
Why invest in stocks?
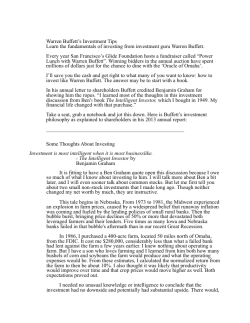
Joseph E. Buffa, Equity Generalist Kent A. Newcomb, CFA, Equity Generalist Why invest in stocks? 2013 Why should someone invest in stocks? Because historically, stocks have performed well when compared to other long-term financial assets and have typically outpaced inflation. Keep in mind that past performance is not a guarantee of future results. Figure 1 – Investment in the US capital markets 1926-2012 $10,000 S&P 500 $3,525 $1,000 Long-Term Corp Bonds $174 Long-Term U.S. Gov't Bonds $123 $100 U.S. Treasury Bills $21 $10 Inflation $13 $0 S&P 500 Long Term Corporate Bonds Long Term U.S. Government Bonds Dec-10 Jun-08 Dec-05 Jun-03 Jun-98 Inflation Dec-00 Dec-95 Jun-93 Jun-88 Dec-90 Jun-83 Dec-85 Jun-78 Dec-80 Jun-73 Dec-75 Dec-70 Jun-68 Jun-63 Dec-65 Dec-60 Jun-58 Jun-53 Dec-55 Jun-48 Dec-50 Jun-43 Dec-45 Jun-38 Dec-40 Jun-33 Dec-35 Jun-28 Dec-30 Dec-25 $1 U.S. Treasury Bills Sources: Ibbotson Associates, Wells Fargo Advisors. Past performance is no guarantee of future results. Hypothetical value of $1 invested at the beginning of 1926. Assumes reinvestment of income and no transaction costs or taxes. This is for illustrative purposes only and not indicative of any investment. An index is not managed and you cannot invest directly in an index. Inflation is measured by the Consumer Price Index for all urban consumers, not seasonally adjusted. Treasury bills and government bonds, unlike stocks and bonds, are guaranteed by the U.S. government and if held to maturity, offer a fixed rate of return and fixed principal value. Yield and market value of bonds will fluctuate prior to maturity. The principal value of an investment in stocks fluctuates with changes in market conditions. Please see page 11 for Disclaimers Page 1 of 11 Why invest in stocks? In this report, we will examine the following: • the record of long-term returns, in both nominal and real (inflation-adjusted) terms, of key asset classes, the volatility of stocks versus other asset classes, the total return potential of dividend paying stocks, • strategies for reducing a portfolio’s risk, and • investment ideas for the stock investor. What is stock? Common stock is a type of security that represents an ownership, or equity interest, in a company. It is a claim on a portion of the company’s earnings and assets. Some people avoid buying stocks because they think the stock market is too risky, that stocks should be bought only with money that can be lost without resulting in undue financial strain. Although it is true that an investment in stocks carries the risk of principal loss, what we are talking about in this report is prudent, long-term stock investing; not speculating in the hot concept du jour or in a stock for which little or nothing is known about the underlying company. The prudent investor buys stock in high quality companies and participates in any earnings remaining after the fixed claims of other securities. In exchange for taking on a higher level of downside risk compared to a fixed income investment, a stockholder should have greater opportunity for capital appreciation given the stock’s potential to reflect the growth of the company’s earnings. Figure 1 depicts the hypothetical outcome of one dollar invested in each of several different financial asset classes in 1926, and held through 2012. All proceeds were reinvested; in other words, dividends received were used to purchase more shares of stock and interest payments from bonds were used to purchase more bonds. The study shows that stocks have significantly outperformed both corporate and government bonds and T-bills over the 87-year period. What investors may not appreciate when looking at Figure 1 is how dramatically stocks have outperformed other asset classes over this period, as Figure 1 uses a logarithmic scale for the vertical axis in order to fit the graph on a single page. 2013 Many investors, worried about day-to-day volatility, shun stocks and stay with historically more conservative fixed-income investments. Of course, fixed-income investments can and should have a place in a well-diversified portfolio. Government bonds and Treasury bills are guaranteed by the U.S. government, and if held to maturity, offer a fixed rate of return and principal value. Yet, as illustrated in Figure 1, history has shown that over time fixedincome investments have significantly underperformed equity investments. Inflation takes its toll There are two primary risks to one's investments: volatility, the near-term risk that price fluctuation could result in selling an asset at a lower price than what one paid for it; and inflation, the longer-term risk that investment returns will not keep up with the rising cost of living. As shown in Figure 2, fixed-income investments have not done a good job historically of outpacing inflation. If investors own only bonds and Treasury bills, it could be difficult over time to maintain the manner in which they have become accustomed to living, i.e., because of inflation, investors run the risk of outliving their assets. Historically, only stocks have provided a noteworthy return over time after taking into account the eroding effects of inflation. Because of inflation, we believe it is important that all investors seek at least some growth potential in their investments. Even investors whose primary objective is receiving current income must try to keep up with the rising cost of living. Historically, stocks have been one of the better investment vehicles for providing growth. Over long periods of time, stock prices tend to move up as earnings, cash flow and dividends increase, potentially providing attractive total returns to investors in such stocks. Companies that consistently increase their annual dividend rates give investors the potential to keep up with or outpace the effect inflation has on the cost of living. Investors who are looking for high current income may find better yields in the fixedincome arena. But, to receive growing income, we feel it is necessary to consider dividend-paying stocks. Page 2 of 11 Why invest in stocks? What about the volatility? As shown in Figure 2, since 1926, the average annual standard deviation (a common statistical measure used to measure the volatility of investment returns) of stocks has been 20%, 8% for long-term corporate bonds, 10% for long-term government bonds, 3% for T-bills and 4% for inflation. The stock investor historically has had to tolerate more than twice the volatility of the long-term bond investor. In other words, the stock investor has had to be willing to withstand a good deal more risk than the fixedincome investor. As compensation for this extra risk, the cumulative total returns of stocks in our illustration have been 20 times greater than long-term corporate bond total returns ($3525 vs. $174), nearly 29 times greater than long-term government bond total returns ($3525 vs. $123), and 168 times greater than Treasury bill total returns ($3525 vs. $21) over the time period reviewed (1926-2012). Some investors are not able to tolerate an investment that can deviate as much as plus or minus 20% a year or more on average. It is important that an investor know and understand his tolerance for volatility well enough to determine the amount of risk that can be assumed. A risk-averse investor must also understand that he cannot expect the kinds of returns that only more volatile investments like stocks typically offer. In portfolios with an investment time horizon of five years or more, a strong case can be made for a significant stock component in the portfolio, because time offers long-term investors a better opportunity to achieve the positive returns that stocks can offer. Over long periods of time, stock prices tend to move in recognition of the underlying company’s growth potential. If the valuation of the stock moves to levels greatly in excess of the company’s growth rate, the stock could be vulnerable to a pullback. Conversely, valuation levels well below a company’s growth rate might portend a rally in the shares at 2013 some point. In our opinion, it is difficult for a stock to sustain a valuation not supported by the growth of the underlying business, as company fundamentals generally drive the direction of stocks. In the short term, emotional factors such as fear and greed can cause stock prices to bounce around, sometimes dramatically, on a daily basis. But over the long term, we believe that the success or failure of the company to grow is what ultimately determines the direction of its stock price. The long-term trend of stocks has been up. If you want the potential to participate in the stock market, it is imperative to know what is realistic in the way of risk (volatility) and return, and to be prepared to deal with it. How can we apply this notion of volatility and return to an individual stock? Suppose a company is expected to increase earnings 10% per year. All other things equal, a company with 10% annual earnings growth should, maybe not every year, but over time have a stock that offers roughly 10% average annual price appreciation. With historical data from Figure 2 in mind, an investor must be able to tolerate about twice as much in the way of annual volatility (i.e. standard deviation) as return. So, an investor must be able to tolerate a drop in stock price of about 20% for the potential to earn that anticipated 10% annual return. It’s understandable if periods of strong volatility and steep price declines scare away investors. However, if investors bail out of the market during periods when the indexes are negative, they risk missing the potential rebound, a point we will illustrate later in this report. Wise investors don’t forget the market’s potential for long-term return. We think market participation is critical throughout all kinds of circumstances. Despite wars, terrorism, politics, economic swings, interest rate changes, and numerous other recurring concerns, over the long term the share prices of good quality companies have tended to follow in relation to their growth. We think that trend will continue over the long term. Page 3 of 11 Why invest in stocks? 2013 Figure 2 – Summary of returns (1926-2012) Nominal Average Average Annual Compound Standard Cumulative Annual Deviation Index Value Return (Risk) S&P 500 $3,525.34 9.8% 20.3% Long Term Corporate Bonds $174.12 6.1% 8.4% Long Term US Government Bonds $123.12 5.7% 9.8% Treasury Bills $20.57 3.5% 3.1% Inflation $12.81 3.0% 4.1% Real (Inflation Adjusted) Average Average Annual Compound Standard Cumulative Annual Deviation Return (Risk) Index Value $275.24 6.7% 20.3% $13.59 3.0% 9.5% $9.61 2.6% 10.8% $1.61 0.5% 3.9% - Sources: Ibbotson Associates, Wells Fargo Advisors *Please see the bottom of page 1 for descriptions and disclaimers. Figures are shown for illustrative purposes only and assume that $1 was invested in 1926. How can you deal with volatility? Diversify. Owning stocks from several sectors with different investment characteristics is a good strategy designed to smooth out the performance of the entire investment portfolio over the long run. (Diversification does not guarantee a profit or protect against loss.) Stick with good quality companies, with measurable fundamentals, so that you can determine reasonable expectations for their shares. Understand what is realistic in the way of return and volatility. If you get meaningful profits, lock some in along the way. Don’t be scared out of the market by big daily point moves. As illustrated in Figure 1, the long-term trend of large-cap stock prices has been up. Stocks are financial assets that give investors the potential to keep up with inflation and build wealth over time. To participate in the stock market, it is necessary to understand and accept the inherent risks and volatility that inevitably follow. But, if you own stock in companies that you know and understand, with products and services that are in demand and are likely to stay in demand in the future, then near-term stock market action should not deter you from participating in the company’s long-term growth potential. Think total return Historically, about 45% of the roughly 10% average annual total return from stocks has come from dividends and 55% has come from price appreciation. For instance, over the 87-year period (1926-2012) depicted in Figure 1, the S&P 500 generated a total return of 9.8% per year on average, and approximately 5.6% per year on a price only basis (5.6/9.8 = 57%). What is not shown in Figure 1 is the fact that capital appreciation alone led the dollar invested in stocks in 1926 to grow to $112 by the end of 2012, an average compound annual return of roughly 5.6%. The remainder of the $3,525 total return from stocks was achieved by collecting the dividends paid, purchasing more shares of stock, and enjoying the benefits of growth compounding. By this measure, 3.2% of the total return ($112) came from capital appreciation, while 96.8% ($3,525-$112=$3,413) came from dividends and dividend reinvestment. The compounding power of dividend reinvestment A stock investor can potentially benefit in two ways from the growth potential of a company. A company can reinvest all or some portion of its earnings back into the company to develop new and existing growth opportunities. This can result in potentially Page 4 of 11 Why invest in stocks? higher earnings. Then, if the company pays out to shareholders a portion of its earnings as dividends, the growing company may be able to increase the amount of dividends it pays out as its earnings grow. If the disciplined stock investor then reinvests those dividends in more shares of stock, the total return from that stock investment may exceed the return from one where dividends are harvested and spent. Recall from the discussion of Figure 1 and Figure 2 that over 95% of the total return from holding a $1 investment in stocks from 1926-2012 came from dividends and their subsequent reinvestment into additional shares of stock. Ask your financial advisor about dividend reinvestment, an automatic service that allows you to take full advantage of the compounding growth potential of your dividend income. Of course you will need to consult with your financial advisor to be sure that your current income needs are being properly met before initiating a dividend reinvestment plan. Calculating total return When determining whether or not to invest in a company, most people like to have an idea as to the company's growth potential. An analyst's job, in part, is to make projections about how much a company is expected to grow. For some companies, the most important factor is earnings growth; for other companies, cash flow or dividends could be the critical factor to determine their growth rate. Regardless, history has shown that over long periods of time stock prices tend to move in recognition of growth. Therefore, when estimating what an investment could return to an investor, it is useful to look at the analyst's projected growth rate– be it earnings, cash flow, or dividend growth. But, looking only at the growth rate could be misleading. For instance, suppose an investor bought stock in a company that paid a $1.00 dividend, and the stock's price rose from $40 to $50 during the year. The investor's total return would have been 27.5% ($50 ending stock price + $1 dividend [i.e., $51] divided by $40 beginning stock price = 27.5%). If the investor calculated only the percentage change in price movement ($50 divided by $40 = 25%), she would have understated her 2013 increase in wealth by 2.5%, the dividend yield when the investment was purchased. In other words, it is important to consider the entire change in value, or total return– income received as well as change in price. Projected Total Return (%) = Estimated Growth Rate (%) + Yield (%) Here's another illustration: Suppose a company pays an annual dividend of $1.00 per share. If the stock is trading at a price of $40, the current yield is 2.5% ($1.00 divided by $40 = 2.5%). The analyst projects that the company should be able to increase its dividend 5% per year. If the company does in fact raise its dividend 5% the next year to $1.05 per share, and the yield remains stable at 2.5% on the higher dividend, the stock would trade at $42 ($1.05 divided by 2.5% = $42), all else being equal. To determine the total return to an investor in this example, add the 2.5% dividend yield that has been collected during the course of the year, plus the 5% price appreciation ($42 divided by $40 = 5%), for roughly a 7.5% total return. We can carry this out another year, raising the $1.05 dividend by 5% to $1.1025 per share. To yield 2.5% on the higher dividend, the shares must trade at $1.1025 divided by 2.5% = $44.10. The total return for year two of 7.5% equals the 2.5% dividend yield plus 5% price appreciation ($44.10 divided by $42 = 5%), or roughly 15% in total return for the two-year period. Our illustration is purposefully simplistic. The yield and estimated dividend growth are only two of a large number of factors that determine a stock’s market price. Using earnings growth estimates and P/E ratios as a proxy for stock price movement This exercise of using dividend growth estimates to determine where we think a stock's price could go over time is very similar to one in which analysts are making earnings per share (EPS) estimates and examining price/earnings (P/E) ratios to gauge a stock’s upside potential. For example, suppose a Page 5 of 11 Why invest in stocks? company is expected to earn $5 per share this year (2013), $6 per share in 2014 and $7 per share in 2015. If the shares are currently trading at $50, the P/E ratio is 10 times ($50 stock price divided by $5 estimated earnings per share). If P/E multiples remain stable, by the year 2015 when this company is expected to earn $7 per share, the shares could be trading at $70 ($7 EPS estimate multiplied by 10 times P/E multiple). If all this comes to pass, the shares would have increased 40% ($70 divided by $50 = 40%), or an average 20% per year, in line with the roughly 20% per year increase in earnings. Over long periods of time, stock prices tend to move in recognition of growth– be it cash flow, earnings or dividend growth, or some combination thereof. How rising dividends and fluctuating interest rates affect stock prices and total returns The problem with the exercises we just walked through, though, is that they assume a stable interest rate or P/E multiple environment. Unfortunately, in real life, neither interest rates (yields) nor P/Es remain stable for very long; they fluctuate. As yields change, prices typically change in the opposite direction (i.e., higher yield leads to lower price). All types of investments compete for investors' funds. Therefore, as interest rates and dividend yields fluctuate, prices also fluctuate to adjust to changing investor requirements. The inverse relationship between yield and price explains some of the volatility in stock prices, as yields constantly change. Companies that raise dividends appeal to investors because dividends that increase as corporate earnings rise have the potential to amplify a stock's upward price momentum when yields are stable or falling, and may help cushion the stock's fall when yields are rising. The hypothetical examples presented in Figure 3 demonstrate the effects dividends and interest rates could have on a stock’s price and total return. For the purpose of this exercise, we assume that a stock’s current dividend yield acts as a proxy for market interest rates; that is, as interest rates rise, an investor’s required current yield from stocks will 2013 also rise. We suggest readers take a few minutes to review Figure 3 before reading further. Notice that in the increasing yield with rising dividend case (Scenario 2), rising dividends provide a cushion for the stock (0.6% total return) when compared with the -16.1% return from the constant dividend and rising yield case (Scenario 1). Scenario 3, which contemplates an average annual total return of 7.5% (2.5% from stable yield and 5% from annual estimated dividend growth) would result in a roughly 35% total return over a five-year period. The total return after five years with interest rates (yields) rising one-quarter percentage point and dividends rising 5% each year (Scenario 2) were only marginally positive. That is why we say that the dividend growth estimate is only a proxy for the amount by which we think the stock's price will move, as rising interest rates (i.e., yields) basically offset the positive impact on total return expected from dividend growth in Scenario 2. Figure 3 excludes two other basic scenarios (stable dividend, stable yield) and (rising dividend, declining yield). For comparative purposes, the stable dividend, stable yield scenario would produce a total return for the five-year period contemplated of 12.5%; basically the $5.00 in dividends collected on a beginning (and ending) price of $40 [($45/$40) - 1 x 100 = 12.5%]. In a rising dividend (+5% per year) and declining yield environment (down .25% per year), the cumulative (5yr) total return would be 117% [$5.53 dividends + ending stock price of $81.33 ($5.53/1.5%) / $40 - 1 x 100 = 117%]. Changes in yield typically impact an investment's total return. Just as it is very difficult to anticipate the direction and magnitude of interest rates or yields, it is also challenging to quantify the impact that changes in yield will have on an investment's total return. The simplistic scenarios outlined in Figure 3 suggest, however, that rising dividends can provide downside support for stocks in a rising interest rate environment (Scenario 2) and can amplify a stock’s potentially positive return in a Page 6 of 11 Why invest in stocks? 2013 Figure 3 – Hypothetical total return scenarios 1 Scenario 1: Dividend remains unchanged, yield increases 25 basis points (one-quarter percent) per year Stock Price Dividend Current (Dividend/ Total Rate Yield Yield) Return Year 1 $1.00 2.50% $40.00 Year 2 $1.00 2.75% $36.36 Year 3 $1.00 3.00% $33.33 Year 4 $1.00 3.25% $30.77 Year 5 $1.00 3.50% $28.57 -16.1% The -16.1% total return is calculated by taking the sum of all the annual cash dividends, $5.00, adding them to the $28.57 stock price (dividend/yield: $1.00/3.5% = $28.57) at the end of Year 5, which equals $33.57, and dividing that by the beginning price of $40.00. Subtract one from your result and multiply by 100 to get a percentage change [($33.57/$40.00)-1]x100= -16.1%. Scenario 2: Dividend increases 5% per year, yield increases 25 basis points (one-quarter percent) per year Stock Price Dividend Current (Dividend/ Total Rate Yield Yield) Return Year 1 $1.00 2.50% $40.00 Year 2 $1.05 2.75% $38.18 Year 3 $1.10 3.00% $36.75 Year 4 $1.16 3.25% $35.62 Year 5 $1.22 3.50% $34.73 0.6% The 0.6% total return is calculated by taking the sum of all the annual cash dividends, $5.53, adding them to the $34.73 stock price (dividend/yield: $1.22/3.5% = $34.73) at the end of Year 5, which equals $40.26, and dividing that by the beginning price of $40.00. Subtract one from your result and multiply by 100 to get a percentage change [($40.26/$40.00)-1]x100=0.6%. Scenario 3: Dividend increases 5% per year, yield remains unchanged Stock Price Dividend Current (Dividend/ Total Rate Yield Yield) Return Year 1 $1.00 2.50% $40.00 Year 2 $1.05 2.50% $42.00 Year 3 $1.10 2.50% $44.10 Year 4 $1.16 2.50% $46.31 Year 5 $1.22 2.50% $48.62 35.4% The 35.4% total return is calculated by taking the sum of all the annual cash dividends, $5.53, adding them to the $48.62 stock price (dividend/yield: $1.22/2.5% = $48.62) at the end of Year 5, which equals $54.15, and dividing that by the beginning price of $40.00. Subtract one from your result and multiply by 100 to get a percentage change [($54.15/$40.00)-1]x100=35.4%. 1 The examples used throughout this report are hypothetical and do not represent the return available on any particular investment. Page 7 of 11 Why invest in stocks? stable or declining interest rate environment (Scenario 3). Building wealth requires patience Many investors are concerned about the volatility of stocks and the possible risk to investment principal along the way. Accumulating shares at regular intervals (e.g., monthly) over time, with the same dollar amount each time, as opposed to the outright purchase of an entire position, is one way of potentially reducing some of the risks of incorrectly timing a purchase decision. This practice, known as dollar cost averaging, can help reduce the need for accurate market timing. To illustrate how difficult it is to time market fluctuations correctly, and therefore why patience is so essential to long-term investment success, we examined what would have happened if an investor had been out of the market during some of the bestperforming days over the last 20 years. The average compound annual total return received by an investor in the S&P 500, with dividends reinvested over the entire 20-year period from 1993 through 2012, would have been 8.2%. Had that investor missed the 10 and 20 days that the S&P 500 turned in its highest returns during that period, the average compound annual total returns would have been just 4.5% and 2.1%, respectively. Missing the market's best 30 and 40 days doomed the investor to average compound annual total returns of 0.0% and -2.0% respectively. A summary of these results is presented in Figure 4. It requires patience to buy and hold. But that strategy, when devoted to stocks of good quality companies, has frequently yielded results superior to one of trading in and out of the market. (Dollar cost averaging does not ensure a profit or protect against a loss in a declining market. You should consider your financial and emotional ability to continue the program in both up and down markets). Figure 5 helps to put into perspective how seldom large company stocks (represented by the S&P 500) have generated negative returns during various holding periods. For example, since 1926 there have 2013 been only 12 five-year periods (out of 83 total, or just 14%) in which the S&P 500 had a negative total return, or lost an investor money; most of which occurred in the 1930’s (4) and in the decade just completed (5), including the five year period ended 12/31/2011 (-0.3%). Most investors who have built significant wealth by participating in the stock market have achieved this success over years and years of patient investing. The stock market provides a way to own a piece of the companies that provide our goods and services, and a way to participate in the decisions managements make about these companies. Just as companies do not prosper overnight, most stocks do not go up dramatically and create significant investment value overnight either. Many investors like to get paid while waiting for the market to reflect a company's progress. Fortunately for such investors, many companies pay shareholders a portion of their earnings, usually quarterly, in the form of dividends. Stocks that can potentially stand the test of time We think that to be successful in the stock market it makes sense to emulate the techniques of great investors, such as Warren Buffett and John Templeton, by adhering to a formula of: selecting good quality companies with solid prospects for future growth, accumulating shares over several weeks, months or years according to a disciplined, regular schedule– adding to positions if the shares pull back and provide an attractive buying opportunity, and patiently holding onto the shares year after year, monitoring the companies' progress, selling only if something of a materially negative nature occurs at a company. Diversification is also critical to modifying portfolio risk over time. In addition to stocks, a wellconstructed portfolio may also contain other asset classes. Figure 6 provides some guidelines that should help investors who wish to build a welldiversified portfolio of common stocks. Page 8 of 11 Why invest in stocks? 2013 Figure 4 - Market timing: the risk of missing major opportunities 8.22% 4.53% 2.08% -0.02% -1.94% Invested All Missed 10 Days Best Days Missed 20 Best Days Missed 30 Best Days Missed 40 Best Days Sources: FactSet, Wells Fargo Advisors Figure 5 – Summary of returns for different holding periods (nominal terms 1926-2012) Number of Periods 1 Year 87 5 Years 83 10 Years 78 15 Years 73 20 Years 68 Times Equities Outperformed Fixed Income Number Percent 53 61% 58 70% 59 76% 63 86% 61 90% Times Equities Had Negative Returns Number Percent 24 28% 12 14% 4 5% 0 0% 0 0% Sources: Morningstar, Wells Fargo Advisors *Please see the bottom of page 1 for descriptions and disclaimers. Past performance is no guarantee of future results. Figure 6 – Diversification guidelines A properly diversified portfolio should include: • Roughly 20 to 30 stocks • Representation from at least six to eight sectors with different investment characteristics • No more than 20 percent of the total portfolio value in any one sector • No more than 10 percent of the total portfolio value in any one stock • A minimum of approximately 3% to 4% of the total portfolio value in each security. Diversification cannot eliminate the risk of fluctuating prices and uncertain returns. Page 9 of 11 Why invest in stocks? What stocks should I buy? The first step in any investment-planning process is one of self-examination. Defining one’s financial goals, and how much risk can be tolerated along the way, is crucial at the outset. Once an investor has determined if the primary investment objective is for income, growth, or some combination; he or she can evaluate the risk that accompanies owning aggressive stocks versus conservative stocks. 2013 Stocks included in several Wells Fargo Advisors investment strategies presented in Figure 7 may be suitable for an investor's temperament or comfort level. Our Diversified Stock Income Plan (DSIP) and Core Stock Investment Plan, in particular, identify a number of stocks we consider appropriate for longterm investors. Investors desiring more information on specific stocks should contact their financial advisor, who can help determine which stocks may be appropriate additions to their portfolio. Figure 7 – Wells Fargo Advisors investment strategies Diversified Stock Income Plan (DSIP): The Diversified Stock Income Plan is a closely monitored list of stocks chosen because of the likelihood of the companies to consistently raise annual dividends. Our goal is to find stocks with attractive current yields that have the potential to provide a growing stream of income over time, while taking into consideration company fundamentals and valuation. With a package of such stocks, we are seeking a relatively low risk way to help conservative income and growth-oriented equity investors to potentially keep up with the rising cost of living. Core Stock Investment Plan: The Core Stock Investment Plan is designed for those who aspire to build wealth by holding long-term investments (three to five-plus year time horizon) in industry-leading companies. Our objective is to offer you the opportunity to invest in businesses that we believe can stand the test of time. High Yield Equity Income List: Designed with a time horizon of approximately 12 months, the High Yield Equity Income list seeks to emphasize companies that pay notably higher dividends than the broader market (as measured by the S&P 500), with expectations of reasonable long-term capital appreciation and reasonable risk. Dynamic Growth List: Designed with a 12-month investment horizon, the Dynamic Growth list focuses on companies that offer above average growth potential, and may be on track to become leaders in the markets they serve. Focus List: The Focus list is a recommended portfolio of 25 individual stocks, equally weighted at 4% each, with an intermediate (9-12 month) timeframe. The individual stocks are chosen based on their fundamental outlook (“bottom-up”), within a framework of recommended sector weightings (“top-down”) from Wells Fargo Advisors Equity Strategy team. Please contact your Wells Fargo Advisors financial advisor if you would like more information on any of the investment strategies listed above. Page 10 of 11 Why invest in stocks? 2013 Disclaimers Dividends are not guaranteed and are subject to change or elimination. Standard deviation measures the dispersion of a set of data from its mean. The more spread apart the data is, the higher the deviation. S&P 500 Index is a market capitalization-weighted index, composed of 500 widely held common stocks that is generally considered representative of the US stock market. An index is not managed and is unavailable for direct investment. Stocks offer long-term growth potential, but may fluctuate more and provide less current income than other investments. An investment in the stock market should be made with an understanding of the risks associated with common stocks, including market fluctuations. Investing in fixed income securities involves certain risks such as markets risk if sold prior to maturity and credit risk especially if investing in high yield bonds, which have lower ratings and are subject to greater volatility. Bond prices fluctuate inversely to changes in interest rates. Therefore, a general rise in interest rates can result in the decline of the value of your investment. All fixed income investments may be worth less than original cost upon redemption or maturity. . Government securities, unlike stocks and bonds, are guaranteed as to payment of principal and interest by the U.S. government if held to maturity. Additional information available upon request. Past performance is not a guide to future performance. The material contained herein has been prepared from sources and data we believe to be reliable but we make no guarantee as to its accuracy or completeness. This material is published solely for informational purposes and is not an offer to buy or sell or a solicitation of an offer to buy or sell any security or investment product. Opinions and estimates are as of a certain date and subject to change without notice. Wells Fargo Advisors is a broker/dealer affiliate of Wells Fargo & Company; other broker/dealer affiliates of Wells Fargo & Company may have differing opinions than those expressed in this report. Investment and Insurance Products: NOT FDIC Insured NO Bank Guarantee MAY Lose Value Wells Fargo Advisors is the trade name used by two separate registered broker-dealers: Wells Fargo Advisors, LLC, and Wells Fargo Advisors Financial Network, LLC, Members SIPC, nonbank affiliates of Wells Fargo & Company. ©2013 Wells Fargo Advisors, LLC. All rights reserved. CAR # 0413-03040 Page 11 of 11


© Copyright 2026