
“Control” laboratory rodents are metabolically morbid: Why it matters
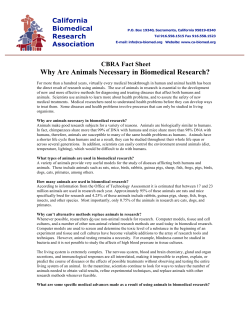
Bronwen Martina, Sunggoan Jia, Stuart Maudsleyb, and Mark P. Mattsonc,1
a
Metabolism Unit, Laboratory of Clinical Investigation, bReceptor Pharmacology Unit, Laboratory of Neurosciences, and cCellular and
Molecular Neurosciences Section, Laboratory of Neurosciences, National Institute on Aging Intramural Research Program, Baltimore, MD
21224
Edited by Solomon Snyder, Johns Hopkins University School of Medicine, Baltimore, MD, and approved February 4, 2010 (received for review December
23, 2009)
Failure to recognize that many standard control rats and mice used in biomedical research are sedentary, obese, glucose intolerant, and on a
trajectory to premature death may confound data interpretation and outcomes of human studies. Fundamental aspects of cellular
physiology, vulnerability to oxidative stress, inflammation, and associated diseases are among the many biological processes affected by
dietary energy intake and exercise. Although overfed sedentary rodents may be reasonable models for the study of obesity in humans,
treatments shown to be efficacious in these animal models may prove ineffective or exhibit novel side effects in active, normalweight subjects.
cancer
| clinical trials | exercise | insulin resistance | obesity
M
ice and rats are the most
widely used animal models in
biomedical research. When
housed under standard laboratory conditions these rodents are sedentary, have continuous access to food, and
have virtually no environmental stimulation. Animals maintained in this manner are widely used as “standard” controls
in basic and translational biomedical research studies, including preclinical drug
testing. Compared to those that are fed
less, exercise more, and have a stimulating
environment, animals maintained under
the usual standard laboratory conditions
are relatively overweight, insulin resistant,
hypertensive, and are likely to experience
premature death (1–5). Indeed, simply
reducing daily food intake 20–40% below
the ad libitum amount, or providing food
intermittently, rather than continuously,
has been shown to significantly reduce
the risk of developing diseases such as
cancer, type 2 diabetes, and renal failure
and can extend lifespan by up to 40% in
rats and mice (3, 6, 7). Currently, one of
the greatest health concerns is the rise in
obesity and its associated pathologies,
such as metabolic syndrome, diabetes,
cardiovascular disease, and cancer. In the
United States, more than 30% of the adult
population is obese, and some studies estimate that by 2030, more than 366 million
people worldwide will develop type 2 diabetes, with obesity being an important
factor responsible for this increase (8, 9).
Although dietary energy restriction can
increase the maximum lifespan of laboratory animals and is therefore hailed as
an “antiaging” intervention (10), its major
effect is to increase the average lifespan
by preventing or delaying the development
of various diseases that are the primary
cause of death in overweight rodents (11).
www.pnas.org/cgi/doi/10.1073/pnas.0912955107
The use of overweight and unstimulated
animals as standard controls may bias the
measured experimental outcomes. We
therefore suggest that new guidelines with
regards to laboratory animal husbandry
should be developed and implemented that
ensure that control animals are fed in
portions rather than ad libitum and are
provided environmental stimulation. At
the very least, institutional animal care
and use committees should make investigators aware of the fact that their control
animals are overfed and relatively sedentary. In the present article, we provide an
overview and discuss how experimental
outcomes and data interpretation may be
altered depending on the type of control
animal that is used, i.e., healthy nonobese
“lean” control compared to an overweight
unhealthy standard control.
Health of Laboratory Animals Is Poor
by Human Standards
Laboratory mice and rats are typically
housed either singly or in groups of 2–5 per
cage with 1–3 square feet of floor space
covered with bedding. The animals have
continuous access to food, which typically
consists of dry pelleted food provided in
an overhead bin. Under these conditions
the animals gain weight progressively
during their adult life; some strains of
laboratory rats achieve body weights upwards of 1 kg and fat mass that accounts
for 30–50% of the body weight (12).
Regular exercise (voluntary exercise on an
in-cage running wheel, for example) and/
or dietary energy restriction have been
shown to cause significant reductions in
body weight and body fat mass (∼20–40%)
(12, 13). In addition to being overweight,
laboratory rodents maintained under
standard laboratory conditions exhibit a
physiological profile consistent with increased disease susceptibility, compared
to animals maintained on lower energy
diets and/or animals with higher physical
activity levels (see Table 1 for overview).
Thus, relative to their leaner counterparts
on reduced energy diets, typical overweight ad libitum-fed rodents exhibit elevated levels of energy regulatory
hormones and factors such as glucose, insulin, triglycerides, low-density lipoprotein
(LDL) cholesterol and leptin, and decreased levels of adiponectin and ghrelin
(3, 14). Additionally, the general cardiovascular health of laboratory rats has
been shown to be improved when their
food intake is reduced; i.e., their plasma
lipid profiles are improved, blood pressure
and resting heart rate are reduced, and the
ability of their cardiovascular system to
recover from stress is enhanced (15, 16).
Consistent with an adverse effect of the
standard housing conditions on the overall
health and well-being of laboratory animals, it has been demonstrated that wild
mice eat less and live longer than domesticated laboratory mice (17).
Studies in which the dietary energy
intake of rats or mice was reduced have
clearly demonstrated that the standard ad
libitum feeding paradigm fosters poor
health outcomes and premature death.
In one study, the average lifespan of rats
was increased from 2.4 years for those
housed under standard conditions to 4
years for those maintained on a reduced
energy diet; the longest-lived control ad
libitum rat lived for 2.9 years, whereas the
Author contributions: B.M., S.M., and M.P.M. designed research; B.M. and S.M. performed research; B.M., S.J., S.M.,
and M.P.M. analyzed data; and B.M., S.M., and M.P.M.
wrote the paper.
The authors declare no conflict of interest.
This article is a PNAS Direct Submission.
1
To whom correspondence should be addressed. E-mail:
[email protected].
PNAS | April 6, 2010 | vol. 107 | no. 14 | 6127–6133
PERSPECTIVE
“Control” laboratory rodents are metabolically morbid:
Why it matters
oldest energy-restricted rat lived for 4.6
years (18). The activity levels of rodents
that eat a reduced calorie diet have been
shown to be increased compared to their
ad libitum-fed counterparts (15), which
may contribute to their increased lean/fat
mass ratio. The insulin sensitivity of muscle and liver cells increases when dietary
energy intake is decreased or animals are
provided with the opportunity to exercise,
indicating that animals housed under
standard laboratory conditions are relatively insulin resistant (15, 19). In humans,
such a metabolic profile is a harbinger
of future dysfunction and disease in multiple organ systems (20). Not only are ad
libitum-fed animals less healthy than those
that eat less and exercise more, they also
have reduced cognitive function. Thus, the
cognitive abilities of rats maintained on
restricted feeding schedules (15) or provided access to a running wheel (21) are
superior to rats maintained under standard housing conditions.
Insulin Resistance and Diabetes
Insulin resistance is defined by impaired
sensitivity to insulin of its main target
organs, adipose tissue, liver, and muscle.
Insulin regulates glucose uptake and circulating free fatty acid (FFA) concentrations. Insulin decreases lipolysis and
FFA efflux from adipocytes, inhibits gluconeogenesis in liver cells by reducing key
enzyme activities, and induces glucose
uptake in skeletal muscle cells by stimulating the translocation of the GLUT4
glucose transporter to the plasma membrane. Obesity, and particularly central
obesity, is the most common risk factor for
the development of type 2 diabetes and
other features of the metabolic syndrome
such as dyslipidemia and hypertension.
Numerous studies have demonstrated that
dietary energy restriction promotes euglycemia and increases insulin sensitivity (22,
23). One longitudinal study of rats showed
that dietary energy restriction decreases
the mean 24-h plasma glucose levels by
≈15 mg/dL and the circulating insulin
levels by ≈50% (24). It has been proposed
that the significant effects of dietary energy restriction on circulating levels of
glycemic hormones could play a role in the
beneficial life-extending actions of dietary
energy restriction. However, as control
laboratory rats and mice tend to become
overweight and insulin resistant under
standard housing conditions, the question
arises: Is the lifespan of the restricted animals extended only because it has been
compared to the lifespan of the relatively
unhealthy standard control animals?
Immune Function and Inflammation
There are strong functional connections
between the metabolic and immune systems (25–27). Metabolic disruption and
6128 | www.pnas.org/cgi/doi/10.1073/pnas.0912955107
obesity involve overactivation of an inflammatory process in metabolically active
sites such as adipose tissue, liver, and immune cells. The consequence of this effect
is a potent increase in circulating levels of
proinflammatory cytokines and other inflammatory markers (28). Activation of
the immune system in response to obesity
is mediated by several specific and conserved signaling pathways, with Jun Nterminal kinase (JNK) and IκB kinase
β/nuclear factor κ-light-chain-enhancer
of activated B (IKKβ/NFκB) pathways
being the most well studied (29). It is
known that the immune activation of these
signaling pathways can modify insulin signaling and result in the development of
insulin resistance, which exacerbates systemic physiological failure. In obese patients as well as standard control
experimental animals, a chronic low-grade
inflammation occurs which is characterized by increased plasma levels of Creactive protein, inflammatory cytokines
such as TNF-α, IL-6, MCP-1, IL-8, and
multifunctional proteins such as leptin
(30) and osteopontin (31). Adipose tissue
produces large quantities of inflammatory
cytokines and chemokines (collectively
called adipokines) and adipose tissue is
one of the main contributors to elevated
systemic TNF-α concentrations in obesity
(32). Long-term obesity-induced systemic
metabolic disruption also generates a
chronic stressful state response (33) that
can suppress humoral immunity. This
stress can be causally linked to obesity
through increased levels of plasma glucocorticoids, which can stimulate the development and differentiation of
preadipocytes (34). The biological activity
of the stress-responsive glucocorticoids is
tightly controlled by the expression of the
enzyme 11β-hydroxysteroid dehydrogenase (11β-HSD) (35). Protection from dietinduced obesity and insulin resistance was
found in mice lacking 11β-HSD1 (36),
whereas mice with adipose tissue-specific
overexpression of 11β-HSD1 developed an
obese phenotype when fed a high calorie
diet (37). Studies in obese humans resulted in similar findings (38, 39) and,
most importantly, suggested that the ability to regulate the activity of 11β-HSD is
lost in type 2 diabetic patients and is
compromised in nondiabetic, obese individuals. Proinflammatory mediators,
(TNF-α, IL-6, MCP-1, and IL-8) intracellular processes (stress response) and
signaling pathways (JNK and NFκB activation) have all been linked to obesity and
inflammation in experimental animals,
demonstrating the importance of consideration of the metabolic-immune status of
the control animal. In humans, several
functional similarities with the animal
findings have been found (40, 41). However, there are disparities between animal
and human therapeutic responsiveness,
which may be due to the use of the
standard animal control. Obesity-related
immunotherapeutics based on mouse
studies, such as neutralization of TNF-α,
have not transferred successfully to humans. Obese humans administered TNF-α
monoclonal antibodies do not show similar
responses to those of mice with respect to
a decrease in body weight and the reversal
of insulin resistance (42–44). As the
standard control animal may possess altered immune responses, activation of
adipokines, and stress status, it is likely
that this may impact the apparent efficacy
of lifestyle or pharmacotherapeutic interventions for disorders that are influenced
by inflammatory and immune activity.
Cancer
The standard living conditions of laboratory animals might be considered a good
reflection of an increasingly large proportion of populations in industrialized
countries who are sedentary and overfed.
With respect to the induction of tumors in
experimental animal conditions, standard
controls develop more spontaneous tumors
than do those that eat less (45, 46). Many
different types of tumors grow more rapidly in animals fed ad libitum compared to
those on reduced energy diets (47–49). In
addition, some carcinogens are less effective in inducing cancers in animals maintained on reduced energy diets, compared
to overweight animals on the standard ad
libitum diet (50, 51). Certain aspects of
the mechanisms of carcinogenesis, tumor
growth, and metastasis may be different
in obese mice compared to more slender
mice that eat less. Indeed, the effects of
energy intake and exercise on carcinogenesis may result from changes in the expression of p450 enzymes that metabolize
carcinogens, or in the amounts of oxidative
DNA damage and apoptosis (50–53).
Although the risk of several types of
cancers is increased in individuals who are
overweight and sedentary, many cancers
can strike otherwise healthy people at any
age. It is therefore important to know
whether potential cancer therapies that are
efficacious in reducing tumor growth in
overweight and unstimulated animals are
equally effective in more physically fit
animals. There have been more than 500
phase II clinical trials in cancer patients
involving drugs that fall into only a few
general types with regard to their mechanisms of action, including cytotoxic, antiproliferative, and antiangiogenic agents
(54). The majority of these drugs, although
exhibiting efficacy in animal studies are
often ineffective in the human clinical trials. It is reasonable to consider that some
of these drugs might have failed because
they were evaluated in preclinical rodent
models in which the subjects are uniformly
Martin et al.
in a metabolically morbid state. For example, angiogenesis may play a much
more prominent role in the growth of tumors in obese individuals (55), and so
antiangiogenic drugs may have relatively
little effect on the same type of tumor in a
slender and fit individual. In addition,
numerous hormones and growth factors
whose levels are affected by energy intake
(testosterone, estrogen, leptin, IGF1,
VEGF, etc.) also affect the growth of
cancers (45, 46, 49–58). A given cancer
drug might therefore be more (or less)
effective in overweight individuals compared to their slender counterparts.
Neurological Disorders
What are the arguments, both pro and
con, of standard ad libitum animal models
for major neurodegenerative disorders
such as Alzheimer’s, Parkinson’s and
Huntington’s diseases, and stroke? The
most widely used models of Alzheimer’s
disease are transgenic mice that express a
mutant form of human amyloid precursor
protein alone, or in combination with
mutant presenilin-1 and tau (59). Such
“Alzheimer’s mice” develop progressive
accumulation of amyloid β-peptide, and
associated dysfunction of synapses, in
brain regions that play a role in regulating
learning and memory processes. The
progression of the latter pathological
processes is retarded by dietary energy
restriction (60) and environmental enrichment (61), and is hastened by diabetes (62). Similarly, dietary energy
restriction (63, 64) and exercise (65, 66)
have been reported to delay disease onset
and slow progression in mouse models of
Parkinson’s and Huntington’s diseases.
A potential advantage of the standard ad
libitum laboratory housing conditions is
that the disease process is accelerated,
and so experimental interventions can be
tested more rapidly. A possible disadvantage is that drugs that show good
efficacy in the overweight animal models
may be less effective or ineffective in active normal weight animals. For example,
because levels of oxidative stress are
elevated in brain cells of sedentary obese
animals, antioxidant therapies may be
very effective in animals housed under
standard laboratory conditions, but not in
more healthy animals that eat less food
and exercise more (67, 68). The failure of
several different drugs to improve outcome in human stroke patients, despite
their clear effectiveness in animal models
of stroke, might be due to the fact that
the animal models involved young sedentary overfed rats and mice (69, 70).
Indeed, neurons in the brains of overfed
animals are more vulnerable to ischemic
stroke than are neurons in the brains of
their more healthy counterparts (64).
Thus, drugs such as glutamate receptor
Martin et al.
antagonists (71) and antiinflammatory
agents (72) may be effective in animal
models, but ineffective in human clinical
trials, because they modify processes associated with a sedentary gluttonous
lifestyle instead of, or in addition to,
stroke-specific processes.
A Comparison of Various Genomic and
Physiological Parameters in an ad Libitum Overfed Standard Control Laboratory Rat Model to a Healthy Body
Weight Control
Using a standardized animal model, the
Sprague–Dawley rat, we compared how
usage of an overweight standard control or
a lean control can affect various output
data. In this experiment, multiple forms of
animal data were recorded from Sprague–
Dawley rats subjected to different
amounts of energy intake and food availability (40% calorie restriction, alternate
day fasting and a high fat/glucose diet) for
a period of 4 months (from 4 to 8 months
of age). The output variables measured,
using comparison with standard or lean
controls, included transcriptional regulation in multiple tissues including gonads
(73) and hippocampus (74), whole body
weight and food intake, plasma hormones,
and performance in cognitive tests (15). In
this scenario, we compared output data
indices first to the standard overweight ad
libitum control and then to a lean “mild
calorie-restricted” control (20% calorie
restriction compared to ad libitum control). First, we studied the differences in
global transcription in two different tissues
of female rats (similar results were also
obtained for males). When comparing the
genes significantly modulated by the implemented experimental diets to the two
A
G onads
B
controls (standard or lean) it is clear from
Fig. 1 that there is minimal similarity in
the identity of the significantly regulated
genes in both tissues for all of the experimental paradigms. Therefore, using
either an ad libitum standard control or a
lean control leads to distinct transcriptional outputs in both the tissues. Because
physiological processes are regulated by
the concerted actions of multiple genes in
related groups, it may be possible that
even though the gene identities appear
different on the basis of which control
animal is used, their predictive functional
output may still be the same, albeit mediated via different genes. To assess the
potential functional signaling output of
these genes, we assessed their functional
clustering using both gene ontology (GO:
http://www.geneontology.org/) and KEGG
(Kyoto Encyclopedia of Genes and Genomes: http://www.genome.jp/kegg/) pathway analysis. Using functional clustering
of the output genes with GO terms, it is
again clear in Fig. 2 that in each of the
experimental cases the predicted significant GO term functional clusters are
very different, depending on which control
animals are used. In a similar manner to
Figs. 1 and 2, using an even higher level of
functional sophistication, i.e., signaling
pathway analysis, it is clear in Fig. 3 that
when one predicts the signaling behavior
of the significantly regulated gene sets in
the two tissues that there is very little
similarity in the predicted physiological
activity when using standard versus lean
control animals. Therefore, if one were to
attempt to assess the role of gene transcription between various tissues it seems
that divergent data could be obtained depending on which control was employed.
Hippoc ampus
40% CR
75
10
40% CR
47
I n t er m i t t e n t F a s t i n g
49
6
26
High-Fat Glucose
53
10
42
95
11
Low Energy
22
I n t e r m i t t e n t Fa s t i n g
169
6
21
High-Fat Glucose
65
2
Left circle: Genes compared to lean control
Overlap: Common genes
Right circle: Genes compared to standard control
12
High E nerg y
Fig. 1. Differences and commonalities in gonadal and hippocampal gene expression for Sprague–
Dawley rats maintained on low and high energy diets, compared with both healthy “lean” controls and
standard ad libitum–fed overweight controls. (A and B) Common and unique significantly altered genes
in gonadal tissue (ovaries; A) and hippocampal tissue (B) from rats on 40% caloric restriction, alternate
day fasting, and a high fat/glucose diet, compared with standard ad libitum overweight controls and
healthy lean controls (20% caloric restriction).
PNAS | April 6, 2010 | vol. 107 | no. 14 | 6129
A
B
Gonads
Hippocampus
40% CR
30
5
40% CR
17
37
I n t er m i t t en t F a s t i n g
32
3
3
8
I n t e rm i tt e n t F a s t i n g
5
31
High-Fat Glucose
22
1
Low Energy
10
14
High-Fat Glucose
14
19
0
1
High En ergy
Left circle: Go terms compared to lean control
Overlap: Common GO terms
Right circle: Go terms compared to standard control
Fig. 2. Differences and commonalities in gonadal and hippocampal gene ontology (GO) functional
groups for Sprague–Dawley rats maintained on low and high energy diets, compared with both healthy
“lean” controls and standard ad libitum–fed overweight controls. (A) Common and unique significantly
altered GO functional groups in ovaries (A) and hippocampus (B) from rats on 40% caloric restriction,
intermittent fasting, and a high fat/glucose diet, compared with standard ad libitum overweight controls
and healthy lean controls (20% caloric restriction).
ative percentage differences resulted when
the output value for lean controls was less
than the value for standard controls. It is
clear that many of the measured indices
(chemical, behavioral, and cognitive) show
large percentage differences in their values when the two types of control animals
are used, especially with respect to plasma
hormones (leptin and growth hormone)
and blood-borne energy-regulatory factors
such as cholesterol and 3-hydroxybutyrate
(Fig. 4). As the relative health status of
lean versus standard control animals is
divergent, it is not surprising that there are
profound differences in experimental
outcome, but it is surprising how dramat-
As many scientists often subject experimental animals to a battery of physiological or behavioral tests, we also
compared the differences in the data collected for several physiological variables
depending on which control animals were
used. Finally, we compared the percentage
difference in the respective output index
values for body mass, food consumption,
plasma hormones, and maze-solving performance when using either lean or
standard controls (Fig. 4). If the output
index value was greater using the lean
control than the output index value using
the standard control, then a positive percentage difference was calculated. Neg-
A
B
Gonads
Hippocampus
40% CR
2
3
40% CR
7
I nt e r m it t en t F a s t i n g
4
0
1
High-Fat Glucose
4
0
7
0
Low Energy
0
I n t e r mi tt e n t F a s t i n g
11
1
0
High-Fat Glucose
0
1
0
0
Left circle: KEGG pathways compared to lean control
Overlap: Common KEGG pathways
Right circle: KEGG pathways compared to standard control
High Energy
Fig. 3. Differences and commonalities in gonadal and hippocampal KEGG functional pathways for
Sprague–Dawley rats maintained on low and high energy diets, compared with both healthy controls
and standard ad libitum–fed overweight controls. (A) Common and unique significantly altered KEGG
functional pathways in ovaries (A) and hippocampus (B) from rats on 40% caloric restriction, intermittent
fasting, and a high fat/glucose diet, compared with standard ad libitum overweight controls and healthy
lean controls (20% caloric restriction).
6130 | www.pnas.org/cgi/doi/10.1073/pnas.0912955107
ically distinct some experimental results
can be (e.g., transcriptional responses).
Therefore it is important for the extrapolation of data from animals to humans that the physiological health of the
control animals be considered because
important drug effects or physiological
actions may be completely missed or
wildly exaggerated.
Research on Standard ad Libitum
Overfed Laboratory Animals May Misinform the Design and Outcome of
Human Studies
When maintained under the standard
laboratory housing conditions of continuous food availability and minimal
opportunity for exercise, laboratory animals exhibit increased vulnerability to
cancers and neurodegenerative disorders.
For example, in a mouse model of prostate
cancer, reducing energy intake results in
slower growth of the prostate tumors (47),
and intermittent caloric restriction reduces
the incidence of mammary tumors in a
mouse model of breast cancer (75). In a
mouse brain tumor model, dietary energy
restriction reduces the growth of blood
vessels in the tumors and slows the
growth of the tumors (48). Compared to
animals that eat more sparingly or
exercise regularly, animals that overeat
and live a sedentary lifestyle exhibit accelerated dysfunction and degeneration
of neurons in the brain in experimental
models of Alzheimer’s disease (60, 61, 76),
Parkinson’s disease (63, 77) and stroke
(78, 79). Moreover, cognitive function,
synaptic plasticity, and neurogenesis
(the production of new nerve cells from
stem cells) are enhanced by exercise
and dietary restriction and are compromised by a sedentary lifestyle (80–83).
The adverse effects of a sedentary
lifestyle on the brain results from an impaired ability to respond adaptively to
stress as indicated by reduced
production of neurotrophic factors, protein chaperones, and antioxidant proteins
(56, 78, 81).
For many decades, countless studies
have investigated the potential health
benefits and mechanisms of action of
dietary energy restriction regimens. Many
studies have shown that caloric restriction
can significantly extend lifespan in a variety
of species, ranging from flies and worms to
mice and rats (84–86). Dietary energy restriction is thought to prolong lifespan by
impinging upon fundamental metabolic
and cellular signaling pathways including
insulin-like signaling, FoxO transcription
factors, sirtuins, and peroxisome proliferator-activated receptor. These pathways
stimulate the production of various protein chaperones, neurotrophic factors, and
antioxidant enzymes, all of which help
cells cope with stress and resist disease
Martin et al.
Lipid
regulatory
factors
Learning
and
memory
ho
rm
on
e
Trophic hormones
G
ro
w
th
150
is
iti
on
s)
qu
R
et
er ent
ro io
rs n
C
ho
Ac
or
te
x)
la
sm
a)
(p
F
N
BD
qu
tim isit
e i on
e
(c
F
N
BD
C
or
ti
Pr
ol
B
H
er
ol
3le
st
Le
co
st
er
on
ti n
ac
es
r id
ly
ce
Tr
ig
in
in
pt
G
hr
el
lin
su
In
m
as
s
pt
io
n
um
ns
Bo
dy
co
od
Ac
ro
ol
di
st
e
to
tra
Es
Te
s
0
- 50
B
(h D N
ip F
po
ca
m
pu
ne
in
L
ct
D
ne
L
H
G
lu
Ad
o
ip
LD
co
se
50
er
ro
rs
R
et
en
ti o
n
ti m
e
100
Fo
Percentage difference ‘lean’ compared to ‘standard’ control
Glycemic
regulatory
factors
Gross
physiology
-10 0
Fig. 4. Overview of various physiological differences between standard ad libitum–fed control animals and moderately fed lean animals. The percentage
difference for numerous variables (gross physiology, glycemic regulatory factors, lipid regulatory factors, trophic hormones, and learning and memory) for
“lean” control Sprague–Dawley rats (20% caloric restriction) compared to “standard” control Sprague–Dawley rats fed ad libitum. LDL, low density lipoprotein; HDL, high density lipoprotein; BDNF, brain-derived neurotrophic factor; and 3-HB, 3-β-hydroxybutyrate.
(see refs. 83, 87 for review). However,
other studies have demonstrated that dietary energy restriction has no or even
harmful effects on lifespan in different
animal models (17, 84, 88–90). Further
research is needed, using a standardized
approach, to determine the pros and cons
of long- and short-term dietary energy restriction. Moreover, it was recently reported that in recombinant inbred mice,
there are striking variations in lifespan in
response to food restriction, due to differences in genetic background (84).
These findings suggest that the role of
genetic background in the choice of experimental rodent models would also be
important to consider, as different genetic
backgrounds are likely to affect
experimental outcomes.
Another factor to consider besides body
weight, metabolic health, housing conditions, and genetic background of laboratory rodents is whether the rodent model
in itself could have experimental drawbacks. Rodents are typically used for
experimental research for their ease of use,
relatively low cost, rapid breeding, high
offspring numbers, and easy maintenance
(91). In addition, mice and humans have
considerable genome similarities, and
more than 90% of the respective genomes
can be grouped in terms of corresponding
regions (92). However, it is well established that mice and humans have several
physiological differences that may render
the use of mouse models for the investigation of human physiology and pathophysiology imperfect (91). For example,
there are significant differences between
rodents and humans in olfactory function
(93), reproductive function (94), and digestive function (95).
Two examples of animal models for which
the standard housing conditions can be
Martin et al.
considered healthier than the standard
conditions for rodents are canines and
nonhuman primates. In both cases the animals are fed portioned meals two or three
times daily and may exercise in large cages or
open arenas; accordingly, they maintain
lower levels of body fat compared to laboratory rats and mice. In contrast to rodents
whose lifespans are shortened by the usual
housing conditions, the lifespans of dogs
(10–20 years for beagles) and monkeys (25–
40 years for rhesus macaques) are believed
similar to their wild counterparts (96, 97).
On the other hand, some organ systems
of dogs and monkeys are more sensitive
than their rodent counterparts to adverse
effects of excessive energy intake, with
the cardiovascular system being one clear
example, where rodents are resistant to
atherosclerosis. This issue of human dis-
ease-relevant physiology has been, in part,
circumvented in mice by generating transgenic animals that express mutated human
genes that cause inherited diseases (cancers, diabetes, Alzheimer’s disease, Parkinson’s disease, and many others).
We suggest that all investigators who
employ rodent models in their research
should consider how housing conditions,
particularly dietary energy intake and
level of exercise, might affect the
responses of the animals to experimental
manipulations, as well as the outcomes
measured and their interpretation. Both
qualitative and quantitative features of
many physiological processes are subject
to modification by energy intake and
exercise, with recent global gene expression
studies (98, 99) indicating that the
variables shown in Table 1 represent
Table 1. Comparisons of physiological and metabolic factors in rats maintained under
standard housing conditions (overfed and sedentary) and more natural conditions
(reduced energy intake or running wheel exercise)
Housing conditions
Factor
Body weight
Total body fat
Mean blood pressure
Resting heart rate
Plasma glucose
Plasma insulin
Plasma leptin
Plasma adiponectin
Total cholesterol
LDL cholesterol
TNFα*
IL-6*
Standard
600–700 g
25–40%
110–130 mm Hg
350–400 bpm
150–160 mg/dL
125–140 nmol/L
8–12 ng/mL
9–11 ng/mL
140–170 mg/dL
15–25 mg/dL
6–7 pg/mL
6.5–7.5 pg/mL
Diet restriction
350–500 g
5–20%
80–90 mm Hg
250–300 bpm
110–130 mg/dL
70–80 nmol/L
2–6 ng/mL
14–16 ng/mL
70–100 mg/dL
10–15 mg/dL
3–4 pg/mL
4.5–5.5 pg/mL
Exercise
500–600 g
10–20%
115–125 mm Hg
280–300 bpm
125–135 mg/dL
NA
NA
NA
130–140 mg/dL
NA
NA
NA
Unless indicated otherwise, all data were from studies of male Sprague–Dawley rats. The information in
this table is based on data in refs. 15, 16, 100, 101, and 102. bpm, beats per minute; NA, data not available.
*Data from male Dahl-SS rats.
PNAS | April 6, 2010 | vol. 107 | no. 14 | 6131
only the tip of the iceberg of a myriad
of signaling and metabolic pathways
influenced by energy intake and
expenditure.
Conclusions
The beneficial effects of some drugs in
animal models might result from their
effects on processes associated with an
unhealthy lifestyle (increased oxidative
stress, inflammation, insulin resistance,
etc.) rather than a specific effect of the
drug on the disease process. This is a
critical issue that should be addressed in
future studies in many different branches
of biomedical research. Ideally, the
efficacy of interventions should be estab1. Goodrick CL (1980) Effects of long-term voluntary wheel
exercise on male and female Wistar rats. I. Longevity,
body weight, and metabolic rate. Gerontology 26:22–33.
2. Holloszy JO (1993) Exercise increases average longevity
of female rats despite increased food intake and no
growth retardation. J Gerontol 48:B97–B100.
3. Weindruch R (1996) The retardation of aging by caloric
restriction: Studies in rodents and primates. Toxicol
Pathol 24:742–745.
4. Alessio HM, et al. (2005) Exercise improves biomarkers
of health and stress in animals fed ad libitum. Physiol
Behav 84:65–72.
5. Mattson MP, Wan R (2005) Beneficial effects of
intermittent fasting and caloric restriction on the
cardiovascular and cerebrovascular systems. J Nutr
Biochem 16:129–137.
6. Heilbronn LK, Ravussin E (2003) Calorie restriction and
aging: review of the literature and implications for
studies in humans. Am J Clin Nutr 78:361–369.
7. Hursting SD, Lavigne JA, Berrigan D, Perkins SN,
Barrett JC (2003) Calorie restriction, aging, and cancer
prevention: Mechanisms of action and applicability to
humans. Annu Rev Med 54:131–152.
8. Flegal KM, Carroll MD, Ogden CL, Curtin LR (2010)
Prevalence and trends in obesity among US adults,
1999-2008. JAMA 303:235–241.
9. Wild S, Roglic G, Green A, Sicree R, King H (2004) Global
prevalence of diabetes: Estimates for the year 2000 and
projections for 2030. Diabetes Care 27:1047–1053.
10. Masoro EJ (2009) Caloric restriction-induced life
extension of rats and mice: A critique of proposed
mechanisms. Biochim Biophys Acta 1790:1040–1048.
11. Dirx MJ, Zeegers MP, Dagnelie PC, van den Bogaard T,
van den Brandt PA (2003) Energy restriction and the
risk of spontaneous mammary tumors in mice: A
meta-analysis. Int J Cancer 106:766–770.
12. Oscai LB, Holloszy JO (1969) Effects of weight changes
produced by exercise, food restriction, or overeating
on body composition. J Clin Invest 48:2124–2128.
13. Brochmann EJ, Duarte ME, Zaidi HA, Murray SS (2003)
Effects of dietary restriction on total body, femoral,
and vertebral bone in SENCAR, C57BL/6, and DBA/2
mice. Metabolism 52:1265–1273.
14. Barzilai N, Banerjee S, Hawkins M, Chen W, Rossetti L (1998)
Caloric restriction reverses hepatic insulin resistance in
aging rats by decreasing visceral fat. J Clin Invest 101:
1353–1361.
15. Martin B, et al. (2007) Sex-dependent metabolic, neuroendocrine, and cognitive responses to dietary energy
restriction and excess. Endocrinology 148:4318–4333.
16. Wan R, Camandola S, Mattson MP (2003) Intermittent
food deprivation improves cardiovascular and neuroendocrine responses to stress in rats. J Nutr 133:
1921–1929.
17. Harper JM, Leathers CW, Austad SN (2006) Does
caloric restriction extend life in wild mice? Aging
Cell 5:441–449.
18. Weindruch R, Sohal RS (1997) Seminars in medicine of
the Beth Israel Deaconess Medical Center. Caloric
intake and aging. N Engl J Med 337:986–994.
6132 | www.pnas.org/cgi/doi/10.1073/pnas.0912955107
lished in animals housed in both the
usual overfed, sedentary conditions and
more healthy conditions of reduced
energy intake and increased exercise, i.e.,
lean control animals. The standard
overfed sedentary control animal is a
good model for an increasing fraction of
human subjects who are overweight
and sedentary, but may be inadequate
for preclinical studies relevant to
normal weight active humans. Many
patients suffering from cancer, vascular
disorders, and neurodegenerative
disease may in many other ways be relatively fit and cognitively stimulated.
Treatments for the latter patients
should be tested in healthy animal
19. James DE, Kraegen EW, Chisholm DJ (1984) Effect of
exercise training on whole-body insulin sensitivity
and responsiveness. J Appl Physiol 56:1217–1222.
20. Bonora E (2006) The metabolic syndrome and cardiovascular disease. Ann Med 38:64–80.
21. Aguiar AS, Jr, et al. (2009) Physical exercise improves
motor and short-term social memory deficits in
reserpinized rats. Brain Res Bull 79:452–457.
22. Wang ZQ, Bell-Farrow AD, Sonntag W, Cefalu WT
(1997) Effect of age and caloric restriction on insulin
receptor binding and glucose transporter levels in
aging rats. Exp Gerontol 32:671–684.
23. Wing RR, et al. (1994) Caloric restriction per se is a
significant factor in improvements in glycemic
control and insulin sensitivity during weight loss in
obese NIDDM patients. Diabetes Care 17:30–36.
24. Masoro EJ (1992) Retardation of aging processes by
food restriction: An experimental tool. Am J Clin Nutr
55 (6, Suppl):1250S–1252S.
25. Chandra RK (1981) Immune response in overnutrition.
Cancer Res 41:3795–3796.
26. Nieman DC, et al. (1996) Immune response to obesity
and moderate weight loss. Int J Obes Relat Metab
Disord 20:353–360.
27. Womack J, et al. (2007) Obesity and immune cell
counts in women. Metabolism 56:998–1004.
28. Shoelson SE, Lee J, Goldfine AB (2006) Inflammation
and insulin resistance. J Clin Invest 116:1793–1801.
29. Yuan M, et al. (2001) Reversal of obesity- and dietinduced insulin resistance with salicylates or targeted
disruption of Ikkbeta. Science 293:1673–1677.
30. Friedman JM, Halaas JL (1998) Leptin and the
regulation of body weight in mammals. Nature 395:
763–770.
31. Kiefer FW, et al. (2008) Osteopontin expression in human
and murine obesity: Extensive local up-regulation in
adipose tissue but minimal systemic alterations.
Endocrinology 149:1350–1357.
32. Hotamisligil GS, Shargill NS, Spiegelman BM (1993)
Adipose expression of tumor necrosis factor-alpha:
Direct role in obesity-linked insulin resistance. Science
259:87–91.
33. Hotamisligil GS (2006) Inflammation and metabolic
disorders. Nature 444:860–867.
34. Purnell JQ, et al. (2009) Enhanced cortisol production
rates, free cortisol, and 11beta-HSD-1 expression
correlate with visceral fat and insulin resistance in
men: Effect of weight loss. Am J Physiol Endocrinol
Metab 296:E351–E357.
35. Seckl JR, Walker BR (2001) Minireview: 11betahydroxysteroid dehydrogenase type 1- a tissue-specific
amplifier of glucocorticoid action. Endocrinology 142:
1371–1376.
36. Morton NM, et al. (2001) Improved lipid and lipoprotein
profile, hepatic insulin sensitivity, and glucose tolerance
in 11beta-hydroxysteroid dehydrogenase type 1 null
mice. J Biol Chem 276:41293–41300.
37. Masuzaki H, et al. (2001) A transgenic model of
visceral obesity and the metabolic syndrome. Science
294:2166–2170.
models. It is not a major expense or
hardship to reduce the food intake of
laboratory rats and mice and raise them
in cages with running wheels. In
addition to better informing
the development of
therapeutic interventions, comparisons
between sedentary and fit animals
will undoubtedly reveal novel
mechanisms by which diet and exercise
affect basic biological processes and
disease pathogenesis.
ACKNOWLEDGMENTS. This work was supported by
the Intramural Research Program of the National
Institutes of Health, National Institute on Aging.
38. Engeli S, et al. (2004) Regulation of 11beta-HSD genes
in human adipose tissue: Influence of central obesity
and weight loss. Obes Res 12:9–17.
39. Valsamakis G, et al. (2004) 11beta-hydroxysteroid
dehydrogenase type 1 activity in lean and obese males
with type 2 diabetes mellitus. J Clin Endocrinol Metab 89:
4755–4761.
40. Arkan MC, et al. (2005) IKK-beta links inflammation
to obesity-induced insulin resistance. Nat Med 11:
191–198.
41. Solinas G, et al. (2007) JNK1 in hematopoietically derived
cells contributes to diet-induced inflammation and
insulin resistance without affecting obesity. Cell Metab
6:386–397.
42. Karalis KP (2009) Mechanisms of obesity and related
pathology: Linking immune responses to metabolic
stress. FEBS J 276:5747–5754.
43. Lo J, et al. (2007) Effects of TNF-alpha neutralization
on adipocytokines and skeletal muscle adiposity in
the metabolic syndrome. Am J Physiol Endocrinol
Metab 293:E102–E109.
44. Bernstein LE, Berry J, Kim S, Canavan B, Grinspoon SK
(2006) Effects of etanercept in patients with the
metabolic syndrome. Arch Intern Med 166:902–908.
45. Ross MH, Bras G (1971) Lasting influence of early
caloric restriction on prevalence of neoplasms in the
rat. J Natl Cancer Inst 47:1095–1113.
46. Albanes D (1987) Total calories, body weight, and
tumor incidence in mice. Cancer Res 47:1987–1992.
47. Bonorden MJ, et al. (2009) Cross-sectional analysis of
intermittent versus chronic caloric restriction in the
TRAMP mouse. Prostate 69:317–326.
48. Mukherjee P, El-Abbadi MM, Kasperzyk JL, Ranes MK,
Seyfried TN (2002) Dietary restriction reduces
angiogenesis and growth in an orthotopic mouse
brain tumour model. Br J Cancer 86:1615–1621.
49. Bunk B, Zhu P, Klinga K, Berger MR, Schmähl D (1992)
Influence of reducing luxury calories in the treatment
of experimental mammary carcinoma. Br J Cancer 65:
845–851.
50. Hikita H, Vaughan J, Babcock K, Pitot HC (1999) Shortterm fasting and the reversal of the stage of promotion
in rat hepatocarcinogenesis: Role of cell replication,
apoptosis, and gene expression. Toxicol Sci 52:
2S17–2S23.
51. Qu B, Halliwell B, Ong CN, Lee BL, Li QT (2000) Caloric
restriction prevents oxidative damage induced by the
carcinogen clofibrate in mouse liver. FEBS Lett 473:
85–88.
52. Hart RW, et al. (1992) Modulation of chemical toxicity
by modification of caloric intake. Adv Exp Med Biol
322:73–81.
53. Manjgaladze M, et al. (1993) Effects of caloric restriction
on rodent drug and carcinogen metabolizing enzymes:
Implications for mutagenesis and cancer. Mutat Res 295:
201–222.
54. Lee JJ, Feng L (2005) Randomized phase II designs in
cancer clinical trials: Current status and future directions. J Clin Oncol 23:4450–4457.
Martin et al.
55. Thompson HJ, et al. (2004) Effect of dietary energy
restriction on vascular density during mammary carcinogenesis. Cancer Res 64:5643–5650.
56. Rose DP, Komninou D, Stephenson GD (2004) Obesity,
adipocytokines, and insulin resistance in breast cancer.
Obes Rev 5:153–165.
57. O’Malley RL, Taneja SS (2006) Obesity and prostate
cancer. Can J Urol 13:2S11–2S17.
58. Birmingham JM, Busik JV, Hansen-Smith FM, Fenton JI
(2009) Novel mechanism for obesity-induced colon
cancer progression. Carcinogenesis 30:690–697.
59. Götz J, Ittner LM (2008) Animal models of Alzheimer’s
disease and frontotemporal dementia. Nat Rev Neurosci
9:532–544.
60. Halagappa VK, et al. (2007) Intermittent fasting and
caloric restriction ameliorate age-related behavioral
deficits in the triple-transgenic mouse model of
Alzheimer’s disease. Neurobiol Dis 26:212–220.
61. Lazarov O, et al. (2005) Environmental enrichment
reduces Abeta levels and amyloid deposition in
transgenic mice. Cell 120:701–713.
62. Cao D, Lu H, Lewis TL, Li L (2007) Intake of sucrosesweetened water induces insulin resistance and
exacerbates memory deficits and amyloidosis in a
transgenic mouse model of Alzheimer disease. J Biol
Chem 282:36275–36282.
63. Duan W, Mattson MP (1999) Dietary restriction and 2deoxyglucose administration improve behavioral
outcome and reduce degeneration of dopaminergic
neurons in models of Parkinson’s disease. J Neurosci
Res 57:195–206.
64. Yu ZF, Mattson MP (1999) Dietary restriction and 2deoxyglucose administration reduce focal ischemic brain
damage and improve behavioral outcome: evidence for a
preconditioning mechanism. J Neurosci Res 57:830–839.
65. Pothakos K, Kurz MJ, Lau YS (2009) Restorative effect
of endurance exercise on behavioral deficits in the
chronic mouse model of Parkinson’s disease with
severe neurodegeneration. BMC Neurosci 10:6.
66. Pang TY, Stam NC, Nithianantharajah J, Howard ML,
Hannan AJ (2006) Differential effects of voluntary
physical exercise on behavioral and brain-derived neurotrophic factor expression deficits in Huntington’s disease
transgenic mice. Neuroscience 141:569–584.
67. Lim GP, et al. (2001) The curry spice curcumin reduces
oxidative damage and amyloid pathology in an
Alzheimer transgenic mouse. J Neurosci 21:8370–8377.
68. Quinn JF, et al. (2007) Chronic dietary alpha-lipoic
acid reduces deficits in hippocampal memory of
aged Tg2576 mice. Neurobiol Aging 28:213–225.
69. Cheng YD, Al-Khoury L, Zivin JA (2004) Neuroprotection for ischemic stroke: Two decades of success
and failure. NeuroRx 1:36–45.
Martin et al.
70. Lodder J (2000) Neuroprotection in stroke: Analysis of
failure, and alternative strategies. Neurosci Res
Commun 26:173–179.
71. Hoyte L, Barber PA, Buchan AM, Hill MD (2004) The
rise and fall of NMDA antagonists for ischemic stroke.
Curr Mol Med 4:131–136.
72. Jordán J, Segura T, Brea D, Galindo MF, Castillo J (2008)
Inflammation as therapeutic objective in stroke. Curr
Pharm Des 14:3549–3564.
73. Martin B, et al. (2009) Gonadal transcriptome alterations
in response to dietary energy intake: Sensing the
reproductive environment. PLoS One 4:e4146.
74. Martin B, et al. (2008) Conserved and differential effects
of dietary energy intake on the hippocampal
transcriptomes of females and males. PLoS One 3:e2398.
75. Cleary MP, et al. (2002) Weight-cycling decreases
incidence and increases latency of mammary tumors to
a greater extent than does chronic caloric restriction in
mouse mammary tumor virus-transforming growth
factor-alpha female mice. Cancer Epidemiol Biomarkers
Prev 11:836–843.
76. Adlard PA, Perreau VM, Pop V, Cotman CW (2005)
Voluntary exercise decreases amyloid load in a
transgenic model of Alzheimer’s disease. J Neurosci
25:4217–4221.
77. Smith AD, Zigmond MJ (2003) Can the brain be
protected through exercise? Lessons from an animal
model of parkinsonism. Exp Neurol 184:31–39.
78. Arumugam TV, et al. (2010) Age and energy intake
interact to modify cell stress pathways and stroke
outcome. Ann Neurol, 10.1002/ana.21798.
79. Ploughman M, Attwood Z, White N, Doré JJ, Corbett D
(2007) Endurance exercise facilitates relearning of
forelimb motor skill after focal ischemia. Eur J Neurosci
25:3453–3460.
80. Stranahan AM, et al. (2008) Diabetes impairs
hippocampal
function
through
glucocorticoidmediated effects on new and mature neurons. Nat
Neurosci 11:309–317.
81. Stranahan AM, et al. (2009) Voluntary exercise and
caloric restriction enhance hippocampal dendritic spine
density and BDNF levels in diabetic mice. Hippocampus
19:951–961.
82. van Praag H (2009) Exercise and the brain: Something
to chew on. Trends Neurosci 32:283–290.
83. Martin B, Mattson MP, Maudsley S (2006) Caloric
restriction and intermittent fasting: Two potential diets
for successful brain aging. Ageing Res Rev 5:332–353.
84. Liao CY, Rikke BA, Johnson TE, Diaz V, Nelson JF
(2010) Genetic variation in the murine lifespan
response to dietary restriction: From life extension
to life shortening. Aging Cell 9:92–95.
85. McCay CM, Crowell MF, Maynard LA (1935) The effect
of retarded growth upon the length of life and upon
the ultimate body size. J Nutr 10:63–79.
86. Masoro EJ (2005) Overview of caloric restriction and
ageing. Mech Ageing Dev 126:913–922.
87. Martin B, et al. (2008) Caloric restriction: Impact upon
pituitary function and reproduction. Ageing Res Rev
7:209–224.
88. Turturro A, et al. (1999) Growth curves and survival
characteristics of the animals used in the Biomarkers
of Aging Program. J Gerontol A Biol Sci Med Sci 54:
B492–B501.
89. Forster MJ, Morris P, Sohal RS (2003) Genotype and
age influence the effect of caloric intake on mortality
in mice. FASEB J 17:690–692.
90. Harrison DE, Archer JR (1987) Genetic differences in
effects of food restriction on aging in mice. J Nutr
117:376–382.
91. Sundberg JP, King LE, Jr (1996) Mouse models for the
study of human hair loss. Dermatol Clin 14:619–632.
92. Waterston RH, et al.; Mouse Genome Sequencing
Consortium (2002) Initial sequencing and comparative
analysis of the mouse genome. Nature 420:520–562.
93. Godfrey PA, Malnic B, Buck LB (2004) The mouse
olfactory receptor gene family. Proc Natl Acad Sci
USA 101:2156–2161.
94. Finn CA (1996) Why do women menstruate? Historical
and evolutionary review. Eur J Obstet Gynecol Reprod
Biol 70:3–8.
95. Yamamoto K, Matsunaga S, Matsui M, Takeda N,
Yamatodani A (2002) Pica in mice as a new model
for the study of emesis. Methods Find Exp Clin
Pharmacol 24:135–138.
96. Cotman CW, Head E (2008) The canine (dog) model of
human aging and disease: Dietary, environmental
and immunotherapy approaches. J Alzheimers Dis
15:685–707.
97. Mattison JA, Roth GS, Lane MA, Ingram DK (2007)
Dietary restriction in aging nonhuman primates.
Interdiscip Top Gerontol 35:137–158.
98. Zahn JM, et al. (2007) AGEMAP: A gene expression
database for aging in mice. PLoS Genet 3:e201.
99. Xu X, et al. (2007) Gene expression atlas of the mouse
central nervous system: Impact and interactions of
age, energy intake and gender. Genome Biol 8:R234.
100. Pitts GC (1984) Body composition in the rat:
Interactions of exercise, age, sex, and diet. Am J
Physiol 246:R495–R501.
101. Seymour EM, Parikh RV, Singer AAM, Bolling SF
(2006) Moderate calorie restriction improves cardiac
remodeling and diastolic dysfunction in the Dahl-SS
rat. J Mol Cell Cardiol 41:661–668.
102. Mueller PJ, Hasser EM (2006) Putative role of the NTS
in alterations in neural control of the circulation
following exercise training in rats. Am J Physiol
Regul Integr Comp Physiol 290:R383–R392.
PNAS | April 6, 2010 | vol. 107 | no. 14 | 6133


© Copyright 2026