
e we hy ar W ng
W
e
w
a re
y
h
cc
u
s
e
in
d
e
g
Financial Highlights
Marubeni Corporation
Years ended March 31
Thousands of
U.S. Dollars
(Note)
Millions of Yen
For the year :
Total volume of trading
transactions
Gross trading profit
Net income (loss)
At year-end :
Total assets
Net interest-bearing debt
Total shareholders’ equity
Amounts per 100 shares (¥/US$) :
Basic earnings (loss)
Diluted earnings (loss)
Cash dividends
Ratios :
Return on assets (%)
Return on equity (%)
Net D/E ratio (times)
2003
2002
2001
2003
¥8,793,303
¥8,972,245
¥9,436,863
$73,277,525
479,754
15,036
3,538,692
252,600
5,320,604
3,089,839
342,297
36,012,350
18,867,642
2,167,092
1,006
940
–
16.92
15.80
2.50
424,643
30,312
4,321,482
2,264,117
260,051
436,804
(116,418)
4,805,669
2,712,906
263,895
2,030
1,896
300
(7,792)
(7,792)
–
0.7
11.6
8.7
–
–
10.3
0.3
4.5
9.0
Note: U.S. dollar amounts above and elsewhere in this report are converted from yen, for convenience only, at the prevailing rate
of ¥120 to US$1 as of March 31, 2003.
Contents
02 _ To Our Stakeholders/ 04_Interview with the President and CEO/ 12_Corporate Governance/14_At a Glance
16_ Strategy by Business Segment
16_Agri-Marine Products/ 18_Textile/ 20_Forest Products & General Merchandise
22_Chemicals/ 24_Energy/ 26_Metals & Mineral Resources/ 28_Transportation & Industrial Machinery
30_Utility & Infrastructure/ 32_Plant & Ship/ 34_Development & Construction/
36_Finance & Logistics Business/ 38_Telecom & Information/ 40_Business Incubation Department
42_ Risk Management/ 43_Compliance/ 44_Our Commitment to Sustainable Growth
45_ Corporate Citizenship/ 46_Directors, Corporate Auditors and Corporate Vice Presidents
47_ Financial Section/ 84_International Network/ 86_Major Subsidiaries and Affiliates
92_ Organization/ 93_Management Policies at Marubeni/ Corporate Data
Disclaimer Regarding Forward-Looking Statements
This annual report contains forward-looking statements about the performance and management plans of Marubeni and its Group companies,
based on management’s assumptions in light of current information. The following factors may therefore influence actual results. These factors
include consumer trends in Japan and in major global markets, private capital expenditures, currency fluctuations, notably against the U.S.
dollar, materials prices, and political turmoil in certain countries and regions.
Because we have
innovative strategies,
powerful businesses
and new solutions !
In November 2001, Marubeni enacted its @ction 21 “A” PLAN
Year ended March 2003
Net income ¥30.3 billion
for the sweeping elimination of non-performing assets.
Backed by this plan, Marubeni achieved a sharp turnaround in
performance for the fiscal year ended March 2003,
with net income of ¥30.3 billion. There is no question that
Marubeni’s ability to generate profits is improving.
30.3
Without resting on its laurels, Marubeni will take its selectivity
and focus drive a step further to attain another spectacular
leap forward in performance.
W
h
n
is
t
a
t
ex
?
-116.4
Year ended March 2002
Net loss ¥116.4 billion
Annual Report 2003
For the fiscal year ended March 31, 2003
Marubeni Corporation 2003
1
Implementing
the best management practices !
To Our Stakeholders
Over the last year or so, Marubeni has single-mindedly focused on realizing a dramatic
improvement in our earnings structure. In this regard, we have exited from unprofitable
businesses, chipped away at interest-bearing debt, cut expenses, and improved
the profitability of divisions and subsidiaries—all in accordance with the stated objectives
of our “A” PLAN. The result of these actions is that we were able to stage a V-shaped
recovery in performance, rebounding from a net loss of ¥116.4 billion in the previous year
to a record high of ¥30.3 billion in net income for the year under review.
However, the achievement of the “A” PLAN is not our ultimate goal. On April 1, 2003,
former President and CEO Tohru Tsuji was appointed Chairman, and Nobuo Katsumata,
formerly a Corporate Executive Vice President, took the helm as President and CEO.
Chairman Tsuji will lend his invaluable support to Marubeni’s new management team
headed by President Katsumata to help the company take another dramatic leap forward.
Our new keyword is “From recovery to a leap forward.” In April 2003, we launched
a new medium-term management plan called the “V” PLAN (Vitalize Marubeni).
Under this plan, we are determined to realize our goal of forging Marubeni into a resilient
corporate group possessing the top operational units and business portfolio in the industry.
The management and employees of Marubeni are joined in a concerted effort to improve
the company’s corporate value and enhance its reputation in the eyes of its stakeholders.
To all of our stakeholders, I ask for your continued support and encouragement
as we endeavor to reach these goals.
2
Marubeni Corporation 2003
July 2003
Tohru Tsuji
Chairman
Nobuo Katsumata
President and CEO
Marubeni Corporation 2003
3
Nobuo Katsumata, President and CEO
Interview with the President and CEO
Q
What are your impressions of
billion, well ahead of our target of ¥2,500 billion.
Marubeni’s @ction 21 “A” PLAN that
In shareholders’ equity, meanwhile, declining stock prices
recently concluded in March 2003 and
and foreign currency translation regrettably prevented us
how would you rate the plan overall?
from reaching our stated objectives in this area. Still,
the faster-than-expected reduction of net interest-bearing
debt meant that we almost achieved our net D/E ratio target,
A
The plan was a roadmap that emerged from
two pressing concerns: what steps were
necessary to ensure Marubeni’s corporate
I would certainly say that the “A” PLAN scored perfect
marks in my book. But a company’s future does not start
survival and how could we achieve a sharp turnaround?
and end with one year’s good performance. We cannot
An “A” PLAN Steering Committee was assembled and
allow ourselves to be satisfied with achieving a V-shaped
given sweeping powers to drive the plan forward,
recovery. Essentially, what we have done thus far is place
quickening the pace of the decision-making process.
Marubeni in a position where it can finally meet upcoming
The “A” PLAN called for consolidated net income of
¥30.0 billion, net interest-bearing debt of ¥2,500 billion,
shareholders’ equity of ¥290.0 billion and a net debt-to-
challenges head-on, including a persistently harsh economic
environment. The real battle starts now.
The “A” PLAN can certainly be credited with
equity (D/E) ratio of 8.6 times by the end of March 2003.
reinvigorating both Marubeni’s earnings power and our
Specific measures called for Marubeni to withdraw from
internal structure. To parlay this success into more gains,
unprofitable businesses, lower its interest-bearing debt, cut
we initiated in April 2003 our latest three-year management
expenses, and improve the profitability of divisions and
plan, known as the “V” PLAN. Improving Marubeni’s
subsidiaries, with the goal of drastically reforming our
financial position and strengthening our earnings base are
earnings structure.
the central tenets of this new plan. The plan calls for
In terms of results, we posted close to an all-time high
consolidated net income of ¥50.0 billion, net interest-bearing
of ¥30.3 billion in consolidated net income. We consider this
debt of ¥2,000 billion, and a net D/E ratio of 4 to 5 times by
record performance as ample proof that we have improved
its scheduled conclusion in March 2006.
our ability to generate earnings. Reductions in net interestbearing debt also exceeded expectations, falling to ¥2,264.1
4
with this metric standing at 8.7 times as of March 31, 2003.
Marubeni Corporation 2003
Financial Targets
“V”PLAN
06
20
h
c
ar
M
ed
d
en
ar s
Ye rget
Ta
tes
er ebt
t
n D
tI g
Ne arin
rs’
e
b
lde
o
eh
ar
Sh uity
q
E
s
et
ss
A
sk
Ri
on
illi
1
b
0
*
0
n
,0
lio
¥2
bil
0
-50
00
4
¥
on
illi
b
80
¥5
06
20
ch
r
a
M
ed
d
en
ar s
Ye rget
Ta
06
20
ch
r
a
M
ed
d
en
ar s
Ye rget
n
Ta
llio
0
¥5
e
om
nc
I
2
t
Ne
s*
g
in
rn
Ea
e
r
Co
bi
n
illio
b
40
¥1
8.6
3
n*
ur
et
r
sk
Ri
tio
Ra
E
/
tD
Ne
es
im
t
0
-5.
4.0
*1: Including capital enhancement
Income (excluding Provision for Doubtful Accounts) +
*2: Operating
Equity in Earnings (loss) + Dividends
*3: Risk-return=
Net Income
Risk Assets
Marubeni Corporation 2003
5
“V”PLAN
Financial Targets by Business Model
— Net Income
n
lio
bil
30
¥
n
lio
il
0b
5
¥
5
32
6
43
(7)
60
Commodity Trade
20
006
0
Ma
40
3
200 *
h
rc
st)
Ma reca
(Fo
2
rch
0)
(2
s
on )
illi
( B ye n
of
Q
1
Could you elaborate on how you
Project Solution Service
Business Incubation
figures at the announcement of
* Estimated
the plan in February 2003.
PATRAC, a proprietary performance indicator based on
intend to implement portfolio
the capital cost, will be used to evaluate and judge the
management, one of the central themes
performance of these newly formed units. Whether a unit
of the “V” PLAN?
delivers positive or negative PATRAC will ultimately
determine its fate. Optimal use of PATRAC in determining
the efficacy of our portfolio units and operating companies
A
One of the most vexing issues Marubeni must
will bring greater precision to our efforts toward selection
resolve is how to achieve a steady expansion
and concentration of resources. We believe this newfound
in earnings while at the same time reducing
clarity will translate into desired improvements in
the company’s level of risk assets. We believe the key to
doing this lies in also managing our business at a lower
Marubeni’s earnings, balance sheet and cash flows.
Here’s how. We plan to exit from any unit that, for
level to divisions as at present. To this end, we reorganized
whatever reason, experiences negative PATRAC for three
Marubeni’s business segments and subsidiaries into 100 so-
straight years. However, if a unit with currently negative
called “portfolio units,” based on criteria such as products
PATRAC submits what management believes is a viable
and services offered, business model, geography and client
plan for achieving positive PATRAC in its third year,
base. In implementing this change, our main objective was
the unit will be given a chance to prove itself. Whatever
to accomplish the formerly daunting task of screening out
the case may be, all discussions are now focused on a single
unprofitable fields and businesses from otherwise good
topic: how will PATRAC change? From that perspective
divisions, and vice versa. By then rigorously prioritizing
alone, portfolio units will have a clear idea of their target.
resources we will see steady improvements in overall
Despite only being launched this past April, this new
business efficiency.
system has already taken root, with a PATRAC-centric
mindset already beginning to permeate the entire Marubeni
6
Marubeni Corporation 2003
Group. By using PATRAC to evaluate units and operating
companies, and focusing resources on only the strongest
units and most promising fields, Marubeni is on
Q
increasingly solid ground.
Another major objective of the “V” PLAN
involves the clarification of management
strategies according to the specific business model concerned. Could you elabo-
As we apply greater selectivity and focus to our
rate further on this point?
portfolio units, we are determined to create a company with
the best portfolio in the industry.
PATRAC*= Net Income - (Risk Assets x 8%)
The performance benchmark is a positive PATRAC value.
(
During the V PLAN (April 2003 – March 2006),
Risk Asset Cost (Equity cost) is taken to be 8%.
* PATRAC : Profit After Tax less Risk Asset Cost
)
A
As a general trading company, Marubeni
conducts business across a wide spectrum of
areas. The products Marubeni handles and the
services it provides span and incorporate
every industry imaginable, so naturally each business
model has certain distinctive characteristics and features.
Logically, it follows that management policies must also
account for these differences. Devising business strategies
based on business models, rather than individual
industries, is vitally important. At Marubeni, our operations
are divided broadly into three distinct business models:
commodity trade, project solution services, and business
incubation. Strategies pertaining to each business model are
clearly defined, and divisions with similar or complementary functions are grouped together. In so doing, our aims
are to deepen Marubeni’s level of specialization,
heighten the company’s functions, and achieve gains in
overall efficiency.
Marubeni Corporation 2003
7
Q
Do you believe that Marubeni can
Products Division in formulating plans for a “Tokyo metro-
improve earnings in its strong suit of
politan supermarket alliance” to drive improvements in
commodity trade amid fears that
distribution efficiency by reorganizing the industry. Years ago,
growth could be inhibited by
the maturity of markets?
a common notion abounded of transforming convenience
stores into IT communication bases. In the end, though, we
reasoned that enhancing the supermarket business model
where we have investments and alliances gives us the greatest
A
The term “commodity trade” can cause some
reward as a trading company.
misunderstanding. It is best I think to consider
We will also continue to strengthen our presence in other
Marubeni’s role as more of an intermediary for
fields where Marubeni has definitive strengths. Among these
the trade of merchandise. In actuality, of course, Marubeni is
are pulp & paper, in which we have accumulated a wealth of
far more than an intermediary. Our customers and business
experience, know-how and accomplishments over the years,
partners demand services from Marubeni that are as diverse as
and electronics materials, where we began making well-placed
they are sophisticated. For this reason, Marubeni is also
investments in China over a decade ago.
broadening the scope of its services to encompass merchandise
development, manufacturing and management consulting.
Complementing this, we invest along the value chain, from
Q
What strategies do you have in
important field in the context of our overall earnings base.
A
In areas such as plant and development and
This is particularly true when considering the high degree of
oriented skills, and specialized expertise that distinguish
trust we have won from our customers over many years in this
these areas as outstanding strengths. During the past
field. The “V” PLAN calls for investments of between ¥100.0
decade, however, the ease with which these businesses
billion and ¥150.0 billion over its duration, most of which will
received investments and financing resulted in an
be concentrated in commodity trade. The “V” PLAN targets an
excessively bulky asset portfolio. When the “A” PLAN was
increase of ¥20.0 billion in net income in the year ending
enacted to streamline assets, this situation invariably led to
March 31, 2006, compared with the past fiscal year. Of this
enormous write-offs. As a result, business activities in
increase, we expect the commodity trade to account for ¥11.0
plant-related areas are now conducted without heavy
billion. That means we must ask whether, for example,
dependence on financing. Based on this stance, we have
investments in the retail field will really be rewarded with
busied ourselves assembling expertise as an organizer,
higher earnings. This was the motivation of our Agri-Marine
developer and consultant, transforming this business model
upstream to downstream areas. Increasing earnings at every
stage in the value chain that is created is the essence of
Marubeni’s commodity trade business model. Through a
mind for the project solution service
business model?
combination of investment and trade, we work to spread our
business into every industry possible.
Commodity trade is a Marubeni specialty—and an
8
Marubeni Corporation 2003
construction, Marubeni has spent years
gaining the practical know-how, solution-
“V”PLAN
Financial Targets by Business Model
— Net Interest-bearing Debt
n
lio
il
0b
,40
¥2
11
5
1,0
4
1,2
n
lio
0
0
bil
00
,0
¥2
0
80
3,
00
0
2,
50
0
0
2,
2
1,2
00
Commodity Trade
0
1,
50
0
1,
Project Solution Service
00
0
50
h
arc 3
M
At 200
t)*
c as
e
r
(Fo
rch
Ma 06
t
A
20
0
70
0
0
s
on )
illi
( B ye n
of
Business Incubation
figures at the announcement of
* Estimated
the plan in February 2003.
into one centered on providing solutions to our customers.
while at the same time spreading the risk as you foster the
Marubeni received orders in plant-related areas totaling a
growth of those budding prospects.
record-high ¥1,500.0 billion in the year ended March 31,
2003, underscoring our superior capabilities in this field.
The recovery in orders and the resounding success of our
overseas IPP business, yet another of Marubeni’s strengths,
are clear indications that it was not too late to steer our
project solution service business model back on track.
One thing it certainly proves is that this business model has
Q
more than enough fight left in it.
Fund procurement is the lifeblood of
any trading house and a vital element
for improving financial position. What
specific steps are being taken in this
regard at Marubeni?
Q
Could you give us a brief
outline of the business incubation
business model?
A
Our somewhat delicate financial position
certainly constitutes the most urgent issue
Marubeni currently faces. The crux of the
matter is this: how do we lift shareholders’ equity past its
A
The business incubation model takes a long-
current level of ¥260.0 billion to strengthen our balance
term approach to nurturing the growth of
sheet? By relentlessly implementing the “V” PLAN, our
businesses with the potential to become
hope over its three-year duration is to raise earnings, boost
substantial future earners. Resources are being invested
equity, and reduce interest-bearing debt to result in a net D/E
largely in biotechnology, nanotechnology, and other new
ratio of between four and five times.
applied technology fields targeted by the “V” PLAN. In the
To achieve those objectives, we will redouble our
business incubation model, I believe what is most important
efforts to raise earnings, and cut net interest-bearing debt to
is to develop an eye for spotting promising opportunities
below the ¥2,000 billion mark. In addition, we will need to
Marubeni Corporation 2003
9
increase shareholders’ equity by approximately ¥100.0
the execution of business operations. Moreover, the term of
billion over the next 3 years to place it somewhere in
office for directors is now one year, a move that should
the neighborhood of ¥400 to ¥500 billion by March 31, 2006.
imbue management with more vigor than ever before.
In doing so, we will try to bring shareholders’ equity as
In May 2003, we set up the Advisory Committee in an
close as possible to a level that covers our achieving
effort to turn Marubeni into a company with an even higher
a financial position sturdy enough to withstand even
degree of transparency. This committee ensures that views
the highest degree of risk, thereby regaining the trust of
and opinions from outside are reflected in management
the capital markets. That said, the effects of share dilution
decisions taken throughout Marubeni. Changes have also
and share pricing must be carefully weighed in our
been made to the Management Remuneration Committee,
decisions to raise shareholders’ equity.
which now includes auditors from outside the company.
Furthermore, we recently established the Corporate
Auditor’s Office to bolster internal audit functions, giving
Q
In this challenging economic landscape,
Marubeni a system fully equipped to carry out corporate
the implication of major corporations in
audits. IR activities are also extremely important to
Japan and elsewhere in a host of
ensuring highly transparent management. For my part, I am
scandals has heightened awareness
regarding corporate governance.
personally working to proactively disclose information and
create other opportunities for increased IR activities
at Marubeni.
What is your stance on corporate
governance and how do you intend to
enhance such activities at Marubeni?
A
Actually, we have enacted a number of
corporate governance measures during the
past two years. At March 31, 2002, Marubeni
had 26 directors. As of June 30, 2003, that number stood at
11. The small number of directors will facilitate faster
decision-making. All of our chief operating officers have
also been appointed to the position of corporate vice
president. With these steps, we have further separated
management oversight and responsibility for
10
Marubeni Corporation 2003
Q
Next to corporate governance,
compliance is another issue of which
stakeholders have become much more
aware as of late. What is your stance
and what measures do you have
regarding this issue?
A
I believe that the job of a general trading
ethical values in all employees of the Marubeni Group.
company is to act as a kind of wide-ranging
Moreover, we have established what we call the “Door of
service company. We should first provide
Courage” as a point of contact for employees wishing to
customers with functions and services well matched to their
report compliance-related concerns.
particular needs. As customers recognize our capacity to
meet their requirements, the extent to which they value
Q
In closing , are there any sentiments you
obligations. As I see it, the most important aspect of
A
At this moment, my top priority and the goal to
compliance is to constantly review the ethical standpoints
“V” PLAN. I am fully prepared to usher in any and all reforms
and common knowledge of every employee and every
required to reach this goal. I have sent emails to all Marubeni
director in the Marubeni Group to ensure that no gaps exist
employees informing them of my commitment, and have
when compared against the standards and knowledge of
taken time to respond to each of the questions they have asked
society at large. By allowing the “earning profits as opposed
me in return. Everyone at Marubeni appears to share the same
to making profits“ mindset to permeate the entire Group, all
sense of urgency and apprehension for what lies ahead. But I
employees can feel confident in their actions and decisions
also sense among them a strong feeling of solidarity, of shared
on the company’s behalf. This trend ultimately raises
purpose. Marubeni possesses the structure and resources
Marubeni’s standing as a good corporate citizen.
required to take a spectacular leap forward to its next stage of
what we can provide will then materialize into profits. In
other words, it is important to have a sense that one is
“earning” profits, as opposed to merely “making” profits.
wish to convey to our stakeholders?
When we hear the word “compliance,” the image that
usually springs to mind is one of adherence to the law.
Compliance, though, is not simply about fulfilling basic legal
Marubeni takes very seriously any scandals involving
which I am firmly and whole-heartedly
committed is the successful completion of the
growth. The question being posed to me now is: to what extent
Group companies. In May 2002, in an effort to prevent the
can I as president maximize this position and utilize it to
recurrence of scandals that call our sincerity as a corporate
Marubeni’s advantage? As an answer, I will pledge to our
citizen into question and to maintain our existence as a
stakeholders only this—that I plan to implement the “V”
sound corporate enterprise, we established a compliance
PLAN with a degree of speed and decisiveness they have
committee. Specific measures taken by the committee to
never witnessed before to turn Marubeni into a resilient
strengthen Marubeni’s compliance structure include the
corporate group imbued with an indomitable will to survive.
drafting of the Compliance Manual, as well as training
aimed at instilling the spirit of corporate governance and
In these endeavors, many will marvel at what
Marubeni accomplishes in the years ahead.
Marubeni Corporation 2003
11
Implementing
the best management practices !
Corporate Governance
Enhanced corporate governance is indispensable to achieving the objectives of
“V” PLAN, Marubeni’s current medium-term management plan. That is why
Marubeni is implementing initiatives aimed at reform of its current system of
corporate governance. Placing greater emphasis on transparency for shareholders
and other stakeholders, these actions will improve checks on management and
management oversight.
Members of the Board
Shigeki Kuwahara
Yuji Kato
Executive Deputy President
Corporate Executive Vice
President
Nobuo Katsumata
President and CEO
Tohru Tsuji
Chairman
12
Marubeni Corporation 2003
Specific measures
importance. With this in mind, Marubeni established the
Marubeni downsized its Board of Directors from 26 members
Advisory Committee as a forum for advice and suggestions
(for the fiscal year ended March 31, 2002) to its current 11
from academic experts, economists, attorneys, cultural
member-size to make the Board more dynamic in its activi-
figures and others. This committee will be instrumental in
ties. All chief operating officers have also been appointed to
improving the transparency and soundness of the company,
the position of corporate vice president. From these actions,
and enabling Marubeni to better refine its corporate culture.
Marubeni has gained a system that clearly separates respon-
The Advisory Committee is scheduled to convene three
sibilities for management from the execution of business
times yearly, presenting management as a whole with
operations, and allows chief operating officers to concentrate
invaluable opportunities to hear and exchange opinions
completely on their business units.
that can be channeled into the creation of effective business
Furthermore, in April 2003, terms of office for Board
strategy in the years ahead.
members were changed from 2 years to 1 year as a further
transparency of its management by means of the newly
Establishment of the Corporate Auditor’s
Office
established Advisory Committee and Corporate Auditor’s
In April 2003, Marubeni set up the Corporate Auditor’s
Office, and the inclusion of outside expertise on its Manage-
Office as a means of facilitating and strengthening the
ment Remuneration Committee.
capacity of corporate auditors to execute their duties. The
step to invigorate management. Marubeni will enhance the
office staff serves to support Corporate Auditors in fulfilling
Establishment of the Advisory Committee
their auditing functions. Moreover, Marubeni has nearly
Because Marubeni operates across a broad spectrum of
doubled the staff of its Audit Department. This infusion of
business fields, having access to outside viewpoints and
personnel is expected to result in stronger auditing func-
opinions when deciding on policy is a matter of vital
tions throughout the entire Marubeni Group.
Kazuo Ogawa (Left)
Corporate Senior Vice President
Makoto Isogai (Right)
Corporate Senior Vice President
Toshio Nakagawa
Corporate Executive
Vice President
Tomoyuki
Nakayama
(Left)
Corporate Senior Vice
President
Akira Matsuda
Corporate Senior
Vice President
Katsuo Koh
Executive Deputy President
Susumu
Watanabe (Right)
Corporate Senior Vice
President
Marubeni Corporation 2003
13
At a Glance
Segment
Percentage of Total
11.6%
Agri-Marine
Products
8.0%
4.2%
Textile
Main Products
and Services
• Production, sales and transport
of products associated with
food and food production,
including agricultural and
marine products, processed
foods, beverages, livestock
feed, fertilizer, and related raw
materials
• Trading transactions: ¥1,023,513 million
• Segment assets:
¥347,483 million
• The division entered an alliance with Tobu Store Co.,
Ltd., a major Japanese supermarket chain, which also
saw it take an equity stake of 12.5%.
• Opened the first and second outlets of Metro Cash & Carry
Japan K.K., a joint venture with Metro AG of Germany.
• U.S.-based subsidiary Columbia Grain International, Inc.
extended its grain procurement network through a
business tie-up with General Mills, Inc., one of the
largest producers of flour and grain in the United States.
• Engaged in every stage of the
textile business from raw
materials through to finished
products, including planning,
procurement, production, sales,
logistics and retail outlet
management
• Trading transactions: ¥370,277 million
• Segment assets:
¥123,868 million
• The division is actively forming alliances with leading
Japanese textile manufacturers to establish and
expand production bases in China, which is gaining
greater self-sufficiency in textile materials.
• In addition, the division is also targeting China’s
enormous consumer market, having established the
country’s first foreign-affiliated garment wholesaler.
• Sales of footwear, rubber
products and building materials
• Production and sales of paper
pulp, paper and paperboard
• Afforestation projects
• Trading transactions: ¥745,776 million
• Segment assets:
¥299,009 million
• Despite weak market prices, cost reductions helped
Canada-based pulp manufacturer Daishowa-Marubeni
International Ltd. turn results around.
• Well Corporation, an operator of recycled-paper yards,
was established by Marubeni Paper Recycle Co., Ltd.
to strengthen its capacity to handle recycled paper.
• Business operations related to
petrochemicals, plastics,
inorganic chemicals, specialty
chemicals, electronic materials,
and the fields of biotechnology
and recycling
• Trading transactions: ¥569,928 million
• Segment assets:
¥147,420 million
• Petrochemical product transactions were strong due to
rising prices brought on by higher crude oil and
naphtha prices in the second half of the fiscal year.
• The division built a system for providing optimum
solutions across the spectrum of electronic materials
with the establishment in July 2002 of a company
in Shanghai specializing in the trading of
electronic materials.
• Resource development for oil,
gas, nuclear and other
commercially viable forms of
energy; related marketing
business, including retail
operations such as resource
trade and gasoline filling stations
• Trading transactions: ¥2,309,753 million
• Segment assets:
¥348,338 million
• The division acquired E & P rights to the Fairway Gas
field in the U.S. The division’s investment in the same
field also entitles it to receive the oil equivalent of 6,500
barrels/day of natural gas.
• The division is also involved in the development of the
Sycamore oil field in the North Sea, and its share of
daily production has risen to 18,000 barrels.
• Overseas metal resource
development, including aluminum
smelting and the development of
mines both for non-ferrous metals
and ore used in steel production
• Sale of raw materials for steel
production (iron ore, coal, ferro
alloys), non-ferrous metals such as
copper, zinc, and aluminum, and
precious metals
• Trading transactions: ¥442,344 million
• Segment assets:
¥157,820 million
• Work progressed smoothly to ramp up production
capacity at Aluminerie Alouette, an aluminum smelter in
Canada. When operating at full capacity, the smelter
will have an annual output of 550,000 metric tons
(Marubeni’s share is 37,000 metric tons).
• Total annual production at the four Australian coal mines
the division is involved in through Marubeni Coal Pty. Ltd.
climbed 10% year-on-year to 11,000,000 metric tons.
2.9%
8.5%
Forest Products &
General
Merchandise
6.9%
6.5%
Chemicals
3.4%
26.3%
Energy
8.1%
5.0%
Metals &
Mineral Resources
3.7%
Highlights
Note: Segment performance throughout this report is based on business results for the year ended March 31, 2003. Information regarding business lines, products and services is as of April 2003.
14
Marubeni Corporation 2003
Segment trading transactions as percentage of total
Segment
Percentage of Total
8.8%
Transportation &
Industrial
Machinery
6.8%
4.8%
Utility &
Infrastructure
5.4%
8.4%
Plant & Ship
9.1%
2.1%
Development &
Construction
8.7%
0.4%
Finance & Logistics
Business
3.9%
4.4%
Telecom &
Information
5.7%
Main Products
and Services
Segment assets as percentage of total
Highlights
• Import of airliners, and defense and
aerospace equipment
• Export, wholesale and retail of
automobiles and construction, forestry,
and agricultural machinery
• Import and domestic sales of large-scale
industrial and automotive machinery, as
well as printing, environmental, and food
processing machinery
• Wholesale and retail of computer
hardware, software and peripherals;
sales of medical equipment
• Trading transactions: ¥776,578 million
• Segment assets:
¥292,581 million
• The division received an order from Hokuetsu Paper
Mills, Ltd. for a 2,900 metric ton/day soda recovery
boiler/steam turbine power generator, the largest
in Japan.
• An order worth approximately ¥2 billion was received
from the Irrigation Department, Ministry of Agriculture
and Irrigation, the Union of Myanmar, for 133 units of
equipment, consisting of trucks and construction
machinery.
• Development and operations of
power, water and solid waste
management projects
• Machinery supply and
construction of power plants,
transportation infrastructure
such as railways and airports,
and water and waste
management projects
• Trading transactions: ¥421,850 million
• Segment assets:
¥232,197 million
• To expand overseas operations, the division secured
power generation assets with gross capacity of 5,000megawatts, and wind power assets in Japan of 50megawatts.
• The division received orders for construction of
the Shuweihat Water Transmission scheme (480
kilometers) in the UAE and a renovation project for
the Astana International Airport in Kazakhstan.
• Handling of projects and
equipment related to
steel-making, cement,
petrochemicals, fertilizer, oil
refining and natural gas
• Supply and trading of various
types of new and secondhand
vessels and ship materials
• Ship finance, owing and
chartering
• Trading transactions: ¥736,476 million
• Segment assets:
¥392,244 million
• Orders were received for steel plants from several
companies, including Tubarao of Brazil, Baoshan of
China, and Eregli of Turkey.
• In energy and chemical plants, orders were received
for petrochemical, oil and gas plants largely from Africa,
the Middle East, the CIS, and China.
• In the ship business, orders were received for over 30
new vessels.
• Housing development in Japan,
primarily condominiums
• Leasing and subleasing of
commercial building and
management of real estate
funds in Japan
• Residential housing development overseas
• Trading transactions: ¥185,840 million
• Segment assets:
¥376,963 million
• Condominiums performed well for the division,
particularly for properties located in and around Tokyo.
• Overseas, positive sales continue for division housing
projects in Shanghai, with other new projects also on
the drawing board.
• Operation of businesses related
to funds, financing services,
and insurance; trading and
dealing of financial products
• Operation of forwarding and
third-party logistics (3PL)
businesses, logistics-related
consulting, and container
terminal businesses
• Trading transactions: ¥37,834 million
• Segment assets:
¥169,504 million
• The division operates a container terminal business at
Thailand’s Laem Chabang port, handling one of the top
shares of such business at the port and contributing to
the development of Thailand’s industry and economy.
• The division built upon its success in management
buy-in (MBI) funds to structure new funds designed to
rehabilitate struggling companies.
• Telecommunication network
infrastructure businesses
• Export and construction of
security-related facilities and
telecommunication network
facilities for overseas clients
• IT solution service
• Mobile service and cable
television businesses
• ASP/ISP businesses
• Trading transactions: ¥386,162 million
• Segment assets:
¥245,103 million
• The division’s mobile phone business in Japan turned
in a steady performance.
• The division is assembling a capable team for its IT
solutions business targeting enterprises and government agencies in Japan and elsewhere, with full-scale
services set to commence in the current fiscal year.
Marubeni Corporation 2003
15
Agri-Marine Products Division
Strategy by Business Segment
Agri-Marine Products
Cereals & Sugar Unit
Grain & Feedstuff Unit
Oilseeds, Fats & Oils Unit
Beverage Unit
Foods Merchandising Unit
Foods Marketing Project Unit
Farm Products Unit
Meat & Seafood Unit
Osaka Foodstuff Unit
Division
Message from the COO
Division Strategies and Strengths
Trading companies play two vital roles in Japan’s food
Grain trading is a competitive strength for the division. The
sector. The first is as a conduit for the movement of food
division is the top player in feed such as corn and ranks
and natural resources from overseas to Japan, which has a
second in wheat and soybeans among Japanese trading firms
low degree of self-sufficiency in these areas, ensuring stable
in terms of volume. To ensure stable supplies, the division
imports of food. The comprehensive nature of trading
has bolstered its in-house collection function while strength-
companies allow them to address everything from purchas-
ening its relationships with major food producers. To
ing, and shipment logistics, to fluctuations in exchange
illustrate, the division has teamed up with Archer Daniels
rates and prices for heavily imported staple foods such as
Midland Company to create a mechanism for the import of
wheat, soybeans, and corn. The second role is to develop
non-genetically modified organisms.
and efficiently serve consumers with products that meet
The division’s in-house collection function includes
their needs. The division ensures products that consumers
Columbia Grain International, Inc., one of the largest grain
seek by developing products through its global network
collection and export bases on the U.S. West Coast. In 2002,
and by creating logistics mechanisms, including the
the division forged a business alliance with General Mills,
construction of systems driven by supply chain manage-
Inc., one of the largest processors of grain in the United
ment. Highly cognizant of the importance of this social
States, for the collection of wheat in Montana, a major
mission and role, Marubeni aims to contribute to society
grain-producing state. With this move, the division further
through this business.
expanded its food collection network.
The division also maintains grain silos and feed blend
plants in Japan to facilitate greater integration of distribution channels from overseas producing areas to the supply
points in Japan. In October 2003, Marubeni Shiryo Co., Ltd.,
a subsidiary of Marubeni, merged with Nisshin Feed, Inc.,
a subsidiary of Nisshin Seifun Group, Inc., creating
Marubeni-Nisshin Feed, Inc., now one of the leading feed
companies in Japan in terms of market share.
16
Marubeni Corporation 2003
Segment Assets
Segment Net Income
( At March 31)
( Years ended March 31)
35
34
6,4
86
8,6
66
,0
7,0
00
5)
00
0
0,
(
7
6,4
5,
00
30
’01
10
83
0,
7,4
0
0
0,
)
(1
00
0
00
,0
,0
0
(5
00
0
10
’02
’03
0
00
20
’02
’03
79
56
40
34
’01
0,0
00
0)
ns
illio
(M
n)
Ye
of
0,
ns
illio
(M
n)
Ye
of
Tetsuro Sakamoto
Corporate Vice President, COO
In close-to-the-consumer downstream operations, in
and society gradually become more consumer-oriented.
2001, Marubeni invested in Maruetsu, Inc., one of the
Moreover, the division works to create highly efficient
largest supermarket operators in the Tokyo Metropolitan
logistics mechanisms by leveraging information technology
area. In 2003, Marubeni concluded a capital and business
(IT) and logistics technology (LT).
alliance with Tobu Store Co., Ltd., another major supermar-
The division also seeks to capitalize on opportunities
ket operator in the Tokyo Metropolitan area. By pursuing
in new areas. For example, in food wholesale business,
alliances in the logistics and retail industries, including
the division has set up a joint venture with Metro AG, one
supermarkets that serve as direct conduits to end users, the
of the world’s largest wholesale and retail companies, to
division is able to work with partners to create products
create Japan’s first full-fledged cash-and-carry wholesale
that better meet consumer needs, as both Japan’s economy
food business.
Business Topics
Investment in Tobu Store Co., Ltd.
Marubeni and Maruetsu concluded a capital and
business alliance with Tobu Store Co., Ltd., in
January 2003, with Marubeni taking a 12.5%
stake. Marubeni will supply trading company
functions, including the development and supply
of products that meet consumer needs, as well
as the development and operation of information
and logistics systems, working with other alliance
partners to improve the capabilities of Tobu Store.
One of the Tobu Store supermarkets
Launch of Metro Cash & Carry Japan
Metro Cash & Carry Japan (Metro Japan), a joint
venture between Marubeni and Metro AG,
opened its first outlet in December 2002 in Chiba
Prefecture and its second outlet in Saitama
Prefecture in February 2003. Metro Japan thus
became Japan’s first full-fledged wholesale food
business operating on a cash-and-carry format.
Metro Japan offers a broad range
of high quality products at a reasonable price
aimed exclusively at foodservice customers, such
as restaurants and hotels, under a one-stopshopping format.
Metro Japan’s first flagship store in Chiba city
Marubeni Shiryo and Nisshin Feed
combine operations
Marubeni Shiryo and Nisshin Feed have agreed
to combine their operations in October 2003. The
new company will be called Marubeni -Nisshin
Feed, Inc., with Marubeni holding a 60% stake
and Nisshin Seifun Group a 40% stake. The new
company will have sales exceeding ¥100 billion
and will possess the top share in livestock feed
and marine feed in the industry, excluding
National Federation of Agricultural Cooperative
Associations. By deploying corporate resources
with maximum efficiency, Marubeni-Nisshin aims
to establish competitive advantages in all areas,
including costs, sales, and product quality. In
doing so, the company aims to emerge as the
leading company in the feed mixture industry.
Kashima Factory of Marubeni Shiryo
Marubeni Corporation 2003
17
Textile Division
Strategy by Business Segment
Apparel Unit
Apparel Retail Unit
Utility Apparel Unit
Textile Raw Material Unit
Textile Unit
Industrial Material & Interior Furnishings Unit
Textile
Division
Message from the COO
Marubeni Textile Asia Ltd. and Marubeni Textile (Shanghai)
The Textile Division belongs to the consumer goods industry
Co., Ltd., source of the division’s strengths in materials
under a commodity trade-oriented business model. The
proposals and procurement, and Passport Fashion Company
division aims to add value by carrying out integrated
Limited, responsible for overseeing production control of
functions across the consumer goods market, from materials
apparel overseas. In addition, the division offers a range of
to made-up products, based on consumer market trends. The
services through Marubeni Fashion Planning Corporation.
division handles a broad range of consumer goods, from
Though focused mainly on planning proposals and consulting,
clothing and materials, such as fiber, yarn, and textiles, to
the company also renders services in the areas of marketing,
interior and bedding, miscellaneous goods and a variety of
product planning, outlet design, and store management.
industrial materials. The division has been reorganized into
The company is also committed to building long-term
six portfolio units to become more competitive in each
alliance-based businesses with the division’s customers.
operating area. To intensify consolidated management in
In the global textile market, trading of made-up
each unit enables the division to integrate strategy, optimize
garments is expected to expand, fueled by China’s remark-
the deployment of corporate resources, and execute multiple
able growth as the world’s manufacturing center following
functions that emphasize specialization and planning and
its entry into the World Trade Organization. The division is
marketing skills. As a whole, this enables the division to
aggressively expanding its global transactions by emphasiz-
better meet customer expectations.
ing Asia, mainly China, as a production base for offshore
trade of garments bound for Europe and the United States.
Division Strategies and Strengths
It is also leveraging the production infrastructure that has
Japanese apparel companies are increasingly concentrating
arisen to support exports to Japan and exploiting sales
their resources on stores and other sales activities by
methods that have been refined in the Japanese market,
outsourcing production, including planning, amid the
where standards are very high.
intensifying competition in the domestic retail market
18
Specifically, in anticipation of China achieving greater
brought on by diversifying consumption patterns and
self-sufficiency in textile materials, the division aims to
falling prices in the consumer market. The division strives
strengthen production bases in China, in both upstream and
to increase import volume by executing a broad range of
downstream areas and at every stage of the production
functions. Overseas, it carries out materials procurement
process, from finished apparel to materials for consumer
and production and the oversight of sewing processes,
goods and industrial materials. It is doing this by teaming
while effectively utilizing distribution networks both in
up with leading Japanese textile manufacturers that boast
Japan and abroad. Because customer needs are becoming
world-class technologies. Simultaneously, the division is
more complex, the division complements its own strengths
maintaining and upgrading its domestic bases for the
by tapping the highly specialized capabilities of subsidiaries
production of highly functional materials and differentiated
Marubeni Corporation 2003
Segment Assets
Segment Net Income
( At March 31)
( Years ended March 31)
18
97
5
1,3
03
0
0
0
00
0
10
00
0
,0
00
(4
0
00
)
,0
’02
’03
(2
0,
50
’03
’01
00
00
68
4
2,
0,
3,8
2
3
1,9
2)
0,
12
’02
15
’01
46
(3,
20
1
,5
50
4,0
00
)
ns
illio
(M
n)
Ye
of
,0
ns
illio
(M
n)
Ye
of
Hiroshi Koyabu
Corporate Vice President, COO
products while focusing on the development of products
tion, which pioneered the cash-and-carry wholesale textile
that cater to the global market.
business in Japan, to establish China’s first foreign-affiliated
The division is also focusing on domestic sales in China
cash-and-carry wholesale business for garments and
in tandem with expansion of production bases. Its economic
personal items. The venture has already commenced sales in
expansion and vibrant consumer markets point to contin-
China. By deploying a business model that has proved
ued growth in domestic demand. As one response, the
successful in Japan, the division is contributing to the
division has teamed up with industry leader Self Corpora-
modernization of China’s distribution systems.
Business Topics
Expansion of production bases
in China
Marubeni is focusing on the expansion of its bases
in China, recognizing that the nation represents not
only a major production base but also a substantial
consumer market. One example is Jiangyin Nikke
Worsted Spinning Co., Ltd. Marubeni invested in
this company, along with Nippon Keori Kaisha, Ltd.,
Suzhou Marusho Textile Co., Ltd.
to expand production capacity and improve
technology and product development capabilities.
Marubeni has also taken a stake in Jiangyin Ishida
Rope Mfg. Co., Ltd., which is a fiber-rope
manufacturer and is aiming to expand into the
industrial material field.
Another company in which Marubeni acquired a
stake in 2002 is Komatsu Seiren (Shanghai) Sports
& Fashion Co., Ltd. Marubeni joined Komatsu
Seiren Co., Ltd., a leader in the fabric dyeing and
processing industry, in providing capital for this
manufacturer of sports and casual wear. Finally,
Marubeni has invested in Suzhou Marusho Textile
Co., Ltd., which produces worsted yarn used in
carpets, a type of product for which output in
China is insufficient. In addition to these
investments, Marubeni has large-scale projects
set to come online after April 2003.
Introduction of the Russell Athletic
brand to the Japanese market
Marubeni has teamed up with Russell Corporation, widely recognized as one of the foremost
makers and marketers of sportswear in the
United States since the 1930s, to introduce the
Russell Athletic brand to the Japanese market.
The Russell Athletic brand boasts the top share of
the market for uniforms for professional and
college teams, mainly American
football, baseball and basketball.
By utilizing Marubeni’s
production bases in Japan and
overseas, uniforms can be
delivered to Japanese
consumers within three weeks
after an order is placed.
Marubeni works with Imoto Co.,
Ltd., to wholesale sporting
goods and has joined forces
with Xebio Co., Ltd., on the
retail side.
Russell Athletic brand products
Marubeni Corporation 2003
19
Forest Products &
General Merchandise Division
Rubber Unit
Hide, Leather & Footwear Unit
General Merchandise & New Products Unit
Housing & Construction Materials Unit
Leisure Business Unit
Pulp Unit
Wood Chip Unit
Printing & Publication Paper Unit
Packaging Paper & Board Unit
Osaka Pulp, Paper & Paperboard Unit
Strategy by Business Segment
Forest Products &
General Merchandise
Division
Message from the COO
Japanese footwear makers on an OEM basis. Another impor-
The Forest Products & General Merchandise Division operates
tant company is Marubeni Footwear Inc., which wholesales
businesses that leverage both production and marketing
overseas footwear brands and engages in the retail business by
functions. Simultaneously, it aims to find new products and
operating The Athlete’s Foot Japan. Marubeni handles 7–8% of
create new business models.
the approximately ¥300 billion in footwear imported into Japan
In general merchandise, the division handles various
each year.
products such as natural rubber, leather, footwear, and
3. Paper and paperboard The division has forged close
construction materials.
alliances with paper manufacturers both domestically and
In pulp and paper, the division and numerous subsidiaries
in Japan and abroad are active at every stage of the business,
such as plantation, manufacture of pulp and paper, paper
overseas, mainly in Finland. The division also operates its own
paper manufacturers, sales agencies and logistic companies.
Consequently, the division has established a presence in a
processing, and sales. The division also strives to expand its
broad array of fields, including newsprint, publication paper,
global presence and strengthen its comprehensive capabilities
printing paper and information paper. In addition, the division
as a group by creating new functions, including e-commerce
focuses on online sales of printing paper through FORESTNET
platforms that address ever-changing needs in distribution,
Co., Ltd. at http://www.f-n.co.jp. Overseas, the division has
and the construction of paper-recycling networks that address
established sales bases in North America and Europe to
the needs of a recycling-oriented society.
facilitate worldwide market research activities and sales.
Division Strategies and Strengths
recycling-oriented companies, Koa Kogyo Co., Ltd., and
The division aims to expand its product lineups in the follow-
Fukuyama Paper Co., Ltd., that make the environment a
ing areas:
priority and strengthen relations with domestic paper manu-
1. Natural rubber The division seeks to increase profits from
facturers and expand sales to key customers.
In the business of paperboard, the division operates two
20
the business of natural rubber production by adding a trading
The division participates actively in new businesses in
function. In addition, the division, as a world-leading rubber
Japan and abroad and wholly demonstrates the functions of the
trader handling around 5% of the global rubber market, is
Marubeni Group. As a result, the division has been firmly
upgrading and expanding two key businesses—Marubeni
establishing a leading position in the industry.
International Commodities (Singapore) Pte. Ltd. and U
4. Pulp Marubeni owns a 50% stake in Daishowa-Marubeni
Derivatives Pte. Ltd. As a network trader with its own up-
International Ltd. (DMI), which is ranked one of the top market
stream and downstream business bases centered in Asia, the
pulp manufacturers in Canada. Marubeni has been marketing
division works to expand worldwide transactions, particularly
all of the products produced by DMI. Sales volume since the
in China, and thereby enhance profits.
joint venture was established in 1971 has accumulated to more
2. Footwear These operations cover all aspects of the footwear
than 8 million metric tons. Supported by a top-notch customer
business, from product planning to retailing. Hong Kong-based
base as well as technical and sales capabilities cultivated over
Marubeni Footwear Resources Limited plays a pivotal role in
many years, Marubeni, including DMI, sells 1.5 million metric
sourcing overseas products and supplying them to major
tons of market pulp annually, corresponding to roughly 4% of
Marubeni Corporation 2003
Segment Assets
Segment Net Income
( At March 31)
( Years ended March 31)
38
33
,0
00
0
68
00
4,
0
0
4,8
6,
00
0
0
0
0
00
00
0,
2,
0
0
00
00
0,
10
’03
60
00
0
3,0
’02
’03
8,
00
’01
0,
20
’02
14
10
09
0,
9,0
8,0
40
29
94
55
30
’01
1,7
1,8
ns
illio
(M
n)
Ye
of
ns
illio
(M
n)
Ye
of
Kazuoki Matsushita
Corporate Vice President, COO
the market pulp share worldwide.
5. Wood chips As the top trading house in this field, handling
The division set up Marubeni Paper Recycle Co., Ltd., to
around 30% of wood chips imported into Japan, the division
strengthen its capability to handle recycled paper, which ranks
develops new supply sources in South Africa, Southeast Asia,
alongside pulp as a raw material for making paper. Under-
and Latin America. The division also secures its own afforesta-
neath Marubeni Paper Recycle, the division established Well
tion resources in New Zealand and Australia through WA
Corporation, which operates recycled-paper yards, as a joint
Plantation Resources Pty Ltd (Wapres), with the aim of
venture with Kokko K. K. In addition to recycling ordinary
maintaining a stable supply of raw material wood chips for
paper, Well shreds confidential documents. In the coming
papermaking in the future.
years, the division will emphasize production and trading to
expand its pulp business and generate stable profits.
Business Topics
Unimac Rubber Company Limited
Unimac Rubber was established in 1991 in Trang,
Thailand, a natural-rubber producing region, as
part of the division’s upstream strategy to handle
natural rubber. With production capacity of
roughly 50,000 metric tons annually, Unimac
Rubber offers a stable supply of solid-form natural
rubber and natural latex to tire makers, glove
makers, and other users, who give the company’s
products high marks for quality.
Unimac Rubber Company Limited
WA Plantation Resources Pty Ltd
Daishowa-Marubeni International Ltd.
Located in the state of Western Australia,
Wapres, through its wholly owned subsidiary
WACAP, has been making and exporting
papermaking-use wood chips for around 30 years.
Marubeni acquired Wapres to gain access to that
business in 2000, and the company is now jointly
operated with Nippon Paper Industries. Wapres
currently owns and manages around 30,000
hectares of blue gum plantation trees. Each year,
Wapres ships roughly 1 million metric tons of
high-quality woodchips to Japan from Western
Australia’s Bunbury Port, thereby contributing to a
stable supply of raw materials for Japanese paper
manufacturers.
Marubeni and Daishowa Paper Mfg. Co., Ltd.,
established DMI as a joint venture in Canada in
1969. Later, DMI teamed with Weldwood of
Canada Ltd. to set up Cariboo Pulp & Paper Co.
Marubeni sells half of this plant’s annual output of
340,000 metric tons.
DMI expanded in 1992 with the acquisition of
Peace River Pulp Mill. Marubeni sells all of this
plant’s annual output of 460,000 metric tons.
Drawing on their ample timber resources and
technologies cultivated over many years, both
plants are among the most competitive in North
America. Both produce 100% elemental chlorine
free pulp, earning them top reputations for quality
among customers.
The blue gum nurseries of Wapres
Daishowa-Marubeni International Ltd.
Marubeni Corporation 2003
21
Chemicals Division
Strategy by Business Segment
Chemicals
Division
Specialty Chemicals Unit
Electronic Materials Unit
Inorganic Chemicals Unit
Agricultural Chemicals Unit
Basic Chemicals Unit
Plastics Planning Unit
Vinyl Alkali Unit
Osaka Chemicals Unit
Chemix Project Unit
Plax Project Unit
Message from the COO
Division Strategies and Strengths
The Chemicals Division consists of 10 individual business
Swift technological innovation and the rapid commercial-
units. The division’s products include commodity
ization of new products constantly reshape the division’s
chemicals, notably petrochemicals and plastics; inorganic
operations and profit structure. The division’s greatest
chemicals, such as sulfur and salt; pharmaceuticals;
responsibility is to solidify its earnings base while
agrochemicals; and a wide range of chemicals that apply
increasing shareholder value and customer profits by
leading-edge technology, including specialty chemicals,
concentrating on fields of superior growth and earnings
electronic materials, and biochemicals. Looking ahead, the
potential ahead of competitors.
division plans to strengthen its competitive powers, mainly
The division focuses on three business areas. First, it
in basic chemicals, electronic materials, and other areas that
enters areas offering definite demand and low market risk.
demonstrate superior growth. As for the markets, the
Second, it explores fields with abundant growth possibili-
division has positioned Asia, particularly China, as an
ties but limited market risk. Third, it handles businesses
important market, aiming to solidify its earnings base. By
that Marubeni has prioritized before its rivals, and in which
heavily allocating resources in these fields, the overriding
its expertise allows it to reap rewards as a pioneer and
goal is to form a business portfolio that delivers superior
maximize synergies.
performance on the dual fronts of trade and business and
To illustrate, the division positions China as a key
that is well balanced in terms of geography, product lines,
market for electronic materials, due to rapid expansion in
and business platforms.
manufacturing and demand. Accordingly, the division
adjusts its business model to cater to the changes in the
Chinese market and China’s relationship with the global
market. Moreover, in the environmental field, the division
set up a polyethylene terephthalate (PET) recycling and
recycled sheet manufacturing business more than a decade
ago. It has since established a solid position in this field.
The division’s most valuable asset is its talented staff.
They prize relationships and are extremely adept at
perceiving and understanding the specific needs of business
and trading partners. Moreover, they possess a wealth of
ability to plan and create solutions to address these needs.
22
Marubeni Corporation 2003
Segment Assets
Segment Net Income
( At March 31)
( Years ended March 31)
18
5
16
03
2
0
63
00
0
3,
00
0
0,
00
0
2,
2,0
0
,0
00
0
1,
00
50
’02
’03
11
00
0,
2,1
’01
4,
20
0
00
10
’02
’03
,42
3,8
0,
7
14
,69
67
15
’01
0,3
0
0
00
0
ns
illio
(M
n)
Ye
of
ns
illio
(M
n)
Ye
of
Ko Mori
Corporate Vice President, COO
All divisional staff build diverse and multifaceted business
Trading houses work best with partners that offer
relationships and personal networks through extensive
specialized technologies and know-how. The interweaving
experience in Japan and abroad. The division also actively
of resources with those of partners yields greater mutual
localizes human resources to ensure that its networks are
synergies and better opportunities to maximize profit
closely in touch with local market conditions. For example,
structures than do independent efforts. The division strives
the division has established a company dedicated to sales
to select first-class business and trading partners to create
within China. This company is staffed with experts capable
strong and highly profitable business units in every field.
of proposing and executing optimal solutions for local
manufacturers and clients across a broad range of electronic
materials, including those used in cellular phones.
Business Topics
Business Topics
Electronic materials business in China
The electronics industry is shifting its production
bases to China at an accelerating pace. Amid this
development, Marubeni underscored its
commitment to the production of semiconductors, LCDs and mobile devices in this sector by
establishing a company (located in Wuxi, Jiangsu
Province) in May 2001 to produce printed circuit
boards. Marubeni also established in July 2002
a business base in Shanghai dedicated to the
handling of electronic materials. Marubeni aims to
use its existing CRT glass business in Shanghai
and its photoresist (optical resin) manufacturing
business in Suzhou to generate synergies not only
in the domestic Chinese market but also in
overseas markets.
Promotion of biochemical business
Pharmaceutical companies are stepping up the
use of biotechnology in the development of
new drugs and are carrying out clinical trials
simultaneously in Japan, Europe, and the
United States. To exploit this trend, Marubeni is
setting up new businesses, particularly those
that utilize new technologies, including
biotechnology, and facilitate the launch of new
drugs globally. In addition to investing in
ventures that use new microarray technologies
(a method for batch analysis of a large number
of genes) and that develop new cell-based drug
screening systems, Marubeni has forged
alliances with clinical trial companies with the
aim of supplying total solutions.
CMK Electronics (Wuxi) Co., Ltd. located in Wuxi,
China produces printed circuit boards.
Marubeni Corporation 2003
23
Energy Division
Strategy by Business Segment
Energy
Division
Message from the COO
Oil and Gas E & P Unit
Sakhalin Project Unit
LNG Unit
Energy Trading Unit
Petroleum Products Unit
Nuclear Power Unit
MIECO Unit
Sino Benny Unit
Marubeni Energy Unit
Marubeni Ennex Unit
Utility Services Unit
The division is also taking part in the Sakhalin I Project,
This division strives to enhance Marubeni’s corporate value
an ambitious plan for developing the Russian Federation’s
through its activities in the dynamic field of energy, with
oil-rich Sakhalin Island, through Sakhalin Oil and Gas
the ultimate goal of increasing value for all stakeholders.
Development Co., Ltd. By 2005, this project aims to achieve
Operations revolve around three key businesses areas:
a maximum production level of 250,000 barrels of crude oil
energy resource exploration and production, trading, and
per day. Meanwhile in Qatar, the division’s liquefied
marketing and retailing.
natural gas (LNG) production and sales operations are
The energy industry is currently engulfed in a period of
proceeding apace, with plans underway to ramp up
marked transition. To seize the opportunities emerging
production. This project will serve as the base for strength-
from these profound changes in the business environment,
ening LNG operations.
priority is being given to reallocating resources to busi-
In trading, long a core area of focus, the division is
nesses with high return profiles relative to risk in each area.
primarily engaged in transactions involving crude oil and
This will result in an optimally balanced business portfolio
petroleum products, mainly for Japan and other Asian
and a stronger, more flexible earnings structure, contribut-
markets. The division has particularly distinguished itself in
ing to achieving the goals of the “V” PLAN, Marubeni’s
the trade of naphtha, importing about 25% of this material
current medium-term management plan.
to Japan. Moreover, by leveraging risk management
functions gained through years of business experience, the
Division Strategies and Strengths
division plans to optimize ties between overseas branches
Oil and gas E & P (exploration and production) is one of the
and group companies in its business network to supply
division’s core businesses. The division acquired a 35.7%
competitive products in a more efficient manner.
interest in a gas field located in the Gulf of Mexico in March
and operates in China’s Shenzhen region one of the
waters in the North Sea and off the East Coast of India.
country’s largest liquefied petroleum gas (LPG) terminals.
Looking forward, the division will make additional invest-
The division also deals in products from this facility. In
ments in these areas to optimize output, while promoting
Japan, armed with a distribution infrastructure consisting of
new investments and new development in Africa, the Middle
10 facilities for the storage of petroleum products and a
East and other areas where the potential exists for high
network of 760 filling stations, the division is expanding
returns. These actions are intended to boost Marubeni’s
downstream operations.
worldwide daily production from its current 30,000 boed
(barrels of oil equivalent per day) to 50,000 boed by 2005.
24
In terms of marketing and retailing, the division owns
2003, in addition to the production assets its retains in U.K.
Marubeni Corporation 2003
The division also carries out a wide range of businesses
in the field of nuclear energy. Services offered encompass the
Segment Assets
Segment Net Income
( At March 31)
( Years ended March 31)
31
8,9
35
8,3
8
1,4
65
,0
00
4,
0
0
’02
00
0
6,
00
2,
0
0
0
0
00
00
,0
’03
0
00
00
0,
0
10
’03
56
00
6,5
0,
20
’02
8,
0
30
00
5,4
’01
10
38
0,
8,3
83
3
40
34
’01
81
ns
illio
(M
n)
Ye
of
ns
illio
(M
n)
Ye
of
Koichi Mochizuki
Corporate Vice President, COO
entire nuclear fuel cycle business, from uranium ore procure-
gas-to-liquid (GTL) fuels and dimethyl ether (DME). Both
ment, conversion, enrichment, fuel fabrication and recycling
represent so-called “clean fuels” that reduce environmental
to related transport. The division is also engaged in the
burden. These efforts to market environmentally friendly
import and export of various equipment for nuclear power
fuels prove that even amid a challenging and rapidly
plants. In these businesses, the division deploys its high
changing business environment, the Energy Division is
degree of specialization in providing value-added services.
committed to encouraging the kind of creative solutions
Where new business is concerned, the division is
that give rise to successful new businesses.
currently working towards the commercialization of
Business Topics
Purchase of gas production and
sharing rights in the Gulf of Mexico
In March 2003, Marubeni acquired an interest in
the Fairway Gas Field, located in the Gulf of
Mexico off the coast of the U.S. state of Alabama.
The purchase was made through Marubeni Oil &
Gas (U.S.A.) Inc. The gas field is producing natural
gas on the order of 18,000 boed, of which
Marubeni’s share is 6,500 barrels, or 35.7%.
The Fairway Gas Field in Alabama state waters in
the Gulf of Mexico
The Qatar LNG Project
Sales of imported LPG in China
Marubeni has been a partner in the Qatar LNG
Project, which saw its first LNG shipments begin
in 1997. Production and sales operations have
steadily grown since then, owing to long-term
contracts with 5 power companies and 3 gas
companies in Japan, which extend through 2021.
Moreover, the upgrade of facilities onsite is
expected to increase annual production levels
from the current 7.7 million metric tons to 9.2
million metric tons by 2006, further extending the
operational scope of this project.
In 1995, Marubeni formed Shenzhen Sino-Benny
LPG Co., Ltd. with local Chinese partners. This
move made possible for the first time the
construction of an LPG storage terminal able to
accommodate 40,000-ton refrigerated LPG
tankers. The terminal has since thrived, providing
approximately 20%, or nearly 1 million metric
tons, of China’s imported LPG to Guangdong
province. The terminal has also received high
marks from both local governmental organizations
and the LPG industry.
Qatar LNG Project
Refrigerated LPG import terminal in Shenzhen, China
Marubeni Corporation 2003
25
Metals &
Mineral Resources Division
Strategy by Business Segment
Metals &
Mineral Resources
Iron Ore Unit
HBI Project Unit
Steel Making Raw Materials Unit
Coal Unit
Non-Ferrous Metals & Ores Unit
Precious Metals Unit
Light Metals Unit
MMC Unit
Division
Message from the COO
chain integrator, the division seeks to move beyond the
The division maintains a long-term perspective on its
distribution of individual products, the traditional function
development of resources in upstream areas, from mine
of trading houses, gaining the ability to add increasing
discovery and feasibility studies to commercial production.
amounts of value. To this end, the division is exploring
The division is able to generate stable profits in its mid-
ways to better apply the assets at its command.
stream commodity trade by trading in iron ore and coal, as
The “V” PLAN defines natural resources development as
well as ingots of copper, zinc, aluminum and related raw
a core business. The division will thus give priority to
materials. The division’s abilities to cover a diverse array of
investment in promising resource ventures, including
fields, leverage midstream capabilities, and quickly antici-
expansion plans for aluminum smelting plant and coal mine
pate changes in customer requirements, are fast becoming
development projects already underway. Meanwhile, the
its defining characteristics, as is its skill in linking new
division plans to optimize its assets through the restructuring
products, materials and technologies to promising and
or sale of less profitable businesses, with the goal of maxi-
profitable downstream fields. With the exception of the fiscal
mizing earnings through investments that generate higher
year ended March 31, 2002, which required write-offs
returns and greater asset values.
associated with unrealized losses stemming from Marubeni’s
In downstream businesses, the division handles new
bold “A” PLAN, the division has made consistent contribu-
commercially viable materials derived from its products in
tions to the overall performance of the Marubeni Group since
upstream and midstream fields. One example is aluminum
the division was organized in April 2000.
disks, essential components in hard disk drives (HDD),
The division strives to create a seamless interplay
manufactured by Toyo-Memory Technology Sdn. Bhd., a
between its wide range of products and its diverse array of
joint venture established in Malaysia in 1998 with Toyo
business skills. Going forward, plans will focus on achiev-
Kohan Co., Ltd. Toyo-Memory Technology boasts a monthly
ing higher earnings by effectively implementing the “V”
production rate of 1.76 million disks, and continues to
PLAN, Marubeni’s latest medium-term management plan.
operate at full capacity as of June 2003. In preparation for
the next wave of technological innovation, the company is
Division Strategies and Strengths
boosting the data storage capacity of its disks to 80 and
Through the development of ore and coal mines, and
even 100 gigabytes (GB), and has undertaken R&D activities
participation in smelting projects overseas, the division
to enable production of disks that meet the high standards
secures its own supply of resources. At the same time, it
for quality that customers demand.
maintains downstream businesses that harness metal
26
Separately, the division has begun handling the interme-
resources, notably electronic materials. The division thereby
diate materials used in the production of high-density
aims to build a vertically integrated value chain covering
printed circuit boards. The Metals & Mineral Resources
upstream and downstream areas. By becoming a value
Development Department, which was launched in April
Marubeni Corporation 2003
Segment Assets
Segment Net Income
( At March 31)
( Years ended March 31)
7
7,4
20
4
0
0
50
00
36
3
1,
0
0,
0,
(1,
0
0
00
0
10
,0
,0
00
50
’02
’03
9)
0
00
2
1,9
’01
00
0,
0
15
1
’02
’03
,82
57
20
’01
8
3,
5
7,7
25
17
3
2,7
0
(1
00
)
ns
illio
(M
n)
Ye
of
ns
illio
(M
n)
Ye
of
,5
00
0
Tadatsugu Nakajima
Corporate Vice President, COO
2002, continues to assist the division in the setup and
On the organizational front, the thermal coal opera-
commercialization of promising new businesses and materi-
tions formerly conducted by the Energy Division’s Thermal
als. Hopes are high that these activities will eventually result
Coal Department and by Marubeni Tetsugen Co., Ltd. have
in the construction of new earnings pillars for Marubeni.
been unified under the Coal Department of the Metals &
Meanwhile, the Automobile Recycling Law, due to take effect
Mineral Resources Division. Through this integration, the
in Japan from December 2004, is expected to present greater
division seeks not only to maximize synergies arising from
business opportunities for the division’s ferrous and non-
the joint use of supply sources and related information, but
ferrous metal scrap recycling business, allowing for a more
to achieve an optimal divisional business portfolio.
substantial contribution to the sustainable development of a
recycling-oriented society.
Business Topics
Business Topics
Manufacture and sale of intermediate
materials for high-density printed
circuit boards in China
Marubeni and North Corporation, the developer
of technology for the production of high-density
printed circuit boards used in mobile phones
and other portable electronic devices,
established NMBG (H.K.) Ltd. in September
2001. NMBG has already begun test shipments
from the plant in Zhu Hai, Guangdong, China,
which has rapidly become a major market for
these products, with plans proceeding apace for
the start of full-scale operations in 2003.
Production of printed circuit boards
Facilities expansion at aluminum
smelting joint venture in Canada
Through Marubeni Metals and Minerals (Canada),
Inc., Marubeni possesses a 6.67% stake in
Aluminerie Alouette, an aluminum smelting project
in Quebec, Canada. Marubeni’s participation in this
project was finalized in September 2002, when the
decision was made to increase capacity at the site.
As of June 2003, the project had an annual output
of 240,000 metric tons. The completion of
additional facilities is expected to boost output to
550,000 metric tons, resulting in the largest project
of its kind in the Western Hemisphere. Marubeni
handles approximately 420,000 metric tons of
annual aluminum ingot output, including 37,000
metric tons at the Alouette project.
A designer’s rendition of the Alouette plant
after the completion of expansion construction
Expanding coal business in Australia
Marubeni is actively involved in four Australian
coal mines (Macquarie, Jellinbah East, Coppabella
and German Creek East) through Marubeni Coal
Pty. Ltd. The combined annual production of
these mines is 11,000,000 metric tons, an
increase of nearly 10% over the past year. Coal
produced from the mines is sold to steel
manufacturers in Japan and other parts of the
world. Moreover, Marubeni expects an increase in
the total volume of coal it handles once full-scale
operations commence at Hail Creek (annual
capacity of 5.5 million metric tons) and Moorvale
(annual capacity of 2.1 million metric tons), two
cost-competitive open-cut mines, in mid-2003.
Hail Creek mine
Marubeni Corporation 2003
27
Transportation &
Industrial Machinery Division
Aerospace & Defense System Unit
Automotive & Construction Machinery
Retail Business Unit
Automotive & Construction Machinery Wholesale Unit
Automotive, Construction & Agro Machinery Unit
Automotive & Construction Machinery Solution Unit
Production Machinery Unit
Industrial Machinery Unit
Industrial System Subsidiaries & Affiliates Unit
Digital Products Unit
Medical Business Unit
Strategy by Business Segment
Transportation &
Industrial Machinery
Division
Message from the COO
Division Strategies and Strengths
The Transportation & Industrial Machinery Division has
In the fiscal year ended March 31, 2003, the division
been reorganized into four business groups since April 2003
achieved net income of ¥3.6 billion on total assets of ¥292.6
— the three existing groups of aerospace and defense
billion, because of more effective use of assets and the
system, automotive and construction machinery, and
improved profits of our affiliates. In the fiscal year ending
production and industrial machinery, as well as a new
March 31, 2004, the division will cultivate new customers,
group — digital products and medical business. The
products, and businesses based on trust from and good
division’s main business model is commodity trade,
relationships with customers in each of its four business
including operation of sales affiliates, of machinery-related
groups, while maximizing the use of the division’s corpo-
products in these four business groups.
rate resources.
Under this new organization, the division will maxi-
In the aerospace and defense system group, the
mize free cash flow through improved selection in its
division will utilize its customer base cultivated from
current portfolio of businesses and assets, and the cultiva-
investment in aircraft engines to promote domestic sales of
tion of new products and businesses in promising business
regional passenger jets, European-made large helicopters,
fields. These actions are in line with steps for attaining more
aircraft engines, and electronic instruments to private- and
profitable assets laid out in the “V” PLAN.
public-sector clients.
In the automotive and construction machinery group,
the division will strengthen its automotive wholesale and
retail businesses in Europe and the United States while
working to further improve returns on investment by
replacing certain assets. Moreover, the division will
strengthen its handling of a broad range of construction,
mining, and agricultural machinery destined for use in
natural resource and agricultural development projects in
the Middle East, North Africa, Asia, and the Confederation
of Independent States (CIS).
28
Marubeni Corporation 2003
Segment Assets
Segment Net Income
( At March 31)
( Years ended March 31)
44
,48
9)
0)
67
00
0
0
’01
3,5
5,
25
(6,
0
00
00
,0
0
)
0)
00
0)
ns
illio
(M
n)
Ye
of
5,
ns
illio
(M
n)
Ye
of
00
(1
,0
0
00
0
0,
00
(1
00
00
0,
’02
’03
(5
0
0,
20
0
10
’03
(10
0,
81
0,
2,5
30
29
’02
31
40
’01
9,1
78
50
32
7,0
Michio Kuwahara
Corporate Vice President, COO
In the production and industrial machinery group, the
promote and cultivate new products and projects that
division will promote domestic sales and exports of
contribute to the preservation of the natural environment,
bundled hardware and software for automobile production
including the reduction of CO2 emissions.
machinery and pulp and paper manufacturing equipment
In the digital products and medical business group, the
to meet needs and requests from overseas and domestic
division will create new business and projects that make
customers. The division will also create proprietary func-
full use of the Internet in accordance with the growing use
tions and added value as part of efforts to roll out new
of broadband networks and services, the integration of PCs
products and new business models in the nanotechnology
with home electronics, and the convergence of broadcasting
and high-technology fields. In the fields of industrial waste
and telecommunications.
recycling and new energy development, the division will
Business Topics
Business Topics
Large export order for construction
machinery from Myanmar
Marubeni received an order worth ¥2 billion
from the Irrigation Department, Ministry of
Agriculture and Irrigation, the Union of Myanmar, for
133 units of equipment, consisting of trucks and
construction machinery. This equipment will be
used mainly for construction of a dam that will
supply water for irrigating farmland. Komatsu, Ltd.
and other Japanese manufacturers will be the
suppliers, with delivery starting in spring 2003.
Komatsu construction equipment
Sales of regional passenger jets
(170 and 190 Series)
Soda recovery boiler and power plant
for Hokuetsu Paper Mills, Ltd.
Marubeni became a sales agent in Japan for 170
and 190 series regional passenger jets made by
Empresa Brasileira de Aeronautica S.A. (Embraer).
The 170 series jet seats 70 - 86 passengers, while
the 190 series seats 96 - 116 passengers. To
date, approximately 350 of the jets have been
ordered worldwide, and Marubeni is now
marketing these jets in Japan.
Marubeni received an order for a soda recovery
boiler that burns biomass black liquor fuel,
a by-product produced in the chemical pulping
process, and an 85-megawatt steam turbine
power generator from Hokuetsu Paper Mills, Ltd.
for its Niigata Mill. The main equipment will be
manufactured by Kawasaki Heavy Industries, Ltd.,
and should be completed in October 2004. The
equipment will have the largest capacity of its
kind in Japan, burning 2,900 metric tons of black
liquor per day.
Regional passenger jet manufactured by Embraer
of Brazil
Graphic of a soda recovery boiler and
85-megawatt steam turbine generator
Marubeni Corporation 2003
29
Utility & Infrastructure Division
Strategy by Business Segment
Utility &
Infrastructure
Overseas Power Project Unit-I
Overseas Power Project Unit-II
Domestic Power Project Unit
New Energy Business Unit
Environment Infrastructure Unit
Overseas Asset Management Unit
Railway & Transport Project Unit
Division
Message from the COO
with a solid track record and a strong position within the
The Utility & Infrastructure Division aims to expand its presence
industry. To date, the division has completed EPC projects with
in the transportation and environment sectors, as well as in the
an aggregate capacity of 65,500 megawatts, and has secured
power business, including the overseas independent power
power generation assets with a gross capacity of 5,000 mega-
producer (IPP) business, one of the key areas for the entire
watts. In the fiscal year ending March 31, 2004, the division will
company as outlined in the “V” PLAN. Based on these ambi-
set up a holding company to manage its power generation
tions, the division seeks to establish itself in a leading position in
assets. The logic behind this move is that it enables the division
the comprehensive infrastructure business in Japan and abroad.
to optimally manage assets and maximize profits.
The main themes in the pursuit of this target are the diversified
Railway & transport projects focus on exportation of
and efficient procurement of funds necessary for the overseas
equipment and offshore trade of transportation-related EPC
IPP business and growing earnings therefrom. In addition, the
projects and infrastructure schemes, such as for railways,
division will deploy corporate resources in markets where it
airports, ports and harbors, bridges, and roads.
excels in overseas engineering-procurement-construction (EPC)
The division is traditionally strong in large, full turnkey deals
projects and the transportation sector. It is also essential that the
as a prime contractor. The division pursues not only publicly
division responds quickly and adequately to business opportuni-
funded projects but also privately funded complex projects
ties presented by the deregulation of and changes to laws
with maintenance and operation components by offering a
pertaining to retail sales of electric power, and the new energy and
competitive contract scheme to its clients.
environment fields in Japan.
The division is working more closely with partners in Japan
and abroad that offer technological clout and superb cost-
Division Strategies and Strengths
competitiveness to conclude contracts and propose systems
The division’s core operational area covers the overseas power
and businesses that best match client requirements.
business (IPP and EPC), followed by transportation projects.
2002 took advantage of industry deregulation to utilize the
operations and enhance profit growth in the same areas.
Mibugawa hydro power station owned and operated by
In the near future, the division will position the domestic
Marubeni to retail electricity under the service area of Chubu
electric power business and environmental infrastructure
Electric Power Co., Inc. The division also began similar operations
projects as core businesses with significant growth potential. In
in April 2003 under the service area of Tokyo Electric Power Co.,
the fiscal year ended March 31, 2003, overseas power opera-
Inc., utilizing surplus power from other industries.
tions and transportation projects accounted for nearly all of
In 2004, deregulation will be extended to users demanding
divisional net income. In the future, however, the division will
high-voltage power, fostering further growth in the retail power
focus on generating higher profits from domestic power
business. Moreover, the division is pushing ahead with sales of
operations and environmental infrastructure projects as well.
wind power and fuel cells, reflecting renewable portfolio
Overseas power operations take place under a business
30
In domestic power business concerns, the division in July
The division is aiming to further broaden the scale of such
standards (RPS). In March 2003, the division started operating a
model attuned to shifting trends in the electric power industry,
wind power plant in Nejime, Kagoshima Prefecture, bringing its
based on expertise and know-how accumulated in the EPC
total capacity from wind power to 32 megawatts. Meanwhile,
arena over many years. These efforts have provided the division
sales of molten carbonate fuel cells produced by U.S.-based
Marubeni Corporation 2003
Segment Assets
Segment Net Income
( At March 31)
( Years ended March 31)
19
8,6
21
23
2,8
4)
1,9
60
4,5
08
0
’01
50
0
2,
00
0
00
00
0
,5
)
(5
00
)
ns
illio
(M
n)
Ye
of
ns
illio
(M
n)
Ye
of
,0
00
0
00
00
(2
,0
,0
’02
’03
0
0
0,
0
10
50
’03
52
00
0,
0,
15
’02
(3,
5,
97
20
’01
2,1
25
23
07
Mamoru Sekiyama
Corporate Vice President, COO
FuelCell Energy, Inc. are getting on track, with operation of the
Jenets Co., Ltd. as cooperative ventures with France-based
first domestic unit beginning in April 2003.
Veolia Group for the operation and maintenance of local
In the area of environmental infrastructure, the develop-
government water treatment and waste management facilities.
ment of potable water, wastewater treatment, and waste
Overseas, the division is involved in an 18-year build-operate-
management projects has assumed a more prominent position
transfer (BOT) water treatment plant project with Veolia Water
in business activities. This shift comes amid growing global
S.A. in Chengdu, China, while in Mexico, a wastewater
concern for the natural environmental, as well as ongoing
recycling business is being run with Ondeo-Degremont S.A., a
deregulation, allowing the private sector to take a more active
French company. Going forward, the division plans to actively
role in public works projects. Actions on the domestic front will
participate in a broader range of environmental projects along
include the establishment of Nippon Utilities Management and
these lines.
Business Topics
Business Topics
Bang Bo combined cycle power plant in
Thailand
The Bang Bo combined cycle power plant is a 350
megawatt dual-fired (natural gas and oil) power plant
located in the Samut Prakarn Province of Thailand.
Eastern Power and Electric Company Limited is the
plant owner, with a 28% stake by Marubeni. The
plant began operations in March 2003, and will
supply power to the Electricity and Generating
Authority of Thailand under a long-term contract of
20 years.
Renovation project for the Astana
Airport in Kazakhstan
Marubeni has formed an international consortium to
extend the runway and expand and renovate the
aprons and taxiways of Astana International Airport in
Kazakhstan. The Marubeni-led consortium will also
construct a new passenger terminal, new cargo
terminal, and a new flight-control tower, as well as the
flight-safety facilities. The renovation work is scheduled
for completion in 2005 and is aimed at meeting the
expected rise in
demand for
international air
transportation in
Kazakhstan and
ensuring air traffic
Designer’s rendition of the
safety.
Astana Airport in Kazakhstan
neighboring town of Sata is underway.
After completion of phase II in the first half of 2004,
these wind farms will have a combined capacity of 26
megawatts, and constitute the largest class wind
power station in western Japan.
Shuweihat Water Transmission
scheme in UAE
In July 2002, Marubeni received an order worth
approximately ¥100 billion for the Shuweihat Water
Transmission scheme from the Abu Dhabi Water &
Electricity Authority of the United Arab Emirates.
The project involves the construction of 480 kilometers
of water pipeline to transmit 450,000 metric tons/day of
desalinated water produced at the Shuweihat
Desalination Plant, located 250 kilometers west of Abu
Dhabi, to the suburbs of the city. The project also
entails the construction of two pumping stations. The
contractual completion of the project is November 2004.
Operation of Minami Osumi Wind Farms
in Japan
A wind power station located in the town of Nejime,
Kagoshima Prefecture, began commercial operation
on March 1, 2003. As phase I of the ongoing project,
the facility has total
power capacity of
13 megawatts.
Phase II construction of a station
with the same
capacity near the
Bang Bo combined cycle power plant in Thailand
A wind power station located in the
town of Nejime, Kagoshima Prefecture
Laying of water pipelines during construction of the Shuweihat
Water Transmission scheme in the UAE
Marubeni Corporation 2003
31
Plant & Ship Division
Strategy by Business Segment
Plant & Ship
Industrial Plant Unit
Energy & Chemical Project Unit
Ship Unit
Asset Management Unit
Musi Pulp Project Unit
CAPC Project Unit
Tekmatex Business Unit
Protechs Business Unit
Division
Message from the COO
Division Strategies and Strengths
The important role of the division is the comprehensive
This division has a total of eight units, comprising five
coordination of oil and gas-related projects and industrial
business units and three other units specializing in the
plants mainly for overseas markets, covering every phase
management of assets and the execution of important projects.
from feasibility studies to completion and operation of
In the plant business, the division has shifted from a
projects. The division is also involved in the trading,
finance-dependent business to EPC businesses by increas-
operating and chartering of vessels. The division has
ing the proportion of projects that use export credit agency
combined its experiences and know-how cultivated over the
frameworks. The division’s new business model extensively
years in these fields, as well as its diverse functions of
incorporates elements of risk management.
financial arrangement and execution of Engineering
In industrial plants, these changes resulted in receiving
Procurement and Construction (EPC) contracts, with
of orders, mainly in steel and cement fields, from countries
Marubeni’s global business network. This has enabled the
in which the division is traditionally successful, namely
division to provide solution services tailored to the chang-
Brazil, China, and Turkey.
ing business environment and evolving customer needs.
The division, by deepening its experience, knowledge
In energy and chemical projects, the division achieved
notable success, particularly in oil and gas-related projects,
and capabilities, is staunchly committed to leveraging the
in oil and gas-producing regions such as Africa, the CIS, the
comprehensive functions of a trading company to provide
Middle East, South America and China. The ship business
optimal solutions to customers; and we believe it is our
aggressively pursued trading of various types of new and
solid intention to contribute to the economic development
secondhand vessels and chartering, receiving orders for
of the countries where our operations are exposed.
transactions involving over 30 new vessels as a result.
Through these efforts, the division concluded contracts
totaling ¥1.1 trillion in the fiscal year ended March 31, 2003,
a record high. As for the Chandra Asri project in Indonesia,
a financial restructuring has taken effect in August 2002
after extended negotiations.
32
Marubeni Corporation 2003
Segment Assets
Segment Net Income
( At March 31)
( Years ended March 31)
57
3,6
58
(14
7
,0
00
(30
)
10
0
’01
2
,20
0
00
0
,0
)
0,
00
0)
00
0)
ns
illio
(M
n)
Ye
of
0,
ns
illio
(M
n)
Ye
of
00
(4
,0
0
0
0,
0)
(3
0
00
00
00
0,
’03
00
’02
(2
0
0,
00
( 10
00
0,
30
20
0
10
’03
7
1,2
0,
44
0,
2,2
50
39
’02
2)
87
40
’01
2,2
60
40
,00
Tsuyoshi Endo
Corporate Vice President, COO
The division’s core strength is its mutual relationship of
resources in markets and business sectors where the
trust with customers and leading contractors in Japan and
division has a long record of accomplishments, to promote
overseas, backed by an extensive track record in the plant
projects by identifying latent customer needs, (2) integrat-
and ship businesses. The division’s capabilities encompass
ing and maximizing the value of diverse trading house
sophisticated know-how and expertise in finance, and skill
functions in order to meet customer needs more flexibly,
in minimizing risk in the execution of projects, which have
and (3) enhancing the economic returns from existing
been derived from its experience in handling numerous
invested projects.
orders and contracts in these areas. Going forward, the
division plans to further broaden, strengthen and improve
its capabilities, with the aim of: (1) concentrating corporate
Business Topics
Crude oil shuttle tanker business
In August 2002, Marubeni concluded a contract
with Transpetro S.A. (Rio de Janeiro) to charter
two shuttle tankers for the transportation of crude
oil. Transpetro is a 100% subsidiary of Petrobras,
the national oil company of Brazil. The chartered
vessels (Suezmax, 153,000dwt*) are owned by a
lease SPC established by Marubeni. This marks
the first time that Transpetro has procured tankers
from outside the Petrobras Group.
Companhia Siderurgica De Tubarao
(Brazil) places order for 75-megawatt
thermal power station and LD gas
recovery system
Marubeni received full turnkey construction
orders from Companhia Siderurgica De Tubarao,
Brazil’s largest steelmaker (located in the State
of Espirito Santo) for a 75-megawatt thermal
power station (boiler/turbine generator) and an
LD gas recovery system to fuel the new power
station. Plant will be handled jointly by Mitsubishi
Heavy Industries, Ltd., and Kawasaki Heavy
Industries, Ltd. The new facilities will enable
Companhia Siderurgica De Tubarao to meet
100% of its power needs internally.
Construction of container ship for
Evergreen Group of Taiwan completed
Construction of a 6,400 TEU** container ship for
the Evergreen Group of Taiwan was completed in
January 2003 at the Kobe Shipyard and Marine
Works of Mitsubishi Heavy Industries, Ltd.
Delivery of the vessel to the Evergreen Group by
Marubeni and Mitsubishi Heavy marks the 38th
ship Marubeni has delivered this year. By
augmenting its fleet, the Evergreen Group has
improved customer service by achieving greater
logistics speed and efficiency. Moreover, it has
further cemented its position among the leaders
in the container transport industry.
**TEU: Twenty-foot Equivalent Unit
*dwt: deadweight tonnage
Crude oil shuttle tanker
Tubarao Steelworks
Container ship of the Evergreen Group
Marubeni Corporation 2003
33
Development &
Construction Division
Strategy by Business Segment
Tokyo Housing Development Unit-I
Tokyo Housing Development Unit-II
Construction Business Unit
Urban Development Unit
Real Estate Business Unit-I
Real Estate Business Unit-II
Osaka Housing Development Unit
Housing Supporting Business Unit
Overseas Housing Development Unit
Estate Management Unit
Development &
Construction
Division
Message from the COO
operating companies in the housing business. Meanwhile,
The Development & Construction Division operates within a
four units operate and manage the division’s 30-plus
project solution service business model. The condominium
companies, working together to promote restructuring
business is the division’s core source of earnings. To date, the
within the division. These units strive to strengthen the
division has supplied some 60,000 family-oriented condo-
division as a whole by pursuing greater selectivity and
miniums nationwide, consisting mainly of those in its Famille
focus in its business portfolio.
series. The division aims to further expand earnings by
The condominium business will remain the main
focusing on urban condominiums that cater to a broad range
earnings pillar. The condominium sales ratio has been
of homebuyers. In operating areas outside of housing, the
decreasing because of the deflationary trend of recent years.
division will expand its commercial property sublease
Still, medium- and long-term demand for urban condomini-
business and its real estate fund business, thereby enhancing
ums should remain strong. Accordingly, the condominium
and cultivating new earnings sources. These activities
business, centered on urban areas, will remain a profit base
revolve around maximization of profit after tax less risk asset
going forward.
cost (PATRAC), Marubeni’s chief administrative index.
From April 2003, the division established within the
head office a new housing technology and service depart-
Division Strategies and Strengths
ment to field inquiries and complaints from people who
From April 2003, the division was reorganized into 10
have purchased a condominium. Consistent with the
business units, six of which are targeted for future growth
company’s increased emphasis on compliance, the depart-
and expansion. Three of these units collectively promote the
ment operates based on the policy of maintaining a direct
development of condominiums in Japan. There is also a
channel of communication with customers and implement-
newly established Urban Development Unit specializing in
ing swift and detailed solutions.
areas outside of domestic housing. The Overseas Housing
The division also operates a business involved in the
Development Unit is in charge of the division’s housing and
lease of residential properties to expatriates living in China
condominium business in the rapidly growing Shanghai
for over a decade. Recently, the division’s housing and
market. Finally, the Housing Support Business Unit com-
condominium project in Shanghai, which has been at the
prises Marubeni Real Estate Sales Co., Ltd. (sales) and
center of the rapid growth in China’s economy, has been
Benny Estate Service Co., Ltd. (property management), key
performing well. Consequently, the division is considering
the establishment of a new condominium project there.
Moreover, the division plans to establish the domestic
non-housing field, including leasing, subleasing, and real
estate funds, as a stable operating base and a second
earnings pillar during the term of the “V” PLAN. The
34
Marubeni Corporation 2003
Segment Assets
Segment Net Income
( At March 31)
( Years ended March 31)
42
8,4
0,
2)
0,
)
(1
0
00
5,
0
0)
(1
00
00
00
0)
ns
illio
(M
n)
Ye
of
5,
0)
(2
ns
illio
(M
n)
Ye
of
00
0
,0
0,
0
0)
(2
00
00
0,
’03
00
,36
,0
0
(23
’02
5)
(5
00
’01
1)
0
(20
00
0,
20
0
10
’03
0,
30
’02
38
84
63
40
6,9
37
’01
(5,
4
50
39
0
6,3
Norihiro Shimizu
Corporate Vice President, COO
division had operated this business in parallel with the
potential, including Tipness Co., Ltd., a fitness club chain
marketing department of the condominium business, but
that is operated as a joint venture with Suntory Ltd., and
from April 2003, it set up the new Urban Development Unit
Tsunagu Network Communications, Inc., which promotes
to specialize in the non-housing field. Specifically, the goal
greater use of IT technology in condominiums and is
is to bolster fee-based businesses through steps such as
operated in partnership with Mitsubishi Estate Co., Ltd.
roughly doubling the amount of assets under management
and Tokyo Tatemono Co., Ltd. Both Tsunagu Network
in the division’s real estate funds.
Communications and Tipness are expected to demonstrate
The Urban Development Unit comprises a group of
rapid growth going forward.
diverse operating companies with significant growth
Business Topics
Famille Nihonbashi BLEU CLAIR
Famille Nihonbashi BLEU CLAIR (Chuo-ku, Tokyo)
is a 13-story, 90-unit condominium complex that
offers a variety of floor plans, from one-room
efficiencies to four-bedroom units. Nihonbashi
Famille Nihonbashi BLEU CLAIR
BLEU CLAIR marks the fourth complex in the
Nihonbashi series supplied since September
1998. The latest complex is located in Tokyo’s
Nihonbashi district, an area close to Ohtemachi—
the heart of the city’s business district—and
Tokyo Station. Designed (both interior and
exterior) by a French designer who has handled
projects around the world, the Famille Nihonbashi
BLEU CLAIR offers hotel-like common spaces
and a host of detailed amenities.
Housing project in Shanghai
Marubeni has sold all of the units in its 928-unit
Sakura Garden project in Shanghai, China. The
company commenced sales of 454 units for the
first phase of a low-rise condominium project,
called Phoenix City (which will eventually have
1,600 units), in August 2002 and quickly sold all of
them. To meet surging demand for housing in
Shanghai, Marubeni plans to market more units in
stages, having begun sales of around 400 units in
the second round of phase I in spring 2003 and
starting sales of roughly 300
units in the first round of
phase II in autumn 2003.
In addition, a new project is in
the planning stages.
Marubeni’s real estate
management affiliate in
Shanghai will manage the
units. Thus, Marubeni is
contributing to the improvement of the housing
environment for the residents
of Shanghai in two
respects—development and
property management.
View of Sakura Garden in Shanghai, China
Marubeni Corporation 2003
35
Finance & Logistics
Business Division
Strategy by Business Segment
Finance Business Unit
Insurance Business Unit
Treasury & Trading Unit
Logistics Business Unit
Finance &
Logistics Business
Division
Message from the COO
Division Strategies and Strengths
This division provides services in finance, insurance,
The division is made up of four units: Finance Business,
foreign currency trading and logistics, with a level of
Insurance Business, Treasury & Trading and Logistics
expertise made possible through years of practical experi-
Business. By maximizing synergies between these units and
ence in each of these four fields. These services are a
the other operating divisions, we bring to the fore the full
defining aspect of Marubeni as a general trading house and
value and strengths of Marubeni.
constitute a core competence. We aim to offer high value-
In the field of finance, we offer services that combine
added services by developing and refining these critical
the collective strengths of the company with sophisticated
skills, taking them beyond the traditional realm of services
financial schemes. When setting up, managing and selling
offered in support of the trading activities of operating
management buy-in, venture capital, and real estate funds,
divisions. Indeed, we are wedding financial, logistics and
we are able to draw on an extensive network of partner
information technologies to create new business models
companies and our expertise in incubating businesses. And
and, in the process, new ways to generate earnings.
by capitalizing on in-depth knowledge and experience in
portfolio management, we can develop and manage new
types of investment products.
In the insurance field, we act as an agent and as a
broker. Our services extend beyond life and non-life
insurance policies for individual and corporate clients to
include trade credit insurance, which is in increasing
demand in Japan. Furthermore, we are broadening our
horizons by exploring the feasibility of entering new
markets that do not fall within the domains of the life or
non-life insurance sectors. Notable examples are nursing
care and disability income insurance, two so-called “thirdsector” insurance products. Moreover, weather derivatives,
corporate pension funds and other areas on the fringe of the
insurance industry also harbor potential as future businesses for the division.
In foreign currency trading, a traditional area of
expertise for Marubeni as a trading house, we offer services
of the highest quality to customers via other operating
divisions. By extending these services while enhancing risk
36
Marubeni Corporation 2003
Segment Assets
Segment Net Income
( At March 31)
( Years ended March 31)
34
0,3
54
0
0
00
0
7
44
2,
00
0
0
0
00
0
,0
00
0
1,
00
0
10
’02
’03
00
0
3,
00
0,
04
00
0,
30
9,5
0,
16
20
’02
’03
44
4,
40
3,3
ns
illio
(M
n)
Ye
of
ns
illio
(M
n)
Ye
of
Hitoshi Sakamoto
Corporate Vice President, COO
management skills, we are attempting to generate higher
solutions that address client needs in Japan and overseas.
earnings in this field. In addition to foreign currency
Overseas, we operate a container terminal business that has
trading, the division is actively structuring and selling
no peer in the trading house sector.
Regarding new investments, we are channeling re-
hedge funds that use our operational knowledge of financial markets, including money and equity markets.
The fourth business domain of the division, logistics
sources into business domains that offer the best opportunities to capitalize on our strengths and the most attractive
services, is a mainstay business in which we are very much
risk-return profiles. With existing projects, the division looks
at home as a trading company. Sophisticated international
to strengthen its balance sheet by realigning its asset
logistics services have been a prime focus of this division,
portfolio. This includes seeking capital gains from asset
but we have been expanding our capabilities here, too. With
sales. To optimize resource allocation and earnings, the
the ability to offer supply chain management (SCM), third-
division will take on the challenge of building dynamic, new
party logistics and other solutions in conjunction with
business models by leveraging its creativity and agility to
logistics
services,Topics
we are a one-stop source of logistics
Business
seize opportunities.
Business Topics
Expanding logistics operations
Eastern Sea Laem Chabang Terminal Co., Ltd.
runs a container terminal business at Thailand’s
Laem Chabang port. In calendar 2002, this
company handled approximately 520,000 TEUs
(20-foot-equivalent units). It consistently ranks as
one of the leading players in terms of containers
handled at the port, contributing to the development of Thai industry and its economy. This
company’s pedigree is underscored by a top
ranking in service quality at the Asian Freight
Industry Awards.
Corporate acquisition funds
In the 1990s, Marubeni made forward-looking
investments in corporate management buy-in and
buy-out funds. Today, it has an impressive track
record in Japan and is reaping the benefits of
those investments. Building on these successes,
the division is stepping up efforts to expand
profits by beginning to invest in funds created to
rehabilitate struggling companies.
Eastern Sea Laem Chabang Terminal
Marubeni Corporation 2003
37
Telecom & Information Division
Strategy by Business Segment
Telecom &
Vectant Unit
Nexion Unit
Solution Service Unit
Project Management Unit
Enterprise Sales Unit
Overseas Telecom & Information Unit
Information
Division
Message from the COO
Division Strategies and Strengths
The Telecom & Information Division has been implement-
In the fiscal year ended March 31, 2003, the division
ing the following strategies since the fiscal year under
concentrated its corporate resources in the following three
review. First, the division is constructing business bases and
fields: (1) product distribution, including PCs and mobile
carrying out powerful sales activities in the field of solution
phones; (2) solutions and services for IT network systems;
services, including system integration for enterprises in
and (3) infrastructure utilization, including optical fiber
Japan and overseas. Second, it is effectively utilizing the
telecommunication lines. The division did not meet its goal
prominent telecommunication infrastructure owned by the
of higher sales for the Vectant Group, which utilizes its own
Marubeni Group. The division continues to seek profit
telecommunication infrastructure to offer services, because
growth revolving around the video transmission services
of slumping IT investments by enterprises in Japan and
offered by Nexion Corporation and a broad range of
abroad and lower sales of PCs and other IT equipment,
telecommunication services using the optical fiber network
owing to the worsening economic environment. On the
of Global Access Ltd. (GAL) in Japan. The division is also
other hand, the mobile phone business was steady and
pushing ahead with efforts to create a strong business
overseas telecommunication contracts were firm, under-
presence based on the policies of creating new ventures and
pinned by healthy orders from Costa Rica and Algeria.
cultivating future earnings sources.
In April 2003, the division made a fresh start as a unit
that pursues a business incubation-oriented business model,
with a focus on the aforementioned solutions and services
and the infrastructure related business. IT investments by
Japanese enterprises totaled ¥25 trillion in 2002, and it is
expected to reach ¥30 trillion in 2006 despite slower growth
as a result of the economic downturn. Even under these
circumstances, the division should experience greater
domestic demand for system integration and IT solutions,
as it is in the business of helping enterprises improve
operating efficiency and reduce costs. In this field, the
division provides solutions to enterprises, academic/
research institutions, and government agencies. These
solutions combine products and services offered by Group
companies, including Marubeni Solutions Corporation and
Marubeni Information Systems Co., Ltd., as well as those of
business partners like Hitachi Ltd. and Hewlett-Packard
38
Marubeni Corporation 2003
Segment Assets
Segment Net Income
( At March 31)
( Years ended March 31)
30
,64
7)
0,
0
0)
(3
00
0)
ns
illio
(M
n)
Ye
of
ns
illio
(M
n)
Ye
of
0,
0)
(4
00
0
00
,0
0,
0
0)
00
’03
00
0,
0,
0
(2
00
00
20
0
10
’03
(35
’02
(1
’01
00
03
0)
0
0,
5,1
6)
99
(7,
0,
24
’02
65
30
’01
3,3
52
(3,
2
40
26
8
3,3
Shuichi Morizane
Corporate Vice President, COO
Japan Ltd., thereby providing the division with even greater
Moreover, Nexion started full-scale video transmission services in
capabilities in new product/service development and sales.
April 2002, and order flow has been steady. In addition to further
In addition to using its bases in Tokyo, Osaka, Nagoya, and
strengthening its operations, Nexion plans to enter the digital
Fukuoka to deliver solutions throughout Japan, the division
terrestrial broadcasting business in December 2003 with test
offers the same services to Japanese companies overseas.
broadcasts in several regions across Japan, with the goal of
In the telecommunication infrastructure field, the
being a pioneer in this field.
division sells access to the Vectant Group’s independently
By entering and expanding its presence in these new
constructed optical fiber network linking Tokyo, Nagoya, Osaka,
businesses, the division aims to bolster its earnings and
and Fukuoka. The division aims to build a strong business by
emerge as a strong player in the IT industry.
approaching users that require high-speed, broadband lines.
Business Topics
services using its data-center buildings (Com
Space) in Tokyo’s Nihonbashi and East Shinjuku
areas. The company uses its own network, built
to meet the individual needs of constituent users,
to offer a business platform for the new age of
broadband communications to telecom carriers,
Internet service providers, government agencies,
and large enterprises.
Global Access Ltd.
GAL is a Type I communication carrier that offers
high-speed, broadband telecommunication
services over its own optical fiber network within
Japan. In addition to Wave Length, SDH/SONET,
and Ethernet dedicated line services and dark
fiber services, GAL offers housing and co-location
Nexion Corporation
Nexion is a broadband company that provides
video transmission services from various locations
abroad via its own global optical fiber network
dedicated to transmitting high-quality, largecapacity video content. Nexion uses cutting-edge
video content transmission facilities and achieves
interconnection with satellite earth stations in
every country in the world to offer a broad lineup
of services tailored to customer needs, whether
for high-definition television (HDTV) or for
standard-definition television sets. By delivering a
variety of advanced-quality video image services,
mainly news and sports, to media markets around
the world, Nexion contributes to the advancement of next-generation digital broadcasting.
GAL Network
TOKYO
KJCN
NAGOYA
JUSCN
FUKUOKA
OSAKA
OSAKA
CITY RING
NAGOYA
CITY RING
TOKYO
CITY RING
APCN- 2
PC-1
EAC
JUSCN
APCN- 2
EAC
PC-1
JUSCN
Nexion provides video transmission services
Marubeni Corporation 2003
39
Strategy by Business Segment
Business Incubation
Strategies and Business Model
for Business Incubation
Department
•Investment
•Management assistance
•Overseas expansion, etc.
Venture
Marubeni
Growth
Business Outline
Marubeni established the Business Incubation Department
in April 2001 to create new businesses beyond the traditional
Profitable
Company
•Earn intellectual property
•Sole sales agency
•Capital gains
divisional framework. The department is developing
innovative business models that will become a part of
Marubeni’s core business in three to five years. The department is putting focus on newly advanced technologies such
as biotechnology and nanotechnology, as well as on new
•Develop intellectual property business, in addition to the product itself.
•Hands-on-support:
•Raise the value of the invested company by assisting its management.
•Invest in early-stage ventures as well as mid- to late-stage businesses.
markets and expanding industries such as healthcare.
Strategies
1. Access and assess deal-flows through invested funds:
Achievements
Discover and invest in promising new business seeds by
Incubation Department invested in five projects. Having
establishing a strategic alliance with Japanese, U.S. and
made investments in nine projects in the previous fiscal year,
European biotechnology, nanotechnology and healthcare funds.
the department’s investments in this two-year span total
The deal-flows are evaluated by the department’s own criteria
about ¥2.4 billion. As the first phase of the department’s
and through technical screening from retained consultants.
business, two trading projects were also launched in the
2. Provide solutions:
fiscal year ended March 31, 2003. In all cases, the growth
Invest in and provide all necessary solutions to promising
potential and originality of the patents and know-how that
venture companies to increase their value. Examples of
the partners possessed were thoroughly assessed for creation
assistance include establishing the company, organizing
of the most suitable business model.
In the fiscal year ended March 31, 2003, the Business
management, promoting sales and entering overseas/
Japanese markets.
3. Expected returns:
Obtain patent usage and exclusive sales rights as returns by
companies and has been incubating new businesses.
providing these solutions. Expect capital gains from initial
Investment targets are mainly in the fields of drug candidate
public offerings or dividends and at the same time generate
substances and related screening tools, and applied
revenues and earnings from regular trading operations.
technology in the medical field, namely biomedicine, an area
The department also aims to commercialize not only the
products but also the intellectual property by leveraging the
40
Biotechnology
• In this field, the department has found promising venture
which includes immunology and regenerative medicine.
• In order to efficiently identify significant investment targets
accumulated expertise of a trading house. The department
and create business opportunities in Japan, the department
will utilize Marubeni’s global network and maintain close
has invested in biotechnology-related venture funds in
ties with other divisions to carry out these plans.
Europe and the United States. Additionally, in December
Marubeni Corporation 2003
2002, Marubeni and Marubeni America Corporation
Marubeni is the largest investor from the private sector in
invested $1.5 million in the Caduceus Private Fund-II, a
this fund. The department has also invested in the
U.S.-based bio-venture fund. At the same time, the depart-
company that manages the fund. By doing so, the depart-
ment created a unique system that encompasses all phases
ment is able to maintain close ties with the fund, and
of the incubation process, from discovering promising
acquire access to emerging projects as well as to profes-
opportunities to creating and fostering businesses.
sional technological assessments of nanotechnology.
The department accomplished this by forming strategic
ogy and its marketability in two stages, support licensing/
Healthcare
• The department will introduce advanced technologies from
in-licensing, provide information services via the Internet,
Europe and the United States in medical treatment, nursing
formulate new business models and create added value.
care service, health improvement, and other growing fields
partnerships with consultants to screen and assess technol-
• The department has newly invested directly in two
Japanese venture companies. One is Osteogenesis Inc.,
which is developing technology to regenerate alveolar
by establishing strategic alliances with companies in different
fields to construct new business models in these areas.
• In fiscal 2001, the department invested in Coty Co., Ltd.,
bone and other bones. The other is the Institute of Gene
which primarily manages childcare centers in Sapporo, in
and Brain Science, which develops treatments for spinal
order to enter the childcare market. In addition,
cord injuries. The department will assist both companies
the department partnered with Nagase & Co., Ltd.,
by introducing their technology to potential business
Iwatani International Corporation, and Nichido Fire &
partners and supporting their forays into U.S. markets.
Marine Insurance Co., Ltd. to enter the home oxygen
• The department has formed an alliance with Columbia
therapy business, and is aiming to establish a joint venture
University to provide funds for research to identify and
in this area. Moreover, the department will utilize
validate novel anti-neurodegenerative drugs, including
infrastructure, such as the network of medical institutions
drugs for the treatment of Alzheimer’s disease.
and patients created by this partnership, to lay the
The department is considering the creation of a university
foundation for new businesses and the introduction of
technology fund centered on technologies and ventures
innovative home medical treatment products, such as
originating from Columbia University and other
ultra-lightweight portable oxygen units.
universities in the United States and Europe.
New Technologies
• The targets in this area are critical technologies capable of
transforming existing business sectors and industry
structures, particularly in the medical, telecommunications,
and environmental service fields.
• In the fiscal year ended March 31, 2002, the department
established a joint venture company with Given Imaging,
Ltd., a NASDAQ-listed manufacturer of capsule endoscopes.
Clinical trials for approval are proceeding smoothly.
• The department delivered electrolyzed water and water
purification systems to Yamashita Corporation, a leading
Nanotechnology
• In nanotechnology, which encompasses a broad spectrum
company in the rental nursing care products business,
in a move that has received an
of potential applications, the department has identified
overwhelming response from
nanomaterials and nanoelectronics as its strategic fields,
the industry. The department is
and is making progress in finding such technologies and
also working to create other
venture companies.
electrolyzed water-related
• In order to swiftly identify promising businesses,
Marubeni has invested ¥300 million in the Critical Tech-
businesses, including healthcare
products and soil remediation.
nology Fund, which is Japan’s first nanotechnology fund.
Marubeni Corporation 2003
41
Risk Management
“V” PLAN, the current medium-term management plan,
Group assets, which is the principal reason for adopting
strongly emphasizes the notion that better risk management
more sophisticated risk management methods. The stated
is a key objective for the Marubeni Group, since it paves the
goal of the “V” PLAN is to reduce total consolidated risk
way to the generation of increased corporate value through
assets to ¥580 billion or less by the end of March 2006. In
the development of an asset base of higher quality.
this context, risk assets can be thought of as the total
Marubeni has traditionally approached risk manage-
amount of equity capital that needs to be set aside as a
ment on a project-by-project basis, with the result that the
provision for potential losses on all Marubeni Group assets.
risk-return performance of the company was related to an
The goal is to increase shareholders’ equity by the end of
aggregate of many individual management decisions. This
the period covered by the “V” PLAN (March 2006) to a level
approach had the disadvantage that it did not provide
close to the value of total risk assets.
adequate control over risk diversification, one of the basic
Besides being designated as one of the key business
tenets of risk management. This in turn resulted in overexpo-
performance indices, risk assets also form the basis for the
sure to certain areas, occasionally leading to large and
calculation of PATRAC (Profits After Tax less Risk Assets
unexpected losses. To avoid any recurrence of such problems,
Cost)*, an important internal financial indicator that was
Marubeni is now shifting to a portfolio-based integrated risk
developed by Marubeni to aid in the evaluation of the
management system that measures the overall risk associated
performance of portfolio units and consolidated subsidiaries.
with total Group assets. This helps to ensure that there is no
To raise PATRAC, each portfolio unit or consolidated
excessive concentration of risk associated with any particular
subsidiary must reduce its existing risk assets, minimize
country, industry or customer.
them through new business development, or boost returns.
Integrated Risk Management and
Measurement of Risk
Future Challenges
The portfolio management approach depends on producing
Marubeni head office, principally in the Risk Management
quantitative measurements of the risk associated with total
Department and the Corporate Planning & Coordination
business assets. This is done by first categorizing all Marubeni
Department. These groups analyze and compile data on risk
Group assets in terms of country, industry, customer credit
assets and perform the PATRAC calculations, which are
rating, and account type. Numerical methods are then applied
then reported to management.
to derive a common measure of risk to all assets irrespective of
Integrated risk management is carried out mainly by staff at
Looking to the future, Marubeni believes that maximizing
category, which is known as Value at Risk (VaR). This quanti-
the results of risk management practices and generating growth
fies the risk by determining the maximum potential loss in
in consolidated corporate value depend critically on developing
asset value, taking into account the possible effects of risk
an effective combination of the portfolio management and
diversification and correlational factors. Marubeni has also
traditional risk-aggregation approaches to ensure that Marubeni
developed its own computational analysis systems that use
Group assets are managed in the most appropriate and timely
computer simulations to make precise and detailed risk
manner. By means of individual project risk analysis and proper
quantifications. This method allows multiple risk factors to be
actions for asset preservation and risk-avoidance, strong
integrated to give a single monetary value for risk – hence the
individual assets can be developed. The key mission for
name, integrated risk management.
management is to keep a close eye on the risk-return profiles of
Risk Assets
The “V” PLAN uses the amount of “risk assets” determined
by integrated risk management calculations as a key
component of performance and management indices. The
core aim of the plan is to improve the quality of Marubeni
all assets so that risk is equally and healthily diversified across
the entire business portfolio. To use a forestry analogy, the idea
is to help each individual tree grow properly while also
watching the whole forest to stop trees from growing too close
to each other or from becoming diseased.
* PATRAC = Net income – (Risk assets x 8%)
The performance benchmark is a positive PATRAC value.
42
Marubeni Corporation 2003
Compliance
Companies self-evidently need to pursue profits to promote
The base of the Japanese edition of the manual provides
their continued existence in the interests of consumers,
compliance training tips aimed at all Marubeni employees in
suppliers, shareholders, employees and other stakeholders.
Japan. At Marubeni Group firms, the company is constructing
Yet, if such pursuits do not result in sound business
compliance systems that are tailored to the different products
practices, no value is ultimately added. More than ever
and trading arrangements unique to each operation. It is our
before, companies today must establish compliance struc-
desire to shape Marubeni into a “credibility-oriented, reliable
tures to ensure that corporate behavior is ethical and
business group.”
complies with relevant laws and regulations.
Marubeni has worked to establish effective internal
Separately, Marubeni has established a compliance
access point dubbed the “Door of Courage.” This advisory
control systems and structures to promote regulatory
channel provides any director or employee within the
compliance and corporate ethics within the Marubeni
Marubeni Group with the means to report any compliance
Group. On April 24, 2002, the company established a
violations directly to the central compliance committee, or
Compliance Committee to strengthen existing controls.
else to discuss them with an external legal counsel that can
Reporting directly to the president, this committee oversees
provide advice on the issue. Naturally, any reporters of
the implementation of various measures designed to boost
compliance violations receive assurances they will not be
compliance and promote ethics.
penalized for such actions.
Corporate Compliance Manual and
the “Door of Courage”
Expansion of Stringent Compliance
Measures
Marubeni has formulated and distributed a compliance
The “V” PLAN, the current medium-term management
manual, which is designed to act as a guide to the required
plan that commenced from April 2003, designates the
standards of corporate behavior for all directors and
strengthening of existing regulatory compliance struc-
employees in the performance of daily duties. The manual
tures, including all Marubeni Group companies, as one of
commits all who work within the Marubeni Group not only
the most important issues facing the company. In specific
to uphold the law, but also to promote the highest standards
terms, besides providing for more related training and
of ethical corporate behavior as members of society. The
education programs to cultivate a strongly compliance-
opening sentence of the manual sets forth a clear, uncom-
oriented corporate culture among all individual staff, the
promising principle to inspire all employees to make ethical
plan calls for the construction of separate compliance
choices, even when under pressure: “When you are faced
structures within all business divisions and Marubeni
with a choice between integrity and profit, choose integrity
Group companies. Centered on a system of compliance
without hesitation.”
officers appointed in each business area, these new
structures aim to reflect the differences that exist between
various areas and industries. The plan also substantially
boosts the effectiveness of internal controls by instituting
systems of compliance audits, by increasing the numbers
of internal audit personnel, and by strengthening the
audit functions inside Marubeni Group companies. In the
future, Marubeni plans to continue seeking improvements to its compliance systems in a sure and steady
fashion, since this is not a task that should be rushed.
Marubeni Corporation 2003
43
43
Our Commitment to Sustainable Growth
Integrated Environmental Management System
has translated into its recognition in leading world equity
As a major trading house with operations that span the
markets as an eco-stock. The company has been selected for
globe, the Marubeni Group is introducing environmental
two consecutive years as a stock for a Japanese equity
management systems based on ISO 14001 guidelines
eco-fund by the Japan Research Institute Limited, which was
worldwide. The goal is to reduce the environmental impact
commissioned by a leading European financial institution to
of Marubeni’s many diverse businesses and to work actively
advise on the selection of companies that are actively
toward the development of eco-conscious business models.
committed to environmental conservation. Marubeni also
An integrated environmental management system with
remains a listing on the Dow Jones World Sustainability
common global standards is being applied across the entire
Index, a benchmark indicator that comprises corporations
Marubeni Group to promote a unified certification process.
deemed to be staunch contributors to sustainable growth and
Marubeni has developed a global environmental policy to
to sustainability in the economic, environmental and social
raise awareness of environmental responsibilities among all
spheres. Again, this marked the second consecutive year of
directors and employees, and is undertaking a variety of
index inclusion. In addition, Marubeni has been included in
initiatives to develop an integrated response to the challenge
the new FTSE 4 Good Index, an equity market benchmark
of environmental impact reduction. As of March 31, 2003, the
designed jointly by the Financial Times newspaper and the
Tokyo and Osaka head offices, domestic branches and offices,
London Stock Exchange to guide investors toward firms that
and a total of five overseas corporate subsidiaries and 31
take social responsibilities as a corporate citizen seriously.
affiliates had gained ISO 14001 certification. The worldwide
These various achievements provide a positive, objective
certification process continues.
evaluation of the efforts that the Marubeni Group is making
As part of a policy initiative to strengthen compliance
structures within the Marubeni Group, the company has
issued a compliance manual to all staff. This manual
with regard to the environment and to the development of
constructive relationships with all stakeholders.
stresses the importance of observance of environmental
Development of Eco-Businesses
conservation laws and regulations, and of taking measures
The Marubeni Group Environmental Policy commits the
to reduce the impact of business activities on the
company to promote eco-consciousness within daily business
environment and natural ecosystems.
activities and to develop businesses that provide positive
environmental benefits. Marubeni is leveraging its capabilities as a general trading house to contribute to environmental
conservation projects across a wide range of business fields.
Examples include wind power generation projects, PET
bottle recycling operations, and participation in an
environmental fund organized by the European Bank of
Reconstruction and Development. A description of the
Marubeni Group Environmental Policy and examples of
eco-conscious business activities can be found in the Environ-
Greater Transparency and Disclosure
Marubeni is striving to raise transparency in relation to its
In line with the Marubeni Group Environmental Policy,
environmental activities to promote deeper mutual
the company is aware of its responsibilities as a good
understanding with all its external stakeholders. Efforts to
corporate citizen. In all its daily business activities,
promote transparency include the publication of an annual
Marubeni will continue to do its utmost to preserve the
environmental report, disclosure of environmental
environmental well-being of the Earth, while striving for
information on its website, and a system for answering
the harmony and prosperity of human society. Marubeni is
related external inquiries.
committed to continue working for a better environment
Marubeni’s commitment in the environmental sphere
44
mental Report and on the company’s website.
Marubeni Corporation 2003
and sustainable growth.
Corporate Citizenship
The Marubeni Foundation
Its consistently high level of donations to the commu-
Marubeni recognizes its social responsibilities as a
nity over nearly three decades have gained the Marubeni
corporate citizen. One of the main ways in which Marubeni
Foundation a high reputation among Japan’s private-sector
has contributed to society over many years is through the
philanthropic organizations. In March 2003, in recognition
Marubeni Foundation, which was established in 1974 and
of its contributions to society, the Japan Fashion Associa-
has been authorized as a social welfare corporation by
tion, a member of the Japan-Tokyo Chamber of Commerce,
Japan’s Ministry of Health, Labour and Welfare. The
presented the foundation with the Japan Lifestyle &
Marubeni Foundation is involved in a variety of social
Culture Award.
welfare activities. It disburses over ¥100 million in funds
every year to social welfare institutions and related bodies
throughout Japan for many different projects, in response to
requests submitted through a transparent application
process. Since 1975 the foundation has consistently
supported over 50 projects each year. Over the past 28
years, a cumulative total of ¥2.8 billion has been distributed
to nearly 1,500 groups.
Recipient institutions and bodies, which include groups
working in each of Japan’s 47 administrative regions, range
from homes for the elderly and physically and mentally
challenged people, to children’s institutions and welfarerelated volunteer groups. Fund disbursements typically cover
Tohru Tsuji, former Chairman of the Marubeni Foundation, at the award ceremony
the costs of building facilities or purchasing special vehicles or
other equipment. The contributions are also used for housing
Academic Scholarships
and other building renovation projects, and for surveys and
Marubeni has established academic scholarship funds in the
similar research projects in welfare-related fields. Recently,
Philippines (1989), Vietnam (1994) and Indonesia (1999) to
the foundation has also made numerous donations to institu-
support local education and training. Marubeni finances
tions and groups that tackle important contemporary social
these funds, which disburse scholarships out of investment
issues such as truancy, domestic violence and homelessness.
returns. In the Philippines, the fund provides scholarships
In these diverse ways, the Marubeni Foundation supports a
for students on vocational training courses, whereas in
broad range of worthy social causes.
Indonesia the fund supports university students. In the
Despite declining returns on investments due to low
interest rates in recent years, the foundation has worked to
fiscal year ended March 31, 2003, these funds supported a
total of 233 students across the three nations.
develop extra sources of donations so that the level of
annual disbursements can be maintained at ¥100 million.
Other Activities
One such initiative is the ¥100 Club, which now counts
As part of regional community initiatives, Marubeni has
over 4,000 volunteers from among Marubeni directors,
organized semiannual cleanup drives in the vicinity of its
employees and retirees.
Tokyo head office in conjunction with local residents. The
company also organizes collections of second-hand clothing
from employees to send to refugees overseas.
Marubeni Corporation 2003
45
45
Directors, Corporate Auditors and Corporate Vice Presidents
MEMBERS OF THE BOARD
CORPORATE AUDITORS
Chairman
Inoshin Kitamura
Toshihiko Mori
Hiroaki Shinoda
Tatechika Umeda
Tohru Tsuji
President and CEO
Chief Operating Officer, Finance & Logistics Business Div.;
Executive Corporate Officer, Business Incubation Dept.
Teruo Asada
General Manager, Finance Dept.;
Senior Corporate Officer, Investor Relations
Nobuo Katsumata
CORPORATE
VICE PRESIDENTS
Michio Kuwahara
Advisor to the President for Iron & Steel Strategies and
Coordination Dept.; Executive Corporate Officer,
Iron & Steel Strategies and Coordination Dept.
Corporate Executive Vice President
Mamoru Sekiyama
Kazuhiko Sakamoto
Chief Operating Officer, Utility & Infrastructure Div.
Shigeki Kuwahara
General Manager for the Americas; President and CEO,
Marubeni America Corporation
Koichi Mochizuki
Executive Deputy Presidents
Katsuo Koh
Executive Corporate Officer, Corporate Strategies Dept.;
Advisor to the President for Energy Div.,
and Metals & Mineral Resources Div.
Corporate Executive Vice Presidents
Toshio Nakagawa
CIO; Advisor to the President for Transportation &
Industrial Machinery Div., Telecom & Information Div.,
and Business Incubation Dept.
Corporate Senior Vice Presidents
Chief Executive for Europe & Africa;
Managing Director and CEO, Marubeni Europe plc
Masakatsu Takita
Chief Representative in Indonesia; President and CEO,
P.T. Marubeni Indonesia
Corporate Vice Presidents
Chief Operating Officer, Metals & Mineral Resources Div.
Advisor to the President for Utility & Infrastructure
Div., Plant & Ship Div., and Finance & Logistics
Business Div.
Executive Corporate Officer, Human Resources Dept.,
Corporate Communications Dept., and Corporate
Planning & Coordination Dept.
Tomoyuki Nakayama
Advisor to the President for Agri-Marine Products Div.,
and Textile Div.
Susumu Watanabe
Executive Corporate Officer, General Affairs Dept.,
Corporate Accounting Dept., Finance Dept.
and Investor Relations
Marubeni Corporation 2003
Deputy General Manager for the Americas;
Executive Vice President and COO, Marubeni America
Corporation; President and CEO, Marubeni Canada Ltd.
General Manager for China; President, Marubeni
China Co., Ltd.; General Manager, Beijing Office
Hiroshi Koyabu
Chief Operating Officer, Textile Div.
Chief Operating Officer, Chemicals Div.
Tetsuro Sakamoto
Chief Operating Officer, Agri-Marine Products Div.
Shuzo Yamada
General Manager, Nagoya Branch
Kazuo Ogawa
Toru Nishimi
Ko Mori
Makoto Isogai
Advisor to the President for Forest Products & General
Merchandise Div., Chemicals Div., and Development &
Construction Div.
General Manager, Corporate Planning & Coordination Dept.
Tadatsugu Nakajima
Corporate Senior Vice Presidents
Akira Matsuda
Masaru Funai
Tadao Manabe
Yuji Kato
Executive Corporate Officer, Audit Dept., Information
Strategy Dept., Risk Management Dept., and Legal Dept.
Chief Operating Officer, Transportation & Industrial
Machinery Div.
Chief Operating Officer, Energy Div.
Kiyoshi Yoshimitsu
46
Hitoshi Sakamoto
Tsuyoshi Endo
Chief Operating Officer, Plant & Ship Div.
Shuichi Morizane
Chief Operating Officer, Telecom & Information Div.
Norihiro Shimizu
Chief Operating Officer, Development & Construction Div.
Makoto Itoh
President, Marubeni Thailand Co., Ltd.;
General Manager, Bangkok Branch
Kazuoki Matsushita
Chief Operating Officer, Forest Products & General
Merchandise Div.
Fumio Uehara
President & CEO, Nexion Corporation
(As of September 1, 2003)
Financial Section
48_Eleven-Year Summary
50_Financial Review
58_Consolidated Balance Sheets
60_Consolidated Statements of Operations
61_Consolidated Statements of Changes in
Shareholders’ Equity
62_Consolidated Statements of Cash Flows
63_Notes to Consolidated Financial Statements
83_Report of Independent Auditors
Marubeni Corporation 2003
47
Eleven-Year Summary
Marubeni Corporation
Years ended March 31
Millions of Yen
Thousands of
U.S. Dollars*
2003
2003
2002
¥2,928,999
1,101,830
1,477,899
3,284,575
8,793,303
$24,408,325
9,181,917
12,315,825
27,371,458
73,277,525
¥3,232,883
1,209,677
1,519,451
3,010,234
8,972,245
¥3,754,652
1,184,653
1,760,793
2,736,765
9,436,863
424,643
3,538,692
436,804
479,754
33,166
30,312
276,383
252,600
(165,155)
(116,418)
6,688
15,036
At year-end:
Total assets .............................................................................
Net interest-bearing debt .....................................................
Total shareholders’ equity ...................................................
4,321,482
2,264,117
260,051
36,012,350
18,867,642
2,167,092
Amounts per 100 shares (¥/US$):
Basic earnings (loss) ..............................................................
Diluted earnings (loss) .........................................................
Cash dividends ......................................................................
2,030
1,896
300
16.92
15.80
2.50
For the year:
Trading transactions
Domestic .............................................................................
Export ..................................................................................
Import .................................................................................
Offshore ..............................................................................
Total volume of trading transactions .................................
Gross trading profit ..............................................................
Income (loss) before income taxes and equity in
earnings (losses) of affiliated companies .........................
Net income (loss) ..................................................................
Cash Flows (for the year):
Net cash provided by (used in) operating activities ........
Net cash provided by (used in) investing activities ........
Net cash (used in) provided by financing activities ........
Cash and cash equivalents at end of year .........................
194,788
113,241
(294,001)
466,511
1,623,233
943,675
(2,450,008)
3,887,592
2001
4,805,669
2,712,906
263,895
5,320,604
3,089,839
342,297
(7,792)
(7,792)
–
198,456
74,504
(150,104)
466,642
1,006
940
–
179,305
187,993
(456,125)
329,811
Ratios:
Return on assets (%) .............................................................
Return on equity (%) ............................................................
Shareholders’ equity to total assets (%) .............................
Net D/E ratio (times) ...........................................................
0.7
11.6
6.0
8.7
–
–
5.5
10.3
0.3
4.5
6.4
9.0
Consolidation:
Consolidated subsidiaries ...................................................
Equity-method affiliates ......................................................
Total ......................................................................................
327
157
484
354
161
515
412
186
598
Number of employees:
Consolidated ..........................................................................
Non-consolidated .................................................................
24,829
3,914
28,140
4,234
30,956
4,855
Stock price (Tokyo Stock Exchange) (¥):
High ......................................................................................
Low ......................................................................................
151
86
262
58
401
200
* U.S. dollar amounts above and elsewhere in this report are converted from yen, for convenience only, at the prevailing rate of ¥120 to US$1 as of
March 31, 2003.
48
Marubeni Corporation 2003
Millions of Yen
2000
1999
1998
1997
1996
1995
1994
1993
¥ 4,571,183
1,250,165
1,425,294
2,975,800
10,222,442
¥ 5,183,131
2,163,734
1,452,026
3,161,266
11,960,157
¥ 5,931,831
2,535,228
1,710,749
3,462,709
13,640,517
¥ 6,604,469
2,190,089
1,727,032
3,448,387
13,969,977
¥ 6,967,511
1,976,749
1,531,517
3,064,783
13,540,560
¥ 6,741,379
2,058,938
1,619,055
2,449,590
12,868,962
¥ 7,020,640
2,247,539
1,775,125
2,300,504
13,343,808
¥ 7,469,459
2,600,561
2,396,812
2,990,595
15,457,427
453,496
522,356
534,485
496,550
475,221
460,167
451,596
458,193
(149,904)
(117,729)
54,922
17,230
57,504
20,113
33,900
15,117
14,572
10,368
36,104
5,493
37,146
1,108
7,388,101
4,432,159
475,253
7,550,347
4,555,208
512,929
7,644,002
4,403,714
560,589
6,844,022
4,079,368
480,451
7,059,389
3,932,907
438,810
8,067,086
4,620,051
452,873
1,153
1,054
600
1,346
1,289
600
1,012
1,010
600
694
694
600
368
368
600
74
74
600
5,419
2,060
5,584,353
3,328,437
324,301
138
138
–
184,701
257,006
(594,878)
405,308
6,511,841
3,966,471
354,017
(7,880)
(7,880)
300
232,414
99,101
(213,321)
579,366
254,221
(58,769)
(91,879)
480,825
24,308
66,036
(209,412)
373,015
107,547
(252,345)
267,217
485,844
(99,929)
(158,296)
(4,188)
359,436
227,959
436,054
(772,509)
642,575
(241,545)
(75,819)
(124,646)
785,127
0.0
0.6
5.8
10.3
–
–
5.4
11.2
0.2
3.5
6.4
9.3
0.3
3.8
6.8
8.9
0.2
2.9
7.3
7.9
0.2
2.3
7.0
8.5
0.1
1.2
6.2
9.0
0.0
0.2
5.6
10.2
456
190
646
488
201
689
479
214
693
459
203
662
436
188
624
410
164
574
422
157
579
464
175
639
31,342
5,344
–
5,844
–
6,041
–
6,386
–
6,702
–
7,064
–
7,190
–
7,218
486
205
345
155
525
177
638
421
602
404
580
415
545
410
490
309
Marubeni Corporation 2003
49
Financial Review
1. OPERATING ENVIRONMENT
out. The Bank of Japan continued its quantitative easing policy in
the face of ongoing deflation, but this failed to increase lending
During the year under review, ended March 31, 2003, the U.S.
economy witnessed capital investment pick up slowly, but
consumer spending made moderate gains in the first half of 2002
on the part of financial institutions. The Nikkei 225 Stock
Average at the end of March 2003 actually hit a 21-year low, and
was representative of the continuing difficulties and instability
thanks to low interest rates and a positive wealth effect supported by high housing prices. However, the second half of the
fiscal year was adversely influenced by falling stock prices and a
faced by capital markets.
Total Volume of Trading Transactions
and consumer sentiment worsened and economic recovery
slowed. This situation was exacerbated in the early months of
2003 by increasing tension in Iraq. The result was that businesses
Marubeni recorded a total volume of trading transactions of
¥8,793.3 billion (US$73,278 million) on a consolidated basis,
¥178.9 billion, or 2%, lower than the previous fiscal year. The
and households reined in spending, slowing economic growth.
In Europe, mandatory fiscal constraints by countries having
already adopted the euro prevented the adoption of proactive
total volume of trading transactions includes the sales value of
all transactions in which Marubeni and its subsidiaries participate, irrespective of the type of transaction, based on the
economic policies. Germany and other European countries
suffered stock market slumps and layoffs as a result. Predictably,
consumer spending fell and as a consequence domestic demand
practices of Japanese trading companies.
within Europe stagnated. Overall growth rates failed to improve
significantly from the low figures of the previous year.
In Asia, exports and domestic demand made significant gains
Domestic transactions were down ¥303.9 billion, or 9.4%, at
¥2,929.0 billion mainly due to declines in Metals and Machinery.
Exports declined ¥107.8 billion, or 8.9%, to ¥1,101.8 billion
in South Korea, Thailand and Malaysia, driving robust economic
expansion. The Indonesian economy benefited from a consumerled recovery, with Taiwan and Singapore making similar
primarily because of declines in Metals and Machinery. Imports,
notably in Textiles and Metals, edged down ¥41.6 billion, or
2.7%, to ¥1,477.9 billion. Offshore transactions climbed ¥274.3
progress on the back of strong exports. Exports to the U.S. by
NIE and ASEAN countries slowed somewhat from the summer
onwards, but exports to China and other Asian countries were
billion, or 9.1%, to ¥3,284.6 billion, largely due to an increase in
Machinery transactions.
steady. Chinese exports continued their strong performance,
with internal Chinese demand also benefiting from foreign direct
investment. As a consequence, total overall growth for China
By Region
Trading transactions in Japan dipped ¥268.4 billion, or 3.3%, to
¥7,895.3 billion, due to the transfer of the Iron and Steel business
came to a strong 8%.
The Russian economy made a strong showing during the year
due to rising crude oil prices. In contrast, disruptions in capital
to Marubeni-Itochu Steel Inc. Transactions in North America
improved ¥6.9 billion, or 0.4%, to ¥1,606.8 billion, largely due to
an increase in Energy transactions. European transactions rose
markets and economic stagnation in Argentina and Brazil
showed no signs of abating.
The Japanese economy bottomed out thanks to strong exports.
However, consumer spending remained flat and capital expendi-
¥85.5 billion, or 23.4%, to ¥451.6 billion, mainly reflecting Utility
and Infrastructure transactions. In Asia and Oceania, transactions fell ¥40.0 billion, or 6.7%, to ¥560.5 billion, primarily from
lower Energy and Textiles transactions. Transactions in other
tures were lackluster, amid high unemployment and low
personal income levels. A full-scale economic recovery thus
remained a distant prospect. From autumn 2002, the economy
regions, negatively impacted by lower Plant and Ship transactions, declined ¥4.6 billion, or 0.6%, to ¥815.8 billion.
began to lose steam as exports and industrial production peaked
50
2. OVERVIEW OF
FISCAL YEAR ENDED MARCH 31, 2003
delayed recovery in unemployment rates, both brought on by a
series of highly publicized accounting irregularities at major
corporations and weak corporate profits. As a result, business
Marubeni Corporation 2003
By Transaction Type
Total Volume of Trading Transactions by Region
(Years ended March 31)
8,163.8
Japan
7,895.3
North
America
Europe
1,599.9
1,606.8
366.1
451.6
Asia &
Oceania
Other
Regions
600.5
560.5
820.4
815.8
(Billions of Yen)
2002
2003
East. Complementing this strong performance was a withdrawal
from unprofitable businesses in the U.S., which helped to take
gross trading profit up 35.3%, or ¥3.6 billion, to ¥13.9 billion
(US$116 million).
Transportation & Industrial Machinery transactions
benefited mainly from an upsurge in aircraft-related business,
rising 0.3%, or ¥2.4 billion, over the previous year to ¥776.6
billion (US$6,471 million). Due both to this and favorable
progress in the industrial machinery business, gross trading
profit rose 3.6%, or ¥1.9 billion, to ¥54.4 billion (US$453 million).
Energy transactions grew due to a rise in oil-related transactions, lifting total sales in the area 5.1%, or ¥112.8 billion, to
¥2,309.8 billion (US$19,248 million). However, a fall in profits
from oil-related businesses brought gross trading profit down
2.2%, or ¥0.7 billion, to ¥29.6 billion (US$247 million).
Metals & Mineral Resources transactions suffered from falling
prices in the non-ferrous light metals market, dropping 7.1% or
Total Volume of Trading Transactions and
Gross Trading Profit by Operating Segment
¥33.8 billion from the previous year to ¥442.3 billion (US$3,686
million). This took gross trading profit down 4.1%, or ¥0.6
billion, to ¥14.0 billion (US$117 million).
The Company’s operating segments by which management
evaluates performance and allocates resources are classified in
terms of the nature of the products and services or geographic
Chemicals transactions were buoyed by the rise in crude oil and
naphtha prices, with sales of organic and synthetic fiber
materials growing to push total sales up 5.8%, or ¥31.1 billion, to
areas. These segments are managed by product-specific Head
Office divisions. Domestic branches and offices, and overseas
corporate subsidiaries and branches operate in their respective
¥569.9 billion (US$4,749 million). At ¥29.3 billion (US$244
million), gross trading profit also benefited from growth in
polyvinyl chloride alkali sales, improving on last year’s figure by
geographic areas as independent operating units. Each reportable segment purchases, distributes and markets a wide variety
of industrial and consumer goods, including raw materials and
2.0%, or ¥0.6 billion.
Forest Products & General Merchandise transactions rose 2.4%,
or ¥17.3 billion, to ¥745.8 billion (US$6,215 million). The main
equipment in many industries and, in addition, provides the
related financing, insurance and other services accompanying
these operations primarily on a worldwide basis. The Company
contributing factors were growth in natural rubber sales and an
upturn in the plywood market, which more than offset declines in
wood-chip and domestic paper transactions. Gross trading profit
has twelve segments identified by product and service, in
addition to its domestic branches and offices, and overseas
corporate subsidiaries and branches.
rose 1.0%, or ¥0.4 billion, to ¥41.2 billion (US$344 million) as a
consequence of improved profitability due to cost reduction
initiatives in the paper business.
IT Business transactions fell 17.3%, or ¥81.0 billion from the
previous year, to ¥386.2 billion (US$3,218 million) as a result of
weakness in the submarine cable-related business in Asia and a
Agri-marine Products transactions fell 2.0% from the previous
year, or ¥21.3 billion, to ¥1,023.5 billion (US$8,529 million) as
seafood business volume fell. This unfavorable trend combined
general decline in the PC market. Gross trading profit in this area
fell 1.9%, or ¥0.6 billion, to ¥32.6 billion (US$271 million).
Utility & Infrastructure transactions increased 27.9%, or ¥92.1
with the removal from the scope of consolidation of an oilexpressing subsidiary to bring gross trading profit down 2.8% from
the previous year, or ¥1.7 billion, to ¥58.6 billion (US$488 million).
billion, to ¥421.9 billion (US$3,515 million) as a result of orders
in Southeast Asian power generation and Near and Middle East
water pipe projects. Gross trading profit increased 12.0%, or
Textile transactions fell 15.5%, or ¥68.1 billion, to ¥370.3 billion
(US$3,086 million) due to stagnation in the domestic market and
a review of low-profit transactions. These factors resulted in a
¥1.3 billion, to ¥11.8 billion (US$99 million), in line with the
increased sales.
Plant & Ship transactions rose 22.6%, or ¥135.8 billion, over the
decline of ¥3.6 billion, or 12.9%, in gross trading profit to ¥24.5
billion (US$204 million).
Development & Construction transactions rose 0.5%, or ¥0.9
previous year to ¥736.5 billion (US$6,137 million). These strong
results were due to an increase in energy and chemical plant
contracts secured mainly in Africa and the Near and Middle
billion, over the previous year to ¥185.8 billion (US$1,549
million), as growth in domestic housing projects outweighed a
contraction in installation contracts. Improved profit margins
Marubeni Corporation 2003
51
were an additional factor in taking gross trading profit up 5.7%,
or ¥1.8 billion, to ¥34.0 billion (US$284 million).
provision for doubtful accounts made in the previous fiscal year
pursuant to the @ction 21 “A” PLAN initiated in the previous
Finance & Logistics Business transactions dropped 18.6%, or
¥8.6 billion, to ¥37.8 billion (US$315 million) as a result of the
removal from the scope of consolidation of certain subsidiaries
year, the provision for doubtful accounts declined 87.1%, or ¥38.3
billion, to ¥5.7 billion (US$47 million).
operating in lease-related businesses. Gross trading profit fell
3.7%, or ¥0.3 billion, to ¥6.5 billion (US$54 million).
Domestic Branches and Offices transactions fell 41.8%, or
¥124.4 billion, to ¥172.9 billion (US$1,441 million) due to the
transfer of the Iron & Steel business to Marubeni-Itochu Steel Inc.
Gross trading profit declined 7.7%, or ¥0.5 billion, to ¥6.1 billion
(US$51 million).
Overseas Corporate Subsidiaries and Branches transactions
dropped 3.2%, or ¥34.7 billion, to ¥1,065.4 billion (US$8,878
million) due to the abovementioned transfer of the Iron & Steel
business to Marubeni-Itochu Steel. Gross trading profit dropped
2.5%, or ¥1.9 billion, to ¥72.8 billion (US$607 million).
As a result of the above factors, gross trading profit fell 2.8%,
or ¥12.2 billion to ¥424.6 billion (US$3,539 million).
Selling, General and Administrative Expenses
(Years ended March 31)
1998
440.0
1999
458.2
2000
411.5
2001
2002
2003
400.4
392.1
345.6
(Billions of Yen)
Gross Trading Profit
(Years ended March 31)
1998
534.5
1999
2000
522.4
453.5
2001
2002
2003
479.8
436.8
424.6
(Billions of Yen)
52
Consequently, operating profit climbed ¥72.6 billion to
¥73.4 billion (US$611 million).
Interest expenses, net of interest income improved ¥6.0 billion
from the previous year to ¥23.5 billion, largely owing to a decrease
in interest-bearing debt and lower interest rates. Despite gains on
the exchange and sale of securities in its portfolio, the Company
posted a loss on investment securities of ¥12.7 billion. This came as
the result of a combined loss of ¥30.9 billion, consisting of a loss on
the devaluation of shareholdings in banks due to falling stock
prices and a loss accompanying the establishment of an employee
retirement benefit trust. The sale of real-estate holdings led to a
gain on property and equipment of ¥8.5 billion. Other-net in other
income (expenses) amounted to ¥19.3 billion, and included losses
incurred in liquidating subsidiaries and affiliated companies of
¥12.5 billion and net foreign currency transaction loss of ¥5.3
Selling, general and administrative expenses fell 11.9%, or
¥46.5 billion, to ¥345.6 billion (US$2,880 million). Reasons
billion, due to the yen’s appreciation. Although losses incurred in
liquidating subsidiaries and affiliated companies declined year on
year, a stronger yen led to larger exchange losses, causing other –
include a nearly ¥20.0 billion decline in expenses (approximately
¥16.5 billion excluding roughly ¥3.5 billion due to changes in
exchange rates), owing to vigilant cost-reduction initiatives, and
net to worsen by ¥2.8 billion.
Consequently, income before income taxes and equity in
earnings of affiliated companies amounted to ¥33.2 billion
respective declines of around ¥15.0 billion from the transfer of
the Iron & Steel business to Marubeni-Itochu Steel Inc. and
withdrawal from unprofitable businesses. Because of a large
(US$276 million), reversing the previous fiscal year’s result by
¥198.3 billion.
Marubeni Corporation 2003
After posting heavy valuation losses in the previous year in
line with the @ction 21 “A” PLAN, equity in earnings (losses) of
(3) Foreign currency fluctuations
affiliated companies were ¥13.4 billion (US$112 million), turning
around the previous fiscal year’s result by ¥32.4 billion.
The result was net income of ¥30.3 billion (US$253 million),
business in various foreign currencies. Fluctuations in these
currencies can thus impact business performance. The Company
and certain consolidated subsidiaries enter into foreign exchange
reversing the previous fiscal year’s net loss by ¥146.7 billion.
contracts principally to hedge foreign currency denominated
transactions, assets and liabilities to minimize the effect of
foreign currency fluctuations.
Net Income
The Company and certain consolidated subsidiaries conduct
(Years ended March 31)
(4) Interest rate fluctuations
1998
1999
17.2
2.1
2001
2002
2003
institutions and from capital markets via the issuance of bonds
and other means. The Company has both fixed and variable-rate
debt obligations. While most business assets can be shifted to
(117.7)
2000
The Company procures funds through loans from financial
15.0
cover the risk of fluctuations in interest rates on borrowings,
fluctuations in market interest rates may have an impact on
earnings. Through its Asset Liability Management program, the
Company utilizes interest swaps contracts and other means to
reduce the risk of interest rate fluctuations.
(116.4)
30.3
(Billions of Yen)
3. SIGNIFICANT FACTORS IMPACTING
OPERATING RESULTS
(1) Macroeconomic conditions in Japan
and other principal economies
(5) Gains (losses) on marketable equity
securities and debt securities
The Company and certain subsidiaries invest in marketable equity
securities, debt securities and other available-for-sale securities
with the intent of strengthening business relationships and other
purposes. The companies determine the appropriate classification
of investment securities as either trading, held-to-maturity or
available-for-sale securities at the date of purchase in accordance
with Statement of Financial Accounting Standards No. 115,
Marubeni conducts business activities worldwide, and is thus
affected by economic conditions both in its home country of
Accounting for Certain Investments in Debt and Equity Securities.
These trading and available-for-sale securities bear an intrinsic
risk of fluctuation in their fair value.
Japan and abroad. Conversely, as a sogo shosha (general trading
company), Marubeni is active in multiple industries and
conducts businesses in Japan and many other countries, without
Trading securities
Trading securities are held for resale in anticipation of short-term
limiting its presence to any specific country. This diversified
portfolio of businesses helps to mitigate the effects of economic
fluctuations on Marubeni’s performance.
market movements. Trading securities, consisting primarily of
marketable equity securities, are stated at fair value. Gains and
losses are included in (loss) gain on investment securities.
(2) Fluctuations in the prices of various
commodities
Available-for-sale securities
Marketable equity securities not classified as trading securities,
Because Marubeni handles a variety of merchandise, its business
and debt securities not classified as trading nor held-to-maturity
securities are classified as available-for-sale securities and are
carried at fair value, with the unrealized gains and losses, net of
performance is impacted by fluctuations in market conditions.
The Company and certain consolidated subsidiaries enter into
commodity futures and forward contracts principally as a means
of hedging the risks associated with certain inventories, commitments and forecasted transactions.
taxes, reported in accumulated other comprehensive loss in
shareholders’ equity.
Marubeni Corporation 2003
53
Billions of yen
March 31, Y-o-Y
2003
change
(6) Retirement benefits and pension plans
The Company has a lump-sum retirement plan based on
compensation as of the date of severance and years of service
and a defined benefit retirement plan.
The Company’s retirement plan is based on a welfare pension
plan as defined by the Welfare Pension Insurance Law of Japan,
and consists of two components: a public pension plan managed
on behalf of the Japanese government in the form of a substitutional portion and a corporate pension plan with a defined
compensation rate of 5.5%.
The persistence of low interest rates and a deteriorating
investment environment may weaken the financial integrity of
the Company’s pension fund, increasing the risk of higher
retirement benefit obligations and pension costs. To minimize
this risk, the Company adopted a cash balance plan and reduced
retirement benefits for certain employees effective April 1, 2003.
Under the cash balance plan, the Company’s former compensation rate of 5.5% has been pegged to the variable interest rate
of government bonds (guaranteed minimum of 2.5%). The
guaranteed period of pension payments has been extended from
15 to 20 years.
To minimize investment risk, the Company obtained
approval from Japan’s Minister of Health, Labour and Welfare
for exemption from future benefit obligations with respect to
the substitutional portion of the welfare pension fund on
April 15, 2003. The final date for transfer of all pension assets
to the government is currently scheduled for some time after
October 2003.
4. FINANCIAL CONDITION
Consolidated total assets fell ¥484.2 billion, or 10.1% year on
year, to ¥4,321.5 billion due to a review of low-profit transactions,
business reorganization, and sale of various assets.
Consolidated interest-bearing debt fell in line with a
decrease in receivables and inventories, as well as the sale and
redemption of marketable and investment securities. Interestbearing debt dropped ¥439.9 billion, or 13.8%, to ¥2,745.0
billion. Net interest-bearing debt excluding cash and cash
equivalents was down ¥448.8 billion, or 16.5%, to ¥2,264.1
billion yen. A breakdown of cash and cash equivalents and net
interest-bearing debt is as follows.
Short-term loans:
Short-term loans from bank and others ..... ¥ 548.4 ¥-170.8
Commercial paper .........................................
12.7
+12.7
Interest-bearing portion of long-term debt:
Long-term loans .............................................
1,736.5
-23.6
Bonds ...............................................................
447.3
-258.2
Total interest-bearing liabilities ........................ ¥2,745.0 ¥-439.9
(Cash and cash equivalents and
time deposits) ....................................................
(480.8)
(-8.9)
Interest-bearing debt, net of cash and
cash equivalents and time deposits ............... ¥2,264.1 ¥-448.8
Total shareholders’ equity decreased ¥3.8 billion, 1.5%, to
¥260.1 billion. This mainly reflected an increase in accumulated
other comprehensive loss. The main components were a
deterioration of ¥20.9 billion in currency translation adjustments
and an ¥8.7 billion increase in unrealized losses on securities.
As a consequence, the net debt-to-equity ratio improved
1.57 points to 8.71 times, from 10.28 times at the previous
fiscal year-end.
5. CASH FLOWS
Net cash provided by operating activities came to ¥194.8 billion
as a result of the greater asset efficiency brought on by streamlining receivables and inventories. Net cash provided by investing
activities rose ¥38.7 billion over the previous year to ¥113.2
billion due to sales and redemption of marketable and investment securities and the collection of loans receivable. Accordingly, free cash inflow for the year came to ¥308.0 billion.
Net cash used in financing activities was ¥294.0 billion, after
free cash inflow was used to reduce interest-bearing debt. Cash
and cash equivalents at year-end were ¥466.5 billion, ¥0.1 billion
lower than at the previous fiscal year-end.
6. LIQUIDITY AND FUNDING SOURCES
(1) Funding Policy
Marubeni’s fundamental policy is to maintain a balanced mix of
funding in line with the requirements of its asset portfolio. The
goal is to sustain a stable level of liquidity while at the same time
trimming financing costs. In the year ended March 31, 2003,
54
Marubeni Corporation 2003
loans from financial institutions comprised approximately 80%
of total funding sources. The remaining approximately 20% was
7. COMMITMENTS AND
CONTINGENT LIABILITIES
raised from capital markets via the issuance of bonds and
commercial paper. The Company is also securitizing receivables
and taking other actions to diversify funding sources. The
The Company guarantees debt of affiliated companies and third
parties in the ordinary course of business. Should the guaranteed
Company will continue its drive to attain an optimal funding
structure by maintaining existing relationships with major
financial institutions and by flexibly securing funding from
parties fail to make payments, the Company would be required
to make such payments under these guarantees. The term of the
guarantees is basically one year. The related guarantee fees are
capital markets via bonds issuances and other means, while
diversifying funding sources.
primarily received quarterly or semi-annually. Certain of these
guarantees were secured by guarantees issued to the Company
by other parties. The outstanding balance of guarantees, which
(2) Liquidity
As part of contingency plans, Marubeni is taking steps to secure
the liquidity necessary to withstand unforeseen changes in its
approximated the maximum potential payment under these
guarantees, was ¥276,431 million ($2,303,592 thousand), including ¥151,355 million ($1,261,292 thousand) to affiliated compa-
business environment. These steps primarily involve maintaining a sufficient balance of cash deposits and committed credit
facilities. As of March 31, 2003, the balance of cash deposits on a
nies, at March 31, 2003, net of the amount secured by guarantees
issued to the Company by other parties of ¥21,258 million
($177,150 thousand).
consolidated basis was approximately ¥480.0 billion. The
Company’s committed credit facilities totaled approximately
¥420.0 billion, consisting of ¥400.0 billion yen for the parent
The Company, its subsidiaries and affiliated companies
conduct business activities on a global scale and are involved in
transactions which are subject to review and jurisdiction by a
company and approximately ¥20.0 billion for major overseas
subsidiaries. Of the parent company’s committed credit facility,
¥152.0 billion was switched to a long-term three-year commit-
wide range of authorities, both in Japan and abroad. Such
business activities are not without risk and, from time to time,
may involve legal actions, claims or other disputes. Although
ted credit facility upon renewal in March 2003, in a significant
step toward ensuring ample liquidity. Marubeni also holds
highly liquid marketable securities among its assets, virtually
there are various matters pending at any one time, management
is of the opinion that settlement of all such matters pending at
March 31, 2003 would not have a material effect on the consoli-
eliminating any liquidity concerns.
dated financial position or results of operations of the Companies.
(3) Credit ratings
8. CONSOLIDATED SUBSIDIARIES AND
AFFILIATED COMPANIES
Improving Marubeni’s credit ratings remains one of the most
important management tasks. Marubeni hopes to restore all its
credit ratings to an investment grade as soon as possible through
dialogue with ratings agencies aimed at promoting greater
understanding of its businesses, along with strengthening its
earnings power and improving its financial structure.
Marubeni’s credit ratings as of June 30, 2003 are listed below.
Ratings agency
As of June 30, 2003
Long
Short
term
term
Japan Credit Rating Agency, Ltd. .....................
BBB+
Ratings & Investment Information, Inc. ..........
BB+
a-3
Moody’s Investors Service ................................
B1
NP
Standard & Poor’s ..............................................
–
C
As of March 31, 2003, Marubeni had 484 companies within the
scope of consolidation, 31 less than the 515 companies as of
March 31, 2002. This latest figure accounts for the addition of 17
newly consolidated companies and the removal of 48 companies
from the scope of consolidation. The 484 companies included 327
subsidiaries and 157 affiliates. There were 176 companies based
in Japan, while 308 were located overseas.
A profitability comparison of consolidated companies is
presented as follows.
J-2
Marubeni Corporation 2003
55
Profitability Comparison of Consolidated Companies
March 31, 2003
Domestic Overseas Total
Profitable companies
No. of companies ............................................
Profit .................................................................
128
247
375
¥ 24.4 ¥ 40.9 ¥ 65.3
Billions of yen
March 31, 2002
Domestic Overseas
Total
134
Y-o-Y change
Domestic Overseas Total
257
391
-6
¥ 16.1 ¥ 34.9
¥ 51.0
¥ 8.3
-10
-16
¥ 6.0 ¥14.3
Unprofitable companies
No. of companies ............................................
Loss ...................................................................
Total
No. of companies ............................................
48
61
109
¥(17.1) ¥(14.0) ¥(31.1)
176
308
484
53
71
¥(26.4) ¥(81.1)
187
328
124
¥(107.5)
515
Profit (loss) .......................................................
¥ 7.2 ¥ 26.9 ¥ 34.1
¥(10.3) ¥(46.2)
¥ (56.5)
Percentage of profitable companies .................
72.7% 80.2% 77.5%
71.7% 78.4%
75.9%
-5
¥ 9.3
-11
-20
-31
+1.0
+1.8
+1.6
Points Points
composed of portfolio units at the very forefront of their
In June 2001, FASB issued Statement of Financial Accounting
respective industries. Guided by the new plan, risk assets will be
reduced and replaced by quality assets, a move expected to make
a positive contribution to profit margins. Numerical targets have
Standards No. 143, Accounting for Asset Retirement Obligations
(“SFAS 143”), which is effective for fiscal years beginning after
June 15, 2002. SFAS 143 requires legal obligations associated with
been set as follows: consolidated net income of ¥50 billion, net
interest-bearing debt of ¥2 trillion or less, and a net debt-toequity ratio four to five times or less. During the three years
the retirement of long-lived assets to be recognized at their fair
value at the time that the obligations are incurred. Upon initial
recognition of a liability, that cost should be capitalized as part of
covered by the “V” PLAN, the Company plans to increase its
shareholders’ equity. Marubeni put forward a proposal to the
regular General Meeting of Shareholders held in June 2003 to
the related long-lived asset and allocated to expense over the
useful life of the asset. The Company adopted SFAS 143 on April 1,
2003, and, based on current circumstances, does not believe that
partially revise the Articles of Incorporation to enable the
Company to issue preferred shares. This will give the Company
more options for making flexible and swift decisions on reinforc-
the impact of adoption of SFAS 143 will have a material effect on
the Company’s financial position or results of operations.
ing its capital structure.
Moreover, the Company will implement business strategies
tailored to the demands of individual business models, simulta-
10. MANAGEMENT POLICIES
neously ensuring that the utmost emphasis is placed upon riskreturn profiles and cash flows. These measures will introduce a
new level of robustness to management practices. The position-
On the basis of the @ction 21 “A” PLAN unveiled in November
2001, Marubeni has pursued ever-higher profits in core business
areas, reduced expenses, and turned around unprofitable
businesses. As a result, the Company achieved consolidated net
income of ¥30 billion and lowered interest-bearing debt to under
¥2,500.0 billion during the year, ended March 31, 2003, both of
which numbered among the numerical targets set under the
above plan.
Now, the Company plans to take its profitability and vitality,
which were successfully restored under the @ction 21 “A” PLAN,
to the next level. To this end, the Company will embark upon a
new three-year medium-term management plan: the “V” PLAN
launched in April 2003.
Under the “V” PLAN, the Company will take as its basic
management policy the creation of a robust corporate group
56
-15
+¥17.5 +¥73.1 +¥90.6
Points
9. RECENTLY ISSUED ACCOUNTING
STANDARDS
-10
¥67.1 ¥76.4
Marubeni Corporation 2003
ing of PATRAC (Profit After Tax Less Risk Asset Cost) as the
most important performance indicator will continue to be
instrumental in this respect, ensuring returns commensurate
with the risks in any given business. At the same time, resources
will be selectively concentrated on portfolio units, which
constitute the fundamental unit of operations on a consolidated
basis. This will give Marubeni a stronger financial structure and
reinforce its profit base.
11. OUTLOOK
In the year ending March 31, 2004, consumer spending and
capital investments are expected to bounce back in the U.S. as a
consequence of the swift conclusion of war in Iraq, allowing the
Billions of yen
U.S. economy to commence a modest recovery. A similar path is
likely to be followed by Asian economies on the back of renewed
growth in exports to the U.S. The unabated spread of Severe
Acute Respiratory Syndrome (SARS), however, may dampen
economic growth across the region, most notably in China.
In Japan, the prospects for an upturn in consumer spending are
uncertain, with no strong signs of marked improvement in
unemployment and personal income levels. However, increased
exports to both the U.S. and Asian countries are expected to
underpin steady economic growth. The persistence of deflationary
conditions and worsening business and consumer sentiment,
however, are likely to lead, at best, to a gradual economic recovery.
Against this backdrop, Marubeni started a new three-year
medium-term management plan, the “V” PLAN, in April 2003.
Guided by this plan, the Company will continue to reduce risk
assets and replace them with quality assets. These moves will
play an important role in efforts to increase profit margins,
which management anticipates will translate into consolidated
net income of ¥33.0 billion for the year ending March 31, 2004, an
increase of ¥2.7 billion over the year under review.
Marubeni will continue to reduce net interest-bearing debt,
excluding cash and cash equivalents, through the timely
collection of receivables, the sale of certain businesses and other
assets, and other means. In light of foreign exchange rates and
other uncertain factors, Marubeni expects to lower net interestbearing debt, excluding cash and cash equivalents, to ¥2,200
billion or less by March 31, 2004.
Billions of yen
Total volume of trading transactions ...........
Year ending
March 31,
2004
(forecast)
Year ended
March 31,
2003
(results)
¥8,200.0
¥8,793.3
Gross trading profit ........................................
420.0
424.6
Selling, general and administrative expenses ....
(335.0)
(345.6)
Provision for doubtful accounts ...................
(8.0)
(5.7)
Operating profit ..............................................
77.0
73.4
Interest expense, net of interest income ......
(26.0)
(23.5)
Dividends .........................................................
5.0
6.8
Loss on investment securities .......................
Loss (gain) on property and equipment ......
Other-net ..........................................................
Income before income taxes and equity in
Year ended
March 31,
2003
(results)
Total assets .......................................................
¥4,200.0
¥4,321.5
Total Shareholders’ equity .............................
290.0
260.1
Net interest bearing debt ...............................
2,200.0
2,264.1
Net debt-to-equity ratio (times) ....................
7.59
8.71
The assumptions used in preparing forecasts for the year
ending March 31, 2004 are: exchange rate of roughly ¥120 to the
U.S. dollar; a short-term prime rate for the Japanese yen of
1.375%; and a long-term prime rate of 1.4%.
The above and other forward-looking statements about the
performance of Marubeni and its Group companies found in this
document are based on management’s assumptions in light of
current information. Any number of uncontrollable and unforeseen
factors may cause forecasts to differ materially from actual results.
12. DIVIDENDS
Providing shareholders with steady dividend payments ranks
alongside improving shareholders’ equity as one of a
corporation’s most important responsibilities. For the year ended
March 2000 to the year ended March 2002, however, the Company
did not pay dividends, in order to increase shareholders’ equity.
For the year under review, the Company paid year-end
dividends of ¥3.00 per share, as the financial targets set in
@ction21 “A” PLAN have been achieved.
The Company also plans to pay year-end dividends of ¥3.00
per share for the year ending March 31, 2004.
Note: Segment performance throughout this report is based on business
results for the year ended March 31, 2003. Information regarding business lines, products and services is as of April 2003. Further, from
April 2003, the IT Business Division has been renamed the Telecom &
Information Division.
(12.7)
}
(10.0)
8.5
(19.3)
earnings of affiliated companies .................
46.0
33.2
Income taxes ....................................................
(26.0)
(16.3)
Equity in earnings of affiliated companies ...
13.0
13.4
Net income .......................................................
Year ending
March 31,
2004
(forecast)
¥
33.0
¥
30.3
Marubeni Corporation 2003
57
Consolidated Balance Sheets
Marubeni Corporation
At March 31, 2003 and 2002
Millions of Yen
ASSETS
Current assets:
Cash and cash equivalents (Notes 2 and 15) .............................................
Time deposits (Notes 7 and 15) ...................................................................
Investment securities (Notes 2, 3, 7 and 15):
Marketable equity securities ...................................................................
Other ..........................................................................................................
Notes and accounts receivable – trade (Notes 5 and 7):
Notes receivable .......................................................................................
Accounts receivable .................................................................................
Due from affiliated companies ...............................................................
Allowance for doubtful accounts ..........................................................
Inventories (Notes 2 and 7) ..........................................................................
Advance payments to suppliers ................................................................
Deferred income taxes (Note 10) ................................................................
Prepaid expenses and other current assets ..............................................
Total current assets ...........................................................................
Investments and long-term receivables:
Affiliated companies (Notes 2, 4 and 7) .....................................................
Securities and other investments (Notes 2, 3, 7 and 15):
Marketable equity securities ...................................................................
Other ..........................................................................................................
Notes, loans and accounts receivable – trade, net of unearned interest,
less allowance for doubtful accounts of
¥110,462 million ($920,517 thousand) in 2003 and
¥115,341 million in 2002 (Notes 2, 5, 7 and 15) ........................................
Property leased to others, at cost, less accumulated depreciation of
¥50,282 million ($419,017 thousand) in 2003 and ¥93,402 million
in 2002 (Notes 2, 6 and 7) ............................................................................
Total investments and long-term receivables ..............................
Property and equipment, at cost (Notes 2 and 7):
Land and land improvements ....................................................................
Buildings .......................................................................................................
Equipment .....................................................................................................
Accumulated depreciation .........................................................................
Net property and equipment .................................................................
Prepaid pension cost (Note 9) ........................................................................
Deferred income taxes (Note 10) ...................................................................
Intangible assets (Notes 2 and 6) ...................................................................
Goodwill (Notes 2 and 6) ................................................................................
Other assets ......................................................................................................
Total assets ........................................................................................
58
Marubeni Corporation 2003
Thousands of
U.S. Dollars
(Note 1)
2003
2002
2003
¥ 466,511
14,331
¥ 466,642
5,336
$ 3,887,592
119,425
182
13,108
751
63,198
1,517
109,233
108,048
824,784
131,655
(32,068)
397,714
67,741
34,594
175,474
2,202,074
181,566
919,741
182,708
(34,213)
439,278
67,074
33,207
162,271
2,487,559
900,400
6,873,200
1,097,125
(267,233)
3,314,283
564,508
288,283
1,462,284
18,350,617
364,648
283,944
3,038,733
112,589
337,955
164,484
389,373
938,242
2,816,292
245,887
332,254
2,049,058
201,871
1,262,950
249,781
1,419,836
1,682,258
10,524,583
171,037
276,190
279,089
726,316
(265,985)
460,331
113,005
157,335
42,236
23,553
59,998
¥4,321,482
181,675
306,152
302,286
790,113
(278,239)
511,874
93,829
154,391
48,136
17,393
72,651
¥4,805,669
1,425,308
2,301,583
2,325,742
6,052,633
(2,216,541)
3,836,092
941,708
1,311,125
351,967
196,275
499,983
$36,012,350
Thousands of
U.S. Dollars
(Note 1)
Millions of Yen
LIABILITIES AND SHAREHOLDERS’ EQUITY
2003
2002
2003
¥ 561,139
402,186
¥ 719,254
528,048
$ 4,676,158
3,351,550
196,282
608,386
44,717
60,553
13,773
1,984
216,880
2,105,900
222,066
624,962
52,371
58,138
10,967
1,490
223,912
2,441,208
1,635,683
5,069,883
372,642
504,609
114,775
16,533
1,807,334
17,549,167
Long-term debt, less current portion (Notes 7, 8 and 15) ..........................
1,902,327
2,048,454
15,852,725
Employees’ retirement benefits (Note 9) .....................................................
9,571
12,893
79,758
Deferred income taxes (Note 10) ...................................................................
10,972
6,345
91,433
Minority interests in consolidated subsidiaries .......................................
32,661
32,874
272,175
194,039
87,765
64,786
(86,441)
194,039
216,993
(94,754)
(52,375)
1,616,992
731,375
539,883
(720,342)
(98)
260,051
¥4,321,482
(8)
263,895
¥4,805,669
(816)
2,167,092
$36,012,350
Current liabilities:
Short-term loans (Notes 7, 8 and 15) ...........................................................
Current portion of long-term debt (Notes 7, 8 and 15) ............................
Notes and accounts payable – trade:
Notes and acceptances payable (Note 7) ...............................................
Accounts payable .....................................................................................
Due to affiliated companies ....................................................................
Advance payments received from customers .........................................
Income taxes (Note 10) .................................................................................
Deferred income taxes (Note 10) ................................................................
Accrued expenses and other current liabilities .......................................
Total current liabilities .....................................................................
Commitments and contingent liabilities (Note 17)
Shareholders’ equity (Note 11):
Common stock:
Authorized shares – 3,000,000,000
Issued and outstanding shares – 1,494,021,081
in 2003 and 2002 .....................................................................................
Additional paid-in capital ..........................................................................
Retained earnings (accumulated deficit) ..................................................
Accumulated other comprehensive loss (Notes 3, 9, 10 and 12) ............
Cost of common stock in treasury – 756,776 shares
in 2003 and 88,388 shares in 2002 ............................................................
Total shareholders’ equity ...............................................................
Total liabilities and shareholders’ equity ...................................
See accompanying notes.
Marubeni Corporation 2003
59
Consolidated Statements of Operations
Marubeni Corporation
Years ended March 31, 2003, 2002 and 2001
Thousands of
U.S. Dollars
(Note 1)
Millions of Yen
2003
Gross trading profit ...............................................................
(Total volume of trading transactions:
2003, ¥8,793,303 million ($73,277,525 thousand)
2002, ¥8,972,245 million
2001, ¥9,436,863 million) (Notes 2, 4 and 13)
Expenses:
Selling, general and administrative expenses .................
Provision for doubtful accounts (Note 5) .........................
Total ...........................................................................
Operating profit .....................................................................
Other income (expenses):
Interest expense, net of interest income:
2003, ¥26,605 million ($221,708 thousand);
2002, ¥45,773 million;
2001, ¥75,262 million .......................................................
Dividends .............................................................................
(Loss) gain on investment securities (Note 3) ..................
Gain (loss) on property and equipment (Note 6) ............
Other – net (Notes 2 and 14) ...............................................
Total ...........................................................................
Income (loss) before income taxes and equity
in earnings (losses) of affiliated companies ...................
Provision (benefit) for income taxes (Note 10):
Current .................................................................................
Deferred ...............................................................................
Income (loss) before equity in earnings (losses)
of affiliated companies .......................................................
Equity in earnings (losses) of affiliated companies –
net (after income tax effects) (Notes 4 and 10) ..................
Net income (loss) ...................................................................
2002
2001
2003
¥424,643
¥ 436,804
¥479,754
$3,538,692
345,612
5,660
351,272
73,371
392,092
43,936
436,028
776
400,356
37,916
438,272
41,482
2,880,100
47,167
2,927,267
611,425
(23,513)
6,797
(12,732)
8,530
(19,287)
(40,205)
(29,492)
7,477
(83,814)
(43,636)
(16,466)
(165,931)
(29,532)
7,692
2,318
3,738
(19,010)
(34,794)
(195,942)
56,642
(106,100)
71,083
(160,725)
(335,042)
33,166
(165,155)
6,688
276,383
16,931
(657)
16,274
19,704
(87,378)
(67,674)
21,784
(13,258)
8,526
141,091
(5,475)
135,616
16,892
(97,481)
(1,838)
140,767
13,420
¥ 30,312
(18,937)
¥(116,418)
16,874
¥ 15,036
Yen
Basic earnings (loss) per 100 shares (Note 2) .....................
Diluted earnings (loss) per 100 shares (Note 2) ................
See accompanying notes.
60
Marubeni Corporation 2003
¥ 2,030
¥ 1,896
¥ (7,792)
¥ (7,792)
111,833
$ 252,600
U.S. Dollars
¥ 1,006
¥
940
$
$
16.92
15.80
Consolidated Statements of Changes in Shareholders’ Equity
Marubeni Corporation
Years ended March 31, 2003, 2002 and 2001
Millions of Yen
Common stock:
Balance at beginning of year ........
Balance at end of year ...................
Additional paid-in capital:
Balance at beginning of year ........
Transfer to retained earnings
(accumulated deficit)
(Note 11) .........................................
Balance at end of year ...................
Retained earnings
(accumulated deficit):
Balance at beginning of year ........
Net income (loss) ...........................
Transfer from additional
paid-in capital (Note 11) ..............
Balance at end of year ...................
Accumulated other
comprehensive loss (Note 12):
Balance at beginning of year ........
Effect of change in accounting
standard (Note 2) ..........................
Unrealized (losses) gains on
investment securities, net of
reclassification (Note 3) ...............
Currency translation adjustments,
net of reclassification ...................
Unrealized losses on derivatives ......
Minimum pension liability
adjustment (Note 9) ......................
Other comprehensive (loss)
income, net of tax .........................
Comprehensive (loss) income ......
Balance at end of year ...................
Cost of common stock in treasury:
Balance at beginning of year ........
Treasury stock
(repurchased) sold .......................
Balance at end of year ...................
Thousands of U.S. Dollars (Note 1)
2002
2003
2001
¥ 194,039
¥ 194,039
¥ 194,039
¥ 194,039
¥194,039
¥194,039
$ 1,616,992
$ 1,616,992
¥ 216,993
¥ 216,993
¥216,993
$ 1,808,275
(129,228)
¥ 87,765
–
¥ 216,993
–
¥216,993
(1,076,900)
$ 731,375
¥ (94,754)
30,312
¥ 30,312
¥ 21,664
(116,418)
¥
¥(116,418)
6,628
15,036
¥ 15,036
$ (789,617)
252,600
129,228
¥ 64,786
–
¥ (94,754)
–
¥ 21,664
$
¥ (52,375)
¥ (90,398)
¥(93,357)
$ (436,459)
1,426
–
(34,066)
1,076,900
539,883
–
–
14,628
(37,568)
(72,908)
(20,854)
(4,101)
24,137
(2,141)
10,362
–
(173,783)
(34,175)
(362)
(27)
30,165
(3,017)
38,023
(34,066)
¥ (3,754)
38,023
¥ (78,395)
2,959
2,959
¥ 17,995
(283,883)
¥ (86,441)
¥ (52,375)
¥(90,398)
$ (720,342)
¥
(8)
¥
(1)
¥
(2)
$
(67)
¥
(90)
(98)
¥
(7)
(8)
¥
1
(1)
$
(749)
(816)
Millions of Yen
2001
2003
¥(43,951)
$ (158,633)
10,287
(8,749)
38,383
¥ 14,628
6,383
¥(37,568)
$
¥ (27,252)
¥ 22,298
¥ 13,688
$ (227,100)
¥
1,839
6,398
(3,326)
85,725
(72,908)
53,317
¥ (20,854)
¥ 24,137
¥ 10,362
$ (173,783)
¥
¥
¥
$
–
(4,618)
517
¥
(4,101)
¥
1,426
–
–
(3,411)
–
(38,483)
1,270
–
4,308
(715)
(283,883)
$ (31,283)
Thousands of U.S. Dollars (Note 1)
2002
¥ (23,755)
¥ (19,036)
$ 252,600
(8,749)
2003
Disclosure of reclassification
amount for the year ended:
Unrealized (losses) gains on
investment securities arising
during the period .........................
Less: reclassification adjustments
for losses (gains) included in
net income (loss) ..........................
Net unrealized (losses) gains .......
Currency translation adjustments
arising during period–
(losses) gains .................................
Less: reclassification adjustments
for losses (gains) included in
net income (loss) ..........................
Net currency translation
adjustments ..................................
Effect of change in
accounting standard ....................
Unrealized losses on derivatives
arising during the period ...........
Less: reclassification adjustments
for losses included in
net income (loss) ..........................
Net unrealized losses on
derivatives ....................................
2003
¥
–
$
(34,175)
See accompanying notes.
Marubeni Corporation 2003
61
Consolidated Statements of Cash Flows
Marubeni Corporation
Years ended March 31, 2003, 2002 and 2001
Thousands of
U.S. Dollars
(Note 1)
Millions of Yen
Operating activities
Net income (loss) ......................................................................
Adjustments to reconcile net income (loss) to net cash
provided by operating activities:
Depreciation and amortization ...........................................
Provision for doubtful accounts .........................................
Equity in (earnings) losses of affiliated companies,
less dividends received ......................................................
Loss (gain) on investment securities ..................................
(Gain) loss on property and equipment ............................
Deferred income taxes .........................................................
Changes in operating assets and liabilities:
Notes and accounts receivable .......................................
Inventories .........................................................................
Advance payments to suppliers and prepaid
expenses and other current assets ................................
Prepaid pension cost ........................................................
Notes, acceptances and accounts payable .....................
Advance payments received from customers and
accrued expenses and other current liabilities ...........
Income taxes ......................................................................
Other .....................................................................................
Net cash provided by operating activities ............................
Investing activities
Proceeds from sales and redemptions of securities and
other investments ...................................................................
Purchases of securities and other investments .....................
Proceeds from sales of property and equipment and
property leased to others .......................................................
Purchases of property and equipment and property
leased to others .......................................................................
Collection of loans receivable .................................................
Loans made to customers ........................................................
Other .........................................................................................
Net cash provided by investing activities .............................
Financing activities
Net decrease in short-term loans ............................................
Proceeds from long-term debt ................................................
Payments of long-term debt ....................................................
(Purchase) sale of treasury stock ............................................
Other .........................................................................................
Net cash used in financing activities .....................................
Effect of exchange rate changes on cash and
cash equivalents .........................................................................
Net (decrease) increase in cash and cash equivalents ..........
Cash and cash equivalents at beginning of year ...................
Cash and cash equivalents at end of year ...............................
Supplemental cash flow information:
Cash paid during the year for:
Interest ....................................................................................
Income taxes ..........................................................................
Non-cash investing activities:
Exchange of assets:
Fair value of assets received ............................................
Carrying value of assets surrendered ............................
Contribution to joint venture:
Carrying value of stocks received ..................................
Carrying value of assets contributed .............................
Carrying value of liabilities contributed .......................
Contribution of securities to employee
retirement benefit trusts ....................................................
See accompanying notes.
62
Marubeni Corporation 2003
2003
2002
2001
¥ 30,312
¥(116,418)
¥ 15,036
2003
$
252,600
63,665
5,660
71,052
43,936
69,914
37,916
530,542
47,167
(5,555)
12,732
(8,530)
(657)
31,647
83,814
43,636
(87,378)
(6,740)
(2,318)
(3,738)
(13,258)
(46,292)
106,100
(71,083)
(5,475)
76,603
15,637
291,263
35,970
64,461
20,495
638,358
130,308
(1,062)
(8,819)
(13,898)
(58,369)
(9,322)
(148,059)
5,678
(84,507)
55,801
(8,850)
(73,492)
(115,817)
19,155
3,996
5,549
194,788
13,066
(162)
3,780
198,456
23,354
(15,923)
13,134
179,305
108,092
(82,796)
224,832
(158,546)
283,634
(133,590)
900,767
(689,967)
47,783
19,432
65,830
398,192
(59,663)
165,363
(61,523)
(4,015)
113,241
(76,783)
114,806
(58,879)
9,642
74,504
(95,430)
148,999
(56,724)
(24,726)
187,993
(497,192)
1,378,025
(512,692)
(33,458)
943,675
(53,423)
368,218
(609,920)
(90)
1,214
(294,001)
(29,498)
509,708
(632,830)
(5)
2,521
(150,104)
(150,052)
374,323
(680,791)
1
394
(456,125)
(445,192)
3,068,483
(5,082,667)
(750)
10,118
(2,450,008)
159,625
33,300
46,242
1,623,233
(14,159)
(131)
466,642
¥ 466,511
13,975
136,831
329,811
¥ 466,642
13,330
(75,497)
405,308
¥ 329,811
(117,991)
(1,091)
3,888,683
$ 3,887,592
¥ 52,864
12,935
¥ 82,460
19,866
¥ 108,358
37,707
$
30,270
24,239
48,660
47,148
23,039
28,005
252,250
201,992
–
–
–
25,495
201,990
176,495
–
–
–
–
–
–
8,746
–
–
72,883
440,533
107,792
Notes to Consolidated Financial Statements
Marubeni Corporation
Years ended March 31, 2003, 2002 and 2001
1. Basis of Financial Statements
Marubeni Corporation (the “Company”), a Japanese corporation,
maintains its books and records and prepares its financial
statements in Japanese yen. The accompanying consolidated
financial statements differ from the non-consolidated financial
statements issued for domestic purposes in Japan. In addition to
consolidation, they reflect certain adjustments not recorded on
the Company’s books, which in the opinion of management are
appropriate to present the Company’s financial position, results
of operations, and cash flows in accordance with accounting
principles generally accepted in the United States of America.
The principal adjustments are: (1) recognition of installment sales
on the accrual basis, (2) recognition of the value ascribed to
warrants, (3) accounting for pension costs, (4) accounting for
certain investments in debt and marketable equity securities,
(5) deferred gain on sales of property for tax purposes, (6) accounting for long-lived assets, (7) accounting for derivative
instruments and hedging activities, and (8) accounting for saleleaseback of real estate.
Certain reclassifications have been made in the 2002 and 2001
financial statements to conform to the presentation for 2003.
The translation of Japanese yen amounts into U.S. dollar
amounts for the year ended March 31, 2003 is included solely for
the convenience of readers outside of Japan and has been made
at ¥120 to $1, the exchange rate prevailing on March 31, 2003.
The translation should not be construed as a representation that
the Japanese yen amounts could be converted into U.S. dollars at
this or any other rate.
2. Significant Accounting Policies
Consolidation
Cash equivalents
The consolidated financial statements of the Company include
the accounts of domestic and foreign subsidiaries (together, the
“Companies”). Significant intercompany transactions and
accounts have been eliminated. When a subsidiary sells stock to
unrelated third parties, the Company’s shareholdings in the
subsidiary decreases while the price per share increases or
decreases, depending on the price of the new stock issued. The
Companies recognize such a change in the price per share as a
gain or loss at the time of the sale of stock.
In January 2003, the Financial Accounting Standards Board
(“FASB”) issued Interpretation (“Interpretation”) No. 46,
Consolidation of Variable Interest Entities. Interpretation No.46
requires the consolidation of variable interest entities in which
the Company absorbs a majority of the entity’s expected losses,
receives a majority of the entity’s expected residual returns, or
both, as a result of ownership, contractual or other financial
interests in the entity. Interpretation No.46 applies immediately
to variable interest entities created after January 31, 2003, and to
variable interest entities in which the Company obtains an
interest after that date. The adoption of Interpretation No.46 for
such entities did not have a material impact on the Company’s
financial position and results of operations. Interpretation No.46
will also apply in interim period beginning July 1, 2003, to
variable interest entities in which the Company holds a variable
interest that it acquired before February 1, 2003, and the
Company is currently reviewing the impact on the Company’s
financial position and results of operations.
The Companies considers deposits in banks and securities
purchased under resale agreements with an original maturity of
three months or less to be cash equivalents.
Use of estimates
Available-for-sale securities
Marketable equity securities not classified as trading and debt
securities not classified as trading or held-to-maturity are
classified as available-for-sale securities and are carried at fair
value, with the unrealized gains and losses, net of taxes,
reported in accumulated other comprehensive loss in shareholders’ equity. The amortized cost of debt securities in this
category is adjusted for the amortization of premiums and
accretion of discounts to maturity. Such amortization and
accretion are included in interest income. Realized gains and
The preparation of financial statements in conformity with
accounting principles generally accepted in the United States of
America requires management to make estimates and assumptions that affect the amounts reported in the financial statements
and accompanying notes. Although the actual results could
differ from those estimates, management does not believe that
any differences would materially affect the consolidated financial
statements of the Company.
Investment securities
Management determines the appropriate classification of
investment securities as either trading, held-to-maturity or
available-for-sale securities at the date of purchase in accordance
with Statement of Financial Accounting Standards No. 115,
Accounting for Certain Investments in Debt and Equity Securities.
Trading securities
Trading securities are held for resale in anticipation of short-term
market movements. Trading securities, consisting primarily of
marketable equity securities, are stated at fair value. Gains and
losses are included in (loss) gain on investment securities.
Held-to-maturity securities
Debt securities are classified as held-to-maturity when the
Companies have the positive intent and ability to hold the
securities to maturity. Held-to-maturity securities are stated at
amortized cost, adjusted for amortization of premiums and
accretion of discounts to maturity. Such amortization and
accretion are included in interest income. Interest on securities
classified as held-to-maturity is included in interest income.
Declines in fair value judged to be other than temporary on heldto-maturity securities are included in (loss) gain on investment
securities.
Marubeni Corporation 2003
63
losses and declines in fair value judged to be other than
temporary on available-for-sale securities are included in (loss)
gain on investment securities. The average cost of securities
sold is used in the determination of realized gains or losses.
Interest and dividends on investment securities classified as
available-for-sale are included in interest income and dividend
income, respectively.
Inventories
Inventories, which primarily consist of commodities, merchandise and real estate held for sale, are stated at the lower of cost
(primarily specific or moving average cost) or market (generally
replacement cost). Inventories included real estate for sale of
¥115,140 million ($959,500 thousand) and ¥131,836 million at
March 31, 2003 and 2002, respectively.
Investments
The Companies’ investments in affiliated companies are stated at
cost, adjusted for equity in their undistributed earnings or
accumulated losses since acquisition. Other investments are
stated at cost, adjusted for any declines in value judged to be
other than temporary.
Loans and allowance for doubtful accounts
Loans including accounts receivable are stated at cost.
In evaluating the credit risk relating to loans, the Companies
categorize them based on the potential exposures for credit
ratings of debtors, geographical and other considerations.
When a loan is impaired, the allowance for credit losses is
determined based on discounted cash flows using the loans’
initial effective interest rate or the fair value of the collateral for
certain collateral dependent loans. For other loans, the allowance for credit losses is determined based on a historical bad
debt ratio by the credit risk category. When loans are legally or
contractually determined to be uncollectible, the loans are offset
against their respective allowances.
Cash received on impaired loans is either applied against the
principal of such loans or reported as interest income, based on
management’s judgment with regard to the collectibility of the
principal. The Companies discontinue the accrual of interest
when loans are past due for a period of six months or more. The
accrual of interest is resumed when agreements for rescheduling
of payment is made and receipt of interest is probable.
Loans ninety days past due are noted as delinquent and
monitored for collectibility.
Leases
The Companies leases vessels, buildings and equipment to
customers and other third parties. Finance leases are included in
current and non-current accounts receivable in the consolidated
balance sheet. Operating leases are presented separately as
property leased to others in the consolidated balance sheet.
Depreciation
Depreciation of property and equipment (including property
leased to others) is determined by the declining-balance or the
straight-line method (primarily for buildings) at rates based on
the estimated useful lives of the respective assets, which are from
2 to 50 years.
Long-lived assets other than goodwill and
other intangible assets
Long-lived assets held and used are evaluated for impairment
and written down to their fair value if the sum of their expected
future cash flows is less than the carrying amount of the assets.
Long-lived assets to be disposed of are reported at the lower of
the carrying amount or fair value less cost to sell.
64
Marubeni Corporation 2003
Goodwill and other intangible assets
Effective April 1, 2002, the Companies adopted Statement of
Financial Accounting Standards No. 142,Goodwill and Other
Intangible Assets (SFAS142). SF AS142 pr ohibits the amortization
of goodwill and intangible assets with indefinite useful lives.
SFAS142 r equires that these assets be reviewed for impairment
at least annually. Intangible assets with finite lives will continue
to be amortized over their estimated useful lives. Additionally,
SFAS142 r equires that goodwill included in the carrying value of
equity method investments no longer be amortized. The
Companies test goodwill for impairment using the two-step
process prescribed in SFAS142. The first step is a scr een for
potential impairment, while the second step measures the
amount of the impairment, if any.
Guarantees
Effective on January 1, 2003, the Companies adopted the
Financial Accounting Standards Board (“FASB”) Interpretation
(“Interpretation”) No.45, Guarantor’s Accounting and Disclosure
Requirements for Guarantees, Including Indirect Guarantees of
Indebtedness of Others. As a result of adopting Interpretation
No.45, the Companies r ecognizes, at the inception of a guarantee, a liability for the fair value of the obligation undertaken in
issuing the guarantee, issued or modified after December 31,
2002, while the previous accounting for guarantees continues to
be applied for guarantees issued before January 1, 2003. The
adoption of Interpretation No.45 did not have a material impact
on the Company’s financial position and results of operations.
Trading transactions and revenue recognition
The trading transactions undertaken by the Companies take
many forms and consist of those in which the Companies act as
principal and those in which the Companies act as agent. In
agency transactions, payment for goods is made directly by the
purchaser to the supplier. The total volume of trading transactions includes the sales value of all transactions in which the
Companies participate, regardless of the form of such transaction, based on the practice of the Japanese trading companies.
Gross trading profit principally consists of gross profit on sales
transactions and commissions on agency transactions. Shipping
and handling costs are included in determining the gross
trading profit.
In acting as principal, the Companies recognize gross trading
profit when the delivery conditions are met. These conditions are
considered to have been met when the goods are received by the
customer or title to securities such as bills of lading are transferred to the customer. In acting as agent, the Companies
recognize gross trading profit when contracted services are fully
rendered to the customers.
Other income (expenses)
Other-net in other income (expenses) includes losses incurred in
liquidating subsidiaries and affiliated companies of ¥12,542
million ($104,517 thousand), ¥16,669 million and ¥9,233 million
for the years ended March 31, 2003, 2002 and 2001, respectively.
Derivative instruments and hedging activities
Effective April 1, 2001, the Companies adopted Statement No.
133 of Financial Accounting Standards Board (FASB), Accounting
for Derivative Instruments and Hedging Activities (SFAS 133), as
amended. SFAS133 r equires the Companies to recognize all
derivative instruments on the consolidated balance sheet at fair
value. Derivatives that are not hedges must be adjusted to fair
value through income. If the derivative is a hedge, depending on
the nature of the hedge, changes in the fair value of derivatives
will either be offset against the change in value of the hedged
assets, liabilities, or firm commitments through earnings or
recognized in other comprehensive income until the hedged item
is recognized in earnings. The ineffective portion of the change in
fair value of a hedge will be immediately recognized in earnings.
For derivative and non-derivative financial instruments designated as hedging the foreign currency exposure of a net investment in foreign subsidiaries and affiliates, the gain or loss is
reported in other comprehensive income as part of the cumulative translation adjustment to the extent the hedges are effective.
Gains and losses related to the hedge ineffective portion and
related to the portion of hedging instruments excluded from the
assessment of hedge effectiveness are included in other income
(expenses) – net. The Companies expects to reclassify ¥1,413
million ($11,775 thousand) of net losses on derivative instruments from accumulated other comprehensive income to
earnings during the 12 months ending March 31, 2004, due to
actual export and import transactions or receipts and payments
of interest. The maximum length of time over which the
Companies are hedging its exposure to the variability in future
cash flows for forecasted transactions excluding those forecasted
transactions related to the payments of variable interest on
existing financial instruments is 16 months.
Earnings/loss per 100 shares of common
stock
The computation of basic earnings or loss per 100 shares of
common stock is based on the weighted average number of
shares of common stock outstanding during the year. The
computation of diluted earnings or loss per share is based on the
weighted average number of shares of common stock outstanding plus any potentially dilutive securities. For additional
disclosures regarding convertible debentures, refer to Note 8.
The following table sets forth the computation of basic and diluted earnings/loss per 100 shares:
Thousands of
U.S. Dollars
Millions of Yen
2003
2002
2001
2003
Numerator:
Net income (loss) (numerator for
basic earnings (loss) per 100 shares) ........................................ ¥
Effect of dilutive securities:
Convertible debentures ...........................................................
30,312
¥
(116,418)
¥
(116,418)
30,645
15,036
407
2,775
¥
15,443
$255,375
–
333
Numerator for diluted earnings (loss) per 100 shares ............ ¥
¥
$252,600
Denominator:
Denominator for basic earnings (loss) per 100 shares –
weighted average shares ...........................................................
Effect of dilutive securities:
Convertible debentures ...............................................................
1,493,495,279
1,493,990,899
1,494,018,855
123,151,564
–
148,869,326
1,616,646,843
1,493,990,899
1,642,888,181
Denominator for diluted earnings (loss) per 100 shares –
adjusted weighted average shares and
assumed conversions .................................................................
Yen
U.S. Dollars
Basic earnings (loss) per 100 shares ...............................................
¥2,030
¥(7,792)
¥1,006
$16.92
Diluted earnings (loss) per 100 shares ...........................................
¥1,896
¥(7,792)
¥ 940
$15.80
The convertible debentures issued in 1986 and redeemed in
2001 with a rate of 2.1%, issued in 1988 and redeemed in 2000
with a rate of 2.0% and issued in 1996 with a rate of 0.85% were
dilutive for the year ended March 31, 2001. Convertible debentures were antidilutive for the years ended March 31, 2002. The
convertible debentures issued in 1996 with a rate of 0.85% were
dilutive for the year ended March 31, 2003.
(“SFAS 143”), which is effective for fiscal years beginning after
June 15, 2002. SFAS 143 requires legal obligations associated
with the retirement of long-lived assets to be recognized at
their fair value at the time that the obligations are incurred.
Upon initial recognition of a liability, that cost should be
capitalized as part of the related long-lived asset and allocated
to expense over the useful life of the asset. The Companies will
adopt SFAS 143 on April 1, 2003, and, based on current
circumstances, does not believe that the impact of adoption of
SFAS 143 will have a material impact on the Company’s
financial position or results of operations.
Recently issued accounting standards
In June 2001, FASB issued Statement of Financial Accounting
Standards No. 143, Accounting for Asset Retirement Obligations
Marubeni Corporation 2003
65
3. Marketable Equity Securities and Debt Securities
The following is a summary of available-for-sale securities and held-to-maturity securities at March 31, 2003 and 2002:
Available-for-sale securities
Millions of yen
2002
2003
Gross
Unrealized
Gains
Cost
Gross
Unrealized
Losses
Gross
Gross
Unrealized Unrealized
Gains
Losses
Fair Value
¥
7,606
¥
6,865
¥
463
¥
(251)
¥
¥
¥
486
¥
(477)
¥ 11,827
Cost
Fair Value
Current:
Corporate bonds ........................ ¥
7,947
¥
19
¥
Non-current:
Corporate bonds ........................ ¥
7,205
¥
252
¥
(360)
7,077
7,457
¥ 11,818
Other debt securities .................
2
–
(1)
1
39
–
(1)
38
Total debt securities ..............
Marketable equity securities ....
7,207
124,353
252
17,068
(1)
(28,832)
7,458
112,589
11,857
161,362
486
30,406
(478)
(27,284)
11,865
164,484
Total ........................................ ¥ 131,560
¥ 17,320
¥ (28,833)
¥ 120,047
¥173,219
¥30,892
¥(27,762)
¥176,349
–
Thousands of U.S. dollars
2003
Cost
Current:
Corporate bonds ........................ $
Gross
Unrealized
Gains
158
Gross
Unrealized
Losses
Fair Value
$ (3,000)
$
63,383
$
$
62,142
8
66,225
$
60,042
16
$ 2,100
–
60,058
1,036,275
2,100
142,234
(8)
(240,267)
62,150
938,242
Total ........................................ $1,096,333
$144,334
$(240,275)
$1,000,392
Non-current:
Corporate bonds ........................ $
Other debt securities .................
Total debt securities ..............
Marketable equity securities ....
–
(8)
Held-to-maturity securities
Millions of yen
2002
2003
Cost
Gross
Unrealized
Gains
Gross
Unrealized
Losses
Fair Value
Cost
Gross
Gross
Unrealized Unrealized
Gains
Losses
Fair Value
Current:
Corporate bonds ........................
Non-current:
Corporate bonds ........................
¥
5,502
¥ 46,120
¥
59
¥ 173
¥
–
¥ (3,398)
5,561
¥ 56,121
¥
1
¥ 42,895
¥ 58,484
¥
22
¥
Thousands of U.S. dollars
2003
Current:
Corporate bonds ........................
Cost
Gross
Unrealized
Gains
Gross
Unrealized
Losses
$45,850
$492
$
$384,333
$1,442
$(28,317)
–
Fair Value
$46,342
Non-current:
Corporate bonds ........................
66
Marubeni Corporation 2003
$357,458
¥
(2)
¥ 56,120
¥ (5,878)
¥ 52,628
In addition to the securities listed above, the Companies held
trading securities of ¥182 million ($1,517 thousand) and ¥751
million, which are equal to their fair value, as of March 31, 2003
and 2002, respectively. The net unrealized holding losses on
trading securities included in earnings for the years ended
March 31, 2003, 2002 and 2001 amounted to ¥5 million ($42
thousand), ¥75 million and ¥40 million, respectively.
The proceeds from sales of available-for-sale securities
amounted to ¥23,984 million ($199,867 thousand), ¥31,370 million
and ¥88,515 million for the years ended March 31, 2003, 2002 and
2001, respectively. Gross realized gains on sales of available-forsale securities totaled ¥9,356 million ($77,967 thousand), ¥13,274
million and ¥26,559 million, and gross realized losses totaled
¥846 million ($7,050 thousand), ¥2,892 million and ¥1,349 million
for the years ended March 31, 2003, 2002 and 2001, respectively.
The Company contributed certain available-for-sale securities
to an employee retirement benefit trust at fair value of ¥8,746
million ($72,883 thousand) and recognized a loss of ¥1,611
million ($13,425 thousand), which is included in loss on investment securities for the year ended March 31, 2003.
The Companies wrote down certain investment securities
whose decline in value was considered to be other than temporary to their fair value. These write-downs amounted to ¥23,699
million ($197,492 thousand) and ¥77,820 million for the years
ended March 31, 2003 and 2002.
The amortized cost and estimated fair value of debt and
marketable equity securities at March 31, 2003 are summarized by
contractual maturity below. Expected maturities may differ from
contractual maturities because the issuers of certain securities have
the right to prepay obligations without prepayment penalties.
Available-for-sale securities
Cost
Fair Value
Cost
Millions of yen
Due in one year or less .......................................................................
Due after one year through five years .............................................
Due after five years ............................................................................
¥
3,643
9,882
1,629
Fair Value
Thousands of U.S. dollars
¥ 3,586
9,708
1,770
$
30,358
82,350
13,575
$
29,883
80,900
14,750
Total debt securities .......................................................................
15,154
15,064
126,283
Marketable equity securities .............................................................
124,353
112,589
1,036,275
938,242
¥139,507
¥127,653
$1,162,558
$1,063,775
Total
..............................................................................................
125,533
Held-to-maturity securities
Cost
Fair Value
Cost
Millions of yen
Due in one year or less .......................................................................
Due after one year through five years .............................................
Due after five years ............................................................................
Total
..............................................................................................
¥
Fair Value
Thousands of U.S. dollars
5,502
36,785
9,335
¥ 5,561
34,819
8,076
$
45,850
306,541
77,792
¥ 51,622
¥ 48,456
$ 430,183
$
46,342
290,158
67,300
$ 403,800
4. Affiliated Companies
Investments in and amounts due from affiliated companies at March 31, 2003 and 2002 consisted of the following:
Thousands of
U.S. dollars
Millions of yen
Investments in equity securities ....................................................................................
Long-term receivables .....................................................................................................
2003
2002
2003
¥271,847
92,801
¥220,829
63,115
$2,265,392
773,341
¥364,648
¥283,944
$3,038,733
The financial information of affiliated companies at March 31, 2003 and 2002 and for the years ended March 31, 2003, 2002 and 2001,
is summarized as follows:
Millions of yen
Thousands of
U.S. dollars
2003
2002
2003
Total assets ........................................................................................................................
Total liabilities ..................................................................................................................
¥3,479,882
2,855,211
¥4,268,927
3,686,526
$28,999,017
23,793,425
Net assets ..........................................................................................................................
¥ 624,671
¥ 582,401
$5,205,592
Thousands of
U.S. dollars
Millions of yen
Net sales ...............................................................................................
Net income ...........................................................................................
2003
2002
2001
2003
¥5,840,322
58,711
¥4,552,961
2,425
¥3,084,618
43,169
$48,669,350
489,258
Marubeni Corporation 2003
67
The Company’s sales to and purchases from affiliated companies for the years ended March31, 2003, 2002 and 2001 wer e as follows:
Thousands of
U.S. dollars
Millions of yen
2003
2002
2001
2003
Sales ......................................................................................................
¥458,504
¥421,275
¥445,241
$3,820,867
Purchases .............................................................................................
442,467
555,948
608,587
3,687,225
The unamortized balance of the difference between the cost of
investment in affiliated companies and the Company’s equity in
the net assets at the dates of acquisition amounted to ¥8,434
million ($70,283 thousand) at March 31, 2003. The difference was
not significant at March 31, 2002.
Certain investments in the common stock of affiliated
companies are marketable equity securities, which have carrying
values of ¥41,162 million ($343,017 thousand) and ¥26,151
million at March 31, 2003 and 2002, respectively, with corresponding aggregate quoted market values of ¥39,336 million
($327,800 thousand) and ¥20,340 million.
5. Loans and Allowance for Doubtful Accounts
The changes in the allowance for doubtful accounts are summarized as follows:
Thousands of
U.S. dollars
Millions of yen
Balance at beginning of year .............................................................
Provision ..........................................................................................
Charge-offs ......................................................................................
Other ................................................................................................
2003
2002
2001
2003
¥149,554
5,660
(7,999)
¥129,726
43,936
(19,538)
¥142,012
37,916
(51,304)
$1,246,283
47,167
(66,658)
(4,685)
(4,570)
¥149,554
1,102
¥129,726
(39,042)
Balance at end of year ........................................................................
¥142,530
At March 31, 2003 and 2002, the recorded investments in loans
that are considered to be impaired under SFAS1 14 were ¥295,065
million ($2,458,875 thousand) and ¥307,602 million, respectively,
and the allowance for credit losses related to those loans were
¥126,577 million ($1,054,808 thousand) and ¥130,990 million,
respectively. The recorded investment in the impaired loans, net
of the valuation allowance, is either secured by collateral or
believed to be collectible. The average recorded investments in
impaired loans were ¥300,570 million ($2,504,750 thousand),
¥269,583 million and ¥214,609 million for the years ended March
31, 2003, 2002 and 2001, respectively. The Companies generally
recognize interest income on impaired loans on a cash basis,
which was not significant for the years ended March 31, 2003,
2002 and 2001.
The recorded investment in loans on nonaccrual status was
¥131,581 million ($1,096,508 thousand) at March 31, 2003, and the
recorded investment in loans past due of ninety days and still
accruing interest was not significant at March 31, 2003.
The aggregated amount of losses on sales of loans was ¥1,790
million ($14,917 thousand) for the year ended March 31, 2003.
$1,187,750
6. Long-Lived Assets and Goodwill
The gross carrying amounts and accumulated amortization of intangible assets as of March 31, 2003 are as follows:
Millions of yen
Gross
carrying
amount
Accumulated
amortization
Net book
value
Mining and operating rights ......................................................................................
Software ........................................................................................................................
Additional minimum liability ...................................................................................
¥32,080
19,361
4,720
¥(10,532)
(10,611)
(1,688)
¥21,548
8,750
3,032
Other .............................................................................................................................
Unamortized intangible assets:
Land rent rights ...........................................................................................................
9,481
(4,323)
5,158
2,953
–
Other .............................................................................................................................
795
–
Amortized intangible assets:
¥69,390
68
Marubeni Corporation 2003
¥(27,154)
2,953
795
¥42,236
Thousands of U.S. dollars
Gross
carrying
amount
Accumulated
amortization
Amortized intangible assets:
Mining and operating rights ......................................................................................
$267,334
Software ........................................................................................................................
Additional minimum liability ...................................................................................
Other .............................................................................................................................
161,342
39,333
79,008
Unamortized intangible assets:
Land rent rights ...........................................................................................................
Other .............................................................................................................................
24,608
6,625
Net book
value
$(87,767)
$179,567
(88,425)
(14,066)
(36,025)
72,917
25,267
42,983
–
–
$578,250
24,608
6,625
$(226,283)
$351,967
The amount of the residual value of the amortized intangible assets is not significant.
The amortization expense of intangible assets was ¥7,263 million ($60,525 thousand) for the year ended March 31, 2003. The estimated
amortization expense for the next five years is as follows:
Millions of yen
Thousands of
U.S. dollars
2004 ...........................................................................................................................................................
2005 ...........................................................................................................................................................
2006 ...........................................................................................................................................................
¥6,196
5,335
3,817
$51,633
44,458
31,808
2007 ...........................................................................................................................................................
2008 ...........................................................................................................................................................
2,698
1,826
22,483
15,217
Millions of yen
Thousands of
U.S. dollars
¥17,393
8,555
(2,050)
$144,941
71,292
(17,083)
For the year ending March 31
The changes in the carrying amount of goodwill for the year ended March 31, 2003, are as follows:
Balance at beginning of year ......................................................................................................................
Goodwill acquired during the year ..........................................................................................................
Impairment losses ........................................................................................................................................
Effect of exchange rate and other ..............................................................................................................
(345)
Balance at end of year .................................................................................................................................
As a result of decreases in the estimated future cash flows due
to the worsened business circumstance and conditions and
changes in the operating styles, the companies recognized
impairment losses of ¥2,050 million ($17,083 thousand) in the
Transportation and industrial machinery and Chemical segments
(2,875)
¥23,553
$196,275
of ¥200 million ($1,667 thousand) and ¥1,850 million ($15,417
thousand), respectively, for the year ended March 31, 2003. The
fair value of the reporting unit was estimated using the expected
present value of future cash flows.
The reconciliation of net income (loss) and earnings (loss) per 100 shares from reported amounts to amounts adjusted for amortization made in the prior years is as follows:
Millions of yen
2003
Thousands of U.S. dollars
2002
2001
2003
¥(116,418)
¥15,036
$252,600
802
–
¥15,838
$252,600
2002
2001
$(970,150)
$125,300
Reported net income (loss) .............................
¥30,312
Add back: Goodwill amortization ............
–
Adjusted net income (loss) .............................
¥30,312
¥(114,805)
2003
2002
2001
2003
2002
Reported earnings (loss) per 100 shares ...
Goodwill amortization ...........................
¥ 2,030
–
¥ (7,792)
108
¥ 1,006
54
$ 16.92
–
$ (64.93)
0.90
$
8.38
0.45
Adjusted earnings (loss) per 100 shares ...
¥ 2,030
¥ (7,684)
¥ 1,060
$ 16.92
$ (64.03)
$
8.83
1,613
Yen
13,442
$(956,708)
6,683
$131,983
U.S. dollars
2001
Basic earnings-per-share:
Marubeni Corporation 2003
69
Yen
U.S. dollars
2003
2002
Diluted earnings-per-share:
Reported earnings (loss) per 100 shares ...
Goodwill amortization ...........................
¥ 1,896
–
¥ (7,792)
108
¥
Adjusted earnings (loss) per 100 shares ...
¥ 1,896
¥ (7,684)
¥
Due to decreases in expected future cash flows below their
carrying amounts, the Company and certain of its subsidiaries
recognized impairment losses primarily on their commercial and
residential real estate leased to others in the total amount of
¥41,835 million, which is included in gain (loss) on property and
2001
2003
2002
2001
940
49
$ 15.80
–
$ (64.93)
0.90
$
7.83
0.41
989
$ 15.80
$ (64.03)
$
8.24
equipment on the consolidated statement of operations, for the
year ended March 31, 2002. The segment affected by the
impairment losses was primarily Development and construction.
The amount of impairment losses for the year ended March 31,
2003 was immaterial.
7. Pledged Assets
The following table summarizes assets pledged as collateral for the Company’s obligations at March 31, 2003 and 2002:
Thousands of
U.S. dollars
Millions of yen
2002
2003
Time deposits ...................................................................................................................
Investment securities, securities and other investments and investments in
affiliated companies ......................................................................................................
Notes, loans and accounts receivable – trade (current and non-current) ...............
Inventories ........................................................................................................................
Property leased to others, net of accumulated depreciation .....................................
Property and equipment, net of accumulated depreciation .....................................
Other assets ......................................................................................................................
¥ 1,164
¥
1,419
94,073
22,357
26,683
20,179
139,910
3,937
¥308,303
164,106
37,080
28,184
19,794
177,209
8,682
¥436,474
2003
$
9,700
783,942
186,308
222,358
168,158
1,165,917
32,809
$2,569,192
The obligations secured by such collateral were as follows:
Thousands of
U.S. dollars
Millions of yen
Short-term loans ..............................................................................................................
Other current assets .........................................................................................................
Long-term debt ................................................................................................................
Financial guarantees .......................................................................................................
Guarantees of contracts, etc. ..........................................................................................
In addition, acceptances payable at March 31, 2003 and 2002 were
secured by trust receipts on inventories, the standard terms of which
provide that the proceeds from the sales of any such collateral be
delivered to the respective bank to be applied against outstanding
acceptances. However, the Companies has, in general, followed the
practice of paying acceptances on their maturity dates. Given the
substantial volume of the Company’s transactions, it would not be
practicable to determine the total amount of inventories and/or
2003
2002
2003
¥19,444
3,760
56,581
–
7,546
¥87,331
¥26,641
$162,033
31,333
471,508
–
62,884
$727,758
–
116,114
24,794
8,174
¥175,723
proceeds from the sales of such inventories covered by outstanding
trust receipts.
As is customary in Japan, security, if requested by a lending
bank, must be given and the bank has the right to offset cash
deposited with it against any debt or obligations that become due
and, in the case of default or certain other specified events, against
all debt payable to the bank. To date, no such request has been
made to the Companies and no such rights have been exercised.
8. Short-Term Loans and Long-Term Debt
Short-term loans at March 31, 2003 and 2002 consisted of:
Thousands of
U.S. dollars
Millions of yen
Short-term loans from banks and others .................................................................
Commercial paper .......................................................................................................
2003
2002
2003
¥548,439
12,700
¥719,254
–
$4,570,325
105,833
¥561,139
¥719,254
$4,676,158
The weighted average interest rates on short-term loans outstanding at March 31, 2003 and 2002 were 0.63% and 0.60%, respectively.
70
Marubeni Corporation 2003
Long-term debt at March 31, 2003 and 2002 consisted of:
Thousands of
U.S. dollars
Millions of yen
2002
2003
4.0% reverse dual currency notes due 2005 .................................................................
2.8% notes due 2002 ........................................................................................................
3.0% notes due 2002 ........................................................................................................
2.0% notes due 2002 ........................................................................................................
2.0% notes due 2003 ........................................................................................................
2.0% notes due 2003 ........................................................................................................
2.12% notes due 2004 ......................................................................................................
1.6% notes due 2002 ........................................................................................................
2.0% notes due 2003 ........................................................................................................
2.0% notes due 2003 ........................................................................................................
2.5% notes due 2004 ........................................................................................................
2.3% notes due 2004 ........................................................................................................
1.5% notes due 2002 ........................................................................................................
2.0% notes due 2003 ........................................................................................................
2.0% notes due 2003 ........................................................................................................
2.0% notes due 2003 ........................................................................................................
2.37% notes due 2004 ......................................................................................................
2.13% notes due 2005 ......................................................................................................
1.52% notes due 2004 ......................................................................................................
1.75% notes due 2008 with prepayment options ........................................................
1.2% notes due 2004 ........................................................................................................
1.48% notes due 2006 ......................................................................................................
1.15% notes due 2005 ......................................................................................................
1.27% notes due 2006 ......................................................................................................
1.13% notes due 2006 ......................................................................................................
0.81% notes due 2004 ......................................................................................................
Libor + 0.73% notes due 2007 ........................................................................................
0.85% convertible debentures due 2006 .......................................................................
Medium-term notes due from 2002 to 2008 principally at rates from 0.1% to
4.4% or at floating rates ................................................................................................
Loans from government-owned banks and government agencies:
Secured, due serially through 2016 principally at rates from 1.1% to 6.7% ........
Unsecured, due serially through 2016 principally at rates from 0.3% to 6.4% ...
Loans principally from banks and insurance companies:
Secured, due serially through 2009 principally at rates from 1.5% to 8.0% ........
Unsecured, due serially through 2017 principally at rates from 0.1% to 8.6% ...
Other ...............................................................................................................................
Less current portion ....................................................................................................
To hedge against exposure related to the payment of interest
and the repayment of the principal of certain short-term loans
and long-term debt denominated in foreign currencies, the
Company and certain of its subsidiaries enter into foreign
exchange contracts.
To hedge against exposure to changes in interest rates and
foreign currency exchange rates, the Company and certain of its
subsidiaries enter into several interest rate swap agreements,
including interest rate and currency swap agreements. The
interest rate swap agreements primarily change the fixed interest
rates on the principal of certain short-term loans and long-term
debt into floating interest rates. The floating interest rates are, in
general, based upon the six-month or three-month LIBOR
(London Interbank Offered Rate). The interest rate swap
agreements are to remain in effect through the maturity dates of
¥
12,196
–
–
–
14,500
39,376
4,600
–
10,473
18,460
8,723
7,600
–
27,929
23,119
4,600
3,400
5,800
10,600
4,400
8,300
3,800
36,637
7,974
28,100
27,163
15,578
64,500
¥
16,491
37,500
10,000
30,000
14,500
39,541
4,900
32,137
10,594
18,878
9,700
7,900
14,100
28,200
23,119
4,600
4,700
8,000
11,300
5,000
8,700
4,200
37,047
10,000
28,100
28,100
18,484
68,890
2003
$
101,633
–
–
–
120,833
328,133
38,333
–
87,275
153,833
72,692
63,333
–
232,742
192,658
38,333
28,333
48,333
88,333
36,667
69,167
31,667
305,308
66,450
234,167
226,358
129,817
537,500
45,083
153,098
375,692
31,552
106,242
77,909
86,998
262,933
885,350
20,939
1,577,877
134,992
38,205
1,556,992
128,619
174,492
13,148,976
1,124,934
2,304,513
402,186
2,576,502
528,048
19,204,275
3,351,550
¥1,902,327
¥2,048,454
$15,852,725
the short-term loans and long-term debt.
The indentures covering the 0.85% convertible debentures due
2006 issued in November 1996 provide that (1) the holders may
convert the debentures into shares of common stock at the
conversion price of ¥539 ($4.49), and (2) the debentures are
redeemable at the option of the Company at prices ranging from
100% to 102% of the principal amounts after March 31, 2003.
During the year ended March 31, 2003, the Company entered
into a long-term line of credit arrangement of ¥152,000 million
($1,266,667 thousand) with a syndicate of certain financial
institutions and intends to refinance certain short-term loans and
current portion of long-term debt when due. Such short-term
loans and current portion of long-term debt totaling to ¥133,527
million ($1,112,725 thousand) are classified as long-term debt on
the consolidated balance sheet at March 31, 2003.
Marubeni Corporation 2003
71
Long-term debt subsequent to March 31, 2003 matures as follows:
Year ending March 31
Millions of yen
Thousands of
U.S. dollars
2004 ...........................................................................................................................................................
2005 ...........................................................................................................................................................
2006 ...........................................................................................................................................................
¥402,186
448,385
595,128
$3,351,550
3,736,542
4,959,400
2007 ...........................................................................................................................................................
2008 ...........................................................................................................................................................
Thereafter .................................................................................................................................................
221,911
139,830
497,073
1,849,258
1,165,250
4,142,275
Certain agreements principally with Government-owned
financial institutions provide that earlier repayment may be
required if, in the judgment of the lenders, the Company or
certain of its subsidiaries have achieved higher than expected
earnings or received sufficient proceeds from the issuance of
common stock or debentures to repay its loans. To date, none of
the lenders has made such a request.
Certain of the long-term debt agreements stipulate, among
other things, that the Companies, upon request, submit for the
lenders’ approval the proposed appropriations of income,
including dividends, before such appropriations can be submitted to the shareholders. The Companies has never received such
a request.
9. Employees’ Retirement Benefits
The Company and certain of its subsidiaries have unfunded
lump-sum retirement plans which, in general, cover all employees other than directors. In addition, the Company and certain of
its subsidiaries have contributory and non-contributory funded
pension plans with independent trustees covering eligible
employees. Under the terms of the lump-sum retirement plans,
eligible employees are entitled under most circumstances, upon
mandatory retirement or earlier voluntary severance, to indemnities based on their compensation as of the date of severance
and years of service.
Effective April 1, 1991, the Company amended its contributory funded pension plan to combine the plan with the pension
benefits normally provided under the Welfare Pension Insurance
Law of Japan. The combined welfare pension plan, in general,
covers all employees and provides for pension payments for life
commencing at age 60 or lump-sum payments upon severance.
At retirement, the Company’s employees are entitled to
benefits from both the lump-sum retirement plan and the
combined welfare pension plan. A larger portion of the total
benefits is paid from the combined welfare pension plan than
from the lump-sum retirement plan.
The Company contributes to the combined welfare plan
amounts which are determined by independent actuaries. The
plan assets primarily consist of Japanese government bonds,
corporate bonds and marketable equity securities.
During the years ended March 31, 2003 and 2002, the
Company contributed ¥22,246 million ($185,383 thousand) and
¥5,000 million, respectively, to a trust which was established to
provide pension benefits and is legally segregated from the
Company. This contribution was made to improve the funding
of the benefit plans.
For the year ended March 31, 2003, the Company applied to
the Japanese government for introduction of a cash balance plan
and reduction of retirement benefits for certain employees
effective April 1, 2003.
The reconciliation of beginning and ending balances of the projected benefit obligation and plan assets, and the funded status of the
Company’s and certain subsidiaries’ plans are as follows:
Thousands of
U.S. dollars
Millions of yen
2003
2002
2003
Change in projected benefit obligation
Projected benefit obligation at beginning of year .......................................................
¥252,218
¥248,238
$2,101,816
Service cost ...................................................................................................................
Interest cost ..................................................................................................................
Actuarial losses ............................................................................................................
8,417
7,371
19,139
10,165
7,380
2,066
70,142
61,425
159,492
Foreign currency exchange rate changes .................................................................
Benefits paid .................................................................................................................
Plan amendment ..........................................................................................................
(1,221)
(17,779)
(23,877)
1,599
(17,511)
281
(10,175)
(148,158)
(198,975)
244,268
252,218
Projected benefit obligation at end of year ..................................................................
72
Marubeni Corporation 2003
2,035,567
Thousands of
U.S. dollars
Millions of yen
2002
2003
2003
Change in plan assets
Fair value of plan assets at beginning of year .............................................................
Actual return on plan assets ......................................................................................
Foreign currency exchange rate changes .................................................................
Employees’ contributions ...........................................................................................
Employer’s contribution .............................................................................................
Benefits paid .................................................................................................................
228,890
(11,724)
(1,102)
706
26,082
(9,909)
227,623
(8,077)
1,567
787
15,887
(8,897)
1,907,417
(97,700)
(9,183)
5,883
217,350
(82,575)
Fair value of plan assets at end of year ........................................................................
Funded status ...................................................................................................................
Unrecognized net transition obligation being recognized over 15 years ................
Unrecognized prior service cost ....................................................................................
Unrecognized net loss .....................................................................................................
232,943
(11,325)
622
(18,417)
138,303
228,890
(23,328)
1,243
5,123
101,135
1,941,192
(94,375)
5,183
(153,475)
1,152,525
Net amount recognized ..................................................................................................
¥109,183
¥ 84,173
$ 909,858
Amounts recognized in the consolidated balance sheet consist of:
Prepaid benefit cost – current ....................................................................................
Prepaid benefit cost – noncurrent .............................................................................
Accrued benefit liability .............................................................................................
Intangible assets ..........................................................................................................
Accumulated other comprehensive income, before tax ........................................
¥ 1,642
113,005
(9,571)
3,032
1,075
¥
$
Net amount recognized ..................................................................................................
¥109,183
¥ 84,173
859
93,829
(12,893)
1,999
379
13,683
941,708
(79,758)
25,267
8,958
$ 909,858
The components of net pension expense of the Company’s and certain subsidiaries’ plans for the years ended March 31, 2003, 2002
and 2001 were as follows:
Thousands of
U.S. dollars
Millions of yen
2003
2002
2001
2003
Service cost – benefits earned during the year ...............................
Interest cost on projected benefit obligation ...................................
Expected return on plan assets .........................................................
Net amortization and deferrals ........................................................
Employees’ contributions ..................................................................
¥8,417
7,371
(7,782)
4,580
(706)
¥10,165
7,380
(7,579)
5,227
(787)
¥10,375
7,197
(4,882)
5,434
(899)
$70,142
61,425
(64,850)
38,166
(5,883)
Net pension expense ..........................................................................
¥11,880
¥14,406
¥17,225
$99,000
The aggregate projected benefit obligation and aggregate fair value of plan assets for pension plans with projected benefit obligations
in excess of plan assets are as follows:
Thousands of
U.S. dollars
Millions of yen
Aggregate projected benefit obligation ........................................................................
Aggregate fair value of plan assets ...............................................................................
2003
2002
2003
¥243,738
232,406
¥251,830
228,375
$2,031,150
1,936,717
The aggregate accumulated benefit obligation and aggregate fair value of plan assets for pension plans with accumulated benefit
obligations in excess of plan assets are as follows:
Thousands of
U.S. dollars
Millions of yen
Aggregate accumulated benefit obligation ..................................................................
Aggregate fair value of plan assets ...............................................................................
2003
2002
2003
¥20,287
10,716
¥30,635
17,742
$169,058
89,300
The discount rates and weighted average rates of increases in future salary levels used in determining the actuarial present value of
the projected benefit obligation and the expected long-term rates of return on plan assets for the years ended March 31, 2003, 2002 and
2001 were as follows:
Discount rates ...................................................................................................................
Weighted average rates of increases in future salary levels ......................................
Expected long-term rates of return on plan assets .....................................................
2003
2002
2001
2.5%
3.3%
3.0%
3.0%
3.3%
3.0%
3.0%
3.4%
3.5%
Marubeni Corporation 2003
73
10. Income Taxes
Effective the year ended March 31, 2003, the Company adopted the new the Japanese tax regulations allowing the Company to file a
consolidated tax return.
The significant components of deferred tax assets and deferred tax liabilities at March31, 2003 and 2002 wer e as follows:
Thousands of
U.S. dollars
Millions of yen
2003
Deferred tax assets:
Allowance for doubtful accounts ..............................................................................
2003
¥101,365
$ 691,542
Inventories ....................................................................................................................
Investment securities ..................................................................................................
Employees’ retirement benefits .................................................................................
7,468
52,574
5,892
6,924
37,748
6,432
62,233
438,117
49,100
Unrealized profit .........................................................................................................
Investments in affiliated companies .........................................................................
Net operating loss carryforwards .............................................................................
14,331
20,055
28,255
14,999
32,332
29,149
119,425
167,125
235,458
Other .............................................................................................................................
¥
82,985
27,432
17,266
228,600
Total deferred tax assets .................................................................................................
Valuation allowance ........................................................................................................
238,992
(28,284)
246,215
(45,371)
1,991,600
(235,700)
Net deferred tax assets ....................................................................................................
210,708
200,844
1,755,900
Deferred tax liabilities:
Property and equipment ............................................................................................
21,675
11,440
180,625
Undistributed earnings ..............................................................................................
Other .............................................................................................................................
3,923
6,137
2,797
6,844
32,692
51,141
Total deferred tax liabilities ...........................................................................................
31,735
21,081
264,458
Net deferred tax assets ....................................................................................................
¥178,973
¥179,763
$1,491,442
The net changes in the valuation allowance for deferred tax
assets were ¥17,087 million ($142,392 thousand) of decrease and
¥22,526 million of increase for the years ended March 31, 2003
and 2002, respectively.
At March 31, 2003, the Company and certain of its subsidiaries
have net operating loss carryforwards of ¥116,948 million
($974,567 thousand), of which ¥103,643 million ($863,692
thousand) will expire through 2022, and ¥13,305 million
($110,875 thousand) has no expiration date.
During March 2003, new tax legislation was enacted in Japan
which will reduce the Company’s and its domestic subsidiaries’
statutory income tax rate from 42% to 41% for fiscal years ending
after March 31, 2004. Deferred income tax balances have decreased
by ¥4,201 million ($35,008 thousand) to reflect the revised rates.
Realization of the Company’s net deferred tax assets is dependent on the Company generating sufficient taxable income or the
Company executing certain available tax strategies. Although
realization is not assured, management believes it is more likely
than not that the net deferred tax assets will be realized.
Taxes on income applicable to the Company would normally
result in a statutory tax rate of approximately 44% (including a
temporary surtax of 2%) and 42% for the years ended March 31,
2003 and 2002, respectively. A reconciliation of the statutory
income tax rate to the effective income tax rates expressed as a
percentage of income (loss) before income taxes and equity in
earnings (losses) of affiliated companies is as follows:
2003
Statutory income tax rate ................................................................................................
44.0%
2002
(42.0)%
2001
42.0%
Tax effect of subsidiaries’ operations ...........................................................................
Tax effect of permanent differences ..............................................................................
Difference in tax rates of foreign subsidiaries .............................................................
28.8
6.5
(15.1)
11.7
0.2
(0.8)
88.0
3.4
(31.5)
Tax effect on undistributed earnings of subsidiaries and other ...............................
Effect of tax rate change ..................................................................................................
Other ...............................................................................................................................
(23.5)
12.7
(4.3)
(12.8)
–
2.7
18.6
–
7.0
Effective income tax rates ...............................................................................................
74
2002
Marubeni Corporation 2003
49.1%
(41.0)%
127.5%
Total income taxes recognized for the years ended March 31, 2003, 2002 and 2001 are applicable to the following:
Thousands of
U.S. dollars
Millions of yen
2003
2002
2001
2003
Income (loss) before income taxes and equity in earnings (losses)
of affiliated companies .....................................................................
Equity in earnings (losses) of affiliated companies .......................
Other comprehensive income ...........................................................
¥16,274
6,486
(6,403)
¥(67,674)
(8,404)
10,693
¥8,526
(1,064)
1,570
$135,616
54,050
(53,358)
Total income taxes ..............................................................................
¥16,357
¥(65,385)
¥9,032
$136,308
No provision has been made for Japanese income taxes on the
undistributed earnings of the Company’s domestic subsidiaries
earned prior to March 31, 1993 or on the undistributed earnings
of the Company’s foreign subsidiaries which amounted to
¥98,635 million ($821,958 thousand) and ¥86,646 million at March
31, 2003 and 2002, respectively. The Company considers such
earnings to be permanently invested. Determination of the
amount of the related unrecognized deferred income tax liability
is not practicable.
11. Shareholders’ Equity
The amount of retained earnings available for dividends under
the Japanese Commercial Code (the “JCC”) is based on the
amount recorded on the Company’s books maintained in
accordance with Japanese accounting practices. The adjustments
included in the accompanying consolidated financial statements
but not recorded on the books, as explained in Note 1, have no
effect on the determination of retained earnings available for
dividends under the JCC.
Under the JCC, the amount of increased net assets due to the
unrealized gains is deducted from the net assets used in
determining retained earnings available for dividends. There
was no such an amount included in the retained earnings at
March 31, 2003.
The retained earnings available for dividends amounted to
¥5,548 million ($46,233 thousand) at March 31, 2003.
At the conversion price, 119,666,048 shares of common stock
were reserved at March 31, 2003 for conversion of the 0.85%
convertible debentures issued in 1996.
Effective October 1, 2001, the Company’s shares had no par
value, as prescribed by an amendment of the JCC.
The JCC requires that an amount equal to at least 10% of
cash dividends and other distributions from retained earnings
paid by the Company be appropriated as a legal reserve to the
extent that the total amount of additional paid-in capital and
the legal reserve equals 25% of the common stock. The
amounts of additional paid-in capital and the legal reserve
were ¥57,478 million ($478,983 thousand) and zero at March
31, 2003, respectively.
At the June 26, 2002 shareholders’ meeting of the Company,
the shareholders approved a proposal to eliminate the
Company’s accumulated deficit of ¥148,072 million ($1,233,933
thousand) by an adjustment to the additional paid-in capital of
¥129,228 million ($1,076,900 thousand) and legal reserve ¥18,844
million ($157,033 thousand), as permitted by the JCC. Since there
are no such laws or rules in the United States of America, the
accompanying consolidated financial statements reflect the
transaction in such a way as permitted under the JCC and
recorded in its statutory books. The balance of the consolidated
retained earnings (accumulated deficit) at March 31, 2003 would
be ¥64,442 million ($537,017 thousand) had the Company not
eliminated the accumulated deficit.
12. Other Comprehensive Income (Loss)
The amount of income tax expense or benefit allocated to each component of other comprehensive income (loss) for the years ended
March 31, 2003, 2002 and 2001 was as follows:
Millions of yen
Before-tax
amount
Tax (expense)
or benefit
Net-of-tax
amount
2003
Unrealized losses on investment securities arising during period ......................
Less: reclassification adjustments for income included in net income ................
¥(32,115)
17,438
¥13,079
(7,151)
¥(19,036)
10,287
Net unrealized loss ......................................................................................................
Currency translation adjustments arising during period .....................................
(14,677)
(26,053)
5,928
(1,199)
(8,749)
(27,252)
Less: reclassification adjustments for income included in net income ................
7,050
Net currency translation adjustments ......................................................................
Unrealized losses on derivatives arising during the period .................................
(19,003)
(6,966)
Less: reclassification adjustments for income included in net income ................
873
Net unrealized losses on derivatives ........................................................................
Minimum pension liability adjustment ...................................................................
(6,093)
(696)
Other comprehensive loss ..........................................................................................
¥(40,469)
(652)
(1,851)
2,348
(356)
1,992
334
¥6,403
6,398
(20,854)
(4,618)
517
(4,101)
(362)
¥(34,066)
Marubeni Corporation 2003
75
Thousands of U.S. dollars
2003
Unrealized losses on investment securities arising during period ......................
Before-tax
amount
Tax (expense)
or benefit
Net-of-tax
amount
$(267,625)
$108,992
$(158,633)
Less: reclassification adjustments for income included in net income ................
145,317
(59,592)
85,725
Net unrealized loss ......................................................................................................
Currency translation adjustments arising during period .....................................
Less: reclassification adjustments for income included in net income ................
(122,308)
(217,108)
58,750
49,400
(9,992)
(5,433)
(72,908)
(227,100)
53,317
Net currency translation adjustments ......................................................................
Unrealized losses on derivatives arising during the period .................................
Less: reclassification adjustments for income included in net income ................
(158,358)
(58,050)
7,275
(15,425)
19,567
(2,967)
(173,783)
(38,483)
4,308
Net unrealized losses on derivatives ........................................................................
(50,775)
16,600
(34,175)
Minimum pension liability adjustment ...................................................................
(5,800)
2,783
Other comprehensive loss ..........................................................................................
$(337,241)
$53,358
(3,017)
$(283,883)
Millions of yen
2002
Unrealized losses on investment securities arising during period ......................
Before-tax
amount
Tax (expense)
or benefit
Net-of-tax
amount
¥(40,891)
¥17,136
¥(23,755)
Less: reclassification adjustments for losses included in net loss ........................
66,100
(27,717)
38,383
Net unrealized gains ...................................................................................................
Currency translation adjustments arising during period .....................................
Less: reclassification adjustments for losses included in net loss ........................
25,209
22,766
2,826
(10,581)
(468)
(987)
14,628
22,298
1,839
Net currency translation adjustments ......................................................................
Effect of change in accounting standard ..................................................................
Unrealized losses on derivatives arising during the period .................................
25,592
2,477
(6,711)
(1,455)
(1,051)
3,300
24,137
1,426
(3,411)
Less: reclassification adjustments for losses included in net loss ........................
2,195
Net unrealized losses on derivatives ........................................................................
Minimum pension liability adjustment ...................................................................
(2,039)
(46)
Other comprehensive income ....................................................................................
¥48,716
(925)
1,324
19
¥(10,693)
1,270
(715)
(27)
¥38,023
Millions of yen
Before-tax
amount
Tax (expense)
or benefit
Net-of-tax
amount
Unrealized losses on investment securities arising during period ......................
Less: reclassification adjustments for losses included in net income ..................
¥(74,870)
11,121
¥30,919
(4,738)
¥(43,951)
6,383
Net unrealized losses ..................................................................................................
(63,749)
26,181
(37,568)
Currency translation adjustments arising during period .....................................
Less: reclassification adjustments for gains included in net income ...................
13,958
(3,259)
Net currency translation adjustments ......................................................................
Minimum pension liability adjustment ...................................................................
10,699
57,579
2001
Other comprehensive income ....................................................................................
76
Marubeni Corporation 2003
¥4,529
(270)
(67)
(337)
(27,414)
¥(1,570)
13,688
(3,326)
10,362
30,165
¥2,959
The accumulated balance of each component of accumulated other comprehensive loss at March 31, 2003, 2002 and 2001 was as follows:
Millions of yen
Balance at March 31, 2000 ...........................................
Change in the period ...................................................
Balance at March 31, 2001 ...........................................
Change in the period ...................................................
Balance at March 31, 2002 ...........................................
Change in the period ...................................................
Balance at March 31, 2003 ...........................................
Unrealized
gains (losses)
on investment
securities
Currency
translation
adjustments
¥ 23,326
(37,568)
(14,242)
14,628
386
(8,749)
¥(8,363)
¥(86,325)
10,362
(75,963)
24,137
(51,826)
(20,854)
¥(72,680)
Unrealized
losses on
derivatives
¥
–
–
–
(715)
(715)
(4,101)
¥(4,816)
Minimum
pension
liability
adjustment
Accumulated
other
comprehensive
losses
¥(30,358)
30,165
(193)
(27)
(220)
(362)
¥(582)
¥(93,357)
2,959
(90,398)
38,023
(52,375)
(34,066)
¥(86,441)
Thousands of U.S. dollars
Balance at March 31, 2002 ...........................................
Change in the period ...................................................
Balance at March 31, 2003 ...........................................
Unrealized
gains (losses)
on investment
securities
Currency
translation
adjustments
Unrealized
losses on
derivatives
Minimum
pension
liability
adjustment
Accumulated
other
comprehensive
losses
$
3,216
(72,908)
$(69,692)
$(431,884)
(173,783)
$(605,667)
$(5,958)
(34,175)
$(40,133)
$(1,833)
(3,017)
$(4,850)
$(436,459)
(283,883)
$(720,342)
13. Segment Information
The Company’s operating segments by which management
evaluates performance and allocates resources are classified in
terms of the nature of the products and services or areas. The
segments, by products and services, are managed by the
divisions of the Head Office. Domestic branches and offices, and
overseas corporate subsidiaries and branches operate in the
respective areas and are independent operating units. Each
reportable segment purchases, distributes and markets a wide
variety of industrial and consumer goods including raw
materials and equipment relating to a multitude of industries
and, in addition, provides the related financing, insurance and
other services to these operations primarily on a worldwide
basis. The Company has twelve segments identified by product
and service, in addition to its domestic branches and offices, and
overseas corporate subsidiaries and branches. Effective for the
year ended March 31, 2002, the finance and logistics business
segment was added, and the iron and steel segment was excluded
since its business was transferred to Marubeni-Itochu Steel Inc.
on October 1, 2001. These segments are outlined as follows:
IT Business: This group is engaged in information technology-related
businesses such as: IP network infrastructures; overseas communication facilities; cellular phones; wholesale and retail sales of hardware
and software for personal computers; medical healthcare; BS/CS
broadcasting; ASP/ISP, etc., both domestically and internationally.
Utility and infrastructure: This group develops and promotes
the privatization of electricity, water and solid waste businesses
both domestically and internationally. In addition, the group
provides construction, installation and supplies businesses
related to railroads, airports, harbors, bridges and others.
Plant and ship: This group constructs and supplies a wide variety
of industrial plants and participates in investments in these
businesses both domestically and internationally. In addition, it
supplies cargo ships and tankers, and owns and operates a fleet.
Transportation and industrial machinery: This group imports
and exports vehicles, construction equipment, agro-industrial
equipment, environmental and industrial equipment, airplanes,
defense-related equipment and aerospace-related equipment
both domestically and internationally.
Energy: This group focuses on products related to energy such as
oil, gas, nuclear energy and coal. It also enters into various
businesses which benefit from the development of resources,
such as retail gas stations.
Metals and mineral resources: This group produces, processes
and sells nonferrous light metals both domestically and internationally, in addition to processing and selling raw materials for
production of steel and light metals internationally.
Chemicals: This group handles a wide variety of goods ranging
from basic chemicals to leading-edge finished products for
information technology and bio technology industries for sale in
Japan and internationally. Especially, this group focuses on
furthering bolster efficient operations in electric materials, retail,
resource development and environmental area.
Forest products and general merchandise: Besides selling
rubber products, footwear and housing materials, the group
operates leisure facilities, manufactures and sells raw materials
for paper production, paper and paperboard, and takes part in
afforestation projects, in Japan and internationally.
Agri-marine products: This group produces and sells all sorts of
foods such as agricultural and marine products, processed food
and beverages, raw materials and fodder and manure in
addition to distributing these products on a worldwide basis.
Textile: As an organization handling various textile-related
goods from raw materials through finished products, the group
purchases and produces raw materials for apparel and designs
and sells apparel and living products in addition to rendering
distribution services on a worldwide basis.
Development and construction: This group develops
condominiums, houses and apartments, and develops and rents
sports facilities and commercial buildings in Japan while
operating internationally as a general area developer.
Finance and logistics business: This group is involved in project
finance, non-bank financial services and the insurance business while
it invests in infrastructure projects for logistics and operates a
forwarding and a third party logistics business, improving efficiency
in logistics operations through supply chain management.
Domestic branches and offices: Domestic branches and offices
are located throughout Japan, including Hokkaido, Tohoku,
Chubu, Chugoku-Shikoku, Kyushu, and handle various
merchandise and carry out related activities.
Overseas corporate subsidiaries and branches: Overseas
corporate subsidiaries and branches are located throughout the
world, primarily in North America and Europe, and handle
various merchandise and perform related activities.
Marubeni Corporation 2003
77
The Companies’ operating segment information for the years ended March 31, 2003, 2002 and 2001, were as follows:
Millions of yen
Year ended March 31, 2003
IT business
Utility and
infrastructure
Plant and
ship
Transportation
and industrial
machinery
Energy
Metals and
mineral
resources
Chemicals
Total volume of trading transactions:
Outside customers .......................
Inter-segment ................................
¥381,758
4,404
¥421,743
107
¥732,978
3,498
¥753,677
22,901
¥2,308,904
849
¥414,473
27,871
¥547,563
22,365
Forest products
and general
merchandise
¥705,421
40,355
Total ...........................................
¥386,162
¥421,850
¥736,476
¥776,578
¥2,309,753
¥442,344
¥569,928
¥745,776
Gross trading profit ..........................
¥ 32,559
¥ 11,832
¥ 13,866
¥ 54,371
¥
29,615
¥ 13,984
¥ 29,279
¥ 41,242
Segment net income (loss) ...............
¥ (7,990)
¥ 4,508
¥ 1,277
¥ 3,567
¥
6,556
¥ 1,923
¥ 2,063
¥ 4,868
Segment assets ..................................
¥245,103
¥232,197
¥392,244
¥292,581
¥ 348,338
¥157,820
¥147,420
¥299,009
Depreciation and amortization .......
¥ 4,452
¥ 2,977
¥
283
¥ 1,791
¥
5,452
¥ 2,477
¥ 4,320
¥ 3,323
Expenditures for segment assets ....
¥ 2,868
¥ 2,641
¥
582
¥ 1,375
¥
5,507
¥ 1,153
¥ 2,418
¥ 3,851
Overseas
corporate
subsidiaries
and branches
Corporate
and
elimination
Consolidated
¥8,793,303
–
Millions of yen
Agri-marine
products
Textile
Development Finance and
and
logistics
construction
business
Domestic
branches
and offices
Total volume of trading transactions:
Outside customers ....................... ¥1,006,979
Inter-segment ................................
16,534
¥366,742
3,535
¥185,346
494
¥ 32,479
5,355
¥158,639
14,296
¥ 771,859
293,508
¥ 4,742
(456,072)
Total ........................................... ¥1,023,513
¥370,277
¥185,840
¥ 37,834
¥172,935
¥1,065,367
¥(451,330)
¥8,793,303
Gross trading profit .......................... ¥
58,559
¥ 24,494
¥ 34,027
¥ 6,523
¥ 6,081
¥
72,827
¥ (4,616)
¥ 424,643
Segment net income (loss) ............... ¥
¥
4,943
¥ (4,378)
¥
¥ 636,817
¥4,321,482
7,066
¥ 1,934
¥
¥ 3,344
¥
Segment assets .................................. ¥ 347,483
¥123,868
¥376,963
(205)
¥169,504
¥ 60,764
836
Depreciation and amortization ....... ¥
5,206
¥
378
¥ 3,411
¥ 12,000
¥
197
¥
9,561
¥
7,837
¥
63,665
Expenditures for segment assets .... ¥
8,710
¥
199
¥ 2,072
¥ 7,475
¥
117
¥
14,521
¥
6,174
¥
59,663
¥ 491,371
30,312
Thousands of U.S. dollars
Utility and
infrastructure
Plant and
ship
Transportation
and industrial
machinery
Total volume of trading transactions:
Outside customers ....................... $3,181,317
Inter-segment ................................
36,700
$3,514,525
892
$6,108,150
29,150
Total ........................................... $3,218,017
$3,515,417
$
98,600
Segment net income (loss) ............... $ (66,584) $
37,566
Year ended March 31, 2003
IT business
Gross trading profit .......................... $ 271,325
Energy
Metals and
mineral
resources
Chemicals
Forest products
and general
merchandise
$6,280,642
190,841
$19,240,866
7,075
$3,453,942
232,258
$4,563,025
186,375
$5,878,508
336,292
$6,137,300
$6,471,483
$19,247,941
$3,686,200
$4,749,400
$6,214,800
$ 115,550
$ 453,092
$
246,792
$ 116,533
$ 243,992
$ 343,683
$
$
$
54,633
$
$
10,642
29,725
16,025
17,192
$
40,566
Segment assets .................................. $2,042,525
$1,934,975
$3,268,700
$2,438,175
$ 2,902,817
$1,315,167
$1,228,500
$2,491,742
Depreciation and amortization ....... $
37,100
$
24,808
$
2,358
$
14,925
$
45,433
$
20,642
$
36,000
$
27,692
Expenditures for segment assets .... $
23,900
$
22,008
$
4,850
$
11,458
$
45,892
$
9,608
$
20,150
$
32,092
Thousands of U.S. dollars
Agri-marine
products
78
Textile
Development Finance and
and
logistics
construction
business
Domestic
branches
and offices
Overseas
corporate
subsidiaries
and branches
Corporate
and
elimination
Consolidated
Total volume of trading transactions:
Outside customers ....................... $8,391,492
Inter-segment ................................
137,783
$3,056,184
29,458
$1,544,550
4,117
$ 270,658
44,625
$1,321,992
119,133
$6,432,158 $
39,516 $73,277,525
2,445,900 (3,800,599)
–
$8,878,058 $(3,761,083) $73,277,525
Total ........................................... $8,529,275
$3,085,642
$1,548,667
$ 315,283
$1,441,125
Gross trading profit .......................... $ 487,992
$ 204,117
$ 283,558
$
54,358
$
50,675
Segment net income (loss) ............... $
$
$
(1,708) $
27,867
$
6,967
58,883
16,117
$ 606,892 $
(38,467) $ 3,538,692
$
(36,483) $
41,192 $
252,600
Segment assets .................................. $2,895,692
$1,032,233
$3,141,358
$1,412,533
$ 506,367
$4,094,758 $ 5,306,808 $36,012,350
Depreciation and amortization ....... $
43,383
$
3,150
$
28,425
$ 100,000
$
1,642
$
Expenditures for segment assets .... $
72,583
$
1,658
$
17,267
$
$
976
Marubeni Corporation 2003
62,292
79,675 $
65,309 $
530,542
$ 121,008 $
51,450 $
497,192
Millions of yen
Year ended March 31, 2002
IT business
Utility and
infrastructure
Plant and
ship
Transportation
and industrial
machinery
Energy
Metals and
mineral
resources
Chemicals
Forest products
and general
merchandise
Total volume of trading transactions:
Outside customers .......................
Inter-segment ................................
¥462,716
4,427
¥329,565
185
¥593,155
7,539
¥756,297
17,906
¥2,195,849
1,099
¥430,132
45,965
¥518,620
20,239
¥695,337
33,147
¥728,484
Total ...........................................
¥467,143
¥329,750
¥600,694
¥774,203
¥2,196,948
¥476,097
¥538,859
Gross trading profit ..........................
¥ 33,205
¥ 10,564
¥ 10,251
¥ 52,466
¥
30,285
¥ 14,589
¥ 28,694
¥ 40,833
Segment net income (loss) ...............
¥ (35,647)
¥ 1,960
¥ (30,202)
¥ (6,250)
¥
5,465
¥ (1,369)
¥ 2,111
¥ 3,060
Segment assets ..................................
¥263,365
¥212,807
¥402,287
¥329,131
¥ 351,483
¥177,754
¥165,692
¥331,755
Depreciation and amortization .......
¥ 3,808
¥ 3,968
¥ 1,796
¥ 3,756
¥
7,133
¥ 2,196
¥ 2,600
¥ 2,737
Expenditures for segment assets ....
¥ 11,635
¥ 4,710
¥ 8,524
¥ 1,674
¥
3,255
¥
¥ 1,880
¥ 4,687
Overseas
corporate
subsidiaries
and branches
Corporate
and
elimination
Consolidated
188
Millions of yen
Agri-marine
products
Textile
Development Finance and
and
logistics
construction
business
Domestic
branches
and offices
Total volume of trading transactions:
Outside customers ....................... ¥1,030,882
Inter-segment ................................
13,912
¥434,724
3,664
¥184,018
909
¥ 39,435
7,025
¥276,451
20,912
¥ 792,738
307,319
¥ 232,326
(484,248)
¥8,972,245
–
Total ........................................... ¥1,044,794
¥8,972,245
¥438,388
¥184,927
¥ 46,460
¥297,363
¥1,100,057
¥(251,922)
Gross trading profit .......................... ¥
60,276
¥ 28,134
¥ 32,183
¥ 6,774
¥ 6,585
¥
¥
Segment net income (loss) ............... ¥
(6,475)
¥ 1,352
¥ (23,362)
¥
¥ (1,399) ¥ (11,363)
¥ (14,746)
¥ (116,418)
Segment assets .................................. ¥ 346,456
¥150,503
¥398,484
¥340,354
¥ 92,549
¥ 563,108
¥ 679,941
¥4,805,669
Depreciation and amortization ....... ¥
4,671
¥
830
¥ 3,526
¥ 16,161
¥
148
¥
9,782
¥
¥
71,052
Expenditures for segment assets .... ¥
8,076
¥
652
¥ 13,260
¥ 12,547
¥
243
¥
14,701
¥
76,783
447
74,704
7,261
7,940
¥ (9,249)
¥ 436,804
Millions of yen
Transportation
Plant and and industrial
ship
machinery
Energy
Metals
and mineral
resources
Iron and
steel
Chemicals
Year ended March 31, 2001
IT business
Utility and
infrastructure
Total volume of trading transactions:
Outside customers .......................
Inter-segment ................................
¥444,564
6,536
¥424,372
194
¥505,369
6,027
¥814,057
22,442
¥1,909,479
1,670
¥470,489
53,352
¥483,958
46,016
¥574,741
26,790
¥601,531
Total ...........................................
¥451,100
¥424,566
¥511,396
¥836,499
¥1,911,149
¥523,841
¥529,974
Gross trading profit ..........................
¥ 41,328
¥ 10,126
¥ 20,188
¥ 53,179
¥
31,258
¥ 15,517
¥ 25,524
¥ 29,571
Segment net income (loss) ...............
¥ (3,526)
¥ (3,524)
¥ (14,002)
¥ (10,489)
¥
8,383
¥ 2,738
¥ (2,366)
¥ 3,803
Segment assets ..................................
¥303,382
¥198,623
¥573,658
¥447,078
¥ 318,981
¥207,470
¥251,544
¥180,367
Depreciation and amortization .......
¥ 2,810
¥ 3,554
¥ 3,690
¥ 21,155
¥
4,342
¥ 2,458
¥
962
¥ 4,087
Expenditures for segment assets ....
¥ 17,632
¥ 1,884
¥ 1,358
¥ 23,035
¥
16,976
¥
¥
592
¥ 2,231
252
Millions of yen
Forest
products and
general
Agri-marine
merchandise
products
Textile
Development
and
construction
Domestic
branches
and offices
Overseas
corporate
subsidiaries
and branches
Corporate
and
elimination
Consolidated
Total volume of trading transactions:
Outside customers .......................
Inter-segment ................................
¥759,723
34,604
¥1,029,812
22,951
¥483,641
5,255
¥206,892
620
¥408,320
26,869
¥ 893,807
335,478
¥ 27,639
(588,804)
¥9,436,863
–
¥9,436,863
Total ...........................................
¥794,327
¥1,052,763
¥488,896
¥207,512
¥435,189
¥1,229,285
¥(561,165)
Gross trading profit ..........................
¥ 43,987
¥
65,040
¥ 30,570
¥ 29,123
¥ 11,426
¥
69,936
¥
Segment net income (loss) ...............
¥ 8,014
¥
8,679
¥ (3,462)
¥ (5,381)
¥ 1,126
¥
(1,363)
¥ 26,406
¥
Segment assets ..................................
¥381,894
¥ 350,086
¥184,097
¥426,304
¥170,607
¥ 559,145
¥ 767,368
¥5,320,604
¥
¥
69,914
¥
95,430
Depreciation and amortization .......
¥ 3,695
¥
4,220
¥
568
¥ 3,016
¥
281
¥
8,562
Expenditures for segment assets ....
¥ 2,681
¥
4,140
¥
323
¥ 3,592
¥
77
¥
21,681
2,981
6,514
¥ (1,024)
¥ 479,754
15,036
Marubeni Corporation 2003
79
Effective April 1, 2001, the finance and logistics business
segment was created. The respective amounts for the years
ended March 31, 2001 were treated as Corporate.
The accounting policies of the reportable segments are the
accounting principles generally accepted in Japan.
Corporate and elimination includes differences in accounting
principles generally accepted in Japan and those in the United
States of America. The principal differences are described in Note 1.
Intersegment transactions are generally priced in accordance
with the prevailing market prices.
The respective amounts of Iron and steel for the first half of
the year ended March 31, 2002 are included in Corporate and
elimination.
Total volumes of trading transactions by country are as follows:
Thousands of
U.S. dollars
Millions of yen
Country
Japan .....................................................................................................
United States of America ...................................................................
United Kingdom .................................................................................
Other .....................................................................................................
Total ..................................................................................................
2003
2002
2001
2003
¥5,864,552
1,341,698
271,730
1,315,323
¥8,793,303
¥6,075,145
1,340,796
182,915
1,373,389
¥8,972,245
¥6,780,133
1,091,601
143,767
1,421,362
¥9,436,863
$48,871,267
11,180,817
2,264,416
10,961,025
$73,277,525
Total volumes of trading transactions are attributed to countries based on the location of operations.
Long-lived assets, including property leased to others, by country are as follows:
Thousands of
U.S. dollars
Millions of yen
Country
Japan .....................................................................................................
United States of America ...................................................................
Australia ...............................................................................................
Other .....................................................................................................
Total ..................................................................................................
2003
2002
2001
2003
¥491,188
99,318
25,712
45,984
¥662,202
¥515,992
135,495
28,748
81,420
¥761,655
¥571,326
127,608
26,903
109,044
¥834,881
$4,093,233
827,650
214,267
383,200
$5,518,350
Total volumes of trading transactions with external customers by product for the years ended March 31, 2003, 2002 and 2001, were
as follows:
Thousands of
U.S. dollars
Millions of yen
Product
Machinery ............................................................................................
Energy ..................................................................................................
Metals ...................................................................................................
Chemicals .............................................................................................
Forest products and general merchandise ......................................
Agri-marine products ........................................................................
Textile ...................................................................................................
Development and construction ........................................................
Total ..................................................................................................
2003
2002
2001
2003
¥2,494,041
2,396,933
502,251
910,187
807,806
1,063,732
425,279
193,074
¥8,793,303
¥2,279,414
2,308,831
874,196
863,307
819,288
1,112,431
520,043
194,735
¥8,972,245
¥2,360,973
1,988,217
1,326,967
909,064
901,502
1,139,875
587,368
222,897
¥9,436,863
$20,783,675
19,974,441
4,185,425
7,584,892
6,731,717
8,864,433
3,543,992
1,608,950
$73,277,525
There is no concentration by customer.
14. Foreign Currency Transactions
Net foreign currency transaction gains and losses included in
other income (losses) – net amounted to ¥5,331 million ($44,425
thousand) of loss for the year ended March 31, 2003 and ¥6,153
million and ¥4,645 million of gains for the years ended March 31,
2002 and 2001, respectively. Net foreign currency transaction
gains and losses include translation gains and losses resulting
from remeasuring the financial statements of certain subsidiaries
in highly inflationary economies into Japanese yen.
15. Financial Instruments
Risk management
Substantially all the derivative instruments which the Company
and certain of its subsidiaries hold are utilized to hedge related
market risks, and gains and losses on the derivative instruments
are offset against losses and gains on the hedged assets and
liabilities. The Company and certain of its subsidiaries also enter
into derivative transactions for trading purposes. The Company
80
Marubeni Corporation 2003
has internal regulations regarding positions and loss limits and
the actual positions and gains/losses are periodically reported to
management. Although the Company and certain subsidiaries
are exposed to credit risks in the event of nonperformance by the
counterparties, such risks are minimized by avoiding a concentration of counterparties, selecting counterparties with high
credit ratings and maintaining strict credit control.
The Company and certain of its subsidiaries have separate
departments which confirm their financial transactions with the
counterparties from the departments which execute them. In
addition, the Company has as its “middle-office” a “Risk
Management Division,” in its Tokyo Head Office. The Risk
Management Division independently performs direct confirmation procedures with the counterparties to each transaction and
the month-end outstanding balances, analyzes various risks and
exposures, reports the results of the analysis, and monitors and
controls financial risks. Furthermore, the Risk Management
Division obtains derivative transaction data from the financial
subsidiaries and foreign corporate subsidiaries, reports to
management periodically, and strengthens the Company’s
unified global control over derivative transactions.
Foreign exchange contracts
The Company and certain of its subsidiaries conduct business in
various foreign currencies and enter into foreign exchange
contracts principally to hedge foreign currency denominated
transactions, assets and liabilities to minimize the effect of
foreign currency fluctuations. Gains and losses related to the
hedge ineffective portion and related to the portion of hedging
instruments excluded from assessment of hedge effectiveness
were not significant for the year ended March 31, 2003.
Interest rate swap agreements, including
interest rate and currency swap agreements
The Company and certain of its subsidiaries enter into interest
rate swap agreements primarily to change the fixed interest rates
on the principal of certain debt securities, loans receivable, shortterm loans and long-term debt to floating interest rates. Gains
and losses related to the hedge ineffective portion and related to
the portion of hedging instruments excluded from assessment of
hedge effectiveness were not significant for the year ended
March 31, 2003. In addition, the Company and certain of its
subsidiaries enter into interest rate swap agreements for trading
purposes on a limited basis.
Commodity futures and forward contracts
The Company and certain of its subsidiaries enter into commodity
futures and forward contracts principally as a means of hedging
the risks associated with certain inventories, commitments and
forecasted transactions. Gains and losses related to the hedge
ineffective portion and related to the portion of hedging instruments excluded from the assessment of hedge effectiveness were
not significant for the year ended March 31, 2003.
Other derivative instruments
The Company and certain of its subsidiaries utilize option
contracts primarily to hedge the risks associated with changes in
interest rates and exchange rates. Gains and losses related to the
hedge ineffective portion and related to the portion of hedging
instruments excluded from assessment of hedge effectiveness
were not significant for the year ended March 31, 2003. In
addition, the Company and certain of its subsidiaries enter into
other derivative contracts for trading purposes on a limited basis.
Fair value of financial instruments
The estimated fair value of the financial instruments of the
Companies has been determined using available market
information or other appropriate valuation methodologies.
However, considerable judgement is required in interpreting
market data to develop estimates of fair value. Consequently, the
estimates are not necessarily indicative of the amounts that could
be realized or would be paid in a current market exchange.
The following methodologies and assumptions were used by
the Companies in estimating the fair value disclosures of the
financial instruments:
Cash and cash equivalents, and time deposits:the carrying
amounts of the cash and cash equivalents, and time deposits
reflected in the consolidated balance sheets approximate their
fair value.
Investment securities, securities and other investments:the
fair value of marketable equity securities is based on quoted
market prices. The carrying amount of the marketable equity
securities reflected in the balance sheets represents their fair
value. The fair value of investments in debt securities is based on
quoted market prices or estimated using discounted cash flow
analyses, based on the estimated current rates offered to the
issuers for securities with similar terms and remaining maturities. It was not practicable to estimate the fair value of the
investments other than marketable equity securities and debt
securities without incurring excessive costs. The carrying
amount of the portion of the portfolio for which fair value could
not be estimated was ¥284,377 million ($2,369,808 thousand) and
¥319,024 million at March 31, 2003 and 2002, respectively, and
represents the cost of this portion of the portfolio, which
management believes is not impaired.
Long-term notes, loans and accounts receivable – trade: the
fair value of long-term notes, loans and accounts receivable trade is estimated using discounted cash flow analyses, based on
the interest rates currently being offered to borrowers for similar
long-term notes, loans and accounts receivable - trade with
similar credit ratings. The fair value of accounts receivable with
collectibility concerns is reflected at their carrying value less the
related allowance for doubtful accounts.
Short-term loans: the carrying amount of the short-term loans
reflected in the accompanying consolidated balance sheets
approximates their fair value.
Long-term debt:the fair value of long-term debt is estimated
using discounted cash flow analyses, based on the current
borrowing rates for borrowing arrangements with similar terms
and remaining maturities.
Foreign exchange contracts:the fair value of for eign exchange
contracts is estimated based on the quoted market prices of comparable contracts, adjusted where necessary for maturity differences.
Interest rate swap agreements:the fair value of inter est rate
swap agreements is estimated using discounted cash flow
analyses, based on the current swap rates for interest rate swap
agreements with similar terms and remaining periods.
Commodity futures and forward contracts:the fair value of
commodity futures contracts is estimated based on the quoted
market prices of comparable contracts, adjusted where necessary
for maturity differences.
The carrying amounts and fair value of financial instruments
and the derivative instruments at March 31, 2003 and 2002 were
as follows (amounts in parentheses represent liabilities):
Millions of yen
Millions of U.S. dollars
2002
2003
Carrying
amount
Short-term investments in debt securities .......
Long-term investments in debt securities ........
Long-term notes, loans and accounts receivable trade (less allowance for doubtful accounts) ......
Long-term debt ....................................................
Interest rate swaps ...............................................
Foreign exchange contracts ................................
Commodity futures and
forward contracts and other .............................
¥
Fair
value
13,108¥13,167
53,578
50,353
245,887
(2,304,513)
50,194
290
245,666
(2,252,911)
50,194
290
(1,367)
(1,367)
2003
Carrying
amount
Fair
value
¥63,198
70,349
¥63,197
64,493
332,254
(2,576,502)
37,860
2,589
3,790
331,749
(2,466,990)
37,860
2,589
3,790
Carrying
amount
$
109,233
446,483
Fair
value
$
109,725
419,608
2,049,058
(19,204,275)
418,283
2,417
2,047,217
(18,774,258)
418,283
2,417
(11,392)
(11,392)
Marubeni Corporation 2003
81
16. Concentration of Credit Risk
Although the Company operates as a general trading business,
their fields of business comprise export, import, domestic and
offshore trading in a wide variety of industrial, agricultural and
consumer products, and also involve all levels of the production
process from planning, investment, and research and development, through production, distribution and marketing. In
addition, the Company operates in substantially all geographic
areas of the world, and their customers are diversified. Accordingly, management of the Company believes there is no significant concentration of credit risk among its customers or in its
investments. The Company requires collateral to the extent
considered necessary.
17. Commitments and Contingent Liabilities
Rental expense, primarily for office space and equipment,
amounted to ¥17,269 million ($143,908 thousand), ¥23,440 million
and ¥16,450 million for the years ended March31, 2003, 2002 and
2001, respectively.
At March 31, 2003, the future minimum lease payments
payable and rentals receivable under non-cancelable operating
leases were as follows:
Millions of yen
Year ending March 31
Thousands of U.S. dollars
Payable
Receivable
Payable
Receivable
2004 ..................................................................................................
¥10,073
¥14,262
$83,942
$118,850
2005 ..................................................................................................
2006 ..................................................................................................
2007 ..................................................................................................
8,148
6,173
3,950
12,671
9,912
7,481
67,900
51,442
32,917
105,592
82,600
62,342
2008 ..................................................................................................
Thereafter ........................................................................................
3,310
17,080
5,239
7,008
27,583
142,333
43,658
58,400
The future minimum rentals to be received under noncancelable subleases corresponding to the above future minimum lease
payments payable were not significant at March 31, 2003.
In fiscal 2002, the Company sold to a third party the buildings and property of Osaka headquarters and Nagoya branch
for ¥12,500 million ($104,167 thousand) and ¥2,900 million
($24,167 thousand), respectively, and leased back these facilities.
The lease terms are 10 years and 2 years, respectively. The
Company does not have continuing involvement under the
sale-leaseback transactions.
The Company had commitments to make additional investments or loans in aggregate amounts of approximately ¥18,000
million ($150,000 thousand) and ¥40,000 million at March 31, 2003
and 2002, respectively.
The Company guarantees debt of affiliated companies and
third parties in the ordinary course of business. Should the
guaranteed parties fail to make payments, the Company would
be required to make such payments under these guarantees. The
term of the guarantees is basically one year. The related guarantee fees are primarily received quarterly or semi-annually.
Certain of these guarantees were secured by guarantees issued to
the Company by other parties. The outstanding balance of
guarantees, which approximated the maximum potential
payment under these guarantees, was ¥276,431 million
($2,303,592 thousand), including ¥151,355 million ($1,261,292
thousand) to affiliated companies, at March 31, 2003, net of the
amount secured by guarantees issued to the Company by other
parties of ¥21,258 million ($177,150 thousand). The comparable
amounts at March 31, 2002 were ¥382,148 million, ¥220,614
million and ¥27,026 million, respectively.
The Company, its subsidiaries and affiliated companies
conduct business activities on a global scale and are involved in
transactions which are subject to review and jurisdiction by a wide
range of authorities, both in Japan and abroad. Such business
activities are not without risk and, from time to time, may involve
legal actions, claims or other disputes. Although there are various
matters pending at any one time, management is of the opinion
that settlement of all such matters pending at March 31, 2003
would not have a material effect on the consolidated financial
position or results of operations of the Companies.
18. Subsequent Events
At the June 26, 2003 annual meeting, the shareholders approved
the payment of a cash dividend of ¥3 per share, aggregating
¥4,480 million ($37,333 thousand).
On April 15, 2003, the Marubeni Welfare Pension Fund
received approval from the Japanese government to transfer the
future benefit obligation related to the substitutional portion for
the government-defined benefit prescribed by the Welfare
Pension Insurance Law of Japan. The Company will account for
the entire process upon completion of the transfer to the
Japanese government of the substitutional portion of the benefit
82
Marubeni Corporation 2003
obligation and the related plan asset in accordance with the
consensus reached by the Emerging Issue Task Force on Issue
No. 03-2, Accounting for the Transfer to the Japanese Government of
the Substitutional Portion of Employee Pension Fund Liabilities. The
Company expects to complete the transaction in the year ending
March 31, 2004, when the related gain or loss will be recognized.
The effect of the completion of the transaction has not yet been
determined because the amount of the benefit obligation and the
related plan assets to be transferred may change.
Marubeni Corporation 2003
83
International Network
84
Africa
Europe
Middle East
CIS
Oceania
China
Abidjan
Accra
Addis Ababa
Algiers
Cairo
Harare
Johannesburg
Lagos
Lusaka
Nairobi
Tripoli
Athens
Berlin
Brussels
Bucharest
Budapest
Dublin
Düsseldorf
Hamburg
Helsinki
London
Madrid
Milan
Oslo
Paris
Prague
Risley
Stockholm
Warsaw
Abu Dhabi
Amman
Ankara
Baghdad
Doha
Dubai
Istanbul
Muscat
Riyadh
Sana’a
Tehran
Almaty
Khabarovsk
Kiev
Moscow
Tashkent
YuzhnoSakhalinsk
Auckland
Brisbane
Melbourne
Noumea
Perth
Sydney
Beijing
Dalian
Guangzhou
Hong Kong
Kunming
Nanjing
Ningbo
Qingdao
Shanghai
Shenzhen
Tianjin
Xiamen
Marubeni Corporation 2003
Overseas Corporate
Subsidiaries
Asia
Bandung
Bangkok
Calcutta
Chittagong
Colombo
Dhaka
Goa
Hanoi
Ho Chi Minh City
Islamabad
Jakarta
Kaohsiung
Karachi
Kota Kinabalu
Kuala Lumpur
Kuching
Lahore
Manila
Mumbai (Bombay)
New Delhi
Phnom Penh
Seoul
Sibu
Singapore
Taipei
Ulan Bator
Vientiane
Yangon
North
America
Central and
South America
Boston
Calgary
Detroit
Houston
Los Angeles
New York
Omaha
Portland
San Francisco
Toronto
Vancouver
Washington, D.C.
Bogotá
Buenos Aires
Caracas
Lima
Mexico City
Rio de Janeiro
Salvador
San José
Santiago
São Paulo
Marubeni America Corporation
(New York)
Marubeni Canada Ltd.
(Vancouver)
Marubeni Mexico S.A. de C.V.
(Mexico City)
Marubeni Venezuela C.A.
(Caracas)
Marubeni Brasil S.A.
(São Paulo)
Marubeni Argentina S.A.
(Buenos Aires)
Marubeni Chile Limitada
(Santiago)
Marubeni Europe plc
(London)
Marubeni Deutschland GmbH
(Düsseldorf)
Marubeni Benelux S.A.
(Brussels)
Marubeni France S.A.
(Paris)
Marubeni Iberia S.A.
(Madrid)
Marubeni Scandinavia AB
(Stockholm)
Marubeni Nigeria Ltd.
(Lagos)
Marubeni Saudi Arabia Co., Ltd.
(Riyadh)
Marubeni Iran Co., Ltd.
(Tehran)
Marubeni India Private Ltd.
(New Delhi)
Marubeni Singapore Pte. Ltd.
(Singapore)
Dagangterus Sdn. Bhd.
(Kuala Lumpur)
Marubeni Thailand Co., Ltd.
(Bangkok)
P.T. Marubeni Indonesia
(Jakarta)
Marubeni Philippines Corporation
(Manila)
Marubeni China Co., Ltd.
(Shanghai)
Marubeni Hong Kong &
South China Ltd.
(Hong Kong)
Marubeni Taiwan Co., Ltd.
(Taipei)
Marubeni Korea Corporation
(Seoul)
Marubeni Australia Ltd.
(Sydney)
Marubeni New Zealand Ltd.
(Auckland)
(As of April 1, 2003)
Marubeni Corporation 2003
85
Major Subsidiaries and Affiliates
AGRI-MARINE PRODUCTS
company name
Akagi Suisan Co., Ltd.
• Beni Frozen Corporation
• Benirei Corporation
Central Japan Grain Terminal Co., Ltd.
• Cia. Iguaçu de Café Solúvel
• Columbia Grain International, Inc.
Fremont Beef Company
Great Wall Dalian Investment Co., Ltd.
Katakura Chikkarin Co., Ltd.
• Marubeni Chikusan Corporation
• Marubeni Egg Corporation
• Marubeni Foods Corporation
• Marubeni Foods Investment Co., Ltd.
• Marubeni Shiryo Co., Ltd.
• Marukoh Fisheries Co., Ltd.
• Melitta Japan Ltd.
Metro Cash & Carry Japan K.K.
Nacx Nakamura Corporation
Nissan-Agri Co., Ltd.
OM2 Network Co., Ltd.
• Pacific Grain Terminal Ltd.
• Rangers Valley Cattle Station Pty. Ltd.
• Rice World Co., Ltd.
S Foods Inc.
• Seiwa Shokuhin Co., Ltd.
• Stork Corporation
• Ten Corporation
The Maruetsu, Inc.
The Nisshin OilliO Group, Ltd.
Tokyo Allied Coffee Roasters Co., Ltd.
• Tokyo Flour Milling Co., Ltd.
Toyo Sugar Refining Co., Ltd.
Viñas Argentinas S.A.
Weifang Meicheng Foodstuffs
Company Ltd.
Wyoming Premium Farm LLC.
Yamaboshiya Co., Ltd.
main business
nationality
ownership
Processing and wholesale of marine products
Wholesale of frozen foods
Refrigerated warehousing and wholesale of marine products
Grain warehousing, stevedoring and transportation operations
Production of instant coffee
Grain trading
Meat and variety meat processing
Broiler farming and processing
Manufacturing of fertilizer, marketing of LPG, feedstuffs and foods
Marketing of livestock, meats and processed products
Production and sales of eggs
Wholesale of coffee, tea, alcoholic beverages and foodstuffs
Investment in retailers for the Agri-Marine Products Group of Marubeni
Manufacture of compound feed
Wholesale of domestic and imported tuna
Coffee filter paper, equipment trading
Wholesale of foods for professional customers such as hotels,
restaurants and caterers
Wholesale, transportation and processing of frozen foods,
and refrigerated warehousing
Production and sales of fertilizer, sales of agricultural chemicals and golf-related business
Meat store chain
Grain warehousing, stevedoring and transportation
Cattle feedlot operation
Wholesale of rice and processed rice
Meat and variety meat processing and sales
Wholesale of frozen foods
Catering services
Management of “Ten-Don” fast-food chain
Supermarket chain
Seed crushing and sales of edible oils, fine chemicals and healthy food products
Manufacture and wholesale of roasted coffee
Flour milling
Sugar refining
Production of wine and must
Broiler farming and processing
Japan
Japan
Japan
Japan
Brazil
U.S.A.
U.S.A.
China
Japan
Japan
Japan
Japan
Japan
Japan
Japan
Japan
Japan
27.0%
84.0%
74.5%
50.0%
61.5%
100.0%
45.0%
40.0%
24.5%
99.9%
100.0%
96.8%
100.0%
99.7%
86.1%
60.0%
20.0%
Japan
20.0%
Pig farming
Wholesale of confectionery
U.S.A.
Japan
main business
nationality
ownership
Manufacture of fishing nets and warp-knit products
Spinning and weaving of cotton and polyester/cotton fabrics
Production and sales of casual wear
Wholesale of Japanese kimonos and related products
Marketing and sales of fabric, apparel and sportswear
Consulting on fashion merchandising, planning, design and research
Wholesale of industrial and interior textiles, ready-made goods and materials
Wholesale of textile piece goods, knitting yarn and textile ready-made goods
Textile materials trade
Textile materials trade
Production and sales of casual wear
Production and quality control of apparel made up overseas
Spinning of synthetic yarn
Japan
Thailand
Japan
Japan
Japan
Japan
Japan
Japan
China
China
Japan
China
China
96.7%
37.2%
33.4%
99.9%
100.0%
100.0%
99.4%
100.0%
100.0%
100.0%
70.0%
100.0%
65.0%
Japan
Japan
Japan
Australia
Japan
Japan
Japan
Japan
Japan
Japan
Japan
Japan
Japan
Japan
Argentina
China
34.9%
17.3%
76.8%
100.0%
80.0%
15.0%
70.0%
70.0%
50.5%
29.0%
15.0%
22.1%
59.3%
39.2%
40.0%
20.0%
40.0%
44.7%
TEXTILE
company name
• Benny Toyama Corporation
Erawan Textile Co., Ltd.
Fabricant Co., Ltd.
• Kyoto Marubeni Co., Ltd.
• Marubeni Fashion Link, Ltd.
• Marubeni Fashion Planning Corp.
• Marubeni Intex Co., Ltd.
• Marubeni Tex Co., Ltd.
• Marubeni Textile Asia Ltd.
• Marubeni Textile (Shanghai) Co., Ltd.
• Pacific Clothing Inc.
• Passport Fashion Company Limited
• Shanghai Xin Hong Textile Co., Ltd.
• Consolidated subsidiary
86
Marubeni Corporation 2003
Thai Textile Development &
Finishing Co., Ltd.
Tokai Dyeing Co., (Thailand) Ltd.
Dyeing, printing and finishing of medium- to heavy-weight fabrics
Thailand
27.1%
Dyeing, printing and finishing of cotton and synthetic fabrics
Thailand
31.2%
ownership
FOREST PRODUCTS & GENERAL MERCHANDISE
company name
Daishowa-Marubeni International Ltd.
• Forestnet Co., Ltd.
• Fukuyama Paper Co., Ltd.
• Koa Kogyo Co., Ltd.
• Marubeni Building Materials Co., Ltd.
• Marubeni Business Machines
(America), Inc.
• Marubeni Cement & Construction
Materials Co., Ltd.
• Marubeni CLS Corporation
• Marubeni Footwear Inc.
• Marubeni International Commodities
(Singapore) Pte. Ltd.
• Marubeni Lumber Co., Ltd.
• Marubeni Office Supply Co., Ltd.
• Marubeni Paper & Pulp Logistics Co., Ltd.
• Marubeni Paper Recycle Co., Ltd.
• Marubeni Pulp & Paper Sales Co., Ltd.
• Marubeni Pulp & Paper Sales
Europe GmbH
Marusumi Paper Co., Ltd.
• Pan Pacific Fiber, Inc.
• Precision Japan Ltd.
• Southern Plantation Forest Pty. Ltd.
• U Derivatives Pte. Ltd.
• Unimac Rubber Company Ltd.
• WA Plantation Resources Pty Ltd
Yokohama Reifen GmbH
main business
nationality
Manufacture and sales of bleached kraft pulp
Sales and marketing of printing/writing paper by Internet,
and other related services
Manufacture of corrugating medium and paper tube materials
Manufacture of corrugating medium, containerboard and printing paper
Wholesale of wood products and construction materials
Sales of copying machines and other office equipment to Central and
South America
Wholesale of cement and construction materials
Canada
50.0%
Japan
Japan
Japan
Japan
U.S.A.
65.0%
55.0%
77.5%
100.0%
100.0%
Japan
90.0%
Sales of synthetic leather
Export, import and wholesale of footwear
Sales of natural rubber and related products
Japan
Japan
Singapore
100.0%
100.0%
100.0%
Sawmilling and wholesale of logs and lumber
Conversion and sales of information processing paper
Integrated logistics management of imported and domestic paper and pulp products
Assortment and sales of waste paper
Wholesale of all types of paper
Sales of thermal paper, inkjet paper and pulp
Japan
Japan
Japan
Japan
Japan
Germany
100.0%
97.1%
91.9%
100.0%
88.2%
100.0%
Manufacture of printing paper
Waste paper collection and sales
Sales of golf component parts
Hardwood plantation, chip production and sales activities
Natural rubber trading
Production and sales of natural rubber
Wood chip export and plantation
Sales of Yokohama Tires
Japan
U.S.A.
Japan
Australia
Singapore
Thailand
Australia
Germany
32.2%
66.7%
100.0%
57.1%
99.0%
75.0%
60.0%
25.0%
CHEMICALS
company name
• AGROVISTA B.V.
• Agrovista France S.A.S.
Ain Medical Systems Inc.
Ain Pharmaciez Inc.
Beijing Asahi Glass Electronics Co., Ltd.
CMK Electronics (WUXI) Co., Ltd.
Dampier Salt Limited
• Helena Chemical Company
• Image Ukraine CJSC
Italpet Preforme S.p.A.
• Marubeni Chemical Asia Pacific Pte. Ltd.
• Marubeni Chemix Corporation
• Marubeni Information Technology
(Shanghai) Co., Ltd.
• Marubeni Plax Corporation
• Marubeni Specialty Chemicals
(Europe) GmbH
• Marubeni Specialty Chemicals Inc.
• M-I Chemicals Co., Ltd.
Mizushima Paraxylene Co., Ltd.
• Nantong Wanhong Agrochemical Co., Ltd.
P.T. Fukusuke Kogyo
• Polyglory Plastics (Hong Kong) Ltd.
main business
nationality
ownership
Holding company of agrochemicals distribution companies in the U.K. and
the Netherlands
Holding company of agrochemicals and home and garden products distribution
companies in France
Pharmacy operation in Kanto area
Pharmacy operation
Manufacture and sales of multiform and frit glass
Manufacture and sales of PCB (printed circuit board)
Production and sales of salt and gypsum
Distribution of agrochemicals, fertilizer and seeds
Sales of photosensitive materials and products
Manufacture of PET resin and preforms
Import/export/offshore trade of organic and specialty chemicals
Sales and foreign trade of organic chemicals and specialty chemicals
Import/export of electronic-related components and materials
U.K.
100.0%
France
100.0%
Japan
Japan
China
China
Australia
U.S.A.
Ukraine
Italy
Singapore
Japan
China
44.3%
15.0%
20.0%
20.0%
20.4%
100.0%
76.0%
37.5%
100.0%
100.0%
100.0%
Sales and foreign trade of plastic products and resin
Sales and foreign trade of specialty chemicals
Japan
Germany
100.0%
100.0%
Sales and foreign trade of specialty chemicals
Manufacture and sales of PVC compounds
Production and sales of paraxylene
Formulation and sales of agrochemicals
Manufacture and sales of PE films
Manufacture and sales of PE films
U.S.A.
Japan
Japan
China
Indonesia
China
100.0%
100.0%
50.0%
85.0%
20.0%
87.0%
• Consolidated subsidiary
Marubeni Corporation 2003
87
• Polytech Incorporated
• Saitama Pet Bottle Recycle Co., Ltd.
Shanghai Asahi Electronic Glass Co., Ltd.
• Shinko Chemical Terminal Co., Ltd.
Wuxi Zhenyu Chemical Co., Ltd.
• ZAO FUJIFILM RU
Sheeting of recycled PET resin
Production and sales of PET flakes made from used PET bottles
Manufacture and sales of glass bulbs for CRT
Manufacture, sales, transportation and storage of chemical products
Production and sales of sulphuric acid, SOP and hydrochloric acid
Sales of photosensitive materials and products
Japan
Japan
China
Japan
China
Russia
100.0%
100.0%
25.0%
85.5%
44.4%
100.0%
ENERGY
company name
• D.M. Gas Station, Inc.
• Energy U.S.A. Inc.
• Marubeni Energy Corporation
• Marubeni Ennex Corporation
• Marubeni International Petroleum
(Singapore) Pte. Ltd.
• Marubeni LNG International B.V.
• Marubeni Oil & Gas (U.K.) Limited
• Marubeni Oil & Gas (U.S.A.) Limited
• Marubeni Utility Services, Ltd.
• MIECO Inc.
• MQL International B.V.
Qatar LNG Investment Co., Ltd.
Qatar LNG Service Agency Co., Ltd.
• Ravva Oil (Singapore) Pte. Ltd.
Shenzhen Sino-Benny LPG Co., Ltd.
• Toh-hoku Sekiyugas Co., Ltd.
main business
nationality
ownership
Sales of petroleum products
Nuclear energy related business
Sales of petroleum products and LPG
Oil terminals
Petroleum trading
Japan
U.S.A.
Japan
Japan
Singapore
100.0%
100.0%
100.0%
100.0%
100.0%
Investment in LNG projects
Oil and gas development and production
Oil and gas development and production
Sales of nuclear power plant related components and services
Petroleum trading
Investment in LNG projects
Natural gas development
LNG importing services
Oil and gas development and production
Import and sales of LPG
Sales of petroleum products and LPG
Netherlands
U.K.
U.S.A
Japan
U.S.A.
Netherlands
Japan
Japan
Singapore
China
Japan
100.0%
100.0%
100.0%
100.0%
100.0%
100.0%
50.0%
50.0%
100.0%
49.0%
100.0%
METALS & MINERAL RESOURCES
company name
ANT Minerals Pty. Ltd.
• Marubeni Aluminium Australia Pty. Ltd.
• Marubeni Caja Investment Limited
• Marubeni Coal Pty. Ltd.
• Marubeni LP HOLDING B.V.
• Marubeni Metals & Minerals (Canada) Inc.
• Marubeni Metals Corporation
• Marubeni Tetsugen Co., Ltd.
• Marubeni Thermal Coal Pty. Ltd.
NMBG (H.K.) Ltd.
Silbasa-Silicio de Alta Pureza da
Bahia S.A.
Toyo-Memory Technology Sdn. Bhd.
main business
nationality
ownership
Investing in McArthur River zinc mine in Australia
Investment in aluminum business in Australia and sales of aluminum ingots
Investing in Sociedad Minera Refineria de Zinc Cajamarquilla S.A. in Peru
Investment in coal business in Australia
Investing in Los Pelambres copper mine in Chile
Investment in aluminum business in Canada and sale of aluminum ingot
Sales of nonferrous and light metal products
Sales of raw materials for steelmaking, ferro alloys and other minerals
Investment in Dartbrook coal mine in Australia
Production and sales of intermediate materials used in production of
printed circuit boards
Production and sales of high purity ferro silicon
Australia
Australia
Cayman Islands
Australia
Netherlands
Canada
Japan
Japan
Australi a
China
20.0%
100.0%
100.0%
100.0%
100.0%
100.0%
100.0%
100.0%
100.0%
30.0%
Brazil
24.6%
Production of aluminum disks for hard disk drives (HDDs)
Malaysia
40.0%
main business
nationality
ownership
Sales of Kubota- and AGCO- brand agricultural equipment
Car dealer for Saturn brand
Import assembly and distribution of Hino trucks
Wholesale of PC software and contents
Third-party logistics (3PL) and application service provider (ASP) for
ERP and other B2B IT systems
Development of investment in waste treatment business
Car dealer for BMW, Volkswagen, Mazda
Sales and service of construction machinery
Canada
U.S.A.
Guatemala
Japan
Japan
100.0%
90.0%
49.0%
61.3%
77.5%
Japan
U.S.A.
Australia
40.0%
100.0%
30.0%
Germany
U.K.
Canada
France
Australia
Japan
20.0%
40.0%
20.0%
26.2%
20.0%
62.2%
TRANSPORTATION & INDUSTRIAL MACHINERY
company name
• Avenue Machinery Corporation
• Bi-County Saturn LLC
CODACA Holding & Investment Co., Ltd.
• Computer Wave Inc.
• CyberLogistics Corporation
Ecomanage Corporation
• Gallery Automotive Group, LLC.
Hitachi Construction Machinery
(Australia) Pty. Ltd.
Kubota (Deutschland) GmbH
Kubota (U.K.) Ltd.
Kubota Canada Ltd.
Kubota Europe S.A.
Kubota Tractor Australia Pty. Ltd.
Logitec Corporation
• Consolidated subsidiary
88
Marubeni Corporation 2003
Sales and service of Kubota tractors, generators, engines and construction
Sales and service of Kubota tractors, generators, engines and construction
Sales and service of Kubota tractors, generators, engines and construction
Sales and service of Kubota tractors, generators, engines and construction
Sales and service of Kubota tractors, generators, engines and construction
Development, manufacturing and sales of peripheral equipment for PCs
machinery
machinery
machinery
machinery
machinery
• Long Island Automotive Group, Inc.
• Marubeni Aerospace America
Corporation
• Marubeni Aerospace Corporation
• Marubeni Airleasing (UK) Ltd.
• Marubeni Auto & Construction
Machinery America, Inc.
• Marubeni Auto Dirkes GmbH
• Marubeni Auto Investment (UK) Limited
• Marubeni Aviation Services Ltd.
• Marubeni Citizen-Cincom Inc.
• Marubeni Construction Machinery
Sales, Inc.
• Marubeni Disc Systems, Inc.
Marubeni Infotec Corporation
• Marubeni Machinery Co., Ltd.
• Marubeni Techno-Systems Corporation
• Marubeni Vehicle Corporation
Marubeni-Komatsu Ltd.
Media Vision Inc.
• Meditec Corporation
• N.V. Marubeni Auto and Construction
Machinery (Europe) S.A.
• Nissan Adria d.o.o.
• Nissan Diesel America, Inc.
• Nissan Marubeni Ltda.
• Nissan Norge AS
• Nissan Poland Ltd.
• Nissan Sverige AB
Ogihara Europe Ltd.
P.T. Astra Multi Finance
• Shinnihon Reiki Co., Ltd.
Sofmap Co., Ltd.
• Toyota Ghana Company Limited
• UD Truck (Oceania) Pty. Ltd.
Unipres Mexicana S.A. de C.V
Unipres U.S.A. Inc.
Car dealer for Volvo, Land Rover and Saturn brands
Export of aircraft, engines, onboard equipment, space products and those
parts to Japan
Sales, export, import and lease of aircraft, engines, onboard equipment,
satellites and those parts
Aircraft lease/finance transactions
Sales, import and export of automobiles and construction machinery,
and investment
Car dealer for Nissan, Mitsubishi and Fiat brands
Investment in motor retail and service industry
Investment in aircraft engine development programs and leasing of aircraft
Sales of Citizen machine tools
Sales of construction and mining equipment
U.S.A.
U.S.A.
100.0%
100.0%
Japan
100.0%
U.K.
U.S.A.
100.0%
100.0%
Germany
U.K.
Cayman Islands
U.S.A.
Japan
100.0%
100.0%
100.0%
60.0%
100.0%
Sales of optical disc, CD and DVD machinery
Wholesale of PCs and peripheral equipment, semiconductors and
electronics components
Sales and distribution of printing machinery and industrial machinery
Sales of production machinery relating to media, food, beverage, packaging,
chemical and environmental equipment
Export and import of automobiles and parts, construction, mining and
agricultural machinery
Import, sales and service of construction machinery
Development, marketing, and sales of PC/Internet software
Import sales and maintenance of medical equipment, apparatus and accessories
Import, distribution and service of Nissan vehicles and parts
U.S.A.
Japan
80.0%
60.0%
Japan
Japan
100.0%
100.0%
Japan
100.0%
U.K.
Japan
Japan
Belgium
40.0%
51.6%
100.0%
100.0%
Import, distribution and service of Nissan vehicles and parts
Import, distribution and service of UD trucks
Import, distribution and service of Nissan vehicles, trucks and parts
Import, distribution and service of Nissan vehicles and parts
Import, distribution and service of Nissan vehicles and parts
Import, distribution and service of Nissan vehicles and parts
Sales and manufacture of automotive body panels and pressing die
Consumer financing of Nissan Diesel and Isuzu vehicles
Engineering and construction of industrial use cooling towers and accessories
Retail of digital products, such as PCs and software
Import and distribution of Toyota vehicles
Import and distribution of Nissan Diesel trucks
Sales and manufacture of automotive body panels
Sales and manufacture of automotive body panels
Slovenia
U.S.A.
Chile
Norway
Poland
Sweden
U.K.
Indonesia
Japan
Japan
Ghana
Australia
Mexico
U.S.A.
66.1%
50.0%
100.0%
100.0%
100.0%
100.0%
46.5%
20.0%
100.0%
25.8%
100.0%
100.0%
30.6%
32.5%
ownership
IRON & STEEL STRATEGIES AND COORDINATION DEPT.
company name
main business
nationality
Marubeni Construction Material Lease
Co., Ltd .
Marubeni-Itochu Steel Inc.
Thai Cold Rolled Steel Sheet Public
Co., Ltd.
Leasing and sales of temporary construction materials
Japan
34.3%
Manufacture, processing, import, export and sales of steel products
Manufacture of cold-rolled steel sheet
Japan
Thailand
50.0%
37.5%
main business
nationality
ownership
BOT water recycling and desalination project for PEMEX
IPP in India
BOT water supply project, for Chengdu Municipal Government,
Sichuan Province
IPP in Thailand
Mexico
India
China
50.0%
26.0%
40.0%
Thailand
28.0%
Investment in wind power generation business entity in Spain
IPP in Taiwan
IPP of Shimamaki Wind Farm, Hokkaido
Metering of potable water and wastewater usage, utility fee collection services
Marketing and development of power projects
Operation and maintenance of Mindanao Geothermal Power Plant units 1 and 2
Execution, marketing, development and investment for power projects in Europe
U.K.
Taiwan
Japan
Japan
China
Philippines
U.K.
UTILITY & INFRASTRUCTURE
company name
• Aquasistema Salina Cruz S.A. de C.V.
BPL Power Projects (AP) Limited
Chengdu Générale des Eaux-Marubeni
Waterworks Co., Ltd.
Eastern Power and Electric Company
Limited
• Eurasia Energy & Environment Ltd.
Ever Power IPP Company Ltd.
• Hamanasu Wind Power Corporation
Jenets Co., Ltd.
• Marubeni Asian Power Ltd.
• Marubeni Energy Services Corporation
• Marubeni Europower Ltd.
100.0%
25.3%
100.0%
47.5%
100.0%
100.0%
100.0%
• Consolidated subsidiary
Marubeni Corporation 2003
89
• Marubeni Mindanao Power Holdings
Corporation
• Marubeni Miravalles Investment Ltd.
• Marubeni Pacific Energy Holdings
Corporation
• Marubeni Power Holding B.V.
• Marubeni Power International Inc.
• Marubeni Power Systems Corporation
• Marubeni Power Ventures, Inc.
• Marubeni Termovalle Investment Limited
• Mibugawa Power Company
Millmerran Power Partners
• Minami-Kyusyu Wind Power Corporation
• Nippon Utilities Management
• P.T. Matlamat Cakera Canggih
PPN Power Generating Company Limited
San Roque Power Corporation
Sarakitomanai Wind Power Corporation
• SmartestEnergy Ltd.
Tapal Energy Ltd.
• Transport Systems Engineering Co., Ltd.
Uni-Mar Enerji Yatirimlari A.S.
• Yuya Wind Power Corporation
Holding company of geothermal power project in the Philippines
Philippines
100.0%
Investment in thermal power generation business entity in Costa Rica
Holding company of geothermal power project in the Philippines
Costa Rica
Philippines
100.0%
100.0%
Investment in a power project in Tunisia
Marketing and development of power projects in Central and South America
Engineering, procurement and construction services, and IPP services
including M&A in overseas markets
Holding company of international power projects
Investment in IPP in Colombia
Operation and management of Mibugawa Hydro Power Station
Investment in IPP for merchant operations
Sales of wind-generated electricity produced in Kagoshima, Japan
Development of water/wastewater business and solid waste business
Marketing, development, contracting and execution for power project in Indonesia
IPP in India
IPP of San Roque Multipurpose Dam Project
Sales of wind-generated electricity produced in Hokkaido
Consolidation and sales of electricity and green benefits in the U.K.
Sales of diesel-generated electricity produced in Pakistan
Planning and development of transport systems
IPP in Turkey
Sales of wind-generated electricity produced in Yamaguchi, Japan
Netherlands
U.S.A
Japan
100.0%
100.0%
100.0%
U.S.A
Cayman Islands
Japan
Australia
Japan
Japan
Indonesia
India
Philippines
Japan
U.K.
Pakistan
Japan
Turkey
Japan
100.0%
100.0%
100.0%
30.0%
80.0%
33.3%
60.0%
26.0%
42.5%
49.0%
100.0%
25.0%
100.0%
33.3%
90.0%
main business
nationality
ownership
Production and supply of nitrogen for PEMEX
Mexico
35.0%
Compression of associated gas for Pemex Exploracion y Produccion
at Cantarell oil field
Investment and related services for Chandra Asri Project
Mexico
50.0%
Japan
84.6%
Investment and related services for Karnaphuri Fertilizer Co., Ltd.
Ship management, brokerage and trade of ship equipment and others
Production and sales of pulverized coal to USS Gary works
Civil work and installation of plants
Export, transport and installation of equipment and machines, plant
construction and overseas development assistance for cement, pulp and paper,
nonferrous metals, sugar, plywood and steel, oil and petrochemical plants
Import, export and domestic sales of textile machinery
Sales and service of textile machinery
Investment for American Iron Oxide Company, a joint venture manufacturing
high-purity iron oxide
Manufacture and sales of petrochemical products
Production and sales of bleached kraft pulp
Ship leasing, finance and ship owning
Investment and consulting services for Musi Pulp Project
Production of cotton yarns
Japan
Japan
U.S.A.
U.S.A.
Japan
26.8%
100.0%
100.0%
100.0%
100.0%
Japan
Thailand
U.S.A.
100.0%
60.6%
100.0%
Indonesia
Indonesia
Liberia
Japan
U.S.A.
20.8%
45.0%
49.0%
49.9%
100.0%
main business
nationality
ownership
Property management of condominiums, buildings and commercial complexes
Operation of Fuyo Country Golf Club
Operation of four golf clubs
Development and leasing of commercial complexes
Development and sales of industrial estate in Batangas State in the Philippines
Development and leasing of real estate
Sales and marketing of real estate
Engineering and construction of airconditioning systems, facilities and snow machines
Development, sales and operation of industrial estate in Bekasi, Indonesia
Japan
Japan
Japan
Japan
Philippines
Japan
Japan
Japan
Indonesia
99.3%
74.5%
100.0%
43.0%
40.0%
100.0%
100.0%
75.4%
60.0%
PLANT & SHIP
company name
Compania de Nitrogeno de Cantarell
S.A. de C.V.
Compania de Servicios de Compresion
de Campeche, S.A. de C.V.
• Japan Indonesia Petrochemical
Investment Corporation
KAFCO Japan Investment Co., Ltd.
• Koyo Line Ltd .
• MARCOP Inc .
• Marubeni Plant Contractor Inc.
• Marubeni Protechs Corporation
• Marubeni Tekmatex Corporation
• Marubeni Tekmatex (Thailand) Co., Ltd.
• MCP Iron Oxide, Inc.
PT. Chandra Asri
PT. Tanjungenim Lestari Pulp & Paper
Royal Maritime Corporation
Sumatra Pulp Corporation
• Swift Spinning Inc.
DEVELOPMENT & CONSTRUCTION
company name
• Benny Estate Service Co., Ltd.
• Fuyo Kanko Co., Ltd.
• Kohei Co., Ltd.
Koshigaya Community Plaza Co., Ltd.
Lima Land, Inc .
• Marubeni Real Estate Co., Ltd.
• Marubeni Real Estate Sales Co., Ltd.
• Marubeni Setzbi Corporation
• P.T. Megalopolis Manunggal
Industrial Development
• Consolidated subsidiary
90
Marubeni Corporation 2003
P.T. Mekanusa Cipta and four companies
• Park Lane Co., Ltd.
• Shanghai House Property Development
Co., Ltd .
Shanghai International Realty Co., Ltd.
Sin Heap Lee-Marubeni Sdn. Bhd.
Tipness Co., Ltd .
• Tsunagu Network Communications, Inc.
Housing development in Cibubur, Indonesia
Operation of Hotel Park Lane Tsurumi, Nishikasai and spa resort
Development of housing estates for local residents in Shanghai
Indonesia
Japan
China
26.0%
100.0%
60.0%
Leasing of housing for expatriates in Shanghai
Development and sales of housing in suburb of Kuala Lumpur and operation
of golf course
Operation of sports club and facilities
Internet service provider for condominiums
China
Malalysia
30.0%
40.0%
Japan
Japan
28.6%
60.0%
FINANCE & LOGISTICS BUSINESS
company name
Eastern Sea Laem Chabang Terminal
Co., Ltd.
GCI Asset Management, Inc.
Lima Logistics Corporation
• Marnix Corp.
• Marnix Europe Ltd.
• Marubeni Document Systems Inc.
• Marubeni International Finance p.l.c.
• Marubeni Logistics Corp.
• Marubeni Safenet Co., Ltd.
• Marubeni Transport Service Corp.
MG Leasing Corporation
Shanghai Wai-hong International
Logistics Co., Ltd.
main business
nationality
ownership
Container terminal operation
Thailand
29.0%
Investment advisory house
Warehousing and operation of inland container depot
Insurance broker
Insurance broker
Preparation of shipping documentation
Financial services and investment
Warehousing and total logistics services
Insurance agency
Total logistics services
Lease and sales of plants, machinery and equipment
Warehousing and total logistics services
Japan
Philippines
Japan
U.K.
Japan
U.K.
Japan
Japan
U.S.A.
Japan
China
49.7%
42.8%
100.0%
100.0%
100.0%
100.0%
100.0%
100.0%
100.0%
25.0%
25.0%
ownership
TELECOM & INFORMATION
company name
main business
nationality
Hewlett-Packard Solutions Delivery, Ltd.
Japan Cablenet Holdings Limited
Koala Television Co., Ltd.
Marunouchi Direct Access Ltd.
Integration, consultation and other related services for information systems
CATV and telecommunication operation, and management of CATV operators
CATV services in Matsudo and Nagareyama, Chiba, Japan
Area local exchange carrier, providing last-mile solutions to supply dark fiber
in Marunouchi
Development and sales of the contactless IC tag and related systems, etc.
Sales and rental of prepaid card system for pachinko games
Sales of Iwasaki lamps, lighting equipment and fixtures
Providing international/domestic combined bandwidth via own fiber-optic
cable (Type I Carrier)
Internet access service, ASP and iDC service provider (Type II Carrier)
Operation and development of information and communication systems
Global network solutions and various telecommunication services
Sales of computers, network products, semiconductor-related products, and SI
Sales of telecommunications services and equipment, IT solutions and
mobile contents
Provider of a range of customer support solutions via multimedia call
center facilities
Type I Carrier providing broadband communication service to corporate users
Broadcast of Mystery Channel on satellite broadcasting and CATV
Video transmission service, broadband media service
Marketing and sales of advanced electronic equipment/devices
Sales and engineering of telecom systems mainly in Europe and Africa
Sales and engineering of telecommunication equipment
Japan
Japan
Japan
Japan
Mighty Card Corporation
Nasca Corporation
LCA Holdings Pty. Ltd.
• Global Access Ltd.
• Global Solution KK
• Marubeni Information Systems Co., Ltd.
• Marubeni Network Systems Corporation
• Marubeni Solutions Corporation
• Marubeni Telecom Co., Ltd.
• Marubeni Telemarketing Corporation
• Metro Access KK
• Mystery Channel Inc.
• Nexion Corporation
• Marubeni Solutions USA Corporation
• Marubeni Network Systems (Europe) B.V.
• Marpless Communication Technologies
(Pty.) Ltd.
34.0%
23.0%
20.4%
49.0%
Japan
Japan
Australia
Japan
39.0%
41.4%
45.0%
100.0%
Japan
Japan
Japan
Japan
Japan
100.0%
66.0%
81.0%
91.0%
70.8%
Japan
100.0%
Japan
Japan
Japan
U.S.A.
Netherlands
South Africa
80.0%
67.2%
96.4%
91.0%
100.0%
51.0%
OTHERS
company name
Avanti Staff Corporation
• Marubeni Management Resources
Corporation
Shanghai Baihong Trading Co., Ltd.
main business
nationality
ownership
Temporary staff placement and personnel services
Management services and consulting
Japan
Japan
42.5%
100.0%
Wholesaling of domestic and imported commodities, export of domestic products,
storage, product processing, delivery, and retailing of self-supporting commodities
China
49.0%
(As of July 1, 2003)
• Consolidated subsidiary
Marubeni Corporation 2003
91
Organization
General Meeting of
Shareholders
Agri-Marine Products Div.
Board of Directors
Corporate Auditors
Textile Div.
Board of Corporate Auditors
Forest Products &
General Merchandise Div.
President
Corporate Auditor Dept.
Chemicals Div.
Corporate Management
Committee
Committee of
Chief Operating Officers
Committee of
Executive Officers
Energy Div.
Metals & Mineral Resources Div.
Transportation &
Industrial Machinery Div.
Iron & Steel Strategies and
Coordination Dept.
Utility & Infrastructure Div.
Audit Dept.
General Affairs Dept.
Plant & Ship Div.
Human Resources Dept.
Corporate Communications Dept.
Corporate Planning & Coordination Dept.
Development & Construction Div.
Corporate Strategies Dept.
Information Strategy Dept.
Finance & Logistics Business Div.
Corporate Accounting Dept.
Finance Dept.
Telecom & Information Div.
Risk Management Dept.
Legal Dept.
Business Incubation Dept.
Osaka Planning & Administration Dept.
Domestic Branches & Offices
Overseas Branches & Offices
(As of April 1, 2003)
92
Marubeni Corporation 2003
Management Policies at Marubeni
Company Doctrine
Taking up the spirits of “Fairness — Innovation — Harmony,” the Marubeni Group aims to proudly
contribute to the economy and society though fair and upright corporate activities.
Management Policy
Marubeni aims to be a resilient Group possessing the No.1 Portfolio Unit in each industry.
Goals
• Attain a solid financial structure
• Achieve net income of at least 50 billion yen
Business Strategy
Marubeni practices sound and strong operation through implementation of a diversified business model strategy.
Each of our models is based upon risk-return and cash flow management.
Corporate Data
Founded
Major Stockholders
1858
Sompo Japan Insurance Inc.
Japan Trustee Services Bank, Ltd. (Trust Account)
J.P. Morgan Trust Bank Ltd. (Tax-exempt Account)
The Master Trust Bank of Japan, Ltd. (Trust Account)
The Yasuda Mutual Life Insurance Company
Mizuho Corporate Bank, Ltd.
The Tokio Marine and Fire Insurance Company, Limited
UFJ Trust Bank Ltd. (Trust Account “A”)
Nippon Life Insurance Company
The Nichido Fire and Marine Insurance Company, Limited
Incorporated
December 1, 1949
Paid-in Capital
¥194,039,842,190
Number of Shareholders
163,891
Number of Shares Issued and
Outstanding
1,494,021,081
Stock Listings
Number of Employees
Sapporo, Tokyo, Nagoya, Osaka, Fukuoka,
Düsseldorf and Frankfurt stock exchanges
3,914 (plus 1,801 overseas employees)
Transfer Agent of Common Stock
Number of Domestic Offices*
Mizuho Trust & Banking Co., Ltd.
17
Home Page Address
Number of Overseas Branches & Offices and
Overseas Corporate Subsidiaries*
53 overseas branches & offices and 28 overseas
corporate subsidiaries with 77 offices
for a total of 130 offices in 75 countries
http://www.marubeni.com
For further information, please contact:
Corporate Communications Dept., Marubeni Corporation,
4 -2, Ohtemachi 1-chome, Chiyoda-ku, Tokyo 100-8088, Japan
Tel: 81-3-3282-2111 Fax: 81-3-3282-4241
E-mail: [email protected]
(As of March 31, 2003, except * as of April 1, 2003)
Marubeni Corporation 2003
93
Marubeni Corporation Annual Report 2003 For the fiscal year ended March 31, 2003
http://www.marubeni.com
Printed on recycled paper in Japan


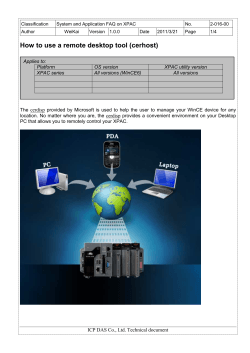
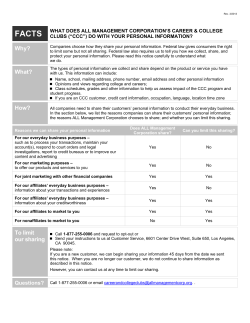
© Copyright 2026