
Only a theory: Why birds fly, why mammals stayed
Only a theory:
Why birds fly, why mammals stayed
small, and why dinosaurs became
big and died out
Marcus Clauss
Clinic for Zoo Animals, Exotic Pets and Wildlife, Vetsuisse Faculty, University of
Zurich, Switzerland
Science and Barbecue Zürich August 2012
... or how listening to interdisciplinary
gossip, riding trains and drawing
pictures can lead to high attentiongenerating and completely nonuseful hypotheses.
DFG Research Group 533
Sauropod Biology - the Evolution of Gigantism
DFG Research Group 533
Sauropod Biology - the Evolution of Gigantism
Digestive physiology supervisors
Jürgen Hummel
Marcus Clauss
DFG Research Group 533
Sauropod Biology - the Evolution of Gigantism
Digestive physiology supervisors
Jürgen Hummel
Marcus Clauss
Digestive physiology PhD students & associates
Julia Fritz
Ragna Franz Patrick Steuer
DFG Research Group 533
Sauropod Biology - the Evolution of Gigantism
(Digestive physiology) supervisors
Jürgen Hummel
Marcus Clauss
Chris Carbone
Digestive physiology PhD students & associates
Julia Fritz
Ragna Franz Patrick Steuer
DFG Research Group 533
Sauropod Biology - the Evolution of Gigantism
(Digestive physiology) supervisors
Jürgen Hummel
Marcus Clauss
Chris Carbone
Digestive physiology PhD students & associates
Julia Fritz
Ragna Franz Patrick Steuer Dennis Müller
Daryl Codron
Irina
Nurutdinova
DFG Research Group 533
Sauropod Biology - the Evolution of Gigantism
(Digestive physiology) supervisors
Jürgen Hummel
Marcus Clauss
Chris Carbone
Digestive physiology PhD students & associates
Julia Fritz
Ragna Franz Patrick Steuer Dennis Müller
Daryl Codron
Irina
Nurutdinova
Assumptions
- Niche stratification according to body size (=body mass)
- Eggs cannot increase endlessly in size because of
physical constraints on egg shell thickness (stronger
shells needed for larger eggs) and diffusion (thicker
shells prevent diffusion of oxygen)
- The K-T extinction event affected all animals above a
certain body size threshold
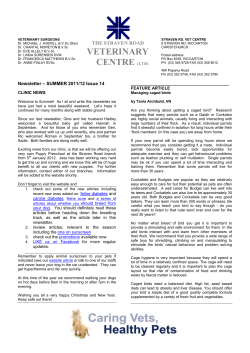
Niches of parent and offspring
adult
A
A-2
A-3
niche space
A-1
Niches of parent and offspring
adult
A
A-1
A-2
A-3
niche space
egg
Niches of parent and offspring
adult
A
A-2
egg
A-3
niche space
A-1
Niches of parent and offspring
adult
A
A-2
egg
neonate
A-3
niche space
A-1
Niches of parent and offspring
adult
A
juvenile
egg
A-2
neonate
A-3
niche space
A-1
Niches of parent and offspring
adult
A
A-1
juvenile
A-2
egg
neonate
A-3
niche space
juvenile
Niches of parent and offspring
adult
A
A-2
A-3
niche space
A-1
Niches of parent and offspring
adult
foetus
A
A-2
A-3
niche space
A-1
Niches of parent and offspring
adult
A
A-2
A-3
niche space
neonate
A-1
Niches of parent and offspring
adult
A
A-1
A-2
A-3
niche space
juvenile
Niches of parent and offspring
niche space
Niches of parent and offspring
niche space
Niches of parent and offspring
niche space
Niches of parent and offspring
niche space
Niches of parent and offspring
niche space
Niches of parent and offspring
niche space
Niches of parent and offspring
niche space
Niches of parent and offspring
niche space
Niches of parent and offspring
niche space
Niches of parent and offspring
niche space
Niches of parent and offspring
niche space
Niches of parent and offspring
niche space
Niches of parent and offspring
niche space
Niches of parent and offspring
niche space
Niches of parent and offspring
niche space
Niches of parent and offspring
niche space
Niches of parent and offspring
niche space
Niches of parent and offspring
niche space
Niches of parent and offspring
niche space
Niches of parent and offspring
niche space
Niches of parent and offspring
niche space
Niches of parent and offspring
niche space
Niches of parent and offspring
niche space
Niches of parent and offspring
niche space
Niches of parent and offspring
niche space
Niches of parent and offspring
niche space
Niches of parent and offspring
niche space
Niches of parent and offspring
niche space
Niches of parent and offspring
niche space
Niches of parent and offspring
niche space
Resulting hypothesis I
The reproductive mode of dinosaurs
(ovipary), with its intrisic limited juvenile start
size linked to ontogenetic niche
stratification, may have led to a parallel
decrease of small dinosaur species with the
increase of larger species, because
offspring of large species fill the niche space
of the smaller species.
A catastrophic event, truncating adult body
size, could therefore, in theory, wipe out the
whole reproductive dinosaur population.
Resulting hypothesis II
In contrast, the reproductive mode of
mammals (and also that of many birds due
to parental care) does not lead to an
ontogenetic niche stratification, but
offspring use the parents’ niche.
Thus, with increasing body mass of larger
species, niches of smaller species are not
usurped by the larger species’ offspring to
the same extent.
Die-offs of larger species would not leave
niches of smaller life forms empty.
Work plan
Check species assemblages for distribution
patterns (is there a ‘gap’)?
Design deterministic model to test effect of
interspecific competition on body mass
distribution of mammals and dinosaurs
before and after a simulated K-T-event
Work plan
Check species assemblages for distribution
patterns (is there a ‘gap’)?
Design deterministic model to test effect of
interspecific competition on body mass
distribution of mammals and dinosaurs
before and after a simulated K-T-event
Daryl Codron
Species distributions
Deterministic model
• Populations of different sized species of:
Dinosaurs: i1,i2…ik = {2 g to ~131 tons}
Mammals: i1,i2…ik = {2 g to ~16 tons}
Each structured by size (log2M increments, j) from neonateadult
bdinosaurs ~0.6
Mneonate = aMadultb
bmammals ~0.9
For each Mi,j, estimate:
1. initial abundance n (allometry)
2. survivorship p (r-selecting or K-selecting)
3. fecundity f (allometry; add fini,k to ni,1)
• Assume: each log2M step = ontogenetic niche shift
Deterministic model
Competition-induced mortality (α) occurs amongst
all similarly-sized individuals (symmetric)
• Density of each i after competition:
Ni = pi,j ni,j – α(Σ[pi,j nj] – pi,jni,j)
Independent α for D on M and M on D:
Dinosaurs: NDi = Σ[nDi,j – αDD(ΣnDj–nDi,j) - αMD(ΣnMj)]
Mammals: NMi = Σ[nMi,j – αMM(ΣnMj – nMi,j) - αDM(ΣnDj)]
Simulate K-T: kill all individuals >25 kg
Model results - no competition
Dinosaurs
(non-avian)
Aves
Mammalia
0.06
αDD = 0.00
αMM = 0.00
αDM = 0.00
αMD = 0.00
0.04
relative abundance
0.02
0.00
-9
-7
-5
-3
-1
1
3
5
log2Madult (kg)
7
9
11
13
15
17
Model results - mild competition-induced mortality
Dinosaurs
(non-avian)
Aves
Mammalia
0.06
αDD = 0.1
αMM = 0.1
αDM = 0.00
αMD = 0.00
0.04
relative abundance
0.02
0.00
-9
-7
-5
-3
-1
1
3
5
log2Madult (kg)
7
9
11
13
15
17
Model results - stronger competition
0.10
Dinosaurs
(non-avian)
Aves
Mammalia
αDD = 0.15
αMM = 0.15
αDM = 0.00
αMD = 0.00
0.08
0.06
0.04
relative abundance
0.02
0.00
-9
-7
-5
-3
-1
1
3
5
log2Madult (kg)
7
9
11
13
15
17
Model results - including competition from dinosaurs on mammals
Dinosaurs
(non-avian)
Aves
Mammalia
0.12
αDD = 0.15
αMM = 0.15
αDM = 0.15
αMD = 0.00
0.10
0.08
0.06
relative abundance
0.04
0.02
0.00
-9
-7
-5
-3
-1
1
3
5
log2Madult (kg)
7
9
11
13
15
17
Model results - ... and from mammals on dinosaurs
Dinosaurs
(non-avian)
Aves
Mammalia
0.20
0.18
αDD = 0.15
αMM = 0.15
αDM = 0.15
αMD = 0.15
0.16
0.14
0.12
0.10
relative abundance
0.08
0.06
0.04
0.02
0.00
-9
-7
-5
-3
-1
1
3
5
log2Madult (kg)
7
9
11
13
15
17
Model results - ... and from mammals on dinosaurs
Dinosaurs
(non-avian)
Aves
Mammalia
0.20
0.18
αDD = 0.15
αMM = 0.15
αDM = 0.15
αMD = 0.15
0.16
0.14
0.12
0.10
relative abundance
0.08
0.06
0.04
0.02
0.00
-9
-7
-5
-3
-1
1
3
5
log2Madult (kg)
7
9
11
13
15
17
Model results - after K/T, with competition
0.12
Dinosaurs
(non-avian)
Aves
Mammalia
0.10
αDD = 0.15
αMM = 0.15
0.08
0.06
relative abundance
0.04
0.02
0.00
-9
-7
-5
-3
-1
1
3
5
log2Madult (kg)
7
9
11
13
15
17
Deterministic model
• Robustness and sensitivity
Changes and variability in M effects on:
1. life history strategy
2. reproductive output
3. Madult:Mneonate ratio
4. competition co-efficient (α)
5. symmetry of α
6. abundance
Stochastic parameter estimates (bounded within
empirical limits for birds/herpetiles or mammals), 103 iterations
Model results - variation in neonate scaling, demography, and ecology
pre K-T
post K-T
variable adult-neonate mass scaling exponent
0.25
0.20
0.15
0.10
0.05
0.00
-9
-7
-5
-3
0.20
0.16
0.12
0.08
0.04
0.00
-1
1
3
5
7
9
-7
-5
-3
-1
1
3
5
7
9
-9
-7
-5
-3
-1
1
3
5
7
9
11 13 15 17
relative abundance
variable fertility (birth rate)
-7
-5
-3
-1
1
3
5
variable
0.50
0.40
0.30
0.20
0.10
0.00
-9
-7
-5
-3
-1
1
3
5
7
9
-7
-5
-3
-1
1
3
-7
-5
7
9
-3
-1
1
3
-9
-7
-5
-3
-1
1
3
5
7
9
5
7
9
-9
-7
-5
-3
-1
1
3
5
7
9
0.20
0.16
0.12
0.08
0.04
0.00
7
9
11 13 15 17
11 13 15 17
variable fertility (birth rate)
0.12
0.10
0.08
0.06
0.04
0.02
0.00
α
11 13 15 17
variable abundance-mass scaling exponent
0.12
0.10
0.08
0.06
0.04
0.02
0.00
11 13 15 17
5
variable initial abundance
-9
11 13 15 17
0.25
0.20
0.15
0.10
0.05
0.00
-9
-9
0.12
0.10
0.08
0.06
0.04
0.02
0.00
variable abundance-mass scaling exponent
0.10
0.08
0.06
0.04
0.02
0.00
0.14
0.12
0.10
0.08
0.06
0.04
0.02
0.00
11 13 15 17
variable initial abundance
-9
variable adult-neonate mass scaling exponent
11 13 15 17
variable
11 13 15 17
-9
Dinosaurs (non-avian);
Aves;
log2Madult (kg)
-7
-5
-3
-1
Mammalia
1
3
5
7
9
α
11 13 15 17
Conclusions
Size-specific competition influences species diversity
- Effects largest amongst species with high intraspecific
niche breadth (e.g. large, oviparous)…
- … favouring large-bodied taxa
Explains paucity of small-bodied dinosaurs
- Dominance of large dinosaurs then limited max BM of
other vertebrate groups in Mesozoic…
- … resultant dominance of small taxa amongst mammals
further limited small dinosaurs (=aerial niche?)
Extinction event above body mass threshold = remaining
species diversity too low for recovery


© Copyright 2026