
The University of Chicago
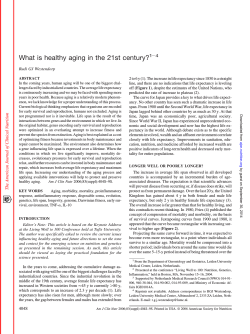
The University of Chicago
The Size–Life Span Trade-Off Decomposed: Why Large Dogs Die Young
Author(s): Cornelia Kraus, Samuel Pavard and Daniel E. L. Promislow,
Reviewed work(s):
Source: The American Naturalist, (-Not available-), p. 000
Published by: The University of Chicago Press for The American Society of Naturalists
Stable URL: http://www.jstor.org/stable/10.1086/669665 .
Accessed: 26/02/2013 12:37
Your use of the JSTOR archive indicates your acceptance of the Terms & Conditions of Use, available at .
http://www.jstor.org/page/info/about/policies/terms.jsp
.
JSTOR is a not-for-profit service that helps scholars, researchers, and students discover, use, and build upon a wide range of
content in a trusted digital archive. We use information technology and tools to increase productivity and facilitate new forms
of scholarship. For more information about JSTOR, please contact [email protected].
.
The University of Chicago Press, The American Society of Naturalists, The University of Chicago are
collaborating with JSTOR to digitize, preserve and extend access to The American Naturalist.
http://www.jstor.org
This content downloaded on Tue, 26 Feb 2013 12:37:58 PM
All use subject to JSTOR Terms and Conditions
vol. 181, no. 4
the american naturalist
april 2013
The Size–Life Span Trade-Off Decomposed:
Why Large Dogs Die Young
Cornelia Kraus,1,2,* Samuel Pavard,1,3 and Daniel E. L. Promislow4
1. Laboratory of Survival and Longevity, Max Planck Institute for Demographic Research, Rostock, Germany; 2. Department of
Sociobiology/Anthropology, University of Go¨ttingen, Go¨ttingen, Germany; 3. Eco-Anthropologie et Ethnobiologie, Unite´ Mixte de
Recherche 7206, Centre National de la Recherche Scientifique, Muse´um National d’Histoire Naturelle, Universite´ Paris Diderot,
Sorbonne Paris Cite´, F-75005 Paris, France; 4. Department of Genetics, University of Georgia, Athens, Georgia 30602
Submitted July 7, 2011; Accepted November 7, 2012; Electronically published February 21, 2013
Online enhancements: PDF appendixes.
abstract: Large body size is one of the best predictors of long life
span across species of mammals. In marked contrast, there is considerable evidence that, within species, larger individuals are actually
shorter lived. This apparent cost of larger size is especially evident
in the domestic dog, where artificial selection has led to breeds that
vary in body size by almost two orders of magnitude and in average
life expectancy by a factor of two. Survival costs of large size might
be paid at different stages of the life cycle: a higher early mortality,
an early onset of senescence, an elevated baseline mortality, or an
increased rate of aging. After fitting different mortality hazard models
to death data from 74 breeds of dogs, we describe the relationship
between size and several mortality components. We did not find a
clear correlation between body size and the onset of senescence. The
baseline hazard is slightly higher in large dogs, but the driving force
behind the trade-off between size and life span is apparently a strong
positive relationship between size and aging rate. We conclude that
large dogs die young mainly because they age quickly.
Keywords: size, life span, baseline hazard, aging rate, onset of senescence, dogs.
Introduction
You can’t have it all. Organisms cannot allocate unlimited
resources to growth, maintenance (repair), and reproduction throughout life. Trade-offs between these traits are
inevitable. Although large size can increase short-term survival and fecundity, growing large rapidly and maintaining
a large body size might come at the cost of reduced survival
later in life. There is considerable evidence that growing
fast can compromise an individual’s life span (Metcalfe
and Monaghan 2003; Austad 2010). Mice, rats, and dogs
selected for a high growth rate and/or a large body size
exhibit reduced longevity (Patronek et al. 1997; Miller et
* Corresponding author; e-mail: [email protected].
Am. Nat. 2013. Vol. 181, pp. 000–000. 䉷 2013 by The University of Chicago.
0003-0147/2012/18104-53149$15.00. All rights reserved.
DOI: 10.1086/669665
al. 2000, 2002; Bartke et al. 2001a; Rollo 2002), and there
is some evidence that increased weight and height might
be detrimental to human health (Samaras 2009). The relationship between growth and longevity also holds across
species. Even though a strong positive relationship between
body size and life span exists in mammals (Gaillard et al.
1989; Promislow and Harvey 1990), postnatal growth rate
and adult life span are inversely correlated when controlling for body size (de Magalhaes et al. 2007).
The domestic dog, Canis lupus familiaris, provides us
with an ideal opportunity to understand how the shape
of age-specific mortality curves has evolved under strong
directional selection for body size. Body size varies by
almost two orders of magnitude (from Chihuahuas to
mastiffs; Moody et al. 2006; Sutter et al. 2008) and longevity by a factor of two: small breeds are expected to
live about 10–14 years, whereas large breeds die at a
median age of 5–8 years (Michell 1999; Proschowsky et
al. 2003). Large dogs grow considerably faster and also
take longer to reach adult weight (Kirkwood 1985; Favier
et al. 2001; Hawthorne et al. 2004; Galis et al. 2007).
Having exchanged natural selection for artificial selection
some 9,000 generations ago (Lindblad-Toh et al. 2005),
dogs might seem a rather unsuitable species to help us
answer evolutionary questions. But one can envision the
making of the roughly 400 dog breeds known today as
a large-scale selection experiment for a wide variety of
traits, ranging from body size to complex behavioral
traits. Domestication and selective breeding have produced earth’s most phenotypically variable mammal
(Austad 2005; Moody et al. 2006). This provides a unique
chance to identify and characterize trade-offs between
life-history traits. Often, such trade-offs are difficult to
measure in observational data. Across species, negative
correlations can be masked by correlated responses of
other traits such as fecundity. Within species, trade-offs
are often obscured by a high positive covariance due to
This content downloaded on Tue, 26 Feb 2013 12:37:58 PM
All use subject to JSTOR Terms and Conditions
000 The American Naturalist
variation in individual quality (Reznick et al. 2000; Metcalfe and Monaghan 2003). At the level of single strains
or breeds within a species, the size-longevity relationship
is inconsistent (mice: Anisimov et al. 2004; Drosophila:
Khazaeli et al. 2005; dogs: Galis et al. 2007), perhaps
because of lack of variation. Under natural conditions,
where extrinsic mortality factors play a large role, increased body size often improves survival prospects (e.g.,
ungulates: Gaillard et al. 2000; rodents: Sauer and Slade
1987). Covariation of life-history traits across dog breeds
directly selected for certain trait values, such as a standard
body size, can provide a valuable addition to experimental studies of trade-off functions.
Why do large dogs die young? Life span is often used
as a proxy for aging (Monaghan et al. 2008). However,
life span is the outcome of several components of the
mortality trajectory: the early mortality decline, the onset
of senescence, the baseline mortality (i.e., the lowest
point in the hazard curve, sometimes also called level of
mortality, initial mortality, or age-independent mortality), and/or the rate of aging, which is determined by
age-related changes in intrinsic susceptibility (fig. 1). Artificial selection for large size in yellow dung flies resulted
in increased juvenile mortality, but only in stressful environments (Teuschl et al. 2006). In dwarf mice, it has
been suggested that the increased longevity is a consequence of a delayed onset of senescence (Bartke et al.
2001b). Fast growth in natural populations of perch and
lizards resulted in increased adult mortality (Olsson and
Shine 2002; Metcalfe and Monaghan 2003). The costs of
rapid growth might also be paid late in life: comparative
analyses have linked pre- as well as postnatal growth rate
to senescence rates in mammals and birds (Ricklefs and
Scheuerlein 2001; Ricklefs 2006).
Here our aim is to decompose the size–adult life expectancy trade-off by comparing mortality trajectories
across 74 dog breeds. We attempt to test three specific—
nonexclusive—hypotheses. The decreased life expectancy
of large dogs compared to their smaller conspecifics might
be due to (1) an earlier onset of senescence (fig. 1B), (2)
a higher minimum mortality hazard (fig. 1C), and/or (3)
an increased rate of aging (fig. 1D).
Methods
Data
Mortality curves were derived from age at death data for
dogs from the Veterinary Medical Database (VMDB).1
These data include dogs seen at veterinary teaching hos1
Veterinary Medical Database (VMDB), http://www.vmdb.org/; VMDB
does not make any implicit or implied opinion on the subject of the article
or study.
pitals throughout North America and have been used to
study mortality in dogs previously (Li et al. 1996; Patronek
et al. 1997; Galis et al. 2007). Among other variables, this
data set includes information on breed, sex, age at death,
and body mass. The data set covers the years 1984–2004.
We selected all breeds for which at least 120 individuals
were available. Because very early mortality is likely to be
highly biased (stillbirth, neonatal, and early mortality are
presumably much less likely to be seen at a teaching hospital), we excluded animals that died during the first 2
months of life. In contrast to some earlier studies using
the VMDB (e.g., Galis et al. 2007), we did not exclude
any causes of death, such as accidents. We consider them
an integral part of the (likely largely age-independent)
general level of mortality. In total, 56,637 individuals from
74 breeds were included in the final data set (see supplementary material, table A1, available online).
In the VMDB, age at death is recorded as a categorical
variable (0–15 days, 15–60 days, 2–6 months, 6 months–
1 year, 1–2 years, 2–4 years, 4–7 years, 7–10 years, 10–15
years, 115 years). These interval-censored data were used
to estimate age-specific mortality for each breed. Data on
breed weight were obtained from Sutter et al. (2007, supplementary material). We decided not to use the weight
at death recorded in the database for several reasons. (1)
As with age at death data, body weight data are interval
censored (weight categories in pounds: 0–1, 1–5, 5–15,
15–30, 30–50, etc.). As a result, resolution in body weight,
especially for the larger breeds for which the last weight
interval is “1100 pounds” (145.5 kg), would be poor. (2)
Individual weight is unknown in 16,453 cases (∼30%). (3)
For the young ages, individuals are not fully grown, and
hence the weight category given in the database is not
representative of size/growth. (4) Especially at older ages,
diseases leading to death might cause substantial weight
loss, such that weight recorded did not reflect normal adult
weight in that individual. A recent study suggested that
the relatively small variation within most breeds makes
average breed values a suitable surrogate for individual
measures (Sutter et al. 2008).
We assume here that our data set, based on observed
deaths of patients in teaching hospitals, will be subject
to certain biases. First, our models assume that the distribution of ages at death is the same as the distribution
of age structure in the population at large. However, it
is likely that individuals dying at a teaching hospital represent a nonrandom sample of diseases, ages, and breeds.
Dogs with rare or difficult-to-treat diseases are probably
more likely to be brought to a teaching hospital than
dogs with more common or untreatable disorders (see
also discussion in Patronek et al. 1997). Additionally, the
relative frequency of mixed-breed versus purebred dogs
might be lower at teaching hospitals than neighborhood
This content downloaded on Tue, 26 Feb 2013 12:37:58 PM
All use subject to JSTOR Terms and Conditions
A
B
C
D
-2.0
0
-3.0
0.0
-1.0
-3.0
-2.0
log h(age)) (years-1)
-1.0
0.0
Why Large Dogs Die Young 000
0
5
10
15
20
0
5
10
15
20
age (years)
Figure 1: A decline in life expectancy can be due to changes (solid line to dashed line) in different components of the mortality hazard
trajectory h(age): A, increased early mortality; B, an earlier onset of senescence, age a; C, an increased minimum hazard h(a); and D, an
increased rate of aging. Vertical gray lines mark age a, horizontal gray lines mark h(a). Here we investigate scenarios B–D.
clinics. Because mixed-breed dogs live longer than purebred dogs (Patronek et al. 1997), this could alter observed
mortality dynamics. These or other biases in our data
set could account for the fact that mean life expectancy
estimates are lower in this data set than those from other
sources. However, they do show the same pattern of size
dependence as seen previously (Patronek et al. 1997;
Michell 1999; Proschowsky et al. 2003; Galis et al. 2007).
Second, data quality may be particularly low for early
mortality because it is often sudden and therefore not
likely to be seen at a teaching hospital. Third, the lower
sample sizes at the oldest ages mean that the uncertainty
of the estimates of mortality rates at older ages increases.
Finally, we do not know the size of the “at risk” population for each breed and age class (i.e., the healthy dogs
in each age class). We therefore assume that the population of each breed was stationary during the 20-year
period analyzed here (i.e., constant population size and
stable age distribution). Thus, while this is the most extensive analysis of age-specific mortality dynamics in
dogs undertaken to date, we need to bear these caveats
in mind as we interpret our findings.
Mortality Hazard Functions
Because exact ages at death were not available, and because
we excluded mortality until 2 months of age, we used
survival analysis for interval-censored data (Klein and
Moeschberger 2005). Failure time Ti (i.e., the age at death
of dog i), is known to occur within a given age interval,
[L i , R i], with Li denoting the lower and Ri the upper age
limits of an interval. Each individual is defined by a set
of three binary operators d1, i, d2, i, and d3, i defining three
possibilities: (1) the failure time Ti occurred before the
first observation time (Ti ≤ R first, i), so d1, i p 1, d2, i p 0,
and d3, i p 0; (2) the failure time Ti occurred within a given
interval (L t, i ! Ti ≤ R t, i), so d1, i p 0, d2, i p 1, and
d3, i p 0; or (3) the failure time Ti was not observed because death occurred within the last open interval (Ti 1
L last, i), so d1, i p 0, d2, i p 0, and d3, i p 1. For each dog,
the effective observations are (Li, Ri, d1, i, d2, i, d3, i). The
likelihood function over the N individuals is of the form
N
L ∝ 写 ip0 [1 ⫺ S(R i)]d1, i[S(L i) ⫺ S(R i)]d 2, iS(L i)d 3, i, where S(Li)
and S(Ri) are the survival probabilities at the beginning
and the end of each interval.
This content downloaded on Tue, 26 Feb 2013 12:37:58 PM
All use subject to JSTOR Terms and Conditions
000 The American Naturalist
Hazard Models Considered
Model Fitting and Selection
We fitted several parametric survival models. In mammals,
the mortality hazard first decreases throughout the juvenile
period until an age, a, at which the hazard reaches its
minimum, h(a) (note that for our purposes, a is defined
only by the hazard, not by sexual maturity). Mortality then
increases continuously from age a onward. We therefore
fitted a set of common hazard models following this general pattern. The general structure of the models fitted
differs by the number of terms incorporated (two or three).
Each term stands for an additive mortality hazard that
together constitute a competitive risk model. These general
structures were h(t) p h 1(t) ⫹ h 3(t) and h(t) p h 1(t) ⫹
h 2 ⫹ h 3(t), where h1(t) is a negative exponential- or powerbased function capturing the decrease in mortality with
age during early life; h 2 p a 2 is a constant scaling up or
down of the entire hazard function; and h3(t) is a positive
exponential- or power-based function capturing the senescent mortality. The constant h2, when incorporated,
allows the hazard to almost plateau (slow increase) for
young adults, by decoupling the early and late rapid mortality changes to some extent.
We fitted the general structure above for all possible
combinations of h1(t) and h3(t) corresponding to either a
Weibull function (i.e., h 1(t) p b1l 1t b1⫺1 with 0 ! b1 ! 1
and h 3(t) p b3 l 3t b3⫺1 with b3 1 1; Weibull 1951) or a
Gompertz function (i.e., h 1(t) p a 1e⫺b 1t and h 3(t) p
a 3e b 3t; Gompertz 1825). We have chosen the Gompertz
and the Weibull functions because they are the most commonly used ones for human and animal mortality and
have been found to fit a variety of species (e.g., Siler 1979;
Juckett and Rosenberg 1993; Wilson 1994; Ricklefs and
Scheuerlein 2001; Moorad et al. 2012). In particular, the
Weibull function (power function) is very flexible and can
accommodate a large range of shapes for the hazard increase with age: from accelerating to constant (linear hazard increase) and decelerating hazards. Other potential
candidate models such as the Kannisto or the logistic survival model require the estimation of even more parameters (for a comparison, see Thatcher et al. 1998). However, even the five-parameter models failed to reach a
convergent likelihood solution for some breeds (likely due
to the interval-censored nature of the age at death data).
Models with even more parameters exacerbate this problem. For each breed, we therefore fitted eight models. If
we denote W⫺ and W⫹ the decreasing and increasing
Weibull functions, respectively, h the constant second
term, and G⫺ and G⫹ the decreasing and increasing
Gompertz functions, these eight models can be denoted:
G⫺G⫹, G⫺hG⫹, G⫺W⫹, G⫺hW⫹, W⫺G⫹, W⫺hG⫹,
W⫺W⫹, W⫺hW⫹. Model G⫺hG⫹ is also known as the
Siler model for animal mortality (Siler 1979).
All models were fitted using the Nelder-Mead algorithm
implemented in the “optim” function of the Stats package
in the statistical program R (ver. 2.9.2; Nelder and Mead
1965; R Development Core Team 2011). For each model,
the corrected Akaike Information Criterion (AICc) for
small sample sizes was computed (Burnham and Anderson 2002). The model with the lowest AICc was selected as the best-supported model in our candidate set
of models. In 32 out of 74 cases, the DAICc (here, AICc
of the second-best model minus the AICc of the top
model) was below 2. This suggests that the second-best
model was almost equally well supported by the data.
Nonetheless, including the second-best model for these
breeds in the regression analyses (see below) yielded
quantitatively very similar results. In four cases, only one
model converged. For each breed, the selected model, the
model parameters, and select derived parameters are
listed in supplementary table A1.
Key Parameters for Analyzing Age-Specific Mortality
Because of the interval-censored nature of the data and
because the covariate of interest, body size, was available
only as a breed average, we could not use an individualbased approach for analyzing the relationship between
breed size and mortality. Rather, the mortality parameters
of interest (table 1) were analyzed as a function of body
size using linear regression at the breed level.
Comparing the mortality hazard across populations at
a given chronological age t can confound the effects of
size on baseline mortality with the effects of size on aging.
If two populations differ in the onset of senescence, at a
given age, one population will be further along their hazard
trajectory than the other. Hence, for the population that
starts aging earlier, aging will have already contributed
more to the hazard level at this age relative to the population that just started aging. Therefore, we analyzed the
mortality-size relationships as a function of t (hereafter
called “relative age”) such that chronological age t p
a ⫹ t. Rooting the hazard functions at age a allows us to
describe the speed at which mortality hazard is changing
t years after a.
In case our estimates of a are biased, given that the
location of the minimum of a bathtub-like function can
only be estimated with substantial uncertainty, and due to
the data quality problems mentioned above, we also analyzed how size affects baseline mortality and the agespecific increase in the mortality hazard using chronological age. Thus, we can ask whether, at a given chronological
age, large dogs exhibit a higher mortality hazard than small
dogs and whether mortality rates increase faster with age
This content downloaded on Tue, 26 Feb 2013 12:37:58 PM
All use subject to JSTOR Terms and Conditions
Why Large Dogs Die Young 000
Table 1: Parameters describing mortality patterns at the breed level
Parameter
Notation
Onset of senescence
Adult life expectancy
Baseline hazard
Absolute rate of aging
a
e(a)
h(a)
h(a ⫹ t)
Relative rate of aging
h(a ⫹ t)/h(a ⫹ t)
Description
Age at which the mortality hazard is at its lowest point
Remaining life expectancy at age a
Mortality hazard at age a; estimates the minimum hazard
Describes the speed at which the mortality hazard is increasing
at the relative age t (t years after a)
Describes the speed at which the mortality hazard is increasing
at the relative age t (t years after a), relative to the hazard
at this age
in large dogs. We chose 4 years as the starting point for
these analyses because mortality has begun to increase for
all breeds at this age (see table A1 and fig. A1, available
online). As a consequence, however, the effects of size on
the baseline hazard will be slightly overestimated. Because
the results of these analyses largely parallel those for relative age, we present them in the supplementary material
(tables B1, B2; figs. B1–B4, available online).
To make sure that the results obtained in the parametric
analyses were robust and not simply a result of the hazard
functions imposed, we also used nonparametric survival
analysis to estimate a piecewise (per interval) constant
hazard function. The results of the nonparametric hazard
functions match those using the parametric mortality
models, albeit with higher uncertainty levels, and hence
are only presented in the supplementary material (tables
C1, C2; figs. C1–C4, available online).
Onset of Senescence. We did not use our estimates of the
early mortality decline for inference because of data quality
issues discussed above. We used these data (from the age
of 2 months onward), however, to be able to estimate the
onset of senescence. To investigate whether body size affects the onset of senescence, we calculated the age a that
separates the phase of decreasing mortality during early
life from the phase of increasing mortality later in life (i.e.,
senescent mortality). It does not necessarily coincide with
the age of sexual maturity or the end of the growth period.
For mortality hazard functions incorporating only Gompertz terms, age a at which mortality is the lowest can be
calculated analytically by solving the equation h (t) p 0.
In this case, a p [log (a 1b1) ⫺ log (a 3b3 )]/ (b1 ⫹ b3 ). For
hazard models that include a Weibull component, we
solved the equation h (t) p 0 numerically using the function “uniroot” in R (R Development Core Team 2011).
Adult Life Expectancy. We first examine the relationship
between body size and the life expectancy estimates derived
from the best-fitting mortality functions. We estimated
remaining life expectancy at age a by numerical integration. Remaining life expectancy e(a) represents “adult life
expectancy” (i.e., mean years to death after a, throughout
the complete period of increasing mortality).
Baseline Hazard. To investigate whether the trade-off between life span and size across dog breeds is driven mainly
by an increase in the overall level of mortality, we compared the baseline hazard h(a) across breeds.
Absolute and Relative Rate of Aging. Demographic senescence is usually defined as an increase of mortality with
age. Still, measuring the rate of aging is far from straightforward and many different measures have been proposed
and debated (e.g., Promislow 1991; Partridge and Barton
1996; Ricklefs and Scheuerlein 2002; Williams et al. 2006;
Moorad et al. 2012). Here we quantify the speed of aging
and its relationship to size on two levels: an absolute and
a proportional one. First, we calculated the absolute increase in mortality simply as the first derivative of the
hazard function h (t), which we hereafter call the “absolute
rate of aging.” To us, this seems the most direct translation
of the definition of aging as an “increase in mortality rate
over age” into mathematics. Because h2 is independent of
age, h (t) p h 1 (t) ⫹ h 3 (t), where the derivatives of the negative and the positive Gompertz are ⫺a 1b1e⫺b 1t and
a 3b3e b 3t, respectively, and the derivative of the Weibull term
is l(b ⫺ 1)bt b⫺2. Second, we calculated the increase in
mortality relative to the level of mortality at this age as
the ratio h(t)/h(t), which we hereafter call the “relative
rate of aging.” This is comparable to the commonly used
actuarial rate of aging. For the Gompertz function, this
ratio equals the parameter b (i.e., the actuarial rate of
aging; Gompertz 1825). For the Weibull function, this ratio
is itself a function of age t, h (t)/h(t) p (b ⫺ 1)/t. With
increasing age, h1(t) approaches 0, and hence the relative
rate of aging converges to h 3 (t)/h 3(t) or h 3 (t)/[h 2 ⫹ h 3(t)].
This approach has the advantage that we can compare
aging rates even if populations differ in their type of hazard
function. Additionally, it allows us to investigate how the
rate of aging itself changes with age, as suggested by Williams et al. (2006). On the other hand, this can be seen
as a drawback because we cannot derive one neat summary
This content downloaded on Tue, 26 Feb 2013 12:37:58 PM
All use subject to JSTOR Terms and Conditions
000 The American Naturalist
measure such as the Gompertz b and simply compare this
statistic across populations. Therefore, we estimated the
relationship between size and aging rate at three points in
time during the senescent period—ages a ⫹ 2, a ⫹ 4, and
a ⫹ 7 years.
Statistical Analyses
To test whether body size or sample size affected which
model provided the best fit for the mortality data of the
given breeds, we employed one-way ANOVAs with model
type as a categorical variable. We used simple linear regression to estimate the slope of the relationships between
breed size and the single mortality components. For most
parameters, we had to log-transform the response variable
to linearize the relationship and to meet standard linear
model assumptions, which we checked using diagnostic
plots. In some cases, there were some outliers (between 1
and 3), but removing these did not change the estimated
coefficients substantially and only increased R2 by a few
percent; therefore we retained all data in the final analyses
and graphs presented. Our focus here is on describing the
shape and the strength of the relationships between size
and components of the mortality trajectory. We still do
report F and P values, even though we are well aware that
they are necessarily not exact, because we could not easily
integrate the uncertainty about our model parameters in
the regression analyses. Still, to test how sensitive our results are to this problem, we repeated the analyses with a
weighted linear regression using the square root of sample
size as weight. As with model selection uncertainty, results
were quantitatively very similar, and hence here we present
only the regression with equal weight for all breeds. We
also do multiple tests on different derived parameters
based on the same directly estimated parameters. Still,
these values should allow a rough evaluation of the relative
support for the different relationships we estimate.
Breeds differ in their degree of genetic relatedness. In
a statistical analysis, breeds that are genetically similar are
expected to be relatively similar to one another in phenotypic traits as well. As such, each breed value does not
represent a fully independent point, as is generally assumed
in statistical analysis. There are a variety of methods for
correcting for this among species (Harvey and Pagel 1991),
as well as among genotypes within species (Kang et al.
2008). Models among species assume that species are not
a product of hybrids (clearly not true for dog breeds; Parker et al. 2004), and models to correct for relatedness,
allowing for reticulate evolution, have been designed primarily for genome-wide association studies (Kang et al.
2008). In the present case, P values may be somewhat
smaller than the true P values because we will have slightly
overestimated the biologically true degrees of freedom.
Results
Size and the Best-Fitting Model
Most of the 74 breeds showed a Gompertz-like increase
in the mortality hazard (n G⫺G⫹ p 37, nG⫺hG⫹: 21,
n G⫺W⫹ p 13, nG⫺hW⫹: 3; see table A1 for more details).
Body size affected which of the candidate models provided
the best fit for the mortality data of a breed (one-way
ANOVA, response: size, factor: “model”: F3, 70 p 3.52,
P p .019). Breeds for which the model G⫺hG⫹ fits best
were on average smallest and those for which the model
G⫺W⫹ fits best were on average largest. An inclusion of
the constant hazard h2 was linked to a 10-kg difference in
weight, although only three breeds were fitted best by
model G⫺hW⫹ (mean size Ⳳ SD: size G⫺G⫹ p 26 Ⳳ 18
kg, size G⫺hG⫹ p 17 Ⳳ 12 kg, size G⫺W⫹ p 35 Ⳳ 18 kg,
size G⫺hW⫹ p 26 Ⳳ 2 kg). The model that fit best did not
depend on sample size (ANOVA, response: n, factor
“model”: F3, 70 p 0.544, P p .65).
Size and Mortality Components
Table 2 provides a summary of the linear regression estimates and statistics describing the relationship between
size and all mortality components considered. In the following paragraphs, we describe these relationships in more
detail.
The results for chronological age and the nonparametric
analyses parallel those of the parametric ones for relative
age to a large degree and are therefore presented in the
supplementary material (app. B and app. C).
Size and the Onset of Aging
The mean age at the onset of senescence among dog breeds
was 2.15 years (Ⳳ0.77 SD). We found no statistically significant relationship between body size and the onset of
aging (fig. 2A; table 2). The only conspicuous feature of
this relationship is that the largest dogs (“giant” breeds,
150 kg) all start aging rather early—in fact, before they
are fully grown.
Size and Life Expectancy
Reaching a, dogs could expect to live on average for
6.47 Ⳳ 1.12 more years. Our analyses revealed a strong
negative relationship between adult life expectancy and
size: size explained 44% of the variance in life expectancy
at a (table 2; fig. 2B).
This content downloaded on Tue, 26 Feb 2013 12:37:58 PM
All use subject to JSTOR Terms and Conditions
Why Large Dogs Die Young 000
Table 2: Linear regression estimates and statistics for the relationship between size and several components of mortality
Parameter
b
SE(b)
R2
F1, 72
a
e(a)
log(h(a))
log(h(a ⫹
log(h(a ⫹
log(h(a ⫹
log(h(a ⫹
log(h(a ⫹
log(h(a ⫹
⫺.0006
⫺.0431
.0074
.0251
.0240
.0198
.0144
.0094
.0021
.0053
.0058
.0032
.0037
.0029
.0025
.0040
.0026
.0021
K.001
.013
56.04
5.49
44.99
69.46
62.97
12.79
13.30
1.046
2))
4))
7))
2)/h(a ⫹ 2))
4)/h(a ⫹ 4))
7)/h(a ⫹ 7))
.438
.071
.385
.491
.467
.151
.156
.143
P
.909
K.001
.022
K.001
K.001
K.001
.004
!.001
!.001
Note: The parameter notation is explained in table 1.
Size and the Baseline Hazard
Large dogs did have a somewhat higher hazard at age a
compared to their smaller counterparts, with the hazard
increasing with size (fig. 2C; table 2). However, the relationship is not very strong: size explained only 7% of the
variance in the baseline hazard across breeds. The modest
explanatory power of size regarding the baseline hazard
suggests that this effect is not the main mechanism by
which size affects life expectancy. At the chronological age
of 4 the relationship is stronger, explaining 15% of the
variance in the mortality hazard across breeds (see supplementary material, table B1; fig. B2), suggesting that, by
this age, aging has already started to drive the hazard
curves of small and large dogs further apart.
Size and the Rate of Aging
The absolute rate of aging (measured as the first derivative
of the hazard function) showed a strong positive correlation with size (table 2; fig. 3); that is, the speed at which
the mortality hazard increases following the onset of senescence increases with body size. Likewise, given that a
dog has reached a certain age (chronological age perspective), the absolute rate of aging increases with body size
(see table B2; fig. B3). A clustering of breeds according to
the best mortality model fitted is evident (fig. 3): breeds
that aged according to the Weibull function had higher
aging rates than those fit by the Siler model (G⫺hG⫹).
The slope of the relationship between size and aging rate
remained rather stable over age, but the variance in aging
rate explained by body size increased from 39% to ∼48%
from age a ⫹ 2 to later ages (table 2). The latter effect
occurs because on a log scale, the first derivative of the
Weibull function increases more slowly with age (log (t))
than the Gompertz function, decreasing the variance in
aging rates between Gompertz and Weibull breeds.
The relative rate of aging—that is, the increase in the
hazard relative to the hazard level at this age—also in-
creases with size. However, the effect is clearly smaller than
for the absolute rate of aging; its slope decreases with age
and is not significantly different from 0 for a ⫹ 7 (table
2; fig. 4). This is mainly because the smaller breeds fitted
best by the Siler model and have a lower relative aging
rate than the Weibull-fitted breeds, which are on average
larger. For the Gompertz-fitted breeds, the size relationship
should stabilize with age because the relative rate of aging
converges to b3, whereas for the Weibull-fitted breeds it
declines with age. The same pattern is shown for chronological age (table B2; fig. B4).
Size and Life Expectancy Revisited
After describing how size is related to the single components of the hazard trajectory, here we set out to quantify
how much of the variation in life expectancy can be explained by size when acting through the baseline hazard
versus the rate of aging (table 3). The baseline hazard and
the absolute rate of aging at age a ⫹ 4 together explain
(not surprisingly) 96% of the variance in life expectancy
among breeds (note that they are not correlated,
rh(a), h (a⫹4) p 0.06; moreover, the relative rate of aging
does not correlate with life expectancy, re(a), h (a⫹4)/h(a⫹4) p
⫺0.06, and hence cannot explain the trade-off between
size and life expectancy). Adding size to the two hazard
components does not improve the fit of the model (R2
remains at 96%). Replacing the rate of aging with size
increases the variance explained by only the baseline hazard by 25% (from 48% to 73%), whereas it improves R2
by only 5% when replacing the baseline hazard with size
(from 51% to 56%). This suggests that the size effect on
life expectancy is driven by its effect on the rate of aging
rather than by its effect on the baseline hazard.
This content downloaded on Tue, 26 Feb 2013 12:37:58 PM
All use subject to JSTOR Terms and Conditions
2
relationship was still evident when looking at the aging
rate relative to the current level of the mortality hazard
(proportional scale); that is, large dogs age at an accelerated pace, suggesting that their adult life unwinds in fast
motion. Additionally, size was connected to the baseline
hazard, which was higher in large dogs compared to small
ones. We found no clear relationship between the age at
the onset of senescence and size.
1
000 The American Naturalist
Growing Large and Growing Old
3
10
0
(years)
(years)
4
A
8
7
6
5
-3.5
-2.5
C
-4.5
log(h( ))
log h( ) (years -1)
-1.5
3
4
e( )
e( ) (years)
9
B
0
20
40
60
80
body size (kg)
Figure 2: Body size shows no significant correlation with the onset
of senescence a (A), it decreases with life expectancy at age a, e(a)
(B), and it increases with the baseline hazard h(a) (C). The different
symbols denote the best-fitting model for each breed (circles: G⫺G⫹,
triangles: G⫺W⫹, plus: G⫺hG⫹, cross: G⫺hW⫹).
Discussion
Large dogs die young because they age quickly. Across
breeds, body size is strongly positively linked to the absolute speed at which the mortality hazard increases. This
The breed-specific hazard trajectories we fitted follow the
familiar bathtub-shaped hazard curve and clearly captured
the size–life span trade-off documented in earlier studies
that used age at death data directly (Patronek et al. 1997;
Michell 1999; Greer et al. 2007). Body size explained 44%
of the variance among breeds in life expectancy at age a
and 47% at age 4 years. Among breeds, an increase of 2
kg in body mass leads to a loss of approximately 1 month
of life expectancy. As expected, our estimates based on
data from veterinary teaching hospitals were somewhat
lower than those based on more representative pet populations (Michell 1999; Proschowsky et al. 2003; Greer et
al. 2007). Our results suggest that in dogs, this trade-off
is mainly driven by the effect of size on aging rate rather
than on baseline mortality. The baseline hazard and the
absolute aging rate each explained about 50% of the variation in life expectancy across breeds. Half (25%) of the
explanatory power of aging rate, but only 5% of that of
the baseline hazard, can be replaced by size as a predictor
(table 3). Depending on age, size explained 38%–49% of
the variation in absolute aging rates.
We see clear differences in the mortality trajectory between short- and long-lived dogs. Our challenge now is
to determine how these mortality trajectories are shaped
by the underlying diseases that dogs die of. Smaller, longerlived dogs show a comparatively slow increase after age a,
suggesting that the onset of age-related diseases is delayed
in these breeds. Another possible explanation is that small
and large dogs do not die of the same causes. Fleming et
al. (2011) showed that deaths due to neoplastic processes
tend to be more common in large dogs than in their
smaller counterparts. This could be due to the fact that
selection for large size in these breeds leads to greater cell
division. Interestingly, compared to other causes of death
by pathophysiological processes, neoplasia shows a steep
increase in frequency with age (Fleming et al. 2011), which
could contribute to the observed high aging rate in large
dogs. Additionally, cause-specific hazard curves for breeds
of different sizes could shed further light on this
phenomenon.
In addition to large breeds being less likely than small
breeds to show a constant hazard component, large
This content downloaded on Tue, 26 Feb 2013 12:37:58 PM
All use subject to JSTOR Terms and Conditions
Why Large Dogs Die Young 000
-2
2
-4
-3
C
-5
-6
logg hʹ(age)
B
A
age=α+2
0
20
40
60
body size (kg)
80
age=α+7
age=α+4
0
20
40
60
80
0
body size (kg)
20
40
60
80
body size (kg)
Figure 3: The absolute rate of aging increases with body size when measured as the first derivative of the hazard function (h ). Depicted
are h at the relative age of (A) a ⫹ 2 , (B) a ⫹ 4 , and (C) a ⫹ 7 years. The different symbols denote the best-fitting model for each breed
(circles: G⫺G⫹, triangles: G⫺W⫹, plus: G⫺hG⫹, cross: G⫺hW⫹).
breeds were more likely than small ones to age according
to the Weibull model. Again, one possible explanation is
that the different distributions of causes of death in small
and large dogs described by Fleming et al. (2011) add
up to hazard profiles of different shape. Another speculative idea is that populations of large breeds are more
heterogeneous compared to smaller ones. Whereas in the
Gompertz function the mortality increase always accelerates (f (t) p f(a, b)e bt), the Weibull function can accommodate accelerating as well as decelerating mortality
hazards (f (t) p f(b, l)t (b⫺3)). Indeed, most of the Weibull-fitted breeds had an estimated b3 ! 3, leading to a
slowing down in the hazard increase with age. As Vaupel
and Yashin (1985) showed, population stratification with
regard to frailty can strongly affect the overall mortality
patterns. With frailer subpopulations being selected out,
the mortality hazard becomes increasingly dominated by
more robust individuals. As a consequence, the hazard
increase can slow down or even reach the much-debated
mortality plateau (Vaupel and Yashin 1985; Pletcher and
Curtsinger 1998; Drapeau et al. 2000). Some have suggested that rapid growth may lead to a “jerry-built” body,
due, for example, to a higher probability of developmental errors (Blanckenhorn 2000; Metcalfe and Monaghan 2003). This, in turn, could lead to a larger variance
in quality. Even if large bodies expire on average more
quickly, there will be some with few errors, reaching a
life span comparable to their small counterparts. In a
cohort study on exceptionally old rottweilers (b3 p 2.2),
Cooley et al. (2003) showed that the majority of the oldest
old dogs had a late onset of all major diseases, suggesting
a robust physiology. Another case in point is the only
two small breeds whose death data were best fit with a
Weibull model, the chondrodystrophic dachshund and
miniature dachshund. Their long backs render them es-
pecially prone to degenerative disc disease, which usually
has an age of onset between 3 and 7 years of age (∼15%
of all deaths; Proschowsky et al. 2003; Fleming et al.
2011). Otherwise, dachshunds are known to be rather
robust and long-lived dogs (e.g., Michell 1999; Proschowsky et al. 2003; Bonnett et al. 2005). It is intuitive
that with individuals of the high-risk subpopulation dying off more quickly, aging will decelerate.
The Baseline Hazard
Compared to the effect of size on aging rate, its effect on
the baseline hazard was small (R 2 p 0.07). Translating the
baseline hazard into annual mortality probabilities (assuming a constant hazard) reveals that an increase in size
from 10 to 25 kg increases mortality probability from 0.050
to 0.056, and a further increase to 50 kg leads to a slight
increase in mortality probability to 0.066. Orthopedic diseases such as hip dysplasia are a frequent cause of death
at young adult ages in dogs and are much more prevalent
in large dogs (e.g., Proschowsky et al. 2003; Bonnett et al.
2005; Fleming et al. 2011). They are also thought to be
negatively influenced by fast growth (Dammrich 1991).
Hence they might contribute to the size effect on early
adult mortality, as well as to age-related mortality, because
they are usually degenerative. Recently, van der Most et
al. (2011) reported compromised immune function in
poultry strains selected for fast growth, which might render
them more susceptible to infectious disease throughout
life. However, there is currently no evidence for a size effect
on either infectious or inflammatory disease in dogs
(Fleming et al. 2011). The variability in the estimates of
the baseline hazard among breeds is high. In part this is
due to the inevitably smaller number of deaths available
for estimation at this point of the hazard trajectory. More-
This content downloaded on Tue, 26 Feb 2013 12:37:58 PM
All use subject to JSTOR Terms and Conditions
000 The American Naturalist
over, due to founder effects and breeding practices (e.g.,
popular sire effects) influencing effective population size,
inbreeding levels differ substantially among breeds (Parker
et al. 2004), and these could be linked to different levels
of vulnerability independent of size. Breed idiosyncrasies
certainly add to the high variance among breeds (e.g.,
Sutter and Ostrander 2004; Fleming et al. 2011).
The Onset of Senescence
Model
e(a) ∼ log(h(a))
e(a) ∼ log(h(a⫹4))
e(a) ∼ log(h(a)) ⫹
log(h(a⫹4))
e(a) ∼ size ⫹
log(h(a⫹4))
e(a) ∼ size ⫹
log(h(a))
e(a) ∼ size ⫹
log(h(a)) ⫹
log(h(a ⫹ 4))
b
SE(b)
⫺1.630
⫺1.367
⫺1.563
⫺1.316
⫺.020
⫺.949
⫺.033
⫺1.308
⫺.0001
⫺1.563
⫺1.313
.120
.157
.058
.047
.007
.209
.004
.152
.002
.062
.068
R2
F1, 72/71
.481 66.59
.514 76.23
.956 715.7
770.4
.564
8.09
20.57
.725 63.35
74.42
.003
.956 626.24
368.4
P
K.001
K.001
K.001
K.001
.006
K.001
K.001
K.001
.960
K.001
K.001
Note: The parameter notation is explained in table 1.
published data), consistent with the notion that large dogs
have been selected artificially for fast growth. The less
interesting explanation is that the lack of a relationship
between a and size is simply due to sample size and data
quality problems. It turns out to be extremely challenging
to distinguish a delay in the onset of aging (a rightward
shift in the Gompertz curve) from a downward shift in
the mortality trajectory, because of a constant proportional
decline at all ages (Promislow et al. 1999). The flat profile
of the hazard trajectory at young adult ages especially in
small dogs also renders it more difficult to estimate the
exact age of onset of senescence. Higher-resolution age
data from a more representative population are clearly
needed.
B
C
-3
-2
-1
A
age = +2
-4
log h ʹ(age)/ h(age )
0
Veterinarians recommend starting geriatric checkups for
small dogs around age 11, for medium-sized ones at age
9–10, and for large dogs at age 7–8, indicating that agerelated diseases appear later in small dogs. Still, we could
not identify a clear correlation between the onset of senescence and body size, even though the low a values of
the few giant dog breeds included in the analysis are suggestive. Across mammals and birds, the age of onset and
the rate of senescence are both tightly linked to generation
time and, hence, should be correlated (Promislow 1991;
Jones et al. 2008; Peron et al. 2010).
One interesting explanation for why we did not find the
expected effect of size on the onset of senescence could
be that two opposing processes are at play. On the one
hand, deleterious effects of growth might shift a toward
earlier ages in large dogs. On the other hand, larger dogs
might undergo a longer mortality decline as a result of a
longer developmental period. We know that size and age
at maturity (first heat in female dogs) are positively correlated; however, the relationship is not as strong as the
one between size and life span (R 2 p 0.16; C. Kraus, un-
Table 3: Linear regression estimates and statistics showing that
the size affects life expectancy mainly via aging rate
0
20
40
60
body size (kg)
80
age = +4
0
20
40
60
80
age = +7
0
body size (kg)
20
40
60
80
body size (kg)
Figure 4: Relative rate of aging increases with body size when measured as the first derivative of the hazard function (h ) divided by the
hazard at the same age. The effect declines with age. Depicted are h /h at the relative age of (A) a ⫹ 2 , (B) a ⫹ 4 , and (C) a ⫹ 7 years.
The different symbols denote the best-fitting model for each breed (circles: G⫺G⫹, triangles: G⫺W⫹, plus: G⫺hG⫹, cross: G⫺hW⫹).
This content downloaded on Tue, 26 Feb 2013 12:37:58 PM
All use subject to JSTOR Terms and Conditions
Why Large Dogs Die Young 000
Potential Proximate Factors
Theoretical and empirical aging research supports the idea
that development and aging are intricately connected (e.g.,
Cichon 1997; Desai and Hales 1997; Morgan et al. 2000;
Finch and Crimmins 2004; Kirkwood 2005; Ricklefs 2006;
Chen et al. 2007; Kaplan and Robson 2009; Austad 2010),
but the exact nature of these links is not yet fully understood. Potential candidates involved in mediating a tradeoff between growth and senescence rate include IGF-1,
telomere dynamics, and oxidative stress (Metcalfe and
Monaghan 2003; Bonsall 2006). The growth hormone
(GH)/insulin-like growth factor 1 (IGF-1) axis might be
a pivotal pathway mediating the trade-off between growth
and survival, with a dampening of IGF-1 signaling generally delaying or slowing down aging and thus extending
life span in a wide range of organisms (Tatar et al. 2003;
Kenyon 2005; Berryman et al. 2008). Not many genetic
changes are necessary to reduce the size of a dog (Boyko
et al. 2010), and indeed, according to Sutter et al. (2007),
a single IGF1 allele is an important determinant of body
size in dogs. Consistently, IGF-1 serum levels of small dogs
are lower than those of large ones (Eigenmann et al. 1988;
Sutter et al. 2007; Greer et al. 2011). Additionally, Favier
et al. (2001) report excessive juvenile secretion of GH in
a giant breed (Great Dane) compared to a medium-sized
breed (beagle), leading to a prolonged phase of rapid
growth in young large-breed dogs. This circumstantial evidence renders it plausible that the GH/IGF-1 axis contributes to the life span/aging benefits of small size in dogs.
There is not much yet known about telomere dynamics
or oxidative stress in dogs (but see Nasir et al. 2001; Speakman et al. 2003; Davis and Kipling 2005). Still, all of the
three (and additional) potential mechanisms might interact and together shape the observed trade-off between size/
aging and life span.
Outlook
Despite some problems inherent in the data set used and
the large residual variance in mortality components among
breeds, the size signal in patterns of aging was strong.
These results point to the clear need for a long-term, longitudinal study of growth and mortality in a large cohort
of companion dogs tracked from birth to death. More
exact death data representative of the general dog population would help to remove the bias in our hazard and
life expectancy estimates. This would allow us to also investigate the relationship between size and mortality within
breeds (see also Galis et al. 2007) as well as direct effects
of growth on mortality, by including the early decline in
mortality, a stage that often encompasses a large fraction
of deaths and yet has rarely been studied (Levitis 2011).
In this study, we had to use size as a proxy for growth,
but size is the outcome of a process involving many factors
such as neonatal weight and the speed and duration of
growth (Metcalfe and Monaghan 2003). In large dogs,
especially growth rate, but also the duration of body
growth, is increased (Kirkwood 1985). It is well known
that large dogs take longer to reach physical and behavioral
maturity, and dogs reaching a similar adult size might
differ in growth patterns. Given the apparent importance
of growth patterns in the evolution of life-history strategies
(e.g., Charnov and Berrigan 1991; Charnov 1993), dogs
seem an excellent model to investigate evolutionary, genetic, and physiological links between growth and mortality and in great detail.
Acknowledgments
We thank the Veterinary Medical Database (VMDB) for
making available their data, and we are grateful to S. Austad, who assisted with procurement of the data from the
VMDB. We would also like to thank J. Gampe, A. Scheuerlein, and J. Vaupel for stimulating discussions. We are
grateful to P. Kappeler, T. Kirkwood, S. Verhulst, Franz J.
Weissing, and an anonymous reviewer for helpful comments on the manuscript. C.K. would like to thank her
dogs Flaca and Chacka for thought-provoking walks. This
work was supported in part by a Breakthroughs in Gerontology grant to D.E.L.P. from the American Federation
of Aging Research.
Literature Cited
Anisimov, V. N., K. G. Arbeev, I. G. Popovic, M. A. Zabezhinksi, S.
V. Rosenfeld, T. S. Piskunova, L. S. Arbeeva, A. V. Semenchenko,
and A. I. Yashin. 2004. Body weight is not always a good predictor
of longevity in mice. Experimental Gerontology 39:305–319.
Austad, S. N. 2005. Diverse aging rates in metazoans: targets for
functional genomics. Mechanisms of Ageing and Development
126:43–49.
———. 2010. Animal size, metabolic rate, and survival, among and
within species. Pp. 27–41 in N. S. Wolf, ed. The comparative
biology of aging. Springer, Dordrecht.
Bartke, A., K. Coshigano, J. Kopchick, V. Chandrashekar, J. Mattison,
B. Kinney, and S. Hauck. 2001a. Genes that prolong life: relationships of growth hormone and growth to aging and life span. Journals of Gerontology Series A: Biological Sciences and Medical Sciences 56:B340–B349.
Bartke, A., J. C. Wright, J. A. Mattison, D. K. Ingram, R. A. Miller,
and G. S. Roth. 2001b. Longevity: extending the lifespan of longlived mice. Nature 414:412.
Berryman, D. E., J. S. Christiansen, G. Johannsson, M. O. Thorner,
and J. J. Kopchick. 2008. Role of the GH/IGF-1 axis in lifespan
and healthspan: lessons from animal models. Growth Hormone
and IGF Research 18:455–471.
This content downloaded on Tue, 26 Feb 2013 12:37:58 PM
All use subject to JSTOR Terms and Conditions
000 The American Naturalist
Blanckenhorn, W. U. 2000. The evolution of body size: what keeps
organisms small? Quarterly Review of Biology 75:385–407.
Bonnett, B. N., A. Egenvall, A. Hedhammar, and P. Olson. 2005.
Mortality in over 350,000 insured Swedish dogs from 1995–2000.
I. Breed-, gender-, age- and cause-specific rates. Acta Veterinaria
Scandinavica 46:105–120.
Bonsall, M. B. 2006. Longevity and ageing: appraising the evolutionary consequences of growing old. Philosophical Transactions
of the Royal Society B: Biological Sciences 361:119–135.
Boyko, A. R., P. Quignon, L. Li, J. J. Schoenebeck, J. D. Degenhardt,
K. E. Lohmueller, K. Y. Zhao, et al. 2010. A simple genetic architecture underlies morphological variation in dogs. PLoS Biology
8:e1000451.
Burnham, K. P., and D. R. Anderson. 2002. Model selection and
multimodel inference: a practical information-theoretic approach.
Springer, New York.
Charnov, E. L. 1993. Life history invariants. Oxford University Press,
New York.
Charnov, E. L., and D. Berrigan. 1991. Dimensionless numbers and
the assembly rules for life histories. Philosophical Transactions of
the Royal Society B: Biological Sciences 332:41–48.
Chen, D., K. Z. Pan, J. E. Palter, and P. Kapahi. 2007. Longevity
determined by developmental arrest genes in Caenorhabditis elegans. Aging Cell 6:525–533.
Cichon, M. 1997. Evolution of longevity through optimal resource
allocation. Proceedings of the Royal Society B: Biological Sciences
264:1383–1388.
Cooley, D. M., D. L. Schlittler, L. T. Glickman, M. Hayek, and D. J.
Waters. 2003. Exceptional longevity in pet dogs is accompanied
by cancer resistance and delayed onset of major diseases. Journals
of Gerontology Series A: Biological Sciences and Medical Sciences
58:1078–1084.
Dammrich, K. 1991. Relationship between nutrition and bonegrowth in large and giant dogs. Journal of Nutrition 121:S114–
S121.
Davis, T., and D. Kipling. 2005. Telomeres and telomerase biology
in vertebrates: progress towards a non-human model for replicative
senescence and ageing. Biogerontology 6:371–385.
de Magalhaes, J. P., J. Costa, and G. M. Church. 2007. An analysis
of the relationship between metabolism, developmental schedules,
and longevity using phylogenetic independent contrasts. Journals
of Gerontology Series A: Biological Sciences and Medical Sciences
62:149–160.
Desai, M., and C. N. Hales. 1997. Role of fetal and infant growth in
programming metabolism in later life. Biological Reviews of the
Cambridge Philosophical Society 72:329–348.
Drapeau, M. D., E. K. Gass, M. D. Simison, L. D. Mueller, and M.
R. Rose. 2000. Testing the heterogeneity theory of late-life mortality
plateaus by using cohorts of Drosophila melanogaster. Experimental
Gerontology 35:71–84.
Eigenmann, J. E., A. Amador, and D. F. Patterson. 1988. Insulin-like
growth factor-1 levels in proportionate dogs, chondrodystrophic
dogs and giant dogs. Acta Endocrinologica 118:105–108.
Favier, R. P., J. A. Mol, H. S. Kooistra, and A. Rijnberk. 2001. Large
body size in the dog is associated with transient GH excess at a
young age. Journal of Endocrinology 170:479–484.
Finch, C. E., and E. M. Crimmins. 2004. Inflammatory exposure and
historical changes in human life-spans. Science 305:1736–1739.
Fleming, J. M., K. E. Creevy, and D. E. L. Promislow. 2011. Mortality
in North American dogs from 1984 to 2004: an investigation into
age-, size-, and breed-related causes of death. Journal of Veterinary
Internal Medicine 25:187–198.
Gaillard J.-M., M. Festa-Bianchet, D. Delorme, and J. Jorgenson.
2000. Body mass and individual fitness in female ungulates: bigger
is not always better. Proceedings of the Royal Society B: Biological
Sciences 267:471–477.
Gaillard, J.-M., D. Pontier, D. Allaine´, J. D. Lebreton, J. Trouvilliez,
and J. Clobert. 1989. An analysis of demographic tactics in birds
and mammals. Oikos 56:59–76.
Galis, F., I. Van Der Sluijs, T. J. M. Van Dooren, J. A. J. Metz, and
M. Nussbaumer. 2007. Do large dogs die young? Journal of Experimental Zoology Part B: Molecular and Developmental Evolution 308B:119–126.
Gompertz, B. 1825. On the nature of the function expressive of the
law of human mortality, and on the mode of determining the
value of life contingencies. Philosophical Transactions of the Royal
Society 115:513–585.
Greer, K., L. Hughes, and M. Masternak. 2011. Connecting serum
IGF-1, body size, and age in the domestic dog. Age 33:475–483.
Greer, K. A., S. C. Canterberry, and K. E. Murphy. 2007. Statistical
analysis regarding the effects of height and weight on life span
of the domestic dog. Research in Veterinary Science 82:208–214.
Harvey, P. H., and M. D. Pagel. 1991. The comparative method in
evolutionary biology. Oxford University Press, Oxford.
Hawthorne, A. J., D. Booles, P. A. Nugent, G. Gettinby, and J. Wilkinson. 2004. Body-weight changes during growth in puppies of
different breeds. Journal of Nutrition 134:2027S–2030S.
Jones, O. R., J. M. Gaillard, S. Tuljapurkar, J. S. Alho, K. B. Armitage,
P. H. Becker, and P. Bize, et al. 2008. Senescence rates are determined by ranking on the fast-slow life-history continuum. Ecology
Letters 11:664–673.
Juckett, D. A., and B. Rosenberg. 1993. Comparison of the Gompertz
and Weibull functions as descriptors for human mortality distributions and their intersections. Mechanisms of Ageing and Development 69:1–31.
Kang, H. M., N. A. Zaitlen, C. M. Wade, A. Kirby, D. Heckerman,
M. J. Daly, and E. Eskin. 2008. Efficient control of population
structure in model organism association mapping. Genetics 178:
1709–1723.
Kaplan, H. S., and A. J. Robson. 2009. We age because we grow.
Proceedings of the Royal Society B: Biological Sciences 276:1837–
1844.
Kenyon, C. 2005. The plasticity of aging: insights from long-lived
mutants. Cell 120:449–460.
Khazaeli, A. A., W. J. Van Voorhies, and W. Curtsinger. 2005. The
relationship between life span and adult body size is highly strainspecific in Drosophila melanogaster. Experimental Gerontology 40:
377–385.
Kirkwood, J. K. 1985. The influence of size on the biology of the
dog. Journal of Small Animal Practice 26:97–110.
Kirkwood, T. B. L. 2005. Understanding the odd science of aging.
Cell 120:437–447.
Klein, J. P., and M. L. Moeschberger. 2005. Survival analysis: techniques for censored and truncated data. Springer, Berlin.
Levitis, D. A. 2011. Before senescence: the evolutionary demography
of ontogenesis. Proceedings of the Royal Society B: Biological Sciences 278:801–809.
Li, Y., B. Deeb, W. Pendergrass, and N. Wolf. 1996. Cellular proliferative capacity and life span in small and large dogs. Journals of
This content downloaded on Tue, 26 Feb 2013 12:37:58 PM
All use subject to JSTOR Terms and Conditions
Why Large Dogs Die Young 000
Gerontology Series A: Biological Sciences and Medical Sciences 51:
B403–B408.
Lindblad-Toh, K., C. M. Wade, T. S. Mikkelsen, E. K. Karlsson, D.
B. Jaffe, M. Kamal, M. Clamp, et al. 2005. Genome sequence,
comparative analysis and haplotype structure of the domestic dog.
Nature 438:803–819.
Metcalfe, N. B., and P. Monaghan. 2003. Growth versus lifespan:
perspectives from evolutionary ecology. Experimental Gerontology
38:935–940.
Michell, A. R. 1999. Longevity of British breeds of dog and its relationships with sex, size, cardiovascular variables and disease. Veterinary Record 145:625–629.
Miller, R. A., C. Chrisp, and W. Atchley. 2000. Differential longevity
in mouse stocks selected for early life growth trajectory. Journals
of Gerontology Series A: Biological Sciences and Medical Sciences
55:B455–B461.
Miller, R. A., J. M. Harper, A. Galecki, and D. T. Burke. 2002. Big
mice die young: early life body weight predicts longevity in genetically heterogeneous mice. Aging Cell 1:22–29.
Monaghan, P., A. Charmantier, D. H. Nussey, and R. E. Ricklefs.
2008. The evolutionary ecology of senescence. Functional Ecology
22:371–378.
Moody, J. A., L. A. Clark, and K. E. Murphy. 2006. Canine history
and breed clubs. Pages 1–18 in E. A. Ostrander and F. Galibert,
eds. The dog and its genome. CSHL, New York.
Moorad, J. A., D. E. L. Promislow, N. Flesness, and R. A. Miller.
2012. A comparative assessment of univariate longevity measures
using zoological animal records. Aging Cell 11:940–948, doi:
10.1111/j.1474-9726.2012.00861.x.
Morgan, I. J., I. D. McCarthy, and N. B. Metcalfe. 2000. Life-history
strategies and protein metabolism in overwintering juvenile Atlantic salmon: growth is enhanced in early migrants through lower
protein turnover. Journal of Fish Biology 56:637–647.
Nasir, L., P. Devlin, T. McKevitt, G. Rutteman, and D. J. Argyle. 2001.
Telomere lengths and telomerase activity in dog tissues: a potential
model system to study human telomere and telomerase biology.
Neoplasia 3:351–359.
Nelder, J. A., and R. Mead. 1965. A simplex algorithm for function
minimization. Computer Journal 7:308–313.
Olsson, M., and R. Shine. 2002. Growth to death in lizards. Evolution
56:1867–1870.
Parker, H. G., L. V. Kim, N. B. Sutter, S. Carlson, T. D. Lorentzen,
T. B. Malek, G. S. Johnson, et al. 2004. Genetic structure of the
purebred domestic dog. Science 304:1160–1164.
Partridge, L., and N. H. Barton. 1996. On measuring the rate of
ageing. Proceedings of the Royal Society B: Biological Sciences 263:
1365–1371.
Patronek, G. J., D. J. Waters, and L. T. Glickman. 1997. Comparative
longevity of pet dogs and humans: implications for gerontology
research. Journals of Gerontology Series A: Biological Sciences and
Medical Sciences 52:B171–B178.
Peron, G., O. Gimenez, A. Charmantier, J. M. Gaillard, and P. A.
Crochet. 2010. Age at the onset of senescence in birds and mammals is predicted by early-life performance. Proceedings of the
Royal Society B: Biological Sciences 277:2849–2856.
Pletcher, S. D., and J. W. Curtsinger. 1998. Mortality plateaus and
the evolution of senescence: why are old-age mortality rates so
low? Evolution 52:454–464.
Promislow, D. E. L. 1991. Senescence in natural populations of mammals: a comparative study. Evolution 45:1869–1887.
Promislow, D. E. L., and P. H. Harvey. 1990. Living fast and dying
young: a comparative analysis of life-history variation among
mammals. Journal of Zoology (London) 220:417–437.
Promislow, D. E. L., M. Tatar, S. Pletcher, and J. R. Carey. 1999.
Below-threshold mortality: implications for studies in evolution,
ecology and demography. Journal of Evolutionary Biology 12:314–
328.
Proschowsky, H. F., H. Rugbjerg, and A. K. Ersboll. 2003. Mortality
of purebred and mixed-breed dogs in Denmark. Preventive Veterinary Medicine 58:63–74.
R Development Core Team. 2011. R: a language and environment
for statistical computing. R Foundation for Statistical Computing,
Vienna.
Reznick, D., L. Nunney, and A. Tessier. 2000. Big houses, big cars,
superfleas and the costs of reproduction. Trends in Ecology and
Evolution 15:421–425.
Ricklefs, R. E. 2006. Embryo development and ageing in birds and
mammals. Proceedings of the Royal Society B: Biological Sciences
273:2077–2082.
Ricklefs, R. E., and A. Scheuerlein. 2001. Comparison of aging-related
mortality among birds and mammals. Experimental Gerontology
36:845–857.
———. 2002. Biological implications of the Weibull and Gompertz
models of aging. Journals of Gerontology Series A: Biological Sciences and Medical Sciences 57:B69–B76.
Rollo, C. D. 2002. Growth negatively impacts the life span of mammals. Evolution and Development 4:55–61.
Samaras, T. J. 2009. Should we be concerned over increasing body
height and weight? Experimental Gerontology 44:83–92.
Sauer, J. R., and N. A. Slade. 1987. Uinta ground squirrel demography: is body mass a better categorical variable than age? Ecology
68:642–650.
Siler, W. 1979. A competing-risk model for animal mortality. Ecology
60:750–757.
Speakman, J. R., A. van Acker, and E. J. Harper. 2003. Age-related
changes in the metabolism and body composition of three dog
breeds and their relationship to life expectancy. Aging Cell 2:265–
275.
Sutter, N., D. Mosher, M. Gray, and E. Ostrander. 2008. Morphometrics within dog breeds are highly reproducible and dispute
Rensch’s rule. Mammalian Genome 19:713–723.
Sutter, N. B., C. D. Bustamante, K. Chase, M. M. Gray, K. Y. Zhao,
L. Zhu, B. Padhukasahasram, et al. 2007. A single IGF1 allele is
a major determinant of small size in dogs. Science 316:112–115.
Sutter, N. B., and E. A. Ostrander. 2004. Dog star rising: the canine
genetic system. Nature Reviews Genetics 5:900–910.
Tatar, M., A. Bartke, and A. Antebi. 2003. The endocrine regulation
of aging by insulin-like signals. Science 299:1346–1351.
Teuschl, Y., C. Reim, and W. U. Blanckenhorn. 2006. Correlated
response to artificial selection in growth, development, phenotypic
plasticity and juvenile viability in yellow dung flies. Journal of
Evolutionary Biology 20:87–103.
Thatcher, A. R., V. Kannisto, and J. W. Vaupel. 1998. The force of
mortality at ages 80 to 120. Odense Monographs on Population
Aging 5. Odense University Press, Odense.
van der Most, P. J., B. de Jong, H. K. Parmentier, and S. Verhulst.
2011. Trade-off between growth and immune function: a metaanalysis of selection experiments. Functional Ecology 25:74–80.
Vaupel, J. W., and A. I. Yashin. 1985. Heterogeneity ruses: some
This content downloaded on Tue, 26 Feb 2013 12:37:58 PM
All use subject to JSTOR Terms and Conditions
000 The American Naturalist
surprising effects of selection on population dynamics. American
Statistician 39:176–185.
Weibull, W. 1951. A statistical distribution function of wide applicability. Journal of Applied Mechanics 18:293–297.
Williams, P. D., T. Day, Q. Fletcher, and L. Rowe. 2006. The shaping
of senescence in the wild. Trends in Ecology and Evolution 21:
458–463.
Wilson, D. L. 1994. The analysis of survival (mortality) data: fitting
Gompertz, Weibull, and logistic functions. Mechanisms of Ageing
and Development 74:15–33.
Associate Editor: Franz J. Weissing
Editor: Mark A. McPeek
Large dogs die young because they age fast. Photograph by Thomas Ko¨llner.
This content downloaded on Tue, 26 Feb 2013 12:37:58 PM
All use subject to JSTOR Terms and Conditions


© Copyright 2026