
The SF-36 in multiple sclerosis: why basic assumptions must be tested
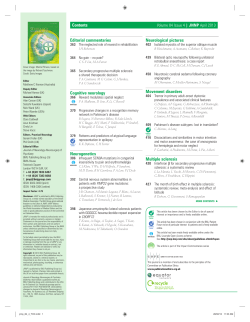
Downloaded from jnnp.bmj.com on October 1, 2014 - Published by group.bmj.com
J Neurol Neurosurg Psychiatry 2001;71:363–370
363
The SF-36 in multiple sclerosis: why basic
assumptions must be tested
J Hobart, J Freeman, D Lamping, R Fitzpatrick, A Thompson
Department of Public
Health and Primary
Care, NuYeld College,
Oxford, OX1 1NF, UK
R Fitzpatrick
Abstract
Objectives—To evaluate, in people with
multiple sclerosis, two psychometric assumptions that must be satisfied for valid
use of the medical outcomes study 36-item
short form health survey (SF-36): the data
are of high quality and, it is legitimate to
generate scores for eight scales and two
summary measures using the standard
algorithms.
Methods—SF-36 data from 438 people
representing the full range of multiple
sclerosis were examined (mean age 48;
70% women). Data quality (per cent missing data and computable scale and summary scores) were determined, six scaling
criteria were tested to determine the
legitimacy of generating the eight SF-36
scale scores using Likert’s method of
summed ratings, and two scaling criteria
were tested to determine the appropriateness of the standard SF-36 algorithms for
weighting scale scores to generate two
summary measures.
Results—Data quality was excellent except in the most disabled subgroup where
missing responses reached a maximum of
16.5% and summary scores could only be
computed for 72%. There was clear support for the generation of SF-36 scale
scores. Item response distributions were
symmetric, item mean scores and variances were equivalent, corrected itemtotal correlations were high (range 0.46–
0.85) and similar, and definite scaling
success rates exceeded 96%. Nevertheless,
there were notable floor or ceiling eVects
in four of the eight scales. Assumptions for
generating two SF-36 summary measures
were only partially satisfied. Although
principal components analysis suggested
a two component model, these components explained less than 60% of the total
variance in SF-36 scales, and less than
75% of the variance in five of the eight
scales. Moreover, scale to component correlations did not support the use of scale
weights derived from United States population data.
Conclusions—When using the SF-36 as a
health measure in multiple sclerosis summary scores should be reported with caution.
Correspondence to:
Dr J Hobart
[email protected]
Keywords: SF-36; tests of scaling assumptions; health
measurement; multiple sclerosis
Received 29 December 2000
and in final form
26 April 2001
Accepted 30 April 2001
Changes in health policy have underlined the
importance of measuring outcomes that are
Department of Clinical
Neurology and
Neurorehabilitation,
Neurological Outcome
Measures Unit,
Institute of Neurology,
Queen Square, London
WC1N 3BG, UK
J Hobart
J Freeman
A Thompson,
Health Services
Research Unit,
Department of Public
Health, London School
of Hygiene and
Tropical Medicine,
Keppel Street, London
WC1E 7HT, UK
D Lamping
(J Neurol Neurosurg Psychiatry 2001;71:363–370)
www.jnnp.com
relevant to patients. This has resulted in the
increased use of generic, patient reported
health status measures. However, the use of
these measures assumes that they satisfy minimum psychometric requirements across diverse clinical populations.1 2 This often untested assumption is the subject of this article.
The medical outcomes study 36 item short
form health survey (SF-36) is one of the most
widely used patient reported health status
measures.3 It is recommended for use in health
policy evaluations, general population surveys,
clinical research, and clinical practice.4 In neurology, the SF-36 has been used in stroke,5
motor neuron disease,6 Parkinson’s disease,7
epilepsy,8 headache,9 and multiple sclerosis.10–13
Moreover, it has often been used as a validating
instrument in the psychometric evaluation of
new measures.14–19
The SF-36 generates two types of scores (fig
1). To generate scores for the eight SF-36
scales, items are summed without weighting or
standardisation. To generate scores for the two
SF-36 summary measures, scale scores are
weighted and combined. Although the eight
scales provide a more comprehensive profile of
health status, the two summary measures have
features that make them more advantageous
for clinical trials. These include better
measurement precision, smaller confidence
intervals, the elimination of floor and ceiling
eVects, simpler analysis by reducing the
number of statistical tests required and avoiding the problem of multiple testing, and superior (theoretically) responsiveness.20 21 Summary measures are also more easily interpreted
as their scores are directly related to scores for
the general United States population, which
have been transformed to a mean of 50 and an
SD of 10.
Despite the widespread use of the SF-36 in
multiple sclerosis, and the demonstration of
some of its psychometric properties,15 22 23 no
study has comprehensively examined two fundamental prerequisites for rigorous measurement: indicators of data quality and tests of
scaling assumptions. Indicators of data quality,
such as item non-response and missing scale
and summary scores, determine the legitimacy
of using an instrument. They reflect respondents’ understanding and acceptance of a measure and help to identify items that may be irrelevant, confusing, or upsetting to patients.1
When there is a large amount of missing data,
scores for scales and summary measures
cannot be reliably estimated. Tests of scaling
assumptions determine whether it is legitimate
to generate scores for an instrument using the
algorithms proposed by the developers. As data
quality and psychometric properties are sample
Downloaded from jnnp.bmj.com on October 1, 2014 - Published by group.bmj.com
364
Hobart, Freeman, Lamping, et al
dependent,1 24 the performance of a measure in
a specific application is more important than its
performance generally.1 This study examines
data quality and tests the scaling assumptions
for the SF-36 in a sample of people with multiple sclerosis.
Methods
PARTICIPANTS, RECRUITMENT, AND DATA
COLLECTION
Data were analyzed from two ethically approved studies conducted at the National Hospital for Neurology and Neurosurgery
(NHNN) in London. Participants in the first
study were adults with clinically definite multiple sclerosis attending the NHNN.25 Full
details of the sampling and the stratification
process are described elsewhere.23 Briefly, 150
consecutive attenders were recruited from
three diVerent sources: a weekly outpatient
clinic, an inpatient neurological rehabilitation
unit, and admissions under one consultant
(AT). People in this hospital based sample were
Item
excluded if they had cognitive impairment precluding reliable completion of questionnaires
(subjective judgement of JF), other comorbid
disabling disorders, or were not English speaking. A stratification process was used to ensure
an even spread of disease severity: all patients
were examined by a neurology registrar and
classified according to the Kurtzke expanded
disability status scale (EDSS26) as either mild
(EDSS<4.5), moderate (EDSS 5.0–6.5), or
severe (EDSS>7.0). Consecutive admissions
were recruited until there were 50 patients in
each category. The SF-36 was administered by
a single investigator (JF) in strict accordance
with the developers’ recommendations.3
The second study was a postal survey of 500
randomly selected, geographically stratified
members of the multiple sclerosis Society of
Great Britain and Northern Ireland. This was
part of a larger study developing a patient
based outcome measure for multiple sclerosis.27 The SF-36 was administered in a booklet
along with three other health measures and
Scale
3a
3b
3c
3d
3e
3f
3g
3h
3i
3j
Limited doing vigorous activities
Limited doing moderate activities
Limited lifting or carrying groceries
Limited climbing several flights of stairs
Limited climbing one flight of stairs
Limited bending, kneeling, stooping
Limited walking more than a mile
Limited walking half a mile
Limited walking one hundred yards
Limited bathing or dressing yourself
Physical functioning (PF)
4a
4b
4c
4d
Cut down amount of time spent on work
Accomplished less than would like
Limited in the kind of work
Difficulty performing the work
Role-physical (RF)
7
8
Pain – magnitude
Pain – interference with work
Bodily pain (BP)
1
11a
11b
11c
11d
Overall rating of general health
I seem to get sick easier than others
I am as healthy as anyone I know
I expect my health to get worse
My health is excellent
General health (GH)
9a
9b
9c
9d
Did you feel full of life
Did you have a lot of energy
Did you feel worn out
Did you feel tired
Vitality (VT)
6
10
Social activities – extent of limitations
Social activities – time of limitations
Social functioning (SF)
5a
5b
5c
Cut down time spent working
Accomplished less than would like
Did not do work as carefully as usual
9b
9c
9d
9f
3h
Have you been a nervous person
Have you felt down in the dumps
Have you felt calm and peaceful
Have you felt downhearted and low
Have you been a happy person
Summary measure
Physical health (PCS)
Mental health (MCS)
Figure 1
Role-emotional (RE)
Mental health (MH)
The measurement model of the SF-36. Adapted from Ware et al.20
www.jnnp.com
Downloaded from jnnp.bmj.com on October 1, 2014 - Published by group.bmj.com
365
The SF-36 in multiple sclerosis
demographic questions. Non-responders were
sent reminders at 3 and 5 weeks.
THE MEASUREMENT MODEL OF THE SF-36
The measurement model of the SF-36 (fig 1)
hypothesises that 35 of the 36 items are
grouped into eight multi-item scales (physical
functioning (PF), role limitations physical
(RP), bodily pain (BP), general health perceptions (GH), energy/vitality (VT), social functioning (SF), role limitations emotional (RE),
and mental health (MH) that are aggregated
into two summary measures (physical component (PCS), mental component (MCS)). The
remaining item is not used in scoring.
DiVerent processes are used to generate
scores for scales and summary measures.
Likert’s method of summated ratings is used
for scales.28 That is, item responses are
summed without weighting or standardisation.
Before this is undertaken, two items are recalibrated and the scoring of nine items is reversed
so that high scores always indicate better
health.3 Finally, as the eight scales have
diVerent ranges they are transformed to have a
common range of 0 (worst health) to 100 (best
health) using the formula provided by Stewart
and Ware.29
Scores for the two summary measures are
generated in three stages. Firstly, scale scores
are standardised (z score transformation) by
subtracting the United States population mean
for that scale and dividing the diVerence by the
United States population standard deviation
for that scale. Next, z scores are multiplied by
their respective factor score coeYcients, derived from United States population data, and
summed. Finally, these aggregated scores are
standardised using a linear T score transformation to have a mean of 50 and SD 10, in the
general United States population.20
The results of factor analytical studies led to
the discovery of the two SF-36 summary
measures. Principal components analysis of
intercorrelations among SF-36 scales from
several studies consistently extracted two components, with similar scale to component
correlations, which accounted for most of the
total SF-36 variance and variance in each of the
individual SF-36 scales.20 These findings indicated that two summary measures could be
generated without substantial loss of information. The two components were interpreted
as measures of physical and mental health
because the scales correlating highest with
them were PF and RP, and MH and RE,
respectively.
ANALYSIS PLANS
All analyses were undertaken in the hospital
and postal samples separately, and in the
pooled sample.
Are the data high quality?
This was determined by calculating the percentage of missing data for items, and the percentage of scale and summary scores that could
be computed. A scale score can be calculated
provided that 50% or more of the items are
completed. Missing items are replaced with a
www.jnnp.com
person specific mean score, the average score
across completed items for that respondent.3 30
By contrast, scores can only be calculated for
summary measures when all eight scale scores
are available.20 The impact of disease severity
on data quality was also examined. In the hospital based sample, participants were categorised as mild, moderate, or severe by their
EDSS score. In the postal survey, participants
were categorised by their indoor mobility as
walking unaided, walking with an aid, or
wheelchair dependent.
Is it legitimate to report SF-36 scale scores in
multiple sclerosis ?
Six scaling assumptions must be satisfied for
SF-36 scale scores to be generated using the
item groups proposed by the developers and
Likert’s method of summated ratings.
(1) Items in each scale must be roughly parallel (that is, measure at the same point on the
scale and have similar variances), otherwise
they do not contribute equally to the variance
of the total score and must be standardised
before combination.28 This criterion is evaluated by examining the symmetry of item
response distributions and the equivalence of
item means scores and SD.1
(2) Items in each scale must measure a common underlying construct, otherwise it is not
appropriate to combine them to generate a
total score.28 This criterion is evaluated by
examining the correlation between each item
and the total score computed from the remaining items in that scale (corrected item-total
correlation). A range of recommended minimum values has been recommended: 0.20,31
0.30,32 and 0.40.1
(3) Items in each scale should contain a
similar proportion of information concerning
the construct being measured, otherwise they
should be given diVerent weights.28 This criterion is determined by examining the equivalence of corrected item-total correlations.
Recently, Ware et al have stated that this criterion can be considered satisfied when values
exceed 0.30, even if they vary.33
(4) Items must be correctly grouped into
scales. That is, items must correlate substantially higher with the construct they are
purported to measure than with the other constructs measured by the instrument.34 This criterion is considered satisfied when item-own
scale correlations (corrected for overlap) exceed item-other scale correlations by at least
n ).
two standard errors (2×1/'`
(5) Scales must generate reliable estimates,
otherwise their scores cannot be confidently
interpreted. This criterion is satisfied when
Cronbach’s á coeYcients35 for each scale
exceed 0.7036 or 0.80.32
(6) Scales must demonstrate that they measure distinct constructs, otherwise interpretation of their scores is confounded. This criterion is satisfied when the correlations among
scales are substantially less than their respective reliability estimates.33
Downloaded from jnnp.bmj.com on October 1, 2014 - Published by group.bmj.com
366
Hobart, Freeman, Lamping, et al
Is it legitimate to report SF-36 summary scores in
multiple sclerosis?
Two scaling assumptions must be satisfied for
SF-36 PCS and MCS scores to be generated
using the developers’ algorithm.3 32
(1) Principal components analysis, with
orthogonal (varimax) rotation of extracted
components, of the correlations among the
eight SF-36 scales should support a two
dimensional model of health that explains
about 80%-85% of the total reliable variance in
the SF-36 scales and at least 75% of the reliable
variance in each of the eight SF-36 scales.3 20
(2) The magnitude and pattern of correlations between the eight SF-36 scales and the
two rotated components should support their
interpretation as measures of physical and
mental health, and be consistent with other
studies. That is, the PCS measure should correlate strongly (>0.70) with the PF, RP, and BP
scales, and weakly (< 0.30) with the MH and
RE scales, and vice versa for the mental MCS
measure.3
These two scaling assumptions were examined by undertaking a scale level principal
components analysis with varimax rotation.
Eigenvalues37 and the scree plot38 were examined to determine the optimum number of
components to rotate.
Results
SAMPLE CHARACTERISTICS
In the hospital based study, 150 people were
recruited and one person withdrew. In the
postal survey, a total of 409 booklets (82%)
were returned; 121 questionnaires were returned blank, of these 84 were considered
ineligible to participate in the study (changed
address; did not have multiple sclerosis;
deceased). Therefore, the response rate was
69% (409–121/500–84). The characteristics of
patients in the two samples were similar, a wide
range of ages and disease duration was
included, and the broad categories of disability
were evenly represented (table 1).
?
For the hospital based sample there were no
missing data, both types of SF-36 scores could
be estimated for all participants, and results
were not influenced by disease severity (table
2). In the postal survey, data quality was excellent in participants who reported that they
ARE THE DATA HIGH QUALITY
Table 1
Characteristics of samples
Sample
No of patients
Women (%)
Age (y) (mean (SD; range))
Years since diagnosis (mean (SD; range))
Years since first symptoms (mean (SD; range))
Disability level (%)
Mild (EDSS <4.5)
Moderate (EDSS 5.0 to 6.5)
Severe (EDSS >7.0)
Indoor mobility %*
Walk unaided
Walk aided
Use a wheel chair
Hospital
Postal
149
68
45 (11; 24–78)
10 (8; 0.1–38)
15 (9; 0.6–43)
288
72
52 (12; 21–80)
14 (10; 1–51)
19 (11; 1–59)
32
34
34
N/A
N/A
N/A
N/A
N/A
N/A
33
38
29
*This question was completed by 94.8% (n=273) of the sample.
www.jnnp.com
Table 2 Per cent item non-response and computable scale
and summary scores
Sample
Pooled
Hospital
Postal survey
Walk
unaided
Walk aided
Wheel chair
No of
patients
Computable scores (%)
Item
non-response
(%)
Scales
PCS/MCS
437
149
288
90
0.9–5.7
0
1.0–7.3
0–4.5
95.7–100
100
92.4–100
96.7–100
90.9
100
86.5
95.5
104
79
1.0–5.8
1.3–16.5
94.2–100
84.8–100
91.3
72.2
walked unaided or with an aid. In wheelchair
dependent participants, the proportion of
missing data reached a maximum of 16.5% for
two items (questions 3i, 3j) and, although scale
scores could be computed for the vast majority
of people, scores for summary measures could
only be computed in 72% (all eight scale scores
must be present for summary scores to be
computed).
IS IT LEGITIMATE TO GENERATE SF-36 SCALE
SCORES IN MULTIPLE SCLEROSIS ?
Results for the pooled sample are reported, but
independent analyses of the hospital and postal
samples yielded similar results. Although all
response options were endorsed for each item,
item response-option frequency distributions
were quite symmetric for only five of the eight
scales (BP, GH, VT, SF, RE). Response distributions were skewed towards less favourable
health states (low scores) for the PF and RP
scales, and skewed towards more favourable
health states for the MH scale. Nevertheless,
items within each scale had similar mean scores
and standard deviations indicating that they
were roughly parallel.
All item-own scale correlations, corrected for
overlap, exceeded 0.40 indicating that the
items in each scale measured a common
underlying construct, and that the criterion of
Ware et al of equivalence of item total correlations was satisfied. Only two item-own scale
correlations did not exceed item-other scale
correlations by more than two standard errors.
Item 9a (“How much of the time did you feel
full of life”) correlated similarly with the VT
and SF scales (0.61 and 0.54 respectively), and
item 9b (“How much of the time have you been
a nervous person”) correlated similarly with
the MH and RE scales (0.46 and 0.36 respectively). Therefore, these two items had a
limited ability to discriminate between two
constructs that are hypothesised to be distinct.
á CoeYcients for all SF-36 scales exceeded
0.80 indicating that all scales generated reliable
scores (table 3). Intercorrelations among scales
(range 0.18 to 0.57) were substantially below
their respective á values, indicating that they
were measuring eight related but distinct
constructs.
Scores for the eight SF-36 scales spanned the
entire scale ranges and, therefore, demonstrated
good variability. Scores for the PF and RP scales
were positively skewed (skewness 1.13 and 1.32
respectively) indicating that respondents tended
to be more physically disabled. Scores for the
other six scales were more evenly distributed
Downloaded from jnnp.bmj.com on October 1, 2014 - Published by group.bmj.com
367
The SF-36 in multiple sclerosis
Table 3
Intercorrelations among SF-36 scales in the pooled sample (n=415 to 437)
1
A
SF-36 scale
MH
PF
RP
PF
RP
BP
GH
VT
SF
RE
MH
(0.94)
0.49
0.30
0.37
0.34
0.45
0.18
0.23
(0.87)
0.28
0.37
0.43
0.48
0.45
0.33
BP
GH
(0.92)
0.34
0.35
0.34
0.28
0.34
(0.81)
0.48
0.48
0.28
0.44
VT
(0.82)
0.49
0.35
0.54
SF
RE
MH
RE
MCS
SF-36
scale*
(0.83)
0.44
0.51
(0.89)
0.57
SF
VT
0.5
GH
RP
(0.83)
BP
*Abbreviations in text.
á CoeYcients in parentheses.
PF
0
Correlations between SF-36 scales and rotated components
MS (n=398)
0.5
0
US population (n=2474)*
SF-36 scale†
Factor‡
PCS
MCS
h2/rtt§
PCS
MCS
h2/rtt
PF
RP
BP
GH
VT
SF
RE
MH
Eigenvalue
Variance
Total variance**
P
P
P
P>M
M>P
M
M
M
0.88
0.69
0.48
0.59
0.47
0.60
0.13
0.20
3.78
47.3
59.7
0.05
0.30
0.31
0.39
0.57
0.51
0.81
0.86
0.996
12.5
0.82
0.67
0.35
0.60
0.67
0.74
0.75
0.91
0.85
0.81
0.76
0.69
0.47
0.42
0.17
0.17
>1.0
NR¶
81.5
0.12
0.27
0.28
0.37
0.64
0.67
0.78
0.87
>1.0
NR
0.78
0.82
0.72
0.78
0.75
0.92
0.78
0.92
1
B
MH
RE
VT
SF
0.5
GH
BP
*From Ware et al 1994.
†Abbreviations in text.
‡Hypothesised factor content: P=physical factor content; M=mental factor content.
§Total reliable variance in each SF-36 scale explained by the two principal components. h2=sum
of squared factor loadings for each scale; rtt=á coeYcient for each scale.
¶Not reported.
**Per cent of total reliable variance in all SF-36 scales explained by the two principal components.
(skewness−0.50 to +0.40). There were notable
floor or ceiling eVects for four scales: RP (floor
61.6%); RE (floor 37.3%, ceiling 41.4%); PF
(floor 23.4%); BP (ceiling 21.1%).
IS IT LEGITIMATE TO GENERATE SF-36 SUMMARY
SCORES IN MULTIPLE SCLEROSIS ?
Results for the pooled sample are reported, but
independent analyses of the hospital and postal
samples yielded similar results. Principal components analysis of intercorrelations among
SF-36 scales extracted only one component
with an Eigenvalue greater than unity.
Nevertheless, the Eigenvalue of the second
component (0.996) was essentially unity and
examination of the scree plot supported the
hypothesis that a two dimensional model of
health underpins the SF-36 in multiple sclerosis. However, these two components explained
less than 60% of the total reliable variance in all
SF-36 scales, and less than 75% of the reliable
variable in five of the eight scales (table 4),
indicating that a substantial amount of information from SF-36 scales is lost when
summary measures are reported in multiple
sclerosis. In addition, the magnitude and
pattern of scale to component correlations in
multiple sclerosis diVer from the United States
general population, indicating that the scale
weights used to generate scores for the
summary measures are not entirely applicable
to people with multiple sclerosis (table 4, fig 2).
Discussion
This study has comprehensively examined the
basic assumptions underpinning the use and
scoring of the SF-36 in people with multiple
www.jnnp.com
1
PCS
MCS
Table 4
RP
PF
0
0
0.5
1
PCS
Figure 2 Plot of the SF-36 scale to component
correlations. (A) SF-36 in the United States population
(n=2.474). Prepared from data reported by Ware et al.20
(B) SF-36 in multiple sclerosis (n=438).
sclerosis. High levels of data completeness
indicate that the SF-36 is acceptable to patients
in both hospital and community settings. However, data quality is somewhat compromised
when the SF-36 is administered by postal survey to more disabled people. This finding
probably represents physical limitations (for
example, impaired vision and writing) rather
than poor acceptance and understanding of the
instrument because data quality in the more
disabled hospital based subsample, where the
instrument can be administered by interview if
required, is excellent.
Results indicate that when using the SF-36
in multiple sclerosis, scale scores can be generated using Likert’s method of summed ratings.
All scaling assumptions were fully satisfied
except item discriminant validity. There were
two instances where items failed to achieve
definite scaling successes. This is a minor
problem because the other items in each scale
fully satisfy the criterion and, therefore, anchor
the construct being measured.33 More problematic are the floor and ceiling eVects demonstrated for four scales. These exceed the
recommended maximum of 15%,39 and represent subsamples of people for whom changes in
health status may be underestimated or not
detected by the SF-36.
The most important finding of this study is
that scores for the two SF-36 summary measures should be reported with caution. Although PCA supports a two dimensional
model of health, this model does not explain as
Downloaded from jnnp.bmj.com on October 1, 2014 - Published by group.bmj.com
368
Hobart, Freeman, Lamping, et al
much of the variance in SF-36 scales as
required and the pattern of scale to component correlations is not entirely consistent with
findings in other clinical populations.2 20 40 In
particular, the BP scale correlates only moderately with the physical component (0.48), and
the SF scale correlates only moderately with
the mental component (0.51) and similarly
with the physical component (0.60). Although
small departures from predicted results are to
be expected, and have been reported,2 these
findings in multiple sclerosis seem to be more
significant. The finding that the two components explain less than 60% of the variance in
SF-36 scales suggests that even multiple sclerosis specific algorithms for summary scores,
based on principal components analysis with
orthogonal rotation, may not be feasible.
Other authors have raised concerns about
the SF-36 summary scores because the weightings are based on factor score coeYcients generated by orthogonal factor rotations.41–43
Simon et al argue that physical and mental
health are related and, therefore, orthogonal
rotations which assume factors are uncorrelated could generate misleading results. They
support their argument with empirical evidence in primary care patients.41 Norvedt et al
show that the SF-36 MCS underestimates the
mental heath impact of multiple sclerosis,43 and
that the RAND-36 physical and mental
summary scores,42 the weightings of which are
generated by oblique factor rotations (which
assume the factors are correlated), provide
mental health scores that are more consistent
with multiple sclerosis.
The results of our study, however, suggest
that the problem may be more fundamental
than the method of factor rotation. Factor
analysis is a data reduction technique that
analyses the relations among a group of
variables and identifies clusters of variables
that are empirically distinct. Table 3 and figure
2 do not show distinct clusters among SF-36
scales. Indeed, correlations among the four
scales hypothesised to correlate highest with
the physical health component (PF, RP, BP,
and GH) are notably lower (range 0.28 to 0.49;
mean 0.36) than those reported by others
(range 0.52 to 0.65; mean 0.5720) and similar to
those between physical and mental scales
(range 0.18 to 0.48; mean 0.37).
In view of the comments of Simon et al, and
others who raise concerns about the use of
principal components analysis or orthogonal
factor rotations in health measurement,44 we
repeated the factor analytical studies using different methods of extraction (principal axis,
maximum likelihood, unweighted and generalised least squares) and oblique (promax) rotation. All methods of factor analysis generated
similar results. Most scales (four or more) did
not load uniquely on only one factor and had
relatively high loadings (>0.50) on both
factors. Furthermore, no clear factor solutions
were generated. These findings are clinically
sound. For example, fatigue can impact significantly on both physical and mental functioning
and roles. Although our failure to replicate the
SF-36 factor structure may represent cultural
www.jnnp.com
diVerences (United Kingdom versus United
States), evidence suggests that this is not the
case.45
Although this is a relatively small study the
generalisability of these results is supported by
two facts. Firstly, when tests of scaling assumptions underpinning the generation of SF-36
scale and summary scores were undertaken for
the hospital and postal samples separately,
similar findings were demonstrated. Secondly,
SF-36 scale score distributions, floor and ceiling eVects, and á coeYcients reported in this
study reproduce the findings of others.15 22
Nevertheless, further studies are required to
establish the replicability of these results and
the interpretation of these findings. It is also
important to note that this study has only considered data quality and scaling assumptions,
criteria that should be satisfied before more
detailed psychometric evaluations are undertaken. More extensive evaluations of SF-36
scales in people with multiple sclerosis are
required to determine the extent to which they
are valid and responsive indicators of the health
constructs that they purport to measure.
This study did not consider the content
validity of the SF-36 in multiple sclerosis. That
is, to what extent do the items of the SF-36
compare with issues volunteered as important
by patients in open ended interviews. Generic
measures are designed to assess health domains
thought to be universally relevant. Therefore,
they have the advantage of enabling comparisons across diseases and interventions, but the
disadvantage of failing to reflect domains and
aspects of health that are disease unique. This
may influence the potential of generic measures to detect change. These arguments underpin the development of disease specific health
measures, and the use of both types of
measures in studies.27
A limitation of our study was that we used an
arbitrary criterion, the subjective judgment of
one of the authors, to determine whether people in the hospital based sample had significant
cognitive impairment precluding reliable completion of questionnaires. It would have been
preferable to have had cognitive function
formally evaluated, and a predefined empirically based cut oV level for inclusion or exclusion. Unfortunately, such criteria do not exist
as the relation between cognitive impairment
and ability to complete self report questionnaires in a reliable and valid manner has not
been formally evaluated. This is an important
area for future research in patient based
outcome measurement of neurological disorders associated with cognitive impairment.
The results of this study have implications
for clinical trials in multiple sclerosis. Some
new and expensive treatments are now available that have been shown to significantly aVect
the natural history of multiple sclerosis in
terms of brain MRI and relapse rate but not
impact on disability progression. As the
disability measure used in all of these studies,
the EDSS, has poor ability to distinguish
between groups and individual patients and
limited responsiveness,46 multiple sclerosis
clinical trialists are looking for more rigorous
Downloaded from jnnp.bmj.com on October 1, 2014 - Published by group.bmj.com
369
The SF-36 in multiple sclerosis
methods of measurement of health status.
There is, rightly, considerable interest in the
SF-36. Furthermore, the benefits of SF-36
summary scores over scale scores (absence of
floor and ceiling eVects, better measurement
precision, greater responsiveness, fewer statistical analyses) oVer an attractive solution to
many measurement problems. Results from
this and other studies15 22 23 show floor and ceiling eVects for SF-36 scales that may limit their
usefulness in detecting treatment eVects, and
this study questions the validity of SF-36 summary scores.
This study also has wider implications for
health measurement. The findings are of practical use for neurologists and other health professionals who may take measures “oV the
shelf ” expecting that such attributes have been
fully tested or that measures are generally
applicable. The result might also be important
in reporting accurately the strength of treatment or rehabilitation eVects.
Conclusions
The findings of this study provide some
empirically based guidelines for the use of the
SF-36 in multiple sclerosis. High levels of data
quality support its use as a health measure in
diverse groups of people with multiple sclerosis. Tests of scaling assumptions suggest that
SF-36 scale scores can be reported with confidence, but that summary scores are not valid.
Results also suggest that use of the SF-36
might be limited to cross sectional studies as
the floor and ceiling eVects associated with
scale scores could underestimate treatment
eVectiveness in clinical trials, and the extent of
health changes in longitudinal studies. It is
important to note that health measures such as
the SF-36 are recommended for group
comparison studies and not individual patient
clinical decision making. This is because confidence intervals around individual scores are
too wide to be able to make reliable and valid
judgments at the level of the individual
patient.39 Finally, this study provides further
evidence of the need to evaluate psychometric
properties, including scaling assumptions, in
relevant clinical populations before these
instruments are used to evaluate therapeutic
eVectiveness in disease specific samples.
We are very grateful to the people with multiple sclerosis who
participated in the study, the multiple sclerosis Society of Great
Britain and Northern Ireland for their collaboration in this
project, and Ms Laura Camfield at the Institute of Neurology
for help with the postal survey.
1 McHorney CA, Ware JE Jr, Lu JFR, et al. The MOS 36-item
short-form health survey (SF-36): III. Tests of data quality,
scaling assumptions and reliability across diverse patient
groups. Med Care 1994;32:40–66.
2 Kosinski M, Keller SD, Hatoum TH, et al. The SF-36
health survey as a generic outcome measure in clinical trials
of patients with rheumatiod arthritis. Tests of data quality,
scaling assumptions, and score reliability. Med Care
1999;37:MS10–22.
3 Ware JE Jr, Snow KK, Kosinski M, et al. SF-36 health survey
manual and interpretation guide. Boston, MA: Nimrod Press,
1993.
4 Stewart AL, Hays RD, Ware JE Jr. The MOS short-form
general health survey: reliability and validity in a patient
population. Med Care 1988;26:724–35.
5 Dorman P, Slattery J, Farrell B, et al. Qualitative
comparison of the reliability of health status assessments
with EuroQol and SF-36 questionnaires after stroke. Stroke
1998;29:63–8.
www.jnnp.com
6 Jenkinson C, Fitzpatrick R, Swash M, et al. The ALS health
profile study: quality of life of ALS patients and carers in
europe. J Neurol 2000;247:0835–40.
7 Jenkinson C, Peto V, Fitzpatrick R, et al. Self-reported functioning and well-being in patients with Parkinson’s disease:
comparison of the short-form health survey (SF-36) and
the Parkinson’s disease questionnaire (PDQ-39). Age Ageing 1995;24:505–9.
8 Jacoby A, Baker G, Steen N, et al. The SF-36 as a health
status measure for epilepsy: a psychometric analysis. Qual
Life Res 1999;8:351–64.
9 Monzon M, Lainesz M. Quality of life in migraine and
chronic daily headache patients. Cephalagia 1998;18:638–
43.
10 Freeman JA, Langdon DW, Hobart JC, et al. Health-related
quality of life in people with multiple sclerosis undergoing
inpatient rehabilitation. J Neurol Rehabil 1996;10:185–94.
11 Rothwell PM, McDowell Z, Wong CK, et al. Doctors and
patients don’t agree: cross sectional study of patients’ and
doctors’ perceptions and assessments of disability in multiple sclerosis. BMJ 1997;314:1580–3.
12 The Canadian Burden of Illness Study Group. Burden of
illness of multiple sclerosis: part II: quality of life. Can J
Neurol Sci 1998;25:31–8.
13 Vickrey BG, Hays RD, Genovese BJ, et al. Comparison of
generic to disease-targeted health-related quality-of-life
measures for multiple sclerosis. J Clin Epidemiol 1997;50:
557–69.
14 Peto V, Jenkinson C, Fitzpatrick R, et al. The development
and validation of a short measure of functioning and wellbeing for individuals with Parkinson’s disease. Qual Life Res
1995;4:241–8.
15 Vickrey BG, Hays RD, Harooni R, et al. A health-related
quality of life measure for multiple sclerosis. Qual Life Res
1995;4:187–206.
16 Cella DF, Dineen K, Arnason B, et al. Validation of the
functional assessment of multiple sclerosis quality of life
instrument. Neurology 1996;47:129–39.
17 Jenkinson C, Fitzpatrick R, Brennan C, et al. Development
and validation of a short measure of health status for individuals with ALS/MND. J Neurol 1999;246:16–21.
18 Schrag A, Selai C, Jahanshahi M, et al. The EQ-5D—a
generic quality of life measure—is a useful instrument to
measure quality of life in patients with Parkinson’s disease.
J Neurol Neurosurg Psychiatry 2000;69:67–73.
19 Martin B, Pathak D, Sharfman M, et al. Validity and
reliability of the migraine-specific quality of life questionnaire (MSQ version 2.1). Headache 2000;40:204–15.
20 Ware JE Jr, Kosinski MA, Keller SD. SF-36 physical and
mental health summary scales: a user’s manual. Boston, MA:
The Health Institute, New England Medical Centre, 1994.
21 Ware JE Jr, Kosinski M, Bayliss MS, et al. Comparison of
methods for the scoring and statistical analysis of SF-36
health profile and summary measures: summary of results
from the medical outcomes study. Med Care 1995;33:
AS264–79.
22 Vickrey B, Hays R, Genovese B, et al. Comparison of a
generic to disease-targeted health-related quality-of-life
measures for multiple sclerosis. J Clin Epidemiol 1997;50:
557–69.
23 Freeman JA, Hobart JC, Langdon DW, et al. Clinical
appropriateness: a key factor in outcome measure selection. The 36-item short form health survey in multiple
sclerosis. J Neurol Neurosurg Psychiatry 2000;68:150–6.
24 Lord FM, Novick MR. Statistical theories of mental test scores.
Reading, MA: Addison-Wesley, 1968.
25 Poser CM, Paty DW, McDonald WI, et al. New diagnostic
criteria for multiple sclerosis: guidelines for research protocols. Ann Neurol 1983;13:227–31.
26 Kurtzke JF. Rating neurological impairment in multiple
sclerosis: an expanded disability status scale (EDSS). Neurology 1983;33:1444–52.
27 Hobart JC, Lamping DL, Fitzpatrick R, et al. The multiple
sclerosis impact scale (MSIS-29): a new patient-based outcome measure. Brain 2001;124:962–73.
28 Likert RA. A technique for the development of attitudes.
Arch Psychol 1932;140:5–55.
29 Stewart AL, Ware JE Jr, ed. Measuring functioning and
well-being: the medical outcomes study approach. Durham,
NC: Duke University Press; 1992.
30 Ware JE Jr, Davies-Avery A, Brook RH. Conceptualization
and measurement of health for adults in the health insurance
study. Vol VI. Analysis of relationships among health status
measures. Santa Monica, CA: The Rand Corporation,
1980. (Report No R-1987/6-HEW.)
31 Streiner DL, Norman GR. Health measurement scales: a practical guide to their development and use, 2nd ed. Oxford:
Oxford University Press, 1995.
32 Nunnally JC, Bernstein IH. Psychometric theory, 3rd ed. New
York: McGraw-Hill, 1994.
33 Ware JE Jr, Harris WJ, Gandek B, et al. MAP-R for windows:
multitrait/multi-item analysis program: revised user’s guide.
Boston, MA: Health Assessment Lab, 1997.
34 Ware JE Jr, Brook RH, Davies-Avery A, et al. Conceptualization and measurement of health for adults in the health
insurance study. Vol I. Model of health and methodology. Santa
Monica, California: The Rand Corporation, 1980. (Report
No R-1987/1-HEW.)
35 Cronbach LJ. CoeYcient alpha and the internal structure of
tests. Psychometrika 1951;16:297–334.
Downloaded from jnnp.bmj.com on October 1, 2014 - Published by group.bmj.com
370
Hobart, Freeman, Lamping, et al
36 Lohr KN, Aaronson NK, Alonso J, et al. Evaluating quality
of life and health status instruments: development of scientific review criteria. Clin Ther 1996;18:979–92.
37 Guttman LA. Some necessary conditions for commonfactor analysis. Psychometrika 1954;19:149–61.
38 Cattell RB. The scree test for the number of factors. Multivariate Behavioural Research 1966;1:245–76.
39 McHorney CA, Tarlov AR. Individual-patient monitoring
in clinical practice: are available health status surveys
adequate? Qual Life Res 1995;4:293–307.
40 Brazier JE, Harper R, Jones NMB, et al. Validating the SF
36 health survey questionnaire: new outcome measure for
primary care. BMJ 1992;305:160–4.
41 Simon GE, Revicki DA, Grothaus MA, et al. SF-36
summary scores: are physical and mental health truly
distinct? Med Care 1998;36:567–72.
42 Hays RD, Prince-Embury S, Chen H. RAND-36 Health
status inventory. San Antonio, TX: Psycholoical Corporation, 1998.
43 Norvedt MW, Riise T, Myer K-M, et al. Performance of the
SF-36, SF-12, and RAND-36 summary scales in a multiple
sclerosis population. Med Care 2000;38:1022–8.
44 Fayers PM, Machin D. Factor analysis. In: Staquet MJ,
Hays RD, Fayers PM, eds. Quality of life assessment in clinical trials: methods and practice. Oxford: Oxford University
Press, 1998:191–223.
45 Jenkinson C. Comparison of UK and US methods for
weighting and scoring the SF-36 summary measures. J
Public Health Med 1999;21:372–6.
46 Hobart JC, Freeman JA, Thompson AJ. Kurtzke scales
revisited: the application of psychometric methods to clinical intuition. Brain 2000;123:1027–40.
Want full access but don't
have a subscription?
Pay per access
For just US$25 you can have instant access to the whole website for 30 days. During this time you will be able to access the full
text for all issues (including supplements) available. You will also be able to download and print any relevant pdf files for personal
use, and take advantage of all the special features Journal of Neurology, Neurosurgery, and Psychiatry online has to offer.
www.jnnp.com
www.jnnp.com
Downloaded from jnnp.bmj.com on October 1, 2014 - Published by group.bmj.com
The SF-36 in multiple sclerosis: why basic
assumptions must be tested
J Hobart, J Freeman, D Lamping, et al.
J Neurol Neurosurg Psychiatry 2001 71: 363-370
doi: 10.1136/jnnp.71.3.363
Updated information and services can be found at:
http://jnnp.bmj.com/content/71/3/363.full.html
These include:
References
This article cites 32 articles, 10 of which can be accessed free at:
http://jnnp.bmj.com/content/71/3/363.full.html#ref-list-1
Article cited in:
http://jnnp.bmj.com/content/71/3/363.full.html#related-urls
Email alerting
service
Topic
Collections
Receive free email alerts when new articles cite this article. Sign up in the
box at the top right corner of the online article.
Articles on similar topics can be found in the following collections
Immunology (including allergy) (1698 articles)
Multiple sclerosis (809 articles)
Notes
To request permissions go to:
http://group.bmj.com/group/rights-licensing/permissions
To order reprints go to:
http://journals.bmj.com/cgi/reprintform
To subscribe to BMJ go to:
http://group.bmj.com/subscribe/


© Copyright 2026