
Original Article Differences in prescribed Kt/V and delivered haemodialysis
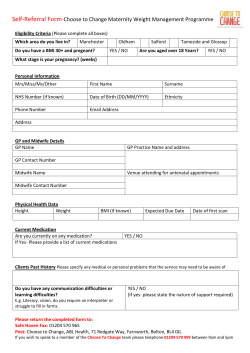
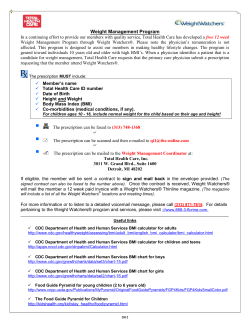
NDT Advance Access published June 19, 2013
Nephrol Dial Transplant (2013) 0: 1–5
doi: 10.1093/ndt/gft237
Original Article
Differences in prescribed Kt/V and delivered haemodialysis
dose—why obesity makes a difference to survival for
haemodialysis patients when using a ‘one size fits all’
Kt/V target
London Medical School, London NW3 2QG, UK
Keywords: anthropomorphic Watson, body composition,
Kt/V, multi-frequency bioimpedance, muscle fat, obesity
Correspondence and offprint requests to: Andrew
Davenport; E-mail: [email protected]
the Watson-based urea volume of distribution for the obese
patients (BMI > 35; spKt/V 1.63 ± 0.48 versus 1.41 ± 0.35 and
BMI 30–35; 1.65 ± 0.3 versus 1.46 ± 0.26, both P < 0.01).
Conclusions. Prescribing dialysis or quantifying on-line clearance based on the anthropomorphically derived Watson
equation leads to underestimation of the delivered dose to
obese patients, due to changes in underlying body composition. As such, when using a ‘one size fits all’ target Kt/V,
obese patients have an advantage over patients with normal
BMI, in that they will receive a greater delivered dose of dialysis, and this may potentially explain the paradoxical survival
advantage of the morbidly obese haemodialysis patient.
A B S T R AC T
Background. Morbid obesity is reported to be a survival factor
for haemodialysis patients compared with those with a normal
body mass index (BMI), yet morbid obesity (BMI >35) is a
mortality risk factor for obese patients in the general population. Traditionally, haemodialysis dosing is prescribed to
achieve a target Kt/V corrected for total body water (TBW). As
obese patients typically have increased body fat, which contains less water than muscle, then obese patients may have
lower levels of body water than their slimmer counterparts,
and as such delivered Kt/V could be greater than that estimated using standard anthropomorphic equations, and so increased dialysis dose may help explain the increased survival
reported for obese patients.
Methods. We compared multi-frequency bioelectrical impedance analysis (MF-BIA) measurements of TBW in healthy
haemodialysis outpatients, and compared TBW with that calculated from the Watson equation derived from anthropomorphic measurements.
Results. Three hundred and sixty-three adult patients, mean
age 58.1 ± 16.7 years, 60.9% male and 29.9% diabetic were
studied. MF-BIA-measured body composition showed that as
BMI increased from <20 to >35, the percentage skeletal muscle
mass fell from 42.8 ± 4.9 to 29.2 ± 5.5% (P < 0.01) whereas the
% fat mass increased from 24.5 ± 11.6 to 46.7 ± 6.8% (P < 0.01).
As such, TBW measured by MF-BIA was significantly lower
from that predicted by the Watson equation at higher BMIs
(BMI > 35; 38.9 ± 6.8 versus 44.7 ± 6.9 L, P < 0.01 and BMI =
30–35; 37.2 ± 7.5 versus 41.9 ± 7.3 L, P < 0.01), and as such the
delivered Kt/V using MF-BIA was much greater than that using
© The Author 2013. Published by Oxford University Press on
behalf of ERA-EDTA. All rights reserved.
INTRODUCTION
Mortality risk progressively increases with chronic kidney
disease staging [1], and intuitively treatment with a greater
amount of dialysis might be expected to improve patient survival. The National Cooperative Dialysis Study (NCDS) showed
that those patients treated by thrice weekly haemodialysis with
higher time-averaged urea concentrations were more likely to
become unwell, and defined a threshold adequacy, based on
urea clearance [2]. Urea clearance was expressed as Kt/V,
where K is the dialyser urea clearance, t is the duration of the
dialysis session and V is the volume of urea distribution [3].
Later studies showed a relationship between carbamylated haemoglobin [4] and Kt/V [5]. Subsequent observational studies
reported improved patient survival rates with Kt/V > 1.0 [6, 7],
and by consensus dialysis sessional Kt/V targets were increased to 1.2 [8]. The Haemodialysis study (HEMO study)
1
Downloaded from http://ndt.oxfordjournals.org/ by guest on October 1, 2014
UCL Center for Nephrology, Royal Free Hospital, University College
Andrew Davenport
Wilcoxon rank-sum pair test for paired values with Bonferroni
correction for multiple analyses where appropriate and by
ANOVA with Tukey post-hoc correction. Statistical analysis used
Graph Pad Prism version 6.0 (Graph Pad, San Diego, CA, USA)
and SPSS version 17 (University Chicago, USA). Statistical significance was taken at or below the 5% level.
R E S U LT S
We studied 363 adult patients, mean age 58.1 ± 16.7 years,
60.9% male, 28.9% diabetic and dialysis vintage 51 (20–83)
months. Major racial groups were 51.5% Caucasoid, 37.8%
south Saharan African or Afro-Caribbean and 34.2% Asian.
Post-dialysis weight 70 ± 16.0 kg, body mass index (BMI)
25.8 ± 5.4 kg/m2, dialysis session time 3.94 ± 0.5 h with preand post-dialysis serum urea 19.8 ± 6.0 and 5.3 ± 2.3 mmol/L,
respectively, with a urea reduction ratio 73.3 ± 7.1%. Pre-dialysis haemoglobin 11.4 ± 1.5 g/L, albumin 40.9 ± 3.9 g/L,
median C-reactive protein 4 (2–11) mg/L and glucose 5.9
(4.8–8.4) mmol/L. TBW, measured by MF-BIA post-dialysis
was 35.2 ± 7.5 L and did not differ from that estimated from
Watson (36.6 ± 7.0 L), but single-pool Kt/V was statistically
different for that using MF-BIA 1.65 ± 0.41 compared with
that using the Watson equation, 1.56 ± 0.32, P < 0.001. MFBIA skeletal muscle mass was 26.3 ± 6.2 kg, fat mass
23.0 ± 12.0 kg, giving a percentage body skeletal muscle
content of 37.6 ± 6.9% and fat content of 31.4 ± 13.0%.
Patients were divided according to BMI into five groups,
those with a BMI 19 or lower, 20–25, 25–30, 30–35 and >35.0.
There was no difference in ethnic distribution between the
groups, although there were differences in sex distribution and
diabetes with BMI (Table 1). TBW was significantly greater
when calculated by the Watson equation compared with that
measured by MF-BIA for those patients with the greater BMIs
(Figure 1).
The pre-dialysis serum urea was lower in those patients
with the smallest BMI compared with the highest quintile,
whereas the urea reduction ratio was higher for the lowest
quintile BMI compared with the highest (Table 1). Comparing
single-pool Kt/V measured by the Daugirdas equation [23],
and that recalculated using MF-BIA, then Kt/V was greater
with the Daugirdas equation for those patients with the lowest
BMIs, and lower for those with the highest BMIs (Figure 2).
The percentage ultrafiltration to MF-BIA measured TBW was
greater for the highest BMI groups (Table 1). Although there
was a trend for patients with a lower BMI having shorter dialysis sessions, this was not significant when correcting for multiple analyses (Table 1).
Body composition, in terms of muscle and fat differed
between the BMI quintiles, with reducing muscle mass and increasing fat as BMI increased (Figure 3).
M AT E R I A L S A N D M E T H O D S
Multi-frequency bioimpedance measurements were made post
dialysis in 361 healthy haemodialysis outpatients attending
their mid-week dialysis session (InBody 720 Body Composition Analysis, Biospace, Seoul, South Korea) [17], using
direct segmental MF-BIA with tetrapolar 8-point tactile electrodes [18], in a standardized manner [19]. Patients with
cardiac pacemakers, implantable defibrillators, amputees and
those unable to stand on the bioimpedance machine were excluded from study. Fresenius F4000H or 5000H dialysis
machines (Fresenius Bad Homburg, Germany) were used with
polysulfone high-flux dialysers (Nipro Corporation, Osaka,
Japan) [20], with ultrapure quality dialysis water and low-molecular-weight heparin (Tinzaparin, Leo Laboratories, Princes
Risborough, UK) [21]. Pre- and post-dialysis dialysis blood
samples were taken in a standardized fashion measured with a
standard laboratory auto-analyser (Roche Integra, Roche diagnostics, Lewes, UK) and haemoglobin (XE-2100 Sysmex Corporation, Kobe, Japan).
Kt/V was calculated using the Daugirdas equation [22].
Body composition was derived from multi-frequency bioelectrical impedance assessments (MF-BIA) [15, 23]. Using TBW
measured post dialysis by MF-BIA, Kt/V was recalculated [24]
assuming the Watson formula for TBW [25]. Ethical approval
was granted by the local ethical committee as part of UK National Health Service audit and clinical service development.
Statistical analysis
Results are expressed as mean ± standard deviation, or
median and inter-quartile range, or percentage. Statistical analysis was by χ 2 analysis, corrected for small numbers by Yates’ correction, students’ t-test for parametric and the Mann–Whitney
U-test for nonparametric data, Student’s pair t-test and
DISCUSSION
Although the NCDS study helped to define a lower limit for
dialysis dosing, based on urea clearance [2, 3], subsequent
2
A. Davenport
Downloaded from http://ndt.oxfordjournals.org/ by guest on October 1, 2014
ORIGINAL ARTICLE
[9], the second randomized controlled trial to investigate the
effect of Kt/V on patient outcomes, reported that higher doses
did not improve overall patient survival. However, on subgroup analysis, women who had been established on haemodialysis for more than 3 years did benefit from higher Kt/V
targets. This led to suggestions that using an estimate of body
water resulted in underdosing of some patient groups on one
hand and potentially delivering greater doses to others [10].
Whereas for the general population, morbid obesity is associated with increased mortality [11], several observational
studies have reported that survival is increased for the morbidly obese haemodialysis patients [12, 13]. This apparent
paradox may be due to changes in body composition, as fat
contains less water than muscle, and the standard equations
used to calculate body water may not reflect these differences.
Multi-frequency bioelectrical impedance assessments (MFBIA) can be used to both measure body water [14] and also
body composition in dialysis patients [15, 16]. To determine
whether obese patients receive a proportionally higher dialysis
dose when the same Kt/V target is used, we compared total
body water (TBW) estimation by anthropomorphic equations
and that measured by MF-BIA.
Table 1. Patients divided according to body mass index (kg/m2)
≤20
20–25
25–30
30–35
>35.0
n
38
141
120
42
22
Male
16
90
81
28
10
Female
22
52
41
14
12
diabetic
2
38
31
20
13
Not diabetic
36
103
89
22
9
Caucasoid
12
51
50
19
10
African
10
39
36
11
8
Asian
16
49
33
9
4
Pre urea (mmol/L)
17.2 ± 5.5
20.0 ± 6.7
19.8 ± 5.0
20.4 ± 5.8
21.7 ± 5.7*
URR (%)
75.2 ± 8.6
74.5 ± 6.3
73.0 ± 6.6
71.1 ± 6.5
78.7 ± 9.8*
UF/TBW%
2.4 (1.4–3.2)
3.1 (1.9–4.0)
3.4 (2.3–5.0)
4.9 (2.8–6.5)
4.6 (3.5–7.7)*
Session time (h)
3.8 ± 0.62
3.89 ± 0.46
4.0 ± 0.46
3.97 ± 0.55
4.12 ± 0.57
Comparison of sex, diabetes and racial origin, Sub Sahara African-AfroCaribbean (African). χ analysis. Pre-dialysis serum urea (Pre-urea).
URR, urea reduction ratio. Dialysis session time in hours. Males versus females P = 0.035, diabetes versus no diabetes P < 0.001.
Ultrafiltration volume (UF) to total body water (TBW). Results expressed as mean ± SD or median (inter-quartile range).
*P < 0.05 BMI < 20 versus BMI > 35.
2
ORIGINAL ARTICLE
Downloaded from http://ndt.oxfordjournals.org/ by guest on October 1, 2014
BMI
F I G U R E 2 : Kt/V calculated by the Daugirdas equation [22] com-
pared with that using total body water measured by multifrequency
bioelectrical impedance analysis (MF-BIA) in patient cohort divided
into body mass index (BMI) kg/m2 groups. *P < 0.05 versus MF-BIA
after correction for multiple analyses.
F I G U R E 1 : Total body water (TBW) calculated by Watson equation
[23] compared with TBW measured by multi-frequency bioelectrical
impedance analysis (MF-BIA) in patient cohort divided into body
mass index (BMI) kg/m2 groups. *P < 0.05 versus MF-BIA after correction for multiple analyses.
the volume of urea distribution, then V will be overestimated
in the morbidly obese patient due to the relative increase in fat
mass and reduction in muscle, due to the lower water content
of adipose tissue. In addition, to achieve a pre-determined
target, it is most likely that dialysis session time will be increased for the obese patient, so they additionally benefit both
from increased clearance of time-dependent solutes, such as
phosphate [28], and also control of sodium balance and overhydration. This is supported by our study with both a trend in
terms of dialysis session time and an increasing proportion of
ultrafiltration to TBW with increasing BMI. As such, this improved delivery of a higher dose of dialysis for the obese
patient could potentially explain the apparent paradox of an
apparent survival advantage for the morbidly obese
(BMI > 35) haemodialysis patient compared with those with
prospective studies failed to show that increasing the delivered
dialysis dose based on Kt/V prescription increased patient survival [9]. This could be due to many confounders, including
residual renal function, the time to accumulate uraemic toxins
to cause morbidity and mortality [26], and the effects of intradialytic weight gains and extracellular volume control [27]. In
addition, the mean Kt/V values in the HEMO study were not
too dissimilar between the groups at 1.16 versus 1.32, so
another potential confounder could have been that patients
with higher BMIs had an underestimate of the actual dose delivered, and those with lower BMIs an overestimate, so that the
groups were not as separated as initially thought.
When dialysis is prescribed according to Kt/V, or measured
by on-line clearance using the Watson equation to estimate
3
Obesity and delivered dialysis dose
obesity with increased body fat content, by containing less
water than muscle, paradoxically has become a survival advantage for haemodialysis patients using current treatment target
paradigms.
C O N F L I C T O F I N T E R E S T S TAT E M E N T
The author has no conflict of interest. The data contained in
this paper have not been previously published in whole or part
form, or by abstract.
F I G U R E 3 : Changes in body composition as percentage of muscle
REFERENCES
1. Chronic Kidney Disease Prognosis ConsortiumMatsushita K, van
der Velde M, Astor BC et al. Association of estimated glomerular
filtration rate and albuminuria with all-cause and cardiovascular
mortality in general population cohorts: a collaborative metaanalysis. Lancet 2010; 375: 2073–2081
2. Lowrie EG, Laird NM, Parker TF et al. Effect of the haemodialysis
prescription of patient morbidity: report from the National Cooperative Dialysis Study. N Engl J Med 1981; 305: 1176–1181
3. Gotch FA, Sargent JA. A mechanistic analysis of the National Cooperative Dialysis Study (NCDS). Kidney Int 1985; 28: 526–534
4. Davenport A, Jones SR, Goel S et al. Differentiation of acute from
chronic renal impairment by detection of carbamylated haemoglobin. Lancet 1993; 341: 1614–1617
5. Davenport A, Jones S, Goel S et al. Carbamylated hemoglobin: a
potential marker for the adequacy of haemodialysis therapy in
end-stage renal failure. Kidney Int 1996; 50: 1344–1351
6. Parker TF, 3rd, Husni L, Huang W et al. Survival of haemodialysis patients in the United States is improved with a greater quantity of dialysis. Am J Kidney Dis 1994; 23: 670–680
7. Held PJ, Port FK, Wolfe RA et al. The dose of haemodialysis and
patient mortality. Kidney Int 1996; 50: 550–556
8. Morbidity and mortality of dialysis: an NIH Consensus Statement Online. Ann Intern Med 1993; 11: 1–33
9. Eknoyan G, Beck GJ, Cheung AK et al. Haemodialysis (HEMO)
Study Group. Effect of dialysis dose and membrane flux in maintenance haemodialysis. N Engl J Med 2002; 347: 2010–2019
10. Spalding EM, Chandna SM, Davenport A et al. Kt/V underestimates the haemodialysis dose in women and small men. Kidney
Int 2008; 74: 348–355
11. Kral JG. Morbid obesity and related health risks. Ann Intern Med
1985; 103(6 (Pt 2)): 1043–1047
12. Leavey SF, McCullough K, Hecking E et al. Body mass index and
mortality in ‘healthier’ as compared with ‘sicker’ haemodialysis
patients: results from the Dialysis Outcomes and Practice Patterns
Study (DOPPS). Nephrol Dial Transplant 2001; 16: 2386–2394
13. Jialin W, Yi Z, Weijie Y. Relationship between body mass index
and mortality in hemodialysis patients: a meta-analysis. Nephron
Clin Pract 2012; 121: c102–c111
14. Papakrivopoulou E, Booth J, Pinney J et al. Comparison of
volume status in asymptomatic haemodialysis and peritoneal
dialysis outpatients. Nephron Extra 2012; 2: 48–54
15. Fürstenberg A, Davenport A. Comparison of multifrequency
bioelectrical impedance analysis and dual-energy X-ray
normal BMI, whereas the morbidly obese patient in the
general population has increased risk of mortality.
The Watson equation, which is advocated as the standard
for calculating TBW, and recommended by many clinical
guideline committees [29], was derived from studies in the
1950s and 1960s. Since then, body composition has changed
in many economically developed countries, with a trend to increased obesity. Our data support earlier smaller anthropomorphic studies [30] and the more recent analysis from the
HEMO study [31], which reported that the Watson equation
overestimates TBW in haemodialysis patients, and these differences in expected and delivered dialysis dose would help to
explain the reports of increased survival reported in overweight patients [32],
More recently, some groups have used alternative scales,
such as body surface area rather than urea volume distribution
to adjust dialysis dose for body size [33]. Normalizing Kt/V to
body surface area rather than Watson-derived TBW, lowered
the dose of dialysis delivered to women compared with men in
the HEMO [33]. Subsequent re-analysis of the HEMO study
group using dialysis dose corrected for body surface area (BSA)
recently reporting different dose–mortality relationships, which
were substantially different from those using the original
volume-based dosing regimen, reporting an increased survival
for haemodialysis patients up to a Kt/V of 1.6 [34]. Morbidly
obese patients were however excluded from the HEMO study,
and our data would suggest that although correction for BSA
may well be an improvement on the Watson-derived urea
volume, any adjustment for BSA assumes a fixed relationship
with body composition [35], which may well no longer hold
given the current epidemic of obesity in the developed world.
Our data show that when prescribing or delivering haemodialysis to a pre-determined target or on-line Kt/V, the actual
dose of dialysis delivered to the obese patient will be greater
than that predicted by using anthropomorphically derived
equations of TBW, and conversely reducing the dose of dialysis to the patient with a low BMI. Thus, to achieve current, one
size fits all, Kt/V targets the morbidly obese patient potentially
benefits from not only greater small solute clearances, but also
from longer session times, with improved clearance of timedependent solutes and reduced risk of overhydration. As such
4
A. Davenport
Downloaded from http://ndt.oxfordjournals.org/ by guest on October 1, 2014
ORIGINAL ARTICLE
mass and fat mass according to body mass index (BMI) kg/m2
groups. *P < 0.05 versus MF-BIA after correction for multiple analyses compared to the two lowest BMI quintile.
16.
17.
18.
19.
20.
22.
24.
25.
Received for publication: 3.2.2013; Accepted in revised form: 19.4.2013
5
Obesity and delivered dialysis dose
ORIGINAL ARTICLE
23.
Downloaded from http://ndt.oxfordjournals.org/ by guest on October 1, 2014
21.
26. Davenport A, Farrington K. Dialysis dose in acute kidney injury
and chronic dialysis. Lancet 2010; 375: 705–706
27. Davenport A. How best to improve survival in haemodialysis
patients: solute clearance or volume control? Kidney Int 2011; 80:
1018–1020
28. Davenport A, Gardner C, Delaney M. Do differences in dialysis
prescription impact on KDOQI bone mineral targets? The Pan
Thames Renal Audit. Blood Purif 2010; 30: 111–117
29. NKF KDOQI Guidelines: Clinical Practice Guidelines and Clinical Practice Recommendations 2006 Updates Hemodialysis Adequacy. http://www.kidney.org/professionals/KDOQI/guideline_
upHD_PD_VA/hd_guide2.htm (March 2013, date last accessed)
30. Kloppenburg WD, Stegeman CA, de Jong PE et al. Anthropometry-based equations overestimate the urea distribution volume in
haemodialysis patients. Kidney Int 2001; 59: 1165–1174
31. Daugirdas JT, Greene T, Depner TA et al. Hemodialysis (HEMO)
Study Group. Anthropometrically estimated total body water
volumes are larger than modeled urea volume in chronic hemodialysis patients: effects of age, race, and gender. Kidney Int 2003;
64: 1108–1119
32. Lowrie EG, Li Z, Ofsthun N et al. Body size, dialysis dose and
death risk relationships among hemodialysis patients. Kidney Int
2002; 62: 1891–1897
33. Daugirdas JT, Greene T, Chertow GM et al. Can rescaling dose of
dialysis to body surface area in the HEMO Study explain the
different responses to dose in women versus men? Clin J Am Soc
Nephrol 2010; 5: 1628–1636
34. Ramirez SP, Kapke A, Port FK et al. Dialysis dose scaled to body
surface area and size-adjusted, sex-specific patient mortality. Clin
J Am Soc Nephrol 2012; 7: 1977–1987
35. Dubois D, Dubois EF. A formula to estimate the approximate
surface area if the height and weight be known. Arch Intern Med
1916; 863: 17
absorptiometry assessments in outpatient haemodialysis patients.
Am J Kidney Dis 2010; 57: 123–129
Fürstenberg A, Davenport A. Assessment of body composition in
peritoneal dialysis patients using bioelectrical impedance and dualenergy x-ray absorptiometry. Am J Nephrol 2011; 33: 150–156
Booth J, Pinney J, Davenport A. The effect of vascular access
modality on changes in fluid content in the arms as determined
by multifrequency bioimpedance. Nephrol Dial Transplant 2011;
26: 227–231
Sartorio A, Malovolti M, Agosti F et al. Body water distribution
in severe obesity and its assessment from eight polar bioelectrical
impedance analysis. Eur J Clin Nutr 2005; 59: 155–160
Booth J, Pinney J, Davenport A. N-terminal proBNP—marker of
cardiac dysfunction, fluid overload, or malnutrition in haemodialysis patients? Clin J Am Soc Nephrol 2010; 5: 1036–1040
Vernon K, Peasegood J, Riddell A et al. Dialyzers designed to increase internal filtration do not result in significantly increased
platelet activation and thrombin generation. Nephron Clin Pract
2011; 117: c403–408
Davenport A. Low-molecular-weight heparin as an alternative anticoagulant to unfractionated heparin for routine outpatient haemodialysis treatments. Nephrology (Carlton) 2009; 14: 455–461
Daugirdas JT. Second generation logarithmic estimates of singlepool variable volume Kt/V: an analysis of error. J Am Soc
Nephrol 1993; 4: 1205–1213
Campos AC, Chen M, Meguid MM. Comparisons of body composition derived from anthropometric and bioelectrical impedance methods. J Am Coll Nutr 1989; 8: 484–489
Lindley EJ, Chamney PW, Wuepper A et al. A comparison of
methods for determining urea distribution volume for routine
use in on-line monitoring of haemodialysis adequacy. Nephrol
Dial Transplant 2009; 24: 211–216
Watson PE, Watson ID, Batt R. Total body water volume for
adult males and females estimated from simple anthropometric
measurements. Am J Clin Nutr 1980; 33: 27–39


© Copyright 2026