
Options for Victorian Agriculture in a “New” Climate
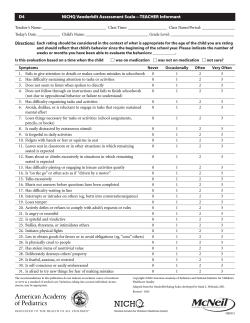
DEPARTMENT OF
PRIMARY INDUSTRIES
CSIRO
ATMOSPHERIC RESEARCH
Options for Victorian Agriculture
in a “New” Climate
-a pilot study linking climate change scenario
modelling and land suitability modelling
Bob Cechet, Adam Hood & Hemayet Hussain
Background
• Victorian Greenhouse Strategy
Understand climate change impacts and
develop adaptation options with sectors/community
• Funding
- Ecological Sustainable Agriculture Initiative (DPI)
- Greenhouse Policy Unit (DSE)
Atmospheric Research
Land Suitability Framework
• Developed by United Nations F.A.O.
• Assesses suitability of land for specific use
• Assessment undertaken using spatial datasets
for various elements based on a function of
the interaction between them and/or through
a multi-criteria analysis method
Atmospheric Research
Land Suitability Analysis (LSA)
• Developed using ArcView Model Builder
• Uses discrete spatial datasets of soil,
landscape and climate (within G.I.S. environment)
• Based on “expert systems” approach
• Easy to scale to regional/strategic levels
• Highly flexible (dependent on question being asked)
• Simple to manipulate/interrogate
Atmospheric Research
Project Design
Land Suitability Analysis
Climate Scenario Tools
Commodities for Analysis
IPCC Climate Change
Evidence
•Rapid Assessment
•GVAP Industry vs. Regional
•Risk and Opportunity
Multi-criteria Evaluation
3.2
3.3
•AHP - IDRISI DSS Module
•Weighted Growth Factors
•Soil Attributes
•Landform
•Climate
Expert Systems Modelling
•Workshops
GIS - Spatial Modelling
3.4
•ESRI Model Builder
•Refine data coverage
•Recent Rapid Change - Industrial
Society
•Link to Greenhouse Gas Emissions
•Relationship CO2 - Climate Change
General Circulation Models
2.1
SRES - Emissions Scenarios
2.2
OzClim - Climate Scenario
Generator
•Long-Term Averages
2.3
•Commodity Specific
Attributes
•GIS Coverages to 2100 by
Scenario and GCM
Regional Commodity Suitability Mapping
• 2020, 2050
•A1F1, B1 scenarios (Extreme, Moderate)
4.1
Biophysical Impact Analysis Change Detection Maps
4.2
Economic and Social Implications
Industry and Regional Adaptation Options
Atmospheric Research
What is OzClim
•
•
•
•
•
•
Based on NZ CLIMPACTS
Climate scenario generator
Explore ranges of climate change
Link climate change with impact models
PC based, GUI interface
Easy to operate, quick to produce results
• www.dar.csiro.au/publications/ozclim.htm
Atmospheric Research
Global Warming
CO2 Concen. (ppmv)
Concentrations
(eg.CO2)
40
30
20
10
0
1980 2010 2040 2070 2100
Choose low emission
scenario IS92c
1100
900
700
500
300
1980 2010 2040 2070 2100
o
Global warming ( C)
Emissions
(eg.CO2)
CO2 Emissions (GtC)
Finding the global warming (I.P.C.C.)
0.7oC
4
3
2
1
o
0
1980 2010 2040 2070 2100
Choose low climate sensitivity
Year
Atmospheric Research
Projected global average warming:
1.4ºC to 5.8ºC by 2100
(I.P.C.C. T.A.R., 2001)
Atmospheric Research
Point Temperature (oC)
YEAR
YEAR
Point Temperature (oC)
Global Temperature (oC)
Creating regional “patterns of change”
Global Temperature (oC)
/OC of
GW
Atmospheric Research
Future mean regional temperatures
+
GW2060
X
[1oC – 3oC]
Base
Climatology
=
Regional
pattern from
GCM
Global
Warming
Result 2060
Atmospheric Research
Land Suitability Analysis (LSA)
• Incorporates Multiple Criteria Evaluation
[MCE] (within G.I.S. environment)
• MCE improves spatial decision making
when considering multiple objectives and
conflicting preferences
• Analytical Hierarchy Process (AHP) is a
MCE method that orders critical factors into
a hierarchy of importance
Atmospheric Research
Analytical Hierarchy Process (AHP)
• Construction of hierarchies; establishing
priorities; ensuring logical consistency
• Improves representativeness as all factors
do not have equal weighting of importance
• Allows criteria to “trade-off” with each
other depending on importance weights
Atmospheric Research
Analytical Hierarchy Process, showing the model used
for high yield pasture: “(criteria weighting)”
RYEGRASS/WHITE CLOVER
Soil
(0.35)
Water Holding
Capacity
(0.65)
EC topsoil
(0.28)
Landscape
(0.30)
Drainage
(0.07)
Altitude
(0.10)
Slope
(0.60)
Climate
(0.35)
Aspect
(0.40)
Temperature
(0.29)
mean mthly temp
min max av.
May-Sept
PASTURE LAND SUITABILITY
IN A CHANGED CLIMATE
Criteria for Growth
(Best managed for 10-14 tons per hectare)
INHERENT FACTORS - AHP
Rainfall
(0.71)
mean mthly rain
Nov-Mar
mean mthly rain
May - Oct
mean mthly rain
May
>9.4degrees
rating 1
>50mm
rating 1
100-175mm
rating 1
>100mm
rating 1
6-9.4 degrees
rating 0.9
30-50mm
rating 0.8
175-250mm
rating 0.8
60-100mm
rating 0.8
<6 degrees
rating 0.3
0-30mm
rating 0.3
65-100mm
rating 0.8
40-60mm
rating 0.6
>250mm
rating 0.6
40-65mm
rating 0.3
<40mm
rating 0.1
Atmospheric Research
Cool Climate Grape
Land Suitability
Victoria
Climate Change Scenario A1F1 (2050)
Gippsland Region
Suitability Index
Restricted
0 (Very low)
1 (Very low)
2 (Low)
3 (Low)
4 (Low)
5 (Moderate) Legend
Gippsland CMA and LGA
6 (Moderate)
boundary
7 (Moderate)
Public Land
8 (High)
This map is suitable for strategic planning
purposes, rather than specific site investigation.
Further detailed site analysis must be carried out
prior to site-specific development proceeding.
Copyright © Department of Natural Resources and Environment (DNRE), 2002.
Map prepared by the Strategic Resources Planning Unit, Agriculture Victoria, Department of Natural Resources and Environment.
This data can not be guaranteed to be without flaw of any kind, and therefore AVS disclaims all liability of error or inappropriate use of the map data.
Data source: Climate data - CSIRO-OzClim (Data Scale: 1:250,000); Soils and DEM data - DNRE, 2001/2002 (Data Scale: 1:25,000).
Base data source: Corporate Geospatial Data Library, DNRE, 2001 (Data Scale: 1:25,000); Auslig Geodata Topo-250K.
0
10
20
30
State Border
Principal Road
Lake
River
No Data
N
10
9 (High)
10 (High)
40
50
Map Sc ale: 1:1,100,000
60
70
80 Kilo meters
Prepared for: Options for Agriculture in a "New Climate"
Edition 3, June 2002, SRP
Project V12CCa; Map Number M76CCa
Model No. A1F1 2050
AMG Zone 55 (Transverse Mercator) Projection
Assessment of Impacts
–
–
Series of specialist workshops developing
awareness & building suitable commodity mode
Mapped commodity scenarios 2000, 2020 and 2050
•
Gippsland
–
–
–
•
•
–
–
–
(Summary of Outputs)
cool climate grapes
high yield pasture
blue gum plantations for years
Mallee (wheat)*
Goulburn/Broken region (stone & pomme fruits)*
Economic and Social Implications*
Industry and Regional Adaptation Options*
Recommendations for further work on toolkit*
*Work currently being undertaken
Atmospheric Research
Graffiti on a billboard in Smith Street, Fitzroy.
Perennial Ryegrass/White Sub-Clover Pasture
Land Suitability
Victoria
Climate Change Scenario A1F1 (2050)
Gipps land R egion
Suitability Index
Restricted
0 (Very low)
1 (Very low)
2 (Low)
3 (Low)
4 (Low)
5 (Moderate)
6 (Moderate)
7 (Moderate)
8 (High)
This map is su itable for strateg ic planning
purp oses, rath er than sp ecific site investigatio n.
Furth er d etailed site analysis sh ou ld be carried o ut
prior to site-specific develop ment pro ceedin g.
Co p yr ig h t © De p a r tm en t o f N a tu ra l Re s ou r ce s a nd E n v ir o nm e n t ( DN R E ), 2 0 0 2 .
Ma p p r ep a r e d by the S tr a te g ic R e so u r ce s P la n n in g Un i t, A g ri cu ltu r e V ic tor ia , D e p a rtm e n t o f N atu r a l R e so u rc e s a n d E n vi ro n m e n t.
Th is d ata c a n n o t b e g u a ra n te e d to b e w ith o u t fla w o f a n y ki nd , a n d th e re fo r e A V S d is cla i m s a ll lia b i lity of er r or o r in a p pr o p ri a te us e o f th e ma p d a ta .
Da ta so u r ce : C lim a te d a ta - C S IR O - O zC li m ( D a ta S ca le : 1 :2 5 0 ,0 00 ) ; S o il s a n d DE M d a ta - D N RE , 20 0 1 /2 0 0 2 (D a ta S ca le : 1 :2 5 ,0 0 0 ).
B as e d a ta s o u rc e: C o r po r a te G e o sp a tia l Da ta L ib r a ry, D N RE , 20 0 1 ( Da ta S c al e : 1 :25 ,0 0 0 ) ; A u sli g G e o d ata T o p o- 2 5 0 K .
N
10
0
10
20
30
40
50
M ap S c ale: 1:1 ,1 00,0 00
60
70
80 Kilom eters
Legend
Gipps land C MA and LGA
boundary
Public Land
9 (High)
State Border
10 (High)
Principal Road
No Data
Lake
River
P re p a re d fo r : O p tio n s fo r A g r icu l tu re i n a "N e w C li m ate "
E di tio n 3 , Ju n e 2 0 0 2, S RP
P ro je c t V 1 2 CC a ; M ap N u m b e r M 2 4 CC b
Mo d e l N o . A 1 F1 2 0 5 0 la n d
A MG Zo n e 5 5 (T ra n sv e rs e Me r ca to r ) P r o je cti o n
Atmospheric Research
Tasmanian Blue Gum
Land Suitability
Climate Change Scenario A1F1 (2050)
Victoria
Gipps land R egion
Suitability Index
Restricted
0 (Very low)
1 (Very low)
2 (Low)
3 (Low)
4 (Low)
5 (Moderate)
6 (Moderate)
7 (Moderate)
8 (High)
This map is su itable for strateg ic planning
purp oses, rath er than sp ecific site investigatio n.
Furth er d etailed site analysis sh ou ld be carried o ut
prior to site-specific develop ment pro ceedin g.
Copyr ig ht © Depa r tm ent of N atural Res our ces and Env ir onm ent ( DN R E), 2002.
Map pr epar ed by the Str ateg ic R esour ces P lannin g Uni t, Agri cultur e Vic tor ia, D ep artm ent of N atur al R e sourc es a nd Envi ron m ent.
This data c an not b e guaranteed to be w ithout flaw of any ki nd, and the refor e AVS dis clai m s all liabi lity of er r or or inappr opri ate us e of the map d ata.
Data sou r ce: C lim a te data - C SIR O- OzC li m ( D ata Scale: 1:2 50,000) ; S oil s and DE M data - D N RE , 200 1/2002 (D ata Scale: 1:25,000).
Bas e da ta s ourc e: C or por ate Geospatia l Data Libr ary, D N RE , 2001 ( Da ta Sc al e: 1 :25,000) ; Ausli g Geo data T opo- 250K.
N
10
0
10
20
30
40
50
M ap S c ale: 1:1 ,1 00,0 00
60
70
80 Kilom eters
Legend
Gipps land C MA and LGA
boundary
Public Land
9 (High)
State Border
10 (High)
Principal Road
No Data
Lake
River
Prepa red for : Op tions for A gr icul ture i n a "N ew C li m ate"
Edi tio n 3, June 2 002, S RP
Projec t V12CC a ; M ap N um ber M 48CC b
Mode l N o. a1f1 2050 l and
AMG Zone 55 (T ransv ers e Mer cator ) Pr ojecti on
More…
•
•
•
•
•
8 GCM datasets, 2 regional models
6 climatic variables
Export options
Regions covered and higher resolution
Links to impact models
Atmospheric Research
Methodological Approach to Land Suitability Analysis
ECOSYSTEM COMPONENTS (data layers)
• Climate
• Soil
• Landscape
COMBINED MCE (AHP) - GIS APPROACH
•Issues Definition
1
•Hierarchy/decision tree
•Weighting Critical Factors
•Intensity ratings
CRITICAL PLANT GROWTH FACTORS
3
•Integration with GIS
•Analysis of critical factors for agriculture
•Grouping of critical factors to create groups of
agricultural commodities -vegetables, trees
)o
2
MAPS OF CURRENT LAND USE
INCORPORATING POLICIES AND
CONTROLS
7
BIOPHYSICAL LAND SUITABILITY
• Identification of homogeneous land units
EXCLUSION CONSIDERATIONS
•Ecological risk
• Ranking of units for a particular land use
•Significant landscapes
4
BIOPHSYICAL MAPPING
• Maps of environmental hazards or risks
•Current land use/incompatible use
8
5
ECONOMIC
SCENARIOS/OUTLOOKS
MAPS OF NON-EXCLUDED LAND FOR TYPES OF
COMMODITIES/CROPS
6
MAPS OF LAND USE OPTIONS
•Market trade potential for
crops/commodities
9
10
Atmospheric Research


© Copyright 2026