
COVER SHEET
COVER SHEET
I
N
T
E
I
N
C
.
G R
A
T
E
D
M
I
C
R O
-
E
L
E
C
T
R O N
L
A G U
9
4
4
1
I
C
S
,
9
(Company's Full Name)
N O R
T
H
S
C
I
E
N
T
H
N O
P
A R
K
,
E
C
C
E
B
I
A
V
E
.
N
A N
,
,
L
A G U
N
N
A
A
(Business Address: No. Street City / Town / Province)
1
ATTY. SOLOMON M. HERMOSURA
841-5346
Contact Person
Company Telephone Number
2
3
1
SEC FORM 17-A
Month
Day
Fiscal Year
0
4
1
Month
Day
Annual Meeting
FORM TYPE
Secondary License Type, if Applicable
C
F
D
Amended Articles Number/Section
Dept. Requiring this Doc.
Total Amount of Borrowings
Domestic
Total No. Of Stockholders
To be accomplished by SEC Personnel concerned
File Number
LCU
Document I.D.
Cashier
STAMPS
Remarks = pls. Use black ink for scanning purposes
3
Foreign
SEC Number:
File Number:
94419
INTEGRATED MICRO-ELECTRONICS, INC.
______________________________________________________
(Company’s Full Name)
33/F Tower One, Ayala Triangle, Ayala Avenue, Makati City
______________________________________________________
(Company Address)
(632) 756-6840
______________________________________________________
(Telephone Number)
December 31, 2011
______________________________________________________
(Fiscal Year Ending)
(Month & Day)
SEC Form 17-A
______________________________________________________
(Form Type)
SECURITIES AND EXCHANGE COMMISSION
SEC FORM 17-A
ANNUAL REPORT PURSUANT TO SECTION 17 OF THE SECURITIES REGULATION CODE AND
SECTION 141 OF THE CORPORATION CODE OF THE PHILIPPINES
1. For the fiscal year ended: December 31, 2011
2. SEC Identification Number: 94419
3. BIR Tax Identification No. 000-409-747-000
4. Exact name of issuer as specified in its charter: INTEGRATED MICRO-ELECTRONICS, INC.
5. Province, Country or other jurisdiction of incorporation or organization: Philippines
6. Industry Classification Code: __________ (SEC Use Only)
7. Address of principal office: 33rd Floor, Tower One, Ayala Triangle, Ayala Avenue, Makati City
Postal Code: 1226
8. Registrant's telephone number: (632) 756-6840
9. Former name, former address, and former fiscal year: Not applicable
10. Securities registered pursuant to Sections 8 and 12 of the SRC, or Sec. 4 and 8 of the RSA
Title of Each Class
Common *
Number of Shares Issued and Outstanding
1,434,078,088
* Net of 15,892,109 treasury shares
11. Are any or all of these securities listed on a Stock Exchange? Yes [ x ] No [ ]
1,350,476,697 common shares are listed with the Philippine Stock Exchange as of March 31, 2012.
12. Check whether the registrant:
(a) has filed all reports required to be filed by Section 17 of the SRC and SRC Rule 17.1 thereunder or
Section 11 of the RSA and RSA Rule 11(a)-1 thereunder, and Sections 26 and 141 of The
Corporation Code of the Philippines during the preceding twelve (12) months (or for such shorter
period that the registrant was required to file such reports): Yes [x] No [ ]
(b) has been subject to such filing requirements for the past ninety (90) days: Yes [ x ] No [ ]
13. State the aggregate market value of the voting stock held by non-affiliates of the registrant. The
aggregate market value shall be computed by reference to the price at which the stock was sold, or
the average bid and asked prices of such stock, as of a specified date within sixty (60) days prior to
the date of filing. If a determination as to whether a particular person or entity is an affiliate cannot be
1
made without involving unreasonable effort and expense, the aggregate market value of the common
stock held by non-affiliates may be calculated on the basis of assumptions reasonable under the
circumstances, provided the assumptions are set forth in this Form. (See definition of "affiliate" in
“Annex B”). The aggregate market value of the voting stock held by non-affiliates of the
Company is about P2.6 billion (based on closing stock price of IMI common shares as of
December 31, 2011 and issue value of IMI preferred shares.
Please see discussion below and in succeeding pages on the following:
PART I – BUSINESS AND GENERAL INFORMATION
PART II – OPERATIONAL AND FINANCIAL INFORMATION
PART III – CONTROL AND COMPENSATION INFORMATION
PART IV – CORPORATE GOVERNANCE
PART V – EXHIBITS AND SCHEDULES
Unless otherwise expressly indicated, the information provided herein is as of December 31, 2010.
PART I - BUSINESS AND GENERAL INFORMATION
Item 1. Business
Integrated Micro-Electronics, Inc. (IMI), a stock corporation organized and registered under the laws of the
Republic of the Philippines on August 8, 1980, has four subsidiaries, namely: IMI International (Singapore)
Pte. Ltd. (“IMI Singapore”), IMI USA, Inc. (“IMI USA”), IMI Japan, Inc. (“IMI Japan”) and PSi Technologies
Inc. (PSi) (collectively referred to as the “Group”). IMI Singapore, IMI USA and IMI Japan are wholly
owned subsidiaries while PSi is 55.78% owned.
On January 21, 2010, the IMI was listed by way of introduction in the PSE.
IMI is registered with the Philippine Economic Zone Authority (PEZA) as an exporter of printed circuit
board assembly (PCBA), flip chip assembly, box build sub-assembly, enclosure system, and provider of
electronics product design, research and development, product development outsourcing and other
electronic parts, among others. IMI is also engaged in the business of providing test development and
systems integration services and distributing related products and equipment and related services. These
PEZA registrations entitle the IMI to a four-year income tax holiday (ITH) and an option to apply for ITH
extension for a maximum of three (3) years subject to various PEZA requirements. IMI’s entitlements to
ITH under the current PEZA registrations had expirations beginning January 2010.
IMI Singapore was incorporated and is domiciled in Singapore. It is engaged in the procurement of raw
materials, supplies and provision of customer services. Its wholly-owned subsidiary, Speedy-Tech
Electronics Ltd. (STEL), was incorporated and is domiciled also in Singapore. STEL on its own has
subsidiaries located in Hong Kong, People’s Republic of China (PRC), Singapore and the Philippines.
STEL and its subsidiaries are principally engaged in the provision of Electronic Manufacturing Services
(EMS) and Power Electronics solutions to original equipment manufacturing customers in the consumer
electronics, computer peripherals/information technology, industrial equipment, telecommunications and
medical device sectors.
IMI Singapore established its Philippine Regional Operating Headquarters (also known as IMI International
ROHQ or IMI ROHQ) in 2009. It serves as a supervisory, communications and coordinating center for the
affiliates and subsidiaries of IMI Singapore.
In 2011, IMI infused additional capital to IMI Singapore in exchange for newly issued shares of the latter.
This was used by IMI Singapore to set up Monarch Elite Ltd. and Cooperatief IMI Europe U.A. as holding
companies and facilitate the acquisition of EPIQ Electronic Assembly EOOD (EPIQ EA), EPIQ CZ s.r.o
(EPIQ CZ), and EPIQ MX, S.A.P.I de C.V. (EPIQ MX) (collectively the EPIQ subsidiaries) from EPIQ NV.
2
The EPIQ subsidiaries design and produce printed circuits and spray casting of plastics, and supply
assembled and tested systems and sub-systems which include drive and control elements for automotive
equipment, household appliances, industrial market and other applications with plastic parts and electronic
components. The EPIQ subsidiaries also provide engineering, research and development, and logistics
management services.
IMI USA was incorporated and is domiciled in California, USA. It is at the forefront of technology with
regard to precision assembly capabilities including surface mount technology (SMT), chip on flex (COF),
chip on board (COB) and flip chip on flex. It specializes in prototyping low to medium PCBA and subassembly. It is also engaged in engineering, design for manufacturing (DFM) technology, advanced
manufacturing process development, new product innovations (NPI), direct chip attach and small
precision assemblies.
IMI Japan was registered and is domiciled in Japan. IMI Japan’s primary purpose is to transact business
with Japanese customers in the following areas: (a) turnkey EMS; (b) engineering and design services;
and (c) original design manufacturing (ODM) solutions. IMI Japan also functions as program
management center for new business in coordination with the Parent Company (wireless), STEL and
Subsidiaries (power management) and IMI USA (film chip). IMI Japan will secure programs/projects from
Japanese customers and then endorse these to the Parent Company or IMI Singapore. There is no
manufacturing operation in IMI Japan.
PSi is a power semiconductor assembly and test services (SATS) company serving niche markets in the
global power semiconductor market. It provides comprehensive package design, assembly and test
services for power semiconductors used in various electronic devices. PSi wholly owns PSi Technologies
Laguna, Inc. (PSi Laguna), which also provides SATS. In addition, PSi owns 40% of PSiTech Realty, Inc.,
the holding company of Pacsem Realty, which is a real estate company that acquires, holds, develops and
disposes any real estate or interest acquired. Pacsem Realty is 40% and 60% directly owned by PSi and
PSiTech Realty Inc., respectively.
Operations
Design and Engineering Services
Partnering with IMI allows a complete and successful product development. This is made possible by IMI’s
capability to design and develop complete products and subsystems, analyze product design and
materials for costs reduction through value and profit engineering, and develop solutions for cost-effective
production and fast time-to-market while safeguarding intellectual property. IMI’s product development and
engineering service offerings include Custom Design Manufacturing (CDM) Solutions, Advanced
Manufacturing Technology (AMT) Services, Engineering and Test Development, and Reliability/Failure
Analysis and Calibration Quality Test solutions.
Manufacturing Solutions
IMI’s comprehensive manufacturing experience allows a prospective client to leverage its strength in
RoHS-compliant and cleanroom manufacturing process, complex manufacturing using consigned
equipment and materials, complete turnkey manufacturing with multiple materials sourcing sites, ERPbased planning, purchasing, and manufacturing process, and strategic partnerships with leading materials
distributors and manufacturers. IMI has the essential infrastructure equipment, manpower and quality
systems to assure quick start of operations and turnaround time. These include: materials management,
PCBA and FCPA Assembly, Automated Through-Hole Assembly, Complete Box build Solutions, Sub
Assembly services, Component Assembly and Manufacture of Enclosure Systems.
Business Models
3
IMI recognizes the uniqueness of each customer’s requirements. To satisfy specific requests, IMI offers
flexible business models that allow it to build the perfect assembly for its client’s manufacturing
requirements.
The “Standard” and “Semi-custom” business models pertain to IMI’s Printed Circuit Board Assembly
(PCBA) processes. IMI invests in Surface Mount Technology (SMT) lines which support multiple customer
requirements. Back-end and box build processes are also set-up depending on customer requirements.
The “Custom” Business Model gives the client a free hand in designing the systems by offering a
dedicated facility manned by an independent and exclusive organization that will build the system from
ground up. With quality structures and operational procedures compatible with the client’s systems, IMI’s
line serves as the client’s extension plant, assuring that all the parts and processes are customized to the
client’s particular needs.
Capabilities and Solutions
IMI’s capabilities allow it to take on the specific outsourcing needs of its customers, providing them with
flexible solutions that encompass design, manufacturing, and order fulfilment. It develops platforms to
customize solutions in response to its customers’ unique requirements. Its platforms in areas like shortrange wireless systems, embedded systems, and sensors and imaging technology represent capabilities
to manufacture products. New manufacturing capabilities are developed by IMI’s Advanced Manufacturing
Engineering (AME) group. Its expertise includes immersion silver process, pre-flow underfill process,
thermally enhanced flip chip technology, traceless flip chip technology, and flip chip on flex assembly,
among others. IMI has a complete range of manufacturing solutions-- from printed circuit board assembly
to complete box build. Through its flexible, efficient, and cost–effective end-to-end EMS solutions, IMI
gives OEMs the luxury of focusing on their core competencies of technology R&D and brand marketing.
Subsidiary in Power Semiconductor Assembly and Test
IMI through its subsidiary PSi Technologies Inc provides outsourced power semiconductor assembly and
test services for legacy packages, power QFNs, and power modules.
Global Materials and Supply Chain Management
IMI’s mission is to offer strategic and competitive Supply Chain Management for complete order fulfillment
of its Customers. IMI’s turnkey capabilities involve major commodities for direct/indirect materials:
passive/active/mechanical/electro-mechanical components, existing vendor base for over 36,000 line
items, and Global sourcing in Asia, US and Europe of over 200 major and strategic suppliers from over
2,000 suppliers listed in our database. IMI is not or is not expected to be dependent upon one supplier for
raw materials or other items.
IMI’s warehousing capabilities include housing all direct and indirect materials, outsourcing to a third party
TM
logistics provider, satellite warehouses in other IMI plants and under the mySAP ERP System.
IMI also has Vendor Partnership Programs to leverage for the most competitive cost and engaged the
supply base on vendor qualification, certification and development. With regard to inbound and outbound
logistics, IMI are partners with the best in the industry. The major lines inbound are Singapore, Japan,
Hong Kong, Taiwan, Malaysia, Thailand, Germany and the US. Major lines outbound are US, Germany,
Malaysia, Hong Kong, Israel, Switzerland, Vietnam, UK, Japan, Singapore and France.
Product Capabilities
IMI has experience in working with some of the world’s leading companies in the following products:
4
Automotive Electronics
•
•
•
•
•
•
•
•
•
•
Automotive Camera
PCBA for Electronic Stability Program (ESP)
Tire Pressure Sensor PCBA
Car Windshield Temperature and Humidity Sensor
Electronic Power Steering (EPS) Rotor Position Sensor
(RPS)
PCBA for Headlight
Switch Controller for Main Light
Communication Power PCBA
Body Control Module (BCM)
Antenna Receiver / DAB Tuner
Industrial Electronics
•
•
•
•
•
•
•
•
•
•
•
•
•
•
•
Automatic Meter Reader (AMR)
Security Device
Electronic Door Access System
Smart Card
Point of Sales System
Printer Control Board
Power Amplifier
DC-DC Power Converter
Engine Controllers
Welding Machine Inverter
Motor Drivers for Conveyor
Fan Motor Control Board
Computer Numerical Control (CNC) Control Board
Main power supplies for LED street lighting
Modules for renewable energy generation, transmission
and conversion
Medical Electronics
•
•
•
•
•
•
•
•
Imaging Equipment Flat Panel FPCA
PCBA for Auto Body Contouring Imaging Equipment
Dental Imaging System
Defibrillator Component
Concealed Hearing Aid
Biomedical and Laboratory Equipment
Centrifuge Control Board
Fitness Equipment Control Board
Telecommunications
•
•
•
•
•
•
•
•
•
Back Panel for Telecommunication Board
Fiber to the “X” (FFTx) systems
Booster Amplifier
GPON (Gigabit Passive Optical Network) Systems
Wireless Security System
Base Station Power Supply
Digital Station Control Board
Power Transistors for amplifiers in cellular base stations
Power Conversion ICs in adapters and chargers for cell
Phones and cordless phones
DC Port and USB Port protection for cell phones and
satellite radio peripherals
•
5
Computing and Storage
Devices
•
•
•
•
•
•
•
•
•
•
•
Consumer Electronics
•
•
•
•
•
•
•
•
•
•
•
•
•
•
•
•
•
•
Power Semiconductor
CD/Combo Drive
DVD Drive
Blu-Ray Disc Drive
Hard Disk Drive
Solid State Drives
Printer Sensor
Printer Control Board
Multi-Function Copier Machine
DVD Recorder Power Supply
Power Supplies for Servers, PCs, Notebooks, and
Netbooks
Over-voltage protection for HDD and DC port protection
for keyboard mouse
Ultrasonic Toothbrush
Hybrid IC
Gas Ignitor and Re-Ignitor
Air-Conditioning (HVAC) Controller
Power Management and Home Appliance for Lighting
Control
Refrigerator and Cooker Hood Control Board
Projector Lamp Drivers
Household Metering Device
Bluetooth Headset
Electric Drive Control for home appliances
Main Power Supply for Flat-panel TV
Power Supply for game consoles and entertainment
electronics
High Voltage Power Conversion ICs in adapters and
chargers for personal electronics
Garage Door Control
Programmable Timer
Pressure Cooker Modules
Steamer Controller Modules
Washing Machine controllers
Coffee Machine
•
Low-Medium Power Packages:
- TO 220 Fpak 2/3L; TO 220 2/3/5/7L, SOT 82
- PowerFlex 2/3/5/7L, TO252 / TO251, TO 263 3L;
- 3 x 3 mm QFN, 3.3 x 3.3mm QFN ; 5x6mm QFN
•
Medium-High Power Packages:
- SOT 93 3L, TO 247 3L, TO 264 3/5L, SOT 227
- Standard Packages - SP3, SP4, SP6
- DRF, ARF
•
Small Signal Packages - SOT 223 3L, TO 220 2/3/5/7L
6
Renewable Energy
•
•
•
•
•
•
PV Panel Assembly
PV Co-Design & Development
PV Panel High Volume Manufacturing
PV Panel Platform
PV Inverter Platform
Inverter Electronics
With regard to emerging product capabilities, IMI is pursuing OEMs in the Photovoltaic (PV) or Solar
Energy and Sensor and Imaging fields.
Human Resources
The Company has a total workforce of 15,375 employees as of December 31, 2011, shown in the
following table:
Job Groups
Total
Managers
Supervisors
Rank-and-File
Technicians
Operators
TOTAL
384
1,413
1,826
807
10,945
15,375
Philippines
163
539
972
334
5,367
7,375
China/
Singapore
161
636
596
414
4,336
6,143
USA
Japan
Europe
6
5
4
3
18
3
1
4
51
233
253
59
1,239
1,835
The relationship between management and employees has always been of solidarity and collaboration
from the beginning of its operations up to the present. The rank and file employees and the supervisory
employees of the Company are not unionized. Hence, there is no existing Collective Bargaining
Agreement (CBA) between the Company and its employees.
At present, the Company does not intend or anticipate hiring any number of employees within the ensuing
twelve (12) months because the current workforce can still cope up with the volume of expected customer
orders within that period.
IMI has existing supplemental benefits for its employees such as transportation and meal subsidy, Group
Hospitalization insurance coverage and non-contributory retirement plan.
The Company has or will have no supplemental benefits or incentive arrangements with its employees
other than those mentioned above.
Strategic Partnerships
An active strategic partnership is that with Renewable Energy Test Center, a California-based engineering
services, test and certification provider for photovoltaic (PV) and renewable energy products. This
partnership was forged in 2009. With IMI Energy Solutions, the partnership aims to offer PV services
including PV panel development, panel prototyping, certification, and mass production. IMI Energy
Solutions focuses on solar panel development and prototyping, while RETC handles product testing and
7
certification. RETC is right next door to IMI Energy Solutions to ensure fast turnaround time from
prototyping to product certification.
Competition
IMI is an electronics manufacturing services (EMS) provider to original equipment manufacturers (OEMs)
in the computing, communications, consumer, automotive, industrial, and medical electronics segments
as well as emerging industries like renewable energy. In 2011, the global economy managed an Asian-led
growth at 3.8 percent despite struggling from the ravages of natural calamities in Japan and Thailand. A
continuing European crisis may lead to a recession in 2012 and may exacerbate difficulties in the US
economy as well as the rest of the world.
The growth of electronics end-markets are mostly in the area of consumer electronics -- primarily tablets
and smartphones. Non-traditional markets continue to have average growth banking on increasing
applications in new technologies that hinge on automation, portability, size and space reduction, higher
power and clean technology. The EMS industry grew by only 3.9 percent in 2011, quite far from the
double-digit growth rates it used to enjoy in previous years. The industry is expected to increase in 2012
but may experience more challenges as market uncertainties continue to cloud visibility into the near
future.
IMI competes worldwide, with focus on Asia (including Japan and China), North America, and Europe.
There are two methods of competition: a) price competitiveness, b) robustness of total solution (service,
price, quality, special capabilities or technology). IMI competes with EMS companies and original design
manufacturers (ODMs) all over the world. Some of its fierce EMS provider competitors include Hon Hai,
Flextronics, and Hana.
Hon Hai is a Taiwanese company with annual revenues of US$92 billion, best known as the vertically
integrated outsourcing partner of Apple for tablets and smartphones. Hon Hai is a competitor of IMI in the
computing and telecommunication infrastructure markets. Flextronics is a Singapore-headquartered
company with annual revenues of US$30 billion; its cost structure is very competitive it is vertically
integrated as well. Flextronics poses competition to IMI in the automotive space. Hana is a Thai company
with annual revenues of US$500 million; it has a semiconductor manufacturing arm. Hana competes with
IMI in industrial market.
IMI is focused on delivering customized solutions of highest quality at reasonable prices. It collaborates
with the customers in finding the right solutions to their problems. IMI even challenges its own systems
and processes if needed. It has a distinct advantage in serving customers who value quality over price and
require complex non-standard solutions. Living up to the flexible expertise brand, IMI is adaptable to the
needs and conditions of its customers. This expertise has propelled IMI onto the current list of the top 30
EMS providers in the world and earned for IMI several accolades from its customers.
Risk Factors
The Company’s business, financial condition and results of operation could be materially and adversely
affected by risks relating to the Company and the Philippines.
IMI’s operating results may significantly fluctuate from period to period
There is a risk that IMI’s operating results may fluctuate significantly. Some of the principal factors
affecting its operating results include:
(1)
(2)
changes in demand for its products and services;
customers’ sales outlook, purchasing patterns, and inventory adjustments;
8
(3)
the mix of the types of services provided to its customers such as: volume of products,
complexity of services, and product maturity;
(4) the extent to which it can provide vertically integrated services for a product;
(5) its effectiveness in managing its manufacturing processes, controlling costs, and integrating
any potential future acquisitions;
(6) its ability to make optimal use of its available manufacturing capacity;
(7) changes in the cost and availability of labor, raw materials and components, which affect its
margins and its ability to meet delivery schedules;
(8) its ability to manage the timing of its component purchases so that components are
available when needed for production while avoiding the risks of accumulating inventory in
excess of immediate production needs;
(9) timing of new technology development and the qualification of its technology by its
customers; and
(10) local conditions and events that may affect its production volumes, such as labor
conditions, political instability, and local holidays.
Due to the factors enumerated above and other risks discussed in this Section, many of which are beyond
the Company’s control, its operating results may vary from time to time.
Furthermore, IMI may not be able to effectively sustain its growth due to restraining factors concerning
corporate competencies, competition, global economies, and market and customer requirements. To
meet the needs of its customers, IMI has expanded its operations in recent years and, in conjunction with
the execution of its strategic plans, the Company expects to continue expanding in terms of geographical
reach, customers served, products, and services. To manage its growth, IMI must continue to enhance its
managerial, technical, operational, and other resources.
IMI’s ongoing operations and future growth may also require funding either through internal or external
sources. There can also be no assurance that any future expansion plans will not adversely affect IMI’s
existing operations since execution of said plans often involves challenges. For instance, IMI may be
required to manage relationships with new or a greater number of suppliers, customers, equipment
vendors, and other third parties. IMI may further be confronted with such issues as shortages of
production equipment and raw materials or components, capacity constraints, construction delays,
difficulties in ramping up production at new facilities or upgrading or expanding existing facilities, and
training an increasing number of personnel to manage and operate those facilities. Compounding these
issues are other restraining factors such as competitors’ more aggressive efforts in expanding business
and volatility in global economies and market and customer requirements. All these challenges could
make it difficult for IMI to implement any expansion plans successfully and in a timely manner.
In response to a very dynamic operating environment and intense industry competition, IMI focuses on
high-growth/high-margin specialized product niches, diversifies its markets and products, engages in
higher value add services, improves its cost structure, and pursues strategies to grow existing accounts.
Moreover, IMI has established a structure that promotes a transparent corporate governance system. It
has an Audit Committee that reviews quarterly and audited annual results of operations. It also has a
Finance Committee that reviews and approves significant financial policies and performs oversight
function over the risk management process of the organization. The Company’s financial statements are
certified by a reputable accounting firm.
IMI is highly dependent on an industry that is characterized by rapid technological changes
The demand for the Company’s solutions is derived from the demand of end customers for electronic
products. IMI’s solutions have end-use applications in the computing, communications, consumer
automotive, industrial and medical electronics industries.
9
These industries have historically been characterized by rapid technological change, evolving industry
standards, and changing customer needs. There can be no assurance that IMI will be successful in
responding to these industry demands. New services or technologies may render IMI’s existing services or
technologies less competitive. If IMI does not promptly make measures to respond to technological
developments and industry standard changes, the eventual integration of new technology or industry
standards or the eventual upgrading of its facilities and production capabilities may require substantial
time, effort, and capital investment.
IMI is keeping abreast of current trends and technology in the electronics industry and is continuously
conducting studies to enhance its capabilities and value proposition to its customers. It defines and
executes technology road maps that are aligned with market and customer requirements.
IMI may not be able to mitigate the effects of price declines over the life cycles of its products or as a
result of changes in its mix of new and mature products, mix of turnkey and consignment business
arrangements, and lower competitors’ prices
The price of IMI’s products tends to decline over the product life cycle, reflecting obsolescence, decreased
costs of input components, decreased demand, and increased competition as more manufacturers are
able to produce similar products in large numbers as such products become standardized. Furthermore,
the gross margin for manufacturing services is highest when a product is first developed. As products
mature, market pressures push average selling prices down and cause gross margin erosion. IMI may be
forced to reduce the price of its service for more mature products in order to remain competitive against
other manufacturing services providers. IMI’s gross margin may further decline if competitors lower their
prices as a result of decreased costs or to absorb excess capacity, liquidate excess inventories, or
restructure or attempt to gain market share.
IMI is also moving to a higher proportion of its products on turnkey production (with IMI providing labor,
materials and overhead support), as compared to those under the consignment model. The margins on
these turnkey businesses are generally lower than those done on consignment basis.
To mitigate the effects of price declines in IMI’s existing products and to sustain margins, IMI continues to
improve its production efficiency by reducing its input component costs, reducing inventory costs, and
lowering operating costs. IMI must continually drive its costs down. More importantly, IMI is intensifying its
effort in capturing customers with products in high-margin product niches most of which involve emerging
technologies or complex manufacturing processes.
IMI generally does not obtain firm volume purchase commitments from its customers
IMI generally does not obtain firm volume purchase commitments from its customers. Customers may
place lower-than-expected orders, cancel existing or future orders or change production quantities.
Although IMI’s customers may be contractually obligated to purchase products, IMI may be unable to or,
for other business reasons, choose not to enforce its contractual rights. Cancellations, reductions, or
instructions to delay production by a significant customer could also harm IMI’s operating results.
In addition, IMI makes significant decisions, including determining the levels of business that it will seek
and accept, production schedules, component procurement commitments, personnel needs, and other
resource requirements. These key decisions are ultimately based on estimates of customer requirements.
The rapid changes in demand for its products reduce its ability to estimate accurately future customer
requirements. Thus in facing these rapid changes in demand, production scheduling difficulty and the
limited ability to maximize manufacturing capacity utilization are encountered.
To the extent possible, IMI negotiates for guaranteed volume and/or volume break pricing, and materials
buy-back to taper the impact of sudden cancellations, reductions, delays in customer requirements.
IMI’s success depends on attracting, engaging and retaining key talents, including skilled research and
development engineers
10
IMI believes that its people are its most valuable asset and an engaged workforce is an essential element
to the continued success of its organization. IMI is committed to build a workforce with purpose,
excitement, and mutual alignment in order to retain its highly-skilled workers, support and technical staff
and management team. It is an organization that keeps abreast of latest trends and developments to fulfill
customer needs to remain in business.
IMI believes that in order to meet customer requirements it has to have highly-skilled workforce
possessing the critical skills, competence and attributes to satisfactory perform and exceed the
requirements of the job. To remain one of the top electronics manufacturing solutions providers, IMI must
have dedicated and passionate workforce with global skills and ethical standards committed to its vision,
mission and values. IMI continuously identifies top-caliber candidates and keep the pipeline full always
ready to assume new roles and fuel growth.
The unending war for talent has always been a challenge in the industry. IMI believes that employee
attrition has an unfavorable impact to the organization. It can interrupt operation processes that could
affect the quality of its products and services that may put the business at risk.
The Company recognizes that its competitiveness is dependent on its key talent pipeline, including
leadership, talent and skill pool, and succession plan. Thus, it has implemented proactive measures to
retain employees through sound retention programs, encouraging work-life balance among its employees,
and providing structured career development paths to promote career growth within the organization and
loyalty to the Company. The Company also believes that in order to sustain IMI’s growth, it will have to
continuously attract, develop, engage and retain skilled workforce highly capable to achieve business
goals.
IMI may encounter difficulties with acquisitions it may make in the future
IMI’s globalization strategy has transformed IMI from a Philippines-centric company into a global network
with manufacturing and engineering facilities in the Philippines, China, Singapore, Bulgaria, Czech
Republic, Mexico and the United States; and sales offices in Asia, Europe and North America.
IMI’s further growth may depend in part on future acquisitions, which may expose IMI to potential
difficulties that include:
(1)
Diversion of management’s attention from the normal operations of IMI’s business;
(2)
Potential loss of key employees and customers of the acquired companies;
(3)
Difficulties in managing and integrating operations in geographically dispersed
locations;
(4)
Lack of experience operating in the geographic market of the acquired business;
(5)
Reduction in cash balance and increases in expenses and working capital
requirements, which may reduce return on invested capital;
(6)
Potential increases in debt, which may increase operating costs as a result of
higher interest payments;
(7)
Difficulties in integrating acquired businesses into existing operations, which may
prevent it from achieving, or may reduce the anticipated synergy.
Mergers and acquisitions (M&As) may have an immediate financial impact to IMI due to:
(1)
Dilution of the percentage of ownership of current stockholders;
11
(2)
Periodic impairment of goodwill and other intangible assets; and,
(3)
Liabilities, litigations, and/or unanticipated contingent liabilities assumed from the acquired
companies.
If IMI is not able to successfully manage these potential difficulties, any such acquisitions may not result in
any material revenues or other anticipated benefits.
To limit its exposure to these potential difficulties, IMI performs a thorough assessment of the upside and
downside of any M&As. IMI creates a team from Business Development, Business Units, Finance, Legal,
Engineering, and Advisers who examines the vision, long-term strategy, compatibility with IMI’s culture,
customer relationship, technology, and financial stability of the Company to be acquired. All M&As have to
be reviewed by the Executive Committee, Finance Committee, and approved by the Board.
IMI’s production capacity may not correspond precisely to its production demand
IMI’s customers may require it to have a certain percentage of excess capacity that would allow it to meet
unexpected increases in purchase orders. On occasion, however, customers may require rapid increases
in production beyond IMI’s production capacity, and IMI may not have sufficient capacity at any given time
to meet sharp increases in these requirements. To soften the impact of this, IMI closely coordinates with
customers which provides them regular capacity reports and action plan/s for common reference and
future capacity utilizations.
IMI may be subject to reputation and financial risks due to product quality and liability issues, respectively;
and may be involved in intellectual property disputes
The contracts the Company entered into with its customers, especially customers from the automotive and
medical industry, typically include warranties that its products will be free from defects and will perform in
accordance with agreed specifications. To the extent that products delivered by IMI to its customers do
not, or are not deemed to, satisfy such warranties, IMI could be responsible for repairing or replacing any
defective products, or, in certain circumstances, for the cost of effecting a recall of all products which
might contain a similar defect, as well as for consequential damages.
There can be no assurance that IMI will be able to recover any losses incurred as a result of product
liability in the future from any third party, or that defects in the products sold by IMI, regardless of whether
or not it is responsible for such defects, would not adversely affect its customer relations, standing and
reputation in the marketplace, result in monetary losses, and have a material adverse effect on its
business, financial condition, and results of operations.
Furthermore, IMI’s business depends in part on its ability to provide customers with technologically
sophisticated products. IMI’s failure to protect its intellectual property or the intellectual property of its
customers could hurt customer relationships and affect its ability to obtain future business. There is also a
risk that IMI may infringe on the intellectual property rights of others. IMI could incur costs in either
defending or settling any intellectual property disputes alleging infringement. In addition, customers
typically require that IMI indemnify them against claims of intellectual property infringement. If any claims
are brought against IMI’s customers for such infringement, whether these have merit or not, IMI could be
required to expend significant resources in defending such claims. In the event IMI is subjected to any
infringement claims, IMI may be required to spend a significant amount of money to develop non-infringing
alternatives or obtain licenses. IMI may not be successful in developing such alternatives or in obtaining
such licenses on reasonable terms or at all, which could disrupt manufacturing processes, damage IMI’s
reputation, and affect its profitability.
12
IMI is not positioned as an original design manufacturer (ODM) so the risk of infringing upon productrelated intellectual property is significantly reduced. IMI’s designs and intellectual properties are used to
attract customers but ultimately, the designs that IMI produces will be owned by the customer. When IMI
helps its customers design their products, IMI exercises proper caution in ensuring that no intellectual
property infringements are committed. It is highly unlikely IMI will enter into any such disputes.
IMI provides appropriate controls to ensure that quality is maintained and continuously improved; and
would not result to losses for the customers and the Company. In addition, IMI and some of its customers
maintain projects that are covered by product recall insurance.
Among others, IMI is certified on ISO 9001:2000 quality management systems and TS 16949:2002, a
quality management system for automotive products. It also received several recognitions from its
customers for its commitment to quality.
Possible failure to comply with environmental regulations could harm IMI’s business
IMI is subject to various national and local environmental laws and regulations in the areas where it
operates, including those governing the use, storage, discharge, and disposal of hazardous substances in
the ordinary course of its manufacturing processes. If more stringent compliance or cleanup standards
under environmental laws or regulations are imposed, or the results of future testing and analyses at IMI’s
manufacturing plants indicate that it is responsible for the release of hazardous substances, IMI may be
exposed to liability. Further, additional environmental matters may arise in the future at sites where no
problem is currently known or at sites that IMI may acquire in the future.
IMI closely coordinates with various government agencies and customers to comply with existing
regulations and continuously looks for ways to improve its environmental and safety standards.
IMI operates in a highly competitive industry
Some of IMI’s competitors in the industry may have greater design, engineering, manufacturing, financial,
or other resources than IMI. Customers evaluate EMS and ODMs based on, among other things, global
manufacturing capabilities, speed, quality, engineering services, flexibility, and costs. In outsourcing,
OEMs seek, among other things, to reduce cost. In addition, major OEMs typically outsource the same
type of products to at least two or three outsourcing partners in order to diversify their supply risks. The
competitive nature of the industry has resulted in substantial price competition. IMI faces increasing
challenges from competitors who are able to put in place a competitive cost structure by consolidating with
or acquiring other competitors, relocating to lower cost areas, strengthening supply chain partnerships, or
enhancing solutions through vertical integration, among others. IMI may lose its customers to its
competitors if it fails to keep its total costs at competitive levels for comparable products.
IMI may also lose customers if it fails to develop and provide the technology and skills required by its
customers at a rate comparable to its competitors. There can be no assurance that IMI will be able to
competitively develop the higher value add solutions necessary to retain business or attract new
customers. There can also be no assurance that IMI will be able to establish a compelling advantage over
its competitors.
The industry could become even more competitive if OEMs fail to significantly increase their overall levels
of outsourcing. Increased competition could result in significant price competition, reduced revenues,
lower profit margins, or loss of market share, any of which would have a material adverse effect on IMI’s
business, financial condition, and results of operations.
IMI regularly assesses the appropriate pricing model (strategic/value based, demand based, etc.) to be
applied on its quotation to existing or prospective customers. The Company is also strengthening its risk
management capabilities to be able to turn some of the risks (e.g., credit risks) into opportunities to gain
or maintain new or existing customers, respectively.
13
IMI’s industry is dependent on the continuous growth of outsourcing by the original equipment
manufacturers
IMI belongs to an industry that is dependent on the strong and continuous growth of outsourcing in the
computing, communications, consumer automotive, industrial, and medical electronics industries. IMI’s
industry exists because customers choose to outsource certain functions in the production process of
certain machines and equipments in these industries. A customer’s decision to outsource is affected by its
ability and capacity for internal manufacturing and the competitive advantages of outsourcing.
IMI’s industry depends on the continuing trend of increased outsourcing by its customers. Future growth in
IMI’s revenue depends on new outsourcing opportunities in which IMI assumes additional manufacturing
and supply chain management responsibilities from its customers. To the extent that these opportunities
do not materialize, either because the customers decide to perform these functions internally or because
they use other providers of these services, IMI’s future growth could be limited.
IMI believes that its manufacturing operations in Singapore, Philippines, and several parts of China and its
enhanced supply chain systems and capabilities will continue to provide strategic advantages for
customers to outsource certain functions of their manufacturing processes to IMI.
Demand for services in the EMS industry depends on the performance and business of the industry’s
customers as well as the demand from end consumers of electronic products
The profitability of companies in the same industry as IMI depends on the performance and business of
the industry’s customers, driven by the demand for electronic products by end consumers. If the end-user
demand is low for the industry’s customers’ products, companies in IMI’s industry may see significant
changes in orders from customers and may experience greater pricing pressures. Therefore, risks that
could seriously harm the customers of IMI’s industry could, as a result, adversely affect IMI as well. These
risks include:
(1)
(2)
(3)
(4)
Their inability to manage their operations efficiently and effectively;
Reduced consumer spending in key customers’ markets;
Seasonal demand for their products; and,
Failure of their products to gain widespread commercial acceptance.
The impact of this risk has been very evident with the global financial crisis resulting in global reduction of
demand for electronics products by end customers. IMI mitigates the impact of industry downturns on
demand by rationalizing excess labor and capacity to geographical areas most optimal, and by initiating
cost containment programs. There have been recent indications that the crisis has bottomed out and the
Company was able to re-hire some of its employees. However, IMI remains cautious and is continuously
monitoring improvements resulting from its cost containment programs.
IMI’s industry may experience shortages in, or rises in the prices of components, which may adversely
affect business
There is a risk that IMI will be unable to acquire necessary components for its business as a result of
strong demand in the industry for those components or if suppliers experience any problems with
production or delivery.
IMI is often required by its customers to source certain key components from suppliers on approved
vendor lists who have been qualified by its customers, and IMI may not be able to obtain alternative
sources of supply should such qualified suppliers be unable to meet the supply in the future. Shortages of
components could limit IMI’s production capabilities or cause delays in production, which could prevent it
from making scheduled shipments to customers.
14
If IMI is unable to make scheduled shipments, it may experience a reduction in its sales, an increase in
costs, and adverse effects on its business. Component shortages may also increase costs of goods sold
because IMI may be required to pay higher prices for components in short supply and redesign or
reconfigure products to accommodate substitute components.
To the extent possible, IMI works closely with customers to ensure that there is at least one back up
supplier or manufacturer for customer-supplied components or components supplied by customernominated suppliers. In addition, IMI has established supplier certification and development programs
designed to assess and improve suppliers’ capability in ensuring uninterrupted supply of components to
IMI.
IMI may be exposed to risk of inventory obsolescence and working capital tied up in inventories
Like other EMS and ODMs, IMI may be exposed to a risk of inventory obsolescence because of rapidly
changing technology and customer requirements. Inventory obsolescence may require IMI to make
adjustments to write down inventory to the lower of cost or net realizable value, and its operating results
could be adversely affected. IMI realizes these risks and as a result, IMI exercises due diligence in
materials planning and provides provision in its inventory systems and planning. IMI is working with key
suppliers to establish supplier-managed inventory arrangements that will make the supplier responsible for
carrying inventory.
IMI’s international operations expose it to various business, economic, political, regulatory, and legal risks
IMI has operations in Singapore, Hong Kong, China, Bulgaria, Czech Republic, Mexico and United States
of America. These international operations expose IMI to numerous risks and challenges, including:
(1)
managing operations that require coordination of communications, directions for the
manufacture and delivery of products, coordination regarding procurement and
delivery of components and raw materials, and other activities and decisions of
different management teams;
(2)
coordinating the activities of senior management who are spread out internationally;
(3)
reversal of currently favorable policies encouraging foreign investment or foreign
trade by host countries could lead to the imposition of government controls,
changes in tariffs or trade restrictions on component or assembled products;
(4)
the burden of complying with a variety of foreign laws, including delays or difficulties
in obtaining import and export licenses, and regulations and unexpected changes in
legal and regulatory environments, including changes to import and export
regulations and duties;
(5)
lower levels of protection for intellectual property rights in some countries;
(6)
potentially adverse tax consequences, including tax consequences which may arise
in connection with inter-company pricing for transactions between separate legal
entities within a group operating in different tax jurisdictions, and overall increases
in duties and taxation;
(7)
potential foreign exchange and repatriation controls on foreign earnings, exchange
rate fluctuations, and currency conversion restrictions;
(8)
lack of developed local infrastructure, transportation and water supply, and difficult
and costly local staffing and sourcing of raw materials or components in some
countries;
(9)
actions which may be taken by foreign governments pursuant to any trade
restrictions; and
15
(10) possible labor unrest and political economic instability.
A substantial portion of IMI’s manufacturing operations is located in China, which has regulated financial
and foreign exchange regime. The Company continuously evaluates the options available to the
organization to ensure maximum usage of excess liquidity. Among others, excess liquidity may be
repatriated out of China through dividend payments, payment of management service or royalty fees, use
of leading and lagging payment, and transfer pricing.
IMI applies conservative financial and operational controls in the management of its business risks.
Organizationally, it is the lead director/company president/chief risk officer who has ultimate accountability
and responsibility to ensure risk management initiatives at subsidiaries operating in various countries all
over the world are aligned with IMI and are responsible for submission of risk reports to ensure key risks
are well understood, assessed/measured and reported. Providing support is the internal audit unit who
regularly process audits and process improvements.
The Audit Committee of the Board meets regularly and performs its oversight role in managing the risks
involved in the operations of IMI. The Board appointed a Chief Risk Officer who oversees the entire risk
management function and is responsible for overall continuity. Moreover, SGV has been engaged as a
risk management consultant which is overseen by the Finance Committee of the Board.
In terms of internal control risks, control mechanisms, systems and policies had been put in place in order
to address any control lapses. The Audit Committee sees to it that these internal control risks are properly
addressed through strict compliance with these system controls, policies and procedures. Moreover, IMI
has a culture and systems for transparency, corporate governance, disclosure and checks-and-balances
between various decision-making personnel that minimize the risks described above.
IMI has adopted various Risk Management Policies like hedging policy that will protect company’s position
on different currencies against movements of the US dollars. Limits on business transactions have been
set with different sites following the Company guidelines on limit of authorities granted to Company
officers and executives. The Company has also introduced and adopted Enterprise Wide Risk
Management program that will identify all risks related to the business and also identify risk mitigating
factors to manage the risk.
While the Company tries to keep its local expertise, it also established global functions to ensure that
there is adequate coordination of activities. In addition, the availability and use of cell phones, e-mails,
and internet based communication tools by the Company resulted in more efficient and timely coordination
of activities and decision making by Management from different sites and countries. Moreover, on a need
be basis, the Company seeks the help of consultants and subject matter experts for changes in laws and
regulations that may have a significant impact in the Company’s business operations. It also maintains
good relationship with local government, customs, and tax authorities through business transparency and
compliance and/or payment of all government related dues on time.
IMI’s subsidiary in China has created a full-time tax management function to ensure compliance with tax
rules and regulations. It also aggressively pursued hiring of experienced logistics managers and staff
from global electronics companies operating in China. This enables the Company to ensure that it has
sufficient manpower complement possessed with the required skills and experience to find vendors in and
out of China for its global materials requirements.
The Company signs unilateral and bilateral agreements with customers, vendors, and partners to restrict
or limit the use of the recipient of confidential information.
With respect to legal proceedings involving the Company, Ayala Corporation’s General Counsel and
Corporate Governance & Legal Affairs group analyze its transactions and activities to ensure compliance
with law, regulation, and contractual obligations. In the event that material litigation against it does arise,
IMI assesses the merits of the case and its impact on company operations. IMI refers the case to Ayala
16
Corporation’s General Counsel and Corporate Governance & Legal Affairs and if needed, the Company
retains external counsel to help in the analysis or handle the actual litigation of the case.
IMI has a Business Continuity Plan composed of, among other components, the ICT Systems Continuity
Plan and the Disaster Recovery Plan. The Company backs-up data in its servers on a daily basis. Data is
backed-up on tape drives for critical and non-critical applications. For SAP-R3 Financials, data is
replicated to a back-up site every hour. Critical systems are recoverable within four to eight hours; regular
systems can be recovered within 24 hours. IMI continually invests in business continuity technology in
order to reduce the recovery time of servers at the back-up site, maximize the reliability, efficiency and
manageability of the back-up system. All these are designed for the recovery of IMI’s critical production
systems in its principal office in the event said office becomes unavailable due to disaster.
IMI’s HR ensures that the Company is able to inspire all its employees from different sites through a
common vision, that employees find greater meaning in the work they do, and more importantly,
employees are convinced that rewards and recognition are linked to contribution and performance. As part
of the Company’s succession planning initiatives, it has instituted various employee development
programs, including cross-posting, foreign immersions, educational assistance, mentoring and leadership
development training. These programs equip the middle-managers with the right tools needed not only for
their present responsibilities, but also those required for them to assume higher positions in the
organization. These programs minimize the risks associated with the turn-over of experienced
management, as IMI would be able to find competent people to take their place.
The Company has been able to overcome major crises brought about by economic and political factors
affecting the country where it operates. The strong corporate governance structure of the Company and its
prudent management team are the foundations for its continued success. IMI also constantly monitors its
macroeconomic risk exposure, identifies unwanted risk concentration, and modifies its business policies
and activities to navigate such risks. Severe macroeconomic contractions may conceivably lead IMI to
tweak or modify its investment decisions to meet the downturn. As a holding company, IMI will affirm the
principles of fiscal prudence and efficiency in operations to its subsidiaries operating in various countries.
IMI faces risks related to foreign currency exchange rates
Because IMI does business in various countries, IMI is exposed to foreign currency fluctuations, which IMI
may not be able to control by matching currencies for its assets and liabilities, and forward foreign
currency exchange rate arrangements. IMI also faces the risk that foreign exchange policies in countries
where it operates may change in ways that could adversely affect its business. IMI regularly performs cash
flow analysis from each site to determine amount of foreign currency exposure to be hedged. IMI’s
Finance Committee of the Board regularly reviews IMI’s foreign currency strategies for guidance and
proper execution.
IMI may suffer business interruptions resulting from “Acts of God” and global events
“Acts of God” and global events like health pandemics may disrupt production activities, transportation,
and distribution. In addition, external factors such as potential terrorist attacks, acts of war,
or geopolitical and social turmoil in parts of the world where IMI operates or that serve as markets for its
products could significantly and adversely affect its business and operating results in ways that cannot
presently be predicted. These uncertainties could limit the capabilities of IMI to accurately plan future
business activities.
IMI continues to look for opportunities to expand its operations to other location or countries that will
provide competitive advantages through its location, products, labor skills, and costs. While these
expansions may bring in new risks, it also reduces the risk that the Company may be adversely affected
by political and regulatory risks specific to each location or country.
17
In addition, IMI has well established business contingency plans to reduce the impact of these events to
our operations. IMI is also adequately covered with insurance against possible losses resulting from these
disasters.
Risks relating to the Philippines or other country where IMI operates
The financial performance of the Company and its subsidiaries, as well as their business prospects, may
be influenced by the general political and peace and order situation in the Philippines or the country in
which it operates and the state of the country’s economy, all of which are beyond the Company’s control.
Any actual or perceived political and economic instability may adversely affect, directly or indirectly, the
Company’s business and ultimately, its financial performance. Any potential investor in, and buyer of, the
Subject Shares should pay particular attention to the fact that the Company and its subsidiaries are
governed in the Philippines or in the country in which they respectively operate by a legal and regulatory
system which, in some respects, may differ from that obtaining in other countries.
The contribution of each segment of the business to the consolidated revenues of the Company is
as follows:
The following tables present revenue and profit information regarding the Group’s geographical
segments for the years ended December 31, 2011, 2010 and 2009.
December 31, 2011
Revenue
Third party
Inter-segment
Total revenue
Philippines
Parent
Company
USA
Total
PSi
$154,151,770
–
$154,151,770
$73,559,713
403,500
$73,963,213
$280,118,990
3,898,157
$284,017,147
$66,239,366
–
$66,239,366
$394,919
2,842,333
$3,237,252
$– $575,453,908
$989,150
885,430 (8,029,420)
–
$1,874,580 ($8,029,420) $575,453,908
$12,128,822
$3,127,887
$22,014,238
$5,425,951
$2,338,546
$1,088,152 ($7,946,062) $38,177,534
Segment gross profit
Segment operating income
(loss)
Singapore/Chin
a Europe/Mexico
Consolidatio
n
and
Japan Eliminations
($13,936,898)
($4,024,730)
$3,902,328
($683,681)
$25,602
$208,146
Segment interest income
$185,072
$3,334
$100,007
$27,077
$–
$30
$–
$315,520
Segment interest expense
$624,079
$389,496
$291,989
$1,191,848
$1,775
$811
$–
2,499,998
($4,390,951)
$6,666,192
$12,098,547
$22,844
$239,468
($116,413)
$5,945,599
(129,022)
(2,724,363)
(223,009)
(250,000)
(847)
$–
(4,654,086)
($4,519,973)
$3,941,829
$11,875,538
($227,156)
$238,621
($116,413)
$1,291,513
Segment profit (loss) before
($8,574,088)
income tax
Segment provision for income
tax
(1,326,845)
Segment profit (loss) after
($9,900,933)
income tax
$–($14,509,233)
Consolidation
December 31, 2010
Revenue
Third party
Inter-segment
Total revenue
Philippines
Singapore/China
USA
Japan
Eliminations
Parent Company
PSi
$143,388,346
–
$143,388,346
$19,345,006
–
$19,345,006
$248,839,859
3,997,122
$252,836,981
$280,521
2,463,391
$2,743,912
$472,873
863,087
$1,335,960
(7,323,600)
($7,323,600)
$412,326,605
–
$412,326,605
($6,572,223)
$44,474,592
Segment gross profit
$13,857,388
$963,522
$32,701,351
$2,588,665
$935,889
Segment operating income (loss)
($8,573,328)
($707,780)
$13,407,801
$28,858
$95,025
$4,250,576
Segment interest income
$272,574
$3,181
$76,786
$–
$37
$352,578
Segment interest expense
$437,792
$102,701
$493,646
$1,561
$1,229
$1,036,929
Segment profit (loss) before income
tax
Segment provision for income tax
Segment profit (loss) after income tax
December 31, 2009
($4,425,209)
(282,199)
($4,707,408)
Philippines
($769,800)
(46,240)
($816,040)
$12,871,708
(3,078,292)
$9,793,416
Singapore/China
$27,297
–
$27,297
USA
$118,173
(793)
$117,380
Japan
$–
Eliminations
$7,822,169
(3,407,524)
$4,414,645
Total
18
Revenue
Third party
Inter-segment
Total revenue
Segment gross profit
Segment operating income (loss)
$196,295,400
–
$196,295,400
$198,837,576
1,392,234
$200,229,810
$63,332
2,083,085
$2,146,417
$17,395,603
$28,443,194
$1,963,998
$10,377,426
$4,135
($585,141)
$305,973
566,118
$872,091
$–
(4,041,437)
($4,041,437)
$395,502,281
–
$395,502,281
$414,707
($3,626,871)
$44,590,631
($377,108)
$–
$9,419,312
Segment interest income
$655,397
$67,730
$–
$134
$–
$723,261
Segment interest expense
$950,821
$834,650
$536
$1,459
$–
$1,787,466
$–
–
$–
$15,161,369
(5,031,188)
$10,130,181
Segment profit (loss) before income
tax
Segment provision for income tax
Segment profit (loss) after income tax
$4,739,424
(206,118)
$4,533,306
$10,790,688
(4,824,263)
$5,966,425
$3,599
–
$3,599
($372,342)
(807)
($373,149)
Inter-segment revenues, cost of sales and operating expenses are eliminated on consolidation.
Please refer also to Note 28 (“Segment Information”) of the Notes to Consolidated Financial Statements of
the 2011 Audited Consolidated Financial Statements which is incorporated herein as Exhibit 1.
Item 2. Properties
IMI has production facilities in the Philippines (Laguna, Cavite and Taguig), China (Shenzhen, Jiaxing,
Chongqing and Chengdu), Singapore, Bulgaria, Czech Republic, and Mexico. It also has a prototyping and
NPI facility located in Tustin, California. Engineering and design centers, on the other hand, are located in
the Philippines, Singapore, China, United States, Bulgaria and Czech Republic. IMI also has a global
network of sales and logistics offices in Asia, North America, and Europe.
The Parent Company does not own land. As a result, it leases the land on which its manufacturing plants,
office buildings and sales offices are located. The head office and main plant of IMI are located at North
Science Avenue, Laguna Technopark, Biñan, 4024, Laguna,Philippines. The premises are leased from
Technopark Land, Inc. On December 23, 2008, IMI renewed the lease for 3 years, which expired on
December 31, 2011. On January 2, 2012, the Parent Company again extended the lease contract for
another three years commencing January 2, 2012 up to December 31, 2015. The lease contract is
renewable at the option of the lessor upon such terms and conditions and upon such rental rates as the
parties may agree upon at the time of the renewal, taking into consideration comparable rental rates for
similar properties prevailing at the time of renewal. IMI is liable to pay a monthly rent specified in the lease
contract, exclusive of value added tax, which increases over the years. In the event of sale, transfer or
disposition of the leased premises, the lessor shall ensure that the lease will be honored by the buyer.
IMI’s subsidiaries, except for IMI-USA, IMI-Japan and Speedy-Tech Electronics (HK) Limited in Hong
Kong, lease the land on which their respective manufacturing and office buildings are located. While the
newly-acquired subsidiaries in Bulgaria, Czech Republic and Mexico own the land wherein their respective
manufacturing and office premises are located.
The Company’s global facilities and capabilities of each location as of December 31, 2011 are shown
below:
Location
Floor Area (in
square meters)
Capabilities
19
Philippines-Laguna
96,182
DFM, NPI, Test & System Dev’t, SMT (inc. Inline SP-AOI, Post-Reflow AOI, X-ray), ICT,
FCT, PCBA & Box-Build Assembly, COB (inc.
DA of Imager Die), COF, Al Wirebonding ,
Robotic & selective wave soldering, ACF &
Hotbar (Flex to rigid board), Heat stake &
ultrasonic weld for plastic enclosure
Class 10k Facility w/ Class 100 Laminar Flow
Hood, LVHM and HVLM
Philippines-Cavite
2,350
SMT & PTH Lines, BGA, X-ray, ICT, Functional
Testing, PCBA Assembly & Full System Box
Build, NPI Center, LVHM
SMT & PTH Lines, BGA, AOI, X-ray, ICT,
Functional Testing, Test Development, H/W &
S/W, PCBA Assembly & Full System Box Build,
Central Warehouse, Logistics Services, HMLV
Turnkey & Consignment, HMLV & LMHV, SMT
& PTH Lines, BGA & COB, X-ray, AOI, ICT,
Functional Testing, Test Development, H/W &
S/W, PCBA Assembly & Full System Box Build,
New Product Introduction (NPI) Center, Central
Warehouse, Logistics Services, D&D Center
Turnkey & Consignment, HMLV & LMHV, SMT
& PTH Lines, BGA & COB, X-ray, AOI, ICT,
Functional Testing, Test Development, H/W &
S/W, PCBA Assembly & Full System Box Build,
New Product Introduction (NPI) Center, Central
Warehouse, Logistics Services
Consignment, HMLV, SMT & PTH Lines, BGA
& COB, X-ray, AOI, PCBA Assembly & Full
System Box Build, New Product Introduction
(NPI) Center, Central Warehouse, Logistics
Services
Procurement, marketing and supply chain
facility
Customer Specific Quality Requirements, e.g.,
Critical Part Monitoring (CPM), Reject Profile
Analysis (RPA), Parts Average Test (PAT), and
Statistical Bin Analysis; Medium to High Power
Discrete Packages and Process including
Large Diameter Wirebonding; Miniaturized
Power Packaging – Power QFN, PowermiteTM
and Process – Cu Clip and Au Wire/Al Wire
Bond; High Reliability Hermetic Packages –
Metal Cans and Ceramic Packages
Power Management (IC) Discrete Packaging,
e.g., 5 – 7L TO-220, Diversified Packaging –
from Low to High Power and Small to Large
Outline
Offers technical, quality assurance, sales and
commercial support in a broad range of
industries for Japan-based clients
Singapore
8,048.22
China-Liantang
18,600
China-Fuyong
China-Kiuchong
China-Jiaxing
China-Chengdu
12,000
18,000
13,000
7,500
China-Chongqing
2,243
Hong Kong*
300
Philippines-PSi Taguig
8,607
Philippines-PSi Laguna
6,968
Japan*
110
20
USA-Tustin, CA*
1,184
Engineering Development and Prototype
Manufacturing Center, Full Range of Assembly
Capabilities with focus on Precision Assembly;
SMT; COB FCOF; Process Development
PV Module or Panel Design/co-Development
(Material Qualification, Process Development),
Solar Panel Testing and Certification, Solar
Panel Prototyping Development, Low-Volume
Manufacturing, Inverter Platform, EMS and
Test Services for Control Electronics of Solar
Systems
PCBA: SMT, COB/COF/ IC Encapsulation, Pin
Through Hole, Automatic Pin Insertion, Wave
Soldering, Selective Soldering System, BGA, Xray, Nitrogen Equipment, Protective Coating,
ICT/ FCT Test, Thermopaste Dispensing, AOI,
Plastic
Injection,
Embedded
Toolshop,
Overmoulding,
Box build: Mechanical Design and Assembly,
USA-Fremont, CA*
1,143
Botevgrad, Bulgaria
23,778
El Salto,
Mexico
Guadalajara,
18,000
PCBA: (Pb & LF): SMT, AOI, Pin Through Hole
(Pin Insertion, Radial/Axial), Wave Soldering
(Hot Bar and Selective), Protective Coating,
ICT/ FCT Test, Plastic Injection : from 50 to
850T + Vertical Bi-injection (220T)/Individual
Dryers for every Machine, supported by
Embedded Toolshop (CNC, EDM,...) and 3D
Inspection CMM
Box built : Customized Operations for PCBA
and Plastic Box assembly
Třemošná,
Plzeňská,
Czech Republic
7,740
PCBA: SMT; Pin Through Hole, Automatic Pin
Insertion, Wave Soldering, UltraSonic Welding,
Selective Soldering System, BGA, Protective
Coating, RF Testing, ICT/ FCT Test, AOI,
Mechanical Assembly
Total
245,753.57
Intellectual Property
The table below summarizes the intellectual properties registered with the United States Patent and
Trademark Office out of the Company’s California and Singapore facilities, competency centers for
Advanced Manufacturing Technology:
Name
Anisotropic Bonding System and Method Using
Dynamic Feedback
Traceless Flip Chip assembly and method
Manufacturing Method for Attaching Components to
a Substrate
Filing Date
Expiration
27 November 2000
26 November 2020
26 February 2001
25 February 2021
05 March 2001
04 March 2021
21
Passive circuitry for harmonic current regulation in a
power supply by energy efficient input current
shaping
16 September 2001
17 September 2020
20 April 2000
19 April 2020
Self-coupled driver used in dual-switch forward
power converter (Singapore)
27 February 2007
26 February 2027
Self-coupled driver used in dual-switch forward
power converter (US)
9 January 2008
8 January 2028
Energy efficient method and apparatus for shaping
input waveform (Singapore)
Item 3. Legal Proceedings
There are no material pending legal proceedings, bankruptcy petition, conviction by final judgment, order,
judgment or decree or any violation of a securities or commodities law for the past five years and the
preceding years until January 31, 2012 to which the Company or any of its subsidiaries or its directors or
executive officers is a party or of which any of its material properties are subject in any court or
administrative government agency. In any event, below is the legal proceeding involving the Company
that may be significant.
IMI filed a civil case on April 11, 2011 against Standard Insurance (“Standard”) seeking to collect
Standard’s share in the loss incurred by IMI consisting in damage to production equipment and
machineries as a result of the May 24, 2009 fire at IMI’s Cebu facility which IMI claims to be covered by
Standard’s “Industrial All Risks Material Damage with Machinery Breakdown and Business Interruption”
policy. The share of Standard in the loss is 22% or US $1,117,056.84 after its co-insurers all paid.
IMI had to resort to court action after Standard denied its claim on the ground that this is an excepted peril.
Standard filed a motion to dismiss on various grounds, such as lack of cause of action and of prescription.
The RTC denied the motion to dismiss but Standard filed a Motion for Reconsideration, which is pending
resolution.
Item 4. Submission of Matters to a Vote of Security Holders
Except for matters taken up during the annual meeting of stockholders, there was no other matter
submitted to a vote of security holders during the period covered by this report.
PART II - OPERATIONAL AND FINANCIAL INFORMATION
Item 5. Market for Issuer's Common Equity and Related Stockholder Matters
The Company’s common shares are listed in the Philippine Stock Exchange only on January 21, 2010.
The market capitalization of the Company’s common shares as of December 31, 2011, based on the
closing price of P4.99/share, was approximately P7.2 billion. The price information of IMI’s common
shares as of the close of the latest practicable trading date, March 15, 2012, is P5.00 per share.
Holders
There are approximately 560 and 42 registered holders of common and preferred shares as of January
31, 2012. The following are the top 20 registered holders of the common shares of the Company:
22
No. of Common
Shares
957,537,373
279,174,296
57,339,671
44,988,446
30,509,154
21,177,748
12,079,323
6,581,622
5,894,108
Stockholder Name
1.
2.
3.
4.
5.
6.
7.
8.
9.
10.
11.
12.
13.
14.
15.
16.
17.
18.
19.
20.
AYC Holdings, Ltd.
PCD Nominee Corporation (Filipino)
POMS Investment Pte Ltd.
2007 ESOWN Subscriptions
2009 ESOWN Subscription
2004 ESOWN Subscription
Mitsubishi Corporation
SIIX Corporation
PCD Nominee Corporation (NonFilipino)
Chow Phui Kheong
Arthur R. Tan
Kwok Kai Ming
Rafael Nestor Velez Mantaring
Kot Yiu Kuen
Masaharu Nishii
Josef Pfister
Transtechnology Pte. Ltd.
Timothy Patterson
Shong Cheng Yeh
Andrew C. Carreon
3,164,906
1,955,451
1,698,768
1,057,930
490,244
414,148
315,860
304,836
255,696
225,617
210,573
Percentage of
Common Shares
66.7702%
19.4672%
3.9983%
3.1370%
2.1274%
1.4767%
0.8423%
0.4589%
0.4110%
0.2206%
0.1363%
0.1184%
0.0737%
0.0341%
0.0288%
0.0220%
0.0212%
0.0178%
0.0157%
0.0146%
Dividends
Stock Dividend
PERCENT
RECORD DATE
PAYMENT DATE
15%
Aug. 31, 2010
Sept. 24, 2010
Cash Dividends
CLASS
Common shares
PAYMENT DATE
June 6, 2009
RATE
n/a*
TERM / RECORD DATE
March 26, 2009
Common shares
Common shares
May 27, 2010
April 4, 2011
USD0.0024/PhP0.11
USD0.00099/
PhP0.044
April 30, 2010
March 9, 2011
* The Board declared a special cash dividend in 2009 amounting to $2.0M apportioned to all the common
shareholders.
Dividend policy
Dividends declared by the Company on its shares of stocks are payable in cash or in additional shares of
stock. The payment of dividends in the future will depend upon the earnings, cash flow and financial
condition of the Company and other factors.
Cash dividends are subject to approval by the Company’s Board but no stockholder approval is required.
Property dividends which may come in the form of additional shares of stock are subject to approval by
both the Company’s Board of Directors and the Company’s stockholders. In addition, the payment of stock
dividends is likewise subject to the approval of the SEC and PSE.
23
Item 6. Management's Discussion and Analysis or Plan of Operation.
Results of Operations
Revenues, gross profit, net income, and the related computed EBITDA and basic earnings per share, for
years ended 2011, 2010 and 2009 are shown on the following table:
For the years ended
31 December
2011
2010
2009
(in US$ thousands,
except Basic EPS)
Revenues from sales and
services
575,454
412,327
395,502
Cost of goods sold and services
537,276
367,852
350,912
38,178
44,475
44,591
3,289
4,739
10,066
20,309
30,242
30,123
0.001
0.002
0.006
Gross profit
Net income attributable to equity
holders of the Parent
Company
EBITDA
Basic Earnings per Share (EPS)
2011 vs. 2010
Revenues from Sales and Services
The Company recorded US$575.5 million consolidated revenues from sales and services in 2011, a 40%
increase from last year’s $412.3 million. The Company’s operations in China and Singapore posted
US$279.7 million in combined revenues in 2011, a 12% year-on-year growth due mainly to new turnkey
programs for major customers. The Philippine operations generated US$154.2 million revenues, an 8
percent increase from 2010 due to strong programs in the automotive and industrial sectors. Toward the
end of the year, IMI’s assembly operations for the storage device manufacturers also increased, as hard
disk drive manufacturers in flood-plagued Thailand transferred production to the Philippines. The increase
can also be attributed to full year revenue contribution of PSi Technologies, Inc. (PSi) acquired in 2010
which posted revenue of US$74.0 million and newly-acquired entities in Europe and Mexico (EPIQ
subsidiaries) which contributed 5-month revenue amounting to $US66.2 million.
Cost of Goods Sold and Services
The increase in cost of goods sold and services in absolute amount by 46% was driven mainly by higher
revenues from existing businesses and revenue contribution of entities acquired in 2010 and 2011.
Significant increase, however, can be attributed to material-related costs as a result of higher revenues
from turnkey businesses. Direct labor, on the other hand, increased as a result of mandated wage
increases particularly in China. The under-utilized facility specifically in it’s PSi subsidiary also caused
overhead to increase.
Gross Profit and Gross Profit Margin
Consolidated gross profit, in absolute amount, declined by US$6.3 million or 14%. Gross profit margin
went down from 10.8% to 6.6% due to higher direct material and labor costs particularly in China.
24
Operating Expenses
Operating expenses grew by 31% from US$40.2 million in 2010 to US$52.7 million in 2011. This resulted
from various provisions made during the end of the year (e.g., provisions for bad debts, allowance for
obsolescence, etc.) and one-time expenses related to key acquisition.
Net Income
Against a backdrop of weak global economic growth, higher material and direct labor costs and lower
factory utilization rate caused IMI’s margins to decline. This resulted to consolidated net income of
US$3.3 million (inclusive of non-recurring items), which was 31% lower than previous year’s net income of
US4.7 million. Without the income resulting from the acquisition of EPIQ subsidiaries, mark-to-market
gains on derivatives and one-time expenses, the consolidated bottomline would be at US$0.2 million.
EBITDA
Decrease in EBITDA by US$9.9 million was mainly driven by decline in gross profit of US$6.3 million and
various provisions made during the year.
Financial Condition
The Company continued to maintain financial stability, ending the year with a positive cash balance of
US$54.1 million, an increase of US$15.9 million from last year’s US$38.1 million.
The Company’s current ratio and debt-to-equity ratio are 1.5:1 and 0.42:1, respectively.
Prospects for the future
The Company is cautiously optimistic in the face of market uncertainty. It banks on its expanded reach
and capability, and growing presence in high-margin and less volatile markets such as the automotive and
industrial sectors.
Key Performance Indicators of the Company
The table below sets forth the comparative performance indicators of the Company:
31 Dec 2011
As of end
31 Dec 2010
(as Restated)
31 Dec 2009
Performance
indicators
Liquidity:
Current ratio
1.51x
1.23x
1.89x
0.42x
0.33x
0.29x
Solvency:
Debt-to-equity ratio
For the years ended
31 December
25
2011
2010
2009
40%
4%
(10%)
Return on equity
2%
3%
6%
Return on assets
1%
1%
3%
1
4%
7%
8%
Operating efficiency:
Revenue growth
Profitability:
EBITDA margin
In the above:
(i) There are no known trends, events or uncertainties that will result in the Company’s liquidity
increasing or decreasing in a material way.
(ii) There were no events that will trigger direct or contingent financial obligation that is material to the
Company, including any default or acceleration of an obligation.
(iii) Likewise, there were no material off-balance sheet transactions, arrangements, obligations (including
contingent obligations), and other relationships of the Company with unconsolidated entities or other
persons created during the reporting period.
(iv) There are no seasonal aspects that may have a material effect on the financial condition of the
Company.
Causes for any material changes
(Increase or decrease of 5% or more in the financial statements)
Income Statement items - YTD December 31, 2011 versus YTD December 31, 2010
40% increase in Revenues from sale of goods and services (US$412.3M to US$575.5M)
Increase was mainly driven by five-month revenue contribution of newly acquired entities in Europe and
Mexico of $66.2m and full year revenue contribution of PSi in 2011 of $74.0 million as against last year’s
three month contribution of $19.3 million on the year of acquisition. On the other hand, the Company’s
China and Singapore operations increased revenues by US$30.9 million or 12% mainly due to new
turnkey programs for major customers. The Philippine operations also increased by $10.8 million or an
8% increase year-on-year due to strong programs in the automotive and industrial sectors.
46% increase in Cost of goods sold and services (US$367.9M to US$537.3M)
Primarily due to increase in turnkey businesses that resulted to higher direct material cost, mandated
wage increase particularly in China and higher manufacturing overhead due to unutilized capacity of
facilities and machineries in some of its Philippine plants.
31% increase in Operating expenses (US$40.2M to US$52.7M)
Brought about by various provisions made towards the end of the year and one-time expenses related to
the acquisition of EPIQ subsidiaries.
1
EBITDA Margin = EBITDA divided by revenues from sales and services where EBITDA represents net operating
income after adding depreciation and amortization, cost of share-based payments. EBITDA and EBITDA Margin
are not measures of performance under PFRS and investors should not consider EBITDA, EBITDA Margin or
EBIT in isolation or as alternatives to net income as an indicator of our operating performance or to cash flows, or
any other measure of performance under PFRS. Because there are various EBITDA calculation methods, our
presentation of these measures may not be comparable to similarly titled measures used by other companies.
26
473% increase in Net finance and other income (US$3.6M to US$20.5M)
Increase pertains mainly to the gain on bargain purchase from the newly acquired entities in Europe and
Mexico of US$13.0 million and mark-to-market gains on derivatives of US$6.2 million. These were offset
by impairment loss recognized on goodwill of US$2.7 million and increase in interest expense pertaining to
additional bank loans availed during the year and existing loans of acquired entities.
37% increase in Provision for income tax (US$3.4M to US$4.7M)
Increase was caused by expiration of some the Parent Company’s entitlements to Income Tax Holidays
and additional provision for taxes from EPIQ subsidiaries. The increase can be attributed also to deferred
tax liabilities recognized from transactions related to acquisition of subsidiaries and derivative
transactions.
110% decrease in Other comprehensive income (US$0.06M to US$6.01M loss)
Comprehensive loss recognized resulted from cumulative translation adjustments arising from translation
of subsidiaries’ functional currency to US$ reporting currency.
516% increase in Noncontrolling interests in net loss (US$0.32M to US$2.0M)
Increase can be attributed to full-year profit and loss of PSi which was acquired during the last quarter of
2010.
Balance Sheet items - December 31, 2011 versus December 31, 2010 (As Restated)
42% increase in Cash and cash equivalents (US$38.1M to US$54.1M)
Increase can be attributable to the Company’s financing activities to support planned expansions.
29% increase in Loans and receivables (US$104.3M to US$134.7M)
Arose from increase in revenues and trade receivables from the new subsidiaries which implement longer
credit terms for their customers.
47% increase in Inventories-net (US$54.7M to US$80.4M)
Due to increase in turnkey businesses for which the Company is responsible in providing materials and
acquisition of EPIQ subsidiaries which also have turnkey arrangements with customers.
65% increase in Derivative assets (US$1.7M to US$2.8M)
Arising from mark-to-market valuations of put and call options related to the acquisition of PSi in 2010.
213% increase in Other current assets (US$2.5M to US$8.8M)
Increase is mainly due to tax credits from the newly acquired subsidiary in Mexico.
31% increase in Property, plant and equipment – net (US$74.6M to US$97.5M)
Arising mainly from the fair value of existing property, plant and equipment of EPIQ subsidiaries at the
time of acquisition amounting to US$39.2M. Capital expenditures to set-up new production lines for new
projects amounted to US$14.8 million. These were offset by depreciation recognized during the year
amounting to US$24.6 million, disposals of assets with a net book value of US$2.5 million and foreign
exchange differences arising from subsidiaries with functional currencies other than US$ amounting to
$4.0 million.
695% increase in Intangible assets – net (US$0.9M to US$7.3M)
Increase pertains to valuation of customer relationship in one of the newly acquired entities in Europe
amounting to US$6.8 million.
27
8% increase in Available-for-sale financial assets (US$0.38M to US$0.41M)
Represents increase in fair value of club shares classified as available-for-sale financial assets.
16% increase in Noncurrent receivables (US$0.18M to US$0.21M)
Increase in advances to customers for equipment purchased by the Company that are reimbursable from
the former.
25% decrease in Deferred income tax assets (US$1.0M to US$0.7M)
Due to reversals of allowance for inventory obsolescence.
42% increase in Accounts payable and accrued expenses (US$101.2M to US$144.0M)
Increase pertains substantially to trade payables and accruals of EPIQ subsidiaries.
118% increase in Trust receipts and notes payable (US$17.9M to US$39.0M)
Increase represents existing loans of the newly acquired subsidiary in Bulgaria of US$11.1M, increase in
loans payable of the Parent Company by US$6.5M and increase in PSi of US$3.5M.
27% decrease in Iincome tax payable (US$2.3M to US$1.7M)
Pertains to decrease in taxes payable in its China and Singapore sites.
100% increase in Provisions (US$nil to US$0.2M)
Relates to provision for restructuring recognized in its Singapore entity during the year.
99% decrease in Derivative liabilities (US$3.8M to US$0.03M)
Decrease is attributable to the exercise of the put option related to the acquisition of its PSi subsidiary in
2010.
100% decrease in Current portion of long-term debt (US$38M to US$nil)
Pertains to repayment of the Parent Company’s long-term debt of US$30.0 million and remaining
installment payment for the five-year term clean loan of its Singapore subsidiary amounting to US$8.0M.
100% increase in Long-term debt (US$nil to US$60.4M)
Relates to availment of a US$40.0 million loan of the Parent Company with the same terms as the
previous loan and deferred payment to the seller arising from the acquisition of the subsidiaries in Europe
and Mexico of US$20.4 million.
446% increase in Deferred tax liabilities (US$0.9M to US$4.8M)
Attributable to the recognition of deferred tax liability on the increase in fair value of property, plant and
equipment and valuation of intangible assets related to acquisition of Europe and Mexico entities and
valuation of call options.
10% decrease in Deferred revenue (US$2.6M to 2.3M)
Pertains to amortization of cash advances made by a customer of PSi related to a subcontracting service
agreement for the facilities support services that will be rendered.
35% increase in Pension liability (US$1.0M to US$1.3M)
Due to retirement fund pension liability of newly acquired subsidiary in Europe.
418% increase in Obligation under finance lease (US$0.1M to 0.6M)
Represents increase in lease obligations of the newly acquired entities in Europe related to machineries,
production equipments and transportation equipment.
38% decrease in Other long-term employee benefits (US$0.4M to US$0.2M)
28
Decline in other long-term benefits in its PSi subsidiary.
242% increase in Subscribed capital stock (US$1.9M to US$6.5M)
Primarily attributable to the subscription agreement entered in relation with the acquisition of EPIQ
subsidiaries as part of the purchase price consideration equivalent to 200 million shares of the Parent
Company.
71% increase in Additional paid-in capital (US$34.6M to US$59.1M)
Relates also to the subscription agreement in relation to the acquisition of EPIQ subsidiaries which
pertains to the fair value of the shares at the time of acquisition in excess of par.
9% decrease in Subscriptions receivable (US$11.4M to US$10.4M)
Mainly represents forfeitures of ESOWN and collections of subscriptions, net of accretion of receivables.
49% decrease in Retained earnings appropriated (US$60.7M to US$30.7M)
Due to reversals of appropriations amounting to US$30.0 million.
82% increase in Retained earnings unappropriated (US$32.7M to US$59.7M)
Increase was caused by reclassification from appropriated to unappropriated of US$30.0 million, and net
income attributable to parent company of US$3.3 million. The increase was offset by dividend declaration
amounting to US$6.3 million.
29% increase in Reserve for fluctuation on available-for-sale financial assets (US$0.11M to US$0.14M)
Represents changes in the fair values of the Company’s investments in club shares.
100% increase in Cumulative translation adjustment (US$nil to US$6.0M)
Exchange differences arising from translation of newly acquired entities to the Company’s reporting
currency.
256% decrease in Noncontrolling interests in consolidated subsidiaries (US$0.8M to US$-1.2M)
Attributed to full-year profit and loss of PSi which was acquired during the last quarter of 2010.
2010 vs. 2009
Revenues from Sales and Services
The Company posted consolidated revenues from sales and services of US$412.3 million in 2010, 4
percent higher than previous year’s revenues of US$395.5 million. The increase was brought about by the
steadfast performance of the Singapore/China operation whose sales increased by 25% from $198.8
million the previous year to $248.8 million this year and which now accounted for 60% of consolidated
revenues from the 50% share in 2009. The growing business in Singapore/China more than offset the
decline in the top line result of the Philippine operation. Philippine revenues this year slipped 27% to
$143.4 million because of loss of major turnkey customer.
Overall, sales from telecommunication and consumer segments made up the bulk of consolidated sales at
27% and 24%, respectively, followed by automotive, industrial, computer peripherals and medical
markets. The Company is currently building on the automotive business as a major growth driver and is
now continuously strengthening its capability in this area. The automotive business has posted the
highest increase this year at 52% among the Company’s business segments.
Since the start of the year, Europe remains to be the biggest market of the Company’s product, getting
37% of the total revenue, while US and Asia are showing steady growth.
29
Cost of Goods Sold and Services
Cost of Goods Sold and Services grew 5% in absolute amount because of higher revenue. The continued
shift towards turnkey business arrangement has pulled cost upward, particularly direct materials and direct
labor cost of Singapore/China. Under turnkey arrangement, the Company owns the materials in addition
to the labor and facility whereas under a consignment arrangement, the materials are provided by the
customer. The unutilized capacity of Philippines also contributes to the increase in manufacturing
overhead.
Gross Profit and Gross Profit Margin
The Company’s operations produced Gross Profit of US$44.5 million which, in absolute terms, slightly
lower than last year. The continuous conversion of turnkey businesses results a slim decline in gross
profit rate of 10.2 percent from the 11.2 percent margin reported last year.
Operating Expenses
Company’s Operating Expense amounted to US$40.2 million, 14% higher than last year. Excluding the
rd
one time expenses, (3 tranche esown expense, provision for unsettled insurance claim and accruals for
expenses related to due diligence) operating expense should only be 1%, slightly higher compared to last
year.
Net Income
Net Income closed at US$4.7 million, 53% lower than the US$10.1 million reported for the same period
last year. Without the last year’s one-time gains from insurance recovery of US$4.5 million (net of
expenses) and this year’s reversal on the fx gain from prior year provisions of $2.3 million and one-time
expenses of US$4.6 million, this year income would be US$7.0 million, 23% better than last year. The
improvement was largely attributable to the sustained strong contribution of the Singapore/China
operation.
EBITDA
EBITDA (Operating income, depreciation, amortization and esown expenses) decreased by 5%, US$28.4
million against last year of US$29.8 million brought about by higher operating expenses.
Financial Condition
The Company ended the year with cash balance of US$38.1 million, 29% lower than the US$53.9 million
as of December 31, 2010, and net debt of US$17.8 million, a reverse of the zero net debt position of last
year. This decrease in cash was attributable to the increased spending on operating and capital
expenditures requirements necessitated by the pick-up in business activity levels following the
improvement in the general economic environment. Current and debt-to-equity ratios have remained
healthy at 1.24:1 and 0.33:1 respectively, from the 1.89:1 and 0.29:1 as of December 31, 2009.
Prospects for the future
The Company ensures it has sufficient resources to cover operating requirements and debt obligation as
well as fund ongoing growth initiatives. It maintains adequate loan facilities to complement cash flows
from operations. In addition, it has laid out financial strategies and controls to ensure continued liquidity
and stable financial position.
30
Key performance indicators of the Company
The table below sets forth the comparative performance indicators of the Company:
31 Dec 2010
As of end
31 Dec 2009
31 Dec 2008
Performance
indicators
Liquidity:
Current ratio
1.24x
1.89x
1.70x
0.33x
0.29x
0.44x
2010
For the years ended
31 December
2009
2008
4%
(10%)
5%
Return on equity
3%
6%
(11%)
Return on assets
1%
3%
( 5%)
2
7%
8%
11%
Solvency:
Debt-to-equity ratio
Operating efficiency:
Revenue growth
Profitability:
EBITDA margin
In the above:
(v) There are no known trends, events or uncertainties that will result in the Company’s liquidity
increasing or decreasing in a material way.
(vi) There were no events that will trigger direct or contingent financial obligation that is material to the
Company, including any default or acceleration of an obligation.
(vii) Likewise, there were no material off-balance sheet transactions, arrangements, obligations (including
contingent obligations), and other relationships of the Company with unconsolidated entities or other
persons created during the reporting period.
(viii)
There are no seasonal aspects that may have a material effect on the financial condition of the
Company.
Causes for any material changes
(Increase or decrease of 5% or more in the financial statements)
Income Statement items - YTD December 31, 2010 versus YTD December 31, 2009
2
EBITDA Margin = EBITDA divided by revenues from sales and services where EBITDA represents net operating
income after adding depreciation and amortization, cost of share-based payments. EBITDA and EBITDA Margin are
not measures of performance under PFRS and investors should not consider EBITDA, EBITDA Margin or EBIT in
isolation or as alternatives to net income as an indicator of our operating performance or to cash flows, or any other
measure of performance under PFRS. Because there are various EBITDA calculation methods, our presentation of
these measures may not be comparable to similarly titled measures used by other companies.
31
5% increase in cost of goods sold and services ($350.9m to $367.9m)
Primarily due to increase in turnkey business that resulted to higher direct material cost, increase salary
wage of direct labor of Singapore/China and higher manufacturing overhead due to unutilized capacity of
both facility and machinery in Philippine plant.
14% increase in operating expenses ($35.2m to $40.2m)
rd
Brought about by the one-time expenses of the 3 ESOWN tranche, provision for unsettled insurance
claim and accruals for expenses related to due diligence.
38% decrease in net finance and other Income ($5.7m to $3.6m)
Attributable to the significant one-time gain from insurance recovery recognized in 2009.
32% Decrease in provision for income tax ($5.0m to $3.4m)
Attributable to the transfer pricing scheme made between China, Singapore and Hong Kong related
transactions.
67% increase in other comprehensive income ($32.9m to $55.1m)
Came from increase in the fair value of club shares classified as available-for-sale financial assets.
601% decrease in Minority Interest ($64.7k to $-324.3k)
Due to last quarter net loss of PSi Technologies Inc. a newly acquired company
Balance Sheet items - December 31, 2010 versus December 31, 2009)
29% decrease in Cash and cash equivalents ($53.9m to $38.1m)
Represents spending for working capital requirements, capital expenditure (set up of new production lines
for new projects and replacement of equipment damaged in Cebu fire), release of dividends to
stockholders, and payment of loans.
15% increase in Loans and receivables-net ($95.8m to $109.9m)
Due to higher sales from Singapore/China operation and from newly acquired company
72% increase in Inventories-net ($31.9m to $54.7m)
Due to the increase in volume and materials lead time requirement of China turnkey businesses.
100% increase in Derivative assets ($0 to $1.7m)
Mainly due to market to market of derivative instruments on call/put option of acquired company and
simple forward contracts.
53% increase in other current assets ($1.6m to $2.5m)
Represents prepayments made by Philippine site and tax credits of China sites.
18% increase in Property, plant and equipment ($63.1m to $74.6m)
Substantially represents acquisition of machinery and facilities equipment related to the set up of new
production lines for new projects, replacement of equipment destroyed in Cebu fire in 2009 and additional
machinery and equipment from newly acquired company.
21% increase in Goodwill ($46.2m to $55.7m)
Additional goodwill derived from newly acquired company.
67% decrease in Intangible assets ($2.9m to $0.9m)
Amortization during the period of intangible asset accounts.
32
24% increase in Available-for-sale financial assets ($309k to $383k)
Represents increase in fair value of club shares classified as available-for-sale financial assets.
67% decrease in Noncurrent receivables ($559k to $184k)
Largely due to payment of monthly accounts receivable billable items and the balance reclassed to current
portion of receivable maturing within one year.
6% increase in Deferred income tax assets ($109k to $115k)
Refers to unutilized business losses and capital allowances of Singapore/China subsidiaries that can be
deductible in the future for tax purposes.
47% decrease in Other noncurrent assets ($2.8m to $1.5m)
Due to reclassification to cash and cash equivalents of two-year time deposits maturing within the next
twelve months.
27% increase in Accounts payable and accrued expenses ($83.2m to $76,512)
Mainly due to the additional accounts payables from new acquisition.
100% increase in Current portion of long-term debt ($8.0m to $38.0m)
Represents reclassification of long-term debt maturing within one year
678% increase in Loans payable ($3.3m to $17.9)
Mainly due to availment of additional $15 million loans of Philippine site
100% increase in Derivative liabilities ($0 to $3.8m)
Mainly due to market to market of derivative instruments on call/put option of acquired company.
30% decrease in Income tax payable ($3.3m to $2.3m)
Largely due to payment of taxes by China sites.
100% decrease in Provisions ($44k to $0)
Reversal of provisions made for warranty and restructuring.
100% increase in Deferred Revenue ($0 to $2.6m)
Represents advance payment on the subcontracting services to be rendered by our newly acquired
company to one of its major customer
100% increase in Pension liability ($0 to $986k)
Due to retirement fund pension liability of newly acquired company
4,375% increase in Accrued rent ($2,302 to $6,262)
Operating lease on acquired company with escalating rental payments
99% decrease in Long-term debt ($38.0m to $0.4m)
Reclassification of long-term debt to current portion of long-term debt maturing within one year.
62% decrease in Obligation under finance lease ($315k to $118k)
Payment of regular monthly rentals of lease agreement classified as finance lease.
23% increase in Capital stock - common ($20.3m to $24.8m)
From declaration of stock dividends.
33
12% decrease in Subscribed capital stock ($2.2m to $1.9m)
Largely due to payment made on subscriptions
14% increase in Additional paid-in capital ($30.5m to $34.6m)
Primarily due to issuance of ESOWN third tranche and accretion of subscriptions receivable.
12% increase in Subscriptions Receivable ($10,153 to $11,767)
Due mainly from issuance of ESOWN third tranche and accretion of subscriptions receivable.
33% decrease in Retained earnings: Appropriated ($60.7m to $40.7m)
Reclassification of Appropriated Retaining Earnings of $20M to Unappropriated Retained Earnings
41% increase in Retained earnings: Unappropriated ($37.5m to $52.7m)
Declaration of cash and stock dividends and reversal of Appropriated to Unappropriated Retained
Earnings
97% increase in Reserve for fluctuation on available-for-sale financial assets ($57k to $112k)
Represents changes in the fair values of the Company’s investments in club shares.
432% increase in Non-controlling interest in a consolidated subsidiary ($292k to $1,554k)
Due to net loss in fourth quarter of the newly acquired company with ownership of 55.78%
Item 7. Financial Statements and Supplementary Schedules
Please see attached Exhibit 1.
Item 8. Changes in and Disagreements with Accountants on Accounting and Financial Disclosure
The accounting policies adopted in the preparation of the consolidated financial statements are consistent
with those of the previous financial year except for the adoption of the following new and amended
standards and interpretations as of January 1, 2011:
•
PAS 24 (Amended), Related Party Transactions
The amendments clarify the definition of a related party. The new definitions emphasize a
symmetrical view of related party relationships and clarify the circumstances in which persons and
key management personnel affect related party relationships of an entity. In addition, the new
amendment introduces an exemption from the general related disclosure requirements for
transactions with government and entities that are controlled, jointly controlled or significantly
influenced by the same government as the reporting entity.
•
PAS 32, Financial Instruments: Presentation (Amendment) - Classification of Rights Issues
The amendment to PAS 32 amended the definition of a financial liability to enable entities to
classify rights issues and certain options or warrants as equity instruments. The amendment is
applicable if the rights are given pro rata to all of the existing owners of the same class of an
entity’s non-derivative equity instruments, to acquire a fixed number of the entity’s own equity
instruments for a fixed amount in any currency.
•
Philippine Interpretation IFRIC 14 (Amendment), Prepayments of a Minimum Funding
Requirements
34
The amendment of the interpretation removes an unintended consequence when an entity is
subject to minimum funding requirements and makes an early payment of contributions to cover
such requirements. The amendment permits a prepayment of future service cost by the entity to
be recognized as a pension asset.
Philippine Interpretation IFRIC19, Extinguishing Financial Liabilities with Equity Instruments
•
The interpretation clarifies that equity instruments issued to a creditor to extinguish a financial
liability qualify as consideration paid. The equity instruments issued are measured at their fair
value. In case that this cannot be reliably measured, the instruments are measured at the fair
value of the liability extinguished. Any gain or loss is recognized immediately in profit or loss.
Information on Independent Public Accountant
a.
The principal accountants and external auditors of the Company is the accounting firm of SyCip,
Gorres, Velayo & Company (SGV & Co.). The same accounting firm is being recommended for
re-election at the scheduled annual stockholders’ meeting.
b.
Pursuant to the General Requirements of SRC Rule 68, Par. 3 (Qualifications and Reports of
Independent Auditors), the Company has engaged SGV & Co. as external auditor of the
Company, and Ms. Josephine Adrienne A. Abarca has been the Partner In-Charge effective audit
year 2009.
c.
Changes in and disagreements with accountants on accounting and financial disclosure.
The Company has engaged the services of SGV & Co. during the two most recent fiscal years.
There are no disagreements with SGV & Co. on accounting and financial disclosure.
External Audit Fees and Services
The Company paid or accrued the following fees, including VAT, to its external auditors in the past two
years:
2011
2010
Audit & Audit-related Fees
P 3.05M
P 3.7M
Tax Fees
-
Other Fees
P 0.22M
P 6.2M
SGV & Co. was engaged by the Company to audit its annual financial statements.
Tax fees
No tax consultancy services were secured from SGV & Co.
All other fees
In 2011, SGV & Co. billed the Company for an aggregate fee of P0.22M for the review of the Company’s
interim condensed consolidated financial statements for the period March 31, June 30 and September 30,
2011 in connection with the Company’s compliance to SEC Form 17-Q.
In 2010, SGV & Co. billed the Company for an aggregate fee of P6.2M for the following services:
i.) Financial and Tax due diligence review services for the acquisition of PSi Technologies Inc.
35
ii)
Assist in the development and implementation of an Enterprise Risk Management Program.
iii) Preparation of Long Form Report and review of financial statements translated to peso related to the
Company’s increase in authorized capital stock and application of stock dividend.
The Company’s Audit Committee (composed of Hiroshi Nishimura, Chairman, Rafael Ma. C. Romualdez
and Jaime P. Villegas) recommended to the Board the appointment of SGV & Co. as its external auditor
and the fixing of the audit fees. Likewise, the other services rendered by SGV & Co. were approved by the
Board upon the recommendation of the Audit Committee. The Board then recommends to the
stockholders, for their approval, the said recommendation.
PART III - CONTROL AND COMPENSATION INFORMATION
Item 9. Directors and Executive Officers of the Issuer
The write-ups below include positions held by the directors and executive officers currently and during the
past five years and their personal circumstances as of December 31, 2011.
Board of Directors
Jaime Augusto Zobel de Ayala
Fernando Zobel de Ayala
Arthur R. Tan
Diosdado P. Banatao
Jose Ignacio A. Carlos
John Eric T. Francia
Alelie T. Funcell
Delfin C. Gonzalez, Jr.
Delfin L. Lazaro
Hiroshi Nishimura
Rafael Ma. C. Romualdez
Chairman of the Board of Directors
Director
Director, President & Chief Executive
Officer
Independent Director
Director
Director
Independent Director
Director
Director
Independent Director
Director
Jaime Augusto Zobel de Ayala, Filipino, 52, has served as Chairman of the Board of Directors of IMI
since 1995. He also holds the following positions: Chairman and CEO of Ayala Corporation; Chairman of
Globe Telecom, Inc. and Bank of the Philippine Islands; Co-Vice Chairman of Mermac, Inc., and Ayala
Foundation, Inc.; Director of Ayala Land, Inc., Manila Water Company, Inc., BPI PHILAM Life Assurance
Corp., Alabang Commercial Corporation, and Ayala International Pte Ltd.; Chairman of Harvard Business
School Asia-Pacific Advisory Board, World Wildlife Fund Philippine Advisory Council and Children’s Hour
Philippines, Inc.; Vice Chairman of the Asia Business Council; Co-Vice Chair of the Makati Business Club;
Member of Harvard University Asia Center Advisory Committee; Member of the Mitsubishi Corporation
International Advisory Committee, JP Morgan International Council, The Asia Society, International
Business Council of the World Economic Forum, Pacific Basin Economic Council, Philippine Economic
Society and Toshiba International Advisory Group; and Member of the Board of Trustees of the
Eisenhower Fellowships, and the Singapore Management University.
Fernando Zobel de Ayala, Filipino, 51, has served as a director of IMI since 1995. He also holds the
following positions: President and Chief Operating Officer of Ayala Corporation; Chairman of Ayala Land,
Inc., Manila Water Company, Inc., Alabang Commercial Corp., Ayala DBS Holdings, Inc., AC International
Finance Limited and Ayala International Pte, Ltd.; Co-Vice Chairman of Ayala Foundation, Inc. and
Mermac, Inc.; Board Member of Globe Telecom, Inc., Bank of the Philippine Islands, Asiacom Philippines,
Inc.; Member of The Asia Society, World Economic Forum, INSEAD East Asia Council and World
36
Presidents’ Organization; Vice Chairman of Habitat for Humanity International and the chairman of the
steering committee of Habitat for Humanity's Asia Pacific Capital Campaign; a member of the Board of
Directors of Caritas Manila, Kapit Bisig para sa Ilog Pasig Advisory Board, Pilipinas Shell Corporation and
Pilipinas Shell Foundation.
Arthur R. Tan, Filipino, 52, is a member of the Board of Directors of IMI since 2001. He has been the
President and Chief Executive Officer of IMI since 23 April 2002. Concurrently, he is the President and
Chief Executive Officer of PSi Technologies Inc., the President of Speedy-Tech Electronics Ltd., and
Chairman of the Board of Speedy-Tech Philippines, Inc.
Diosdado P. Banatao, American, 65, has been an independent director of IMI since 31 January 1994 up
to the present. He has been a Managing Partner of Tallwood Venture Capital, a venture capital firm, since
July 2000. Prior to forming Tallwood, he was a venture partner at Mayfield Fund from January 1998 to
May 2000. He co-founded three technology start-ups: S3 Incorporated (SBLU), Chips and Technologies
(INTC) and Mostron. He also held positions in engineering and general management at National
Semiconductor Corporation, Seeq Technologies and Intersil Corporation. He currently serves on the board
of directors at Ikanos Communications. He previously served as Chairman and led investments in SiRF
Technology, acquired by CSR (CSR); Marvell Technology Group (MRVL), Acclaim Communications,
acquired by Level One (INTC); Newport Communications, acquired by Broadcom (BRCM), Cyras
Systems, acquired by Ciena (CIEN), and Stream Machine, acquired by Cirrus Logic (CRUS). He has also
served on the board of directors of various privately held companies in the semiconductor industry.
Jose Ignacio A. Carlos, Filipino, 42, has been a Director of IMI since 2007 up to the present.
Concurrently, he is the President of Polymer Products Philippines, Inc. and AVC Chemical Corporation.
He is also a member of the Board of Directors of Resins, Inc., Riverbanks Development Corporation and
Mindanao Energy Systems, Inc.
John Eric T. Francia, Filipino, 40, is a Director of IMI since July 2010. He is a Managing Director and a
member of the Management Committee of Ayala Corporation since January 2009. He is the Head of
Ayala’s Corporate Strategy and Development Group, which is responsible for overseeing Ayala’s portfolio
strategy and new business development. He is also holds the following positions: President of AC Energy
Holdings, Inc., which is Ayala’s holding company for its investments in the power sector; Director of Manila
Water Company, LiveIt Investments Ltd., Integreon Managed Solutions (Philippines), Inc., and AC Energy
Holdings, Inc. Prior to joining Ayala, Mr. Francia was a senior consultant and member of the management
team of Monitor Group, a strategy consulting firm based in Cambridge, Massachusetts, USA. Prior to
consulting, he spent a few years in the field of academe and media.
Alelie T. Funcell, Filipino, 55, has been an independent director of IMI since April 2010 up to the present.
She is the Founder, CEO, and President of Renewable Energy Test Center. She served as Chief
Operating Officer and Senior Vice President of Quality at Solaria, Inc., a manufacturer of Concentrator
Photovoltaic products and Vice President of Supplier Management and Manufacturing Operations of
Xilinx, Inc., a billion dollar semiconductor company. Prior to Xilinx, she also worked in several
semiconductor companies, including Intel, IDT and Silicon Systems. She is credited with numerous
patents in the Semiconductor Packaging and Solar Industry. She is twice a recipient of the prestigious
S.C. Valley YWCA "Tribute to Woman in the Industry" (TWIN) Award in 1994 while at IDT and in 2000
while at Xilinx. She was President of the Filipino-American Association of Milpitas, California in 1994 to
1996, a very active Bay area Filipino organization. Recently, she received an award from the FWN, as one
of the 100 Most Influential Filipina Women in the United States in 2009.
Delfin C. Gonzalez, Jr., Filipino, 62, joined the IMI board in July 2010 and became a member of the IMI’s
Finance Committee. He is the Chief Financial Officer of Ayala Corporation and is also a member of its
Management Committee and Finance Committee. He joined Ayala Corporation in late 2000, assigned as
Chief Finance Officer for its subsidiary, Globe Telecom, Inc. until early 2010. He also holds the following
positions in various companies of the Ayala Group: Chairman and President of Water Capital Works, Inc.,
and Azalea Technology Investments, Inc.; Chairman of Darong Agricultural Development Corporation and
AYC Finance Ltd.; and Director of A.C.S.T Business Holdings, Inc., AC International Finance, Ltd.,
37
Asiacom Philippines, Inc., Ayala Aviation Corporation, AYC Holdings Ltd., Michigan Holdings, Inc., AC
Energy Holdings, Inc., MPM Noodles Corporation, LiveIt Investments, Ltd., Azalea International Venture
Partners Ltd., Ayala Automotive Holdings Corp., Honda Cars Makati, Inc., Isuzu Automotive Dealership,
Inc., and various Ayala international companies.
Delfin L. Lazaro, Filipino, 65, has been a director of IMI since 02 May 2000. He holds the following
positions: Chairman of Philwater Holdings Company, Inc., Atlas Fertilizer & Chemicals, Inc., Chairman and
President of Purefoods International, Ltd. and A.C.S.T. Business Holdings, Inc.; Director of Ayala
Corporation, Globe Telecom, Inc., Ayala Land, Inc., Manila Water Co., Inc., Ayala DBS Holdings, Inc., AC
Energy Holdings, Inc., Ayala International Holdings, Ltd., Bestfull Holdings Limited, AG Holdings, AI North
America, Inc., Probe Productions, Inc. and Empire Insurance Company; and Trustee of Insular Life
Assurance Co., Ltd.
Hiroshi Nishimura, Japanese, 59, has been an independent director of IMI since April 2010 up to the
present. He is the Chairman and President of Linkwest International Consultancy Services, Inc. He also
serves as a Consultant to the Jesus V. Del Rosario Foundation, Inc. and a Senior Adviser of Device
Dynamics Asia Philippines, Inc. He served as President of Panasonic Communications Philippines
Corporation (PCP), formerly known as Kyushu Matsushita Electronics Philippines (PKME) from 20002007.
Rafael Ma. C. Romualdez, Filipino, 48, has been a Director of IMI since 1997 up to the present. He is
presently a Director of Resins, Incorporated, RI Chemical Corporation and Claveria Tree Nursery, Inc.;
and Chairman of the Philippine Iron Construction and Marine Works, Inc., Pigmentex Incorporated, Pacific
Resins, Inc., and MC Shipping Corp.
Nominees to the Board of Directors for election at the stockholders’ meeting:
All the above incumbent directors.
Management Committee Members / Key Executive Officers
* Jaime Augusto Zobel de
Chairman of the Board
Ayala
President & Chief Executive Officer
* Arthur R. Tan
** Jerome S. Tan
Chief Financial Officer
** Linardo Z. Lopez
Senior Managing Director, Global Head of Materials and Supply Chain
** Shong Cheng Yeh
Senior Managing Director- COO Asia
** Andrew C. Carreon
Managing Director, Chief Information Officer and COO of PSi
Technologies, Inc.
Jeremy G. Cowx
Managing Director, Sales Director
** Michael R. Hansson
Managing Director, Chief Technology Architect for Test & Systems
Development
Lucrecio B. Mendoza
Managing Director, Head of Test and Systems Development and Value
Engineering
Mary Ann S. Natividad
Managing Director- Global Head of Key Accounts Management
** Timothy Patterson
Managing Director – USA and Global Head of Advanced Manufacturing
Engineering
** Melita R. Tomelden
Managing Director, Global Head of Quality & Reliability
Reynaldo N. Torda
Managing Director – Head of Operations – PSi Technologies, Inc.
Monina S. Lasala
Vice President, Global Head of Human Resources
Rafael Nestor V. Mantaring
Vice President, Head of Design and Development
Jaime G. Sanchez
Vice President, Deputy CFO and Group Controller
** Olaf Gresens
Global Head of Sales and Marketing
Joselito B. Bantatua
Assistant Vice President, General Manager- Jiaxing
Fernandel I. Evangelista
Assistant Vice President, Energy Solutions
Dominador P. Leonida III
Assistant Vice President, Deputy Head of Test and Development System
38
Geronimo B. Magsombol
Jawaharlal K. Milanes
Anthony Raymond P.
Rodriguez
Mario Bernardo N. Santos
Assistant Vice President, Plant Engineering Head
Assistant Vice President, General Manager-Laguna 1
Assistant Vice President, Head – Treasury & Credit
Sheila Marie U. Tan
Christian Gerard P. Castillo
Corporate Secretary
Assistant Corporate Secretary
Assistant Vice President, General Manager-Laguna 2
* Members of the Board of Directors
** Management Committee members
Jerome S. Tan, Singaporean, 50, is the Chief Financial Officer of IMI. He oversees Finance, Treasury,
Credit, Controllership and ICT functions of the IMI global operation. He brings more than 20 years of
broad-based experience and various achievements in finance, strategic planning, business development
and acquisition/integration. He has assumed regional leadership roles in multinational Banking and
Finance companies, and Food and Beverage industry located in different regions in the Asia Pacific. Prior
to joining IMI, he was connected with NBC Universal, the media unit of General Electric Corporation by
serving as the CFO of the TV Group and was responsible for the overall Finance function in Asia Pacific
for CNBC and Universal Network. He was also a key member of the management team of San Miguel
Brewing International Ltd., managing Treasury and Financial Planning, and Regional Business Planning
and Development. Before his exposure in the food and beverage industry, he was an Assistant Director in
First Pacific Bank Asia, Ltd., in Hong Kong. He started his career as an Associate in Robert Fleming, Inc.,
in New York City, USA.
Linardo Z. Lopez, Filipino, 54, joined IMI as Senior Managing Director and Global Head of Materials and
Supply Chain in March 2008 and has served as such up to the present. He spent a significant part of his
career in OEM and contract manufacturing industries, notably with industry leaders such as Solectron and
Flextronics in China.
Shong Cheng Yeh, Malaysian, 42, is currently Senior Managing Director, COO Asia of IMI. He brings with
him over 14 years of experience in electronics manufacturing. Prior to IMI, he was the General Manager
for Asian Operations in the Infrastructure Global Manufacturing business of Flextronics overseeing China,
Malaysia and India.
Andrew C. Carreon, Filipino, 48, has been the Chief Information Officer of the IMI Group since 2003 up
to the present and brings extensive experience in business process improvement and re-engineering as
well as design and implementation of corporate management information systems. Concurrently, he is the
Chief Operating Officer of PSi Technologies Inc. Prior to joining IMI, he was a Director of ICT at American
Microsystems Philippines with global responsibility for back-end manufacturing systems. He also worked
as a Systems Integration Consultant for Digital Equipment Corporation. He has been the Chairman of the
Association of SEIPI IT Executives and Professionals (ASITEP) for two consecutive terms.
Jeremy G. Cowx, Canadian, 40, Managing Director and Sales Director of IMI. He is responsible for
overseeing the IMI-Japan office and all sales activities for IMI in Japan. He is a certified Six Sigma
Champion. His professional background is in Business Development, Sales and Marketing and Account
Management for plastics, semiconductor and technology companies.
Michael R. Hansson, Swedish, 43, has been the Managing Director, Chief Technology Architect for Test
& Systems Development of IMI since August 2006. He successfully built a technical consulting business
providing customized function testers, handlers and automated optical inspection machines to the
electronics and semiconductor industry in the Philippines. He has gained over 20 years of experience in
developing hardware and software products, including 5 years with Timex where he co-designed products
like the Timex/Microsoft Datalink watch.
39
Lucrecio B. Mendoza, Filipino, 55, is a Managing Director and Head of Test & Systems Development
and Value Engineering of IMI. He has set up Eazix, Inc. for IMI in 1998 and has led its product design
services until he moved to IMI with the acquisition of Electronic Assemblies, Inc. He was then the Head of
Engineering for 8 years covering Process Engineering, Equipment Engineering and Test Engineering. He
held the positions of Head of Quality and ICT in concurrent capacity.
Mary Ann S. Natividad, Filipino, 44, is Managing Director and currently the Global Head of Key Accounts
Management in Singapore. Previous to this, she was the Country Business Unit Director in charge of
Singapore Philippine’s turnkey business operations. She has over 21 years experience in the electronics
industry. She was Business Unit Head for Turnkey Operations since 2004. She moved to IMI with the
absorption of Electronics Assemblies, Inc. (EAI) and joined IMI’s Program Management Group in 2002.
She has handled different functions including Materials Management and Production Planning and
Control. Her work stint includes being a Production Manager at Pricon Microelectronics Inc.
Timothy Patterson, American, 59, is the Country Managing Director in USA and the Global Managing
Director for Advanced Manufacturing Engineering. He brings more than 20 years experience in
semiconductor assembly including hybrid and integrated circuit packaging, chip on board, flip chip on flex
and stacked chips. He was responsible for the first SMT production line in the United States while working
for Western Digital, and the first production flip chip on organic substrates line in the world while working
for Smartflex Systems. He holds 12 patents and has published over a dozen articles in trade magazines,
conferences and seminars.
Melita R. Tomelden, Filipino, 55, is currently the Managing Director, Global Head for Quality & Reliability
of IMI. She is responsible for developing and institutionalizing quality and reliability standards and
processes for IMI’s contract manufacturing and turnkey manufacturing operations. She brings over 25
years in manufacturing operations, 22 years of which were spent in quality management in leading
semiconductor and electronics companies like Philips Semiconductors, Telefunken-Temic, Fastech,
Stanford Microsystems and Deltron-Sprague Electronics. She is a certified assessor of the European
Foundation for Quality Management and a corporate member of the American Society for Quality Control.
Reynaldo N. Torda, Filipino, 56, is currently the Country Managing Director in the Philippines and Head of
Operations of Psi Technologies, Inc. He has 30 years of professional experience from leading companies
in the semiconductor and EMS industries such as Amkor Anam, American Microsystems Inc, AME and 35 Systems. He rose from the ranks and held progressively responsible positions in Manufacturing and
Engineering, including Technical Director, Vice President for Operations and General Manager. Prior to
IMI, he was the Philippine General Manager of 3-5 Systems Pacific, Inc., a publicly listed company in
Displays and Electronics Manufacturing Services. He was responsible for securing the company’s ISO
9002, EMS 14000, QS9000, TS16949 and ISO 9000-2000 certifications.
Monina S. Lasala, Filipino, 45, is the Global Head for Human Resources. Prior to joining IMI in 2011, she
was the head of HR of the three core businesses of the SM Group including its subsidiaries (SM Property,
SM Investments and SM Hotels) as Vice-President for Human Resources and Administration where she
was responsible for setting-up the organizational structure of all three core businesses. She brings with
her more than 20 years of HR experience and has played strategic and tactical roles in Training &
Development, Labor Relations, Talent Acquisition, Employee Engagement & Communications, Employee
Relations & Welfare, and Compensation & Benefits. Her career in HR started in PHINMA Group of
Companies where she rose from the ranks and eventually became the Assistant Human Resources
Director of Union Cement (now HOLCIM). She joined The Peninsula Manila for five (5) years as Director
for Human Resources after holding HR Head positions from multi-national hotel establishments in the
country.
Rafael Nestor V. Mantaring, Filipino, 55, is the Vice President for Design and Development in the
Philippines. He heads the Research and Development Group in the Design and Engineering Services
group of IMI. He has over 27 years of combined experience in the academe and in the industry. Prior to
joining IMI, he was the President and General Manager of Rohm LSI Design Philippines, a Japaneseowned technology company involved in design and development of integrated circuits.
40
Jaime G. Sanchez, Filipino, 56, is currently the Deputy CFO and Group Controller of IMI. He has worked
with different Ayala companies for more than thirty (30) years including twelve (12) years at IMI. He was
also assigned as OIC – Chief Financial Officer of IMI starting August 2010 up to early part of 2011. He
brings with him solid professional experience from his stints in FGU, BPI-MS and Universal Reinsurance.
Olaf Gresens, German, 43, has been the Global Head of Sales and Marketing IMI since July 2009. He is
responsible for overseeing the Sales function in all locations where IMI has presence including the office
in Japan which is now officially designated as IMI’s Satellite Sales Office. He brings with him over 15 years
of experience in the areas of design engineering, field applications engineering and sales. Prior to joining
IMI, he spent six years at AMI Semiconductor as Field Applications Engineering Manager.
Joselito S. Bantatua, Filipino, 41, is the General Manager for Jiaxing. Prior to his assignment as
Automotive GM, he was assigned in China to oversee Engineering operations in Shenzhen sites for more
than a year. He started his career in IMI as an Equipment Engineer in 1995. From then on, he has
assumed various roles and rank that made him become a Senior Division Manager. His exposure was
mostly on defining and resolving issues involving machine maintenance/operation, technical manpower
and financial concerns for effective cost management.
Fernandel I. Evangelista, Filipino, 48, is the General Manager for Energy Solution. He joined IMI in 1991
as a Production Supervisor and has since handled and been appointed to various positions in
Manufacturing such as Manufacturing Supervisor, Production Manager, Division Manager, Manufacturing
Engineering Head and BU Group Head. He is currently assigned as the Site General Manager of our
Fremont operations in the US. Prior to joining IMI, Knoll worked with Printed Circuit International
Philippines. He also worked with Mabuhay Electronics.
Dominador P. Leonida III, Filipino, 49, is currently the Assistant Vice President and Deputy Head for Test
and Development Systems. He handles business process improvements, organizational development,
expansion plans and various innovation initiatives. He has a solid track record in technology transfer, the
incubation of new products, and delivery of high value-add engineering services. With over ten years’
experience in managing research and development and engineering organizations, he has assumed
various positions in operations and engineering including test engineering, test hardware development,
test process engineering and equipment engineering for the Flash semiconductor memory group at Intel.
Before joining IMI, he was with Intel Corporation (and its subsidiary Numonyx B.V.) as Senior Design
Engineering Manager handling the operations of the Cavite Design Center. He was also responsible for
the start-up and expansion of the VLSI design engineering operations in the Philippines.
Geronimo B. Magsombol, Filipino, 53, is currently an Assistant Vice President and Plant Engineering
Head of IMI. He started at IMI in 1997 and has been with the Company for more than thirteen (13) years.
Prior to IMI, he worked for Amerton Inc. as Facilities Manager and for Cypress Semi-Conductor as
Facilities Director.
Jawaharlal K. Milanes, Filipino, 41, is the General Manager for Laguna 1 Operations. He was the
Business Unit (Philippines) for Turnkey Business. Prior to this assignment, he was assigned in Jiaxing.
China for one year to oversee all the Business Operations function for Strategic Accounts while
concurrently overseeing the same function for the 3Cs group also in the Philippines. He joined IMI in 1997
as a Production Manager and has since appointed to different positions such as Quality and Training
Manager, Business Unit Manager and Marketing Manager. Prior joining IMI, He worked with Temic
(Telefunken) Microelectronics, Inc as a Production Section Manager.
Anthony Raymond P. Rodriguez, Filipino, 44, is an Assistant Vice President and Head of Treasury and
Credit of IMI since 2009. Prior to IMI, he has gained nineteen (19) years of extensive professional
experience from Banco de Oro – EPCI Bank as Senior Dealer –FX and Derivatives Desk and from Far
East Bank & Trust Co. as International Desk Head for Treasury Marketing.
41
Mario Bernardo N. Santos, Filipino, 44, is the General Manager for Laguna 2 Operations. Prior to this
assignment, he was the Business Unit Group Head in charge of the Business Operations function for
Custom Business. He joined IMI in 1992 as a Product Development Engineer under the Marketing
Department. He later on handled different positions such as Marketing Specialist, Marketing Manager and
Corporate Sales Manager. He was also assigned as Director for IMI Japan in 2007 and was recalled to
the Philippines and was appointed Business Group Head for Custom Group. Prior joining IMI, he worked
with RG Meditron Inc. as a Research and Development Engineer.
Sheila Marie U. Tan, Filipino, 44, is the Corporate Secretary of Integrated Micro-Electronics, Inc since
June 2011. Currently, she also holds the Position of Corporate Secretary of Cebu Holdings, Inc., Cebu
Property Ventures & Development Corp., Ayala Theatres Management, Inc. Avida Land Corporation,
Alabang Commercial Corporation, North Triangle Depot Commercial Corporation, Laguna Technopark,
Inc, Makati Development Corporation and Ayala Property Management Corporation. She is also the
Assistant Corporate Secretary of Ayala Corporation and Ayala Land, Inc. She was the former head of the
Legal Department of Ayala Land, Inc. She transferred to Ayala Corporation as Associate Director
effective January 1, 2009.
Christian Gerard P. Castillo, Filipino, 32, has served as Assistant Corporate Secretary of Integrated
Micro-Electronics, Inc. since June 2011. He is a Senior Counsel of Ayala Group Legal and Division
Manager of Ayala Land, Inc. (ALI) He handles various corporate secretarial functions for affiliates of
Integrated Micro-Electronics, Inc., international holding companies of Ayala Corporation, and leisure,
residential and leasing companies of ALI. Prior to joining ALI in 2008, he was associated at SyCip,
Salazar, Hernandez & Gatmaitan Law Offices.
Significant Employees
The Company considers as significant its entire work force. Everyone is expected to work together as a
team to achieve the Company’s goals and objectives.
Family Relationships
Jaime Augusto Zobel de Ayala, Chairman of the Board, and Fernando Zobel de Ayala, a director of the
Company, are brothers.
There are no known family relationships between the current members of the Board and key officers other
than the above.
Involvement in Legal Proceedings
There are no material pending legal proceedings, bankruptcy petition, conviction by final judgment, order,
judgment or decree or any violation of a securities or commodities law for the past five years and the
preceding years until January 31, 2012 to which the Company or any of its subsidiaries or its directors or
executive officers is a party or of which any of its material properties are subject in any court or
administrative government agency. In any event, below is the legal proceeding involving the Company
that may be significant:
IMI filed a civil case on April 11, 2011 against Standard Insurance (“Standard”) seeking to collect
Standard’s share in the loss incurred by IMI consisting in damage to production equipment and
machineries as a result of the May 24, 2009 fire at IMI’s Cebu facility which IMI claims to be covered by
Standard’s “Industrial All Risks Material Damage with Machinery Breakdown and Business Interruption”
policy. The share of Standard in the loss is 22% or US $1,117,056.84 after its co-insurers all paid.
IMI had to resort to court action after Standard denied its claim on the ground that this is an excepted peril.
42
Standard filed a motion to dismiss on various grounds, such as lack of cause of action and of prescription.
The RTC denied the motion to dismiss but Standard filed a Motion for Reconsideration, which is pending
resolution.
Item 10. Executive Compensation
Name and Principal Position
Arthur R. Tan
President & Chief Executive
Officer
Jerome S. Tan
Global Chief Financial Officer
Linardo Z. Lopez
Senior Managing Director, Global
Materials and Supply Chain
Shong Cheng Yeh
Senior Managing Director, COO
Asia
Andrew C. Carreon
Managing Director, Chief
Information Officer and COO of
PSi Technologies, Inc.
Jeremy G. Cowx,
Managing Director, Sales Director
Michael R. Hansson
Managing Director, Chief
Technology Architect for Test &
Systems Development
Lucrecio B. Mendoza
Managing Director, Head of Test
and Systems Development and
Value Engineering
Mary Ann S. Natividad
Managing Director, Global Head
of Key Accounts Management
Timothy Patterson
Managing Director, USA and
Global Head of Advanced
Manufacturing Engineering
Melita R. Tomelden
Managing Director, Global Head
of Quality & Reliability
Reynaldo N. Torda
Managing Director, Head of
Operations of PSi Technologies,
Inc.
Monina S. Lasala
Vice President, Global Head of
Human Resources
Rafael Nestor V. Mantaring
Vice President, Head of Designs
and Development
Jaime G. Sanchez
Vice President, Deputy CFO and
Group Controller
Year
Salary
Other Income
43
Olaf Gresens
Global Head of Sales and
Marketing
Joselito B. Bantatua
Assistant Vice President, General
Manager-Jiaxing
Fernandel I. Evangelista
Assistant Vice President, Energy
Solutions
Dominador P. Leonida, III
Assistant Vice President, Deputy
Head of Test and Systems
Development
Geronimo B. Magsombol
Assistant Vice President, Plant
Engineering Head
Jawaharlal K. Milanes
Assistant Vice President, Plant
Engineering Head
Anthony Raymond P. Rodriguez
Assistant Vice President, Head of
Treasury & Credit
Mario Bernardo N. Santos
Assistant Vice President, General
Manager-Laguna 2
CEO & Other Named Executive
Officers
All officers as a group
unnamed
Actual 2010
Actual 2011
Projected 2012
Actual 2010
Actual 2011
Projected 2012
P
P
P
P
P
P
95.90 M
98.62 M
104.93 M
187.25 M
191.71 M
202.67 M
P 47.37 M
P 31.50 M
P 36.30 M
P 65.72 M
P 46.89 M
P 51.69 M
The Company has no other arrangement with regard to the remuneration of its existing directors
and officers aside from the compensation received as herein stated.
Compensation of Directors
Section 9 of Article IV of the By-laws provides:
“Section 9 - Each director shall be entitled to receive from the Corporation, pursuant to a
resolution of the Board of Directors, fees and other compensation for his services as director. The
Board of Directors shall have the sole authority to determine the amount, form and structure of the
fees and other compensation of the directors. In no case shall the total yearly compensation of
directors exceed five percent (5%) of the net income before income tax of the Corporation during
the preceding year. (as amended on February 23, 2011.)
xxx
The Chairman of the Board shall receive such remuneration as may be fixed by the Board
of Directors each year, in addition to the per diem and compensation that each Director may be
entitled to receive. (as amended on February 23, 2011.)”
44
i.
Standard arrangement
During the 2008 annual stockholders’ meeting, the stockholders ratified the resolution fixing the
remuneration of non-executive directors which the Board approved at its meeting on April 30, 2008,
as follows:
a. For each Director – P100,000.00 per diem per Board meeting actually attended;
b. For each Board Committee member – P20,000.00 per diem per Committee meeting actually
attended.
The executives who are members of the Board of the Company do not receive per diem. Their
compensation, as executives of the Company, is included in the compensation table indicated above.
ii.
Other arrangement
None of the directors, in their personal capacity, has been contracted and compensated by the
Company for services other than those provided as a director.
The Company has no other arrangement with regard to the remuneration of its existing directors and
officers aside from the compensation received as herein stated.
Item 11. Security Ownership of Certain Beneficial Owners and Management
1) Security ownership of certain record and beneficial owners (of more than 5%) as of January 31,
2012.
Title of
Class
Name, address of
Record Owner and
Relationship with Issuer
Common
AYC Holdings, Ltd.
33/F Tower One
Ayala Triangle,
Ayala Ave., Makati City
5
Ayala Corporation
34/F Tower One
Ayala Triangle
Ayala Ave., Makati City
7
Asiacom Philippines, Inc.
34/F Tower One
Ayala Triangle
Ayala Ave., Makati City
Preferred
Preferred
3
3
Name of Beneficial
Owner and
Relationship with
Record Owner
4
AYC Holdings, Ltd.
Ayala Corporation
6
Asiacom Philippines,
8
Inc.
Citizenshi
p
No. of
Shares
Held
Percent of
outstandin
g Shares
BVI
957,537,373
35.02%
Filipino
596,043,238
21.80%
Filipino
460,000,000
16.82%
AYC Holdings, Ltd. (AYC) is a stockholder of the Company.
The Board of Directors of AYC has the power to decide how AYC’s shares in IMI are to be voted.
5
The Chairman of Ayala Corporation (AC), Jaime Augusto Zobel de Ayala, is the Chairman of the Company.
6
The Board of Directors of AC has the power to decide how AC’s shares in IMI are to be voted.
7
The Chairman of Asiacom Philippines, Inc. (Asiacom), Jaime Augusto Zobel de Ayala, is the Chairman of the
Company.
8
The Board of Directors of Asiacom has the power to decide how Asiacom shares in IMI are to be voted.
45
4
Common
Preferred
PCD
Nominee
9
Corporation (Filipino)
37/F Tower One, The
Enterprise Center, 6766
Ayala Avenue cor. Paseo
de Roxas, Makati City
11
Resins, Inc.
E. Rodriguez Ave., Pasig
City
10
Filipino
239,412,304
8.76%
12
Filipino
219,979,398
8.05%
Resins, Inc.
Resins, Inc.
2) Security ownership of directors and management as of January 31, 2012.
Title of
Class
Directors
Common
Common
Common
Common
Name of Beneficial Owner
Jaime Augusto Zobel de
Ayala
Fernando Zobel de Ayala
Delfin L. Lazaro
Arthur R. Tan
Common
Rafael Ma. C. Romualdez
Common
Jose Ignacio A. Carlos
Common
Diosdado P. Banatao
Common
Delfin C. Gonzalez, Jr.
Common
Hiroshi Nishimura
Common
Alelie T. Funcell
Common
John Eric T. Francia
CEO and Most Highly Compensated Officers
Common
Arthur R. Tan
Common
Jerome S. Tan
Common
Common
Common
Preferred
Common
Common
Common
Common
Preferred
Common
Common
Common
Preferred
Common
Linardo Z. Lopez
Shong Cheng Yeh
9
Andrew C. Carreon
Jeremy G. Cowx
Michael R. Hansson
Lucrecio B. Mendoza
Mary Ann S. Natividad
Timothy Patterson
Melita R. Tomelden
Reynaldo N. Torda
Monina S. Lasala
Citizenship
Amount and Nature of
Beneficial Ownership
100
(direct)
Filipino
100
100
15,279,25
2
115
115
115
100
115
115
100
(direct)
(direct)
(direct
indirect)
(direct)
(direct)
(direct)
(direct)
(direct)
(direct)
(direct)
Filipino
Filipino
Filipino
15,279,25
2
0
(direct
indirect)
2,817,583
1,725,617
2,409,060
1,043,400
287,602
1.919.772
1,072,722
1,606,592
200,000
1,955,698
305,695
690,247
100,000
0
(indirect)
(indirect)
(indirect)
(direct)
(indirect)
(indirect)
(indirect)
(indirect)
(direct)
(indirect)
(indirect)
(indirect)
(direct)
&
Filipino
Filipino
American
Filipino
Japanese
Filipino
Filipino
&
Percent
of All
Class
0.0000%
0.0000%
0.0000%
0.5588%
0.0000%
0.0000%
0.0000%
0.0000%
0.0000%
0.0000%
0.0000%
Filipino
0.5588%
Singaporea
n
Filipino
Malaysian
Filipino
Canadian
Swedish
Filipino
Filipino
American
Filipino
Filipino
Filipino
0.0000%
0.1031%
0.0631%
0.0881%
0.0382%
0.0105%
0.0702%
0.0392%
0.0588%
0.0073%
0.0715%
0.0112%
0.0252%
0.0037%
0.0000%
The PCD is not related to the Company.
Resins, Inc. (Resins) is a customer of a participant of PCD. The Board of Directors of Resins has the power to
decide how Resins shares in IMI are to be voted.
11
Resins is not related to the Company.
12
The Board of Directors of Resins has the power to decide how Resins shares in IMI are to be voted.
46
10
Common
Common
Common
Common
Common
Common
Common
Common
Common
Rafael Nestor V. Mantaring
Jaime G. Sanchez
Olaf Gresens
Joselito B. Bantatua
Fernandel I. Evangelista
Dominador P. Leonida III
Geronimo B. Magsombol
Jawaharlal K. Milanes
Anthony Raymond P.
Rodriguez
Common
Mario Bernardo N. Santos
Other Executive Officers
Common
Sheila Marie U. Tan
Common
Christian Gerard P. Castillo
All Directors and Officers as a group
1,207,931
343,006
1,150,411
0
620,340
0
681,887
468,124
172,561
(indirect)
(indirect)
(indirect)
Filipino
Filipino
German
Filipino
Filipino
Filipino
Filipino
Filipino
0.0442%
0.0125%
0.0421%
0.0000%
0.0227%
0.0000%
0.0249%
0.0171%
0.0063%
0
Filipino
0.0000%
0
0
36,058,575
Filipino
Filipino
0.0000%
0.0000%
1.3189%
(indirect)
(indirect)
(indirect)
(indirect)
None of the members of the Company’s directors and management owns 2.0% or more of the
outstanding capital stock of the Company.
The Company knows of no person holding more than 5% of common shares under a voting trust or
similar agreement.
No change of control in the Company has occurred since the beginning of its last fiscal year.
Item 12. Certain Relationships and Related Transactions
As used herein and in other sections of this report, unless the context otherwise requires, IMI Group or the
Group refers to the Company and its subsidiaries where the Company has a control pursuant to SRC Rule
68, Par. 6 (Consolidated Financial Statements).
In the ordinary course of business, the Group transacts with its related parties. The transactions and
balances of accounts with related parties follow:
Related Party
Relationship Nature of Transaction
Bank of the Philippine
Islands (BPI)
Affiliate
AG Counselors
Affiliate
Corporation (AGCC)
Cash and cash
equivalents
Nontrade receivable
Nontrade payable
Derivative asset
Gains on derivatives
Interest income
Nontrade payable
Professional and service
fees
Balance Sheets
2011
2010
Statements of Comprehensive
Income
2011
2010
2009
$3,753,709 $2,029,657
201,726
70,504
33,262
1,698
1,317
15,283
−
−
−
−
$–
–
–
–
241,968
10,402
$–
–
–
–
95,540
11,938
$–
−
−
−
−
91,569
−
718
−
−
−
−
−
110,786
209,743
2,969
9,377
7,682
−
−
−
Technopark Land, Inc
(TLI)
Affiliate
Nontrade receivable
Innove Communications,
Affiliate
Nontrade payable
Postal and
communication
Building Rental
446
67,102
−
−
−
−
−
−
−
161,624
42,327
202,143
−
286,541
−
Nontrade payable
Postal and
communication
2,931
3,828
−
−
−
−
–
88,248
94,926
95,029
Inc. (ICI)
Globe Telecom, Inc. (GTI) Affiliate
47
a. As of December 31, 2011, the Parent Company has savings and current accounts and short-term
deposits with BPI amounting to $411,556 and $3,342,153, respectively. As of December 31, 2010,
the Parent Company has savings and current accounts and short-term deposits with BPI
amounting to $546,993 and $1,482,664, respectively. Total interest income earned from
investments with BPI amounted to $10,402, $11,938, and $91,569 in 2011, 2010 and 2009,
respectively.
b. As of December 31, 2011 and 2010, nontrade receivables from BPI pertain to retirement and
separation pay advanced by the Parent Company but is reimbursable from the trust fund with BPI.
c.
The Parent Company has outstanding housing and automobile financing loans from BPI
amounting to $33,262 and $1,698 as of December 31, 2011 and 2010, respectively, included in
“Employee-related payables” under “Accounts payable and accrued expenses”. The outstanding
housing and automobile financing loans arise from the differences in the timing of remittances by
the Parent Company to BPI and the period of withholding from employee salaries and wages.
d. The Parent Company has outstanding short-term foreign currency forwards with BPI amounting to
$1,317 and $15,283 as of December 31, 2011 and 2010, respectively.
e. As of December 31, 2011 and 2010, certain plan assets of the Parent Company under its
retirement fund with BPI are invested with its related parties (see Note 26).
f.
The Parent Company engages AGCC, an affiliate, for corporate secretarial services subject to a
monthly fee of P=40,000. As of December 31, 2011 and 2010, payable to AGCC amounted to nil
and $718, respectively. These are due and demandable.
g. The Parent Company has nontrade receivable from TLI, an affiliate, amounting to $9,377 and
$7,682 as of December 31, 2011 and 2010, respectively, which pertains to advances by the
Parent Company for various expenses incurred by TLI, primarily on real property taxes and
corporate secretarial services.
h. The Parent Company has nontrade payables to Innove Communications, Inc., an affiliate,
amounting to $446 and $67,102 as of December 31, 2011 and 2010, respectively, which pertains
to billings on building rental, leased lines, internet connections and ATM connections. These are
due and demandable. Related expense for 2011, 2010 and 2009, amounted to $203,951,
$202,143 and $286,541, respectively.
i.
As of December 31, 2011 and 2010, the Parent Company’s accounts payable to GTI, an affiliate,
amounted to $2,931 and $3,828 for the purchase of Blackberry software and billings for cellphone
charges and WiFi connections. These are due and demandable. Related expense for 2011, 2010
and 2009, amounted to $88,248, $94,926 and $95,029, respectively.
No other transaction was undertaken by the Company in which any Director or Executive Officer was
involved or had a direct or indirect material interest.
To date, there are no complaints received by the Company regarding related-party transactions.
48
PART IV – CORPORATE GOVERNANCE
Item 13. Corporate Governance
Good Governance at IMI. IMI is committed to the highest level of good governance throughout the
organization, as well as to fostering a corporate culture of integrity and empowering leadership.
This governance is anchored on the belief in a strong link between quality governance and the creation of
shareholder value and long-term growth.
In compliance with Securities and Exchange Commission (SEC) Memorandum Circular No.6, Series of
2009 (Revised Code of Corporate Governance), IMI submitted its revised Corporate Governance Manual
to the SEC in March 2011.
Board Structure and Process. IMI’s eleven-person Board of Directors primarily represents the
shareholders to whom it is accountable for creating and delivering value. Stockholders elect the directors
annually.
IMI has three independent directors. For this purpose, the company defines an independent director as
one having no interest or relationship with the company that may hinder his or her independence from the
company or management, which would interfere with the exercise of impartial judgment in carrying out the
director’s responsibilities.
The Board represents a mix of competencies, with each director capable of adding value and exercising
independent judgment. Meetings are held at least quarterly, or as often as necessary for the Board to
fulfill its role.
The Board has established committees to assist in exercising its authority, including monitoring the
performance of the business. Five committees support the Board in the performance of specific
functions and to aid in good governance: Executive, Compensation, Audit, Finance, and Nomination.
The Executive Committee (ExCom), in accordance with the authority granted by the Board, acts on such
specific matters within the competence of the Board of Directors as may occasionally be delegated to the
Executive Committee in accordance with the Corporation’s By-Laws, except with respect to any action
for which shareholders’ approval is also required, filling of vacancies on the Board or in the ExCom,
amendment or repeal of By-Laws or the adoption of new By-Laws, amendment or repeal of any
resolution of the Board of Directors, which by its express terms is not so amendable or repealable,
distribution of cash dividends, and the exercise of powers delegated by the Board exclusively to other
committees, if any.
The Compensation Committee establishes a formal and transparent procedure for developing a policy
on executive remuneration and for fixing the remuneration packages of corporate officers and directors.
It exercises oversight of the remuneration of senior management and other key personnel, ensuring that
compensation is consistent with the company’s culture, strategy, and control environment.
The Audit Committee oversees IMI’s internal control and financial reporting on behalf of the Board of
Directors.
The Finance Committee supervises the implementation of an enterprise-wide risk management program
and oversees major financial policies.
The Nomination Committee ensures that all nominees for directors for election at the annual
stockholders’ meeting have all the qualifications and none of the disqualifications of directors as stated in
49
the By-Laws and pertinent rules of the SEC. The committee also reviews the qualifications of all persons
nominated to positions requiring appointment by the Board.
Directors’ Compensation. Non-executive directors, defined as members of the Board of Directors who
are neither officers nor consultants of the Company, receive per diem of Php 100,000 for each Board
meeting attended, and Php 20,000 per Committee meeting attended. This remuneration scheme for
non-executive directors was ratified at the 2008 annual stockholders meeting.
Management. Management is primarily accountable to the Board of Directors for the operations of IMI.
It concretizes IMI’s targets and formulates the strategies to achieve these.
IMI has adopted the Balanced Scorecard (BSC) system as a means to set and achieve its strategic
objectives. This system has the following benefits: it translates an organization’s strategy into
measurable parameters, communicates the strategy to all members of the company, aligns individual
goals to the company’s strategic objectives, feedbacks implementation results to the strategic planning
process, and enables managers to monitor and adjust strategy implementation and make fundamental
changes to the strategy itself. The BSC system looks at four major perspectives of business: Learning
and Growth, Internal Business Processes, Customers, and Financial.
To further enhance its corporate governance infrastructure, IMI launched a group-wide enterprise risk
management program to ensure that risk management activities are consistently applied, integrated,
aligned and well-coordinated across the organization.
Accountability and Audit. The Audit Committee exercises oversight of the performance of external and
internal auditors. Its role and responsibilities are clearly defined in the Audit Committee Charter
approved by the Board of Directors. An Independent Director chairs the Committee.
IMI’s external auditor is Sycip, Gorres, Velayo & Company (SGV). The Audit Committee approves all
non-audit services conducted by SGV.
A separate Internal Audit Charter approved by the Audit Committee governs the internal audit function.
The Board designated a Compliance Officer who is responsible for ensuring adherence to the provisions
and requirements of IMI’s Corporate Governance Manual. He is also responsible for identifying,
monitoring, and controlling compliance risks.
Financial Reporting. IMI’s financial statements are prepared and presented in accordance with
Philippine Accounting Standards and Philippine Financial Reporting Standards, which comply with
International Accounting Standards. Speedy-Tech Electronics Ltd. and its subsidiaries’ financial
statements are audited by Ernst & Young Singapore.
Information on the Company’s financial instruments is accompanied by a presentation of the Company’s
risk management objectives and policies to allow for a better assessment of financial performance and
cash flows. Significant accounting judgments and estimates are also disclosed.
Disclosures. IMI updates the investing public with strategic, operating, and financial information through
adequate and timely disclosures filed with the SEC and the Philippine Stock Exchange (PSE). These
disclosures are readily available in the company’s website.
IMI complies with the periodic reportorial requirements of SEC and PSE and discloses major and
market-sensitive information such as dividend declarations, acquisitions, the sale and disposition of
significant assets, as well as other material information that may affect the decision of the investing
public.
50
Trading Blackouts. Key officers and covered persons are strictly prohibited from trading during the
following periods:
(a) Structured Disclosures: Ten (10) trading days before and three (3) trading days after the disclosure
of quarterly and annual financial results;
(b) Non-structured Disclosures: Three (3) trading days before and three (3) trading days after the
disclosure of any material information other than Item (a) above.
The Compliance Officer or his designate issues office bulletins for special blackout periods, pertaining to
the above.
The company strictly enforces compliance with these trading blackout periods, no reported violation in
2011.
Code of Conduct. IMI and its employees commit to live by the following values: Integrity, Customer
Focus, Concern for Others, and Excellence. IMI has adopted a Code of Conduct in line with the
Electronics Industry’s Code of Conduct. All IMI employees are expected to comply with this policy, which
outlines the standards to ensure that working conditions in the Company are safe, workers are treated
with respect and dignity, and the manufacturing processes are environmentally responsible. The Code
comprises five sections: Labor, Health and Safety, Environment, Management System, and Ethics.
Annually, all supervisors, engineers and managers are required to sign a declaration of compliance to
the Code of Conduct.
IMI operates in full compliance with the laws, rules and regulations of the countries in which it operates,
and recognizes international standards in order to advance social and environmental responsibility.
PART V - EXHIBITS AND SCHEDULES
Item 14. List of Exhibits/Schedules
2011 Audited Consolidated Financial Statements, Integrated Micro-Electronics, Inc. and
Subsidiaries – Exhibit 1
Statement of Management’s Responsibility for the Financial Statements
Report of Independent Auditors
Consolidated Balance Sheets as of December 31, 2011 and 2010
Consolidated Statements of Income for the Years ended December 31, 2011, 2010 and 2009
Consolidated Statement of Changes in Stockholders’ Equity for the Years Ended December 31,
2011, 2010 and 2009
Consolidated Statements of Cash Flows for the Years Ended December 31, 2011, 2010 and 2009
Notes to Consolidated Financial Statements
Supplementary Schedules – Exhibit 2
Report of Independent Public Accountant on Supplementary Schedules
A.
B.
Financial Assets
Amounts Receivable from Directors, Officers, Employees, Related Parties and Principal
Stockholders (Other than Affiliates)
51
C.
D.
E.
F.
G.
H.
Amounts Receivable from Related Parties which are eliminated during the consolidation of
financial statements
Intangible Assets – Other Assets
Long-Term Debt
Indebtedness to Related Parties (Long-term Loans from Related Companies)
Guarantees of Securities of Other Issuers
Capital Stock
Reconciliation of Retained Earnings Available For Dividend Declaration
Schedule of Financial Ratios
Map Showing the Relationships between and Among the Companies in the Group, its Ultimate
Parent Company and Co-Subsidiaries
Schedule of All Effective Standards and Interpretations under Philippine Financial Reporting
Standards as Of December 31, 2011
Reports on SEC Form 17-C
Reports on SEC Form 17-C were filed during the last six month period covered by this report and are
listed below:
Date
July 28, 2011
IMI Receives Bosch Supplier Award
Particulars
August 1, 2011
IMI Completes Acquisition of EPIQ Subsidiaries in Europe and Mexico
August 11, 2011
IMI Revenue Up 39% in First 6 Months of 2011
November 10, 2011
IMI posts 43% Revenue Rise in First 9 Months
2011 Audited Annual Financial Statements, IMI International (Singapore) Pte Ltd and its subsidiary
– Exhibit 3
52
EXHIBIT 1
2011 Audited Consolidated Financial Statements,
Integrated Micro-Electronics, Inc. and Subsidiaries
SyC ip Go rres Vel ayo & C o.
6760 Ayala Avenue
1226 Makati C it y
Philippines
Phone: (632) 891 0307
Fax:
(632) 819 0872
ww w.sgv.com.ph
BOA/PR C R eg. N o. 0001
SEC Accreditat ion N o. 0012-FR-2
INDEPENDENT AUDITORS’ REPORT
The Stockholders and the Board of Directors
Integrated Micro-Electronics, Inc.
We have audited the accompanying consolidated financial statements of Integrated Micro-Electronics,
Inc. and Subsidiaries, which comprise the consolidated balance sheets as at December 31, 2011 and
2010, and the consolidated statements of comprehensive income, statements of changes in equity and
statements of cash flows for each of the three years in the period ended December 31, 2011, and a
summary of significant accounting policies and other explanatory information.
Management’s Responsibility for the Consolidated Financial Statements
Management is responsible for the preparation and fair presentation of these consolidated financial
statements in accordance with Philippine Financial Reporting Standards, and for such internal control
as management determines is necessary to enable the preparation of consolidated financial statements
that are free from material misstatement, whether due to fraud or error.
Auditors’ Responsibility
Our responsibility is to express an opinion on these consolidated financial statements based on our
audits. We conducted our audits in accordance with Philippine Standards on Auditing. Those
standards require that we comply with ethical requirements and plan and perform the audit to obtain
reasonable assurance about whether the consolidated financial statements are free from material
misstatement.
An audit involves performing procedures to obtain audit evidence about the amounts and disclosures
in the consolidated financial statements. The procedures selected depend on the auditor’s judgment,
including the assessment of the risks of material misstatement of the consolidated financial statements,
whether due to fraud or error. In making those risk assessments, the auditor considers internal control
relevant to the entity’s preparation and fair presentation of the consolidated financial statements in
order to design audit procedures that are appropriate in the circumstances, but not for the purpose of
expressing an opinion on the effectiveness of the entity’s internal control. An audit also includes
evaluating the appropriateness of accounting policies used and the reasonableness of accounting
estimates made by management, as well as evaluating the overall presentation of the consolidated
financial statements.
*SGVMC116496*
A member firm of Ernst & Young Global Limited
-2-
We believe that the audit evidence we have obtained is sufficient and appropriate to provide a basis for
our audit opinion.
Opinion
In our opinion, the consolidated financial statements present fairly, in all material respects, the
financial position of Integrated Micro-Electronics, Inc. and Subsidiaries as at December 31, 2011 and
2010, and their financial performance and their cash flows for each of the three years in the period
ended December 31, 2011 in accordance with Philippine Financial Reporting Standards.
SYCIP GORRES VELAYO & CO.
Josephine Adrienne A. Abarca
Partner
CPA Certificate No. 92126
SEC Accreditation No. 0466-AR-1 (Group A),
February 11, 2010, valid until February 10, 2013
Tax Identification No. 163-257-145
BIR Accreditation No. 08-001998-61-2009,
June 1, 2009, valid until May 31, 2012
PTR No. 3174577, January 2, 2012, Makati City
March 1, 2012
*SGVMC116496*
INTEGRATED MICRO-ELECTRONICS, INC. AND SUBSIDIARIES
CONSOLIDATED BALANCE SHEETS
December 31
2010
(As restated 2011
see Note 2)
ASSETS
Current Assets
Cash and cash equivalents (Note 5)
Loans and receivables - net (Note 6)
Inventories - net (Note 7)
Derivative assets (Note 32)
Other current assets (Note 8)
Total Current Assets
Noncurrent Assets
Property, plant and equipment - net (Notes 9 and 29)
Goodwill (Notes 2 and 10)
Intangible assets - net (Notes 2 and 11)
Pension asset (Note 26)
Available-for-sale financial assets (Note 4)
Noncurrent receivables (Note 12)
Deferred income tax assets (Note 24)
Other noncurrent assets (Note 12)
Total Noncurrent Assets
$54,069,180
133,676,580
80,402,000
2,798,912
8,854,602
279,801,274
$38,134,743
104,257,178
54,694,413
1,693,121
2,508,014
201,287,469
97,505,460
54,355,193
7,333,491
2,807,134
414,348
213,577
743,592
1,518,225
164,891,020
$444,692,294
74,624,267
56,422,231
923,002
2,765,675
382,527
184,179
996,490
1,497,268
137,795,639
$339,083,108
$143,992,965
39,008,811
1,686,735
249,044
34,562
–
184,972,117
$101,153,798
17,921,638
2,298,792
–
3,832,474
38,000,000
163,206,702
60,398,500
4,810,158
2,303,765
1,329,257
913,688
612,724
230,704
70,598,796
255,570,913
–
881,322
2,564,594
986,473
894,088
118,313
372,084
5,816,874
169,023,576
LIABILITIES AND EQUITY
Current Liabilities
Accounts payable and accrued expenses (Note 13)
Trust receipts and loans payable (Note 15)
Income tax payable (Note 24)
Provisions (Note 14)
Derivative liabilities (Note 32)
Current portion of long-term debt (Note 16)
Total Current Liabilities
Noncurrent Liabilities
Long-term debt (Note 16)
Deferred income tax liabilities (Note 24)
Deferred revenue (Note 17)
Pension liabilities (Notes 13 and 26)
Accrued rent (Note 29)
Obligation under finance lease (Note 29)
Other long-term employee benefits (Note 2)
Total Noncurrent Liabilities
Total Liabilities
(Forward)
*SGVMC116496*
-2-
December 31
2010
(As restated see Note 2)
2011
Equity (Note 18)
Equity attributable to equity holders of the Parent Company
Capital stock-common
Capital stock-preferred
Subscribed capital stock
Additional paid-in capital
Subscriptions receivable
Retained earnings:
Appropriated for expansion
Unappropriated
Treasury stock
Reserve for fluctuation on available-for-sale financial assets
Cumulative translation adjustment
Other reserves
Equity attributable to noncontrolling interests in
consolidated subsidiaries
Total Equity
$24,932,075
26,601,155
6,506,970
59,085,110
(10,395,200)
$24,893,713
26,601,155
1,901,963
34,646,889
(11,411,994)
30,660,981
59,671,124
(1,012,585)
144,067
(6,042,819)
170,714
190,321,592
60,660,981
32,727,457
(1,012,585)
111,959
–
170,714
169,290,252
(1,200,211)
189,121,381
$444,692,294
769,280
170,059,532
$339,083,108
See accompanying Notes to Consolidated Financial Statements.
*SGVMC116496*
INTEGRATED MICRO-ELECTRONICS, INC. AND SUBSIDIARIES
CONSOLIDATED STATEMENTS OF COMPREHENSIVE INCOME
2011
REVENUES
Sale of goods
Sale of services
COST OF SALES (Note 19)
Cost of goods sold
Cost of services
GROSS PROFIT
OPERATING EXPENSES (Note 20)
OTHERS - Net
Gain from bargain purchase (Note 2)
Mark-to-market gains (loss) from put and call option
Foreign exchange gains - net
Impairment loss on goodwill (Note 10)
Interest expense and bank charges (Note 22)
Interest income (Note 23)
Miscellaneous income (Notes 6, 7, 9 and 32)
INCOME BEFORE INCOME TAX
PROVISION FOR (BENEFIT FROM) INCOME
TAX (Note 24)
Current
Deferred
NET INCOME
Years Ended December 31
2010
2009
$482,388,266
93,065,642
575,453,908
$328,697,578
83,629,027
412,326,605
$347,788,074
47,714,207
395,502,281
451,886,042
85,390,332
537,276,374
294,328,303
73,523,710
367,852,013
317,585,492
33,326,158
350,911,650
38,177,534
44,474,592
44,590,631
(52,686,767)
(40,224,016)
(35,171,319)
13,018,493
5,355,873
4,480,815
(2,717,451)
(2,499,998)
315,520
2,501,580
–
(207,555)
1,792,949
–
(1,036,929)
352,578
2,670,550
–
–
279,084
–
(1,787,466)
723,261
6,527,178
5,945,599
7,822,169
15,161,369
4,177,862
476,224
4,654,086
3,414,175
(6,651)
3,407,524
1,291,513
4,414,645
10,130,181
32,108
55,080
32,900
5,112,200
(81,012)
5,031,188
OTHER COMPREHENSIVE INCOME (LOSS)
Fair value changes on available-for-sale financial assets
Exchange differences arising from translation of foreign
operations
(6,042,819)
–
–
Other comprehensive income (loss), net of tax
(6,010,711)
55,080
32,900
($4,719,198)
$4,469,725
$10,163,081
$3,289,314
(1,997,801)
$1,291,513
$4,738,929
(324,284)
$4,414,645
$10,065,517
64,664
$10,130,181
($2,721,397)
(1,997,801)
($4,719,198)
$4,794,009
(324,284)
$4,469,725
$10,098,417
64,664
$10,163,081
TOTAL COMPREHENSIVE INCOME (LOSS)
Net Income (Loss) Attributable to:
Equity holders of the Parent Company
Noncontrolling interests
Total Comprehensive Income (Loss) Attributable to:
Equity holders of the Parent Company
Noncontrolling interests
Earnings Per Share (Note 25)
Basic and Diluted
$0.001
$0.002
$0.006
See accompanying Notes to Consolidated Financial Statements.
*SGVMC116496*
INTEGRATED MICRO-ELECTRONICS, INC. AND SUBSIDIARIES
CONSOLIDATED STATEMENTS OF CHANGES IN EQUITY
Capital Stock - Capital Stock Common
Preferred
(Note 18)
(Note 18)
Balances at January 1, 2011,as restated
$24,893,713
$26,601,155
Increase in noncontrolling interest
due to the acquisition of a
subsidiary during the year
(Note 2)
–
–
Issued shares during the year (Note 18)
38,362
–
Subscriptions during the year
(Notes 2 and 18)
–
–
Cost of share-based payments (Note 27)
–
–
Accretion of subscription receivable
(Note 18)
–
–
Collections on subscriptions (Note 18)
–
–
Forfeitures during the year (Note 18)
–
–
Reversal of appropriation (Note 18)
–
–
Cash dividends (Note 18)
–
–
24,932,075
26,601,155
Net income (loss)
–
–
Other comprehensive income (loss)
–
–
Total comprehensive income (loss)
–
–
Balances at December 31, 2011
$24,932,075
$26,601,155
Subscribed
Capital
Stock
(Note 18)
$1,901,963
–
(38,362)
Attributable to Equity Holders of the Parent Company
Retained
Reserve for
Earnings
Retained
Fluctuation on
Additional Subscriptions Appropriated
Earnings
Treasury
AvailablePaid-in
Receivable for Expansion Unappropriated
Stock
for-Sale
(Note 18)
(Note 18)
(Note 18)
(Note 18) Financial Assets
Capital
$34,646,889
($11,411,994)
$60,660,981
$32,727,457
($1,012,585)
$111,959
Other
Reserves
$170,714
Cumulative Attributable to
Translation Noncontrolling
Adjustment
Interests
$–
$769,280
Total
$170,059,532
–
–
–
–
–
–
–
–
–
–
–
–
–
–
–
–
48,092
–
48,092
–
4,746,084
–
24,062,649
673,762
–
–
–
–
–
–
–
–
–
–
–
–
–
–
–
–
28,808,733
673,762
–
–
(102,715)
–
–
6,506,970
–
–
–
$6,506,970
427,535
–
(725,725)
–
–
59,085,110
–
–
–
$59,085,110
–
–
–
–
–
111,959
–
32,108
32,108
$144,067
–
–
–
–
–
170,714
–
–
–
$170,714
(427,535)
615,889
828,440
–
–
(10,395,200)
–
–
–
($10,395,200)
–
–
–
(30,000,000)
–
30,660,981
–
–
–
$30,660,981
–
–
–
30,000,000
(6,345,647)
56,381,810
3,289,314
–
3,289,314
$59,671,124
–
–
–
–
–
(1,012,585)
–
–
–
($1,012,585)
–
–
–
–
–
–
–
(6,042,819)
(6,042,819)
($6,042,819)
–
–
–
–
(19,782)
797,590
(1,997,801)
–
(1,997,801)
($1,200,211)
–
615,889
–
–
(6,365,429)
193,840,579
1,291,513
(6,010,711)
(4,719,198)
$189,121,381
*SGVMC116496*
-2-
Capital Stock - Capital Stock Common
Preferred
(Note 18)
(Note 18)
Balances at January 1, 2010
Increase in non-controlling interest due to
the acquisition of a subsidiary during the year
(Note 2)
Issued shares during the year (Note 18)
Subscriptions during the year (Note 18)
Cost of share-based payments (Note 27)
Accretion of subscription receivable (Note 18)
Collections on subscriptions (Note 18)
Forfeitures during the year (Note 18)
Dilution of noncontrolling interest
Reacquired shares (Note 18)
Cash dividends (Note 18)
Stock dividends (Note 18)
Net income (loss)
Other comprehensive income
Total comprehensive income (loss)
Balances at December 31, 2010, as previously stated
Adjustments (Note 2)
Balances at December 31, 2010, as restated
Subscribed
Capital
Stock
(Note 18)
Attributable to Equity Holders of the Parent Company
Retained
Earnings
Retained
Additional
Subscriptions
Appropriated
Earnings
Paid-in
Receivable
for Expansion Unappropriated
Capital
(Note 18)
(Note 18)
(Note 18)
Reserve for
Fluctuation on
Treasury
AvailableStock
for-Sale
(Note 18) Financial Assets
Other
Reserves
Attributable to
Noncontrolling
Interests
Total
$20,267,538
$26,601,155
$2,167,895
$30,482,156
($10,153,255)
$60,660,981
$37,457,693
($1,012,592)
$56,879
$161,551
$292,318
$166,982,319
–
508,916
–
–
–
–
–
–
–
–
4,117,259
24,893,713
–
–
–
24,893,713
–
$24,893,713
–
–
–
–
–
–
–
–
–
–
–
26,601,155
–
–
–
26,601,155
–
$26,601,155
–
(508,916)
668,506
–
–
–
(425,522)
–
–
–
–
1,901,963
–
–
–
1,901,963
–
$1,901,963
–
–
2,722,308
1,933,185
1,913,073
–
(2,403,833)
–
–
–
–
34,646,889
–
–
–
34,646,889
–
$34,646,889
–
–
(3,390,814)
–
(1,913,073)
1,215,793
2,829,355
–
–
–
–
(11,411,994)
–
–
–
(11,411,994)
–
($11,411,994)
–
–
–
–
–
–
–
–
–
–
–
60,660,981
–
–
–
60,660,981
–
$60,660,981
–
–
–
–
–
–
–
–
–
(5,351,906)
(4,117,259)
27,988,528
4,738,929
–
4,738,929
32,727,457
–
$32,727,457
–
17
–
–
–
–
–
–
(10)
–
–
(1,012,585)
–
–
–
(1,012,585)
–
($1,012,585)
–
–
–
–
–
–
–
–
–
–
–
56,879
–
55,080
55,080
111,959
–
$111,959
–
–
–
–
–
–
–
9,163
–
–
–
170,714
–
–
–
170,714
–
$170,714
1,646,276
–
–
–
–
–
–
(9,163)
–
(51,474)
–
1,877,957
(324,284)
–
(324,284)
1,553,673
(784,393)
$769,280
1,646,276
17
–
1,933,185
–
1,215,793
–
–
(10)
(5,403,380)
–
166,374,200
4,414,645
55,080
4,469,725
170,843,925
(784,393)
$170,059,532
*SGVMC116496*
-3-
Capital Stock - Capital Stock Common
Preferred
(Note 18)
(Note 18)
Balances at January 1, 2009
Shares issued during the year
Cost of share-based payments (Note 27)
Collections on subscriptions
Net reversal of accretion of subscriptions receivable
(Note 27)
Dilution of noncontrolling interest
Cash dividends (Note 18)
Other comprehensive income
Net income
Total comprehensive income (loss)
Balances at December 31, 2009
Subscribed
Capital
Stock
(Note 18)
Attributable to Equity Holders of the Parent Company
Retained
Earnings
Retained
Additional
Subscriptions
Appropriated
Earnings
Paid-in
Receivable
for Expansion Unappropriated
Capital
(Note 18)
(Note 18)
(Note 18)
Reserve for
Fluctuation on
Treasury
AvailableStock
for-Sale
(Note 18) Financial Assets
Other
Reserves
Attributable to
Noncontrolling
Interests
Total
$20,253,054
14,484
–
–
$26,601,155
–
–
–
$2,182,379
(14,484)
–
–
$30,213,723
–
514,153
–
($10,439,358)
–
–
40,383
$60,660,981
–
–
–
$31,091,806
–
–
–
($1,012,592)
–
–
–
$23,979
–
–
–
$55,803
–
–
–
$416,273
–
–
–
$160,047,203
–
514,153
40,383
–
–
–
20,267,538
–
–
–
$20,267,538
–
–
–
26,601,155
–
–
–
$26,601,155
–
–
–
2,167,895
–
–
–
$2,167,895
(245,720)
–
–
30,482,156
–
–
–
$30,482,156
245,720
–
–
(10,153,255)
–
–
–
($10,153,255)
–
–
–
60,660,981
–
–
–
$60,660,981
–
–
(3,699,630)
27,392,176
–
10,065,517
10,065,517
$37,457,693
–
–
–
(1,012,592)
–
–
–
($1,012,592)
–
–
–
23,979
32,900
–
32,900
$56,879
–
105,748
–
161,551
–
–
–
$161,551
–
(105,748)
(82,871)
227,654
–
64,664
64,664
$292,318
–
–
(3,782,501)
156,819,238
32,900
10,130,181
10,163,081
$166,982,319
See accompanying Notes to Consolidated Financial Statements.
*SGVMC116496*
INTEGRATED MICRO-ELECTRONICS, INC. AND SUBSIDIARIES
CONSOLIDATED STATEMENTS OF CASH FLOWS
Years Ended December 31
2010
(As restated see Note 2)
2009
2011
CASH FLOWS FROM OPERATING ACTIVITIES
Income before income tax
Adjustments for:
Depreciation and amortization of property, plant and
equipment (Note 9)
Gain on bargain purchase (Note 2)
Gains on derivative transactions (Note 32)
Impairment loss on goodwill (Note 10)
Interest expense (Note 22)
Provision for doubtful accounts (Note 6)
Unrealized foreign exchange loss (gain) – net
Net pension expense (income) (Note 26)
Amortization of intangible assets (Note 11)
Provision (reversal of provision) for inventory
obsolescence (Note 7)
Provision (reversal of provision) for restructuring
(Note 14)
Cost of share-based payments (Note 27)
Interest income (Note 23)
Amortization of deferred revenue
Gain on sale of property, plant and equipment
(Note 9)
Dividend income
Gain on fire insurance claim (Note 6)
Loss on fire (Notes 7 and 9)
Provision (reversal of provision) for warranty
(Note 14)
Operating income before working capital changes
Changes in operating assets and liabilities:
Decrease (increase) in:
Loans and receivables
Inventories
Other current assets
Net pension asset
Noncurrent receivables
Increase (decrease) in:
Accounts payable and accrued expenses
Provisions
Accrued rent
Other long-term employee benefits
Net cash generated from operations
Interest paid
Income tax paid
Interest received
Dividends received
Net cash provided by (used in) operating activities
$5,945,599
$7,822,169
$15,161,369
24,615,286
(13,018,493)
(6,218,718)
2,717,451
2,344,807
1,977,541
(2,128,698)
1,851,764
1,163,969
19,373,226
–
(1,874,546)
–
942,202
1,531,927
566,968
448,563
2,645,461
18,055,328
–
(160,198)
–
1,739,827
58,228
184,237
(412,790)
2,744,304
1,029,155
(1,734,481)
1,322,908
249,044
673,762
(315,520)
(260,829)
246,382
1,933,185
(352,578)
(358,359)
(889,304)
514,153
(723,261)
–
(115,117)
(367)
–
–
(186,476)
(61)
–
–
(97,969)
(466)
5,625,371
637,159
–
20,510,636
(18,481)
30,985,101
5,243
43,764,139
(836,152)
(400,171)
(6,346,587)
(723,300)
(29,398)
1,889,943
(14,503,933)
(103,392)
(1,148,215)
374,527
(26,767,336)
1,731,187
1,770,559
–
2,363,308
9,689,461
(582,674)
19,600
(141,380)
21,160,035
(1,729,864)
(4,789,919)
315,521
367
14,956,140
(15,028,486)
(43,764)
(27,918)
–
2,393,863
(922,707)
(4,377,137)
333,798
61
(2,572,122)
15,677,641
(5,092,074)
19,978
–
33,467,402
(2,255,783)
(3,325,362)
676,847
466
28,563,570
(Forward)
*SGVMC116496*
-2-
Years Ended December 31
2010
(As restated see Note 2)
2009
2011
CASH FLOWS FROM INVESTING ACTIVITIES
Acquisitions of:
Property, plant and equipment (Note 9)
Intangible assets (Note 11)
Proceeds from sale of property, plant and equipment
Acquisition through business combination - net of cash
acquired (Note 2)
Settlement of derivatives (Note 32)
Decrease (increase) in other noncurrent assets
Net cash used in investing activities
CASH FLOWS FROM FINANCING ACTIVITIES
Availments of loans
Payments of:
Loans payable
Long-term debt
Dividends paid to equity holders of the Parent Company
(Note 18)
Collections of subscriptions receivable (Note 18)
Dividends paid to noncontrolling interest
Net cash provided by (used in) financing activities
EFFECT OF CHANGES IN FOREIGN EXCHANGE
RATES ON CASH AND CASH EQUIVALENTS
($14,830,473)
(411,344)
2,656,466
($22,039,260)
(765,833)
2,594,526
($7,740,314)
(414,243)
3,059,183
5,053,343
1,315,015
293,354
(5,923,639)
2,202,930
1,601,406
1,900,973
(14,505,258)
–
160,198
(234,011)
(5,169,187)
50,838,903
15,619,405
(2,622,978)
(38,000,000)
(2,347,609)
(8,000,000)
(14,807,874)
(8,000,000)
(3,883,683)
615,889
(19,782)
6,928,349
(5,351,906)
1,215,793
(51,474)
1,084,209
(4,260,357)
40,383
(82,871)
(27,110,719)
(26,413)
196,147
–
43,568
NET INCREASE (DECREASE) IN CASH AND CASH
EQUIVALENTS
15,934,437
(15,797,024)
(3,672,768)
CASH AND CASH EQUIVALENTS AT BEGINNING
OF YEAR
38,134,743
53,931,767
57,604,535
$54,069,180
$38,134,743
$53,931,767
CASH AND CASH EQUIVALENTS AT END
OF YEAR (Note 5)
See accompanying Notes to Consolidated Financial Statements.
*SGVMC116496*
INTEGRATED MICRO-ELECTRONICS, INC. AND SUBSIDIARIES
NOTES TO CONSOLIDATED FINANCIAL STATEMENTS
1. Corporate Information
Integrated Micro-Electronics, Inc. (“the Parent Company”), a stock corporation organized and
registered under the laws of the Republic of the Philippines on August 8, 1980, has four
subsidiaries, namely: IMI International (Singapore) Pte. Ltd. (“IMI Singapore”), IMI USA, Inc.
(“IMI USA”), IMI Japan, Inc. (“IMI Japan”) and PSi Technologies Inc. (PSi) (collectively referred
to as the “Group”). IMI Singapore, IMI USA and IMI Japan are wholly owned subsidiaries while
PSi is 55.78% owned. The Group’s parent company is AYC Holdings, Ltd. (AYC), a corporation
incorporated in the British Virgin Islands. AYC is a subsidiary of Ayala Corporation (AC), a
corporation incorporated in the Republic of the Philippines and listed in the Philippine Stock
Exchange (PSE). AC is 52.61% owned by Mermac, Inc., 10.93% owned by Mitsubishi
Corporation and the rest by the public. The registered office address of the Parent Company is
North Science Avenue, Laguna Technopark, Biñan, Laguna.
On January 21, 2010, the Parent Company was listed by way of introduction in the PSE.
The Parent Company is registered with the Philippine Economic Zone Authority (PEZA) as an
exporter of printed circuit board assembly (PCBA), flip chip assembly, box build sub-assembly,
enclosure system, and provider of electronics product design, research and development, product
development outsourcing and other electronic parts, among others. The Parent Company is also
engaged in the business of providing test development and systems integration services and
distributing related products and equipment and related services. These PEZA registrations entitle
the Parent Company to a four-year income tax holiday (ITH) and an option to apply for ITH
extension for a maximum of three (3) years subject to various PEZA requirements. The Parent
Company’s entitlements to ITH under the current PEZA registrations had expirations beginning
January 2010. As of December 31, 2011, there are two remaining project activities with ITH
entitlement which will expire in 2013. Under its PEZA registrations, the Parent Company’s
projects and activities are subject to certain requirements and are entitled to certain incentives,
which include, but are not limited to, ITH and tax and duty free importation of inventories and
capital equipment. Upon the expiration of the ITH on these projects and activities, the Parent
Company will be subject to a five percent (5%) final tax on gross income earned after certain
allowable deductions provided under Republic Act (R.A.) No. 7916 (otherwise known as the
“Special Economic Zone Act of 1995”) in lieu of payment of national and local taxes.
IMI Singapore was incorporated and is domiciled in Singapore. It is engaged in the procurement
of raw materials, supplies and provision of customer services. Its wholly-owned subsidiary,
Speedy-Tech Electronics Ltd. (STEL), was incorporated and is domiciled also in Singapore.
STEL on its own has subsidiaries located in Hong Kong, People’s Republic of China (PRC),
Singapore and the Philippines. STEL and its subsidiaries are principally engaged in the provision
of Electronic Manufacturing Services (EMS) and Power Electronics solutions to original
equipment manufacturing customers in the consumer electronics, computer
peripherals/information technology, industrial equipment, telecommunications and medical device
sectors.
On April 16, 2009, IMI Singapore established its Philippine Regional Operating Headquarters
(also known as IMI International ROHQ or IMI ROHQ). It serves as a supervisory,
communications and coordinating center for the affiliates and subsidiaries of IMI Singapore.
*SGVMC116496*
-2-
On April 28, 2011, the Parent Company infused additional capital to IMI Singapore consisting of
$7,026,195 cash and 200 million of the Parent Company’s own shares in exchange for 43,077,144
newly issued ordinary shares of the latter with par value of SGD1.00 per share. This was used by
IMI Singapore to set up Monarch Elite Ltd. (Monarch) and Cooperatief IMI Europe U.A.
(Cooperatief) as holding companies and to facilitate the acquisition of EPIQ Electronic Assembly
EOOD (EPIQ EA), EPIQ CZ s.r.o (EPIQ CZ), and EPIQ MX, S.A.P.I de C.V. (EPIQ MX)
(collectively the EPIQ subsidiaries) from EPIQ NV (see Note 2). The EPIQ subsidiaries design
and produce printed circuits and spray casting of plastics, and supply assembled and tested
systems and sub-systems which include drive and control elements for automotive equipment,
household appliances, industrial market and other applications with plastic parts and electronic
components. The EPIQ subsidiaries also provide engineering, research and development, and
logistics management services.
IMI USA was incorporated and is domiciled in California, USA. It is at the forefront of
technology with regard to precision assembly capabilities including surface mount technology
(SMT), chip on flex (COF), chip on board (COB) and flip chip on flex. It specializes in
prototyping low to medium PCBA and sub-assembly. It is also engaged in engineering, design for
manufacturing (DFM) technology, advanced manufacturing process development, new product
innovations (NPI), direct chip attach and small precision assemblies.
IMI Japan was registered and is domiciled in Japan. IMI Japan’s primary purpose is to transact
business with Japanese customers in the following areas: (a) turnkey EMS; (b) engineering and
design services; and (c) original design manufacturing (ODM) solutions. IMI Japan also functions
as program management center for new business in coordination with the Parent Company
(wireless), STEL and Subsidiaries (power management) and IMI USA (film chip). IMI Japan will
secure programs/projects from Japanese customers and then endorse these to the Parent Company
or IMI Singapore. There is no manufacturing operation in IMI Japan.
On October 6, 2010, the Parent Company completed its acquisition of 55.78% of PSi Technology,
Inc. (PSi) (see Note 2). PSi is a power semiconductor assembly and test services (SATS)
company serving niche markets in the global power semiconductor market. It provides
comprehensive package design, assembly and test services for power semiconductors used in
various electronic devices. PSi wholly owns PSi Technologies Laguna, Inc. (PSi Laguna), which
also provides SATS. In addition, PSi owns 40% of PSiTech Realty, Inc., the holding company of
Pacsem Realty, which is a real estate company that acquires, holds, develops and disposes any real
estate or interest acquired. Pacsem Realty is 40% and 60% directly owned by PSi and PSiTech
Realty Inc., respectively.
The accompanying consolidated financial statements were authorized for issue by the Parent
Company’s Board of Directors (BOD) on March 1, 2012.
2. Business Combination
Acquisition of PSi
On June 25, 2010, the Parent Company and Narra Venture Capital II, LP (Narra VC) (collectively
referred to as the “New Investors”) entered into an Investors’ Agreement (the Agreement) with
PSi Technology Holdings, Inc. (PSiH) and Merrill Lynch Global Emerging Markets Partners, LLC
(MLGEMP) (collectively referred to as the “Old Investors”), to take on 55.78% and 11.22%
equity share in PSi, respectively.
*SGVMC116496*
-3-
The equity subscription of the New Investors was finalized on October 6, 2010, and the Parent
Company took control of PSi on that date.
In 2010, the Parent Company recorded its share in the identifiable assets and liabilities of PSi
using provisional fair values due to unavailability of certain information to facilitate fair value
computation of accounts receivable, property, plant and equipment, accounts payable and accrued
expenses, and goodwill. The acquisition cost also includes contingent consideration.
In 2011, the Parent Company finalized the purchase price allocation, and the cost of acquisition
has been allocated using proportionate share in the identifiable net assets at the date of acquisition
as follows:
Assets
Cash
Accounts receivable
Inventories
Property, plant and equipment
Other assets
Total
Liabilities
Accounts payable and accrued expenses
Loans payable
Deferred revenue
Accrued rental non-current
Other long-term employee benefits
Total
Net assets
Cost of acquisition
Less: Parent Company’s share in the fair value of net
assets acquired (55.78%)
Goodwill (Note 10)
Fair Value
(As restated)
Provisional
Values
$10,527,930
12,454,190
6,580,987
9,210,386
1,311,932
40,085,425
$10,527,930
18,419,853
6,580,987
9,210,386
1,311,932
46,051,088
31,591,670
2,347,609
2,922,953
902,028
372,084
38,136,344
$1,949,081
35,783,492
2,347,609
2,922,953
902,028
372,084
42,328,166
$3,722,922
$11,283,628
$11,570,031
1,087,197
$10,196,431
2,076,646
$9,493,385
The 2010 comparative information was restated to reflect the above adjustments. Accounts
receivable, accounts payable and accrued expenses, and the cost of acquisition (as adjusted for
contingent consideration) decreased by $5.97 million, $4.19 million, and $0.29 million,
respectively. The final purchase price allocation resulted in a goodwill of $10.20 million.
Cash on acquisition follows:
Cash acquired from PSi
Cash paid
Net cash flow
$10,527,930
8,325,000
$2,202,930
Acquisition-related costs, which consist of professional fees, representation and travel expenses
amounting to $0.17 million, were recognized as expense in 2010.
*SGVMC116496*
-4-
From the date of acquisition up to December 31, 2010, the Parent Company’s share in PSi’s
revenue and net loss amounted to $19.34 million and $0.45 million, respectively. If the
combination had taken place at the beginning of 2010, the Group’s total revenue would have
increased by $27.23 million, while the Group’s net income before tax would have decreased by
$1.04 million.
Acquisition of EPIQ subsidiaries
On April 28, 2011, the Parent Company infused additional capital to IMI Singapore consisting of
$7,026,195 cash and 200 million of the Parent Company’s own shares in exchange for 43,077,144
newly issued ordinary shares of the latter with par value of SGD1.00 per share. This was used by
IMI Singapore to set up Monarch and Cooperatief as holding companies and to facilitate the
acquisition of the EPIQ subsidiaries from EPIQ NV.
On May 4, 2011, the Parent Company, Cooperatief (the Purchaser), and EPIQ NV (the Seller),
entered into a Sale and Purchase Agreement (SPA), for the Purchaser to buy the Seller’s 100%
direct or indirect ownership shares (the EPIQ shares) in the EPIQ subsidiaries.
The Parent Company, Cooperatief and EPIQ NV agreed that the consideration for the EPIQ shares
would include issuance of 200 million of the Parent Company’s shares (the IMI Consideration
Shares); deferred payment of €7,345,080 ($10,515,218) from 2013 to 2018 subject to an interest
rate of 1.599% plus 1.5% (see Note 16); and assumption of liabilities of EPIQ NV to the EPIQ
subsidiaries aggregating to €2,546,419 ($3,645,453).
The acquisition costs are allocated as follows:
Issuance of 200 million IMI Consideration
Shares (Note 18)
Deferred payment
Assumed liabilities of EPIQ NV to the
EPIQ subsidiaries
EPIQ EA
EPIQ CZ
EPIQ MX
TOTAL
$20,638,697
7,533,146
$524,970
191,615
$7,645,066
2,790,457
$28,808,733
10,515,218
115,265
$28,287,108
8,887
$725,472
3,521,301
$13,956,824
3,645,453
$42,969,404
On July 29, 2011, all of the completion conditions under the SPA were fulfilled by the responsible
parties, and the acquisition of the EPIQ subsidiaries by Cooperatief was completed.
Under the SPA, Cooperatief also purchased receivables of EPIQ NV from the EPIQ subsidiaries
aggregating to €11,734,824 ($16,799,576). On July 29, 2011, €4,831,161 ($6,916,294) of this was
settled through cash payment, while the rest will be settled through additional deferred payment
from 2013 to 2018 subject to interest rate of 1.599% plus 1.5% (see Note 16).
*SGVMC116496*
-5-
The provisional fair values of the identifiable assets and liabilities acquired and goodwill (gain
from bargain purchase) arising as at the date of acquisition follow:
EPIQ EA
Carrying
Fair Value
Value
Assets
Cash and cash equivalents
Receivables
Inventories
Property, plant and equipment
Computer software
Customer relationships
Deferred tax assets
Other assets
Total
Liabilities
Accounts payable
Bank loans
Long-term debt
Provisions
Accrued charges and deferred
income
Taxes payable
Deferred tax liabilities
Total
Net Assets
Cost of acquisition
Less: Cooperatief’s share in the
fair value of net assets
acquired
Goodwill (Gain from bargain
purchase)
EPIQ CZ
Carrying
Value
Fair Value
EPIQ MX
Carrying
Value
Fair Value
$1,152,558
26,485,891
20,700,958
10,188,629
158,818
–
–
193,184
58,880,038
$1,152,558
26,485,891
20,700,958
24,810,566
158,818
6,766,617
–
193,184
80,268,592
$515,223
3,333,944
2,984,546
8,072,340
–
–
–
–
14,906,053
$515,223
3,333,944
2,984,546
5,734,207
–
–
444,245
–
13,012,165
$3,385,562
10,508,102
4,476,328
6,120,929
299,735
–
–
120,831
24,911,487
$3,385,562
10,508,102
4,476,328
8,618,229
299,735
–
–
120,831
27,408,787
17,650,612
12,871,248
4,779,883
1,319,762
17,650,612
12,871,248
4,779,883
1,319,762
2,444,865
–
10,114,478
–
2,444,865
–
10,114,478
–
6,409,754
–
2,909,135
–
6,409,754
–
2,909,135
–
1,158,777
352,571
–
38,132,853
$20,747,185
1,158,778
352,571
2,138,855
40,271,709
$39,996,883
$28,287,108
377,763
–
–
12,937,106
$1,968,947
377,763
–
–
12,937,106
$75,059
$725,472
–
1,089,987
937,087
11,345,963
$13,565,524
–
1,089,987
1,686,277
12,095,153
$15,313,634
$13,956,824
39,948,791
($11,661,683)
75,059
$650,413
15,313,634
($1,356,810)
The purchase price allocation for the acquisition of the EPIQ subsidiaries has been prepared on a
preliminary basis due to unavailability of certain information to facilitate fair valuation
computation, and reasonable changes are expected as additional information becomes available.
The accounts that are subject to provisional accounting are property, plant and equipment,
intangible assets, contingent liabilities and goodwill. The goodwill recognized on the acquisition
of EPIQ CZ can be attributed to the acquisition of its automotive, industrial, and turnkey
experience, platforms in Europe and China that serve global customers, access to suppliers and
scale benefit in materials. The gain from bargain purchase recognized for EPIQ EA and
EPIQ MX are attributable to the increase in fair value of property, plant and equipment and the
intangible asset identified for EPIQ EA.
Philippine Financial Reporting Standards (PFRS) 3, Business Combinations, provides that if the
initial accounting for a business combination can be determined only provisionally by the end of
the period in which the combination is effected because either the fair values to be assigned to the
acquiree’s identifiable assets, liabilities or contingent liabilities or the cost of the combination can
be determined only provisionally, the acquirer shall account for the combination using those
provisional values. The acquirer shall recognize any adjustments to those provisional values as a
result of completing the initial accounting within twelve months of the acquisition date; and from
the acquisition date (i) the carrying amount of the identifiable asset, liability or contingent liability
that is recognized or adjusted as a result of completing the initial accounting shall be calculated as
if its fair value at the acquisition date had been recognized from that date; (ii) goodwill or any gain
recognized shall be adjusted from the acquisition date by an amount equal to the adjustment to the
fair value at the acquisition date of the identifiable asset, liability or contingent liability being
recognized or adjusted; and (iii) comparative information presented for the periods before the
initial accounting for the combination is complete shall be presented as if the initial accounting
had been completed from the acquisition date.
*SGVMC116496*
-6-
Acquisition related costs, which consist of professional fees, representation and travel expenses
amounting to $2.14 million, were recognized as expense in 2011.
From the date of acquisition, the EPIQ subsidiaries have contributed $66.2 million and
$2.42 million to the Group’s total revenue and net income before tax, respectively. If the
combination had taken place at the beginning of 2011, the Group’s total revenue and net income
before tax would have increased by $189.9 million and $10.45 million, respectively.
3. Summary of Significant Accounting Policies
Basis of Preparation
The accompanying consolidated financial statements have been prepared under the historical cost
method, except for available-for-sale (AFS) financial assets and derivative financial instruments
that have been measured at fair value.
The consolidated financial statements are presented in United States (U.S.) Dollar, which is the
functional currency of the Parent Company, and are rounded off to the nearest dollar unless
otherwise indicated.
Statement of Compliance
The accompanying consolidated financial statements have been prepared in compliance with
PFRS.
Basis of Consolidation
The accompanying consolidated financial statements include the accounts of the Parent Company
and the following subsidiaries:
IMI USA
IMI Japan
IMI Singapore
IMI International Regional Operating
Headquarter (“IMI ROHQ”)
Speedy-Tech Electronics Ltd.
and Subsidiaries
(“STEL and Subsidiaries”)
Speedy-Tech Technologies
Pte. Ltd. (“STTS”)
Speedy-Tech Electronics (HK)
Limited (“STHK”)
Speedy-Tech (Philippines), Inc.
(“STPHIL”)
Shenzhen Speedy-Tech
Electronics Co., Ltd.
(“SZSTE”)
Speedy-Tech Electronics, Inc.
Speedy-Tech Electronics (Jiaxing)
Co., Ltd. (“STJX”)
Percentage of Ownership
Country of
2010 Incorporation
2011
100.00%
USA
100.00%
100.00%
Japan
100.00%
100.00%
Singapore
100.00%
Functional
Currency
USD
USD
USD
100.00%
100.00%
Philippines
USD
100.00%
100.00%
Singapore
USD
100.00%
100.00%
Hong Kong
USD
100.00%
100.00%
Philippines
USD
99.48%
100.00%
99.48%
100.00%
China
USA
USD
USD
100.00%
100.00%
China
USD
(Forward)
*SGVMC116496*
-7-
Percentage of Ownership
Country of
2010 Incorporation
2011
Speedy-Tech Electronics
(Chong Qing) Co. Ltd.
(“STCQ”)
IMI (Chengdu) Ltd.
Monarch
Cooperatief
EPIQ EA
Microenergia OOD
EPIQ CZ
EPIQ MX
EPIQ Manufactura
S.A.P.I de C.V.
IMI France
PSi
PSi Laguna*
PSiTech Realty, Inc.*
Pacsem Realty, Inc.*
100.00%
100.00%
100.00%
100.00%
100.00%
70.00%
100.00%
100.00%
100.00%
100.00%
55.78%
55.78%
22.31%
35.70%
100.00%
China
100.00%
China
−
Hong Kong
−
Netherlands
−
Bulgaria
−
Bulgaria
− Czech Republic
−
Mexico
−
−
55.78%
55.78%
22.31%
35.70%
Mexico
France
Philippines
Philippines
Philippines
Philippines
Functional
Currency
USD
USD
USD
Euro
Bulgarian Lev
Bulgarian Lev
Czech Koruna
Mexican Peso
Mexican Peso
Euro
USD
USD
USD
USD
* The percentage pertains to ownership of the Parent Company
A subsidiary is consolidated from the date on which control is transferred to the Group and ceases
to be consolidated from the date on which control is transferred out of the Group. The financial
statements of the subsidiaries are prepared for the same reporting period as the Parent Company,
using uniform accounting policies for like transactions and other events in similar circumstances.
All significant intercompany balances and transactions, including intercompany profits and
unrealized profits and losses, are eliminated in consolidation.
Noncontrolling interests represent the portion of profit or loss and net assets in subsidiaries not
held by the Group and are presented separately in the consolidated statement of comprehensive
income and within equity in the consolidated balance sheet, separately from the equity holders of
the Parent Company.
Losses within a subsidiary are attributed to the noncontrolling interest even if such results in a
deficit balance. A change in the ownership interest of a subsidiary, without a loss of control, is
accounted for as an equity transaction. If the Group loses control over a subsidiary, it:
· Derecognizes the assets (including goodwill) and liabilities of the subsidiary
· Derecognizes the carrying amount of any noncontrolling interest
· Derecognizes the cumulative translation differences recorded in equity
· Recognizes the fair value of the consideration received
· Recognizes the fair value of any investment retained
· Recognizes any surplus or deficit in profit or loss
· Reclassifies the parent’s share of components previously recognized in other comprehensive
income to profit or loss or retained earnings, as appropriate.
Changes in Accounting Policies
The accounting policies adopted in the preparation of the consolidated financial statements are
consistent with those of the previous financial year except for the adoption of the following new
and amended PFRS, Philippine Accounting Standards (PAS) and Philippine Interpretations from
International Financial Reporting Interpretation Committee (IFRIC) interpretations as of
*SGVMC116496*
-8-
January 1, 2011. Except as otherwise indicated, the adoption of the new and amended standards
as well as the Philippine Interpretations did not have significant impact on the consolidated
financial statements.
·
PAS 24 (Amended), Related Party Transactions
The amendments clarify the definition of a related party. The new definitions emphasize a
symmetrical view of related party relationships and clarify the circumstances in which persons
and key management personnel affect related party relationships of an entity. In addition, the
new amendment introduces an exemption from the general related disclosure requirements for
transactions with the government and entities that are controlled, jointly controlled or
significantly influenced by the same government as the reporting entity.
·
PAS 32, Financial Instruments: Presentation (Amendment) - Classification of Rights Issues
The amendment to PAS 32 amended the definition of a financial liability to enable entities to
classify rights issues and certain options or warrants as equity instruments. The amendment is
applicable if the rights are given pro rata to all of the existing owners of the same class of an
entity’s non-derivative equity instruments, to acquire a fixed number of the entity’s own
equity instruments for a fixed amount in any currency.
·
Philippine Interpretation IFRIC 14 (Amendment), Prepayments of a Minimum Funding
Requirement
The amendment of the interpretation removes an unintended consequence when an entity is
subject to minimum funding requirements and makes an early payment of contributions to
cover such requirements. The amendment permits a prepayment of future service cost by the
entity to be recognized as a pension asset.
·
Philippine Interpretation IFRIC19, Extinguishing Financial Liabilities with Equity Instruments
The interpretation clarifies that equity instruments issued to a creditor to extinguish a financial
liability qualify as consideration paid. The equity instruments issued are measured at their fair
value. In case that this cannot be reliably measured, the instruments are measured at the fair
value of the liability extinguished. Any gain or loss is recognized immediately in profit or
loss.
Improvements to PFRSs
Improvements to PFRSs, an omnibus of amendments to standards, deal primarily with a view to
removing inconsistencies and clarifying wording. There are separate transitional provisions for
each standard. The adoption of the following amendments resulted in changes to accounting
policies but did not have any impact on the financial position or performance of the Group.
Improvements to PFRSs 2010
· PFRS 3, Business Combinations (Revised);
· PFRS 7, Financial Instruments: Disclosures;
· PAS 1, Presentation of Financial Statements;
· PAS 27, Consolidated and Separate Financial Statements; and
· Philippine Interpretation IFRIC 13, Customer Loyalty Programmes.
*SGVMC116496*
-9-
Standards issued but not yet effective
The Group will adopt the standards, interpretations and amendments enumerated below when
these become effective. Except as otherwise stated, the Group does not expect the adoption of
these new and amended PFRS and Philippine Interpretations to have significant impact on the
consolidated financial statements.
Effective in 2012
· PFRS 7, Financial Instruments: Disclosures – Enhanced Derecognition Disclosure
Requirements (effective for annual periods beginning on or after July 1, 2011)
This amendment requires additional disclosures about financial assets that have been
transferred but not derecognized to enable the users of the Group’s financial statements to
understand the relationship with those assets that have not been derecognized and their
associated liabilities. In addition, the amendment requires disclosures about continuing
involvement in derecognized assets to enable the users to evaluate the nature of and the risks
associated with the entity’s continuing involvement in those derecognized assets.
·
PAS 1, Financial Statement Presentation – Presentation of Items of Other Comprehensive
Income (OCI) (effective for annual periods beginning on or after July 1, 2012)
The amendments to PAS 1 change the grouping of items presented in OCI. Items that could be
reclassified (or “recycled”) to profit or loss at a future point in time (for example, upon
derecognition or settlement) would be presented separately from items that will never be
reclassified.
·
PAS 12, Income Taxes (Amendment) – Deferred Taxes: Recovery of Underlying Assets
(effective for annual periods beginning on or after January 1, 2012)
The amendment clarified the determination of deferred tax on investment property measured
at fair value. The amendment introduces a rebuttable presumption that deferred tax on
investment properties measured using the fair value model under PAS 40 should be
determined on the basis that its carrying amount will be recovered through sale. Furthermore,
it introduces the requirement that deferred tax on nondepreciable assets measured using the
revaluation model in PAS 16 always be measured on a sale basis of the asset.
Effective in 2013
· PFRS 7, Financial instruments: Disclosures – Offsetting Financial Assets and Financial
Liabilities (retrospectively applied for annual periods beginning on or after January 1, 2013)
These amendments require an entity to disclose information about rights of set-off and related
arrangements (such as collateral agreements). The new disclosures are required for all
recognized financial instruments that are set off in accordance with PAS 32. These disclosures
also apply to recognized financial instruments that are subject to an enforceable master netting
arrangement or ‘similar agreement’, irrespective of whether they are set-off in accordance
with PAS 32. The amendments require entities to disclose, in a tabular format unless another
format is more appropriate, the following minimum quantitative information. This is presented
separately for financial assets and financial liabilities recognized at the end of the reporting
period:
a) The gross amounts of those recognized financial assets and recognized financial liabilities;
b) The amounts that are set off in accordance with the criteria in PAS 32 when determining
the net amounts presented in the statement of financial position;
c) The net amounts presented in the statement of financial position;
*SGVMC116496*
- 10 -
d) The amounts subject to an enforceable master netting arrangement or similar agreement
that are not otherwise included in (b) above, including:
i. Amounts related to recognized financial instruments that do not meet some or all of
the offsetting criteria in PAS 32; and
ii. Amounts related to financial collateral (including cash collateral); and
e) The net amount after deducting the amounts in (d) from the amounts in (c) above.
·
PFRS 10, Consolidated Financial Statements (effective for annual periods beginning on or
after January 1, 2013)
PFRS 10 replaces the portion of PAS 27, Consolidated and Separate Financial Statements
that address the accounting for consolidated financial statements. It also includes the issues
raised in SIC-12 Consolidated – Special Purpose Entities.
PFRS 10 establishes a single control model that applies to all entities including special
purpose entities. The changes introduced by PFRS 10 will require management to exercise
significant judgment to determine which entities are controlled, and therefore, are required to
be consolidated by a parent, compared with the requirements that were in PAS 27.
·
PFRS 11, Joint Arrangements (effective for annual periods beginning on or after
January 1, 2013)
This standard replaces PAS 31, Interest on Joint Ventures and SIC-13 Jointly-controlled
Entities - Non-monetary Contributions by Venturers. The standard removes the option to
account for jointly controlled entities (JCEs) using proportionate consolidated. Instead, JCEs
that meet the definition of a joint control must be accounted for using the equity method.
·
PFRS 12, Disclosure of Interests in Other Entities (effective for annual periods beginning on
or after January 1, 2013)
This standard includes all disclosures that were previously in PAS 27 related to the
consolidated financial statements, as well as all the disclosures that were previously included
in PAS 31 and PAS 28. These disclosures relate to an entity’s interests in subsidiaries, joint
arrangements, associates and structured entities. A number of new disclosures are also
required.
·
PFRS 13, Fair Value Measurement (effective for annual periods beginning on or after
January 1, 2013)
This standard establishes a single source of guidance under PFRS for all fair value
measurements. The standard does not change when an entity is required to use fair value, but
rather provides guidance on how to measure fair value under PFRS when fair value is required
or permitted.
·
PAS 19, Employee Benefits (Amendment) (effective for annual periods beginning on or after
January 1, 2013)
The amendments focus on the following key areas: the elimination of the option to defer the
recognition of gains and losses resulting from defined benefit plans (the corridor approach);
the elimination of options for the presentation of gains and losses relating to those plans; and
the improvement of disclosure requirements that will better show the characteristics of defined
benefit plans and the risks arising from those plans. The amendments to the recognition,
presentation and disclosure requirements will ensure that the financial statements provide
investors and other users with a clear picture of an entity’s commitments resulting from
defined benefit plans.
*SGVMC116496*
- 11 ·
PAS 27, Separate Financial Statements (as revised in 2011) (effective for annual periods
beginning on or before January 1, 2013)
As a consequence of the new PFRS 10 and PFRS 12, what remains of PAS 27 is limited to
accounting for subsidiaries, jointly controlled entities and associates in separate financial
statements.
·
PAS 28, Investments in Associates and Joint Ventures (as revised in 2011) (effective for
annual periods beginning on or after January 1, 2013)
As a consequence of the new PFRS 11 and PFRS 12, PAS 28 has been remained PAS 28,
Investment in Associates and Joint Ventures. The standard describes the application of the
equity method to investments in joint ventures in addition to associates.
Effective in 2014
· PAS 32, Financial Instruments: Presentation – Offsetting Financial Assets and Financial
Liabilities (retrospectively applied for annual periods beginning on or after January 1, 2014)
These amendments to PAS 32 clarify the meaning of “currently has a legally enforceable right
to set-off” and also clarify the application of the PAS 32 offsetting criteria to settlement
systems (such as central clearing house systems) which apply gross settlement mechanisms
that are not simultaneous.
Effective in 2015
· PFRS 9, Financial Instruments: Classification and Measurement (effective for annual periods
beginning on or after January 1, 2015)
PFRS 9 as issued reflects the first phase of the IASBs work on the replacement of PAS 39 and
applies to classification and measurement of financial assets and financial liabilities as defined
in PAS 39. In subsequent phases, the IASB will address hedge accounting and impairment of
financial assets. The completion of this project is expected over the course of 2011 or in the
first half of 2012. The adoption of the first phase of PFRS 9 will have an effect on the
classification and measurement of the Parent Company’s financial assets, but will potentially
have no impact on classification and measurement of financial liabilities. The Parent
Company will quantify the effect in conjunction with other phases, when issued, to present a
comprehensive picture.
·
Philippine Interpretation IFRIC 15, Agreement for Construction of Real Estate (effective for
annual periods beginning on or after January 1, 2015)
This Interpretation covers accounting for revenue and associated expenses by entities that
undertake the construction of real estate directly or through subcontractors. The Interpretation
requires that revenue on construction of real estate be recognized only upon completion,
except when such contract qualifies as construction contract to be accounted for under
PAS 11, Construction Contracts, or involves rendering of services in which case revenue is
recognized based on stage of completion. Contracts involving provision of services with the
construction materials and where the risks and reward of ownership are transferred to the
buyer on a continuous basis will also be accounted for based on stage of completion.
*SGVMC116496*
- 12 -
Revenue Recognition
Revenue is recognized to the extent that it is probable that the economic benefits will flow to the
Group and the revenue can be reliably measured. The Group is acting as a principal in all of its
revenue arrangements. The following specific recognition criteria must also be met before
revenue is recognized:
Sale of goods
Revenue from sale of goods is recognized when goods are shipped or goods are received by the
customer depending on the corresponding agreement with the customers, title and risk of
ownership have passed, the price to the buyer is fixed or determinable and recoverability is
reasonably assured.
Rendering of services
Revenue from sale of services is recognized when the related services to complete the required
units have been rendered.
Interest
Interest income is recognized as it accrues using the effective interest rate method.
Dividends
Dividend income is recorded when the right of payment has been established.
Miscellaneous Income
Miscellaneous income is recognized as the Group earns the right over it.
Cash and Cash Equivalents
Cash includes cash on hand and in banks. Cash equivalents are short-term, highly liquid
investments that are readily convertible to known amounts of cash with original maturities of
three (3) months or less and that are subject to an insignificant risk of change in value.
Financial Instruments
Financial instruments within the scope of PAS 39 are classified as: (1) financial assets
and liabilities at fair value through profit or loss (FVPL); (2) loans and receivables;
(3) held-to-maturity (HTM) investments; (4) AFS financial assets; and (5) other financial
liabilities. The classification depends on the purpose for which the instruments were acquired and
whether they are quoted in an active market. Management determines the classification of its
investments at initial recognition and, where allowed and appropriate, re-evaluates this designation
at every reporting date.
Financial instruments are recognized in the consolidated balance sheet when the Group becomes a
party to the contractual provisions of the instrument. In the case of a regular way purchase or sale
of financial assets, recognition and derecognition, as applicable, are done using trade date
accounting. The Group follows the trade date accounting where an asset to be received and
liability to be paid are recognized on the trade date and the derecognition of an asset that is sold
and the recognition of a receivable from the buyer are likewise recognized on the trade date.
The subsequent measurement bases for financial instruments depend on its classification.
*SGVMC116496*
- 13 -
The financial instruments of the Group as of December 31, 2011 and 2010 consist of loans and
receivables, financial asset at FVPL, AFS financial assets, financial liability at FVPL and other
financial liabilities.
Determination of fair value
The fair value for a financial instrument traded in an active market at the reporting date is based on
its quoted market price or dealer price quotation (bid price for long positions and ask price for
short positions), without any deduction for transaction costs. When current bid and ask prices are
not available, the price of the most recent transaction provides evidence of the current fair value as
long as there has not been a significant change in economic circumstances since the time of the
transaction.
For all other financial instruments not listed in an active market, the fair value is determined by
using appropriate valuation methodologies. Valuation methodologies include net present value
techniques, comparison to similar instruments for which market observable prices exist, option
pricing models, and other relevant valuation models.
Day 1 profit
Where the transaction price in a non-active market is different from the fair value from other
observable current market transactions in the same instrument or based on a valuation technique
whose variables include only data from an observable market, the Group recognizes the difference
between the transaction price and fair value (a Day 1 profit) in the consolidated statement of
comprehensive income unless it qualifies for recognition as some other type of asset or liability.
In cases where use is made of data which is not observable, the difference between the transaction
price and model value is only recognized in the consolidated statement of comprehensive income
when the inputs become observable or when the instrument is derecognized. For each transaction,
the Group determines the appropriate method of recognizing the ‘Day 1’ profit amount.
Financial assets or financial liabilities at FVPL
Financial assets or financial liabilities at FVPL include derivatives, financial instruments held for
trading and financial instruments designated upon initial recognition as at FVPL.
Financial instruments are classified as held for trading if they are entered into for the purpose of
short-term profit-taking.
Derivatives, including separated embedded derivatives, are accounted for as financial assets or
liability at FVPL unless they are designated as effective hedging instruments or a financial
guarantee contract. Where a contract contains one or more embedded derivatives, the hybrid
contract may be designated as financial asset or liability at FVPL, except where the embedded
derivative does not significantly modify the cash flows or it is clear that separation of the
embedded derivative is prohibited.
Financial instruments may be designated at initial recognition as financial asset or liability at
FVPL if any of the following criteria are met: (1) the designation eliminates or significantly
reduces the inconsistent treatment that would otherwise arise from measuring the instrument or
recognizing gains or losses on a different basis; or (2) the instrument is part of a group of financial
instruments which are managed and their performance evaluated on a fair value basis, in
accordance with a documented risk management strategy; or (3) the financial instrument contains
an embedded derivative that would need to be separately recorded.
*SGVMC116496*
- 14 Financial instruments at FVPL are subsequently carried at fair value. Changes in fair value of
such assets or liabilities are accounted for in the consolidated statement of comprehensive income.
The Group uses currency forwards to hedge its risks associated with foreign currency fluctuations.
Such are accounted for as nonhedge derivatives.
An embedded derivative is separated from the host contract and accounted for as a derivative if all
of the following conditions are met: (a) the economic characteristics and risks of the embedded
derivative are not closely related to the economic characteristics of the host contract; (b) a separate
instrument with the same terms as the embedded derivative would meet the definition of a
derivative; and (c) the hybrid or combined instrument is not recognized at FVPL. The Group
assesses whether an embedded derivative is required to be separated from the host contract when
the Group first becomes party to the contract. Reassessment of embedded derivatives is only done
when there are changes in the contract that significantly modifies the contractual cash flows.
Loans and receivables
Loans and receivables are nonderivative financial assets with fixed or determinable payments that
are not quoted in an active market other than those that the Group intends to sell in the short term
or that it has designated as at FVPL. After initial measurement, loans and receivables are
subsequently carried at amortized cost using the effective interest rate method less any allowance
for impairment. Amortized cost is calculated taking into account any discount or premium on the
acquisition and includes fees that are an integral part of the effective interest rate and transaction
costs. Gains and losses are recognized in the consolidated statement of comprehensive income
when the loans and receivables are derecognized or impaired, as well as through the amortization
process. Loans and receivables are classified as current assets when the Group expects to realize
or collect the asset within twelve months from balance sheet date. Otherwise, these are classified
as noncurrent assets.
This accounting policy relates primarily to the Group’s cash and cash equivalents, loans and
receivables, noncurrent receivables and miscellaneous deposits.
AFS financial assets
AFS financial assets are those which are designated as such or do not qualify to be classified or
designated as at FVPL, loans and receivables or HTM investments. They are purchased and held
indefinitely, and may be sold in response to liquidity requirements or changes in market
conditions. AFS financial assets are classified as current assets if management intends to sell
these financial assets within 12 months from financial reporting. Otherwise, these are classified as
noncurrent assets.
After initial measurement, AFS financial assets are subsequently measured at fair value.
Dividends earned on holding AFS financial assets are recognized in the consolidated statement of
comprehensive income as dividend income when the right to receive payment has been
established. The unrealized gains and losses arising from the fair valuation of AFS financial assets
are reported under other comprehensive income. The losses arising from impairment of such
investments are recognized as impairment losses in profit or loss. When the security is disposed
of, the cumulative gain or loss previously recognized under other comprehensive income is
recognized as realized gains or losses in profit or loss.
When the fair value of AFS equity instruments cannot be measured reliably because of lack of
reliable estimates of future cash flows and discount rates necessary to calculate the fair value of
unquoted equity instruments, these investments are carried at cost, less any allowance for
impairment losses.
*SGVMC116496*
- 15 -
This accounting policy pertains to the Group’s investments in club shares.
Other financial liabilities
All loans and borrowings are initially recognized at the fair value of the consideration received
less directly attributable transaction costs. After initial recognition, interest-bearing loans and
borrowings are measured at amortized cost using the effective interest rate method. Gains and
losses are recognized in the consolidated statement of comprehensive income when the liabilities
are derecognized as well as through the amortization process. Financial liabilities are classified as
current liabilities if maturity is within 12 months from financial reporting. Otherwise, these are
classified as noncurrent liabilities.
This accounting policy relates primarily to the Group’s accounts payable and accrued expenses
(excluding customers’ deposits, statutory payables and taxes payable), trust receipts and loans
payable, lease liability and long-term debt.
Offsetting
Financial assets and financial liabilities are offset and the net amount reported in the consolidated
balance sheet if, and only if, there is a currently enforceable legal right to offset the recognized
amounts and there is an intention to settle on a net basis, or to realize the asset and settle the
liability simultaneously.
Impairment of Financial Assets
The Group assesses at each reporting date whether a financial asset or group of financial assets is
impaired.
A financial asset or a group of financial assets is deemed to be impaired if, and only if, there is
objective evidence of impairment as a result of one or more events that has occurred after the
initial recognition of the asset (an incurred loss event) and that loss event (or events) has an impact
on the estimated future cash flows of the financial asset or the group of financial assets that can be
reliably estimated. Evidence of impairment may include indications that the borrower or a group
of borrowers is experiencing significant financial difficulty, default or delinquency in interest or
principal payments, the probability that they will enter bankruptcy or other financial
reorganization and where observable data indicate that there is a measurable decrease in the
estimated future cash flows, such as changes in arrears or economic conditions that correlate with
defaults.
Loans and receivables
The Group first assesses whether objective evidence of impairment exists individually for
financial assets that are individually significant. If it is determined that no objective evidence of
impairment exists for an individually assessed financial asset, whether significant or not, the asset
is included in a group of financial assets with similar credit risk characteristics and that group of
financial assets is collectively assessed for impairment. Those characteristics are relevant to the
estimation of future cash flows for groups of such assets by being indicative of the debtors’ ability
to pay all amounts due according to the contractual terms of the assets being evaluated. Assets
that are individually assessed for impairment and for which an impairment loss is, or continues to
be recognized, are not included in a collective assessment for impairment.
If there is objective evidence that an impairment loss on loans and receivables carried at amortized
cost has been incurred, the amount of the loss is measured as the difference between the asset’s
carrying amount and the present value of estimated future cash flows (excluding future expected
credit losses that have not been incurred) discounted at the financial asset’s original effective
interest rate (i.e., the effective interest rate computed at initial recognition). The carrying amount
*SGVMC116496*
- 16 -
of the asset is reduced through the use of an allowance account and the amount of the loss is
charged to profit or loss. Receivables, together with the associated allowance accounts, are
written off when there is no realistic prospect of future recovery. If, in a subsequent period, the
amount of the impairment loss decreases and the decrease can be related objectively to an event
occurring after the impairment was recognized, the previously recognized impairment loss is
reversed to the extent that the carrying value of the asset does not exceed its amortized cost at the
reversal date. Any subsequent reversal of an impairment loss is recognized in profit or loss.
For the purpose of a collective evaluation of impairment, financial assets are grouped on the basis
of such credit risk characteristics as payment history and past-due status. Future cash flows in a
group of financial assets that are collectively evaluated for impairment are estimated on the basis
of historical loss experience for assets with credit risk characteristics similar to those in the group.
Historical loss experience is adjusted on the basis of current observable data to reflect the effects
of current conditions that did not affect the period on which the historical loss experience is based
and to remove the effects of conditions in the historical period that do not exist currently. The
methodology and assumptions used for estimating future cash flows are reviewed regularly by the
Group to reduce any differences between loss estimates and actual loss experience.
AFS financial assets
For the Group’s equity investments classified as AFS financial assets, impairment indicators
would include a significant or prolonged decline in the fair value of the investments below its cost.
Where there is evidence of impairment, the cumulative loss - measured as the difference between
the acquisition cost and the current fair value, less any impairment loss on that financial asset
previously charged to income - is removed from other comprehensive income and recognized in
profit or loss. Impairment losses on equity investments are not reversed through profit or loss.
Increases in fair value after impairment are recognized directly in other comprehensive income.
Derecognition of Financial Assets and Financial Liabilities
Financial asset
A financial asset (or, where applicable, a part of a financial asset or part of a group of similar
financial assets) is derecognized when:
· the right to receive cash flows from the asset have expired;
· the Group retains the right to receive cash flows from the asset, but has assumed an obligation to
pay them in full without material delay to a third party under a ‘pass-through’ arrangement; or
· the Group has transferred its right to receive cash flows from the asset and either: (a) has
transferred substantially all the risks and rewards of the asset; or (b) has neither transferred nor
retained substantially all the risks and rewards of the asset, but has transferred control of the
asset.
Where the Group has transferred its right to receive cash flows from an asset and has neither
transferred nor retained substantially all the risks and rewards of the asset nor transferred control
of the asset, the asset is recognized to the extent of the Group’s continuing involvement in the
asset.
Financial liability
A financial liability is derecognized when the obligation under the liability expires, or is
discharged or cancelled. Where an existing financial liability is replaced by another from the same
lender on substantially different terms, or the terms of an existing liability are substantially
modified, such an exchange or modification is treated as a derecognition of the original liability
and the recognition of a new liability, and the difference in the respective carrying amounts is
recognized in the consolidated statement of comprehensive income.
*SGVMC116496*
- 17 Inventories
Inventories are valued at the lower of cost or net realizable value (NRV). Cost is determined using
the moving average method for raw materials and supplies. For finished goods and work-inprocess, cost includes direct materials, direct labor and a proportion of manufacturing overhead
costs based on normal operating capacity determined using the moving average method. NRV is
the estimated selling price in the ordinary course of business, less the estimated costs of
completion and costs necessary to make the sale. In the event that NRV is lower than cost, the
decline shall be recognized as an expense in the consolidated statement of comprehensive income.
Business Combination and Goodwill
Business combinations from January 1, 2010
Business combinations are accounted for using the acquisition method. The cost of an acquisition
is measured as the aggregate of the consideration transferred, measured at acquisition date fair
value, and the amount of any noncontrolling interest in the acquiree. For each business
combination, the acquirer measures the noncontrolling interest in the acquiree either at fair value
or at the proportionate share of the acquiree’s identifiable net assets. Acquisition costs incurred
are expensed and included in administrative expenses.
When the Group acquires a business, it assesses the financial assets and liabilities assumed for
appropriate classification and designation in accordance with the contractual terms, economic
circumstances and pertinent conditions as at the acquisition date. This includes the separation of
embedded derivatives in host contracts by the acquiree.
If the business combination is achieved in stages, the acquisition date fair value of the acquirer’s
previously held equity interest in the acquiree is remeasured to fair value at the acquisition date
through profit or loss.
Any contingent consideration to be transferred by the acquirer will be recognized at fair value at
the acquisition date. Subsequent changes to the fair value of the contingent consideration which is
deemed to be an asset or liability will be recognized in accordance with PAS 39 either in profit or
loss or as a change to other comprehensive income. If the contingent consideration is classified as
equity, it should not be remeasured until it is finally settled within equity.
Goodwill is initially measured at cost, being the excess of the aggregate of the consideration
transferred and the amount recognized for non controlling interest over the net identifiable assets
acquired and liabilities assumed. If this consideration is lower than the fair value of the net assets
of the subsidiary acquired, the difference is recognized in profit or loss.
Following initial recognition, goodwill is measured at cost less any accumulated impairment loss.
Goodwill is reviewed for impairment, annually or more frequently if events or changes in
circumstances indicate that the carrying value may be impaired. For the purpose of impairment
testing, goodwill acquired in a business combination is, from the acquisition date, allocated to each
of the Group’s cash-generating units (CGUs), or groups of CGUs, that are expected to benefit from
the synergies of the combination, irrespective of whether other assets or liabilities of the Group are
assigned to those units or groups of units. Each unit or group of units to which the goodwill is
allocated should:
·
·
represent the lowest level within the Group at which the goodwill is monitored for internal
management purposes; and
not be larger than an operating segment determined in accordance with PFRS 8.
*SGVMC116496*
- 18 -
Impairment is determined by assessing the recoverable amount of the CGU (or group of CGUs), to
which the goodwill relates. Where the recoverable amount of the CGU (or group of CGUs) is less
than the carrying amount, an impairment loss is recognized. Where goodwill forms part of a CGU
(or group of CGUs) and part of the operation within that unit is disposed of, the goodwill associated
with the operation disposed of is included in the carrying amount of the operation when determining
the gain or loss on disposal of the operation. Goodwill disposed of in these circumstances is
measured based on the relative values of the operation disposed of and the portion of the CGU
retained. If the acquirer’s interest in the net fair value of the identifiable assets, liabilities and
contingent liabilities exceeds the cost of the business combination, the acquirer shall recognize
immediately in the consolidated statement of comprehensive income any excess remaining after
reassessment.
Business combinations prior to January 1, 2010
In comparison to the above-mentioned requirements, the following differences applied:
Business combinations were accounted for using the purchase method. Transaction costs directly
attributable to the acquisition formed part of the acquisition costs. The noncontrolling interest
(formerly known as minority interest) was measured at the proportionate share of the acquiree’s
identifiable net assets.
Business combinations achieved in stages were accounted for as separate steps. Any additional
acquired share of interest did not affect previously recognised goodwill.
When the Group acquired a business, embedded derivatives separated from the host contract by
the acquiree were not reassessed on acquisition unless the business combination resulted in a
change in the terms of the contract that significantly modified the cash flows that otherwise would
have been required under the contract.
Contingent consideration was recognized if, and only if, the Group had a present obligation, the
economic outflow was more likely than not and a reliable estimate was determinable. Subsequent
adjustments to the contingent consideration were recognized as part of goodwill. Goodwill
acquired in a business combination is initially measured at cost, being the excess of the cost of the
business combination over the Group’s interest in the net fair value of the identifiable assets,
liabilities and contingent liabilities of the acquired entity at the date of acquisition.
Property, Plant and Equipment
Property, plant and equipment are carried at cost, net of accumulated depreciation and
amortization and any impairment loss.
The cost of projects in progress include costs of construction of plant and equipment and
machinery items installed and any other cost directly attributable to bringing the asset to its
intended use. Projects in progress are not depreciated and amortized until such time as the
relevant assets are completed and put into operational use.
The initial cost of property, plant and equipment consists of its purchase price and any directly
attributable cost of bringing the asset to its working condition and location for its intended use.
Expenditures incurred after the fixed assets have been put into operation, such as repairs and
maintenance and overhaul costs, are normally charged against operations income in the period in
which the costs are incurred. In situations where it can be clearly demonstrated that the
expenditures have resulted in an increase in the future economic benefits expected to be obtained
*SGVMC116496*
- 19 -
from the use of an item of property, plant and equipment beyond its originally assessed standard of
performance, the expenditures are capitalized as additional costs of property, plant and equipment.
Upon retirement or sale, the cost of the asset disposed and the related accumulated depreciation or
amortization are removed from the accounts and any resulting gain or loss is included in the
consolidated statement of comprehensive income.
Depreciation and amortization are computed on a straight-line basis over the estimated useful lives
(EUL) of the respective assets as follows:
Buildings
Building improvements
Machinery and facilities equipment
Furniture, fixtures and office equipment
Transportation equipment
Tools and instruments
Years
25 - 30
5
7 - 10
3-5
3-5
2-5
Leasehold improvements are amortized over the shorter of the related lease terms or their EUL of
5 years.
The EUL of property, plant and equipment are reviewed annually based on expected asset
utilization as anchored on business plans and strategies that also consider expected future
technological developments and market behavior to ensure that the period of depreciation and
amortization is consistent with the expected pattern of economic benefits from items of property,
plant and equipment. Adjustments to the EUL are accounted for prospectively.
Borrowing Costs
Borrowing costs directly attributable to the acquisition, construction or production of an asset that
necessarily takes a substantial period of time to get ready for its intended use or sale are
capitalized as part of the cost of the respective assets. All other borrowing costs are expensed in
the period they occur. Borrowing costs consist of interest and other costs that an entity incurs in
connection with the borrowing of funds.
Investments in Subsidiaries
Investments in subsidiaries in the Parent Company's separate financial statements are accounted
for under cost method of accounting. Dividends received are reported as dividend income when
the right to receive the payment is established.
Intangible Assets
Intangible assets acquired separately are measured on initial recognition at cost. The cost of
intangible assets acquired in a business combination is the fair value as of the date of acquisition.
Following initial recognition, intangible assets are carried at cost less any accumulated
amortization and any accumulated impairment loss. The EUL of intangible assets with finite life
are assessed at the individual asset level. Intangible assets with finite life are amortized over their
EUL using the straight line method. The amortization periods and method of amortization for
intangible assets with finite useful lives are reviewed annually or earlier when an indicator of
impairment exists.
*SGVMC116496*
- 20 -
The EUL of intangible assets are as follows:
Customer relationships
Unpatented technology
Computer software
Years
5
5
3
Intangible assets with indefinite useful lives are not amortized, but are tested for impairment
annually, either individually or at the cash-generating unit level. The assessment of indefinite life
is reviewed annually to determine whether the indefinite life continues to be supportable. If not,
the change in useful life from indefinite to finite is made on a prospective basis.
A gain or loss arising from derecognition of an intangible asset is measured as the difference
between the net disposal proceeds and the carrying amount of the asset and is recognized in the
consolidated statement of comprehensive income when the asset is derecognized.
Impairment of Nonfinancial Assets
An assessment is made at the reporting date to determine whether there is any indication that an
asset may be impaired, or whether there is any indication that an impairment loss previously
recognized for an asset in prior periods may no longer exist or may have decreased. If any such
indication exists or when annual impairment testing for an asset is required, the Group makes an
estimate of the asset’s recoverable amount. The recoverable amount of an asset is the greater of its
net selling price and value in use. Where the carrying value of an asset exceeds its estimated
recoverable amount, the asset or CGU to which the asset belongs is written down to its
recoverable amount. An impairment loss is charged against operations in the period in which it
arises.
Property, plant and equipment and intangible assets
A previously recognized impairment loss is reversed only if there has been a change in estimate
used to determine the recoverable amount of an asset, however, not to an amount higher than the
carrying amount that would have been determined (net of any accumulated depreciation and
amortization for property, plant and equipment and intangible assets) had no impairment loss been
recognized for the asset in prior periods. A reversal of an impairment loss is credited to current
operations. After such reversal, the depreciation and amortization charge is adjusted in future
periods to allocate the asset’s revised carrying amount, less any residual value, on a systematic
basis over its remaining useful life.
Goodwill
Impairment losses relating to goodwill cannot be reversed in the future.
Income Tax
Current tax
Current tax assets and liabilities for the current and prior periods are measured at the amount
expected to be recovered from or paid to the tax authority. The tax rates and tax laws used to
compute the amount are those that are enacted or substantively enacted as at end of the reporting
period.
Deferred tax
Deferred tax is provided, using the liability method, on all temporary differences at the end of the
reporting period between the tax bases of assets and liabilities and their carrying amounts for
financial reporting purposes.
*SGVMC116496*
- 21 -
Deferred tax liabilities are recognized for all taxable temporary differences. Deferred tax assets
are recognized for all deductible temporary differences, carryforward of unused tax credits and
unused tax losses, to the extent that it is probable that taxable income will be available against
which the deductible temporary differences and carryforward of unused tax credits and unused tax
losses can be utilized, except:
·
·
Where the deferred tax asset relating to the deductible temporary differences arises from the
initial recognition of an asset or liability in a transaction that is not a business combination
and, at the time of the transaction, affects neither the accounting income nor taxable income or
loss; and
In respect of taxable temporary differences associated with investments in subsidiaries,
associates and interests in joint ventures, deferred tax assets are recognized only to the extent
that it is probable that the temporary differences will reverse in the foreseeable future and
taxable income will be available against which the temporary differences can be utilized.
The carrying amount of deferred tax assets is reviewed at the end of the reporting period and
reduced to the extent that it is no longer probable that sufficient taxable income will be available
to allow all or part of the deferred tax assets to be utilized.
Deferred tax assets and liabilities are measured at the tax rate that is expected to apply to the
period when the asset is realized or the liability is settled, based on tax rates (and tax laws) that
have been enacted or substantively enacted as of the reporting date.
Income tax relating to items recognized in other comprehensive income is recognized in the
consolidated statement of comprehensive income under other comprehensive income.
Deferred tax assets and deferred tax liabilities are offset if a legally enforceable right exists to set
off current tax assets against current tax liabilities and the deferred taxes relate to the same taxable
entity and the same taxation authority.
For periods where an ITH is in effect, no deferred taxes are recognized in the consolidated
financial statements as the ITH status of the Group neither results in a deductible temporary
difference or temporary taxable difference. However, for temporary differences that are expected
to reverse beyond the ITH, deferred taxes are recognized.
Equity
Capital stock is measured at par value for all shares issued and outstanding. When the shares are
sold at premium, the difference between the proceeds at the par value is credited to “Additional
paid-in capital” account. Direct costs incurred related to equity issuance, such as underwriting,
accounting and legal fees, printing costs and taxes are charged to “Additional paid-in capital”
account. If additional paid-in capital is not sufficient, the excess is charged against retained
earnings. When the Group issues more than one class of stock, a separate account is maintained
for each class of stock and the number of shares issued.
Subscriptions receivable pertains to the uncollected portion of the subscribed shares.
Retained earnings represent net accumulated earnings of the Group less dividends declared.
Appropriated retained earnings are set aside for future expansion.
*SGVMC116496*
- 22 -
Treasury stock is recorded at cost and is presented as a deduction from equity. When the shares
are retired, the capital stock account is reduced by its par value and the excess of cost over par
value upon retirement is debited to additional paid-in capital to the extent of the specific or
average additional paid-in capital when the shares were issued and to retained earnings for the
remaining balance.
Foreign Currency Transactions
The functional and presentation currency of the Parent Company and its subsidiaries (except for
EPIQ EA, EPIQ CZ, EPIQ MX, IMI France, and Cooperatief) is the U.S. Dollar. Each entity in
the Group determines its own functional currency and items included in the financial statements of
each entity are measured using that functional currency. Transactions in foreign currencies are
initially recorded in the functional currency rate ruling at the date of the transaction. Monetary
assets and liabilities denominated in foreign currencies are retranslated at the functional currency
rate of exchange ruling at the reporting date. All differences are taken to the consolidated
statement of comprehensive income. Nonmonetary items that are measured in terms of historical
cost in a foreign currency are translated using the exchange rate as at the date of initial transaction.
Nonmonetary items measured at fair value in a foreign currency are translated using the exchange
rate at the date when the fair value was determined.
The functional currencies of EPIQ EA, EPIQ CZ, and EPIQ MX, are the Bulgarian Lev (BGN),
Czech Koruna (CZK) and Mexican Peso (MXN), respectively. The functional currency of IMI
France and Cooperatief is the Euro (€). These subsidiaries mostly use their local currencies for
their daily transactions. As at the reporting date, the assets and liabilities of these subsidiaries are
translated into the presentation currency of the Group at the rate of exchange ruling at the
reporting date and their profit and loss accounts are translated at the weighted average exchange
rates for the year. The exchange differences arising on the translation are recognized in the
consolidated statement of comprehensive income and reported as a separate component of equity.
On disposal of a foreign entity, the deferred cumulative amount recognized in the consolidated
statement of comprehensive income relating to that particular foreign operation shall be
recognized in profit or loss.
Pensions and Other Employee Benefits
Defined contribution plans
The Parent Company’s subsidiaries in Singapore, PRC and Hong Kong participate in their
respective national pension schemes which are considered as defined contribution plans. A
defined contribution plan is a pension plan under which the subsidiary pays fixed contributions.
The subsidiary has no legal or constructive obligations to pay further contributions if the fund does
not hold sufficient assets to pay all the employees the benefits relating to employee service in the
current and prior periods. The required contributions to the national pension schemes are
recognized as pension cost as accrued.
Singapore
The subsidiaries incorporated and operating in Singapore make contributions to the Central
Provident Fund scheme in Singapore, a defined contribution pension scheme. Contributions to
national pension schemes are recognized as an expense in the period in which the related service is
performed.
PRC
The subsidiaries incorporated and operating in PRC are required to provide certain staff pension
benefits to their employees under existing PRC regulations. Pension contributions are provided at
rates stipulated by PRC regulations and are contributed to a pension fund managed by government
agencies, which are responsible for administering these amounts for the subsidiaries’ employees.
*SGVMC116496*
- 23 -
Hong Kong
The subsidiary in Hong Kong participates in the defined Provident Fund. The subsidiary and its
employees make monthly contributions to the scheme at 5% of the employees’ earnings as defined
under the Mandatory Provident Fund legislation. The contributions of the subsidiary and the
employees are subject to a cap of HK$1,000 per month and thereafter, contributions are voluntary.
EPIQ CZ
EPIQ CZ, under its Collective Agreement, is committed to pay contributions to life and pension
insurance of its loyal employees. This is done on a monthly basis as part of payroll expenses and
only over the employment period. EPIQ CZ is not obliged to any other payments if employment
terminates.
Defined benefit plans
The Parent Company, PSi and EPIQ EA maintain separate defined benefit plans covering
substantially all of their employees. The plans of the Parent Company and PSi are funded,
noncontributory pension plans administered by their respective Boards of Trustees, while that of
EPIQ EA is unfunded and noncontributory. Pension cost is actuarially determined using the
projected unit credit method. This method reflects services rendered by employees up to the date
of valuation and incorporates assumptions concerning employees’ projected salaries. Actuarial
valuations are conducted with sufficient regularity, with the option to accelerate when significant
changes to underlying assumptions occur. Pension cost includes current service cost, interest cost,
expected return on any plan assets, actuarial gains and losses, past service cost and the effect of
any curtailment or settlement.
A portion of the actuarial gains and losses is recognized as income or expense if the cumulative
unrecognized actuarial gains and losses at the end of the previous reporting period exceeded the
greater of 10% of the present value of the defined benefit obligation or 10% of the fair value of the
plan assets. These gains and losses are recognized over the expected average remaining working
lives of the employees participating in the plan.
Past service costs, if any, are recognized immediately in the consolidated statement of
comprehensive income, unless the changes to the pension plan are conditional on the employees
remaining in service for a specified period of time (the vesting period). In this case, the pastservice costs are amortized on a straight-line basis over the vesting period. The net pension asset
recognized in respect of the defined benefit pension plan is the lower of: (a) the fair value of the
plan assets less the present value of the defined benefit obligation at the reporting date, together
with adjustments for unrecognized actuarial gains or losses and past service costs that shall be
recognized in later periods; or (b) the total of any cumulative unrecognized net actuarial loss and
past service cost and the present value of any economic benefit available in the form of refunds
from the plan or reductions in future contributions to the plan. If there is no minimum funding
requirement, an entity shall determine the economic benefit available as a reduction in future
contributions as the lower of: (a) the surplus in the plan; and (b) the present value of the future
service cost to the entity, excluding any part of the future cost that will be borne by employees, for
each year over the shorter of the expected life of the plan and the expected life of the entity.
The defined benefit obligation is calculated annually by independent actuaries using the projected
unit credit method. The present value of the defined benefit obligation is determined by
discounting the estimated future cash outflows using risk-free interest rates of government bonds
that have terms to maturity approximating the terms of the related pension liability or applying a
single weighted average discount rate that reflects the estimated timing and amount of benefit
payments.
*SGVMC116496*
- 24 -
Employee leave entitlement
Employee entitlements to annual leave are recognized as a liability when they accrue to
employees. A provision is made for the estimated liability for leave as a result of services
rendered by employees up to the reporting date.
Share-based Payment Transactions
Certain employees (including directors) of the Group receive remuneration in the form of sharebased payment transactions, whereby employees render services in exchange for shares or rights
over shares (“equity-settled transactions”).
The Group has an employee stock ownership plan (ESOWN) which allows the grantees to
purchase the Parent Company’s shares at a discounted price. The Group recognizes the difference
between the market price at the time of subscription and the subscription price as employee benefit
expense over the holding period.
Earnings Per Share
Basic earnings per share (EPS) is computed by dividing net income attributable to common equity
holders by the weighted average number of common shares outstanding and adjusted to give
retroactive effect to any stock dividends declared during the period. Diluted EPS is computed by
dividing net income attributable to common equity holders by the weighted average number of
common shares outstanding plus the weighted average number of common shares that would be
issued on conversion of all the dilutive potential common shares. The calculation of diluted
earnings per share does not assume conversion, exercise or other issue of potential common shares
that would have an antidilutive effect on earnings per share.
Leases
The determination of whether an arrangement is, or contains a lease, is based on the substance of
the arrangement and requires an assessment of whether the fulfillment of the arrangement is
dependent on the use of a specific asset or assets and the arrangement conveys a right to use the
asset. A reassessment is made after inception of the lease only if one of the following applies:
a. There is a change in contractual terms, other than a renewal or extension of the arrangement;
b. A renewal option is exercised or extension granted, unless that term of the renewal or
extension was initially included in the lease term;
c. There is a change in the determination of whether fulfillment is dependent on a specified asset;
or
d. There is a substantial change to the asset.
Where a reassessment is made, lease accounting shall commence or cease from the date when the
change in circumstances gave rise to the reassessment for scenarios a, c or d above, and at the date
of renewal or extension period for scenario b.
Finance leases, which transfer to the Group substantially all the risks and benefits incidental to
ownership of the leased item, are capitalized at the inception of the lease at the fair value of the
leased property or, if lower, at the present value of the minimum lease payments and included in
the “Property, plant and equipment” account with the corresponding liability to the lessor included
in the “Accounts payable and accrued expenses” account for the current portion and “Obligation
under finance lease - noncurrent” account for the noncurrent portion in the consolidated balance
sheet. Lease payments are apportioned between the finance charges and reduction of the lease
liability so as to achieve a constant rate of interest on the remaining balance of the liability.
Finance charges are charged directly as “Interest expense” in the consolidated statement of
comprehensive income.
*SGVMC116496*
- 25 -
Leases where the lessor does not transfer substantially all the risks and benefits of ownership of
the assets are classified as operating leases. Operating lease payments are recognized as expense
in the consolidated statement of comprehensive income on a straight-line basis over the lease term.
Expenses
Expenses of the Group include cost of goods sold, cost of services, and operating expenses. Cost
of goods sold and services pertain to the direct expenses incurred by the Group related to the
products and services offered. Operating expenses pertain to the general and administrative
expenses. Cost of goods sold and services are recognized when the related goods are sold and
when services are rendered. Operating expenses are recognized when incurred except for rent
expense which is computed on a straight line basis over the lease term.
Provisions
Provisions are recognized only when the following conditions are met: (a) there exists a present
obligation (legal or constructive) as a result of a past event; (b) it is probable (i.e., more likely than
not) that an outflow of resources embodying economic benefits will be required to settle the
obligation; and (c) a reliable estimate can be made of the amount of the obligation. Provisions are
reviewed at each balance sheet date and adjusted to reflect the current best estimate. If it is no
longer probable that an outflow of resources embodying economic benefits will be required to
settle the obligation, the provision is reversed.
Contingencies
Contingent liabilities are not recognized in the consolidated financial statements. These are
disclosed unless the possibility of an outflow of resources embodying economic benefits is
remote. A contingent asset is not recognized in the consolidated financial statements but disclosed
when an inflow of economic benefits is probable. Where the Group expects some or all of a
provision to be reimbursed, for example an insurance claim, the reimbursement is recognized as a
separate asset but only when the reimbursement is virtually certain.
Events after the Reporting Period
Post year-end events that provide additional information about the Group’s position at the end of
the reporting period (adjusting events) are reflected in the consolidated financial statements. Post
year-end events that are non-adjusting events are disclosed in the consolidated financial statements
when material.
4. Significant Accounting Judgments, Estimates and Assumptions
The preparation of the consolidated financial statements in conformity with PFRS requires
management to make estimates and assumptions that affect the amounts reported in the
consolidated financial statements and accompanying notes. The estimates and assumptions used
are based upon management’s evaluation of relevant facts and circumstances as at the date of the
consolidated financial statements. Actual results could differ from such estimates.
Judgments
In the process of applying the Group’s accounting policies, management has made the following
judgments, apart from those involving estimations, which have the most significant effect on the
amounts recognized in the consolidated financial statements.
*SGVMC116496*
- 26 Functional currency
PAS 21 requires management to use its judgment to determine the entity’s functional currency
such that it most faithfully represents the economic effects of the underlying transactions, events
and conditions that are relevant to the entity. In making this judgment, the Group considers the
currency in which the sales prices for its goods and services are denominated and settled. Further
details are given in Note 3.
Operating lease - Group as lessor
In agreement with the original lessor, the Parent Company subleased a portion of the property it
occupies. Based on the evaluation of the terms and conditions of the arrangement between the
Parent Company and the sublessee, the contract is an operating lease. The sublease agreement
expired in March 2011.
Operating and finance lease commitments - Group as lessee
The Group has entered into various lease agreements for office equipment, office spaces and land
as lessee. The Group has determined that it has not acquired the significant risks and rewards of
ownership of the leased properties and so account for the contracts as operating leases.
The Parent Company has entered into finance lease agreements covering certain office equipment.
EPIQ EA and EPIQ CZ have various finance lease contracts related to machineries and production
equipment and transportation equipment. They have determined, based on the evaluation of the
terms and conditions of the arrangement, that they bear substantially all the risks and rewards
incidental to ownership of the said machineries and equipment and so account for the contracts as
finance leases (see Note 29).
Impairment of AFS equity investments
The Group treats AFS equity investments as impaired when there has been a significant or
prolonged decline in the fair value below the cost of these investments or where other objective
evidence of impairment exists. The determination of what is ‘significant’ or ‘prolonged’ requires
judgment. The Group treats ‘significant’ generally as 20% or more and ‘prolonged’ as greater
than 6 months for quoted equity securities. In addition, the Group evaluates other factors, such as
normal volatility in share price for quoted equities.
Contingent liabilities
The Group is currently involved in various legal proceedings and tax assessments. The estimate
of the probable costs of the resolutions and assessments of these claims have been developed in
consultation with outside counsels handling the defense in these matters and are based upon an
analysis of potential results. The Group currently does not believe these proceedings and tax
assessments will have a material effect on the Group’s financial position. It is possible, however,
that future results of operations could be materially affected by changes in the estimates or in the
effectiveness of the strategies relating to these proceedings (see Note 33).
Receivable from insurance
On May 24, 2009, a fire incident occurred in the Parent Company’s plant in Cebu, Philippines.
The plant was covered by insurance and the Parent Company believes that the collection of the
insurance proceeds is virtually certain. As of December 31, 2009, the Parent Company recognized
receivable and gain from the insurance claim amounting to $5.62 million for damages to
equipment and inventories caused by the fire incident (see Note 6).
*SGVMC116496*
- 27 -
Estimates and Assumptions
The key assumptions concerning the future and other sources of estimation uncertainty at the end
of the reporting period that have significant risks of causing a material adjustment to the carrying
amounts of assets and liabilities within the next financial year are discussed below.
Impairment of loans and receivables
The Group reduces the carrying amount of its loans and receivables through the use of an
allowance account if there is objective evidence that an impairment loss on the loans and
receivables have been incurred, based on the result of the individual and collective impairment
assessments. Factors considered are payment history and past due status. The carrying amounts
of the loans and receivables, net of the allowance for doubtful accounts, amounted to $133.68
million and $104.26 million as of December 31, 2011 and 2010, respectively. Allowance for
doubtful accounts amounted to $3.40 million and $1.37 million as of December 31, 2011 and
2010, respectively. Further details are given in Note 6.
Estimating NRV of Inventories
Inventories are valued at the lower of cost or NRV. This requires the Group to make an estimate
of the inventories’ estimated selling price in the ordinary course of business, costs of completion
and costs necessary to make a sale to determine the NRV. In the event that NRV is lower than
cost, the decline is recognized as an expense. Inventories carried at cost amounted to
$51.61 million and $19.72 million as of December 31, 2011 and 2010, respectively. Inventories
carried at NRV amounted to $28.80 million and $34.98 million as of December 31, 2011 and
2010, respectively. Allowance for inventory obsolescence amounted to $4.85 million and
$3.73 million as of December 31, 2011 and 2010, respectively. Further details are given in
Note 7.
Depreciation and amortization
The Group computes depreciation and amortization of property, plant and equipment on a straightline basis over the assets’ EUL. The EUL and depreciation and amortization method are reviewed
periodically to ensure that these are consistent with the expected pattern of the economic benefits
from the assets. This requires the Group to make an estimate of the expected asset utilization from
business plans and strategies, future technical developments and market behavior to determine the
expected pattern of economic benefits from the assets. Property, plant and equipment, net of
accumulated depreciation, amortization and impairment loss, amounted to $97.51 million and
$74.62 million as of December 31, 2011 and 2010, respectively. Depreciation and amortization
expense on property, plant and equipment amounted to $24.62 million, $19.37 million and
$18.06 million for the years ended December 31, 2011, 2010 and 2009 respectively. Further
details are given in Notes 9, 19 and 20.
The Group computes amortization of intangible assets on a straight-line basis over the assets’
EUL. The amortization period and the amortization method for an intangible asset with a finite
useful life are reviewed at each financial year end. Changes in the expected useful life or the
expected pattern of consumption of future economic benefits embodied in the asset are accounted
for by changing the amortization period or method, as appropriate, and treated as changes in
accounting estimates. The amortization expense on intangible assets with finite lives is recognized
in the consolidated statements of comprehensive income in the expense category consistent with
the function of the intangible asset. Intangible assets, net of accumulated amortization, amounted
to $7.33 million and $0.92 million as of December 31, 2011 and 2010, respectively. Amortization
expense amounted to $1.16 million, $2.65 million and $2.74 million for the years ended
December 31, 2011, 2010 and 2009, respectively. Further details are given in Note 11.
*SGVMC116496*
- 28 -
Impairment of property, plant and equipment and intangible assets
The Group determines at the end of each reporting period whether there is any indication that an
item of property, plant and equipment and intangible assets with finite useful lives may be
impaired, or whether there is any indication that an impairment loss previously recognized for an
asset in prior periods may no longer exist or may have decreased. If any such indication exists and
when the carrying amount of an asset exceeds its estimated recoverable amount, the asset or the
CGU to which the asset belongs is written down to its recoverable amount.
Property, plant and equipment, net of accumulated depreciation, amortization and impairment loss,
amounted to $97.51 million and $74.62 million as of December 31, 2011 and 2010, respectively.
No impairment loss was recognized in 2011, 2010, and 2009. Intangible assets, net of
accumulated amortization, amounted to $7.33 million and $0.92 million as of December 31, 2011
and 2010, respectively. No impairment was recognized for the intangible assets in 2011, 2010 and
2009. Further details are given in Notes 9, 11, 19 and 20.
Impairment of goodwill
The Group determines whether goodwill is impaired at least on an annual basis. This requires an
estimation of the recoverable amount which is the net selling price or value in use of the CGUs to
which the goodwill is allocated. When value in use calculations are undertaken, management
must estimate the expected future cash flows from the asset or CGU and choose a suitable
discount rate in order to calculate the present value of those cash flows. As of December 31, 2011
and 2010, the goodwill impairment determined by the Group amounted to $2.72 million and nil,
respectively. Goodwill amounted to $54.36 million and $56.42 million as of December 31, 2011
and 2010, respectively. Further details are given in Note 10.
Impairment of AFS financial assets
The Group classifies certain assets as AFS and recognizes movements in their fair value in other
comprehensive income. When the fair value declines, management makes assumptions about the
decline in value to determine whether it is an impairment that should be recognized in profit or
loss. In 2011, 2010, and 2009, no impairment losses have been recognized on AFS financial
assets. The carrying amount of AFS financial assets of the Group amounted to $0.41 million and
$0.38 million as of December 31, 2011 and 2010, respectively.
Deferred tax assets
The Group reviews the carrying amounts of its deferred tax assets at the end of each reporting
period and reduces the deferred tax assets to the extent that it is no longer probable that sufficient
taxable income will be available to allow all or part of the deferred tax assets to be utilized.
However, there is no assurance that the Group will generate sufficient taxable income to allow all
or part of its deferred tax assets to be utilized.
As of December 31, 2011 and 2010, the Group has deferred tax assets of $0.74 million and
$1.0 million, respectively. Further details are given in Note 24.
Pension and other employee benefits
The cost of defined benefit pension plans and the present value of the pension obligation are
determined using actuarial valuations. An actuarial valuation involves making various
assumptions that may differ from actual developments in the future. These include the
determination of the discount rate, future salary increases, mortality rates and future pension
increases. Due to the complexity of the valuation, the underlying assumptions and its long-term
nature, a defined benefit obligation is highly sensitive to changes in these assumptions. All
assumptions are reviewed at each reporting date.
*SGVMC116496*
- 29 -
In determining the appropriate discount rate, management considers the interest rates of corporate
bonds in the respective currency with at least AA rating, with extrapolated maturities
corresponding to the expected duration of the defined benefit obligation. The underlying bonds are
further reviewed for quality, and those having excessive credit spreads are removed from the
population of bonds on which the discount rate is based, on the basis that they do not represent
high quality bonds.
The mortality rate is based on publicly available mortality tables for the specific country. Future
salary increases and pension increases are based on expected future inflation rates for the
respective country.
As of December 31, 2011, 2010 and 2009, the Group has unrecognized actuarial gains (losses) of
($4.92) million, ($2.71) million and $2.84 million, respectively. Further details are given in
Note 26.
The Group also estimates other employee benefit obligations and expenses, including the cost of
paid leaves based on historical leave availments of employees, subject to the Group’s policy.
These estimates may vary depending on the future changes in salaries and actual experiences
during the period. Current accrued leaves as of December 31, 2011 and 2010 amounting to
$2.14 million and $2.47 million, respectively, are recognized under “Accounts payable and
accrued expenses”, while noncurrent accrued leaves as of December 31, 2011 and 2010 amounting
to $0.23 million and $0.37 million are recognized under “Other long-term employee benefits” in
the consolidated balance sheets. Cost of leaves in 2011, 2010 and 2009 amounted to
$2.65 million, $1.94 million and $1.62 million, respectively, recognized under “Direct labor,
salaries, wages and employee benefits” under “Cost of goods sold and services” and “Operating
expenses” in the consolidated statements of comprehensive income.
While the Group believes that the assumptions are reasonable and appropriate, significant
differences between actual experiences and assumptions may materially affect the cost of
employee benefits and related obligations.
Share-based payment transactions
For share-based payment granted prior to 2010, the Group determined the cost of equity-settled
shares based on the multiples of net book value, earnings before income tax, depreciation and
amortization and net income of 10 comparable Asian EMS companies as at the close of the
calendar year prior to the grant.
For the grant made in 2010, the cost of equity-settled shares was based on the market value of the
Parent Company’s stocks as quoted at the PSE at the date of grant.
For the years ended December 31, 2011, 2010 and 2009, the Group recognized cost of equitysettled share options amounting to $0.67 million, $1.93 million and $0.51 million, respectively.
Further details are given in Note 27.
Provision for warranty
A provision for warranty is recognized for all products under warranty at the reporting date based
on experience with the level of repairs or returns.
For the years ended December 31, 2011, 2010 and 2009, the Group recognized (reversal of)
provision for warranty amounting to nil, ($0.02) million and $0.01 million, respectively. Further
details are given in Note 14.
*SGVMC116496*
- 30 -
Recognition and measurement of taxes
The Group has exposure to taxes in numerous jurisdictions. Significant judgment is involved in
determining the group-wide provision for taxes including value-added tax, consumption tax and
customs duty. There are certain transactions and computations for which the ultimate tax
determination is uncertain during the ordinary course of business. The Group recognizes
liabilities for expected tax issues based on estimates of whether additional taxes are due. Where
the final tax outcome of these matters is different from the amounts that were initially recognized,
such differences will impact the profit and loss in the period in which such determination is made.
The carrying amount of the Group’s income taxes payable as of December 31, 2011 and 2010
amounted to $1.69 million and $2.30 million, respectively.
Fair value of put and call options
The acquisition of PSi on October 6, 2010 gave rise to a long equity call option and written
equity put option for the Parent Company. The call and put options were valued using binomial
model. This valuation technique considers the probability of PSi’s share price based on a
five-year discounted cash flow to move up or down depending on the volatility, risk free rate and
exercise price based or a 12-month trailing EBITDA of PSi as of the valuation date. As of
December 31, 2011 and 2010, the call option has a positive value of $2.74 million and
$1.21 million, respectively, while the put option has zero value and negative value of $3.83
million, respectively (see Note 31).
Fair value measurement of intangible assets resulting from business combination
Intangible assets resulting from business combinations are valued at fair value at the acquisition
date as part of the business combination. Upon acquisition of EPIQ EA (see Note 2), the Parent
Company identified an intangible asset (customer relationship) and determined its fair value based
on discounted 5-year projected revenues from existing customers as of acquisition date after
excluding projected returns contributed by working capital, workforce and fixed assets. The
customer relationship amounted to $6.20 million as of December 31, 2011 (see Note 11).
5. Cash and Cash Equivalents
This account consists of:
Cash on hand
Cash on hand and in banks
Short-term deposits
2011
$103,983
36,403,020
17,562,177
$54,069,180
2010
$113,367
24,780,649
13,240,727
$38,134,743
Cash in banks earns interest at the respective bank deposit rates. Short-term deposits are made for
varying periods of up to three (3) months and earn interest at the respective short-term deposit
rates.
*SGVMC116496*
- 31 -
6. Loans and Receivables
This account consists of:
Trade
Nontrade
Receivable from insurance
Receivable from employees
Due from related parties (Note 30)
Short-term investments
Receivable from Meralco
Others
Less allowance for doubtful accounts
2011
$127,744,520
4,292,680
1,230,038
1,811,210
211,103
–
–
1,790,216
137,079,767
3,403,187
$133,676,580
2010
(As restated Note 2)
$95,629,246
3,704,483
1,859,984
707,172
78,186
2,000,000
549,923
1,094,720
105,623,714
1,366,536
$104,257,178
Trade
Trade receivables arise from manufacturing and other related services for electronic products and
components and have credit terms ranging from 30 to 60 days from invoice date.
Trade receivables of PSi from certain customers totaling $5.40 million as of December 31, 2010,
were assigned as collateral to Philippine Veterans Bank (PVB). Upon renewal of the credit
facility in April 2011, security in the form of trade receivables was no longer required
(see Note 15).
In 2011, trade receivables of EPIQ EA from certain customers totaling to €10.00 million
($12.94 million) and €2.13 million ($2.76 million) were pledged to UniCredit Bulbank and BNP
Paribas, respectively (see Note 15).
Nontrade
Nontrade receivables represent billings to customers for production and test equipment and all
other charges agreed with the customers in carrying out business operations. These receivables
have credit terms ranging from 30 to 60 days from invoice date.
Short-term investments
As of December 31, 2010, short-term investments pertain to 2-year time deposits due in May 2011
and bear fixed interest rate of 2.00% per annum.
Receivable from insurance
Insurance claims for damages to equipment and inventories caused by a fire incident in the Parent
Company’s plant in Cebu, Philippines in May 2009 amount to $1.23 million and $1.86 million as
of December 31, 2011 and 2010, respectively. The gain from the insurance claims amounting to
$5.62 million is included under “Miscellaneous income” in the 2009 consolidated statement of
comprehensive income.
Receivable from Meralco
As a customer of Manila Electric Company (Meralco), the Parent Company is entitled to a refund
for some of its previous billings under Phase IV of Meralco’s refund scheme. In 2009, additional
receivable from Meralco amounting to $0.37 million was booked by the Parent Company
(included under “Miscellaneous income”). All amounts due were fully collected in 2011.
*SGVMC116496*
- 32 -
The refunds due from Meralco were initially recognized at fair value. The rollforward of the day 1
discount on the Meralco refunds as of December 31, 2011 and 2010 follows:
2011
$15,671
(15,671)
$–
At beginning of year
Accretion
At end of year
2010
$34,451
(18,780)
$15,671
The accretion of the day 1 discount is included under “Interest income” in the consolidated
statements of comprehensive income (see Note 23).
Trade receivables, nontrade receivables, and receivable from insurance with nominal value of
$3.40 million and $1.37 million were individually assessed to be impaired and fully provided with
allowance for doubtful accounts as of December 31, 2011 and 2010, respectively.
Movements in the allowance for doubtful accounts follow:
2011
At January 1, 2011
Provision during the year
Recovery of previously written-off
account
Accounts written off
At December 31, 2011
Trade
$116,087
1,920,224
80,893
–
$2,117,204
Receivable
from
Insurance
$1,202,135
–
Total
$1,366,536
1,977,541
–
(21,783)
$83,848
–
–
$1,202,135
80,893
(21,783)
$3,403,187
Nontrade
$89,092
48,469
(89,247)
$48,314
Receivable
from
Insurance
$–
1,202,135
–
$1,202,135
Total
$312,447
1,531,927
(477,838)
$1,366,536
Nontrade
$48,314
57,317
2010
At January 1, 2010
Provision during the year
Accounts written off
At December 31, 2010
Trade
$223,355
281,323
(388,591)
$116,087
Provisions during the year form part of “Operating expenses” and are included under “Facilities
costs and others - Others” (see Note 21).
*SGVMC116496*
- 33 -
7. Inventories
This account consists of:
At cost:
Raw materials and supplies
Work-in-process
Finished goods
At NRV:
Raw materials and supplies
Work-in-process
Finished goods
2011
2010
$39,239,263
6,134,662
6,231,243
51,605,168
$6,813,778
5,292,449
7,609,282
19,715,509
22,553,457
1,875,642
4,367,733
28,796,832
$80,402,000
33,378,808
1,342,050
258,046
34,978,904
$54,694,413
The cost of the inventories carried at NRV amounted to $33.64 million and $38.80 million as of
December 31, 2011 and 2010, respectively. The amount of inventories recognized as an expense
amounted to $388.88 million, $265.48 million and $263.56 million in 2011, 2010 and 2009,
respectively (see Note 19). Provision for inventory obsolescence recognized in 2011 and 2009
amounted to $1.03 million and $1.32 million, respectively (see Note 21). Reversal of provision
for inventory obsolescence in 2010 amounted to $1.73 million (see Note 21).
In May 2009, the Parent Company lost inventories amounting to $0.56 million due to a fire
incident in its plant in Cebu, Philippines (see Note 6). The loss from the fire and gain from the
insurance claims are included under “Miscellaneous income” in the 2009 consolidated statement
of comprehensive income.
For the years ended December 31, 2011, 2010 and 2009, gain from sale of scrapped packaging
supplies amounting to $0.01 million, $0.23 million and $0.11 million, respectively, are included
under “Miscellaneous income” in the consolidated statements of comprehensive income.
Inventories of EPIQ EA amounting to €8.00 million ($10.35 million) and €2.13 million
($2.76 million) were pledged to UniCredit Bulbank and BNP Paribas, respectively (see Note 15).
8. Other Current Assets
This account consists of:
Tax credits
Advances to suppliers
Prepayments
Current portion of deferred licensing fee (Note 12)
Others
2011
$6,987,291
959,386
674,612
10,000
223,313
$8,854,602
2010
$1,118,577
941,878
380,369
10,000
57,190
$2,508,014
*SGVMC116496*
- 34 -
Tax credits are mainly attributable to STEL, EPIQ MX and EPIQ EA.
Prepayments include prepayments for group hospitalization, life and fire insurance and rent.
9. Property, Plant and Equipment
This account consists of:
2011
Cost
At January 1, 2011
Additions
Additions through business
combination (Note 2)
Disposals
Reclassifications
Foreign currency exchange
difference
At December 31, 2011
Accumulated depreciation
and amortization
At January 1, 2011
Depreciation and amortization
Disposals
At December 31, 2011
Accumulated impairment loss
Net book value as of
December 31, 2011
Buildings and
Improvements
Machinery
and Facilities
Equipment
Furniture,
Fixtures
and Office Transportation
Equipment
Equipment
$51,325,675
2,665,898
$119,640,340
9,486,367
$13,911,109
1,032,112
$971,441
288,382
Tools and
Instruments
Construction
in Progress
Total
$2,724,079
228,659
$96,435
1,129,055
$188,669,079
14,830,473
19,050,081
(444,789)
7,035
18,795,575
(17,395,390)
89,400
187,357
(689,057)
–
319,147
(269,918)
–
–
(10,026)
–
810,842
–
(96,435)
39,163,002
(18,809,180)
–
(1,664,392)
70,939,508
(2,036,889)
128,579,403
(103,010)
14,338,511
(24,985)
1,284,067
–
2,942,712
(126,370)
1,813,527
(3,955,646)
219,897,728
31,519,105
2,984,521
(234,594)
34,269,032
736,565
69,965,946
18,463,462
(15,106,887)
73,322,521
752,909
9,110,181
2,308,112
(671,015)
10,747,278
12,226
237,442
439,127
(247,184)
429,385
–
1,710,438
420,064
(8,150)
2,122,352
–
$35,933,911
$54,503,973
$3,579,007
$854,682
$820,360
$1,813,527
$97,505,460
Buildings and
Improvements
Machinery
and Facilities
Equipment
Furniture,
Fixtures
and Office
Equipment
Transportation
Equipment
Tools and
Instruments
Construction
in Progress
Total
$50,321,661
921,877
$97,732,248
17,786,055
$12,241,416
3,518,838
$1,229,558
498,877
$1,500,626
1,244,636
$1,626,621
96,435
$164,652,130
24,066,718
–
–
–
–
–
112,543,112
24,615,286
(16,267,830)
120,890,568
1,501,700
2010
Cost
At January 1, 2010
Additions
Additions through business
combination (Note 2)
Disposals
Reclassifications
At December 31, 2010
Accumulated depreciation
and amortization
At January 1, 2010
Depreciation and amortization
Disposals
At December 31, 2010
Accumulated impairment loss
Net book value as of
December 31, 2010
219,482
(291,838)
154,493
51,325,675
8,812,625
(6,162,716)
1,472,128
119,640,340
149,303
(1,998,448)
–
13,911,109
28,976
(785,970)
–
971,441
–
(21,183)
–
2,724,079
28,711,998
3,089,224
(282,117)
31,519,105
736,565
61,614,950
13,528,910
(5,177,914)
69,965,946
752,909
8,207,147
2,062,520
(1,159,486)
9,110,181
12,226
147,696
301,151
(211,405)
237,442
–
1,340,200
391,421
(21,183)
1,710,438
–
$4,788,702
$733,999
$19,070,005
$48,921,485
$1,013,641
–
–
(1,626,621)
96,435
–
–
–
–
–
$96,435
9,210,386
(9,260,155)
–
188,669,079
100,021,991
19,373,226
(6,852,105)
112,543,112
1,501,700
$74,624,267
PSi has a Mortgage Trust Indenture (MTI) with the Trust and Investment Division of a local bank,
as Trustee. The mortgaged properties securing the Mortgage Obligations under the MTI are
composed of machinery and equipment. The holders of the Mortgage Participation Certificates
(MPC) under the MTI are: (a) Philippine Veterans Bank (PVB), and (b) a major supplier of PSi,
with a participation of $3.00 million each (see Notes 13 and 15). As of December 31, 2011 and
2010, mortgaged machinery and equipment have a net carrying amount of $2.78 million and
$6.84 million, respectively.
*SGVMC116496*
- 35 -
As of December 31, 2011 and 2010, fully depreciated property, plant and equipment amounting to
$34.90 million and $33.91 million, respectively, are still being used by the Group.
The carrying values of the equipment under finance lease amounted to $2.22 million and
$1.87 million, as of December 31, 2011 and 2010, respectively.
Starting January 2009, the Parent Company extended the estimated useful life of SMT and other
production equipment from five (5) to seven (7) years due to factors which demonstrate that the
equipment can be used for more than five (5) years. The change in estimated useful life reduced
depreciation expense for 2011, 2010 and 2009 by $0.39 million, $0.74 million and $2.07 million,
respectively.
In 2009, the Parent Company retired machineries and equipment damaged by fire with a book
value amounting to $0.08 million (see Note 6). The loss from the damaged facilities and gain
from the insurance claims are included under “Miscellaneous income” in the 2009 consolidated
statement of comprehensive income.
Depreciation and amortization expense included in cost of goods sold and services for the years
ended December 31, 2011, 2010, and 2009 amounted to $21.70 million, $16.23 million and
$15.68 million, respectively (see Note 19). Depreciation and amortization expense included in
operating expenses for the years ended December 31, 2011, 2010 and 2009 amounted to
$2.92 million, $3.14 million and $2.38 million, respectively (see Note 20).
In 2011, the Parent Company, IMI Singapore and PSi disposed certain machineries and
equipment, furniture and fixtures, and tools and instruments, which resulted to gains amounting to
$108,076, $1,464, and $5,577, respectively.
In 2010, the Parent Company, IMI Singapore and PSi disposed certain machineries and facilities
equipment, furniture and fixtures, and tools and instruments, which resulted to gains amounting to
$177,634, $3,707 and $5,135, respectively.
In 2009, the Parent Company and IMI Japan disposed certain machineries and facilities
equipment, furniture and fixtures and tools and instruments, which resulted to gains amounting to
$95,082, $1,508 and $1,379, respectively.
10. Goodwill
Goodwill acquired through business combinations have been allocated to five individual CGUs as
follows:
STEL Group
PSi
IMI USA
EPIQ CZ
Parent Company
2011
$45,128,024
7,478,980
656,610
650,413
441,166
$54,355,193
2010
$45,128,024
10,196,431
656,610
–
441,166
$56,422,231
*SGVMC116496*
- 36 -
STEL Group, PSi and IMI USA
The recoverable amounts of these CGUs have been based on value in use calculations using cash
flow projections from financial budgets approved by management covering a five-year period.
The pre-tax discount rates applied to cash flow projections for STEL Group and IMI USA are
11.12% and 10.16%, respectively, in 2011 and 12.35% and 11.02%, respectively, in 2010. The
pretax discount rate applied to cash flow projections of PSi in 2011 is 12.60% .
Cash flows beyond the five-year period are extrapolated using a steady growth rate of 1%, which
does not exceed the compound annual growth rate for the global EMS industry.
Key assumptions used in the value in use calculations
The calculations of value in use for the CGUs are most sensitive to the following assumptions:
·
·
·
Budgeted gross margins - Gross margins are based on the mix of business model arrangements
with the customers whether consigned or turnkey.
Growth rate - The forecasted growth rate is based on a very conservative steady growth rate
that does not exceed the compounded annual growth rate for the global EMS industry.
Pre-tax discount rates - Discount rates reflect management’s estimate of the risks specific to
each CGU. This is the benchmark used by management to assess operating performance.
No impairment loss was assessed for STEL Group and IMI USA and Trixell. With regard to the
assessment of value in use of STEL Group and IMI USA, management believes that no reasonably
possible change in any of the above key assumptions would cause the carrying value of the units
to exceed their recoverable amount.
The impairment test for PSi resulted to an impairment loss of $2.72 million.
Parent Company
This pertains to the goodwill from purchase of M. Hansson Consulting, Inc. (MHCI) in 2006.
MHCI was subsequently merged to the Parent Company as testing and development department.
The value in use methodology was used in determining the recoverable amount of the Parent
Company in 2009. In 2011 and 2010, the recoverable amount was based on the market price of its
shares at valuation date less estimated costs to sell. The comparison of the recoverable amount
and the carrying amount resulted in no impairment.
EPIQ CZ
Goodwill from the acquisition of EPIQ CZ is based on provisional purchase price allocation. As
discussed in Note 2, provisional accounting has been adopted for the acquisition of the EPIQ
subsidiaries. The goodwill recognized is still subject to finalization.
*SGVMC116496*
- 37 -
11. Intangible Assets
This account consists of:
2011
Cost
At January 1, 2011
Additions
Additions through business
combination (Note 2)
Foreign currency exchange difference
At December 31, 2011
Accumulated amortization
At January 1, 2011
Amortization
Foreign currency exchange difference
At December 31, 2011
Net book value as of
December 31, 2011
Customer
Relationships
Unpatented
Technology
Computer
Software
Total
$12,900,000
–
$100,000
–
$1,463,282
411,344
$14,463,282
411,344
6,766,617
–
19,666,617
–
–
100,000
458,553
(79,149)
2,254,030
7,225,170
(79,149)
22,020,647
12,900,000
563,885
–
13,463,885
100,000
–
–
100,000
540,280
600,084
(17,093)
1,123,271
13,540,280
1,163,969
(17,093)
14,687,156
$6,202,732
$–
$1,130,759
$7,333,491
Customer
Relationships
Unpatented
Technology
Computer
Software
Total
$12,900,000
–
12,900,000
$100,000
–
100,000
$697,449
765,833
1,463,282
$13,697,449
765,833
14,463,282
10,535,000
2,365,000
12,900,000
81,667
18,333
100,000
278,152
262,128
540,280
10,894,819
2,645,461
13,540,280
$–
$–
$923,002
$923,002
2010
Cost
At January 1, 2010
Additions
At December 31, 2010
Accumulated amortization
At January 1, 2010
Amortization
At December 31, 2010
Net book value as of
December 31, 2010
Customer relationships
Customer relationships pertain to STEL Group’s and EPIQ EA’s noncontractual and contractual
agreements, respectively, with certain customers which lay out the principal terms upon which the
parties agree to undertake business.
Unpatented technology
Unpatented technology pertains to products which are technologically feasible. The STEL
Group’s patents were applied for the following technologies, both of which are unique, difficult to
design around and which meet the separability criteria:
·
·
Self bias double-ended switching circuit; and
A zero power consumption switch circuit to simplify the energy star solution for external
power adapter
Computer Software
This includes the Parent Company’s acquisitions of computer applications and modules. EPIQ
EA and EPIQ MX also have computer software with carrying value of $0.11 million and
$0.24 million, respectively, as of December 31, 2011.
*SGVMC116496*
- 38 -
Amortization of intangible assets included in operating expenses for the years ended
December 31, 2011, 2010 and 2009 amounted to $1.16 million, $2.65 million and $2.74 million,
respectively (see Note 20).
12. Noncurrent Receivables and Other Noncurrent Assets
As of December 31, 2011 and 2010, noncurrent receivables amounting to $0.21 million and
$0.18 million, respectively, pertain to advances to customers for equipment purchased by the
Group that are reimbursable from the former.
Other noncurrent assets consist of:
Miscellaneous deposits
Noncurrent portion of deferred licensing fee
2011
$1,498,225
20,000
$1,518,225
2010
$1,467,268
30,000
$1,497,268
Miscellaneous deposits include electric and water meter deposits.
Deferred licensing fee pertains to the payment made by PSi to Amkor Technology, Inc. (ATI), an
unrelated party, in 2004 amounting to $100,000, in accordance with the terms of their
Microleadframe Patent License Agreement. The amortization expense, using the straight-line
method, amounts to $10,000 for each of the ten succeeding years. Moreover, PSi has to pay
additional fees for the use of the license based on a certain formula. The account is payable
quarterly and any unpaid balance shall be subject to 1% interest per month. The agreement is for a
period of ten years, which started in 2004. The amortization expense and additional licensing fee
amounting to $10,000 and $71,559, respectively in 2011 and $2,500 and $3,190, respectively in
2010 are included in “Cost of goods sold and services” under “Facilities costs and others - others”.
13. Accounts Payable and Accrued Expenses
This account consists of:
Trade payables
Accrued expenses
Nontrade payables
Accrued payroll
Dividends payable (Note 18)
Customers’ deposits
Obligation under finance lease - current (Note 29)
Employee-related payables
Accrued interest payable (Notes 15 and 16)
Taxes payable
Deferred revenue - current (Note 17)
Due to related parties (Note 30)
Others
2011
$99,199,121
26,757,739
4,700,640
4,538,123
2,538,556
1,233,595
801,777
678,833
675,863
485,924
260,829
36,639
2,085,326
$143,992,965
2010
(As restated see Note 2)
$71,090,278
17,584,882
980,520
3,563,987
–
681,259
1,209,960
687,935
60,919
639,641
264,741
73,346
4,316,330
$101,153,798
*SGVMC116496*
- 39 -
Accounts payable and accrued expenses are non-interest-bearing and are normally settled on 15-to
60-day terms.
Trade payables include PSi’s liability to a certain supplier amounting to $2.07 million and
$3.39 million as of December 31, 2011 and 2010, respectively, which is covered by an MPC
amounting to $3.00 million under PSi’s MTI with a local bank (see Notes 9 and 15). In addition,
all overdue accounts from July 1, 2010 to December 31, 2010 with the supplier are subject to 1%
interest per month from May 1, 2009 to June 30, 2010 and 0.5% interest per month from July 1 to
December 31, 2010. There are no overdue accounts as of December 31, 2011.
Accrued expenses consist mainly of accruals for light and water, taxes, repairs and maintenance,
professional fees, transportation and travel, subcontractual costs, security, insurance and
representation. In 2010, this also includes a separation pay amounting to $0.40 million of a retired
officer of PSi, which was fully settled in 2011 (see Note 26).
Nontrade payables include provision for losses on purchase commitments of PSi amounting to
$0.17 million and $0.16 million as of December 31, 2011 and 2010, respectively, which pertain to
losses arising from price decline and expected termination of several firm and executory purchase
commitments. Additional provisions of $0.01 million and nil were recorded in 2011 and 2010,
respectively. In 2011, nontrade payables also include SZSTE’s’s liability for acquisition of fixed
assets amounting to $3.00 million.
Dividends payable as of December 31, 2011 amounted to $2.54 million net of foreign exchange
loss of $0.05 million.
14. Provisions
This account consists of:
2011
Restructuring
$–
831,718
(582,674)
$249,044
At January 1, 2011
Provision during the year
Payment
At December 31, 2011
2010
At January 1, 2010
Provision (reversal of provision) during
the year
Payment
At December 31, 2010
Warranty
$18,481
(18,481)
–
$–
Restructuring
$25,283
246,382
(271,665)
$–
Total
$43,764
227,901
(271,665)
$–
A provision for warranty is recognized for all products under warranty at the reporting date based
on the Group’s estimate of possible repairs or returns. No significant repairs or returns are
expected in the future related to the sales made during the year and in prior years. Consequently,
no provision for warranty was recognized as of December 31, 2011 and 2010.
*SGVMC116496*
- 40 -
In 2011, PSi and IMI Singapore announced a restructuring of operations due to unfavorable
economic and business situation. PSi made actual payout in September and November 2011
aggregating to $1.14 million. Part of this payout amounting to $0.58 million is not covered by its
retirement plan. This was recognized as provision in 2011. In addition, IMI Singapore
recognized provision amounting to $0.25 million (see Note 35).
In 2010, the Parent Company announced a restructuring of operations due to closure of two
business activities. The restructuring was completed in July 2010 with actual payout of
$0.25 million.
In 2009, the Parent Company completed a restructuring with actual payment of $5.08 million.
Remaining separation pay amounting to $0.02 million was paid in 2010.
15. Trust Receipts and Loans Payable
This account consists borrowings of:
Parent Company
EPIQ EA
PSi
STEL
2011
$16,460,500
11,066,203
10,167,932
1,314,176
$39,008,811
2010
$10,000,000
–
6,625,249
1,296,389
$17,921,638
Parent Company
As of December 31, 2011 and 2010, the Parent Company has two (2) 90-day term loans
amounting to $5.00 million each and are subject to fixed interest rates of 1.18% and 1.16%. In
2011, the Parent Company also availed of a 60-day term loan amounting to €5.00 million
($6.46 million), subject to a fixed interest rate of 2.27%.
Interest expense incurred on the short-term loans amounted to $0.16 million, $0.03 million and
$0.37 million in 2011, 2010 and 2009, respectively.
EPIQ EA
EPIQ EA has short-term loans from the following banks:
UniCredit Bulbank
BNP Paribas
$10,351,817
714,386
$11,066,203
The loans from UniCredit Bulbank and BNP Paribas are from existing revolving credit facilities
with terms of one year and six months, respectively. The loans bear interest based on 1-month
EURIBOR plus 3.00% and 3-month EURIBOR plus 2.50%, respectively. Interest expense
recognized on the loans in 2011 amounted to $0.21 million.
*SGVMC116496*
- 41 -
The credit facility with UniCredit Bulbank is subject to the following collaterals:
· First ranking pledge on materials, ready made and unfinished production at balance sheet
value, minimum of €10,000;
· first ranking pledge on receivables from a certain customer; and
· notary signed Strong Letter of Patronage from the Parent Company.
As of December 31, 2011, EPIQ EA's pledged inventories and receivables with UniCredit
Bulbank amounted to €8.00 million ($10.35 million) and €10.00 million ($12.94 million),
respectively. The Parent Company also provided a Soft Letter of Comfort to the creditor.
The credit facility with BNP Paribas is subject to the following collaterals:
· First rank pledge on receivables from selected customers of EPIQ EA, subject to prefinancing in the amount of 125% of the utilized portion of the facility but not more than
€2,125,000; and
· first rank pledge on goods of EPIQ EA in the amount of 125% of the utilized portion of the
facility but not more than €2,125,000.
As of December 31, 2011, EPIQ EA's pledged inventories and receivables, with BNP Paribas both
amounted to €2.13 million ($2.76 million).
PSi
PSi has short-term loans and trust receipts payable to the following banks:
Metropolitan Bank & Trust Co. (MBTC)
PVB
2011
$9,247,621
920,311
$10,167,932
2010
$5,000,000
1,625,249
$6,625,249
MBTC
PSi has an unsecured Omnibus Line Credit Facility of $10.00 million granted on
November 24, 2010, which includes 30 to 360 days Promissory Notes (maybe denominated in
USD or Philippine peso [PHP]), Letter of Credit/Trust Receipt (LC/TR) Line, Export Packing
Credit Line, FX Forward Cover, and Foreign Bills Line and Domestic Bill Purchase Line,
subject to interest rates ranging from 2.27% to 2.85% in 2011 and 2.56% in 2010. As of
December 31, 2011 and 2010, the outstanding trust receipts payable amounted to $1.75 million
and nil. The facility will expire on October 30, 2012.
PSi incurred interest expense on its short-term loan and trust receipts payable aggregating to
$0.51 million in 2011.
The undrawn credit facility amounted to $0.75 million and $5.00 million as of December 31, 2011
and 2010, respectively.
PVB
In 2010, PSi had a Revolving Promissory Note Line (RPNL) of $3.00 million, including the
availability of Letters of Credit (LC)/Trust Receipts (TR) up to $1.50 million. This short-term
credit facility, which expired in April 2011, is secured by trade receivables from certain customers
and MTI on machinery and equipment (see Notes 6 and 9). This was renewed on April 20, 2011,
through an Omnibus Line Facility of $5.00 million, which includes unsecured RPNL of
*SGVMC116496*
- 42 -
$3.00 million, which may be available for LC, and 5-year term loan of $2.00 million secured by
the MTI on machineries and equipment. PSi has not yet availed of the 5-year term loan as of
December 31, 2011, hence the MPC of PVB is temporarily not effective. The interest rates in
2011 and 2010 ranged from 2.36% to 2.71% and 3.16% to 3.72%, respectively. As of
December 31, 2011 and 2010, there are no outstanding trust receipts payable under this facility.
PSi incurred interest expense for its short-term loan amounting to $0.10 million and $0.03 million
in 2011 and 2010, respectively.
The undrawn credit facility amounted to $4.08 million and $1.37 million as of December 31, 2011
and 2010, respectively.
STEL
The loans of STEL are clean loans from various Singapore banks from existing revolving credit
facilities and bear interest rates ranging from 3.35% to 3.45%, 3.52% to 3.70%, and 1.94% to
3.86% in 2011, 2010 and 2009, respectively, and have maturities of 30 to 240 days from the date
of issue with renewal options. STEL incurred interest expense for its short-term loans amounting
to $0.07 million, $0.07 million and $0.25 million in 2011, 2010 and 2009, respectively.
16. Long-Term Debt
This account consists borrowings of:
Parent Company
Cooperatief
IMI Singapore
Less: Current portion
2011
$40,000,000
20,398,500
–
$60,398,500
–
$60,398,500
2010
$30,000,000
–
8,000,000
$38,000,000
38,000,000
$–
The Parent Company’s long term debt as of December 31, 2010 is a five-year term clean loan
from a Philippine bank obtained in 2006 with original amount of $40.00 million and payable in a
single balloon payment at the end of the loan term. The Parent Company may, at its option,
prepay the loan in part or in full, together with the accrued interest without penalty. Interest on the
loan is payable quarterly and re-priced quarterly at the rate of 3-month LIBOR plus margin of
0.80%. The Parent Company prepaid $10.00 million of the loan principal in 2007. In October
2011, the Parent Company fully paid the remaining balance of $30.00 million. On the same date,
the Parent Company obtained another five-year clean loan with the same bank amounting to
$40.00 million with the same terms as the previous loan. The Parent Company incurred interest
expense for its long-term loans amounting to $0.53 million, $0.34 million and $0.42 million in
2011, 2010 and 2009, respectively.
Loan covenants related to the Parent Company’s loan are as follows:
·
·
The ratio of debt to earnings before income tax, depreciation and amortization (EBITDA)
shall not exceed 3:1 at all times with reference to the borrower's consolidated financial
statements;
maintenance of debt service coverage ratio (DSCR) of at least 1.5:1;
*SGVMC116496*
- 43 ·
·
maintenance at all times of a current ratio of at least 1:1; and
maintenance of a debt to equity ratio, computed with reference to the borrower's consolidated
financial statements, of not greater than 1.75:1.
As of December 31, 2011 and 2010, the Parent Company has complied with all the abovementioned loan covenants.
Cooperatief’s long-term debt relates to the acquisition of EPIQ shares and receivables of EPIQ NV
from the EPIQ subsidiaries (see Note 2). This is subject to interest rate of 1.599% plus 1.5%.
Below is the amortization schedule:
Due dates
2013
2014
2015
2016
2017
2018
Total
Amounts in Euro
€2,000,000
2,000,000
2,000,000
2,000,000
2,000,000
4,248,743
€14,248,743
Amount in USD
$2,863,200
2,863,200
2,863,200
2,863,200
2,863,200
6,082,500
$20,398,500
In 2011, Cooperatief incurred interest expense amounting to $0.26 million for its long-term debt.
The IMI Singapore loan as of December 31, 2010 is a five-year term clean loan from a Singapore
bank obtained in 2006 with an original principal amount of $40.00 million. The loan is payable in
ten (10) equal semi-annual installments starting in May 2007 until November 2011. Interest on
the loan is payable semi-annually and is re-priced semi-annually at LIBOR quoted by the bank
plus 0.75%. IMI Singapore incurred interest expense for its long-term loan amounting to
$0.06 million, $0.15 million and $0.54 million in 2011, 2010 and 2009, respectively.
Loan covenants related to IMI Singapore’s loan are as follows:
·
·
·
·
The ratio of borrower’s consolidated debt to borrower’s consolidated net worth for each test
period will not exceed 1.5:1;
Guarantor’s consolidated net worth for each test period will not be less than $50.00 million;
The ratio of guarantor’s consolidated debt to guarantor consolidated net worth for each test
period will not exceed 1.5:1; and
The ratio of guarantor’s EBITDA to guarantor’s consolidated current debt for each test period
will not be less than 1.25:1.
The loan was paid in full in November 2011.
17. Deferred Revenue
On June 28, 2010, PSi and a local customer entered into a Subcontracting Services Agreement
(SSA) for PSi to provide subcontracted services. In consideration, the local customer shall pay
PSi service fees as provided for in the SSA.
The SSA shall take effect upon the execution thereof and is effective until August 14, 2020, unless
mutually terminated by both parties. The subcontracted services shall be effective starting from
July 15, 2010 and ending February 29, 2020, renewable upon mutual agreement by both parties.
*SGVMC116496*
- 44 -
In September 2009, PSi received noninterest-bearing cash advances amounting to $3.00 million
from a foreign customer, an affiliate of the local customer. On July 15, 2010, the foreign customer
assigned all of its rights with respect to the cash advances, including payments thereof, to the
local customer. The local customer and PSi agree that the full cash advances amounting to $3.00
million will be applied to pre-pay and cover any, and all of the fees payable under Annex B of the
SSA for the facilities support services that will be rendered by PSi to the local customer.
Moreover, PSi shall return to the local customer, upon termination of the SSA, for any reason, the
cash advances less any amount applied to pay the fees as detailed in the SSA.
As of December 31, 2011 and 2010, the current and noncurrent portion of the advances from the
local customer follow:
Total outstanding advances from the local customers
Less current portion
Noncurrent portion
2011
$2,564,594
260,829
$2,303,765
2010
$2,829,335
264,741
$2,564,594
The current portion is included under “Accounts payable and accrued expenses” (see Note 13).
18. Equity
Capital Stock
This account consists of:
2011
Shares
Authorized - P
=1 par value
Common
Preferred
Issued - Common
At beginning of year
Issuances during the year
through stock dividend
Issuances during the year
through ESOWN
At end of year *
Issued - Preferred
At beginning of year
Issuances during the year
At end of year
Amount
2010
Shares
Amount
2,250,000,000
1,500,000,000
2,250,000,000
1,500,000,000
2009
Shares
Amount
1,500,000,000
1,500,000,000
1,352,290,094
$24,893,713
1,137,788,197
$20,267,538
1,137,020,302
$20,253,054
–
–
187,500,000
4,117,259
–
–
1,940,646
1,354,230,740
38,362
$24,932,075
27,001,897
1,352,290,094
508,916
$24,893,713
767,895
1,137,788,197
14,484
$20,267,538
1,300,000,000
–
1,300,000,000
$26,601,155
–
$26,601,155
1,300,000,000
–
1,300,000,000
$26,601,155
–
$26,601,155
1,300,000,000
–
1,300,000,000
$26,601,155
–
$26,601,155
*
Out of the total issued shares, 15,892,109 shares as of December 31, 2011 and 2010 and 15,892,365 shares as of
December 31, 2009 pertain to treasury shares.
The preferred shares have certain features, rights and privileges, which include voting rights,
quarterly dividends at a dividend rate of 8.25% rate p.a., cumulative in payment of current
dividends, nonparticipating in any other or further dividends beyond those that are specifically
payable on the shares, nonconvertibility to common shares, preference over holders of common
stock in the distribution of corporate assets in the event of dissolution and liquidation and in the
payment of the dividend at the rate specified, no pre-emptive rights, redeemable at the option of
the issuer and certificated.
*SGVMC116496*
- 45 -
On October 23, 2009, the SEC approved the registration of 1,268,497,252 common shares of the
Parent Company with PhP1.00 par value. As of December 31, 2011, 2010 and 2009, there were
562, 112 and 143 registered common stockholders, respectively.
On April 8, 2010, the Parent Company’s BOD approved the increase in its authorized capital stock
from =
P3.00 billion to =
P3.75 billion, which shall consist of an additional 750 million common
shares with par value of =
P1.00 per share, and the amendment of the Articles of Incorporation to
reflect such increase. The Parent Company’s BOD also approved the declaration of stock
dividends equivalent to 187.5 million common shares to all the subscribed and outstanding
common shares of the Parent Company as of the record date to be set by the SEC in connection
with its approval of the Parent Company’s application for increase in authorized capital stock.
The BOD of the Parent Company further resolved to consolidate into whole shares, the fractional
shares resulting from the declaration of stock dividend and the Parent Company to redeem it as
treasury stock, at a price equal to the last closing price at the Philippine Stock Exchange (PSE)
immediately prior to the record date.
On August 12, 2010, the SEC approved the (1) increase in the Parent Company’s authorized
capital stock from =
P3.00 billion to =
P3.75 billion and the amendment in its Articles of Incorporation
to reflect the increase, and (2) its payment of 15% stock dividend equivalent to 187.5 million
common shares to its stockholders of record as of August 31, 2010. The issuance of the stock
dividends was made on September 24, 2010.
Subscribed Capital Stock
Details of this account follow:
At beginning of year
Subscriptions during the year
ESOWN (Note 27)
EPIQ NV
Issuances during the year
ESOWN
Forfeitures during the year
ESOWN
At end of year
2011
Shares
Amount
90,587,000
$1,901,963
–
200,000,000
–
4,746,084
2010
Shares
Amount
107,898,420
$2,167,895
30,885,000
–
668,506
–
(508,916)
(1,940,646)
(38,362)
(27,001,897)
(4,737,168)
283,909,186
(102,715)
$6,506,970
(21,194,523)
90,587,000
2009
Shares
Amount
108,666,315
$2,182,379
–
–
(767,895)
(425,522)
–
$1,901,963 107,898,420
–
–
(14,484)
–
$2,167,895
As mentioned in Note 2, the consideration for the acquisition of EPIQ shares includes issuance of
200 million of the Parent Company’s shares to EPIQ NV. On July 29, 2011, the Parent Company
and EPIQ NV executed a subscription agreement for the subscription of the said shares.
Subscriptions Receivable
Details of this account are as follows:
At beginning of year
Subscriptions during the year
(Note 27)
Collections
Accretion (Note 27)
Forfeitures(Note 27)
At end of year
2010
2009
2011
Shares
Amount
Shares
Amount
Shares
Amount
120,987,477 $11,411,994 111,297,000 $10,153,255 111,297,000 $10,439,358
3,390,814
–
–
–
– 30,885,000
– (1,215,793)
–
(40,383)
–
(615,889)
–
1,913,073
–
(245,720)
–
427,535
–
–
(4,737,168)
(828,440) (21,194,523) (2,829,355)
116,250,309 $10,395,200 120,987,477 $11,411,994 111,297,000 $10,153,255
*SGVMC116496*
- 46 -
Dividends
2011
On February 14, 2011, the Finance Committee of the Parent Company approved the declaration
and payment of the first quarter cash dividends of 8.25% per annum or equivalent of $0.61 million
to all shareholders of the Parent Company’s preferred shares as of record date of February 8, 2011.
Payment date was on February 21, 2011. This was ratified by the BOD of the Parent Company on
February 23, 2011.
Likewise on February 23, 2011, the BOD of the Parent Company approved the declaration of the
quarterly cash dividends of 8.25% per annum for the second to fourth quarters of 2011 on its
outstanding preferred shares. The record and payment dates for the cash dividends are as follows:
Record date
Payment date
Amount
2nd Quarter
May 9, 2011
May 20, 2011
$605,658
3rd Quarter
4th Quarter
August 17, 2011 November 9, 2011
August 23, 2011 November 22, 2011
$605,658
$605,658
On the same date, the BOD of the Parent Company approved the declaration of regular cash
dividend of =
P0.044 per share (aggregating to $1.43 million) to all outstanding common shares as
of record date March 9, 2011. This was paid on April 4, 2011.
On December 5, 2011, the BOD of the Parent Company also approved the declaration of the
quarterly cash dividends of 8.25% per annum for 2012 on its outstanding preferred shares. The
record and payment dates for the cash dividends are as follows:
Record date
Payment date
Amount
1st Quarter
February 8, 2012
February 21, 2012
$621,229
2nd Quarter
May 9, 2012
May 21, 2012
$607,575
3rd Quarter
4th Quarter
August 10, 2012 November 9, 2012
August 23, 2012 November 22, 2012
$641,709
$621,229
2010
On January 21, 2010, the Parent Company’s BOD approved and authorized the declaration and
payment of quarterly dividend of 8.25% p.a. from the unappropriated retained earnings as of
December 31, 2008, to all shareholders of the Parent Company’s preferred shares. Other details
follow:
Covering period
Record date
Payment date
Amount
1st Quarter
November 21, 2009 to
February 22, 2010
February 8, 2010
February 22, 2010
$599,703
2nd Quarter
February 22, 2010 to
May 21, 2010
May 10, 2010
May 21, 2010
$567,460
3rd Quarter
May 21, 2010 to
August 24, 2010
August 9, 2010
August 24, 2010
$612,599
4th Quarter
August 24, 2010 to
November 22, 2010
November 8, 2010
November 22, 2010
$580,357
On April 8, 2010, the BOD of the Parent Company approved and authorized the declaration
and payment of cash dividends in the amount of $0.0024 or =
P0.11 per common share or the
equivalent of $2.99 million, out of the unrestricted retained earnings of the Parent Company
as of December 31, 2009, to all common stockholders of the Parent Company as of record date
April 30, 2010. The dividends were paid on May 27, 2010.
*SGVMC116496*
- 47 -
2009
On March 26, 2009, the BOD of the Parent Company approved and authorized the declaration and
payment of quarterly dividend of 8.25% p.a. or the equivalent of $0.55 million, out of the
unrestricted retained earnings of the Parent Company as of December 31, 2008, to all stockholders
of the Parent Company’s preferred shares of record as of May 8, 2009. The dividends were paid
on May 11, 2009.
Likewise, on March 26, 2009, the BOD of the Parent Company approved and authorized the
declaration and payment of cash dividends amounting to $0.00163 per share or the equivalent of
$2.00 million, out of the unrestricted retained earnings of the Parent Company as of
December 31, 2008, to all common stockholders of the Parent Company as of record date
March 26, 2009. Payment was made on June 6, 2009.
On July 21, 2009, the BOD of the Parent Company approved and authorized the declaration and
payment of quarterly dividend of 8.25% p.a. or the equivalent of $0.57 million, out of the
unrestricted retained earnings of the Parent Company as of December 31, 2008, to all stockholders
of the Parent Company’s preferred shares of record as of August 10, 2009. The dividends were
paid on August 21, 2009.
On November 4, 2009, the BOD of the Parent Company approved and authorized the declaration
and payment of quarterly dividend of 8.25% p.a. or the equivalent of $0.58 million, out of the
unrestricted retained earnings of the Parent Company as of December 31, 2008, to all stockholders
of the Parent Company’s preferred shares of record as of November 9, 2009. The dividends were
paid on November 21, 2009.
Treasury Stock
The movements in the treasury stock follow:
At beginning of year
Issuance during the year
Acquisition during the year
At end of year
2011
Shares
Amount
15,892,109
$1,012,585
–
–
–
–
15,892,109
$1,012,585
2010
Shares
Amount
15,892,365
$1,012,592
(300)
(17)
44
10
15,892,109
$1,012,585
2009
Shares
Amount
15,892,365
$1,012,592
–
–
–
–
15,892,365
$1,012,592
On April 8, 2010, the Management of the Parent Company approved to assign 100 qualifying
shares to each of its three (3) independent directors. The qualifying shares were pulled out from
the treasury shares of the Parent Company.
On September 24, 2010, the Parent Company redeemed the fractional shares aggregating to
44 shares resulting from the stock dividend declared on April 8, 2010.
Retained Earnings
The appropriated retained earnings will be used to finance the Group’s planned expansion and
acquisition of other EMS companies.
On February 23, 2011 and December 5, 2011, the BOD of the Parent Company approved the
reclassification of appropriated retained earnings to unappropriated retained earnings amounting to
$20.00 million and $10.00 million, respectively.
*SGVMC116496*
- 48 -
Accumulated net earnings of the subsidiaries amounting to $13.33 million and $9.03 million as of
December 31, 2011 and 2010, respectively, are not available for dividend declaration. This
accumulated equity in net earnings becomes available for dividend upon receipt of cash dividends
from the investees.
In accordance with SEC Memorandum Circular No. 11 issued in December 2008, the Parent
Company’s retained earnings available for dividend declaration as of December 31, 2011
amounted to $4.10 million.
19. Cost of Goods Sold and Services
This account consists of:
Direct, indirect and other material-related
costs (Note 7)
Direct labor, salaries, wages and employee
benefits (Note 26)
Depreciation and amortization (Note 9)
Facilities costs and others (Note 21)
2011
2010
2009
$388,879,422
$265,483,888
$263,560,759
90,847,467
21,698,353
35,851,132
$537,276,374
64,704,176
16,231,694
21,432,255
$367,852,013
55,309,521
15,683,663
16,357,707
$350,911,650
2011
2010
2009
$28,175,341
$22,897,063
$16,388,199
4,080,902
20,430,524
$52,686,767
5,786,993
11,539,960
$40,224,016
5,115,969
13,667,151
$35,171,319
20. Operating Expenses
This account consists of:
Salaries, wages and employee benefits
(Note 26)
Depreciation and amortization
(Notes 9 and 11)
Facilities costs and others (Note 21)
21. Facilities Costs and Others
This account consists of:
Utilities
Repairs and maintenance
Outsourced activities (Note 29)
Variable overhead
Travel
Government-related
Technology-related
Provision for doubtful accounts
(Note 6)
Cost of Goods Sold and Services
2010
2009
2011
$8,071,258
$6,092,725
$12,993,248
3,381,890
2,223,681
6,189,964
3,379,122
3,007,146
6,008,519
3,616,274
3,682,733
2,945,218
192,176
107,774
1,330,336
1,171,785
1,110,324
1,262,184
41,733
9,343
184,563
–
–
–
Operating Expenses
2010
2009
2011
$649,768
$435,802
$913,419
492,723
486,894
974,965
5,549,611
5,360,863
6,828,361
–
–
–
1,496,090
1,423,523
1,922,497
157,017
638,063
1,605,101
1,063,758
590,429
1,408,556
1,977,541
1,531,927
58,228
(Forward)
*SGVMC116496*
- 49 -
Cost of Goods Sold and Services
2010
2009
2011
Provision (reversal of provision) for
inventory obsolescence
Postal and communication
Sales commission
Insurance
Promotional materials, representation
and entertainment
Staff house
Membership fee
Others
$–
$–
$–
–
–
–
–
–
–
–
4,937,100
$35,851,132
–
–
–
1,578,017
$21,432,255
Operating Expenses
2010
2011
2009
–
–
$1,029,155
869,266
835,092
550,173
($1,734,481)
781,162
556,665
262,678
$1,322,908
683,743
950,279
198,652
–
–
–
123,981
$16,357,707
492,746
271,366
182,961
569,325
$20,430,524
270,215
25,844
69,929
367,054
$11,539,960
312,805
51,161
99,461
1,054,340
$13,667,151
“Others” include donations, small tools and instruments, spare parts, brokerage charges, freight
out, test material and copying expenses.
22. Interest Expense and Bank Charges
This account consists of:
Interest expense (Notes 15 and 16)
Bank charges
2011
$2,344,807
155,191
$2,499,998
2010
$942,202
94,727
$1,036,929
2009
$1,739,827
47,639
$1,787,466
Interest expenses also include interest on finance lease and employees’ car and housing loan.
23. Interest Income
This account consists of:
Interest on bank balances and fixed deposits
(Note 5)
Accretion of Meralco receivable (Note 6)
2011
2010
2009
$299,849
15,671
$315,520
$333,798
18,780
$352,578
$676,847
46,414
$723,261
24. Income Tax
Parent Company
As discussed in Note 1, the Parent Company is registered with PEZA and is entitled to certain
incentives, which include ITH. The Parent Company’s entitlements to ITH under the current
PEZA registrations have expirations beginning January 2010. In 2011, there are two remaining
project activities with ITH entitlement which will expire in 2013. Upon the expiration of the ITH,
the Parent Company will be subject to a five percent (5%) final tax on gross income earned after
certain allowable deductions in lieu of payment of national and local taxes.
PSi
PSi is a PEZA-registered entity, and is subject to a 5% tax on gross income less allowable
deductions, as defined in RA No. 7916, as amended by RA No. 8748, in lieu of all national and
local taxes, except real property tax on land being leased in FTI-SEZ. The 5% tax on gross
*SGVMC116496*
- 50 income shall be paid and remitted as follows: (a) three percent (3%) to the National Government;
and (b) two percent (2%) to the treasurer’s office of the municipality or city where the enterprise is
located.
PSi registered its subcontracted services with PEZA on July 9, 2010. Under the Supplemental
Agreement, the subcontracted services are entitled to incentives granted to non-pioneer projects
under RA No. 7916, as amended. PSi started rendering subcontracted services on July 15, 2010.
On August 9, 2010, PSi was registered by PEZA as an Ecozone Logistics Service Enterprise to
provide warehousing logistics support services.
On February 17, 2011, the BOD of PEZA approved, through Resolution No. 11-073, the
application of the PSi for the registration of its new activity, particularly the manufacture of Power
Modules semiconductor products (New Activity). The New Activity shall be entitled to incentives
granted to non-pioneer projects under RA No. 7916, as amended, as indicated in the Supplemental
Agreement between the Company and PEZA executed on April 6, 2011.
ITH incentives availed in 2011 amounted to $11,079.
STHK and Monarch Elite
Hong Kong profits tax has been provided at the rate of 16.5% for the years ended
December 31, 2011 and 2010, on the assessable profit for the year.
SZSTE, SZSTT, STJX and STCQ
In accordance with the “Income Tax Law of PRC for Enterprises with Foreign Investment and
Foreign Enterprises”, the subsidiaries in the PRC are entitled to full exemption from Enterprise
Income Tax (EIT) for the first two (2) years and a 50% reduction in EIT for the next three (3)
years, commencing from the first profitable year after offsetting all tax losses carried forward from
the previous five (5) years.
SZSTE is subject to taxation at the statutory tax rate of 25% for the years ended
December 31, 2011 and 2010 on its taxable income as reported in the financial statements of
SZSTE prepared in accordance with the accounting regulations in the PRC.
SZSTT has been dormant for the financial year under audit and thus there is no current tax
expense for SZSTT. Deferred income tax assets arising from the tax losses of SZSTT are not
recognized in the consolidated financial statements due to uncertainty as to whether sufficient
taxable income will be available against which the deferred income tax assets can be utilized.
STJX is entitled to full exemption from EIT for the first two years and a 50% reduction in EIT for
the next three years, commencing from the first profitable year, that is after all tax losses have
been fully offset in accordance with the “Income Tax of the PRC for Enterprises with Foreign
Investment and Foreign Enterprises”. STJX is in its seventh profitable year, and hence is subject
to taxation at the rate of 25% in 2011 and 2010 on the taxable income as reported in the financial
statements of STJX prepared in accordance with the accounting regulations in the PRC.
STCQ is entitled to full exemption from EIT for the first five (5) years, commencing from the first
profitable year, that is after all tax losses have been fully offset in accordance with the “Income
Tax of the PRC for Enterprises with Foreign Investment and Foreign Enterprises”. STCQ is in its
second profitable year, and hence is not subject to taxation on the taxable income as reported in
the financial statements of STCQ prepared in accordance with the accounting regulations in the
PRC.
*SGVMC116496*
- 51 -
STPHIL
STPHIL is registered with the PEZA as an economic zone export enterprise engaged in the
manufacture and distribution of electronic products. As a registered enterprise, it is entitled to
certain incentives, including the payment of income tax equivalent to 5% on gross income, as
defined under R.A. No. 7916, in lieu of all local and national taxes.
Cooperatief
Taxation is calculated on the reported pre-tax result, at the prevailing tax rates, taking account of
any losses carried forward from previous financial years (if applicable) and tax-exempt items and
non-deductible expenses and using tax facilities.
IMI France
Income tax is computed based on the income earned by the corporation during the calendar year.
Losses may be carried forward with no time limit. On certain conditions, losses may be carried
back one year. The tax rate applicable is 33.33% based on net profits.
EPIQ EA
Income taxes are calculated in accordance with the Bulgarian legislation, and the effect of the
current and deferred taxes is reported. The current income tax is calculated based on the taxable
income for tax purposes. The nominal tax rate is 10%.
EPIQ MX
EPIQ MX is subject to Income Tax and the Business Flat Tax. These taxes are recorded in the
results of the year they are incurred. Income tax rate for 2011 is 30%. Business Flat Tax is
calculated on a cash flow basis whereby the tax base is determined by reducing taxable income
with certain deductions and credits. The applicable Business Flat Tax rate is 17.5%.
Income tax incurred will be the higher of Income Tax and Business Flat Tax.
EPIQ CZ
Income tax due is calculated by multiplication of the tax base and the rate as defined by the
income tax law. The tax base comprises the book income from operations which is increased or
decreased by permanently or temporarily tax-decreasing costs and tax-deductible revenues
(e.g. creation and recording of other provisions and allowances, entertainment expenses,
difference between book and tax depreciations). The applicable tax rate is 19%.
The effective income tax of the Group is accounted for as follows:
Income before income tax
Tax on:
Income from foreign subsidiaries
Income subject to 5% gross income tax
Income subject to regular tax
Others
Current income tax expense
Deferred income tax expense (benefit)
Effective income tax
2011
$5,945,599
2010
$7,822,169
3,431,467
741,540
3,939
916
4,177,862
476,224
$4,654,086
3,085,736
324,316
4,077
46
3,414,175
(6,651)
$3,407,524
2009
$15,161,369
4,906,082
189,422
16,696
–
5,112,200
(81,012)
$5,031,188
The tax on income from foreign subsidiaries was derived by aggregating the effective income tax
for each national jurisdiction.
*SGVMC116496*
- 52 -
The reconciliation of the statutory income tax rate to the effective income tax rate of the Group
follows:
Statutory income tax
Tax effects of:
Income subject to income tax holiday
Income subject to gross income tax
Interest income subjected to final tax
Nondeductible expenses
Difference in tax jurisdiction
Provision for income tax
2011
30.00%
2010
30.00%
2009
30.00%
12.60%
(28.54%)
(0.90%)
106.75%
(41.63%)
78.28%
50.87%
(14.07%)
(0.54%)
(13.75%)
(8.95%)
43.56%
(7.86%)
(6.25%)
(1.22%)
7.31%
11.20%
33.18%
Deferred taxes of the Group relate to the tax effects of the following:
Deferred income tax assets:
Allowance for inventory obsolescence
Revaluation of fixed assets of subsidiaries
Unutilized business losses
Others
Deferred income tax liabilities:
Revaluation of fixed assets of subsidiaries
Unrealize mark-to-market gains from put and
call option
Excess of net book value over tax written-down
value of fixed assets of subsidiaries
Others
Net deferred tax assets (liabilities)
2011
2010
$111,275
444,245
−
188,072
743,592
$386,104
−
556,000
54,386
996,490
(3,966,754)
(205,414)
(820,748)
(9,988)
(12,668)
(4,810,158)
($4,066,566)
−
(672,988)
(2,920)
(881,322)
$115,168
As of December 31, 2011, deferred income tax assets on accrued retirement obligations, excess of
cost over NRV of inventories, MCIT, and unrealized foreign exchange losses of PSi aggregating
to $6.21 million have not been recognized due to uncertainty of its recoverability.
As of December 31, 2010, deferred income tax assets on accrued retirement obligations, excess of
cost over NRV of inventories, MCIT and NOLCO of PSi aggregating to $7.34 million have not
been recognized due to uncertainty of its recoverability.
Details of PSi’s NOLCO and MCIT follow:
Inception Year
2009
2010
2011
Expiry Year
2012
2013
2014
NOLCO
$28,516
402,265
342
$431,123
MCIT
$870
46
−
$916
*SGVMC116496*
- 53 -
25. Earnings per Share
The following table presents information necessary to calculate EPS on net income attributable to
equity holders of the Parent Company.
Net income
Less dividends on preferred stock (Note 18)
Weighted average number of common shares
outstanding
Basic and Diluted EPS
2011
$3,289,314
2,477,852
$811,462
2010
$4,738,929
2,360,119
$2,378,810
2009
$10,065,517
2,251,226
$7,814,291
1,526,590,221
$0.001
1,337,038,223
$0.002
1,229,749,252
$0.006
As of December 31, 2011, 2010 and 2009, the Parent Company has no dilutive potential common
shares.
26. Employee Benefits
The Parent Company, PSi and EPIQ EA have defined benefit pension plans covering substantially
all of their employees, which require contributions to be made to administered funds. The plans
are administered by local banks as trustees. The latest retirement valuation was made on
December 31, 2011.
The following tables summarize the components of the net defined benefit expense (income)
recognized in the consolidated statements of comprehensive income and the funded status and
amounts recognized in the consolidated balance sheets for the plan:
Net defined benefit expense
Current service cost
Interest cost on benefit obligation
Curtailment loss
Settlement gain
Amortization of actuarial loss (gains)
Benefits paid due to settlement
Expected return on plan assets
Net defined benefit expense (income)
2011
$1,497,897
1,095,671
160,619
166,774
133,506
(23,837)
(1,178,866)
$1,851,764
2010
$630,577
583,682
146,377
136,079
(55,578)
–
(992,574)
$448,563
2009
$535,987
703,313
8,274,802
(3,229,952)
(108,734)
(5,085,413)
(1,502,793)
($412,790)
Net pension asset
Plan assets
Benefit obligation
Underfunded
Unrecognized net actuarial losses
Foreign currency exchange difference
Net pension asset
2011
$12,185,092
(15,629,752)
(3,444,660)
4,922,537
–
$1,477,877
2010
$12,812,771
(14,145,445)
(1,332,674)
2,711,374
(6,020)
$1,372,680
*SGVMC116496*
- 54 -
These are presented in the consolidated balance sheets as follows:
Pension asset
Parent Company
Pension liabilities
PSi
EPIQ EA
Net pension asset
2011
2010
$2,807,134
$2,765,675
$1,086,610
242,647
$1,329,257
$1,477,877
$1,392,995
–
$1,392,995
$1,372,680
As of December 31, 2010, the retirement liability of PSi to its retired officer amounting to
$0.40 million is due within a year and is recorded under “Accounts payable and accrued
expenses”. This was fully paid in 2011 (see Note 13).
The Group does not expect to contribute to the retirement fund in 2012, based on the assumption
that the projected income from the outstanding plan assets will compensate the underfunded status
of the retirement plan.
Movements in the net pension asset of the Parent Company for the years ended
December 31, 2011 and 2010 follow:
At beginning of year
Foreign currency exchange difference
Benefits paid due to settlement
Net benefit expense
At end of year
2011
$2,765,675
1,059,834
–
(1,018,375)
$2,807,134
2010
$2,866,220
–
246,382
(346,927)
$2,765,675
Movements in the net pension liability of PSi for the years ended December 31, 2011 and 2010
follow:
At beginning of year
Benefits paid due to settlement
Net benefit expense
Foreign currency exchange difference
Additions through business combination
At end of year
2011
$1,392,995
(1,111,767)
815,334
(9,952)
–
$1,086,610
2010
$–
(141,237)
101,636
–
1,432,596
$1,392,995
Movements in the net pension liability of EPIQ EA for the five-month period ended
December 31, 2011:
Balance upon acquisition
Net benefit expense
Foreign currency exchange difference
At end of year
$220,123
18,055
4,469
$242,647
*SGVMC116496*
- 55 -
The rollforward of the fair value of plan assets follows:
At beginning of year
Expected return on plan assets
Benefits paid during the year
Actuarial gains (losses)
Foreign currency exchange difference
Additions through business combination
Settlements
At end of year
Actual return on plan assets
2011
$12,812,771
1,178,866
(1,129,315)
(684,909)
7,679
–
–
$12,185,092
$484,101
2010
$10,997,452
992,574
(351,715)
476,306
614,490
359,215
(275,551)
$12,812,771
$1,582,728
2011
$14,145,445
(1,513,280)
1,497,897
1,095,671
(555,234)
528,960
238,797
220,123
(28,627)
–
$15,629,752
2010
$5,294,481
(351,715)
630,577
583,682
(521,933)
5,499,387
198,001
2,509,270
439,176
(135,481)
$14,145,445
The rollforward of the present value of obligation follows:
At beginning of year
Benefits paid during the year
Current service cost
Interest cost on benefit obligation
Settlements
Actuarial loss
Curtailments
Additions through business combination
Foreign currency exchange difference
Unpaid obligations
At end of year
The rollforward of the unrecognized actuarial gains (losses) follows:
At beginning of year
Foreign currency exchange difference
From plan assets
From pension obligation
Recognized actuarial gain due to settlement
Recognized actuarial loss due to curtailment
Amortization of actuarial gain
Additions through business combinations
At end of year
2011
($2,711,374)
(1,226,161)
(684,909)
(528,960)
159,912
(64,551)
(126,741)
6,765
($4,922,537)
2010
$2,836,751
137,554
476,306
(5,499,387)
136,079
(51,624)
(55,578)
(691,475)
($2,711,374)
2009
$6,239,724
248,376
(24,130)
(2,469,731)
(3,229,952)
2,181,198
(108,734)
–
$2,836,751
*SGVMC116496*
- 56 -
The distribution of the plan assets at year-end follows:
Government securities
Corporate bonds
Equities
Loans
Trust funds
Investment properties
Cash
Others
Liabilities
Total plan assets
2011
$7,560,086
1,608,780
1,081,823
1,032,678
670,448
221,556
26
47,574
(37,879)
$12,185,092
2010
$7,184,652
1,120,172
2,011,537
907,199
435,834
293,072
263
877,273
(17,231)
$12,812,771
Others include receivables from sale of shares of stock, deposit instruments, and mutual funds.
As of December 31, 2011, the plan assets include shares of stock, corporate bonds and deposit
instruments of related parties (primarily Ayala Corporation, Ayala Land Inc. and Bank of the
Philippine Islands) with total fair value amounting to $0.64 million, $0.24 million and
$0.21 million, respectively.
As of December 31, 2010, the plan assets include shares of stock, corporate bonds and deposit
instruments of related parties (primarily Ayala Corporation, Ayala Land Inc. and Bank of the
Philippine Islands) with total fair value amounting to $1.16 million, $0.07 million and
$0.07 million, respectively.
The expected rates of return on the plan assets follow:
Treasury bills
Equities
Corporate bonds
Others
2011
5.09%
1.61%-1.84%
2.08%
0.00%
2010
3.88%
1.89%
3.37%-7.75%
1.29%
The overall rates of return are based on the expected return within each asset category and on
current asset allocations. The expected returns are developed in conjunction with external advisers
and take into account both current market expectations of future returns, where available, and
historical returns.
The principal assumptions used to determine pension benefits of the Parent Company, PSi and
EPIQ EA are shown below:
Discount rate
Expected rate of return on plan assets
Rate of salary increase
2011
6.20%-7.00%
7.25%-9.00%
5.00%-7.00%
2010
7.75%-8.00%
7.75%-9.00%
5.00%-7.00%
The deficit in the plan and the economic benefit available as a reduction in future contributions
amounted to $3.44 million and nil, respectively, in 2011, and $1.33 million and $18.96 million,
respectively, in 2010.
*SGVMC116496*
- 57 -
Amounts for the current and previous years follow:
Plan assets
Defined benefit obligation
Surplus (Deficit)
Experience adjustments on plan assets
Experience adjustments on plan liabilities
2011
$12,185,092
15,629,752
($3,444,660)
($684,909)
$1,919,560
2010
$12,812,771
14,145,445
($1,332,674)
($489,126)
$461,141
2009
$10,997,452
5,294,481
$5,702,971
$409,922
$832,013
2008
$13,282,258
4,589,104
$8,693,154
$2,721,023
$4,720,473
2007
$17,686,769
14,668,084
$3,018,685
$310,017
$2,885,346
The Parent Company’s subsidiaries, excluding PSi and EPIQ EA, participate in their respective
national pension schemes which are considered as defined contribution plans. The retirement
expenses of these subsidiaries are allocated as follows:
Cost of goods sold and services (Note 19)
Operating expenses (Note 20)
2011
$1,072
316,043
$317,115
2010
$1,127
284,843
$285,970
2009
$1,331
203,971
$205,302
The retirement expenses (income) of the Group are recorded under Salaries, wages, and employee
benefits.
Salaries, wages, and employee benefits follow:
Wages and salaries
Social security costs
Retirement expense (income) under defined
benefit plans
Retirement expense under defined
contribution plans
Others
2011
$106,227,793
1,652,411
2010
$79,920,925
1,392,817
1,851,764
448,563
317,115
8,973,725
$119,022,808
285,970
5,552,964
$87,601,239
2009
$61,858,084
1,396,967
(412,790)
205,971
8,649,488
$71,697,720
“Others” include expense for leave benefits, training and seminars, employee social and
recreation, bonuses, Pag-ibig premium, health premium, and employee insurance expense.
Salaries, wages, and employee benefits are allocated as follows:
Cost of goods sold and services
(Note 19)
Operating expenses (Note 20)
2011
2010
2009
$90,847,467
28,175,341
$119,022,808
$64,704,176
22,897,063
$87,601,239
$55,309,521
16,388,199
$71,697,720
27. ESOWN
The Group has an ESOWN which is a privilege extended to the Group’s eligible managers and
staff whereby the Group allocates up to 10% of its authorized capital stock for subscription by
said personnel under certain terms and conditions stipulated in the plan. Under the ESOWN, for
as long as the Group remains privately-owned, the subscription price of the shares granted shall
be determined based on the multiples of net book value, earnings before income tax, depreciation
and amortization and net income of 10 comparable Asian EMS companies as at the close of the
*SGVMC116496*
- 58 -
calendar year prior to the grant. Once the Parent Company becomes publicly listed, the
subscription price per share shall be based on market price with a discount to be determined by
the Compensation Committee of the BOD at the date of grant.
To subscribe, the grantee must be an eligible participant as defined in the plan. However, should
the grantee cease to be employed by or connected with the Group before the full payment is made
for the subscribed shares, the remaining balance becomes due and demandable upon separation,
except for special circumstances as provided for by the ESOWN. In such instances, the
grantee/heirs may be allowed to continue paying for the balance for the duration of the original
payment period. If the grantee is separated for cause, shares not fully paid will be forfeited and
whatever the amount the grantee has partially paid will be returned to him with no interest; if fully
paid prior to separation, the shares shall be subject to the Right to Repurchase. If the grantee
separates voluntarily, fully vested but not fully paid shares may be paid for in full upon separation
subject to Right to Repurchase; and payments made for subscribed shares up to the time of
separation may be converted into the equivalent number of shares based on the stipulated
subscription price when the shares were availed of. If the grantee separates involuntarily, shares
not fully paid for, whether fully vested or not, may be paid for in full within ninety (90) days from
separation subject to the Right to Repurchase; and payments made for subscribed shares up to the
time of separation may be converted into the equivalent number of shares based on the stipulated
subscription price.
A subscription is declared delinquent when the minimum payment required remains unpaid one
month after the due date. Any cash dividend of a delinquent subscription will be applied to pay
the subscription due. Stock dividends paid while the subscription is delinquent will only be
released to the grantee when the delinquent account is paid. Sixty (60) days after the due date and
account is still delinquent, the remaining shares are forfeited and the employee will not be eligible
for future ESOWN grants.
On February 21, 2007, the Parent Company’s BOD approved the granting of 45,150,000 shares of
the Parent Company under the ESOWN at the subscription price of P
=12.50 to various employees
of STEL and to the Parent Company’s top performers and key personnel. In 2008, additional
1,539,000 shares were granted to STEL and to the Parent Company’s top performers and key
personnel subject to the same terms as the shares subscribed in 2007. All the granted shares have
been subscribed. The grantees will pay for the shares subscribed through installments over a
period of 8 years, wherein an initial payment of 2.5% of the value of the subscribed shares is
payable upon subscription. It shall serve as a down payment for the subscription. The subscribed
shares have a holding period as follows: (a) 40% after one year from subscription date; (b) 30%
after two years from subscription date; and (c) 30% after three years from subscription date. The
actual grant date of the above two grants was on October 15, 2007. The fair value, determined
based on a private bank’s valuation of the Parent Company to be used by a potential investor, was
=
P14.98 per share. The difference between the fair value and the subscription price will be
recognized as employee benefit expense over the required service period. In 2008, the
management has approved a two-year moratorium on the scheduled payments due in 2008 and
2009 which resulted in an extension of the payment period from eight (8) to ten (10) years. This
extension resulted in a net reversal of accretion amounting to $0.25 million in 2009. The
outstanding shares under this grant have fully vested in September 2010.
*SGVMC116496*
- 59 -
On December 14, 2009, the Chairman of the Parent Company’s BOD approved the terms for
granting 30,885,000 shares of the Parent Company under ESOWN at the subscription price of
=
P5.54 per share to various employees of the Group. The grant date was on January 21, 2010. The
payment scheme and holding period for this grant are similar to the grant in 2007. The fair value
per share used in valuing the grant is =
P9.30, which is the closing price of the Parent Company’s
stock at the PSE at the date of grant.
Movements in the number of shares outstanding under ESOWN for the years ended
December 31, 2011 and 2010 follow:
At January 1
Granted
Forfeitures
At December 31
2011
Weighted average
Number of shares
exercise price
120,987,477
P
=6.59
–
–
(4,737,168)
116,250,309
P
=6.59
P
=6.59
2010
Number of shares
111,297,000
30,885,000
(21,194,523)
120,987,477
Weighted average
exercise price
=6.88
P
5.54
6.59
=6.59
P
The employee benefit expense in 2011, 2010 and 2009 amounted to $0.67 million, $1.93 million
and $0.51 million, respectively. The accretion, net of reversal, recognized as increase (decrease)
in subscriptions receivable and additional paid-in capital presented in the consolidated statements
of changes of equity in 2011, 2010 and 2009 amounted to $0.43 million, $1.91 million, and
($0.25) million, respectively (see Note 18).
28. Segment Information
Management monitors operating results per geographical area (with the Philippine operations
further subdivided into the Parent Company and PSi) for the purpose of making decisions about
resource allocation and performance assessment. It evaluates the segment performance based on
gross revenue, gross profit, operating income, interest income and net income before and after tax.
No operating segments have been aggregated to form a reportable segment.
Intersegment revenue is generally recorded at values that approximate third-party selling prices.
The following tables present revenue and profit information regarding the Group’s geographical
segments for the years ended December 31, 2011, 2010 and 2009.
December 31, 2011
Revenue
Third party
Inter-segment
Total revenue
Segment gross profit
Segment operating income
(loss)
Segment interest income
Segment interest expense
Segment profit (loss) before
income tax
Segment provision for income
tax
Segment profit (loss) after
income tax
Philippines
Parent
Company
Singapore/China Europe/Mexico
USA
Consolidation
and
Japan Eliminations
Total
PSi
$– $575,453,908
$989,150
–
885,430 (8,029,420)
$1,874,580 ($8,029,420) $575,453,908
$1,088,152 ($7,946,062) $38,177,534
$154,151,770
–
$154,151,770
$12,128,822
$73,559,713
403,500
$73,963,213
$3,127,887
$280,118,990
3,898,157
$284,017,147
$22,014,238
$66,239,366
–
$66,239,366
$5,425,951
$394,919
2,842,333
$3,237,252
$2,338,546
($13,936,898)
$185,072
$624,079
($4,024,730)
$3,334
$389,496
$3,902,328
$100,007
$291,989
($683,681)
$27,077
$1,191,848
$25,602
$–
$1,775
$208,146
$30
$811
($8,574,088)
($4,390,951)
$6,666,192
$12,098,547
$22,844
$239,468
($116,413)
$5,945,599
(1,326,845)
(129,022)
(2,724,363)
(223,009)
(250,000)
(847)
–
(4,654,086)
($9,900,933)
($4,519,973)
$3,941,829
$11,875,538
($227,156)
$238,621
($116,413)
$1,291,513
$– ($14,509,233)
$–
$315,520
$–
2,499,998
*SGVMC116496*
- 60 -
December 31, 2010
Philippines
December 31, 2009
Revenue
Third party
Inter-segment
Total revenue
Segment gross profit
Segment operating income (loss)
Segment interest income
Segment interest expense
Segment profit (loss) before income
tax
Segment provision for income tax
Segment profit (loss) after income tax
Japan
$280,521
2,463,391
$2,743,912
$2,588,665
$28,858
$–
$1,561
$472,873
863,087
$1,335,960
$935,889
$95,025
$37
$1,229
$–
(7,323,600)
($7,323,600)
($6,572,223)
$–
$–
$–
$412,326,605
–
$412,326,605
$44,474,592
$4,250,576
$352,578
$1,036,929
–
–
$–
$7,822,169
(3,407,524)
$4,414,645
Singapore/China
Parent Company
Revenue
Third party
Inter-segment
Total revenue
Segment gross profit
Segment operating income (loss)
Segment interest income
Segment interest expense
Segment profit (loss) before income
tax
Segment provision for income tax
Segment profit (loss) after income tax
USA
Consolidation
and
Eliminations
PSi
$143,388,346
–
$143,388,346
$13,857,388
($8,573,328)
$272,574
$437,792
$19,345,006
–
$19,345,006
$963,522
($707,780)
$3,181
$102,701
($4,425,209)
(282,199)
($4,707,408)
($769,800)
(46,240)
($816,040)
Philippines
$196,295,400
–
$196,295,400
$17,395,603
($585,141)
$655,397
$950,821
$4,739,424
(206,118)
$4,533,306
$248,839,859
3,997,122
$252,836,981
$32,701,351
$13,407,801
$76,786
$493,646
$12,871,708
(3,078,292)
$9,793,416
$27,297
–
$27,297
$118,173
(793)
$117,380
Singapore/China
USA
$198,837,576
1,392,234
$200,229,810
$28,443,194
$10,377,426
$67,730
$834,650
$63,332
2,083,085
$2,146,417
$1,963,998
$4,135
$–
$536
$305,973
566,118
$872,091
$414,707
($377,108)
$134
$1,459
$3,599
–
$3,599
($372,342)
(807)
($373,149)
$10,790,688
(4,824,263)
$5,966,425
Japan
Eliminations
$–
(4,041,437)
($4,041,437)
($3,626,871)
$–
$–
$–
Total
$395,502,281
–
$395,502,281
$44,590,631
$9,419,312
$723,261
$1,787,466
$–
–
$–
$15,161,369
(5,031,188)
$10,130,181
Inter-segment revenues, cost of sales and operating expenses are eliminated on consolidation.
For the year ended December 31, 2011, the operating income (loss) and profit (loss) before and
after income tax for each operating segment includes net profit from inter-segment revenues
aggregating to $8.03 million and inter-segment cost of sales and operating expenses aggregating to
$0.08 million and $6.71 million, respectively.
For the year ended December 31, 2010, the operating income (loss) and profit (loss) before and
after income tax for each operating segment includes net profit from inter-segment revenues
aggregating to $7.32 million and inter-segment cost of sales and operating expenses aggregating to
$0.75 million and $5.88 million, respectively.
For the year ended December 31, 2009, the operating income (loss) and profit (loss) before and
after income tax for each operating segment includes net profit from inter-segment revenues
aggregating to $4.04 million and inter-segment cost of sales and operating expenses aggregating to
$0.41 million and $3.02 million, respectively.
The following table presents segment assets of the Group’s geographical segments as of
December 31, 2011 and 2010.
Philippines
Parent
Company
Total
Singapore/
China
Europe/Mexico
USA
Japan
Consolidation
and
Eliminations
Total
PSi
Segment assets
December 31,2011
$245,450,884
$28,859,573 $207,481,985
$113,564,811
$2,821,955
$889,596
($154,376,510) $444,692,294
Segment assets
December 31,2010
As restated
(see Note 2)
$217,873,378
$36,518,323 $204,766,409
$–
$2,804,323
$1,778,955
($124,658,280) $339,083,108
*SGVMC116496*
- 61 Segment assets as of December 31, 2011 do not include investments in subsidiaries amounting to
$129.53 million and inter-segment loans and receivables amounting to $32.21 million which are
eliminated on consolidation. Furthermore, goodwill arising from the acquisition of PSi and EPIQ
CZ amounting to $7.48 million (net of impairment loss of $2.72 million) and $0.65 million are
recognized at consolidated level.
Segment assets as of December 31, 2010 do not include investments in subsidiaries amounting to
$96.21 million and inter-segment loans and receivables amounting to $32.68 million which are
eliminated on consolidation. Furthermore, goodwill arising from the acquisition of PSi amounting
to $10.20 million is recognized at consolidated level.
The following table presents revenues from external customers and noncurrent assets:
Philippines
Europe
USA
Asia
Japan
Revenues from External Customers
2010
2009
2011
$73,948,544
$132,958,167
$69,646,659
153,701,402
106,543,852
284,763,474
101,406,122
80,232,365
139,314,874
67,921,099
54,385,497
72,609,453
15,349,438
21,382,400
9,119,448
$412,326,605
$395,502,281
$575,453,908
Noncurrent Assets
2010
2011
$54,298,943
$45,366,664
–
40,891,989
1,246,318
1,200,195
76,398,853
71,656,878
25,386
78,418
$131,969,500
$159,194,144
Revenues are attributed to countries on the basis of the customer’s location. In 2011, no
revenue of a specific customer reached 10% of the Group’s total revenue. For the years ended
December 31, 2011, 2010 and 2009, one customer from the Philippine segment accounts for
$47.06 million or 8.18%, $42.74 million or 10.37% and 76.41 million or 19% of the Group’s total
revenues, respectively.
Noncurrent assets, which include property, plant and equipment, goodwill, and intangible assets,
are disclosed according to their physical location.
The following table presents revenues per product type:
Consumer
Telecom
Automotive
Industrial
Multiple Market
Computer Peripherals
Medical
Others
Total
2011
$114,272,192
109,859,417
106,497,849
102,569,175
83,417,526
32,627,483
22,451,137
3,759,129
$575,453,908
2010
$91,000,340
112,253,127
36,604,125
80,627,459
26,423,871
36,822,362
24,594,396
4,000,926
$412,326,606
2009
$80,821,637
158,902,456
23,536,006
68,093,382
6,019,939
36,863,625
17,722,737
3,542,500
$395,502,282
29. Lease Commitments
Finance Lease Agreements - as Lessee
On June 30, 2009, the Parent Company entered into a lease contract with IBM for the lease of
servers for a three-year period starting on the same date. The Parent Company has a bargain
option to purchase the servers after the lease term at P
=50.09. The lease provides for monthly
rental payments of $17,141.
*SGVMC116496*
- 62 -
On March 31, 2010, the Parent Company entered into another lease contract with IBM for the
lease of additional server for a one-year period starting on May 1, 2010. The Parent Company has
a bargain option to purchase the servers after the lease term at =
P50.09. The lease provides rental
payments of $1,013,729 each in the first and last months of the lease. At the end of the lease term,
the Parent Company exercised its bargain option to purchase the servers at a nominal of =
P45.45.
EPIQ EA has various finance lease contracts with Interlease AD related to its machinery and
production equipment with terms of 3 to 5 years and final repayment dates between 2012 and
2016. The leases are subject to interest rates of 3-month Euribor plus 2% to 4%.
EPIQ CZ has various finance lease contracts related to its machinery and production equipment
and transportation equipment with terms of 5 to 10 years and final repayment dates between 2013
and 2016. The leases of machinery and equipment are subject to interest rates ranging from 5.90%
to 7.41% per annum. The lease of transportation equipment is subject to interest of 12.26% per
annum.
Future minimum lease payments are as follows:
Within one year (Note 13)
After one year but not more than five years
Total minimum lease payments
2011
Minimum
Present value
payments
of payments
$787,247
$801,777
625,340
612,724
$1,412,587
$1,414,501
Within one year (Note 13)
After one year but not more than five years
Total minimum lease payments
2010
Minimum
Present value
payments
of payments
$1,219,420
$1,209,960
119,987
118,313
$1,339,407
$1,328,273
Operating Lease Agreements - as Lessee
Parent Company
On December 13, 2005, the Parent Company entered into a lease contract with Technopark Land,
Inc. (TLI), an affiliate, for the lease of parcels of land situated at the Special Export Processing
Zone, Laguna Technopark, Biñan, Laguna. The lease shall be for a three-year period commencing
on December 31, 2005 up to December 31, 2008. On December 23, 2008, the Parent Company
extended the lease contract for another three (3) years commencing on December 31, 2008 up to
December 31, 2011. On January 2, 2012, the Parent Company again extended the lease contract
for another three years commencing January 2, 2012 up to December 31, 2015. The lease contract
is renewable at the option of TLI upon such terms and conditions and upon such rental rates as the
parties may agree upon at the time of the renewal, taking into consideration comparable rental
rates for similar properties prevailing at the time of renewal. The Parent Company shall advise
TLI in writing at least sixty (60) days before the expiration of the term of its desire to renew the
contract, which TLI may consider upon such terms and conditions as may be agreed upon between
the parties. The Parent Company shall pay, as monthly rental for and in consideration of the use
of the leased premises, the amount of $1,642 exclusive of value added tax.
*SGVMC116496*
- 63 -
The Parent Company also leases condominium units for the use of its officers and certain
managers. The terms are usually for two (2) to four (4) months and are normally renewable under
conditions specified in separate lease contracts. In 2011, all operating lease contracts for the
Condominium units expired.
The Parent Company leases two office condominium units where some of its facilities are located
under noncancellable operating leases with Cyberzone Properties Inc. The lease agreements are
for three-year periods up to July 2008 and August 2008. On August 15, 2008, the lease
agreements were extended for another three (3) years commencing September 1, 2008 up to
August 31, 2011. The leases contain provisions including, but not limited to, an escalation rate of
7% per year and early termination penalties. The leases provide for quarterly rental payments of
$26,364 during the first year of the lease term. The difference between the prepaid rental
payments and straight line rental expenses resulted to prepayment of nil and $15,878 million as of
December 31, 2011 and 2010, respectively, which is recorded as part of “Prepayments” under
“Other current assets” in the consolidated balance sheets.
IMI Japan
On December 1, 2006, IMI Japan entered into a two-year contract with Kaneshichi Administration
for lease of office premises commencing on December 1, 2006, whereby it is committed to pay a
monthly rental of $6,406. The lease agreement provides for automatic renewal of the lease
contract for another two (2) years unless prior notice of termination is given to the lessor. This
was terminated on April 21, 2010.
On February 15, 2010, IMI Japan entered into a two-year contract with Kabushikigaisha Tokyu
Community for lease of office premises located in Nagoya whereby it is committed to pay a
monthly rental of ¥245,490 inclusive of tax and monthly maintenance fee of ¥35,070 inclusive of
tax. The lease agreement provides for automatic renewal of the lease contract unless prior notice
of termination is given to the lessor.
IMI USA
On July 17, 2008, IMI USA entered into seven-year contract with Roy G.G. Harris and
Patricia S. Harris for lease of office premises commencing on August 2008 up to November 2014.
The lease contains provisions including, but not limited to, an escalation rate of 3% per year and
early termination penalties. The lease provides for monthly rental payments of $13,464 during the
first year of the lease term.
On January 28, 2010, IMI USA entered into a six-year lease agreement with Fremont Ventures,
LLC commencing two months from issuance of building permit or maximum of three months if
Fremont caused the delay. The base monthly rental rate is $3,687 on the first 6 months with
escalation every 11 months as listed in the lease contract. Average monthly rental rate amounts to
$9,523.
IMI Singapore and STEL
IMI Singapore and STEL Group have various operating lease agreements in respect of office
premises and land. These noncancellable leases have remaining noncancellable lease terms of
between 1 to 50 years commencing on January 1, 1992 to April 1, 2011 and ending on
February 28, 2010 to April 30, 2050. Most leases contain renewable options. There are no
restrictions placed upon the lessee by entering into these leases.
*SGVMC116496*
- 64 -
PSi
PSi has a 15-year non-cancellable operating lease agreement with Food Terminal, Inc. (FTI) for
its plant facilities, office spaces, and other facilities commencing on August 15, 2004 up to
August 14, 2020. The lease agreement with FTI provides for increase in rental per year starting on
the second year and annually thereafter until the end of the lease term. The lease agreement
provides a late payment penalty of 2% per month for the monthly rental not paid on time. The
difference between the actual rental payments of PSi and the straight-lined rental expense resulted
to an accrued expense of $0.91 million and $0.89 million as of December 31, 2011 and 2010,
respectively, which is recorded under “Accrued rent” in the consolidated balance sheets.
Moreover, PSi leases its plant facilities, office spaces and other facilities in Calamba, Laguna from
RBF Development Corporation for 36 months until March 31, 2011. PSi has the option to extend
the term of the lease for another two (2) years and the contract was extended up to March 2013.
The lease agreement with RBF provides for increase in rental at varying rates over the term of the
lease. The lease agreement provides penalty interest of 3% per month compounded for the late
payment of monthly rental.
Other operating lease agreements for machinery and equipment and storage space entered into by
PSi are for one (1) year, subject to renewal options.
These operating lease agreements of the Group include clauses to enable upward revision of the
rental charges on agreed dates. Future minimum rentals payable under noncancellable operating
leases as of December 31, 2011 and 2010 follow:
Within one year
After one year but not more than five years
More than five years
2011
$2,113,206
1,743,440
3,081,319
$6,937,965
2010
$2,419,772
5,220,618
3,607,709
$11,248,099
The aggregate rent expense of the Group included under “Outsourced activities” account included
under “Operating expenses” in the consolidated statements of comprehensive income, recognized
on these operating lease agreements for the years ended December 31, 2011, 2010 and 2009
amounted to $1.00 million, $1.09 million and $1.88 million, respectively (see Note 21). Deposits
made under these operating lease agreements are intended to be applied against the remaining
lease payments.
Operating Lease Agreements - as Lessor
On August 1, 2009, the Parent Company subleased the unused portion of its two leased office
condominium units from Cyberzone Properties Inc., with the consent of the latter. 102.52 square
meters and 32.80 square meters were leased to Stratpoint Technologies Inc. and Xepto Computing
Inc., respectively, at the rate of P
=475.00 per square meter in the first month and =
P502.25 per
square meter on the subsequent months. The lease contract is for a term of one (1) year,
renewable upon mutual agreement of both parties.
On June 8, 2010, an extension of the lease contract was executed by the Parent Company and the
lessees for a period of one month from August 1 to 31, 2010. The monthly rental has been
amended to P
=543.83 per square meter. In addition, the lessees have the option to renew the
extended lease under the same terms and conditions, for a month-to-month tenancy basis for
12 months until August 31, 2011. The renewal option was exercised by the lessees for which the
*SGVMC116496*
- 65 -
term of the lease has been extended to March 15, 2011. The lease income amounted to $1,899,
$17,376 and $8,483 in 2011, 2010 and 2009, respectively, recognized under “Miscellaneous
income” in the consolidated statements of comprehensive income.
30. Related Party Transactions
Parties are considered to be related if one party has the ability, directly or indirectly, to control the
other party or exercise significant influence over the other party in making financial and operating
decisions. Parties are also considered to be related if they are subject to common control or
common significant influence which include affiliates. Related parties may be individuals or
corporate entities.
In the ordinary course of business, the Group transacts with its related parties. The transactions
and balances of accounts with related parties follow:
Related Party
Relationship Nature of Transaction
Bank of the Philippine
Islands (BPI)
Affiliate
Cash and cash equivalents
Nontrade receivable
Nontrade payable
Derivative asset
Gains on derivatives
Interest income
Balance Sheets
2011
2010
$3,753,709 $2,029,657
201,726
70,504
33,262
1,698
1,317
15,283
-
Statements of Comprehensive Income
2011
2010
2009
$–
$–
$–
–
–
–
–
–
–
241,968
95,540
10,402
11,938
91,569
-
718
-
110,786
209,743
2,969
9,377
7,682
-
-
-
Nontrade payable
Postal and communication
Building Rental
446
-
67,102
-
161,624
42,327
202,143
-
286,541
-
Nontrade payable
Postal and communication
2,931
-
3,828
–
88,248
94,926
95,029
AG Counselors
Affiliate
Corporation (AGCC)
Nontrade payable
Professional and service fees
Technopark Land, Inc
(TLI)
Affiliate
Nontrade receivable
Innove Communications,
Inc. (ICI)
Affiliate
Globe Telecom, Inc. (GTI) Affiliate
a. As of December 31, 2011, the Parent Company has savings and current accounts and shortterm deposits with BPI amounting to $411,556 and $3,342,153, respectively. As of December
31, 2010, the Parent Company has savings and current accounts and short-term deposits with
BPI amounting to $546,993 and $1,482,664, respectively. Total interest income earned from
investments with BPI amounted to $10,402, $11,938, and $91,569 in 2011, 2010 and 2009,
respectively.
b. As of December 31, 2011 and 2010, nontrade receivables from BPI pertain to retirement and
separation pay advanced by the Parent Company but is reimbursable from the trust fund with
BPI.
c. The Parent Company has outstanding housing and automobile financing loans from BPI
amounting to $33,262 and $1,698 as of December 31, 2011 and 2010, respectively, included
in “Employee-related payables” under “Accounts payable and accrued expenses”. The
outstanding housing and automobile financing loans arise from the differences in the timing of
remittances by the Parent Company to BPI and the period of withholding from employee
salaries and wages.
d. The Parent Company has outstanding short-term foreign currency forwards with BPI
amounting to $1,317 and $15,283 as of December 31, 2011 and 2010, respectively.
*SGVMC116496*
- 66 -
e.
As of December 31, 2011 and 2010, certain plan assets of the Parent Company under its
retirement fund with BPI are invested with its related parties (see Note 26).
f.
The Parent Company engages AGCC, an affiliate, for corporate secretarial services subject to
a monthly fee of =
P40,000. As of December 31, 2011 and 2010, payable to AGCC amounted
to nil and $718, respectively. These are due and demandable.
g.
The Parent Company has nontrade receivable from TLI, an affiliate, amounting to $9,377 and
$7,682 as of December 31, 2011 and 2010, respectively, which pertains to advances by the
Parent Company for various expenses incurred by TLI, primarily on real property taxes and
corporate secretarial services.
h.
The Parent Company has nontrade payables to Innove Communications, Inc., an affiliate,
amounting to $446 and $67,102 as of December 31, 2011 and 2010, respectively, which
pertains to billings on building rental, leased lines, internet connections and ATM
connections. These are due and demandable. Related expense for 2011, 2010 and 2009,
amounted to $203,951, $202,143 and $286,541, respectively.
i.
As of December 31, 2011 and 2010, the Parent Company’s accounts payable to GTI, an
affiliate, amounted to $2,931 and $3,828 for the purchase of Blackberry software and billings
for cellphone charges and WiFi connections. These are due and demandable. Related
expense for 2011, 2010 and 2009, amounted to $88,248, $94,926 and $95,029, respectively.
Key management personnel
Key management personnel of the Group include all management committee members.
Compensation of key management personnel by benefit type follows:
2010
$4,973,639
447,949
596,826
$6,018,414
2011
$5,275,504
387,529
208,877
$5,871,910
Short-term employee benefits
Post-employment benefits
Share-based payments
31. Fair Value of Financial Instruments
The following table sets forth the comparison of the carrying values and fair values of the Group’s
financial assets and liabilities recognized as of December 31, 2011 and 2010. There are no
material unrecognized financial assets and liabilities as of December 31, 2011 and 2010.
Financial Assets
Cash and cash equivalents
Loans and receivables
Trade
Nontrade
Receivable from employees
Due from related parties
Receivable from insurance
Short-term investments
Receivable from Meralco
Others
Carrying Value
2010
2011
2011
Fair Value
2010
$54,069,180
$38,134,743
$54,069,180
$38,134,743
125,627,316
4,208,832
1,811,210
211,103
27,903
–
–
1,790,216
95,513,159
3,656,169
707,172
78,186
657,849
2,000,000
549,923
1,094,720
125,627,316
4,208,832
1,811,210
211,103
27,903
–
–
1,790,216
95,513,159
3,656,169
707,172
78,186
657,849
2,000,000
549,923
1,094,720
(Forward)
*SGVMC116496*
- 67 -
Noncurrent receivables
Miscellaneous deposits
Loans and receivables
AFS financial assets
Derivative assets
Total Financial Assets
Financial Liabilities
Derivative liabilities
Other financial liabilities
Accounts payable and accrued expenses
Trade payables
Accrued expenses
Nontrade payables
Accrued payroll
Dividends payables
Obligation under finance lease Current
Employee-related payables
Accrued interest payable
Due to related parties
Others
Trust receipts and loans payable
Provisions
Long-term debt
Accrued rent
Obligation under finance lease Noncurrent
Other long-term employee benefit
Total Financial Liabilities
Carrying Value
2010
2011
$184,179
$213,577
1,467,268
1,498,225
144,043,368
189,457,562
382,527
414,348
1,693,121
2,798,912
$146,119,016
$192,670,822
2011
$195,848
1,498,225
189,439,833
414,348
2,798,912
$192,653,093
Fair Value
2010
$176,034
1,467,268
144,035,223
382,527
1,693,121
$146,110,871
$34,562
$3,832,474
$34,562
$3,832,474
99,199,121
25,648,519
4,700,640
4,538,123
2,538,556
71,090,278
16,254,068
980,520
3,563,987
–
99,199,121
25,648,519
4,700,640
4,538,123
2,538,556
71,090,278
16,254,068
980,520
3,563,987
–
801,777
169,596
675,863
36,639
2,085,326
39,008,811
249,044
60,398,500
913,688
1,209,960
131,265
60,919
73,346
4,316,330
17,921,638
–
38,000,000
894,088
801,777
169,596
675,863
36,639
2,085,326
39,008,811
249,044
60,917,515
622,298
1,209,960
131,265
60,919
73,346
4,316,330
17,921,638
–
38,000,000
534,738
612,724
230,704
241,807,631
$241,842,193
118,313
372,084
154,986,796
$158,819,270
541,528
230,704
241,964,060
$241,998,622
110,202
372,084
154,619,335
$158,451,809
The following methods and assumptions were used to estimate the fair value of each class of
financial instruments for which it is practicable to estimate such value:
All loans and receivables except noncurrent receivables - Carrying amounts approximate fair
values due to the short-term maturities of these receivables.
Noncurrent receivables - The fair values are based on the discounted value of future cash flows
using the applicable rates for similar types of instruments. The discount rates used are 4.36% and
4.56% in 2011 and 2010, respectively.
Miscellaneous deposits - Carrying amounts are deemed to approximate fair values since the fair
values of certain deposits cannot be reasonably and reliably estimated.
AFS financial assets - These pertain to investments in club shares. Fair value is based on quoted
prices.
Derivative instruments - The fair value of freestanding currency forwards is based on counterparty
valuation. The call and put options were valued using a binomial model. This valuation technique
considers the probability of PSi’s share price, which is valued based on discounted cash flows, to
move up or down depending on the volatility, risk-free rate and exercise price.
Accounts payable and accrued expenses and trust receipts and loans payable - The fair values
approximate the carrying amounts due to the short-term nature of these transactions.
*SGVMC116496*
- 68 Long-term debt - The fair value of long-term debt that is repriced on a semi-annual basis is
estimated using the discounted cash flow methodology using the current incremental borrowing
rates for similar borrowings with maturities consistent with those remaining for the liability being
valued. The discount rates used ranged from 2.10% to 3.90% in 2011. For variable rate loans that
reprice every three (3) months, the carrying value approximates the fair value because of recent
and regular repricing based on current market rates.
Accrued rent - The fair value are based on the discounted value of future cash flows using the
applicable rates for similar types of instruments. The discount rates used range from 3.68% to
7.03% and 4.55% to 7.91% in 2011 and 2010, respectively.
Obligation under finance lease - noncurrent - The fair values are based on the discounted value of
future cash flows using the applicable rates for similar types of instruments. The discount rates
used range from 0.14% to 3.06% in 2010 and 2.00% to 12.26% in 2011.
Other long-term employee benefits - The fair value approximates the accrual that was discounted
using the assumptions and method used in discounting the retirement benefits obligation.
Fair Value Hierarchy
The Group uses the following hierarchy for determining and disclosing the fair value of financial
instruments by valuation technique:
Level 1:
Level 2:
Level 3:
Quoted prices in active markets for identical assets or liabilities;
Those involving inputs other than quoted prices included in Level 1 that are
observable for the asset or liability, either directly (as prices) or indirectly (derived
from prices); and,
Those with inputs for the asset or liability that are not based on observable market
data (unobservable inputs).
The following table shows the Group’s financial instruments carried at fair value as of
December 31, 2011 and 2010, based on fair value hierarchy:
2011
AFS financial assets
Derivative assets
Currency forwards
Call option
Derivative liabilities
Currency forwards
Put option
2010
AFS financial assets
Derivative assets
Currency forwards
Call option
Derivative liabilities
Put option
Level 1
Level 2
Level 3
$414,348
$–
$–
–
–
63,087
–
–
2,735,825
–
–
$414,348
34,562
–
$97,649
–
–
$2,735,825
$382,527
$–
$–
–
–
480,696
–
–
1,212,425
–
$382,527
–
$480,696
3,832,474
$5,044,899
*SGVMC116496*
- 69 -
There were no transfers between Level 1 and Level 2 fair value measurements, and no transfers
into and out of Level 3 fair value measurements.
The fair value of the call and put options are highly sensitive to the estimated 12-month trailing
EBITDA of PSi during the option period and PSi’s cost of equity as of valuation date.
The following are the estimated changes in the fair values of the call and put options assuming the
estimated EBITDA used in the fair value calculation would vary by 5%.
2011
Increase
(Decrease)
in Net Income
Estimated EBITDA is 5% higher
Call option
Put option
Estimated EBITDA is 5% lower
Call option
Put option
2010
Increase
(Decrease)
in Net Income
($271,472)
–
($116,673)
(499,093)
161,879
–
130,204
489,184
The following are the estimated changes in the fair values of the call and put options assuming the
cost of equity will change by 5%.
2011
Increase
(Decrease)
in Net Income
Cost of equity is 5% higher
Call option
Put option
Cost of equity is 5% lower
Call option
Put option
2010
Increase
(Decrease)
in Net Income
$–
–
($283,328)
(462,008)
–
–
391,032
501,489
32. Financial Risk Management Objectives and Policies
The Group’s principal financial instruments, composed of trust receipts and loans payable, longterm debt and other financial liabilities, were issued primarily to raise financing for the Group’s
operations. The Group has various financial instruments such as cash and cash equivalents, loans
and receivables and accounts payable and accrued expenses which arise directly from its
operations.
The main purpose of the Group’s financial instruments is to fund its operational and capital
expenditures. The main risks arising from the Group’s financial instruments are interest rate risk,
liquidity risk, credit risk and foreign currency risk. The Group also enters into currency forwards
to manage the currency risk arising from its operations and financial instruments.
*SGVMC116496*
- 70 -
The Group’s risk management policies are summarized below:
Interest rate risk
The Group’s exposure to market risk for changes in interest rates relates primarily to its long-term
debt obligations with floating interest rates. The Group’s policy is to manage its interest cost
using a mix of fixed and variable rate debt.
The following table demonstrates the sensitivity to a reasonably possible change in interest rates,
with all other variables held constant, of the Group’s income before income tax (through the
impact on floating rate borrowings) as of December 31, 2011 and 2010. There is no other impact
on the Group’s equity other than those already affecting income.
Effect on profit before tax
2010
2011
($380,000)
($510,662)
380,000
510,662
Increase/decrease in basis points
+100
-100
The following table shows the information about the Group’s financial instruments as of
December 31, 2011 and 2010 that are exposed to interest rate risk presented by maturity profile.
Long-Term Debt
2010
2011
$38,000,000
$11,066,203
–
40,000,000
$38,000,000
$51,066,203
Within one year
1-2 years
Liquidity risk
Liquidity or funding risk is the risk that an entity will encounter difficulty in raising funds to meet
commitments associated with financial instruments. The Group’s exposure to liquidity risk relates
primarily to its short and long-term obligations. The Group seeks to manage its liquidity profile to
be able to finance its capital expenditures and operations. The Group maintains a level of cash and
cash equivalents deemed sufficient to finance operations. As part of its liquidity risk management,
the Group regularly evaluates its projected and actual cash flows. To cover financing
requirements, the Group intends to use internally-generated funds and loan facilities with local and
foreign banks. Surplus funds are placed with reputable banks.
The table below summarizes the maturity profile of the Group’s financial assets held for liquidity
purposes and financial liabilities based on contractual undiscounted payments.
2011
Financial assets
Cash and cash equivalents
Financial liabilities
Derivative liabilities
Accounts payable and accrued expenses
Trade payables
Accrued expenses
Nontrade payables
Accrued payroll
On demand
Less than
3 months
3 to
12 months
1 to 5 years
Total
$36,507,003
$17,562,177
$–
$–
$54,069,180
–
34,562
–
–
34,562
–
–
–
–
99,199,121
25,648,519
4,700,640
4,538,123
–
–
–
–
–
–
–
–
99,199,121
25,648,519
4,700,640
4,538,123
(Forward)
*SGVMC116496*
- 71 -
Dividends payable
Obligation under finance lease -current
Employee-related payables
Accrued interest payable
Due to related parties
Others
Trust receipt and loans payable
Provisions
Long-term debt
Accrued rent
Obligation under finance lease - noncurrent
Other long-term employee benefit
On demand
$–
–
–
–
–
–
–
–
–
–
–
–
–
$36,507,003
Less than
3 months
$–
–
169,596
675,863
36,639
2,085,326
–
249,044
–
–
–
–
137,337,433
($119,775,256)
3 to
12 months
$2,538,556
801,777
–
–
–
–
39,008,811
–
–
–
–
–
42,349,144
($42,349,144)
1 to 5 years
$–
–
–
–
–
–
–
–
65,361,624
913,688
621,393
230,704
67,127,409
($67,127,409)
Total
$2,538,556
801,777
169,596
675,863
36,639
2,085,326
39,008,811
249,044
65,361,624
913,688
621,393
230,704
246,813,986
($192,744,806)
2010
Financial assets
Cash and cash equivalents
Short-term investments
Financial liabilities
Derivative liabilities
Accounts payable and accrued expenses
Trade payables
Accrued expenses
Nontrade payables
Accrued payroll
Obligation under finance lease - current
Employee-related payables
Accrued interest payable
Due to related parties
Others
Trust receipts and loans payable
Long-term debt
Accrued rent
Obligation under finance lease - noncurrent
Other long-term employee benefit
On demand
Less than
3 months
3 to
12 months
1 to 5 years
Total
$24,894,015
–
24,894,015
$13,240,728
–
13,240,728
$–
2,000,000
2,000,000
$–
–
–
$38,134,743
2,000,000
40,134,743
3,832,474
–
–
–
3,832,474
–
–
–
–
–
–
–
–
–
–
–
–
–
–
3,832,474
$21,061,541
71,090,278
16,254,068
980,520
3,563,987
–
131,265
60,919
73,346
4,316,330
10,029,250
–
–
–
–
106,499,963
($93,529,235)
–
–
–
–
1,219,430
–
–
–
–
8,106,522
38,427,318
–
–
–
47,753,270
($45,753,270)
–
–
–
–
–
–
–
–
–
–
–
894,088
119,987
372,084
1,386,159
($1,386,159)
71,090,278
16,254,068
980,520
3,563,987
1,219,430
131,265
60,919
73,346
4,316,330
18,135,772
38,427,318
894,088
119,987
372,084
159,471,866
($119,337,123)
Credit Lines
The Group has credit lines with different financing institutions as at December 31, 2011 and 2010,
as follows:
2011
Financial Institutions
Local:
U.S. Dollar
Philippine Peso
Singapore Dollar
Czech Koruna
Euro
Foreign:
U.S. Dollar
Singapore Dollar
Credit Limit
Available
Credit Line
36,000,000
1,060,000,000
30,000,000
4,000,000
9,500,000
36,000,000
1,060,000,000
28,713,951
958,404
947,915
$79,700,000
30,000,000
62,035,986
28,713,951
*SGVMC116496*
- 72 -
2010
Financial Institutions
Local:
U.S. Dollar
Philippine Peso
Foreign:
U.S. Dollar
Singapore Dollar
Credit Limit
Available
Credit Line
$36,000,000
=1,060,000,000
P
$36,000,000
=1,060,000,000
P
$87,700,000
SGD30,000,000
$76,771,639
SGD28,852,908
Credit risk
Credit risk is the risk that the Group’s counterparties to its financial assets will fail to discharge
their contractual obligations. The Group’s major credit risk exposure relates primarily to its
holdings of cash and cash equivalents and short-term investments and receivables from customers
and other third parties. Credit risk management involves dealing with institutions for which credit
limits have been established. The treasury policy sets credit limits for each counterparty. The
Group trades only with recognized, creditworthy third parties. The Group has a well-defined
credit policy and established credit procedures. The Group extends credit to its customers
consistent with sound credit practices and industry standards. The Group deals only with
reputable, competent and reliable customers who pass the Group’s credit standards. The credit
evaluation reflects the customer’s overall credit strength based on key financial and credit
characteristics such as financial stability, operations, focus market and trade references. All
customers who wish to trade on credit terms are subject to credit verification procedures. In
addition, receivable balances are monitored on an ongoing basis with the result that the Group’s
exposure to bad debts is not significant.
The Group’s maximum exposure to credit risk for the components of the consolidated balance
sheets as at December 31, 2011 and 2010 is the carrying amounts as illustrated in Note 31 except
for cash and cash equivalents. The Group's maximum exposure for cash and cash equivalents
excludes the carrying amount of cash on hand.
The Group has 36% and 51% of trade receivables relating to three (3) major customers as of
December 31, 2011 and 2010, respectively.
As of December 31, 2011 and 2010, the aging analysis of loans and receivables, noncurrent
receivables and miscellaneous deposits follows:
2011
Trade
Nontrade
Receivable from
insurance
Receivable from
employees
Due from related
parties
Others
Neither
past due
nor
Total
impaired
$127,744,520 $105,979,396
4,292,680
2,126,197
<30 days
$11,232,980
1,313,161
Past due but not impaired
30-60 days
60-90 days 90-120 days
$3,841,339
$1,212,561
$624,467
286,195
415,902
67,377
>120 days
$2,736,573
–
Specifically
Impaired
$2,117,204
83,848
1,230,038
–
–
–
–
–
27,903
1,202,135
1,811,210
967,651
607,422
107,833
23,555
2,640
102,109
–
211,103
211,103
1,790,216
–
$137,079,767 $109,284,347
Noncurrent receivables
$213,577
$213,577
Miscellaneous deposits
$1,498,225
$1,498,225
–
1,318,465
$14,472,028
$–
$–
–
68,271
$4,303,638
$–
$–
–
167,642
$1,819,660
$–
$–
–
110,462
$804,946
$–
$–
–
125,376
$2,991,961
$–
$–
–
–
$3,403,187
$–
$–
*SGVMC116496*
- 73 -
2010
Total
$95,629,246
3,704,483
Neither
past due
nor
impaired
$79,551,182
2,236,409
<30 days
$6,020,051
666,051
1,859,984
657,849
–
–
–
707,172
333,154
250,293
72,911
78,186
2,000,000
78,186
2,000,000
–
–
549,923
1,094,720
$105,623,714
Noncurrent receivables
$184,179
Miscellaneousdeposits
$1,467,268
549,923
174,530
$85,581,233
$184,179
$1,467,268
–
841,477
$7,777,872
$–
$–
Trade
Nontrade
Receivable from
insurance
Receivable from
employees
Due from related
parties
Short-terminvestments
Receivable from
meralco
Others
Past due but not impaired
30-60 days
60-90 days 90-120 days
$110,700
$286,846
$46,820
753,709
–
–
>120 days
$9,497,560
–
Specifically
Impaired
$116,087
48,314
–
–
1,202,135
12,191
30,291
8,332
–
–
–
–
–
–
–
–
–
–
–
–
52,281
$989,601
$–
$–
–
22,191
$321,228
$–
$–
–
–
$77,111
$–
$–
–
4,241
$9,510,133
$–
$–
–
–
$1,366,536
$–
$–
The following table summarizes the credit quality of the Group’s financial assets as of
December 31, 2011 and 2010:
2011
Cash and cash equivalents
Loans and receivables
Trade
Nontrade
Receivable from insurance
Receivable from employees
Due from related parties
Others
AFS financial assets
Noncurrent receivables
Miscellaneous deposits
Minimal
Risk
$53,965,197
96,874,571
2,126,197
–
967,651
211,103
–
414,348
213,577
1,498,225
$156,270,869
Neither Past Due nor Impaired
Average
Fairly
Risk
High Risk
$–
$–
6,484,107
–
–
–
–
–
–
–
–
$6,484,107
1,150,880
–
–
–
–
–
–
–
–
$1,150,880
High Risk
$–
Past Due or
Individually
Impaired
$–
1,469,838
–
–
–
–
–
–
–
–
$1,469,838
21,765,124 127,744,520
2,166,483
4,292,680
1,230,038
1,230,038
843,559
1,811,210
–
211,103
1,790,216
1,790,216
–
414,348
–
213,577
–
1,498,225
$27,795,420 $193,171,114
Total
$53,965,197
2010
Cash and cash equivalents
Loans and receivables
Trade
Nontrade
Short-term investments
Receivable from insurance
Receivable from employees
Due from related parties
Receivable from Meralco
Others
AFS financial assets
Noncurrent receivables
Miscellaneous deposits
Minimal
Risk
$38,021,376
54,682,891
2,236,409
2,000,000
657,849
333,154
78,186
549,923
174,530
382,527
184,179
1,467,268
$100,768,292
Neither Past Due nor Impaired
Average
Fairly
Risk
High Risk
$–
$–
20,951,727
–
–
–
–
–
–
–
–
–
–
$20,951,727
2,974,036
–
–
–
–
–
–
–
–
–
–
$2,974,036
High Risk
$–
942,528
–
–
–
–
–
–
–
–
–
–
$942,528
Past Due or
Individually
Impaired
$–
Total
$38,021,376
16,078,064
95,629,246
1,468,074
3,704,483
–
2,000,000
1,202,135
1,859,984
374,018
707,172
–
78,186
–
549,923
920,190
1,094,720
–
382,527
–
184,179
–
1,467,268
$20,042,481 $145,679,064
*SGVMC116496*
- 74 -
The Group classifies credit quality as follows:
Minimal Risk - credit can proceed with favorable credit terms; can offer term of 15 to maximum
of 45 days.
Average Risk - credit can proceed normally; can extend term of 15 to maximum of 30 days.
Fairly High Risk - credit could be extended under a confirmed and irrevocable Letters of Credit
and subject to semi-annual review for possible upgrade.
High Risk - transaction should be under advance payment or confirmed and irrevocable Stand-By
Letters of credit; subject to quarterly review for possible upgrade after one year.
Foreign currency risk
The Group’s foreign exchange risk results primarily from movements of the U.S. Dollar against
other currencies. As a result of significant operating expenses in Philippine Peso, the Group’s
consolidated statements of comprehensive income can be affected significantly by movements in
the U.S. Dollar versus the Philippine Peso. In 2011 and 2010, the Group entered into currency
forward contracts and structured currency options, respectively, to hedge its risks associated with
foreign currency fluctuations.
The Group also has transactional currency exposures. Such exposure arises from sales or
purchases denominated in other than the Group’s functional currency. Approximately 37% and
20% of the Group’s sales for the years ended December 31, 2011 and 2010, respectively, and 51%
and 31% of costs for the years ended December 31, 2011 and 2010, respectively, are denominated
in currencies other than the Group’s functional currency.
The Group manages its foreign exchange exposure risk by matching, as far as possible, receipts
and payments in each individual currency. Foreign currency is converted into the relevant
domestic currency as and when the management deems necessary. The unhedged exposure is
reviewed and monitored closely on an ongoing basis and management will consider to hedge any
material exposure where appropriate.
Information on the Group’s foreign currency-denominated monetary assets and liabilities and their
U.S. Dollar equivalent follows:
=)
Philippine Peso (P
Cash and cash equivalents
Loans and receivables
Miscellaneous deposits
Accounts payable and accrued expenses
Other current liabilities
Other Noncurrent liabilities
Net foreign currency-denominated
liabilities
2011
In U.S
In Philippine
Dollar
Peso
=
P138,586,115
$3,155,606
682,449
29,971,390
1,136,210
49,899,432
(18,685,121)
(820,602,594)
(345,891)
(15,190,659)
(2,227,069)
(97,807,142)
2010
In U.S.
In Philippine
Dollar
Peso
$6,229,646
P
=273,385,951
1,715,843
75,299,204
1,350,975
59,287,083
(19,518,736) (856,573,305)
(5,407,324) (237,298,620)
(P
=715,143,458)
($15,629,596) (P
=685,899,687)
($16,283,816)
–
–
*SGVMC116496*
- 75 -
Singapore Dollar (SGD)
Cash and cash equivalents
Loans and receivables
Accounts payable and accrued expenses
Other current liabilities
Loans payable
Net foreign currency-denominated
liabilities
2011
In U.S
In Singapore
Dollar
Dollar
$1,182,114
SGD1,534,256
–
–
(1,379,738)
(1,063,060)
(1,268,326)
(977,220)
(1,258,190)
(1,632,995)
2010
In Singapore
In U.S.
Dollar
Dollar
$–
SGD–
155,000
200,384
(826,133)
(1,068,025)
(981,034)
(1,268,281)
(1,301,359)
(1,682,397)
(SGD2,746,803)
($2,953,526) (SGD3,818,319)
($2,116,356)
Euro (€)
2011
In U.S. Dollar
$2,129,369
528,889
(161,531)
(6,470,000)
Cash and cash equivalents
Loans and receivables
Accounts payable and accrued expenses
Loans payable
Net foreign currency-denominated assets
(liabilities)
($3,973,273)
In Euro
€1,645,571
408,724
(124,831)
(5,000,000)
2010
In U.S. Dollar
$662,782
326,262
(439,873)
−
In Euro
€501,197
246,719
(332,632)
−
(€3,070,536)
$549,171
€415,284
Japanese Yen (¥)
Cash and cash equivalents
Loans and receivables
Miscellaneous deposits
Accounts payable and accrued expenses
Other current liabilities
Net foreign currency-denominated liabilities
2011
In U.S. Dollar In Japanese Yen
$318,454
¥24,801,744
1,770,996
137,928,015
30,712
2,391,931
(6,104,454)
(475,424,732)
(40,959)
(3,189,916)
($4,025,251) (¥313,492,958)
2010
In U.S. Dollar In Japanese Yen
$819,333
¥66,906,179
2,687,836
219,486,880
28,468
2,324,638
(6,434,075)
(525,402,184)
(16,424)
(1,341,175)
($2,914,862) (¥238,025,662)
Renminbi (RMB)
Cash and cash equivalents
Loans and receivables
Accounts payable and accrued
expenses
Other current liabilities
Net foreign currency-denominated
assets
2011
In U.S. Dollar
In Renminbi
$6,725,654 RMB42,513,614
43,024,337
271,961,674
(29,528,588)
(5,982)
(186,653,530)
(37,813)
$20,215,421 RMB127,783,945
2010
In U.S. Dollar
In Renminbi
$4,713,572 RMB31,209,508
38,570,596
255,383,674
(23,234,523)
−
(153,840,450)
−
$20,049,645 RMB132,752,732
Hong Kong Dollar (HKD)
2010
2011
Cash and cash equivalents
Loans and receivables
Accounts payable and accrued
expenses
Net foreign currency-denominated
asset (liabilities)
In U.S. Dollar
$43,089
517,213
(417,235)
$143,067
In Hong Kong
Dollar
HKD334,932
4,020,312
(3,243,178)
HKD1,112,066
In U.S. Dollar
$71,134
201,670
In Hong Kong
Dollar
HKD553,550
1,569,358
(789,914)
(6,146,953)
($517,110)
(HKD4,024,045)
*SGVMC116496*
- 76 -
British Pound (₤)
Loans and receivables – net
Accounts payable and accrued expenses
Net foreign currency-denominated
liabilities
2011
In U.S. Dollar
In UK Pound
₤480
$742
(151,974)
(98,346)
(₤97,866)
($151,232)
2010
In U.S. Dollar
$–
(3,610)
($3,610)
In UK Pound
₤–
(2,329)
(₤2,329)
Australian Dollar (AUD)
2010
2011
Cash and cash equivalents
Accounts payable and accrued expenses
Net foreign currency-denominated
liabilities
In U.S. Dollar
$–
–
In Australian
Dollar
AUD–
–
$–
AUD–
In Australian
Dollar
AUD450
(176,709)
In U.S. Dollar
$458
(179,748)
($179,290) (AUD176,259)
Thai Baht (THB)
Loans and receivables – net
Accounts payable and accrued expenses
Net foreign currency-denominated asset
(liabilities)
2011
In U.S. Dollar
In Thai Baht
$803
THB25,318
–
–
$803
THB25,318
2010
In U.S. Dollar
In Thai Baht
$–
THB–
(4,824)
(145,441)
($4,824)
(THB145,441)
Bulgarian Lev (BGN)
Cash and cash equivalents
Loans and receivables
Miscellaneous deposits
Accounts payable and accrued expenses
Other current liabilities
Loans payable
Long-term debt
Net foreign currency-denominated
liabilities
2011
In U.S
Dollar In Bulgarian Lev
$1,294,206
BGN1,897,190
11,438,379
16,767,637
127,921
187,520
(7,199,852)
(10,554,337)
(17,044,745)
(24,986,067)
(5,833,976)
(8,552,085)
(10,289,247)
(15,083,113)
($27,507,314) (BGN40,323,255)
2010
In U.S.
In Bulgarian
Dollar
Lev
$–
BGN–
–
–
–
–
–
–
–
–
–
–
–
–
$–
BGN–
Czech Koruna (CZK)
Cash and cash equivalents
Loans and receivables
Accounts payable and accrued expenses
Net foreign currency-denominated
liabilities
2011
In U.S
Dollar
$5,141
115,990
(123,385)
($2,254)
In Czech
Koruna
CZK98,956
2,232,727
(2,375,072)
2010
In U.S.
Dollar
$–
–
–
(CZK43,389)
$–
In Czech
Koruna
CZK–
–
–
CZK–
*SGVMC116496*
- 77 -
Mexican Peso (MXN)
Cash and cash equivalents
Loans and receivables
Accounts payable and accrued expenses
Other current liabilities
Loans payable
Long-term debt
Net foreign currency-denominated
liabilities
2011
In U.S
Dollar In Mexican Peso
$4,348
MXN60,917
75,890
1,063,330
(20,419,768)
(1,457,359)
(4,172,005)
(297,756)
(217,079)
(3,041,596)
(375,137)
(5,256,231)
2010
In Mexican
In U.S.
Dollar
Peso
$–
MXN–
–
–
–
–
–
–
–
–
–
–
$–
($2,267,093) (MXN31,765,353)
MXN–
Sensitivity analysis
The following tables demonstrate sensitivity to a reasonably possible change in the U.S. Dollar
exchange rate, with all other variables held constant, of the Group’s income before income tax
(due to changes in the fair value of monetary assets and liabilities) as of December 31, 2011 and
2010. The reasonably possible change was computed based on one year average historical
movement of exchange rates between the U.S Dollar and other currencies.
There is no other impact on the Group’s equity other than those already affecting income. The
increase in U.S. Dollar rate as against other currencies demonstrates weaker functional currency
while the decrease represents stronger U.S. Dollar value.
2011
Currency
PHP
SGD
EUR
JPY
RMB
HKD
GBP
THB
BGN
CZK
MXN
Increase/decrease
in U.S. Dollar rate
1%
-1%
1%
-1%
1%
-1%
1%
-1%
1%
-1%
1%
-1%
1%
-1%
1%
-1%
1%
-1%
2%
-2%
3%
-3%
Effect on profit
before tax
($190,082)
190,082
(21,486)
21,486
(35,631)
35,631
(21,248)
21,248
165,933
(165,933)
1,484
(1,484)
(1,518)
1,518
5
(5)
(289,656)
289,656
(45)
45
(63,408)
63,408
*SGVMC116496*
- 78 -
2010
Currency
PHP
SGD
EUR
JPY
RMB
HKD
GBP
AUD
THB
Increase/decrease
in U.S. Dollar rate
+2%
-2%
+2%
-2%
+3%
-3%
+3%
-3%
+1%
-1%
+1%
-1%
+2%
-2%
+4%
-4%
+1%
-1%
Effect on profit
before tax
($257,639)
257,639
(44,365)
44,365
15,496
(15,496)
(73,740)
73,740
253,450
(253,450)
(6,015)
6,015
(88)
88
(7,085)
7,085
(48)
48
Derivatives
In 2011 and 2010, the Parent Company entered into various short-term currency forwards with
an aggregate notional amount of $71.70 million and $59.00 million, respectively. As of
December 31, 2011 and 2010, the outstanding forward contracts have a net positive fair value of
$0.03 million and $0.48 million, respectively. Net fair value gains recognized in 2011, 2010 and
2009 amounted to $0.86 million, $2.08 million and $0.16 million, respectively.
As discussed in Note 2, the acquisition of PSi gave rise to a long equity call option and written
equity put option for the Parent Company. As of December 31, 2011 and 2010, the call option has
a positive value of $2.74 million and $1.21 million, respectively, while the put option has a zero
value and negative value of $3.83 million, respectively. Net fair value gain (loss) on the options
amounted to $5.36 million and ($0.21 million) in 2011 and 2010, respectively.
In 2008, the Parent Company entered into structured currency options. The weakening of the peso
during the second quarter of 2008 resulted in an unfavorable position on the Parent Company’s
derivative transactions. In May 2008, the BOD approved the unwinding of four major derivative
contracts and the Parent Company incurred unwinding cost amounting to $33.36 million. In 2010,
the outstanding liability on unwinding cost amounting to $2.30 million was condoned by the
counterparty. The gain from the condonation is included under “Miscellaneous income” in the
consolidated statement of comprehensive income.
*SGVMC116496*
- 79 -
Fair Value Changes on Derivatives
The net movements in fair value of the Group’s derivative instruments as of December 31, 2011
and 2010 follow:
2010
2011
Derivative assets
Balance at beginning of year
Net changes in fair value
Initial value of long call option
Fair value of settled instruments
Derivative liabilities
Balance at beginning of year
Initial value of written put option
Net changes in fair value
$1,693,121
2,420,806
–
(1,315,015)
$2,798,912
$–
1,890,536
1,403,991
(1,601,406)
$1,693,121
$3,832,474
–
(3,797,912)
$34,562
$–
3,816,484
15,990
$3,832,474
The net changes in fair value of currency forwards and options are recognized in the consolidated
statements of comprehensive income under “Foreign exchange gains (losses)” and “Miscellaneous
income”, respectively.
Capital management
The primary objective of the Group’s capital management is to ensure that it maintains a strong
credit rating and healthy capital ratios in order to support its business and maximize shareholder
value.
No changes were made in the objectives, policies and processes during the years ended
December 31, 2011 and 2010.
The Group is not subject to externally imposed capital requirements.
The Group monitors capital using a gearing ratio of debt to equity and net debt to equity. The
Group considers bank borrowings in the determination of debt, which consist of trust receipts and
loans payable and long-term debt. Net debt is equivalent to the total bank borrowings less cash
and cash equivalents.
Trust receipts and loans payable
Long-term debt
Total debt
Less cash and cash equivalents
Net debt
Equity attributable to equity holders of the
Parent Company
Debt to equity ratio
Net debt to equity ratio
2011
$39,008,811
40,000,000
79,008,811
(54,069,180)
24,939,631
$190,321,592
42%
13%
2010
$17,921,638
38,000,000
55,921,638
(38,134,743)
$17,786,895
$169,290,252
33%
11%
*SGVMC116496*
- 80 -
33. Contingencies
The Group has various contingent liabilities arising in the ordinary conduct of business which are
either pending decision by the courts or being contested. The outcome of these cases is not
presently determinable.
In the opinion of management and its legal counsel, the eventual liability under these lawsuits or
claims, if any, will not have a material or adverse effect on the Group’s financial position and
results of operations. The information usually required by PAS 37 is not disclosed on the grounds
that it can be expected to prejudice the outcome of these lawsuits, claims and assessments.
34. Notes to Consolidated Statements of Cash Flows
The Group’s noncash investing activities includes capitalization by the Parent Company of office
equipment under finance lease amounting to $2.03 million and $0.58 million, in 2010 and 2009,
respectively.
35. Events after the Reporting Period
As mentioned in Note 14, IMI Singapore announced restructuring of operations in 2011 and
recognized provision for restructuring of $0.25 million as of December 31, 2011. IMI Singapore
paid out $0.18 million of this on February 14, 2012. The balance will be paid in phases within
2012.
*SGVMC116496*
EXHIBIT 2
Supplementary Schedules
Integrated Micro-Electronics, Inc. and Subsidiaries
Schedule A. Financial Assets
December 31, 2011
Name of issuing entity and
association of each issue
Valued based on market
Number of shares or principal Amount shown in the balance quotation at end of reporting
amount of bonds and notes
sheet
period
Income received and accrued
NOT APPLICABLE
Total
0
0
0
Integrated Micro-Electronics, Inc. and Subsidiaries
Schedule B. Amounts Receivable from Directors, Officers, Employees, Related Parties and Principal Stockholders (Other than Related Parties)
December 31, 2011
(in U.S. Dollars)
Name and designation of debtor
Receivables from Employees:
Various Officers and Employees*
Total
Balance at
beginning of
period
707,172
707,172
Additions
Amounts collected
Amounts written off
Current
Balance at end of
period
Not current
7,446,728.17
(6,342,690.48)
-
1,811,210*
-
1,811,210*
7,446,728
(6,342,690)
-
0
-
0
* Consist of receivables from approximately more than 2,300 Officers and Employees.
Integrated Microelectronics, Inc. and Subsidiaries
Schedule C. Amounts Receivable from Related Parties which are Eliminated during the Consolidation of Financial Statements
December 31, 2011
(in U.S. Dollars)
Name and designation of debtor
Balance at beginning
of period
Additions
Amounts
collected
Accounts receivable -trade
Speedy-Tech Electronics
PSi Technologies Laguna, Inc.
PSi Technologies Inc.
IMI Japan
Accounts receivable -nontrade
Speedy-Tech Electronics Ltd.
IMI International (Singapore) Pte Ltd.
Vista Manufaturing Pte. Ltd.
IMI Japan Inc.
Speedy-Tech (Philippines) Inc.
Shenzhen Speedy -Tech Elec. Co.
Speedy-Tech Electronics (Jiaxing)
Speedy-Tech Electronics (HK) Ltd.
Speedy-Tech Electronics (Chong Qing)
PSI Technologies, Inc.
IMI USA
IMI International ROHQ
EPIQ CZ s.r.o.
Cooperatief IMI Europe U.A.
EPIQ MX, S.A.P.I de C.V.
IMI France
427
177,308
2,278
6,650
13,910
20,611,533
1,006,080
18,145
2,046,846
241,262
287,649
93,320
26,341
78
251,724
5,064,248
-
219,496
3,708
29,061
105,012
122,538
88,622
3,816
50,702
501,358
14,191
4,004,932
152,989
1,724
5,064,248
-
Total
29,824,962
5,319,264
6,314,868
These related party receivables are collectible on demand.
Amounts written
off
Current
Balance at end of
period
Not current
2,705
6,650
13,910
-
2,705
6,650
13,910
-
-
20,831,029
1,009,788
18,145
975,258
270,323
392,661
215,858
26,341
78
88,622
253,816
50,702
501,358
14,191
4,004,932
152,989
20,831,029
1,009,788
18,145
975,258
270,323
392,661
215,858
26,341
78
88,622
253,816
50,702
501,358
14,191
4,004,932
152,989
-
28,829,358
177,308
1,071,587
-
28,829,358
Integrated Micro-Electronics, Inc. and Subsidiaries
Schedule D. Intangible Assets
December 31, 2011
(in U.S. Dollars)
Description
Customer relationships
Unpatented technology
Computer software
Beginning
balance
923,002
923,002
Additions at cost
411,344
411,344
Charged to cost
and expenses
Charged to other
accounts
(563,885)
(600,084)
(1,163,969)
Other changes
additions
(deductions)
6,766,617
-
-
396,497
7,163,114
Ending balance
Remarks
6,202,732 Other changes represent acquisition through business combination
Other changes represent acquisition through business combination and
1,130,759 foreign currency exchange difference
7,333,491
Integrated Micro-Electronics, Inc. and Subsidiaries
Schedule E. Long-Term Debt
December 31, 2011
(in U.S. Dollars)
Title of Issue and type of obligation
Amount authorized by
indenture
Amount shown under
caption "Current portion
Amount shown under caption "Long-term debt" in related balance
of long-term debt" in
sheet
related balance sheet
5-year clean loan (Parent Company)
40,000,000
-
40,000,000
principal payable in October 2016; interest payable and repriced
quarterly at the rate of 3-month LIBOR plus margin of 0.80%
Deferred payment to EPIQ NV (Cooperatief)
20,398,500
-
20,398,500
Total
60,398,500
periodic payment of $2,863,200 for the first 5 years from 2013 to 2017
and $6,082,500 in 2018; subject to interest rate of 1.5999% plus 1.5%
60,398,500
Integrated Micro-Electronics, Inc. and Subsidiaries
Schedule F. Indebtedness to Related Parties
December 31, 2011
(in U.S. Dollars)
Indebtedness to Related Parties (Long-term Loans from Related Companies)
Balance at Beginning of
Name of Related Party
Period
NOT APPLICABLE
Balance at End of Period
Related party payables eliminated during consolidation:
Name of Related Party
Balance at Beginning of
Period
Balance at End of Period
Trade payables
IMI USA, Inc.
IMI Singapore
Speedy-Tech Electronics (HK) Ltd.
Speedy-Tech Electronics (Jiaxing)
Speedy-Tech (Philippines) Inc.
Nontrade payables
IMI USA, Inc.
IMI Singapore
Speedy-Tech (Philippines) Inc.
Speedy-Tech Electronics (HK) Ltd.
IMI Japan
Vista Manufaturing Pte. Ltd.
Speedy-Tech Electronics (Jiaxing)
Speedy-Tech Electronics (Shenzen)
IMI International ROHQ
PSi Technologies, Inc.
20,292
506
-
51,149
45,956
14,213
43,430
6,632
893,305
262,032
26,341
1,415,794
1,962
72,876
372,040
5,396,999
832,537
1,152,933
1,669
464,520
12,128
171,417
1,962
61,264
1,034,512
520,141
546,135
Total
9,294,685
4,128,058
These related party liabilities are payable on demand.
Integrated Micro-Electronics, Inc. and Subsidiaries
Schedule G. Guarantees of Securities of Other Issuers
December 31, 2011
(in U.S. Dollars)
Name of issuing entity of
securities guaranteed by the
company for which this
statement is filed
Title of issue of each class of Total amount guaranteed
securities guaranteed
and outstanding
Amount owned by
person for which
this statement if
filed
Nature of
Guarantee
NOT APPLICABLE
Total
0
0
0
Integrated Micro-Electronics, Inc. and Subsidiaries
Schedule H. Capital Stock
December 31, 2011
Title of Issue
Number of Shares
Authorized
Number of shares
Number of shares issued and reserved for options,
outstanding at shown under warrants, conversion
related balance sheet caption
and other rights
Common Stocks
Less: Treasury Shares
Common shares
2,250,000,000
2,250,000,000
1,354,230,740
(15,892,109)
1,338,338,631
Preferred Shares
1,500,000,000
1,300,000,000
150,000,000
Number of shares
held by related
parties
Directors, officers
and employees
97,554,868
1,343,400
Others
INTEGRATED MICRO-ELECTRONICS, INC. AND SUBSIDIARIES
SUPPLEMENTARY SCHEDULE OF RETAINED EARNINGS
AVAILABLE FOR DIVIDEND DECLARATION
DECEMBER 31, 2011
Unappropriated retained earnings, as adjusted to
available for dividend distribution, beginning
($2,290,113)
Add: Net income actually earned/realized
during the period
Net income during the period closed to retained earnings
Less: Non- actual/unrealized income net of tax
Equity in net income of associate/joint venture
Unrealized foreign exchange gain - net (except those
attributable to cash and cash equivalents)
Unrealized actuarial gain
Fair value adjustment (M2M)
Fair value adjustment in investment property resulting
to gain
Adjustment due to deviation from PFRS/GAAP – gain
Accretion of Meralco receivable
Other unrealized gains or adjustments to the retained
earnings as a result of certain transactions
accounted for under the PFRS
Sub-total
Add: Non-actual losses
Depreciation on revaluation increment (after tax)
Adjustment due to deviation from PFRS/GAAP - loss
Unrealized foreign exchange loss
Loss on fair value adjustment of investment property
(after tax)
Net income actually earned during the period
Add (less):
Dividend declarations during the period
Appropriations of retained earnings during the period
Reversals of appropriations
Effects of prior period adjustments
Treasury shares
(9,900,934)
−
−
−
(981,647)
(5,355,873)
−
−
(15,671)
−
(16,254,125)
−
−
−
(16,254,125)
(6,345,647)
30,000,000
(1,012,585)
22,641,768
TOTAL RETAINED EARNINGS AVAILABLE FOR
DIVIDEND DECLARATION, END
$4,097,530
INTEGRATED MICRO-ELECTRONICS, INC. AND SUBSIDIARIES
FINANCIAL RATIOS
DECEMBER 31, 2011 AND 2010
Ratios
(i) Current ratio
(ii) Debt/Equity ratio
(iii) Asset to Equity ratio
(iv) Interest rate coverage ratio
(v) Profitability ratios
GP margin
Net profit margin
EBITDA margin
Return on assets
Return on equity
Formula
Current assets /
Current Liabilities
Bank debts / Equity
attributable to parent
Total Assets / Equity
attributable to parent
EBIT / Interest
Expense
Gross Profit /
Revenues
Net Income after Tax /
Revenues
EBITDA / Revenues
Net Income after Tax /
Total Asset
Net Income after Tax /
Average equity
attributable to parent
Current Assets
Current Liabilities
Bank Debts
Equity attributable to parent
Total Assets
EBIT
Interest expense
Gross Profit
Revenues
Net Income after Tax
EBITDA
Average equity attributable to parent
As of December 31, As of December 31,
2011
2010
1.51
1.23
0.42
0.33
2.34
2.00
2.54
8.30
7%
11%
1%
1%
4%
7%
1%
1%
2%
3%
2011
2010
279,801,274
184,972,117
79,008,811
190,321,592
444,692,294
5,945,599
2,344,807
38,177,534
575,453,908
3,289,314
20,308,771
179,805,922
201,287,469
163,206,702
55,921,638
169,290,252
339,083,108
7,822,169
942,202
44,474,592
412,326,605
4,738,929
30,241,779
167,990,127
INTEGRATED MICRO-ELECTRONICS. AND SUBSIDIARIES
MAP SHOWING THE RELATIONSHIPS BETWEEN AND AMONG THE COMPANIES IN
THE GROUP, ITS ULTIMATE PARENT COMPANY AND CO-SUBSIDIARIES
Mitsubishi
Corporation.
Mermac, Inc.
52.61%
Others
52.61%
10.93%
Ayala
Corporation
100%
100%
Ayala Aviation
Corp.
Ayala Automotive
Holdings Corp.
53.2%
Ayala Land, Inc.
53.2%
AC Int’l Finance
Ltd.
50%
50%
100%
AG Counselors
Corp.
100%
MPM Noodles
Corp.
100%
Michigan Holdings
Inc.
100%
100%
AC Energy Holdings
Inc.
100%
100%
Ayala Hotels, Inc.
76.6%
Azalea Tech Inv
Inc.
Azalea Int’l
Venture Prop
100%
100%
100%
AYC Finance Ltd.
Bestfull Holdings
Ltd.
Darong Agri Dev
Corp.
100%
100%
Leviet Solutions
Inc.
Philwater Holdings
Inc.
100%
78.8%
Purefoods Int’l Ltd.
Technopark Land
Inc.
45.45%
33.3%
Ayala DBS Holdings
Inc.
First Gen Northern
26.6%
16.4%
Mla. Water Co Inc.
43.1%
100%
Water Capital
Works Inc.
2.07%
21.8%
60%
21.3%
Bank of the Phil.
Islands 33.5%
30.46%
20%
40%
BPI Globe Banko
Inc. 45.6%
40%
Globe Telecom Inc.
30.46%
Legend:
% of ownership appearing on top of the box – direct % of ownership
% of ownership appearing inside the box – effective % of ownership
Asiacom Phils. Inc.
AC Int’l Finance Ltd.
100%
AYC Holdings Ltd.
Others
67.3%
32.7%
Integrated Micro-Electronics, Inc.
100%
100%
100%
IMI
International
(Singapore) Pte.
Ltd.
55.78%
PSI
Technologies,
Inc.
IMI Japan
IMI USA
100%
100%
100%
Speedy-Tech Electronics
IMI International
Regional Operating
Headquarter (“IMI
ROHQ”)
100%
Monarch Elite Ltd.
40%
PSiTech Realty,
Inc.22.31%
60%
100%
100%
100%
Speedy-Tech
Electronics (HK) Limited
(“STHK”)
Speedy-Tech
Technologies Pte. Ltd.
(“STTS”)
PSi Laguna
55.78%
40%
Cooperatief IMI
Europe U.A.
Pacsem Realty,
Inc. 35.70%
100%
IMI France SAS
100%
100%
99.48%
Speedy-Tech
(Philippines), Inc.
(“STPHIL”)
Shenzhen Speedy-Tech
Electronics Co., Ltd.
(“SZSTE”)
Speedy-Tech
Electronics, Inc.
100%
Speedy-Tech
Electronics (Jiaxing) Co.
Ltd. (“STJX”)
100%
Speedy-Tech
Electronics (Chong
Qing) Co. Ltd. (“STCQ”)
100%
IMI (Chengdu) Ltd.
100%
100%
100%
EPIQ Electronic
Assembly EOOD
70%
Microenergia
EOOD
EPIQ CZ s.r.o
EPIQ MX,
S.A.P.I. de C.V.
100%
EPIQ
Manufactura
S.A.P.I. de C.V.
INTEGRATED MICRO-ELECTRONICS, INC. AND SUBSIDIARIES
SCHEDULE OF ALL PHILIPPINE FINANCIAL REPORTING STANDARDS (PFRSs)
[WHICH CONSISTS OF PFRSs, PHILIPPINE ACCOUNTING STANDARDS (PASs) AND
PHILIPPINE INTERPRETATIONS] EFFECTIVE AS OF DECEMBER 31, 2011
PFRSs and PIC Q&As
PFRS 1, First-time Adoption of Philippine Financial
Reporting Standards
PFRS 2, Share-based Payment
PFRS 3, Business Combinations
PFRS 4, Insurance Contracts
PFRS 5, Non-current Assets Held for Sale and
Discontinued Operations
PFRS 6, Exploration for and Evaluation of Mineral
Resources
PFRS 7, Financial Instruments: Disclosures
PFRS 8, Operating Segments
PAS 1, Presentation of Financial Statements
PAS 2, Inventories
PAS 7, Statement of Cash Flows
PAS 8, Accounting Policies, Changes in Accounting
Estimates and Errors
PAS 10, Events after the Reporting Period
PAS 11, Construction Contracts
PAS 12, Income Taxes
PAS 16, Property, Plant and Equipment
PAS 17, Leases
PAS 18, Revenue
PAS 19, Employee Benefits
PAS 20, Accounting for Government Grants and
Disclosure of Government Assistance
PAS 21, The Effects of Changes in Foreign Exchange
Rates
PAS 23, Borrowing Costs
PAS 24, Related Party Disclosures
PAS 26, Accounting and Reporting by Retirement
Benefit Plans
PAS 27, Consolidated and Separate Financial
Statements
PAS 28, Investments in Associates
PAS 29, Financial Reporting in Hyperinflationary
Economies
PAS 31, Interests in Joint Ventures
PAS 32, Financial Instruments: Presentation
PAS 33, Earnings per Share
PAS 34, Interim Financial Reporting
PAS 36, Impairment of Assets
PAS 37, Provisions, Contingent Liabilities and
Contingent Assets
PAS 38, Intangible Assets
PAS 39, Financial Instruments: Recognition and
Measurement
Adopted/Not adopted/Not applicable
Adopted
Adopted
Adopted
Not applicable
Not applicable
Not applicable
Adopted
Adopted
Adopted
Adopted
Adopted
Adopted
Adopted
Not applicable
Adopted
Adopted
Adopted
Adopted
Adopted
Not applicable
Adopted
Adopted
Adopted
Adopted
Adopted
Not applicable
Not applicable
Not applicable
Adopted
Adopted
Not applicable
Adopted
Adopted
Adopted
Adopted
PFRSs and PIC Q&As
PAS 40, Investment Property
PAS 41, Agriculture
Philippine Interpretation IFRIC–1, Changes in Existing
Decommissioning, Restoration and Similar Liabilities
Philippine Interpretation IFRIC–2, Members' Shares in
Co-operative Entities and Similar Instruments
Philippine Interpretation IFRIC–4, Determining whether
an Arrangement contains a Lease
Philippine Interpretation IFRIC–5, Rights to Interests
arising from Decommissioning, Restoration and
Environmental Rehabilitation Funds
Philippine Interpretation IFRIC–6, Liabilities arising
from Participating in a Specific Market - Waste
Electrical and Electronic Equipment
Philippine Interpretation IFRIC–7, Applying the
Restatement Approach under PAS 29 Financial
Reporting in Hyperinflationary Economies
Philippine Interpretation IFRIC–9, Reassessment of
Embedded Derivatives
Philippine Interpretation IFRIC–10, Interim Financial
Reporting and Impairment
Philippine Interpretation IFRIC–12, Service Concession
Arrangements
Philippine Interpretation IFRIC–13, Customer Loyalty
Programmes
Philippine Interpretation IFRIC–14, PAS 19 - The Limit
on a Defined Benefit Asset, Minimum Funding
Requirements and their Interaction
Philippine Interpretation IFRIC–16, Hedges of a Net
Investment in a Foreign Operation
Philippine Interpretation IFRIC–17, Distributions of
Non-cash Assets to Owners
Philippine Interpretation IFRIC–18, Transfers of Assets
from Customers
Philippine Interpretation IFRIC–19, Extinguishing
Financial Liabilities with Equity Instruments
Philippine Interpretation SIC–7, Introduction of the Euro
Philippine Interpretation SIC–10, Government
Assistance - No Specific Relation to Operating Activities
Philippine Interpretation SIC–12, Consolidation Special Purpose Entities
Philippine Interpretation SIC–13, Jointly Controlled
Entities - Non-Monetary Contributions by Venturers
Philippine Interpretation SIC–15, Operating Leases –
Incentives
Philippine Interpretation SIC–21, Income Taxes Recovery of Revalued Non-Depreciable Assets
Philippine Interpretation SIC–25, Income Taxes Changes in the Tax Status of an Entity or its
Shareholders
Philippine Interpretation SIC–27, Evaluating the
Substance of Transactions Involving the Legal Form of a
Lease
Adopted/Not adopted/Not applicable
Not applicable
Not applicable
Not applicable
Not applicable
Adopted
Not applicable
Not applicable
Not applicable
Adopted
Not applicable
Not applicable
Not applicable
Adopted
Not applicable
Not applicable
Not applicable
Adopted
Not applicable
Not applicable
Not applicable
Not applicable
Not applicable
Not applicable
Not applicable
Not Applicable
PFRSs and PIC Q&As
Philippine Interpretation SIC–29, Service Concession
Arrangements: Disclosures
Philippine Interpretation SIC–31, Revenue - Barter
Transactions Involving Advertising Services
Philippine Interpretation SIC–32, Intangible Assets Web Site Costs
PIC Q&A No. 2006-01: PAS 18, Appendix, paragraph 9
– Revenue recognition for sales of property units under
pre-completion contracts
PIC Q&A No. 2006-02: PAS 27.10(d) – Clarification of
criteria for exemption from presenting consolidated
financial statements
PIC Q&A No. 2007-03: PAS 40.27 – Valuation of bank
real and other properties acquired (ROPA)
PIC Q&A No. 2008-01 (Revised): PAS 19.78 – Rate
used in discounting post-employment benefit obligations
PIC Q&A No. 2008-02: PAS 20.43 – Accounting for
government loans with low interest rates under the
amendments to PAS 20
PIC Q&A No. 2009-01: Framework.23 and PAS 1.23 –
Financial statements prepared on a basis other than
going concern
PIC Q&A No. 2010-01: PAS 39.AG71-72 – Rate used
in determining the fair value of government securities in
the Philippines
PIC Q&A No. 2010-02: PAS 1R.16 – Basis of
preparation of financial statements
PIC Q&A No. 2011-01: PAS 1.10(f) – Requirements
for a Third Statement of Financial Position
Adopted/Not adopted/Not applicable
Not Applicable
Not Applicable
Not Applicable
Not Applicable
Not Applicable
Not Applicable
Adopted
Adopted
Not Applicable
Adopted
Adopted
Not Applicable
Important: If an entity has early adopted any of the following pronouncements, please take note of
the: (1) additional disclosures the entity has to make for the early adoption of the said pronouncements
and (2) the existing pronouncements that the entity may have to mark as “Not applicable”:
Applicable to annual
period beginning on
or after
Early
application
allowed
Remarks
July 1, 2011
Yes
To be adopted when
effective
January 1, 2013
Not mentioned
To be adopted when
effective
PFRS 9, Financial Instruments
January 1, 2015
Yes
To be adopted when
effective
PFRS 10, Consolidated Financial
Statements
January 1, 2013
Yes
To be adopted when
effective
PFRS 11, Joint Arrangements
January 1, 2013
Yes
PFRS 12, Disclosure of Interests in
Other Entities
January 1, 2013
Yes
Pronouncements issued but not
yet effective
Amendments to PFRS 7:
Disclosures—Transfers of
Financial Assets
Amendments to PFRS 7:
Disclosures—Offsetting Financial
Assets and Financial Liabilities
To be adopted when
effective
To be adopted when
effective
Pronouncements issued but not
yet effective
Applicable to annual
period beginning on
or after
Early
application
allowed
Remarks
PFRS 13, Fair Value Measurement
January 1, 2013
Yes
To be adopted when
effective
July 1, 2012
Yes
To be adopted when
effective
January 1, 2012
Yes
To be adopted when
effective
January 1, 2013
Yes
January 1, 2013
Yes
January 1, 2013
Yes
January 1, 2014
Yes
To be adopted when
effective
Deferred by SEC and
FRSC
No
To be adopted when
effective
January 1, 2013
Yes
To be adopted when
effective
January 1, 2012
Yes
To be adopted when
effective
January 1, 2012
Yes
To be adopted when
effective
January 1, 2012
Yes
To be adopted when
effective
January 25, 2012
Not mentioned
To be adopted when
effective
Amendments to PAS 1:
Presentation of Items of Other
Comprehensive Income
Amendments to PAS 12–Deferred
Tax: Recovery of Underlying
Assets
PAS 19, Employee Benefits
(Revised)
PAS 27, Separate Financial
Statements
PAS 28, Investments in Associates
and Joint Ventures
Amendments to PAS 32, Offsetting
Financial Assets and Financial
Liabilities
Philippine Interpretation IFRIC–
15, Agreements for the
Construction of Real Estate
Philippine Interpretation IFRIC–
20, Stripping Costs in the
Production Phase of a Surface
Mine
PIC Q&A No. 2011-02: PFRS 3.2
– Common Control Business
Combinations
PIC Q&A No. 2011-03:
Accounting for Inter-company
Loans
PIC Q&A No. 2011-04: PAS
32.37-38 – Costs of Public
Offering of Shares
PIC Q&A No. 2011-05: PFRS
1.D1-D8 – Fair Value or
Revaluation as Deemed Cost
To be adopted when
effective
To be adopted when
effective
To be adopted when
effective
EXHIBIT 3
2011 Audited Annual Financial Statements,
IMI International (Singapore) Pte Ltd and subsidiaries
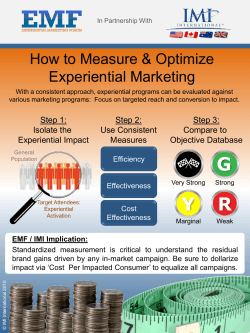


© Copyright 2026