
Document 252524
COVER SHEET
3
A
Y A
R
I
L
A
C O R P
O R A
T
I
O N
4
A N D
2
1
8
S
U B S
T
R
I
I
T
Y
I
D
I
A
A N G L
E
E S
(Company's Full Name)
3
4
/
F
A
Y A
L
T
A
O W E R
O N
A V
E
E N U
E
,
,
A
Y A
M A K A
T
L
A
I
C
(Business Address: No. Street City / Tow n / Province)
0
3
3
Victoria D. Frejas
908-3429
Contact Person
Company Telephone Number
1
1
7
-
Q
Month
Day
Fiscal Year
Month
Day
Annual Meeting
Secondary License Type, if Applicable
C
F
D
Dept. Requiring this Doc.
Amended Articles Number/Section
Total Amount of Borrow ings
6
9
9
7
Total No. Of Stockholders
Domestic
Foreign
To be accomplished by SEC Personnel concerned
File Number
LCU
Document I.D.
Cashier
S TA M P S
Remarks = pls. Use black ink for scanning purposes
1
SEC No. 34218
File No. _____
AYALA CORPORATION
(Company’s Full Name)
34/F Tower One, Ayala Triangle
Ayala Avenue, Makati City
(Company’s Address)
908-3000
(Telephone Number)
March 31, 2014
(Quarter Ending)
(Month & Day)
SEC Form 17- Q Quarterly Report
(Form Type)
2
TABLE OF CONTENTS
PART I
FINANCIAL INFORMATION
Item 1
Financial Statements
Item 2
PART II
SIGNATURES
Consolidated Statements of Financial Position
As of March 31, 2014 (Unaudited) and December 31, 2013 (Audited)
6
Unaudited Consolidated Statements of Income
For the Periods Ended March 31, 2014 and 2013
7
Unaudited Consolidated Statements of Comprehensive Income
For the Periods Ended March 31, 2014 and 2013
8
Unaudited Consolidated Statements of Changes in Equity
For the Periods Ended March 31, 2014 and 2013
9
Unaudited Consolidated Statements of Cash Flows
For the Periods Ended March 31, 2014 and 2013
10
Notes to Unaudited Consolidated Financial Statements
11
Management’s Discussion and Analysis of
Financial Condition and Results of Operations
36
OTHER INFORMATION
44
48
4
PART I
FINANCIAL INFORMATION
Item 1
Financial Statements
5
AYALA CORPORATION AND SUBSIDIARIES
CONSOLIDATED STATEMENTS OF FINANCIAL POSITION
(Amounts in Thousand Pesos)
March 31, 2014
Unaudited
ASSETS
Current Assets
Cash and cash equivalents (Note 4)
Short-term investments (Note 5)
Accounts and notes receivable (Note 6)
Inventories (Note 7)
Other current assets (Note 8)
Total Current Assets
Noncurrent asset held for sale
Noncurrent Assets
Noncurrent accounts and notes receivable (Note 6)
Investment in bonds and other securities (Note 11)
Land and improvements (Note 9)
Investments in associates and joint ventures (Note 10)
Investment properties (Note 12)
Property, plant and equipment
Service concession assets (Note 13)
Intangible assets
Deferred tax assets - net
Pension and other noncurrent assets
Total Noncurrent Assets
Total Assets
December 31, 2013
Audited
68,695,058
8,587,498
58,953,037
51,967,984
38,128,805
226,332,382
226,332,382
65,655,049
119,345
56,341,044
50,178,486
39,194,020
211,487,944
3,328,712
214,816,656
18,334,221
11,849,579
67,219,157
134,033,935
64,193,826
26,948,865
74,148,526
4,180,832
6,854,340
12,864,482
420,627,763
646,960,145
18,282,941
2,784,807
62,474,802
119,804,086
63,157,223
25,883,469
73,754,407
4,175,846
6,513,585
8,016,478
384,847,644
599,664,300
LIABILITIES AND EQUITY
Current Liabilities
Accounts payable and accrued expenses (Note 14)
Short-term debt (Note 16)
Income tax payable
Current portion of:
Long-term debt (Note 16)
Service concession obligation
Other current liabilities (Note 15)
Total Current Liabilities
119,606,884
19,833,552
2,370,071
103,604,247
15,811,285
1,667,543
12,003,010
1,274,811
6,914,044
162,002,372
11,842,519
1,290,406
10,991,693
145,207,693
Noncurrent Liabilities
Long-term debt - net of current portion (Note 16)
Service concession obligation - net of current portion
Deferred tax liabilities - net
Pension liabilities - net
Other noncurrent liabilities (Note 15)
Total Noncurrent Liabilities
Total Liabilities
205,163,242
7,877,265
6,009,986
1,050,323
21,798,955
241,899,771
403,902,143
178,027,343
7,868,295
6,347,400
1,915,040
24,827,938
218,986,016
364,193,709
50,229,112
461,167
(1,317,954)
(450,777)
(260,209)
7,431,169
98,111,215
(5,000,000)
149,203,723
93,854,279
243,058,002
646,960,145
50,166,129
485,187
(1,317,954)
277,848
(1,256,831)
7,482,121
92,639,781
(5,000,000)
143,476,281
91,994,310
235,470,591
599,664,300
Equity
Equity attributable to owners of the parent
Paid-in capital (Note 17)
Share-based payments
Remeasurement gains/(losses) on defined benefit plans
Net unrealized gain (loss) on available-for-sale financial assets
Cumulative translation adjustments
Equity reserve
Retained earnings (Note 17)
Treasury stock
Non-controlling interests
Total Equity
Total Liabilities and Equity
See accompanying Notes to Unaudited Consolidated Financial Statements.
6
AYALA CORPORATION AND SUBSIDIARIES
CONSOLIDATED STATEMENTS OF INCOME
(Amounts in Thousand Pesos, except earnings per share)
March 2014
Unaudited
INCOME
Sale of goods
Rendering of services
Share of profit of associates and joint ventures
Interest income
Other income
COSTS AND EXPENSES
Costs of sales
Costs of rendering services
General and administrative
Interest and other financing charges
Other charges
INCOME BEFORE INCOME TAX
March 2013
Unaudited
24,206,390
12,926,990
3,145,714
1,399,332
2,996,701
44,675,127
21,243,363
10,645,873
3,913,249
807,452
1,455,352
38,065,289
18,650,410
8,306,911
3,763,314
2,879,455
615,919
34,216,009
16,574,373
6,220,854
3,108,859
2,444,848
1,082,913
29,431,847
10,459,118
8,633,442
PROVISION FOR INCOME TAX
Current
Deferred
NET INCOME
Net Income Attributable to:
Owners of the parent
Non-controlling interests
EARNINGS PER SHARE (Note 18)
Basic
Diluted
1,975,564
(189,080)
1,786,484
1,728,848
(20,910)
1,707,938
8,672,634
6,925,504
5,471,434
3,201,200
8,672,634
4,506,815
2,418,689
6,925,504
9.35
9.30
7.37
7.30
See accompanying Notes to Unaudited Consolidated Financial Statements.
7
AYALA CORPORATION AND SUBSIDIARIES
CONSOLIDATED STATEMENTS OF COMPREHENSIVE INCOME
(Amounts in Thousand Pesos)
NET INCOME
March 2014
March 2013
Unaudited
Unaudited
8,672,634
6,925,504
OTHER COMPREHENSIVE INCOME (LOSS)
Other comprehensive income that may be reclassified
to profit or loss in subsequent periods:
Exchange differences arising from translations of foreign investments
Changes in fair values of available-for-sale financial assets
SHARE OF OTHER COMPREHENSIVE INCOME
OF ASSOCIATES AND JOINT VENTURES
Other comprehensive income that may be reclassified
to profit or loss in subsequent periods:
Exchange differences arising from translations of foreign investments
Changes in fair values of available-for-sale financial assets
TOTAL OTHER COMPREHENSIVE INCOME (LOSS)
TOTAL COMPREHENSIVE INCOME
Total Comprehensive Income Attributable to:
Owners of the parent
Non-controlling interests
1,165,981
59,550
1,225,532
12,806
(801,462)
(788,656)
(407,606)
(176,770)
(584,376)
(27,435)
413,072
385,637
436,876
9,109,510
(198,739)
6,726,765
5,739,430
3,370,080
9,109,510
4,359,958
2,366,807
6,726,765
See accompanying Notes to Unaudited Consolidated Financial Statements.
Note: Actuarial valuation on retirement fund is done annually and impact is reflected in the audited year-end
financial statements of the AC Group.
8
AYALA CORPORATION AND SUBSIDIARIES
UNAUDITED CONSOLIDATED STATEMENTS OF CHANGES IN EQUITY
(Amounts in Thousand Pesos)
EQUITY ATTRIBUTABLE TO OWNERS OF THE PARENT
Other Comprehensive Income
Paid-in
Capital
As at January 1, 2014
Net Income
Other comprehensive income (loss)
Total comprehensive income (loss)
Issuance of shares
Cost of share-based payments
Change in non-controlling interests
At March 31, 2014 (Unaudited)
50,166,129
62,983
50,229,112
Net Unrealized
Remeasurement gain (loss) on
gains/(losses) on Available-forShare-based defined benefit Sale Financial
Assets
plans
Payments
485,187
(24,020)
461,167
(1,317,954)
(1,317,954)
277,848
(728,625)
(728,625)
(450,777)
Cumulative
Translation
Adjustments
(1,256,831)
996,622
996,622
(260,209)
Equity
Reserve
7,482,121
(50,952)
7,431,169
Retained
Earnings
92,639,781
5,471,434
5,471,434
98,111,215
Parent
Company
Preferred
Shares Held
by
Subsidiaries
-
Treasury
Stock
(5,000,000)
(5,000,000)
Noncontrolling
Interests
91,994,310
3,201,200
168,880
3,370,080
(1,510,110)
93,854,279
Total Equity
235,470,591
8,672,634
436,876
9,109,510
62,983
(24,020)
(1,561,062)
243,058,002
EQUITY ATTRIBUTABLE TO OWNERS OF THE PARENT
Other Comprehensive Income
Share-based
Paid-in Capital Payments
As at January 1, 2013, as restated
Net Income
Other comprehensive income (loss)
Total comprehensive income (loss)
Issuance of shares
Cost of share-based payments
Cash Dividends
Change in non-controlling interests
At March 31, 2013 (Unaudited Restated)
45,119,932
41,483
45,161,415
460,771
47,212
507,983
Net Unrealized
Remeasurement
gain (loss) on
gains/(losses) on
Available-for-Sale
defined benefit
Financial Assets
plans
(943,361)
(943,361)
1,798,964
1,231,259
1,231,259
3,030,223
Cumulative
Translation
Adjustments
(3,238,400)
(371,618)
(371,618)
(3,610,018)
Equity
Reserve
5,379,074
2,665,115
8,044,189
Retained
Earnings
83,268,077
4,506,815
115,113
4,621,928
(186)
87,889,819
Parent
Company
Preferred
Shares Held
by
Subsidiaries
(250,000)
(250,000)
Treasury
Stock
(7,497,344)
(7,497,344)
Noncontrolling
Interests
82,342,636
2,418,689
(51,882)
2,366,807
5,840,950
90,550,393
Total Equity
206,440,349
6,925,504
922,872
7,848,376
41,483
47,212
(186)
8,506,066
222,883,299
See accompanying Notes to Unaudited Consolidated Financial Statements.
9
AYALA CORPORATION AND SUBSIDIARIES
CONSOLIDATED STATEMENTS OF CASH FLOWS
(Amounts in Thousand Pesos)
March 31, 2014
Unaudited
CASH FLOWS FROM OPERATING ACTIVITIES
Income before income tax
Adjustments for:
Interest and other financing charges - net of amount capitalized
Depreciation and amortization
Cost of share-based payments
Provision for impairment losses
Gain on sale of other assets
Gain on sale of investments
Other investment income
Interest income
Share of profit of associates and joint ventures
Operating income before changes in working capital
Decrease (increase) in:
Accounts and notes receivable - trade
Inventories
Other current assets
Service concession asset
Increase (decrease) in:
Accounts payable and accrued expenses
Net pension liabilities
Other current liabilities
Net cash generated from operations
Interest received
Interest paid
Income tax paid
Net cash provided by (used in) operating activities
CASH FLOWS FROM INVESTING ACTIVITIES
Proceeds from sale/redemptions of investments in associates and joint venture
Disposals of:
Property, plant and equipment
Land and improvements
Maturities (placement) of short-term investments
Deduction in (additions to):
Investments in associates and joint ventures
Investments in bonds, securities and other noncurrent assets
Land and improvements
Accounts and notes receivable - non-trade
Property, plant and equipment
Investment properties
Dividends received from associates, joint ventures and AFS financial assets
Decrease (increase) in other noncurrent assets
Net cash used in investing activities
Marchr 31, 2013
Unaudited
10,459,118
8,633,442
2,879,455
2,151,005
(24,020)
48,639
(49,092)
(1,872,665)
(107,736)
(1,399,332)
(3,145,714)
8,939,658
2,444,848
2,145,664
10,406
333,172
34,043
(35,300)
(807,452)
(3,913,249)
8,845,574
(358,975)
(1,810,961)
(1,926,645)
(413,351)
(16,708,682)
(1,637,240)
(1,643,395)
611,764
19,927,856
(864,717)
1,233,020
24,725,885
1,368,752
(2,908,977)
(1,483,427)
21,702,233
11,157,090
(256,443)
3,104,624
3,473,292
629,508
(3,480,122)
(1,794,529)
(1,171,851)
6,503,708
84,488
(8,468,153)
7,846
925,191
286,503
(19,545,647)
(6,350,323)
(4,744,355)
(3,713,361)
(2,265,702)
(1,667,915)
3,015,519
(5,004,094)
(42,155,835)
(339,377)
1,588,472
(2,054,980)
1,381,226
(2,382,823)
(587,942)
37,497,181
62,010
973
(6,156,572)
(3,790,241)
(191,071)
7,219,072
4,117
74,173
(7,237,906)
(1,320,596)
(310,886)
(3,028,983)
(899,686)
23,493,611
5,092,407
5,548,396
9,068,777
3,040,009
7,308,984
CASH AND CASH EQUIVALENTS AT BEGINNING OF YEAR
65,655,049
81,777,015
CASH AND CASH EQUIVALENTS AT END OF PERIOD
68,695,058
89,085,999
CASH FLOWS FROM FINANCING ACTIVITIES
Proceeds from:
Short-term and long-term debt
Issuance of common and preferred shares
Collections of subscription receivable
Payment of short-term and long-term debt
Dividends paid
Service concession obligation paid
Increase (decrease) in:
Other noncurrent liabilities
Noncontrolling interest in consolidated subsidiaries
Net cash provided by financing activities
NET INCREASE (DECREASE) IN CASH AND CASH EQUIVALENTS
See accompanying Notes to Unaudited Consolidated Financial Statements.
10
AYALA CORPORATION AND SUBSIDIARIES
NOTES TO UNAUDITED CONSOLIDATED FINANCIAL STATEMENTS
1. Basis of Financial Statement Preparation
The accompanying unaudited condensed consolidated financial statements have been prepared
in accordance with Philippine Accounting Standard (PAS) 34, Interim Financial Reporting.
Accordingly, the unaudited condensed consolidated financial statements do not include all of the
information and disclosures required in the December 31, 2013 annual audited consolidated
financial statements, and should be read in conjunction with the Group’s annual consolidated
financial statements as of and for the year ended December 31, 2013.
The preparation of the financial statements in compliance with Philippine Financial Reporting
Standards (PFRS) requires management to make estimates and assumptions that affect the
amounts reported in the financial statements and accompanying notes. The estimates and
assumptions used in the accompanying unaudited condensed consolidated financial statements
are based upon management’s evaluation of relevant facts and circumstances as of the date of
the unaudited condensed consolidated financial statements. Actual results could differ from such
estimates.
The unaudited condensed consolidated financial statements include the accounts of Ayala
Corporation (herein referred to as “the Company”) and its subsidiaries collectively referred to as
“Group.”
The unaudited condensed consolidated financial statements are presented in Philippine Peso (P
= ),
and all values are rounded to the nearest thousand pesos (P
= 000) except when otherwise
indicated.
The unaudited financial statements and other parts of this entire SEC 17Q as of March 31, 2014
include other financial and operating data with respect to Ayala’s subsidiaries (Ayala Land, Inc.,
Integrated Micro-Electronics, Inc., and Manila Water Company, Inc.), associate (Bank of the
Philippine Islands) and joint venture (Globe Telecom, Inc.). This SEC 17Q should be read in
conjunction with the financial and operating highlights of these subsidiaries, associate and joint
venture as contained in their respective SEC17Q as of March 31, 2014.
On May 8, 2014, the Company’s Audit and Risk Committee approved and authorized the release
of the accompanying unaudited condensed financial statements of Ayala Corporation and
Subsidiaries.
2. Significant Accounting Policies
Changes in Accounting Policies
The accounting policies and methods of computations adopted in the preparation of the unaudited
condensed financial statements are consistent with those of the previous financial year.
Standards and interpretation issued but not yet effective
The Group will adopt the following new and amended Standards and Philippine Interpretations of
International Financial Reporting Interpretations Committee (IFRIC) enumerated below when
these become effective. Except as otherwise indicated, the Group does not expect the adoption
of these new and amended PFRS and Philippine Interpretations to have significant impact on the
consolidated financial statements.
Effective 2014
PAS 36, Impairment of Assets - Recoverable Amount Disclosures for Non-Financial Assets
(Amendments)
These amendments remove the unintended consequences of PFRS 13 on the disclosures
required under PAS 36. In addition, these amendments require disclosure of the recoverable
amounts for the assets or cash-generating units (CGUs) for which impairment loss has been
recognized or reversed during the period. These amendments are effective retrospectively for
annual periods beginning on or after January 1, 2014 with earlier application permitted, provided
PFRS 13 is also applied. The amendments affect disclosures only and have no impact on the
Group’s financial position or performance.
11
Investment Entities (Amendments to PFRS 10, PFRS 12 and PAS 27)
These amendments are effective for annual periods beginning on or after January 1, 2014. They
provide an exception to the consolidation requirement for entities that meet the definition of an
investment entity under PFRS 10. The exception to consolidation requires investment entities to
account for subsidiaries at fair value through profit or loss. It is not expected that this amendment
would be relevant to the Group since none of the entities in the Group would qualify to be an
investment entity under PFRS 10.
Philippine Interpretation IFRIC 21, Levies (IFRIC 21)
IFRIC 21 clarifies that an entity recognizes a liability for a levy when the activity that triggers
payment, as identified by the relevant legislation, occurs. For a levy that is triggered upon
reaching a minimum threshold, the interpretation clarifies that no liability should be anticipated
before the specified minimum threshold is reached. IFRIC 21 is effective for annual periods
beginning on or after January 1, 2014. The Group does not expect that IFRIC 21 will have
material financial impact in future financial statements.
PAS 39, Financial Instruments: Recognition and Measurement - Novation of Derivatives and
Continuation of Hedge Accounting (Amendments)
These amendments provide relief from discontinuing hedge accounting when novation of a
derivative designated as a hedging instrument meets certain criteria. These amendments are
effective for annual periods beginning on or after January 1, 2014. These amendments are not
expected to have a significant impact on the Group’s financial position or performance.
PAS 32, Financial Instruments: Presentation - Offsetting Financial Assets and Financial Liabilities
(Amendments)
The amendments clarify the meaning of “currently has a legally enforceable right to set-off” and
also clarify the application of the PAS 32 offsetting criteria to settlement systems (such as central
clearing house systems) which apply gross settlement mechanisms that are not simultaneous.
The amendments affect presentation only and have no impact on the Group’s financial position or
performance. The amendments to PAS 32 are to be retrospectively applied for annual periods
beginning on or after January 1, 2014.
Effective 2015
PAS 19, Employee Benefits – Defined Benefit Plans: Employee Contributions (Amendments)
The amendments apply to contributions from employees or third parties to defined benefit plans.
Contributions that are set out in the formal terms of the plan shall be accounted for as reductions
to current service costs if they are linked to service or as part of the remeasurements of the net
defined benefit asset or liability if they are not linked to service. Contributions that are
discretionary shall be accounted for as reductions of current service cost upon payment of these
contributions to the plans. The amendments to PAS 19 are to be retrospectively applied for
annual periods beginning on or after July 1, 2014.
Annual Improvements to PFRSs (2010-2012 cycle)
The Annual Improvements to PFRSs (2010-2012 cycle) contain non-urgent but necessary
amendments to the following standards:
PFRS 2, Share-based Payment – Definition of Vesting Condition
The amendment revised the definitions of vesting condition and market condition and added the
definitions of performance condition and service condition to clarify various issues. This
amendment shall be prospectively applied to share-based payment transactions for which the
grant date is on or after July 1, 2014. The amendment affects disclosures only and has no impact
on the Group’s financial position or performance.
PFRS 3, Business Combinations – Accounting for Contingent Consideration in a Business
Combination
The amendment clarifies that a contingent consideration that meets the definition of a financial
instrument should be classified as a financial liability or as equity in accordance with PAS 32.
Contingent consideration that is not classified as equity is subsequently measured at fair value
through profit or loss whether or not it falls within the scope of PFRS 9 (or PAS 39, if PFRS 9 is
not yet adopted) The amendment shall be prospectively applied to business combinations for
which the acquisition date is on or after July 1, 2014. The amendment will not have any impact on
the Group’s financial position or performance.
12
PFRS 8, Operating Segments – Aggregation of Operating Segments and Reconciliation of the
Total of the Reportable Segments’ Assets to the Entity’s Assets
The amendments require entities to disclose the judgment made by management in aggregating
two or more operating segments. This disclosure should include a brief description of the
operating segments that have been aggregated in this way and the economic indicators that have
been assessed in determining that the aggregated operating segments share similar economic
characteristics. The amendments also clarify that an entity shall provide reconciliations of the total
of the reportable segments’ assets to the entity’s assets if such amounts are regularly provided to
the chief operating decision maker. These amendments are effective for annual periods beginning
on or after July 1, 2014 and are applied retrospectively. The amendments affect disclosures only
and have no impact on the Group’s financial position or performance.
PFRS 13, Fair Value Measurement – Short-term Receivables and Payables
The amendment clarifies that short-term receivables and payables with no stated interest rates
can be held at invoice amounts when the effect of discounting is immaterial.
PAS 16, Property, Plant and Equipment – Revaluation Method – Proportionate Restatement of
Accumulated Depreciation
The amendment clarifies that, upon revaluation of an item of property, plant and equipment, the
carrying amount of the asset shall be adjusted to the revalued amount, and the asset shall be
treated in one of the following ways:
a. The gross carrying amount is adjusted in a manner that is consistent with the revaluation of
the carrying amount of the asset. The accumulated depreciation at the date of revaluation is
adjusted to equal the difference between the gross carrying amount and the carrying amount
of the asset after taking into account any accumulated impairment losses.
b. The accumulated depreciation is eliminated against the gross carrying amount of the asset.
The amendment is effective for annual periods beginning on or after July 1, 2014. The
amendment shall apply to all revaluations recognized in annual periods beginning on or after the
date of initial application of this amendment and in the immediately preceding annual period. The
amendment has no impact on the Group’s financial position or performance.
PAS 24, Related Party Disclosures – Key Management Personnel
The amendments clarify that an entity is a related party of the reporting entity if the said entity, or
any member of a group for which it is a part of, provides key management personnel services to
the reporting entity or to the parent company of the reporting entity. The amendments also clarify
that a reporting entity that obtains management personnel services from another entity (also
referred to as management entity) is not required to disclose the compensation paid or payable by
the management entity to its employees or directors. The reporting entity is required to disclose
the amounts incurred for the key management personnel services provided by a separate
management entity. The amendments are effective for annual periods beginning on or after
July 1, 2014 and are applied retrospectively. The amendments affect disclosures only and have
no impact on the Group’s financial position or performance.
PAS 38, Intangible Assets – Revaluation Method – Proportionate Restatement of Accumulated
Amortization
The amendments clarify that, upon revaluation of an intangible asset, the carrying amount of the
asset shall be adjusted to the revalued amount, and the asset shall be treated in one of the
following ways:
a. The gross carrying amount is adjusted in a manner that is consistent with the revaluation of
the carrying amount of the asset. The accumulated amortization at the date of revaluation is
adjusted to equal the difference between the gross carrying amount and the carrying amount
of the asset after taking into account any accumulated impairment losses.
b. The accumulated amortization is eliminated against the gross carrying amount of the asset.
The amendments also clarify that the amount of the adjustment of the accumulated amortization
should form part of the increase or decrease in the carrying amount accounted for in accordance
with the standard.
The amendments are effective for annual periods beginning on or after July 1, 2014. The
amendments shall apply to all revaluations recognized in annual periods beginning on or after the
date of initial application of this amendment and in the immediately preceding annual period. The
amendments have no impact on the Group’s financial position or performance.
13
Annual Improvements to PFRSs (2011-2013 cycle)
The Annual Improvements to PFRSs (2011-2013 cycle) contain non-urgent but necessary
amendments to the following standards:
PFRS 1, First-time Adoption of Philippine Financial Reporting Standards – Meaning of ‘Effective
PFRSs’
The amendment clarifies that an entity may choose to apply either a current standard or a new
standard that is not yet mandatory, but that permits early application, provided either standard is
applied consistently throughout the periods presented in the entity’s first PFRS financial
statements. This amendment is not applicable to the Group as it is not a first-time adopter of
PFRS.
PFRS 3, Business Combinations – Scope Exceptions for Joint Arrangements
The amendment clarifies that PFRS 3 does not apply to the accounting for the formation of a joint
arrangement in the financial statements of the joint arrangement itself. The amendment is
effective for annual periods beginning on or after July 1, 2014 and is applied prospectively.
PFRS 13, Fair Value Measurement – Portfolio Exception
The amendment clarifies that the portfolio exception in PFRS 13 can be applied to financial
assets, financial liabilities and other contracts. The amendment is effective for annual periods
beginning on or after July 1, 2014 and is applied prospectively. The amendment has no significant
impact on the Group’s financial position or performance.
PAS 40, Investment Property
The amendment clarifies the interrelationship between PFRS 3 and PAS 40 when classifying
property as investment property or owner-occupied property. The amendment stated that
judgment is needed when determining whether the acquisition of investment property is the
acquisition of an asset or a group of assets or a business combination within the scope of PFRS
3. This judgment is based on the guidance of PFRS 3. This amendment is effective for annual
periods beginning on or after July 1, 2014 and is applied prospectively. The amendment has no
significant impact on the Group’s financial position or performance.
Standard with No Mandatory Effective Date
PFRS 9, Financial Instruments
PFRS 9, as issued, reflects the first and third phases of the project to replace PAS 39 and applies
to the classification and measurement of financial assets and liabilities and hedge accounting,
respectively. Work on the second phase, which relate to impairment of financial instruments, and
the limited amendments to the classification and measurement model is still ongoing, with a view
to replace PAS 39 in its entirety. PFRS 9 requires all financial assets to be measured at fair value
at initial recognition. A debt financial asset may, if the fair value option (FVO) is not invoked, be
subsequently measured at amortized cost if it is held within a business model that has the
objective to hold the assets to collect the contractual cash flows and its contractual terms give
rise, on specified dates, to cash flows that are solely payments of principal and interest on the
principal outstanding. All other debt instruments are subsequently measured at fair value through
profit or loss. All equity financial assets are measured at fair value either through other
comprehensive income (OCI) or profit or loss. Equity financial assets held for trading must be
measured at fair value through profit or loss. For liabilities designated as at FVPL using the fair
value option, the amount of change in the fair value of a liability that is attributable to changes in
credit risk must be presented in OCI. The remainder of the change in fair value is presented in
profit or loss, unless presentation of the fair value change relating to the entity’s own credit risk in
OCI would create or enlarge an accounting mismatch in profit or loss. All other PAS 39
classification and measurement requirements for financial liabilities have been carried forward to
PFRS 9, including the embedded derivative bifurcation rules and the criteria for using the FVO.
The adoption of the first phase of PFRS 9 will have an effect on the classification and
measurement of the Group’s financial assets, but will potentially have no impact on the
classification and measurement of financial liabilities.
On hedge accounting, PFRS 9 replaces the rules-based hedge accounting model of PAS 39 with
a more principles-based approach.
Changes include replacing the rules-based hedge
effectiveness test with an objectives-based test that focuses on the economic relationship
between the hedged item and the hedging instrument, and the effect of credit risk on that
economic relationship; allowing risk components to be designated as the hedged item, not only
for financial items, but also for non-financial items, provided that the risk component is separately
14
identifiable and reliably measurable; and allowing the time value of an option, the forward element
of a forward contract and any foreign currency basis spread to be excluded from the designation
of a financial instrument as the hedging instrument and accounted for as costs of hedging.
PFRS 9 also requires more extensive disclosures for hedge accounting.
PFRS 9 currently has no mandatory effective date. PFRS 9 may be applied before the completion
of the limited amendments to the classification and measurement model and impairment
methodology. The Group will not adopt the standard before the completion of the limited
amendments and the second phase of the project. The Group, however, will continue to monitor
developments in this reporting standard and assess its impact on or need for adoption by the
Group.
Interpretation with Deferred Effectivity Date
Philippine Interpretation IFRIC 15, Agreements for the Construction of Real Estate
This interpretation covers accounting for revenue and associated expenses by entities that
undertake the construction of real estate directly or through subcontractors. The interpretation
requires that revenue on construction of real estate be recognized only upon completion, except
when such contract qualifies as construction contract to be accounted for under PAS 11 or
involves rendering of services in which case revenue is recognized based on stage of completion.
Contracts involving provision of services with the construction materials and where the risks and
reward of ownership are transferred to the buyer on a continuous basis will also be accounted for
based on stage of completion. The SEC and the Financial Reporting Standards Council (FRSC)
have deferred the effectivity of this interpretation until the final Revenue standard is issued by the
International Accounting Standards Board (IASB) and an evaluation of the requirements of the
final Revenue standard against the practices of the Philippine real estate industry is completed.
3. Principles of Consolidation
The unaudited condensed consolidated financial statements included the financial statements of
the Company and the following wholly and majority owned domestic and foreign subsidiaries:
Subsidiaries
AC Energy Holdings, Inc. (ACEHI)
AC Infrastructure Holdings Corporation (AC Infra)
AC International Finance Limited (ACIFL)*
AG Counselors Corporation (AGCC)
Ayala Automotive Holdings Corporation (AAHC)
Ayala Aviation Corporation (AAC)
Ayala Land, Inc. (ALI)
AYC Finance Ltd. (AYCFL)*
Azalea International Venture Partners, Limited (AIVPL)**
Azalea Technology Investments, Inc. (Azalea Technology)
Bestfull Holdings Limited (BHL)***
Darong Agricultural and Development Corporation (DADC)
Integrated Microelectronics, Inc. (IMI)
LiveIt Global Services Management Institute, Inc. (LGSMI)
Manila Water Company, Inc. (MWCI)
Michigan Holdings, Inc. (MHI)
MPM Noodles Corporation (MPM)
Philwater Holdings Company, Inc. (Philwater)
Purefoods International Ltd. (PFIL)**
Technopark Land, Inc. (TLI)
Water Capital Works, Inc. (WCW)
Nature of Business
Power
Transport Infrastructure
Investment Holding
Legal Services
Automotive
Air Charter
Real Estate and Hotels
Investment Holding
BPO
Information Technology
International
Agriculture
Electronics Manufacturing
Education
Water Distribution and
Wastewater Services
Investment Holding
Investment Holding
Investment Holding
Investment Holding
Real Estate
Investment Holding
Effective Percentages of Ownership
December 2013
March 2014
(Audited)
(Unaudited)
100.0
100.0
100.0
100.0
100.0
100.0
48.9
100.0
100.0
100.0
100.0
100.0
58.7
100.0
100.0
100.0
100.0
100.0
100.0
100.0
48.9
100.0
100.0
100.0
100.0
100.0
57.8
100.0
48.5
100.0
100.0
100.0
100.0
78.8
100.0
48.8
100.0
100.0
100.0
100.0
78.8
100.0
*Incorporated in Cayman Islands
**Incorporated in British Virgin Islands
***Incorporated in Hong Kong
Unless otherwise indicated, the principal place of business and country of incorporation of the
Group’s investments in subsidiaries is the Philippines.
15
Except as discussed in subsequent notes, the voting rights held by the Group in its investments in
subsidiaries are in proportion to its ownership interest.
Bestfull Holdings Limited
a. Ayala International Holdings, Ltd. (AIHL), a subsidiary of BHL, acquired an approximately 17
percent ownership interest in GNPower Mariveles Coal Plant Ltd. Co. (GMCP) under the
terms of the Sale and Purchase Agreement that it entered into with an affiliate of a fund
advised by Denham Capital. GMCP is the owner of the 600-megawatt coal-fired power plant
in Mariveles, Bataan. Total consideration in relation to this transaction amounted to US$162
million.
Ayala Land, Inc.
a. On January 24, 2014, ALI entered into a Joint Venture Agreement with AboitizLand, Inc. for
the development of an approximately 15-hectare property in Mandaue City into a mixed-used
city center. ALI subsequently assigned to its subsidiaries, Cebu Holdings, Inc. and Cebu
Property Ventures & Development Corporation, the right to subscribe to ten percent (10%)
and five percent (5%), respectively, of the authorized capital stock of the joint venture
company that will be established. ALI shall retain the remaining thirty five percent (35%) stake
in the joint venture company.
b. On February 21, 2014, the BOD of ALI approved the following:
- Declaration of cash dividend on common shares of P
= 0.21 per share to stockholders of
record as of March 7, 2014.
- Declaration of annual cash dividends of 4.75% per annum or P
= 0.0047 per share on the
unlisted voting preferred shares to all shareholders of record as of June 16, 2014
- Issuance of bonds in the amount of P
= 15 billion with a tenor of up to 11 years.
- Acquisition of 40% interest in Philippine Integrated Energy Solutions, Inc. (PhiEnergy) of
Mitsubishi Corporation. PhilEnergy will be a wholly-owned subsidiary of ALI after the
transaction.
c.
The Company owns 93.1% of the total preferred shares of ALI as of March 31, 2014 and
December 31, 2013. The voting rights held by the Group in ALI as of March 31, 2014 and
December 31, 2013 is equal to 70.1%.
AC Energy Holdings, Inc.
a. On December 16, 2013, AC Energy signed an Investment Agreement with Sithe Global
GNPD BV and Power Partners Ltd. Co. for the development of a proposed 2x600MW coal
power plant project in Bataan, or in an alternative project site within the island of Luzon.
b. On January 29, 2014, the AC Group, through AIHL, closed its acquisition of 17.1% stake in
GNPower Mariveles Coal Plant Ltd. Co. (GMCP), the owner of a 600 MW coal-fired plant in
Mariveles, Bataan. The stake was purchased for USD 162.1 Million. See Bestfull discussion
above.
c.
On January 14, 2014, the Securities and Exchange Commission (SEC) approved the
increase in the Authorized Capital Stock of North Luzon Renewable Energy Corp. (NLREC),
the project company undertaking the construction of the proposed 81 MW wind farm in
Caparispisan, Pagudpud, Ilocos Norte (the “Wind Project”), from 10 million to 6.63 billion
divided into 100,000 common shares and 28,945 redeemable preferred shares.
NLREC is the joint venture project company that is jointly owned by AC Energy, UPC
Philippines Wind Holdco B.V., a wholly owned subsidiary of UPC Renewables Partners, a
developer of wind farm projects across the globe, and the Philippine Investment Alliance for
Infrastructure (PINAI), the dedicated infrastructure fund managed by Macquarie Infrastructure
Management (Asia) Pty Limited Singapore Branch.
On January 29, 2014, the Group, through AIHL, signed an Option Agreement with DGA
NLREC B.V. for the sale of equity interest in Luzon Wind Energy Holdings B.V., a Dutch BV
(wholly-owned by AIHL) that holds indirect equity interest in NLREC.
d. On March 12, 2014, NLREC, entered into an Omnibus Agreement with Rizal Commercial
Banking Corporation (RCBC) for a 3 Billion loan facility that has a tenor of 15 years. Loan
proceeds will be used to finance the on-going construction of the Project.
16
e. Pursuant to the limited partnership agreement of AC Energy and Power Partners Ltd. Co.
signed last July 30, 2013, AC Energy provided on March 19, 2014 additional 12 million
interest free advances to GN Power Kauswagan Ltd. Co. (GNPK). The advances will be used
for pre-development costs of Kauswagan power facility. Advances to GNPK totaled 81.9
million as of March 31, 2014.
AC Infrastructure Holdings Corporation
a. On January 30, 2014, the Department of Transportation and Communications (DOTC)
notified the AF Consortium composed of AC Infrastructure Holdings Corporation, BPI Card
Finance Corporation, Globe Telecom, Inc., Meralco Financial Services Corporation, Metro
Pacific Investments Corporation and Smart Communications Inc., as the winning bidder for
the P
= 1.72-billion contactless Automatic Fare Collection System Project (AFCS). The AFCS
will upgrade the Light Rail Transit and Metro Rail Transit ticketing system by speeding up
payments, reducing queuing time and allowing passengers seamless transfers from one rail
line to another.
AC International Finance Limited
a. As of March 31, 2014 and December 31, 2013, ACIFL, through its wholly-owned subsidiary,
AYC Holdings, Ltd., owns 58.7% and 57.8% of IMI, respectively. The voting rights held by the
Group in IMI as of March 31, 2014 and December 31, 2013 is equal to 68.5% and 70.2%,
respectively.
AYC Finance, Ltd.
a. In January 2014, AYC Finance Ltd. drew on various loans in with foreign banks, with the
Company as a guarantor, for a total of USD 345 million at a rate ranging from 0.87% to 1.39%
over the 1-, 3 or 6-months LIBOR at AYCFL's option. The loan covenants covering
borrowings outstanding as of December 2013 of AYCFL apply to these new loans in 2014.
Please see Note 16 Short-term Loans and Long-term Debt.
Integrated Micro-Electronics, Inc.
a. On February 17, 2014, the BOD of IMI approved the declaration of the cash dividend on
common shares of US$0.00140 or P
= 0.06 per share to stockholders of record as of March 3,
2014.
Azalea International Venture Partners Limited
a. On January 7, 2014, ARES, PEP and LiveIt Investments Ltd. (LiveIt), wholly-owned
subsidiary of AIVPL and the BPO investment arm of Ayala Corporation, entered into an
agreement with Convergys Corporation to sell their 100% combined interest in Stream.
Accordingly, the carrying amount of investment in Stream amounting to P
= 3.3 billion as of
December 31, 2013 is shown as Noncurrent Asset Held for Sale in the consolidated
statement of financial position. On March 4, 2014, LiveIt achieved financial close in relation to
the sale of 100% of its holdings in Stream to Convergys. LiveIt realized approximately
US$145 million total net debt and equity proceeds.
Manila Water Company, Inc.
a. On January 9, 2014, LagunaAAA Water Corporation, a subsidiary of MWCI, signed a Third
Omnibus Loan and Security Agreement with the Development Bank of the Philippines through
the Philippine Water Revolving Fund amounting to P
= 833 million.
b. On February 20, 2014, the BOD of MWC approved the following:
- Declaration of cash dividend of P
= 0.40 per share on the outstanding common share and P
=
0.04 per share on the outstanding participating preferred shares to stockholders of record
as of March 6, 2014.
- Commitment to provide up to 85% of the funding requirements of its corporate social
responsibility arm, Manila Water Foundation, Inc.
- Infusion of additional equity investment in its wholly owned Singapore subsidiary, Manila
Water Asia Pacific Pte. Ltd. in the amount of US$45,000 for its operational purposes
c.
The voting rights held by the Group in MWC as of March 31, 2014 and December 31, 2013 is
equal to 79.7% and 79.3%, respectively.
17
Material partly-owned subsidiaries
The summarized financial information of subsidiaries that have material noncontrolling
interest is provided below.
These information is based on amounts before
intercompany eliminations.
March 2014
(Unaudited)
Ayala Land, Inc. and Subsidiaries
(In Million Pesos)
Current assets
Non-current assets
Current liabilities
Non-current liabilities
Equity
Attributable to owners of the parent
Attributable to non-controlling interest
Revenue
Net income
Attributable to owners of the parent
Attributable to non-controlling interest
Other comprehensive income
156,275
190,626
122,130
110,808
98,790
15,173
22,749
3,464
730
(48)
March 2014
(Unaudited)
Manila Water Co. Inc. and Subsidiaries
(In Million Pesos)
Current assets
Non-current assets
Current liabilities
Non-current liabilities
Equity
Attributable to owners of the parent
Attributable to non-controlling interest
Revenue
Net income
Attributable to owners of the parent
Attributable to non-controlling interest
Other comprehensive income
10,050
64,602
8,659
34,295
31,144
554
3,827
1,431
3
200
March 2014
(Unaudited)
Integrated Microelectronics, Inc. and Subsidiaries
(In Million US$)
Current assets
Non-current assets
Current liabilities
Non-current liabilities
Equity
Attributable to owners of the parent
Attributable to non-controlling interest
Revenue
Net income
Attributable to owners of the parent
Attributable to non-controlling interest
Other comprehensive income
356.5
148.0
233.1
79.1
195.0
(2.7)
205.7
5.0
(0.1)
(0.4)
As of March 31, 2014, the proportion of ownership interest held by material noncontrolling interest of ALI, MWC and IMI are 51.1%, 51.5% and 41.3%, respectively.
18
4. Cash and Cash Equivalents (in thousand pesos):
Cash on hand and in banks
Cash equivalents
March 2014
(Unaudited)
25,240,524
43,454,534
68,695,058
December 2013
(Audited)
22,728,761
42,926,288
65,655,049
Cash in bank earns interest at the prevailing bank deposit rates. Cash equivalents are short-term
investments that are made for varying periods of up to three months depending on the immediate
cash requirements of the Group and earn interest at the respective short-term investment rates.
5. Short-term Investments (in thousand pesos):
Money market placements
March 2014
(Unaudited)
8,587,498
December 2013
(Audited)
119,345
Money market placements are short-term investments made for varying periods of more than
three months and up to six months and earn interest at the respective short-term investment
rates.
As of March 31, 2014, AYC Finance Ltd. has a money market placement with BPI amounting to
P
= 8.5 billion or US$190 million earning interest at 1.125% per annum (see Note 21 Related Party
Transactions).
6. Accounts and Notes Receivable (in thousand pesos):
March 2014
(Unaudited)
Trade:
Real estate
Electronics manufacturing
Water distribution and wastewater services
Automotive
Information technology and BPO
International and others
Related parties (Note 21)
Dividends Receivable
Receivables from officers and employees (Note 21)
Advances to contractors and suppliers
Investment in bonds classified as loans and receivables
Advances and others
Less allowance for doubtful accounts
Less noncurrent portion
December 2013
(Audited)
39,832,997
7,286,792
1,645,476
985,390
194,584
3,618
3,145,472
1,412,577
507,042
8,837,924
1,000,000
11,548,513
76,400,385
1,776,400
74,623,985
18,282,941
56,341,044
40,453,979
7,849,177
1,527,618
1,008,502
167,661
1,881
2,764,963
110
279,003
8,651,533
1,000,000
15,180,460
78,884,887
1,597,629
77,287,258
18,334,221
58,953,037
The aging of the above receivables are summarized in the following table (in million pesos,
unaudited):
Trade Receivables
Non-Trade Receivables
Total
Up to 6
Over 6 mos Over one
months to one year
year
21,882
13,186
9,665
18,551
5,333
2,264
40,433
18,519
11,929
Past due
6,276
130
6,406
Total
51,009
26,278
77,287
19
The Group’s Advances and Others account as of March 31, 2014 increased from year-end 2013
balances mainly driven by ALI’s new and existing residential and commercial projects. Provision
for Doubtful Accounts amounted to P
= 27.1 million and P
= 21.8 million (both amounts unaudited) for
the periods ended March 31, 2014 and 2013 form part of the Group’s General and Administrative
Expenses for the period, respectively.
7. Inventories (in thousand pesos):
March 2014
(Unaudited)
At Cost:
Condominium, residential and commercial units
Subdivision land for sale
Vehicles
Finished goods
Work-in-process
Materials, supplies and others
At NRV:
Subdivision land for sale
Finished goods
Work-in-process
Parts and accessories
Materials, supplies and others
December 2013
(Audited)
26,563,154
18,205,922
1,118,892
9,164
962,235
46,859,367
26,920,259
16,854,931
1,171,478
354,134
432,008
1,544,821
47,277,631
524,158
660,140
818,594
105,391
3,000,334
5,108,617
51,967,984
524,158
316,576
176,749
168,451
1,714,921
2,900,855
50,178,486
The Group’s provision for impairment losses on inventories for the period ended March 31, 2014
(unaudited) amounting to P
= 21.5 million and the net reversal of provision for impairment losses on
inventories for the period ended March 31, 2013 amounting to P
= 25.4 million, form part of the
consolidated General and Administrative Expenses.
8. Other Current Assets (in thousand pesos):
Financial assets at FVPL
Prepaid expenses
Deposits in escrow
Input VAT
Creditable withholding tax
Derivative assets
Others
March 2014
(Unaudited)
15,379,650
10,225,521
6,526,470
3,310,603
1,788,823
925
896,813
38,128,805
December 2013
(Audited)
17,916,513
7,708,414
6,743,298
3,660,057
2,068,934
456,768
640,036
39,194,020
Prepaid expenses account increased from December 31, 2013 balances mainly due to expenses
paid in full at beginning of the year but will be amortized untill year-end. Others include various
pre-operating expenses incurred prior to launching of new real estate projects.
9. Land and Improvements
This account consists of properties for future development and improvement eventually for
transfer to real estate inventories for sale. This account increased from P
= 62,475 million as of
December 31, 2013 (audited) to P
= 67,219 million as of March 31, 2014 (unaudited) arising from
unsubdivided land and certain land acquisitions by the Group.
20
10. Investments in Associates and Joint Ventures
Investments in associates and joint ventures are accounted for under the equity method of
accounting. Major associates and joint ventures and the related percentages of ownership as of
March 31, 2014 are as follows:
Percentage of Ownership
Domestic:
Bank of the Philippine Islands (BPI)
Ayala DBS Holdings, Inc. (ADHI)*
Globe Telecom, Inc. (Globe)*
Emerging City Holdings, Inc. (ECHI)*
South Luzon Thermal Energy Corp. (SLTEC)*
Philippine Wind Holdings Corporation (PWHC)
Berkshire Holdings, Inc. (BHI)*
Asiacom Philippines, Inc. (Asiacom)*
Bonifacio Land Corporation (BLC)
Foreign:
Stream Global Services, Inc. (Stream) (U.S. Company)
Thu Duc Water B.O.O. Corporation (TDW)
(incorporated in Vietnam)
Kenh Dong Water Supply Joint Stock Company
(KDW) (incorporated in Vietnam)
Integreon, Inc. (Integreon)* (British Virgin Islands Company
Saigon Water Infrastructure Joint Stock Company
(Saigon Water) (incorporated in Vietnam)
VinaPhil Technical Infrastructure Investment Joint
Stock Company (VinaPhil) (incorporated in Vietnam)*
Others
Carrying Amounts
(in million pesos)
December 2013
March 2014
(Audited)
(Unaudited)
March 2014
(Unaudited)
December 2013
(Audited)
32.6
73.8
30.4
50.0
50.0
75.0
50.0
60.0
10.0
32.6
73.8
30.4
50.0
50.0
75.0
50.0
60.0
10.0
-
28.9
-
3,329
49.0
49.0
2,297
2,200
47.4
58.7
47.4
58.7
1,931
1,418
1,863
1,449
31.5
31.5
659
645
49.0
Various
49.0
Various
P
Reclassification to noncurrent asset held for sale
P
61,102
33,451
14,764
4,258
3,550
2,495
2,069
1,101
704
601
3,634
134,034
134,034
52,635
29,072
15,371
3,993
3,070
2,180
1,955
1,097
1,395
P
590
2,289
123,133
(3,329)
119,804
P
* Joint ventures
Unless otherwise indicated, the principal place of business and country of incorporation of the
Group’s investments in associates and joint ventures is in the Philippines.
Except as discussed in subsequent notes, the voting rights held by the Group in its investments in
associates and joint ventures are in proportion to its ownership interest.
Bank of the Philippine Islands
a) On November 6, 2013, the BOD of BPI approved the offering for subscription of up to
370.4 million common shares of BPI by way of a stock rights offering to eligible registered
holders of common shares as of January 16, 2014 at the entitlement ratio of 1 rights share for
every 9.602 existing common shares held by such eligible shareholders. The stock rights offer
started on January 20, 2014 and ended on January 30, 2014 (see Note 12).
b) On November 6, 2013, the BOD of BPI approved the declaration of cash dividend on common
shares of P
= 0.90 per share to common shareholders of record 15 working days from receipt of
approval of the BSP and distributable on the 15th working day from said record date. The
BSP approved the dividend declaration on December 6, 2013 to stockholders of record as of
January 3, 2014 and payable on January 24, 2014.
c) On January 20, 2014, the offer period for the stock rights offering of BPI started at an offer
price of P
= 67.50 per rights share. The offer period on January 30, 2014 wherein AC, MHI and
ADHI participated in the stock rights offering by subscribing to 114.4 million, 7.7 million and
58.9 million common shares, respectively, amounting to P
= 7.7 billion, P
= 0.5 billion and
P
= 3.98 billion, respectively.
Globe Telecom Inc.
a) On February 10, 2014, the BOD of Globe approved the declaration of the first semi-annual
cash dividend on common shares of P
= 37.50 per share to stockholders of record as of
February 26, 2014.
21
BPI’s Statements of Condition information (in million pesos):
March 2014
(Unaudited)
December 2013
(Audited)
Total Resources
1,214,555
1,195,364
Total Liabilities
Capital Funds Attributable to the Equity Holders of BPI
Noncontrolling Interest
1,081,969
131,290
1,296
1,089,557
104,534
1,273
Total Liabilities and Capital Funds
1,214,555
1,195,364
BPI’s Statements of Income information (in million pesos except EPS Figures):
March 2014
(Unaudited)
March 2013
(Unaudited)
Interest income
Other Income
Total revenues
10,819
4,182
15,001
9,926
9,394
19,320
Operating expenses
Interest expense
Impairment losses
Provision for income tax
Total Expenses
6,723
2,633
915
1,115
11,386
6,600
2,821
628
800
10,849
Net income for the period
3,615
8,471
3,603
12
3,615
8,369
102
8,471
0.92
2.35
Attributable to:
Equity holders of BPI
Noncontrolling interest
EPS:
Based on 3,929,297,850 shares as of March 31, 2014
and 3,556,356,173 shares as of March 31, 2013
The Company’s share in the net identifiable assets of BPI as of March 2014 (unaudited)
amounted to P43,223 million and no dividends received from BPI for the period ended March 31,
2014. The fair market value of the Company’s investment in BPI as of March 31, 2014 amounted
to P110,036 million.
The Company conducts its telecommunications business through its joint venture entity, Globe.
As of March 31, 2014, the Company effectively owned 30.4% of Globe common shares.
22
Globe’s Statements of Financial Position information (in million pesos):
December 2013
(Audited)
March 2014
(Unaudited)
Current Assets
Noncurrent Assets
Total Assets
34,842
125,187
160,029
35,631
123,448
159,079
Current Liabilities
Noncurrent Liabilities
Equity
Total Liabilities and Equity
54,310
66,052
39,667
160,029
54,989
62,451
41,639
159,079
Globe’s Statements of Income information (in million pesos except EPS Figures):
March 2013
(Unaudited)
March 2014
(Unaudited)
Net Operating Revenues
Other Income
Total Revenues
24,360
308
24,668
22,471
297
22,768
Costs and Expenses
Provision for Income Tax
Total Expenses
20,362
1,357
21,719
21,902
210
22,112
2,949
656
Net Income
EPS:
Basic
Diluted
22.15
22.13
4.88
4.88
As of March 31, 2014
Basic based on 132,676K common shares
Diluted based on 133,284K common shares
As of March 31, 2013
Basic based on 132,417K common shares
Diluted based on 133,233K common shares
The Company’s share in the net identifiable assets of Globe as of March 2014 (unaudited)
amounted to P12,059 million. Dividends received from from Globe for the period ended March
31, 2014 amounted to P1,512 million. The fair value of the Company’s investment in Globe as of
March 31, 2014 amounted to P67,094 million.
As of March 31, 2014, the Company’s direct ownership in ADHI is equal to 73.8%, while ADHI’s
direct ownership in BPI is equal to 21.3%. The fair value of BPI shares held by ADHI amounted to
P72.0 million as of March 31, 2014. The Group and Arran Investment Pte. Ltd. (GICSI), an entity
managed and controlled by GIC Special Investments Pte. Ltd., as joint venture partners, agreed
to vote its BPI shares based on the common position reached jointly by them as shareholders.
11. Investments in Bonds and Other Securities (in thousand pesos):
Quoted/unquoted equity/debt investments
March 2014
(Unaudited)
11,849,579
December 2013
(Audited)
2,784,807
23
Includes investments made by the Group, through AIHL, in GNPower Mariveles Coal Plant Ltd.
Co. in Q1 2014 (see Note 3).
12. Investment Properties
This comprises completed property and property under construction or re-development that are
held to earn rentals, and are not occupied by the companies in the Group. These properties
include parcels of land, buildings and other real estate properties. As of March 31, 2014, the
account includes Investment in Land - net (P
= 12,877.2 million) and Investment in Buildings – net
(P
= 51,316.6 million).
13. Service Concession Assets
The Parent Company has a concession agreement with the DPWH while the MWC Group has
concession agreements with MWSS, POL, TIEZA and CDC. These concession agreements set
forth the rights and obligations of the Parent Company and MWC Group throughout the
concession period.
14. Accounts Payable and Accrued Expenses (in thousand pesos):
Accounts payable
Accrued expenses
Project costs
Personnel costs
Rental and utilities
Professional and management fees
Advertising and promotions
Repairs and maintenance
Various operating expenses
Dividends payable
Interest payable
Taxes payable
Related parties (Note 21)
Retentions payable
March 2014
(Unaudited)
67,632,575
December 2013
(Audited)
63,198,549
24,705,821
3,844,757
3,081,517
2,544,431
966,516
1,208,694
5,130,273
431,209
2,087,742
420,235
6,280,976
1,272,138
119,606,884
11,983,222
2,694,816
2,330,388
1,801,971
1,115,532
1,516,026
3,230,745
2,093,323
2,272,458
6,067,957
4,107,009
1,192,251
103,604,247
Accounts payable and accrued expenses are non-interest bearing and are normally settled on 15to 60-day terms. Other payables are non-interest bearing and are normally settled within one
year.
As of March 31, 2014 (unaudited) and December 31, 2013 (audited), accounts payable includes
non-interest bearing liability of the Company to DBS Ltd. in relation to the acquisition of BPI
common shares and ADHI Class B common shares amounting to P
= 8.7 billion and P
= 14.2 billion,
respectively.
Accrued expenses consist mainly of accruals already incurred but not yet billed for project costs,
personnel, rental and utilities, marketing costs, film share, professional fees, postal and
communication, supplies, repairs and maintenance, transportation and travel, subcontractual
costs, security, insurance, and representation.
Project costs represent accrual for direct costs associated with the commercial, residential and
industrial project development and construction like engineering, design works, contract cost of
labor and direct materials. Increase in accrued project costs from December 31, 2013 (audited)
balance to P
= 24.7M was due to costs of new and existing projects of ALI group (mainly on the
grownt of residential and construction segments).
24
Increase in balances of accounts payable and accrued expenses items from December 31, 2013
(audited) to March 31, 2014 (unaudited) is mainly due to expanded operations of ALI, IMI and
MWCI groups.
Taxes payable consists of net output VAT, withholding taxes, business taxes, and other statutory
payables, which are payable within one year. The decline in taxes payable was mainly a result of
payment during the year of the 2013 taxes which normally have higher balances at year-end.
15. Other Current and Noncurrent Liabilities (in thousand pesos):
March 2014
(Unaudited)
Other current liabilities
Other noncurrent liabilities
December 2013
(Audited)
6,914,044
10,991,693
21,798,955
24,827,938
Other current liabilities mainly include the following:
a. Customers’ deposits consist of tenants’ deposits and construction bonds to be refunded by
the Group through the application of the amount thereof against the rent and service due.
b. Nontrade payables mainly pertain to non-interest bearing real estate-related payables to
contractors, tenants’ deposits, construction bonds and various non-trade suppliers which are
due within one year. This account also includes finance lease payable and miscellaneous
non-interest bearing non-trade accounts of the Group due within one year.
Other noncurrent liabilities mainly include the following:
a. Deposits and deferred credits
Deposits include rental deposits that serve as security for any damages to the leased property
and which will be refunded at the end of lease term.
Deposits are initially recorded at fair value, which was obtained by discounting future cash
flows using the applicable rates of similar types of instruments. The difference between the
cash received and its fair value is recorded as deferred credits.
Deferred credits also include prepayments received from customers before the completion of
delivery of goods or services.
b. Retentions payable pertains to amount withheld from the contractors’ progress billings which
will be later released after the guarantee period, usually one year after the completion of the
project. The retention serves as a security from the contractor should there be defects in the
project.
c.
Estimated liability on property development pertains to the estimated future development of
the sold portion of the real estate inventories.
d. Provisions relate to pending unresolved claims and assessments. The information usually
required by PAS 37, Provisions, Contingent Liabilities and Contingent Assets, is not disclosed
on the grounds that it can be expected to prejudice the outcome of these claims and
assessments.
e. Others mainly include nontrade payables.
Decrease in other current and non-current liabilities from December 31, 2013 balances (audited)
was largely due to ALI group’ deposits for construction of golf course.
25
16. Short-term Debt and Long-term Debt (in thousand pesos):
March 2014
(Unaudited)
Short-term debt:
Philippine Peso with various interest rates
Foreign Currency with various interest rates
Long-term debt:
Company:
Bank loans with various interest rates
Fixed Rate Corporate Notes (FXCNs)
Bonds, due 2017 to 2027
Syndicated term loan
Subsidiaries:
Loans from banks & other financial institutions:
Foreign currency with various interest rates
Philippine Peso with various interest rates
Bonds, due 2014 to 2033
Floating Rate Corporate Notes (FRCNs)
Fixed Rate Corporate Notes (FXCNs)
Less current portion
December 2013
(Audited)
16,265,033
3,568,519
19,833,552
12,114,451
3,696,834
15,811,285
21,148,631
2,817,320
39,710,136
2,937,648
66,613,735
13,193,780
2,816,443
39,689,874
2,938,575
58,638,672
47,927,337
37,671,088
39,664,000
1,000,000
24,290,092
150,552,517
217,166,252
12,003,010
205,163,242
32,392,171
32,189,740
39,312,675
1,000,000
26,336,604
131,231,190
189,869,862
11,842,519
178,027,343
As of March 31, 2014, total proceeds from availment of short-term and long-term debt amounted
to P
= 37.5 billion which mainly consists of proceeds from loans of AC (P
= 8.0 billion as also
discussed in Note 21 Related Party Transactions) ALI (P
= 12.1 billion), AYCFL (P
= 15.4 billion or
US$ 345 million as also discussed in AYC Finance Ltd. in Note 3) and AAHC (P
= 2.1 billion) while
payments of short-term and long-term debt amounted to P
= 6.2 billion which mainly pertains to loan
payment of ALI (P
= 5.0 billion) and AAHC (P
= 1.2 billion).
17. Equity
Details of the Company's paid-up capital (in thousand pesos):
Preferred Preferred Preferred
Stock- A Stock- B Stock-Voting
As of January 31, 2013 (Audited)
1,200,000 5,800,000
Exercise/Cancellation of ESOP/ESOWN
Reissuance of Treasury Stock
As of March 31, 2014 (Unaudited)
1,200,000 5,800,000
As of January 31, 2013 (Audited)
1,200,000 5,800,000
Exercise/Cancellation of ESOP/ESOWN
Reissuance of Treasury Stock
Redemption of preferred shares
As of December 31, 2013 (Audited)
1,200,000 5,800,000
Common
Stock
Additional
Paid-in Subscriptions Total Paid-up
Subscribed Capital
Receivable
Capital
200,000
-
29,821,726
5,412
150,176 13,432,506
56,598
(438,279)
973
200,000
29,827,138
150,176 13,489,104
(437,306)
200,000
-
29,783,010
38,716
160,652
(10,476)
(481,601)
43,322
200,000
29,821,726
8,457,871
215,776
9,558,859
(4,800,000)
150,176 13,432,506
(438,279)
26
50,166,129
62,983
50,229,112
45,119,932
287,338
9,558,859
(4,800,000)
50,166,129
The Group’s reconciliation of Retained Earnings available for dividend declaration shows the
following as of March 31, 2014 and December 31, 2013 (in thousand pesos):
December 2013
(Audited)
March 2014
(Unaudited)
Consolidated retained earnings balance
Accumulated equity in net earnings of subsidiaries, associates
and joint ventures
Treasury shares
Retained Earnings available for dividends
98,111,215
92,639,781
(67,680,009)
(5,000,000)
25,431,206
(64,307,340)
(5,000,000)
23,332,441
There was no dividends declared by the Company as of March 31, 2014 while table below shows
the details on the dividends declared as of December 31, 2013:
(in thousand pesos except dividends per share)
December 2013
(Audited)
Dividends to common shares:
Cash dividends declared
Cash dividends per share
Dividends to equity preferred shares declared
Cash dividends to Preferred B shares
Cash dividends to Voting Preferred shares
2,877,477
P4.80
525,000
3,750
18. Earnings Per Share
The following table presents information necessary to calculate EPS:
(In thousand pesos except per share amounts)
Net Income
Less: Dividends on Preferred Shares
Less: Dilutive effect of Options issued by
subsidiaries, associates and joint ventures
Weighted average number of common shares
Dilutive shares arising from stock options
Adjusted weighted average number of common
shares for diluted EPS
Basic EPS
Dilutive EPS
March 2014
(Unaudited)
March 2013
(Unaudited)
5,471,433
(133,200)
5,604,633
4,506,815
133,200
4,373,615
2,409
5,602,225
4,699
4,368,916
599,514
2,719
593,739
4,342
602,233
598,081
9.35
9.30
7.37
7.30
19. Segment Information
Business segment information is reported on the basis that is used internally for evaluating
segment performance and deciding how to allocate resources among operating segments.
Accordingly, the primary segment reporting format is by business segment.
For management purposes, the Group is organized into the following business units:
•
Real estate and hotels - planning and development of large-scale fully integrated residential
and commercial communities; development and sale of residential, leisure and commercial
lots and the development and leasing of retail and office space and land in these
communities; construction and sale of residential condominiums and office buildings;
development of industrial and business parks; development and sale of upper middle-income
27
and affordable housing; strategic land bank management; hotel, cinema and theater
operations; and construction and property management.
•
Financial services and bancassurance - universal banking operations, including savings and
time deposits in local and foreign currencies; commercial, consumer, mortgage and
agribusiness loans; leasing; payment services, including card products, fund transfers,
international trade settlement and remittances from overseas workers; trust and investment
services including portfolio management, unit funds, trust administration and estate planning;
fully integrated bancassurance operations, including life, non-life, pre-need and reinsurance
services; internet banking; on-line stock trading; corporate finance and consulting services;
foreign exchange and securities dealing; and safety deposit facilities.
•
Telecommunications - provider of digital wireless communications services, wireline voice
communication services, consumer broadband services, other wireline communication
services, domestic and international long distance communication or carrier services and
mobile commerce services.
• Electronics - electronics manufacturing services provider for original equipment
manufacturers in the computing, communications, consumer, automotive, industrial and
medical electronics markets, service provider for test development and systems integration
and distribution of related products and services.
• Information technology and BPO services - venture capital for technology businesses and
emerging markets; provision of value-added content for wireless services, on-line businessto-business and business-to-consumer services; electronic commerce; technology
infrastructure hardware and software sales and technology services; and onshore and
offshore outsourcing services in the research, analytics, legal, electronic discovery, document
management, finance and accounting, IT support,
graphics, advertising production,
marketing and communications, human resources, sales, retention, technical support and
customer care areas.
• Water utilities - contractor to manage, operate, repair, decommission, and refurbish all fixed
and movable assets (except certain retained assets) required to provide water delivery
services and sewerage services in the East Zone Service Area.
• Automotive - manufacture and sale of passenger cars and commercial vehicles.
• International - investments in overseas property companies and projects.
• Others - power and infrastructure, air-charter services, agri-business and others.
Management monitors the operating results of its business units separately for the purpose of
making decisions about resource allocation and performance assessment. Segment performance
is evaluated based on operating profit or loss and is measured consistently with operating profit or
loss in the consolidated financial statements.
Intersegment transfers or transactions are entered into under the normal commercial terms and
conditions that would also be available to unrelated third parties. Segment revenue, segment
expense and segment results include transfers between operating segments. Those transfers are
eliminated in consolidation.
The Group generally accounts for inter-segment sales and transfers as if the sales or transfers
were to third parties at current market prices.
The following tables present revenue and net income information regarding business segments
for the nine months ended March 31, 2014 and 2012 and total assets and total liabilities for the
business segments as of March 31, 2014 and December 31, 2013:
28
March 2014 (Unaudited)
(in million pesos)
Financial
Parent Real Estate and Services and
Telecom
Com pany
Hotels
Bancassurance m unications
INCOME
Sales to external customers
Intersegment
Equity in net earnings of associates
and jointly controlled entities
Interest income
Other income
Total incom e
Operating Expenses
Operating profit
Interest expense and other financing charges
Other charges
Provision for income tax
Net incom e
26
12
20,946
(26)
-
(154)
59
94
37
557
(520)
1,039
14
(1,572)
479
1,132
161
22,692
15,908
6,784
1,385
1,320
4,078
1,871
1,871
1,871
1,871
Inform ation
Technology
and BPO
Services
International
Water Utilities
Electronics
-
3,659
-
9,227
0
406
-
914
914
914
914
87
21
771
4,538
1,916
2,621
405
594
348
1,273
4
38
9,269
8,926
343
31
19
70
222
(49)
15
1,777
2,149
461
1,688
6
10
1,673
32
Autom otive Intersegm ent
and Others Elim inations
Consolidated
-
2,838
34
168
56
256
84
172
2
1
169
(2)
0
138
3,008
2,972
36
12
2
27
(5)
37,133
-
(20)
(0)
(38)
(58)
(102)
44
(0)
(4)
48
3,146
1,399
2,997
44,675
30,721
13,954
2,879
616
1,787
8,672
OTHER INFORMATION
Segment Assets
Investments in associates and jointly
controlled entities
Deferred tax assets
Total Assets
96,228
331,518
-
-
87,113
23,105
2,957
17,119
5,106
(57,074)
506,072
115,776
94
212,098
9,959
5,766
347,243
-
-
4,888
863
92,864
25
23,130
2,480
27
5,463
601
17,720
331
79
5,516
(57,074)
134,034
6,854
646,960
Segment liabilities
Deferred tax liabilities
Total Liabilities
(90,633)
(88)
(90,720)
(231,282)
(1,046)
(232,328)
-
-
(41,680)
(4,700)
(46,380)
(14,314)
(137)
(14,451)
(2,740)
(7)
(2,747)
(26,178)
(26,178)
(397,892)
(6,010)
(403,902)
(242)
(1)
(243)
9,176
(31)
9,145
29
March 2013 (Unaudited)
(in million pesos)
Water Utilities
Electronics
Inform ation
Technology
and BPO
Services
-
3,490
38
6,704
-
353
-
135
-
3,047
39
106
31,889
-
217
217
217
217
69
49
1,245
4,891
1,845
3,046
416
1,101
325
1,204
-
(123)
16
0
246
377
(131)
4
6
5
(146)
(2)
77
(3)
207
155
52
22
1
29
5
1
82
3,174
3,125
49
9
14
26
(17)
89
76
13
(17)
10
20
3,913
807
1,456
38,065
25,904
12,161
2,445
1,083
1,708
6,925
Financial
Telecom
Parent Real Estate Services and
Com pany and Hotels Bancassurance m unications
INCOME
Sales to external customers
Intersegment
Equity in net earnings of associates
and joint ventures
Interest income
Other income
Total incom e
Operating Expenses
Operating profit
Interest expense and other financing charges
Other charges
Provision for income tax
Net incom e
18
32
(5)
260
(18)
287
537
(250)
947
0
73
(1,270)
18,142
(215)
-
69
418
101
18,515
13,025
5,490
1,033
1,272
3,185
3,683
3,683
3,683
3,683
3
49
6,756
6,764
(8)
31
(24)
8
(23)
International
Autom otive Intersegm ent
and Others
Elim inations
Consolidated
Decem ber 2013 (Audited)
(in million pesos)
Other inform ation
Segment Assets
Investments in associates
and joint ventures
Deferred tax assets
Total Assets
112,147
308,789
-
-
85,277
21,240
6,751
9,926
4,512
(75,296)
473,346
102,349
94
214,590
9,319
5,485
323,593
-
-
4,708
821
90,806
29
21,269
2,504
3
9,258
590
10,516
334
82
4,928
(75,296)
119,804
6,514
599,664
Segment liabilities
Deferred tax liabilities
Total Liabilities
(83,315)
(83)
(83,398)
(211,065)
(1,307)
(212,372)
-
-
(40,646)
(4,759)
(45,405)
(12,642)
(138)
(12,780)
(2,309)
(11)
(2,320)
(9,862)
(9,862)
(357,847)
(6,347)
(364,194)
(120)
(2)
(122)
2,112
(47)
2,065
30
20. Financial Instruments
Fair Value of Financial Instruments
The following methods and assumptions are used to estimate the fair value of each class of
financial instrument for which it is practicable to estimate such value:
Financial assets at FVPL - Fair values of investment securities are based on quoted prices as of
the reporting date. For other investment securities with no reliable measure of fair value, these
are carried at its last transaction price.
Derivative instruments - The fair value of the freestanding currency forwards is based on
counterparty valuation. The embedded call and put options of IMI were valued using the binomial
option pricing model. This valuation technique considers the probability of PSi's share price, which
is based on a 5-year discounted cash flow valuation, to move up or down depending on the
volatility, the risk free rate and exercise price that is based on a 12-month trailing EBITDA.
Valuation inputs such as discount rates were based on credit adjusted interest rates while interest
rate volatility was computed based on historical rates or data.
Noncurrent trade and nontrade receivables - The fair values are based on the discounted value of
future cash flows using the applicable rates for similar types of instruments.
AFS quoted equity investments - Fair values are based on the quoted prices published in
markets.
AFS unquoted equity investments - Fair value of equity funds are based on the net asset value
per share. For other unquoted equity shares where the fair value is not reasonably determinable
due to the unpredictable nature of future cash flows and the lack of suitable method of arriving at
a reliable fair value, these are carried at cost less impairment, if any.
AFS unquoted debt investments - Fair values are based on the discounted value of future cash
flows using the applicable rates for similar types of instruments.
Accounts payable and accrued expenses, customers’ deposits, short-term debt and current
portion of long-term debt and service concession obligation - The fair values of accounts payable
and accrued expenses and short-term debt approximate the carrying amounts due to the shortterm nature of these transactions.
Customers’ deposits - non-current - The fair values are estimated using the discounted cash flow
methodology using the Group’s current incremental borrowing rates for similar borrowings with
maturities consistent with those remaining for the liability being valued.
The fair value of noncurrent other financial liabilities (fixed rate and variable rate loans repriced on
a semi-annual/annual basis and deposits) are estimated using the discounted cash flow
methodology using the current incremental borrowing rates for similar borrowings with maturities
consistent with those remaining for the liability being valued.
For variable rate loans that reprice every three months, the carrying value approximates the fair
value because of recent and regular repricing based on current market rates.
Fair Value Hierarchy
The Group uses valuation techniques that are appropriate in the circumstances and for which
sufficient data are available to measure fair value, maximizing the use of relevant observable
inputs and minimizing the use of unobservable inputs.
All assets and liabilities for which fair value is measured or disclosed in the consolidated financial
statements are categorized within the fair value hierarchy, described as follows, based on the
lowest level input that is significant to the fair value measurement as a whole:
•
•
Level 1 - Quoted (unadjusted) market prices in active markets for identical assets and
liabilities.
Level 2 - Valuation techniques for which the lowest level input that is significant to the fair
value measurement is directly or indirectly observable.
31
•
Level 3 - Valuation techniques for which the lowest level input that is significant to the fair
value measurement is unobservable.
For assets and liabilities that are recognized in the consolidated financial statements on a
recurring basis, the Group determines whether transfers have occurred between Levels in the
hierarchy by reassessing categorization (based on the lowest level input that is significant to the
fair value measurement as a whole) at the end of each reporting period. As of March 31, 2014,
there were no transfers made by the Group.
Financial Risk Management
General
Risk is inherent in our business; thus, the effective management of risk is vital to the strategic and
sustained growth of the Company and the Ayala Group.
The Ayala Group adopts a formal risk management process as an essential element of sound
corporate governance and an integral part of good management practice. It is designed primarily
to have a structured and disciplined approach of aligning strategy, processes, people, technology,
and knowledge with the purpose of evaluating and managing the uncertainties the Group faces as
it creates value for all stakeholders.
Enterprise Risk Management (ERM) policies and programs are in place, in accordance with an
internationally recognized standards and framework. These are periodically reviewed and
improved to adapt to changes in the business and operating environment, and be responsive to
emerging and changing risks. The risk management framework encompasses the identification
and assessment of risks drivers; measurement of risks impact; formulation of risk management
strategies; assessment of risk management capabilities required to implement risk management
strategies; design and implementation of risk management capability-building initiatives; and
monitoring and evaluating the effectiveness of risk mitigation strategies and management
performance. And as a continuous process, areas and opportunities for improvement in the risk
management process are identified. Also included in the continuous improvement program, the
Group aims to strengthen its ERM practices and benchmark with industry best practices to ensure
they remain relevant, effective, and a key enabler in the achievement of business strategies and
objectives.
Our Chief Risk Officer (CRO) is the ultimate champion of enterprise risk management of the
Group and oversees the entire risk management function. The Group Risk Management Unit
provides support to the CRO and drives the implementation and continuous improvement of the
risk management process. The Unit also provides oversight and assistance to the Ayala group of
companies’ risk management functions.
The Audit and Risk Committee provides oversight to the risk management process in compliance
with the Audit and Risk Committee Charter. The CRO and the Group Risk Management Unit
submit risk management reports to the committee on a quarterly basis, focusing on the
implementation of risk management strategies and action plans for the identified top risks of the
Ayala group, any emerging risks, and developments in risk management. The CRO and the
Group Risk Management Unit report the same to the Ayala Corp and Ayala Group Mancom at
least twice a year.
The Board monitors the effectiveness of risk management through the regular updates on
strategic and operational risks facing the Group from management and reports from the Audit and
Risk Committee. The company’s internal auditors monitor the compliance with risk management
policies to ensure that an effective control environment exists within the entire Ayala group.
The Ayala Group continues to monitor and manage its financial risk exposures in accordance with
Board approved policies. The succeeding discussion focuses on Ayala Group’s financial risk
management.
Financial Risk Management Objectives and Policies
The Group’s principal financial instruments comprise financial assets at FVPL, AFS financial
assets, bank loans, corporate notes and bonds. The financial debt instruments were issued
primarily to raise financing for the Group’s operations. The Group has various financial assets
32
such as cash and cash equivalents, short-term investments, accounts and notes receivables and
accounts payable and accrued expenses which arise directly from its operations.
The Group’s main risks arising from the use of financial instruments are interest rate risk, foreign
exchange risk, price risk, liquidity risk, and credit risk. The Group also enters into derivative
transactions, the purpose of which is to manage the currency risks arising from its financial
instruments.
The Group’s risk management policies are summarized below:
Interest Rate Risk
The Group’s exposure to market risk for changes in Interest rates relates primarily to the
Company’s and its subsidiaries’ long-term debt obligations. The Group’s policy is to manage its
interest cost using a mix of fixed and variable rate debt.
Foreign Exchange Risk
The Group’s foreign exchange risk results primarily from movements of the Philippine Peso (P
=)
against foreign currencies. The Group may enter into foreign currency forwards and foreign
currency swap contracts in order to hedge its foreign currency obligations.
The second and third columns of the table below summarizes the Group’s exposure to foreign
exchange risk as of March 31, 2014. The fourth and fifth columns of the table demonstrates the
sensitivity to a reasonably possible change in the peso exchange rate, with all variables held
constant, of the Group’s profit before tax (due to changes in the fair value of monetary assets and
liabilities) and the Group’s equity (in thousands).
March 31, 2014
Foreign currency
United States Dollar (USD)
Japanese Yen (JPY)
Chinese RMB (RMB)
Net asset
(liabilities)
PHP
equivalent
(430,685)
(19,301,130)
(8,991,926)
(3,933,753)
203,403
1,481,693
31,192
1,105,405
1,963
121,066
53,827
310,907
Vietnam dong (VND)
27,993,910
59,921
Czech Koruna (CZK)
(38,357)
(86,292)
4,143
56,343
39,342
134,825
Singapore Dollar (SGD)
Euro (EUR)
Hongkong Dollar (HKD)
Malaysian Rupee (MYR)
Mexican Peso (MXN)
Increase
(decrease) in
Peso per foreign
currency
1.00
(1.00)
1.00
(1.00)
1.00
(1.00)
1.00
(1.00)
1.00
(1.00)
1.00
(1.00)
1.00
(1.00)
1.00
(1.00)
1.00
(1.00)
1.00
(1.00)
Increase
(decrease) in
profit before
tax
(430,685)
430,685
(8,991,926)
8,991,926
203,403
(203,403)
31,192
(31,192)
1,963
(1,963)
53,827
(53,827)
27,993,910
(27,993,910)
(38,357)
38,357
4,143
(4,143)
39,342
(39,342)
There is no other impact on the Group’s equity other than those already affecting the net income.
Equity price risk
AFS financial assets are acquired at certain prices in the market. Such investment securities are
subject to price risk due to changes in market values of instruments arising either from factors
specific to individual instruments or their issuers, or factors affecting all instruments traded in the
market. Depending on several factors such as interest rate movements, the country’s economic
performance, political stability, and domestic inflation rates, these prices change, reflecting how
market participants view the developments. The Group’s investment policy requires it to manage
33
such risks by setting and monitoring objectives and constraints on investments; diversification
plan; and limits on investment in each sector and market.
Liquidity Risk
Liquidity risk is defined by the Group as the risk of losses arising from funding difficulties due to
deterioration in market conditions and/or the financial position of the Group that make it difficult to
raise the necessary funds or that forces the Group to raise funds at significantly higher interest
rates than usual.
This is also the possibility of experiencing losses due to the inability to sell or convert marketable
securities into cash immediately or in instances where conversion to cash is possible but at loss
due to wider than normal bid-offer spreads.
The Group seeks to manage its liquidity profile to be able to service its maturing debts and to
finance capital requirements. The Group maintains a level of cash and cash equivalents deemed
sufficient to finance operations. As part of its liquidity risk management, the Group regularly
evaluates its projected and actual cash flows. It also continuously assesses conditions in the
financial markets for opportunities to pursue fund-raising activities. Fund-raising activities may
include bank loans and capital market issues, both on-shore and off-shore.
Credit Risk
Credit risk is the risk that the Group’s counterparties to its financial assets will fail to discharge
their contractual obligations. The Group’s holding of cash and short-term investments and
receivables from customers and other third parties exposes the Group to credit risk of the
counterparty. Credit risk management involves dealing with institutions for which credit limits
have been established. The Group’s Treasury Policy sets credit limits for each counterparty. The
Group trades only with recognized, creditworthy third parties. The Group has a well-defined credit
policy and established credit procedures.
21. Related Party Transactions
Parties are considered to be related if one party has the ability, directly or indirectly, to control the
other party or exercise significant influence over the other party in making financial and operating
decisions. Parties are also considered to be related if they are subject to common control or
common significant influence which include affiliates. Related parties may be individuals or
corporate entities.
There has not been any material transaction during the last two years, or proposed transaction, to
which Ayala was or is to be a party, in which any of its Directors or Executive Officers, any
nominee for election as a Director or any security holder identified in this condensed interim
financial information had or is to have a direct or indirect material interest.
The Group, in its regular conduct of business, has entered into transactions with Associates, Joint
Ventures and other related parties principally consisting of advances, loans and reimbursement of
expenses, purchase and sale of real estate properties, various guarantees, construction
contracts, and development, management, underwriting, marketing and administrative service
agreements. Sales and purchases of goods and services as well as other income and expense to
and from related parties are made at normal market prices and terms.
Highlights of related party transactions follow:
Transactions with BPI
The Group maintains current and savings account, money market placements and other shortterm investments with BPI amounting to P
= 41.2 billion and P
= 38.5 billion, as of March 31, 2014
(unaudited) and December 31, 2013 (audited), respectively. The March 31, 2014 balance
includes P
= 8.5 billion or US$190 million placement of AYC Finance with BPI. It also has shortterm and long-term debt payable to BPI amounting to P
= 32.6 billion and P
= 23.2 billion as of March
31, 2014 (unaudited) and December 31, 2013 (audited), respectively. The March 31, 2014
balance includes P
= 8.0 billion loans obtained by AC parent company in Q1 2014. The loans have
various maturities from 2013 up to 2018 and bear interest at varying prevailing market rates.
34
Receivables from Related Parties
The Group has P
= 2,765.0 million and P
= 3,145.5 million receivables from related parties as of March
31, 2014 (unaudited) and December 31, 2013 (audited) respectively. The balances pertain
mostly to interest and non-interest bearing advances with various maturities from 30 days to two
(2) years. Advances include certain residential development projects which become due as soon
as the projects are completed. The receivables also include certain trade receivables arising from
automotive and other sales.
This account also includes other receivables relating to
reimbursement of operating expenses like management fees, among others. The trade and other
receivables are unsecured, interest free, will be settled in cash and are due and demandable.
Receivables from Officers and Employees
The Group has P
= 279.0 million and P
= 507.0 million receivables from officers and employees as of
March 31, 2014 (unaudited) and December 31, 2013 (audited), respectively. These pertain to
housing, car, salary and other loans granted to the Group’s officers and employees, which are
collectible through salary deduction, are interest bearing ranging from 6.0% to 13.5% per annum
and have various maturity dates ranging from 2014 to 2026.
Payables to Related Parties
The Group has payables to various related parties amounting to P
= 6,281.0 million and P
= 4,107.0
million as of March 31, 2014 (unaudited) and December 31, 2013 (audited), respectively. These
payables include: a) cost of lots for joint development projects; b) purchased parts and
accessories and vehicles; and c) advances and reimbursements for operating costs. These are
all interest-free, unsecured, will be settled in cash. Maturities of these payables range from 15
days to one year, with some accounts due and demandable.
Income and Expenses
The group realized total income of P
= 117.7 million from related parties and incurred total expenses
of P
= 114.7 million for the period ending March 31, 2014. These consist of, among others, income
from real estate, automotive sales, professional services and interest/financing as well as
expenses on interest, water utilities, communications and professional fees.
35
Item 2 - MANAGEMENT’S DISCUSSION AND ANALYSIS OF FINANCIAL CONDITION AND
RESULTS OF OPERATIONS
Ayala Corporation’s consolidated income in the first quarter of 2014 reached P44.7 billion, 17% higher
than the same period in 2013. Sale of goods and rendering services accounted for 83% of total
income during the quarter and amounted to P37.1 billion, up 16% year-on-year. This was mainly
driven by the improved sales performance of Ayala Land, Inc. which reported strong revenue growth
across all its business segments. The robust increase in revenues of Integrated Microelectronics,
Inc.’s (IMI) driven by the improvement in demand across its China, Europe, Mexico, and Philippine
operations, and slightly higher revenues from Manila Water Co. also drove sale of goods and services
higher.
Attributable consolidated net income rose by 22% in the first quarter of the year to P5.5 billion from
P4.5 billion in the same period last year.
Real Estate
Ayala Land maintained solid growth. Total revenues for the first quarter reached P22.7 billion, a 23%
increase year-on-year. Property development revenues which amounted to P13.5 billion accounted
for 59% of total revenues. This was driven mainly by higher residential sales as demand remained
strong. Residential sales rose by 36% to P11.2 billion as a result of higher bookings and steady
project completion. Commercial leasing revenues also increased strongly by 29% to P5.3 billion. The
launch of new malls and offices combined with higher average effective rent underpinned the growth.
Revenues from hotels and resorts, which grew by 47%, also contributed to recurring lease revenues.
Strong top-line growth coupled with stable margins across products resulted in a 25% increase in net
income to P3.5 billion.
Water
Manila Water posted revenues of P3.8 billion, 5% higher year-on-year. Cost of services and operating
expenses increased by 8% due to higher utility and manpower costs. This put earnings before income
taxes, depreciation, and amortization to P2.8 billion, 4% higher year-on-year. Net income for the
quarter grew by 7% to P1.4 billion. New concessions outside the East Zone continued to post
significant earnings with Laguna Water doubling net income year-on-year, Boracay Water up 57%,
and Clark Water reporting stable earnings.
Electronics
IMI posted a 25% growth in revenues year-on-year to US$206 million due to improved sales from its
China, Europe, and Philippine operations. Improved operations, particularly in China, were a result of
increased demand from customers in the telecommunications infrastructure market. IMI China
contributed 36% of revenues, up 29% versus last year. Europe and Mexico operations also grew
robustly by 22% year-on-year, while revenues from the Philippine operations increased by 29%.
Higher sales and improved production efficiency resulted in a seventeen-fold increase in net income
to US$5 million during the quarter.
Share of Profit of Associates and Joint Ventures
Share of profit of associates and joint ventures during the period amounted to P3.1 billion, 20% lower
year-on-year mainly due to lower equity earnings from the banking unit, Bank of the Philippine Islands
(BPI). BPI reported lower net income in the first quarter this year in the absence of significant trading
gains during the period compared to the first quarter last year.
Banking
BPI posted a net income of P3.6 billion for the first quarter, 57% lower than last year’s P8.4 billion as
the bank recorded significant trading gains last year. Its core banking business, however, continued to
grow strongly with net interest income up 15% year-on-year to P8.1 billion. Non-interest income,
excluding trading gains, also grew healthily by 16% year-on-year to P4.3 billion. The bank’s core
lending and deposit businesses experienced strong growth. Net loans increased by 25% to P642
billion while total deposits reached P993 billion, a 32% increase against the prior year.
Notwithstanding the increase in the bank’s loan portfolio, the bank’s gross 90-day non-performing
36
loan ratio dropped to 1.89% during the quarter. The bank’s capital adequacy ratio remains strong at
15.7% following the company’s P25 billion stock rights issue in January 2014.
Telecommunications
Telecom unit, Globe Telecom, maintained its revenue growth momentum in the first quarter.
Consolidated service revenues grew by 9% to P23.2 billion with growth evident across all business
lines. Mobile revenues rose by 8% on the back of broad-based subscriber growth. Total mobile
subscribers as of the end of the quarter reached nearly 41 million, 16% higher than first quarter 2013
level. Continued demand for data has driven growth across mobile data services, broadband, and
fixed line data segments. Broadband revenues also increased by 12% year-on-year. The strong
revenue growth was offset by the increase in operating expenses which kept EBITDA stable at P8.8
billion. Globe’s reported net income increased 4.5 times to P2.9 billion as accelerated depreciation
charges declined significantly during the period compared to the first quarter of 2013 as network
modernization was substantially completed last year. Excluding the impact of accelerated
depreciation charges, core net income was up 9% to P3.4 billion from P3.1 billion in the first quarter of
2013.
Interest Income
Higher investible funds following the fund raising activities of the parent company and Ayala Land
resulted in higher interest income during the period which increased by 73% to P1.4 billion.
Costs and Expenses
Consolidated cost of sales and rendering services increased by 18% to P27 billion in line with the
growth in sales. Consolidated general and administrative expenses increased by 21% to P3.7 billion,
mainly due to higher manpower costs across Ayala Land, IMI, and operating costs at the Auto group
related to the start-up of the Volkswagen operations.
Interest Expense and Other Financing Charges
Consolidated interest expense and other financing charges increased by 18% to P2.9 billion mainly
due to higher debt levels as of year-end 2013 and additional borrowings in the first quarter of 2014.
As of March 2014, total debt increased by 15% from year-end 2013 as Ayala Land incurred new loans
for landbanking and expansion purposes. At the parent level, debt also increased to fund new
business initiatives in the energy and transport infrastructure sectors and the investment in the
banking unit. Total debt as of end March 2014 was at P237 billion. Notwithstanding the higher debt
levels, gearing ratios remain comfortable and well within limits with Ayala Land’s consolidated debt to
equity ratio at 1.1 to 1 and Ayala Corp. consolidated debt to equity ratio at 1.59 to 1.
Balance Sheet Highlights
Consolidated cash and cash equivalents increased by 17% to P77.3 billion from the year-end 2013
level of P65.8 billion. This was mainly due to new borrowings drawn by Ayala Corp parent company,
Ayala Land’s subsidiaries, as well as Manila Water in the first quarter of the year.
Other current assets increased by P3.3 billion to P149 billion. This was due to higher accounts
receivables from Ayala Land as revenues increased by 15%. Inventories also increased as new
residential units were completed. IMI likewise registered an increase in accounts receivables and
inventories from its China and Philippine operations.
Total non-current assets rose by 8% to P420 billion from P388 billion at the beginning of the year.
This was primarily due to the increased investment of Ayala Corp in BPI through the stock rights,
investments in various power projects, Ayala Land’s increased investment in land acquisitions as well
as additional investments in real properties.
On the liabilities side, total short term and long-term debt reached P237 billion, 15% higher than yearend 2013 level of P205.7 billion. This was due to new draw downs from credit facilities by Ayala Corp
at the parent level as well as higher borrowings by Manila Water and Ayala Land’s subsidiaries to
fund its on-going projects.
Total stockholders’ equity reached P243 billion, P7.6 billion higher than the start of the year mainly as
a result of higher earnings during the period.
37
Consolidated current ratio and debt to equity ratio remained healthy at 1.4x and 1.6x, respectively as
of the end of March 2014. Consolidated net debt to equity ratio was at 1.07 to 1 while net debt to
equity at the parent level was at 0.43 to 1.
Key Performance indicators:
For the balance sheet items (current ratio and debt to equity ratios), the Company aims to maintain for
its current ratio not to be lower than 0.5:1 and for its debt to equity ratio not to exceed 3:1. The
company and its subsidiaries' ratios are considered better than these levels as a result of responsive
yet prudent debt management policies.
The key performance indicators (consolidated figures) that the Group monitors are the following:
March 2014
December 2013
Formula
(Unaudited)
(Audited)
Cash/ Cash equivalents + Short-term cash investments
Current Liabilities
0.48
0.45
Current assets
Current liabilities
1.40
1.46
0.02
0.02
Ratio
Liquidity Ratio
Current ratio
Solvency Ratio
After-Tax Net Profit + (Depreciation + Amortization)+
Provision for Bad Debts
Total Liabilities
*
Debt-to-Equity Ratio
Long-term Loans + Short Term Loans
Equity Attributable to Owners of the Parent
1.59
1.43
Assets- to-Equity Ratio
Total Assets
Equity Attributable to Owners of the Parent
4.34
4.18
EBITDA
Interest Expense
5.38
5.41
*
Net Income to Owners of the Parent
Common Equity Attributable to Owners of the Parent
(Average)
4.0%
3.7%
*
Net Income
Total Assets
1.3%
1.3%
*
Interest Rate Coverage Ratio
Return on Common Equity
Return on Assets
* Based on Unaudited March 31, 2013.
2.1 Any known trends or any known demands, commitments, events or uncertainties that will result
in or that are reasonably likely to result in the registrant’s liquidity increasing or decreasing in any
material way. The following conditions shall be indicated: whether or not the registrant is having
or anticipates having within the next twelve (12) months any cash flow or liquidity problems;
whether or not the registrant is in default or breach of any note, loan, lease or other
indebtedness or financing arrangement requiring it to make payments; whether or not a
significant amount of the registrant’s trade payables have not been paid within the stated trade
terms.
The Group does not expect any liquidity problems and is not in default of any financial obligations.
The Group complied with the existing loan covenants and restrictions as of March 31, 2014.
2.2 Any events that will trigger direct or contingent financial obligation that is material to the company,
including any default or acceleration of an obligation:
None
38
2.3 Any material off-balance sheet transactions, arrangements, obligations (including contingent
obligations), and other relationships of the company with unconsolidated entities or other persons
created during the reporting period:
None
2.4 Any material commitments for capital expenditures, the general purpose of such commitments,
and the expected sources of funds for such expenditures.
For 2014, Ayala Corporation earmarked P49 billion in capital expenditures at the parent level to
continue its investment programs in its core holdings and new businesses. Nearly half of this
amount will be used to fund the Company’s additional stake in the BPI which it has acquired over
the past two years. Thirty percent is allocated to its power investments, while 6% is allotted to its
transport infrastructure portfolio. The rest is set aside for other investments, including auto and
education.
As of the first three months of the year, Ayala has spent 57% of the P49 billion, a significant
portion of which was used to support its investments in BPI and ACEHI. The capital expenditures
will be funded through a combination of internally-generated cash and debt.
For the year 2014, Ayala Land‘s consolidated budget for project and capital expenditures amount
to P70.0 billion. This will be financed through a combination of internally-generated funds,
borrowings and pre-selling.
For the first three months of 2014, consolidated project and capital expenditures amounted to
P16.4 billion, about 23% of the projected P70.0 billion budget for the whole year. About 54% was
spent for residential projects, 29% for land acquisition, 12% for shopping centers, 2% for offices,
1% for hotels and resorts, with the balance spent on support businesses. For the reporting
period, capital spending was approved for the development of High Street South Corporate
Center in Bonifacio Global City and Elaro in Nuvali.
MWCI targets to spend around P
= 5 billion capital expenditures in 2014 for the rehabilitation and
construction of facilities to improve water and sewer services in the East Zone Service Area,
subject to rate rebasing review and government approvals. Capital Expenditures will be funded
from the current cash reserves, internal funds generation and proceeds of available loan facilities.
2.5 Any known trends, events or uncertainties that have had or that are reasonably expected to have
a material favorable or unfavorable impact on net sales or revenues or income from continuing
operations should be described.
The Company’s and its subsidiaries’ performance will continue to hinge on the overall economic
performance of the Philippines and other countries where its subsidiaries operate. Interest rate
movements may affect the performance of the real estate, banking and automotive groups,
including the Company.
2.6 Any significant elements of income or loss that did not arise from the registrant's continuing
operations
None
2.7 There were no material changes in estimates of amounts reported in prior interim period of the
current financial year and interim period of the prior financial year, respectively.
None
2.8 Causes for any material changes
(Increase or decrease of 5% or more in the financial statements)
Balance Sheet Items
As of March 31, 2014 (Unaudited) vs. December 31, 2013 (Audited)
Cash and cash equivalents – 5% increase from P
= 65,655 million to P
= 68,695 million
Increase attributable to the Company, ALI, MWCI and AYC Finance’s proceeds from loan
availments and LiveIt’s proceeds from divestment of Stream. These were offset by the Group’s
39
loan payments, additional shares subscription in BPI and infusion in power initiatives.
account is at 11% of the total assets as of March 31, 2014 and December 31, 2013.
This
Short-term investments – 70 times higher from P
= 119 million to P
= 8,587 million
Increase due to proceeds from LiveIt’s divestment of Stream. This account is at 1% and less than
1% of the total assets as of March 31, 2014 and December 31, 2013, respectively.
Accounts and notes receivable (current) – 5% increase from P
= 56,341 million to P
= 58,953 million
Mainly due to higher sales from across residential brands, new project launches and existing
project sales of ALI group and significant growth of revenues from all sites of IMI group. This
account is at 9% of the total assets as of March 31, 2014 and December 31, 2013.
Noncurrent asset held for sale – 100% decrease from P
= 3,329 million to zero balance
Due to the LiveIt’s divestment of Stream in March 2014.
Investments in bonds and other securities – 326% increase from P
= 2,785 million to P
= 11,850 million
Mainly attributable to investments made by the Group, through AIHL, in GNPower. This account
is at 2% and less than 1% of the total assets as of March 31, 2014 and December 31, 2013,
respectively.
Land and improvements – 8% increase from P
= 62,475 million to P
= 67,219 million
Increase due to ALI group’s unsubdivided land and certain land acquisitions. This account is at
10% of the total assets as of March 31, 2014 and December 31, 2013.
Investments in associates and joint ventures – 12% increase from P
= 119,804 million to P
= 134,034
million
Mainly attributable to Group’s additional shares subscription in BPI through stock rights offering
and infusion in power projects. This account is at 21% and 20% of the total assets as of March
31, 2014 and December 31, 2013, respectively.
Deferred tax asset - 5% increase from P
= 6,514 million to P
= 6,854 million
Increase mainly attributable to ALI group’s higher deferred tax asset. This account is at 1% of the
total assets as of March 31, 2014 and December 31, 2013.
Pension and other noncurrent assets - 60% increase from P
= 8,016 million to P
= 12,864 million
Increase mainly attributable to ALI group’s higher pre-operating expenses and down payments
pertaining to new projects. The account also includes the Group’s pension asset.1 This account
is at 2% and 1% of the total assets as of March 31, 2014 and December 31, 2013, respectively.
= 103,604 million to P
= 119,607
Accounts payable and accrued expenses - 15% increase from P
million
Increase mainly caused by higher trade payables and accruals of ALI group for its additional and
existing projects. Also attributed to the increase is the higher trade payables and accruals by
MWCI and IMI groups pertaining to their expanded operations. This account is at 30% and 28%
of the total liabilities as of March 31, 2014 and December 31, 2013, respectively.
Short-term debt – 25% increase from P
= 15,811 million to P
= 19,834 million
Mainly due to the additional loans made by ALI group. This account is at 5% and 4% of the total
liabilities as of March 31, 2014 and December 31, 2013, respectively.
Income tax payable – 42% increase from P
= 1,668 million to P
= 2,370 million
Due to higher tax payable by ALI and MWCI groups. As a percentage to total liabilities, this
account is at less than 1% as of March 31, 2014 and December 31, 2013.
1
The Company's pension fund is known as the AC Employees Welfare and Retirement Fund (ACEWRF). ACEWRF is a
legal entity separate and distinct from the Company, governed by a board of trustees appointed under a Trust Agreement
between the Company and the initial trustees. It holds common and preferred shares of the Company in its portfolio. All
such shares have voting rights under certain conditions, pursuant to law. ACEWRF's portfolio is managed by certain
persons that are beneficiaries of the fund, appointed by the fund's trustees for that purpose. These persons have the
ability to exercise voting rights over the shares in its holdings. These persons are Delfin C. Gonzalez, Jr. (who is the
Company's Managing Director & Chief Finance Officer) and Solomon M. Hermosura (who is the Company's Managing
Director, Group Head of Corporate Governance, General Counsel, Corporate Secretary & Compliance Officer). ACEWRF
has not exercised voting rights over any shares of the Company that it owns.
40
Other current liabilities – 37% decrease from P
= 10,992 million to P
= 6,914 million
Decrease pertains mainly to ALI group’s lower payable to various contractors, deposits from
residential assets and retention payable from projects. This account is at 2% and 3% of the total
liabilities as of March 31, 2014 and December 31, 2013, respectively.
Long-term debt (noncurrent) – 15% increase from P
= 178,027 million to P
= 205,163 million
Mainly due to new borrowings made by the Company, through AYC Finance, to fund investments
in power; loan availments made by ALI and MWCI groups for expansion projects; and directly by
the Company to fund additional subscription in BPI . This account is at 51% and 49% of the total
liabilities as of March 31, 2014 and December 31, 2013, respectively.
Deferred tax liabilities – 5% decrease from P
= 6,347 million to P
= 6,010 million
Decrease attributable to ALI group’s amortization of capitalized DST and other incidental
expenses. This account stood at less than 2% of the total liabilities as of March 31, 2014 and
December 31, 2013.
Pension liabilities – 45% decrease from P
= 1,915 million to P
= 1,050 million
Mainly due to ALI group’s lower pension liabilities. This account stood at less than 1% of the total
liabilities as of March 31, 2014 and December 31, 2013.
Other noncurrent liabilities – 12% decrease from P
= 24,828 million to P
= 21,799 million
Decrease mainly attributable to ALI group’s deposits on completed construction projects. This
account is at 5% and 7% of the total liabilities as of March 31, 2014 and December 31, 2013,
respectively.
Cumulative translation adjustments - 79% increase (improved) from negative P
= 1,257 million to
negative P
= 260 million
Mainly due to higher foreign exchange translation of foreign denominated net assets held by the
international operations group (due to depreciation of Peso from P
= 44.395 in December 2013 to P
=
44.815 in March 2014).
Net unrealized gain on available-for-sale financial assets (including remeasurement gains/losses
on defined benefit plans) – 70% decrease from P
= 1,040 million to negative P
= 1,769 million
Mainly due to movement in the market value of securities held by BPI group. The balance
includes P1,318 million remeasurement gain (losses) on defined benefit plans of the Group.
Retained earnings – 6% increase from P
= 92,640 million to P
= 98,111 million
Mainly due to share in YTD 2014 group net income.
Income Statement items
For the Period Ended March 31, 2014 (Unaudited) vs. March 31, 2013 (Unaudited)
Sale of goods – 14% increase from P
= 21,243 million to P
= 24,206 million
Mainly on account of new projects and improved sales performance of ALI group and higher
revenues across all sites of IMI group. As a percentage to total income, this account is at 54%
and 56% in March 31, 2014 and 2013, respectively.
Rendering of services – 21% increase from P
= 10,646 million to P
= 12,927 million
Improved sales performance of ALI (malls, office leasing & hotel operations specifically sales
generated by its newly acquired subsidiary), MWCI (increase in billed volume and additional
connections) and IMI (growth of customer demand) groups. As a percentage to total income, this
account is at 29% and 28% in March 31, 2014 and 2013, respectively.
Share of profit of associates and joint ventures – 20% decrease from P
= 3,913 million to P
= 3,146
million
Decrease mainly due to lower earnings of BPI group in the absence of trading gains realized in
2013. As a percentage to total income, this account is at 7% and 10% in March 31, 2014 and
2013, respectively.
Interest income – 73% increase from P
= 807 million to P
= 1,399 million
Mainly due to higher cash balance resulting from the Group’s additional loan availments, interest
income on installment sales and proceeds from divestment in Stream. This account is at 3% and
2% of the total income in March 31, 2014 and 2013, respectively.
41
Other income – 106% increase from P
= 1,455 million to P
= 2,997 million
Mainly due to LiveIt’s P1.8B gain from divestment of Stream offset partially by lower rehabilitation
works of MWCI group. This account is at 7% and 4% of the total income in March 31, 2014 and
2013, respectively.
Cost of sales – 12% increase from P
= 16,574million to P
= 18,650million
Increase attributable to higher sales of ALI and IMI groups. As a percentage to total costs and
expenses, this account is at 54% and 56% in March 31, 2014 and 2013, respectively.
Cost of rendering services – 33% increase from P
= 6,221 million to P
= 8,307 million
Increase mainly due to higher sales of rendering services and consolidation of new hotels by ALI;
and higher revenues from IMI, MWCI and LiveIt groups. As a percentage to total costs and
expenses, this account is at 24% and 21% in March 31, 2014 and 2013, respectively.
General and administrative expenses – 21% increase from P
= 3,109 million to P
= 3,763 million
Increase mainly on account of higher manpower expenses of ALI, IMI and LiveIt groups as well as
operating cost of start-up entity of automotive group. This expense classification accounts for
11% of the total costs and expenses in March 31, 2014 and 2013.
Interest and other financing charges – 18% increase from P
= 2,445 million to P
= 2,879 million
Increase mainly due to higher loan balance as a result of fundraising activities in late 2013 and
new borrowings in 2014 of the Company (for initiatives for new growth areas like Energy and
Transport Infrastructure sectors) and ALI group (for landbanking and expansion of various mixed
use projects). This expense classification accounts for 8% of the total costs and expenses in
March 31, 2014 and 2013.
Other charges – 43% decrease from P
= 1,083 million to P
= 616 million
Decrease mainly due lower rehabilitation costs of MWCI group. This expense classification
accounts for 2% and 4% of the total costs and expenses in March 31, 2014 and 2013,
respectively.
Provision for income tax – 5% increase from P
= 1,708 million to P
= 1,786 million
Primarily due to higher taxable income of the several subsidiaries significant part of which comes
from ALI and IMI groups on account of better sales and other operating results.
Income attributable to Owners of the parent – 21% increase from P4,507 million to P5,471 million
Mainly due to better operating results of most of the subsidiaries and associates of the Group.
= 2,419 million to P
= 3,201 million
Non-controlling interests – 32% increase from P
Attributable to the favorable performance of the ALI and IMI groups in Q1 2014.
2.9 Any seasonal aspects that had a material effect on the financial condition or results of operations.
Ayala Corporation being a holding company has no seasonal aspects that will have any material
effect on its financial condition or operational results.
ALI’s leasing portfolio generates a fairly stable stream of revenues throughout the year, with
higher sales experienced in the fourth quarter from shopping centers due to holiday spending.
ALI's development operations do not show any seasonality. Projects are launched anytime of the
year depending on several factors such as completion of plans and permits and appropriate
timing in terms of market conditions and strategy. Development and construction work follow
target completion dates committed at the time of project launch.
MWCI group does not have any significant seasonality or cyclicality in the interim operation,
except for the usually higher demand during the months of April and May.
BPI, IMI and other subsidiaries of the Group do not have seasonal aspects that will have any
material effect to their financials or operations.
42
3.0 Any material events subsequent to the end of the interim period that have not been reflected in
the financial statements for the interim period.
ALI
1. Stockholders’ approval of the following:
a. Amendment of Article Seventh of the Company’s Articles of Incorporation exempting from
pre-emptive rights the issuance of one billion common shares for acquisitions and debt
payments and the issuance of common shares covered by stock options granted to
members of Management Committees of subsidiaries or affiliates.
b. Amendment of the stock option plan to include members of Management Committees of
subsidiaries or affiliates as eligible grantees of stock options.
2. Appointment of Bernard Vincent O. Dy as new President and CEO of ALI.
3. Issuance of P8 billion bonds (first tranche) due 2025 will carry a coupon rate of 5.625%.
4. ALI releases 1st quarter 2014 unaudited financial results.
3.1 Other material events or transactions during the interim period.
ALI
1. Board approval of the following:
a. Amendment of Article Seventh of the Company’s Articles of Incorporation to exclude the
issuance of one billion common shares from the pre-emptive rights of the stockholders, at
a price and under such terms and conditions as may be determined by the Board at the
time of issuance.
b. Further amendment to the Article Seventh of the Company’s Articles of Incorporation to
qualify members of the management committees of the Company’s subsidiaries as
grantees under the employee stock option or ownership plan.
c.
The issuance of bonds of in the amount of up to P15 billion, which are to be registered
with the Securities and Exchange Commission and listed in the Philippine Dealing &
Exchange Corporation, will carry a tenor of up to 11 years. The first tranche will involve
the issuance of P8 billion in bonds with the tenor of 11 years, maturing in 2025, at rate of
5.625% and will be offered to public until April 21, 2014. Proceeds are expected to be
used to partially finance ALIs 2014 capital expenditures which include the construction of
various leasing projects such as Vertis North Mall, BPO and Hotel; Circuit Mall, Retail
Strip and Hotel; and Southpark Mall and BPO.
2. Declaration of cash dividends of P0.20711082 per share to all shareholders as of record date
March 7, 2014, payable on March 21, 2014.
3. ALI signs 50%-50% joint venture agreement with AboitizLand, Inc. for the development of a
15-hectare mixed-use community in Mandaue City, Cebu.
4. ALI assigns to Cebu Holdings, Inc. and Cebu Property Ventures & Development Corporation
rights to subscribe to 10% and 5% of the authorized capital stock of the joint venture company
with AboitizLand, Inc.
5. ALI acquires Mitsubishi Corporation’s 40% stake in Philippine Integrated Energy Solutions,
Inc.
43
PART II – OTHER INFORMATION
1. In January 2014, the Company obtained a 5-year peso loan from BPI amounting to P
= 8 billion.
The loan shall have interest rate per annum equal to the 3-month PDST-R2 plus a spread of sixty
basis points (0.60%) per annum or 95% of the BSP RRP, whichever is higher.
2. On January 3, 2014, the Company paid cash dividends on common shares of P
= 2.40 per share to
common shareholders of record as of December 19, 2013.
3. On March 10, 2014, the Company’s BOD approved the following:
a. Amendment of the Third Article of the Articles of Incorporation of the Company to change the
principal office address of the Company from Metro Manila, Philippines to 32/F to 35/F, Tower
One and Exchange Plaza, Ayala Triangle, Ayala Avenue, Makati City, incompliance with the
Securities and Exchange Commission Memorandum Circular No. 6, Series of 2014.
b. Amendment of Section 2, Article III of our By-Laws, to allow our Board to hold meeting in a
place in Metro Manila other than in our principal office. Our Board approved the amendment
pursuant to its power, delegated by our stockholders in May 1989, to amend our By-Laws.
4. On April 10, 2014, the Finance Committee of the Board of Directors of Ayala Corporation (AC),
pursuant to its authority delegated by the Board, approved this evening the final terms of the
US$300 Million bonds exchangeable for common shares of Ayala Land Inc. (the “Bonds”). The
Bonds will be issued by AYC Finance Limited, a wholly-owned subsidiary of AC, and will be fully
guaranteed by AC.
Subsequent to the approval of the Finance Committee of the final terms of the Bonds, the offering
of the Bonds commenced. The Bonds have been offered outside the United States under
Regulation S of the U.S. Securities Act of 1933 and to qualified institutional investors within the
Philippines in transactions that do not require registration of the Bonds under the Philippine
Securities Regulation Code.
Following is the Parent Company’s press statement:
Ayala Corporation Announces Pricing of US$300,000,000 0.50% Exchangeable Bonds into
Common Shares of Ayala Land, Inc. due 2019
Ayala Corporation (PSE:AC) (the “Company”), one of the largest conglomerates in the
Philippines, announced today the pricing of the offering by AYC Finance Limited, a wholly-owned
and guaranteed subsidiary of Ayala Corporation, of US$300,000,000 aggregate principal amount
of its 0.50% bond due 2019 (the “Bonds”) exchangeable for common shares of Ayala Land, Inc.
(“Ayala Land”). The Bonds have been offered outside the United States under Regulation S of
the U.S. Securities Act of 1933 and to qualified institutional investors within the Philippines in
transactions that do not require registration of the Bonds under the Philippine Securities
Registration Code.
The Bonds will bear interest at a rate of 0.50% per year, payable semiannually. The Bonds will
mature on May 2, 2019, unless earlier exchanged, redeemed or repurchased in accordance with
the terms of the Bonds. The Bonds will be exchangeable at any time on or after June 11, 2014 up
to the close of business on the 10th day prior to the maturity date. The Bonds will initially be
exchangeable at P36.48 per Ayala Land share representing a premium of 20% over Ayala Land’s
closing price on April 10, 2014. On May 2, 2017, the holders of the Bonds will have the right to
require the Company to repurchase for cash all or part of their Bonds at a repurchase price equal
to 100% of the principal amount of the Bonds. Starting May 2, 2017 the Company is able to call
the Bond if the closing price of Ayala Land shares for any 30 consecutive Trading Days is at least
130% of the Exchange Price.
The offering is the first equity-linked international issuance by a Philippine issuer in the past two
years. It has also achieved the lowest cost of financing across Asia ex-Japan in 2014.
The Company intends to use the net proceeds from the issue of the Bonds for general corporate
purposes.
44
The issuance of the offering was completed on May 5, 2014,. The Bonds have been listed and
quoted in the Singapore Exchange effective May 5, 2014.
5. On April 10, 2014, SEC has approved the planned issuance of up to P15-billion fixed rate bonds
of ALI. The bonds offer will be implemented in one or more tranches and sold to general public.
The first tranche will involve the issuance of P8 billion in bonds with the tenor of 11 years,
maturing in 2025, at rate of 5.625% and will be offered to public until April 21, 2014. Proceeds
are expected to be used to partially finance ALIs 2014 capital expenditures which include the
construction of various leasing projects such as Vertis North Mall, BPO and Hotel; Circuit Mall,
Retail Strip and Hotel; and Southpark Mall and BPO.
6. On April 11, 2014, at the annual meeting of the Company’s Stockholders, the stockholders
approved the following:
a. Approval of minutes of the annual stockholders’ meeting held on 19 April 2013.
b. Approval of Corporation’s Annual Report, which consists of the Chairman’s Message,
President’s Report, and the audio-visual presentation to the stockholders, and to approve the
consolidated financial statements of the Corporation and its subsidiaries as of 31 December
2013, as audited by the Corporation’s external auditor SyCip Gorres Velayo & Co.
c.
Ratification of all acts and resolutions of the Board of Directors and Management adopted
during the preceding year.
d. The ratification of the amendments to the Third Article of the Articles of Incorporation to state
our specific principal office address in compliance with the SEC Memorandum Circular No. 6,
series of 2014 to approve the amendment to the Third Article of the Articles of Incorporation in
compliance with Securities and Exchange Commission Memorandum Circular No. 6, series of
2014, so that, as amended, the Third Article shall henceforth read as follows:
THIRD. That the place where the principal office of the Corporation is located is at 32F to
35F, Tower One & Exchange Plaza, Ayala Triangle, Ayala Avenue, Makati City, but it
may establish branch offices in any part of the Philippines or in such other places outside
the Philippines as may be approved by the Board of Directors. (As amended on 11 April
2014).
e. Election of the following as directors effective immediately and until their successors are
elected and qualified:
Jaime Augusto Zobel de Ayala
Fernando Zobel de Ayala
Yoshio Amano
Ramon R. del Rosario, Jr.
Delfin L. Lazaro
Xavier P. Loinaz
Antonio Jose U. Periquet
Messrs. del Rosario, Loinaz and Periquet were elected as independent directors.
f.
Election of SyCip, Gorres, Velayo & Co. as the external auditors of our Company for the fiscal
year 2014.
In the stockholders’ meeting, Jaime Augusto Zobel de Ayala, Chairman and CEO, announced that
the Ayala group plans to spend P187 billion in capital expenditures in 2014.
At its organizational meeting held immediately after the stockholders’ meeting, our Board of
Director elected the following:
a. Board Committees and Memberships:
Executive Committee
Jaime Augusto Zobel de Ayala - Chairman
Fernando Zobel de Ayala - Member
Yoshio Amano - Member
45
Audit and Risk Committee
Xavier P. Loinaz - Chairman
Yoshio Amano - Member
Ramon R. del Rosario, Jr. - Member
Nomination Committee
Ramon R. del Rosario, Jr. - Chairman
Jaime Augusto Zobel de Ayala - Member
Fernando Zobel de Ayala - Member
Antonio Jose U. Periquet - Member
Personnel and Compensation Committee
Ramon R. del Rosario, Jr. - Chairman
Delfin L. Lazaro - Member
Yoshio Amano - Member
Finance Committee
Delfin L. Lazaro - Chairman
Antonio Jose U. Periquet - Member
Jaime Augusto Zobel de Ayala - Member
Committee of Inspectors of Proxies and Ballots
Solomon M. Hermosura – Chairman
Catherine H. Ang – Member
Josephine G. De Asis – Member
b. Officers:
Jaime Augusto Zobel de Ayala
Fernando Zobel de Ayala
Gerardo C. Ablaza, Jr
Cezar P. Consing
Arthur R. Tan
Alfredo I. Ayala
Maria Lourdes Heras-De Leon
John Eric T. Francia
Delfin C. Gonzalez, Jr.
Solomon M. Hermosura
John Philip S. Orbeta
Ginaflor C. Oris
Ma. Cecilia T. Cruzabra
Josephine G. De Asis
June Vee M. Navarro
c.
- Chairman & Chief Executive Officer
- Vice Chairman, President & Chief Operating Officer
- Senior Managing Director
- Senior Managing Director
- Senior Managing Director
- Managing Director
- Managing Director
- Managing Director
- Managing Director & Chief Finance Officer
- Managing Director, General Counsel, Corporate
Secretary & Compliance Officer
- Managing Director
- Managing Director
- Treasurer
- Controller
- Assistant Corporate Secretary
Ayala Group of Companies Management Committee
Jaime Augusto Zobel de Ayala
Fernando Zobel de Ayala
Gerardo C. Ablaza, Jr.
Alfredo I. Ayala
Cezar P. Consing
Ernest Lawrence L. Cu
Maria Lourdes Heras-De Leon
Bernard Vincent O. Dy
John Eric T. Francia
Delfin C. Gonzalez, Jr.
Solomon M. Hermosura
John Philip S. Orbeta
Arthur R. Tan
- Chairman and Chief Executive Officer, Ayala Corporation
- President and Chief Operating Officer, Ayala Corporation
- President, Manila Water Company, Inc.
- President, LiveIt Investments, Ltd.
- President, Bank of the Philippine Islands
- President, Globe Telecom, Inc.
- President, Ayala Foundation, Inc.
- President, Ayala Land, Inc.
- Group Head, Corporate Strategy and Development,
Ayala Corporation
- Chief Finance Officer, Ayala Corporation
- General Counsel and Corporate Secretary, Ayala
Corporation and Ayala Land, Inc.; and Compliance
Officer, Ayala Corporation
- Group Head, Corporate Resources, Ayala Corporation
President, Ayala Automotive Holdings Corporation
- President, Integrated Micro-Electronics, Inc.
46
d.
Ayala Corporation Management Committee
Jaime Augusto Zobel de Ayala
Fernando Zobel de Ayala
Gerardo C. Ablaza, Jr.
John Eric T. Francia
Delfin C. Gonzalez, Jr.
Solomon M. Hermosura
John Philip S. Orbeta
7. On April 21, 2014, the Company, in compliance with the SEC Memorandum Circular No. 1, Series
of 2014 or the Guidelines for Changes and Updates in the Annual Corporate Governance Report
(CGR), filed the updates made on the Annual CGR.
8. On April 25, 2014, the Company submitted the certifications of its independent directors, namely,
Ramon R. del Rosario, Jr. Xavier P. Loinaz and Antonio Jose U. Periquet.
47


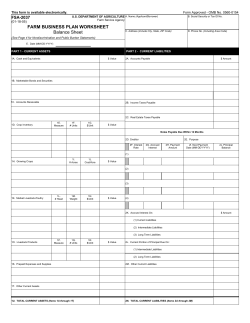
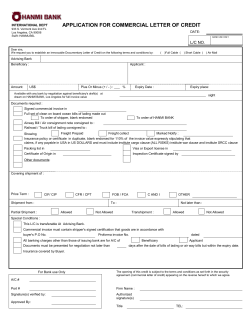

© Copyright 2026