
CALIFORNIA CLEAN FUELS MARKET ASSESSMENT 2001 CONSULTANT REPORT CALIFORNIA
CALIFORNIA
ENERGY
COMMISSION
CONSULTANT REPORT
CALIFORNIA CLEAN FUELS
MARKET ASSESSMENT 2001
SEPTEMBER 2001
P600-01-018
Gray Davis, Governor
CALIFORNIA ENERGY COMMISSION
William J. Keese, Chairman
Commissioners:
Robert A. Laurie
Michal C. Moore
Robert Pernell
Arthur H. Rosenfeld
Steve Larson,
Executive Director
Nancy J. Deller
Deputy Director
TRANSPORTATION ENERGY DIVISION
Mary D. Nichols
Secretary
RESOURCES AGENCY
ACNOWLDEGEMENTS
Consultant/Author
Jon Leonard – Arthur D. Little, Inc.
Program Manager/Author
Peter F. Ward
Project Manager/Author
James M. Folkman
Support Staff
Gigi Tien
The authors wish to acknowledge the contributions to this report by the following:
Jennifer Allen
Alan Argentine
David Ashuckian
Susan Bakker
Gerry Bemis
Susan Brown
Dan Fong
Lilly Ghaffari
Ken Koyama
Tom MacDonald
Pat Perez
Mark Rawson
Mike Smith
Bernard Treanton
Mike Trujillo
Jerry Wiens
Gary Yowell
DISCLAIMER
The California Energy Commission with the assistance of its contractor (Arthur D. Little, Inc.) prepared this
report. The views and conclusions expressed in this document are those of the California Energy Commission
and do not necessarily represent those of the State of California. Neither the State of California, the Energy
Commission, nor any of their employees, contractors, or subcontractors, makes any warranty, expressed or
implied, or assumes any legal liability or responsibility for the accuracy, completeness, or usefulness of any
information, product, or process enclosed, or represents that its use would not infringe on privately owned
rights.
The mention of commercial products, their sources or their uses in connection with material reported here is
not to be construed as either actual or implied endorsement of such products.
Table of Contents
Table of Contents................................................................................................................... i
List of Tables .......................................................................................................................iii
List of Figures...................................................................................................................... vi
1.
1.1
1.2
1.3
1.4
1.5
1.6
1.7
2.
2.1
2.2
2.3
2.4
2.5
2.6
3.
3.1
3.2
4.
4.1
4.2
4.3
4.4
4.5
4.6
4.7
5.
5.1
5.2
5.3
Executive Summary .................................................................................................. 1
Natural Gas Vehicles and Infrastructure .................................................................... 2
Propane Vehicles and Fueling Infrastructure.............................................................. 3
Electric Vehicles (EVs) and Recharging Infrastructure .............................................. 4
Ethanol Vehicles and Fueling Infrastructure .............................................................. 4
Methanol Vehicles and Fueling Infrastructure ........................................................... 5
Hydrogen Vehicles and Fueling Infrastructure........................................................... 5
Recommendations for AFV Infrastructure Incentives ................................................ 5
Background and Introduction .................................................................................... 6
The California Clean Fuel Infrastructure Development Plan ...................................... 6
Technical Advisory Group......................................................................................... 8
Overview of the Clean Fuels Market Assessment ...................................................... 9
Scope, Information Sources and Limitations............................................................ 10
Major Drivers for Use of Clean Fuels ...................................................................... 11
Avoidance of “Stranded” Investments, and Criteria for “Exit” Strategies................. 12
Status of Clean Fuel Vehicle Technologies in California ......................................... 14
Near-Term Fuel / Vehicle Technologies for Potential Development ........................ 14
3.1.1 Natural Gas Vehicles............................................................................... 14
3.1.2 LPG (Propane) Vehicles......................................................................... 25
3.1.3 Electric Vehicles ..................................................................................... 29
3.1.4 Ethanol-Fueled Flexible Fuel Vehicles .................................................... 32
Longer-Term Fuel / Vehicle Technologies............................................................... 33
3.2.1 Methanol Fuel Cell Vehicles ................................................................... 34
3.2.2 Hydrogen Fuel Cell Vehicles................................................................... 35
Status of the Clean Fuels Infrastructure in California .............................................. 39
Natural Gas Supply, Demand and Price ................................................................... 39
Natural Gas Fueling Stations ................................................................................... 45
4.2.1 CNG Stations .......................................................................................... 46
4.2.2 LNG Fuel and Stations ............................................................................ 59
4.2.3 L/CNG Stations....................................................................................... 70
LPG Fuel and Fueling Stations ................................................................................ 72
Electric Vehicle Recharging Stations....................................................................... 79
E85 Fuel and Fueling Stations ................................................................................. 87
Methanol Fuel and Fueling Stations......................................................................... 90
Hydrogen Fuel and Fueling Stations ........................................................................ 93
Conclusions and Recommendations....................................................................... 100
Overview and Summary of Target Vehicles / Applications .................................... 100
California’s Energy Crisis and Other Uncertainties............................................... 101
Funding Recommendations by Vehicle Application............................................... 102
5.4
5.5
5.6
6.
6.1
6.2
6.3
7.
7.1
7.2
7.3
8.
8.1
8.2
Recommendations for Specific Resource Allocations by Fuel Type....................... 103
Recommendations for Further Study and/or Monitoring of Progress...................... 106
5.5.1 Battery EV Recharging Infrastructure.................................................... 106
5.5.2 Hybrid Electric Vehicle Infrastructure ................................................... 106
5.5.3 E85 FFV Infrastructure.......................................................................... 107
5.5.4 Methanol Infrastructure ......................................................................... 107
5.5.5 Hydrogen Infrastructure ........................................................................ 108
Recommendations for AFV Infrastructure Incentives ............................................ 108
Appendix A: Air Quality Regulations and Petroleum Displacement...................... 110
Light-Duty Vehicles .............................................................................................. 110
Medium-Duty Vehicles ......................................................................................... 111
Heavy-Duty Vehicles ............................................................................................ 111
Appendix B: Maps and Linkages for AFV Technologies ...................................... 115
Clean Fuel Station Mapping .................................................................................. 115
Relationships to Clean Cities ................................................................................. 116
Relationships to Interstate Clean Transportation Corridor...................................... 120
Appendix C: Summary Tables by Fuel Type ........................................................ 121
Near-Term Clean Fuel Infrastructure and Vehicles ................................................ 121
Longer-Term Clean Fuel Infrastructure and Vehicles ............................................ 123
List of Tables
Table 1. Overview of the California Fuel Infrastructure Development Plan ................... 7
Table 2. Examples of candidate clean fuels and vehicle technologies ............................ 7
Table 3. Stakeholder organizations represented on the Technical Advisory Group ........ 8
Table 4. U.S. NGV manufacturers and products ...........................................................15
Table 5. Recent model light- and medium-duty CNG vehicles in California................16
Table 6. Largest fuel users by vehicle type / application...............................................17
Table 7. Recent heavy-duty natural gas engines certified to CARB’s Low-NOx
Emission Standards......................................................................................18
Table 8. U.S. Growth of NGV populations in the heavy-duty vehicle sector.................18
Table 9. U.S. Growth of CNG and LNG Vehicles ........................................................19
Table 10. Estimated driving ranges for selected dedicated NGVs .................................21
Table 11. Survey input from end users on average fleet vehicle range ..........................21
Table 12. Incremental cost of selected light- and medium-duty CNG vehicles..............22
Table 13. Examples of major RD&D efforts to improve NGV commercial viability.....24
Table 14. SCAQMD’s adopted or proposed fleet rules affecting HDVs.......................25
Table 15. 2001 MY medium-duty LPG ULEVs available in California .......................26
Table 16. GM / Impco's dedicated propane medium-duty truck for 2001. .....................27
Table 17. Recent H-D dedicated LPG engines certified to Low-NOx Standards ...........27
Table 18. Incremental costs of selected LPG vehicles ..................................................28
Table 19. EVs recently offered in California ................................................................30
Table 20. Recent model year E85 FFVs ......................................................................32
Table 21. Examples of hydrogen fuel cell vehicles under development .......................36
Table 22. 1999 Natural Gas Deliveries in California by Consumer Type ......................40
Table 23. Overview of Existing CNG Stations in California, by Owner / Operator .......46
Table 24. Point-of-sale payment options at California’s public-access CNG stations ....52
Table 25. Summary of TAG input on existing and needed CNG payment RD&D ........53
Table 26. TAG member input on codes and standards for CNG stations.......................54
Table 27. Summarized survey responses on long-term horizon for CNG ......................55
Table 28. Summarized responses on RD&D for CNG infrastructure ............................55
Table 29. Summarized responses on existing barriers and needed incentives................56
Table 30. Projected need for expansion of CNG stations in California..........................57
Table 31. Major RD&D efforts to improve the CNG infrastructure ..............................58
Table 32. Existing LNG and L/CNG stations in California, by owner / operator...........60
Table 33. LNG and L/CNG stations under construction in California ...........................61
Table 34. Planned LNG and L/CNG Stations ...............................................................61
Table 35. Comparison of diesel and LNG price scenarios.............................................63
Table 36. Ranges of LNG Station Prices from Chart Applied Technologies .................64
Table 37. Point-of-Sale Payment Options, Activities and Needs for LNG Stations .......65
Table 38. Proposed objectives for LNG industry by 2010.............................................67
Table 39. Summarized survey responses on long-term horizon for LNG ......................67
Table 40. Major RD&D efforts to improve the L/CNG infrastructure...........................68
Table 41. HD-5 Specification for Automotive LPG......................................................78
Table 42. Summarized survey response on horizon for automotive LPG stations..........79
Table 43. Projected need for expansion of LPG stations in California. .........................79
Table 44. Electric Vehicle Recharging Infrastructure in California...............................80
Table 45. Summarized survey response on long-term horizon for EV charging ............84
Table 46. CARB staff report recommendations on EV infrastructure............................86
Table 47. Summary of survey input from Methanex on methanol infrastructure ........92
Table 48. Schedule of tasks for the "Blueprint for Hydrogen" RD&D plan...................97
Table 49. Summarized responses on RD&D for hydrogen infrastructure ......................98
Table 50. Infrastructure activities recommended for highest priority of resource
allocations .................................................................................................104
Table 51. Sources of potential cost sharing.................................................................105
Table 52. Potential new incentives for AFVs and fueling stations...............................109
Table 53. 2001 LDV types certified to CARB’s most stringent emissions standards..110
Table 54. Recent MY medium-duty vehicle certifications by type..............................111
Table 55. SCAQMD’s adopted or proposed fleet rules affecting HDVs.....................113
Table 56. Websites with maps for clean fuel stations..................................................115
Table 57. Relationship of Clean Cities and California’s CNG infrastructure...............117
Table 58. Examples of Clean Cities Involvement in Propane Infrastructure ...............118
Table 59. Examples of EV infrastructure activities by Clean Cities stakeholders .......119
Table 60. Examples of Clean Cities stakeholders involved with hydrogen
infrastructure .............................................................................................120
Table 61. Summarized status of near-term clean fuel infrastructure and vehicles........121
Table 62. Estimated potentials and recommendations for near-term clean fuel
infrastructure and vehicles .........................................................................122
Table 63. Summarized status and recommendations for longer-term clean fuel
infrastructure and vehicles .........................................................................123
List of Figures
Figure 3-1. Number and type of CNG vehicles used by various fleet types (U.S.) .......15
Figure 3-2. Estimated Near-Term Growth of LNG Vehicle Populations in California...19
Figure 3-3. Incremental cost (over diesel version) of selected natural gas HDVs ..........22
Figure 4-1. Natural gas spot prices, March '00 to January '01 .......................................41
Figure 4-2. Average retail gasoline prices in California, 2000-2001 .............................43
Figure 4-3. Average rack prices for California diesel fuel, 2000-2001 ..........................43
Figure 4-4. Existing and Projected Growth in NG Consumption for the U.S., by
Sector ..........................................................................................................44
Figure 4-5. CNG throughput estimates from TAG members.........................................48
Figure 4-6. The Gas Company’s commodity cost and price of CNG, 1997-2000. .........49
Figure 4-7. December 2000 CNG prices at 15 public access CNG stations...................50
Figure 4-8. Estimated costs to build CNG stations (approx. 300 to 400 scfm)...............51
Figure 4-9. Existing and Projected Near-Term LNG Consumption in California ..........61
Figure 4-10. Current propane demand sectors...............................................................72
Figure 4-11. Production chain for propane (from http://www.npga.com)......................73
Figure 4-12. Retail LPG prices generally track those of crude oil. ................................74
Figure 4-13. Recent trend in retail LPG prices, with GGE and DGE prices...................75
Figure 4-14. Estimated costs to build various types of LPG stations ............................77
Figure 4-15. Historic avg. electricity rates (residential and commercial) for California,
1975-1998 ...................................................................................................81
Figure 4-16. Past and projected U.S. ethanol consumption (millions of gallons)...........88
Figure 7-1. Web-based map system for the California NGV Coalition........................116
1.
Executive Summary
The Clean Fuels Market Assessment is an essential element of the California Fuel
Infrastructure Development Plan. The Assessment provides a foundation of logic to the Plan
by assessing California’s most immediate clean fuel infrastructure needs for transportation
applications and providing essential program recommendations on how to meet those needs.
An immediate focus is to help guide the Plan’s infrastructure expenditures of the currently
available $6 million, such that the potential to displace petroleum fuels (gasoline and diesel)
will be maximized. This inaugural version of the Assessment is designed to provide a
dynamic process whereby annual reviews and updates can be used by the Energy
Commission to set infrastructure goals and development priorities, assist in the preparation of
legislative or administrative remedies, and help guide budget appropriations.
The Plan targets expansion of fueling infrastructure for alternative-fuel vehicles and
applications that will displace the greatest volumes of petroleum based fuels. Whenever
possible, achieving quantifiable air-quality benefits is also an important objective. In addition
to mainstream alternative fuels, a variety of “unconventional” liquid fuels (e.g., biodiesel,
Fischer-Tropsch diesel) can potentially help California meet both objectives. Although their
immediate infrastructure needs in California may be minimal or require further definition,
such fuels should remain candidates for future allocations under the Energy Commission’s
Clean Fuel Infrastructure Development Plan. Moreover, assistance for these fuels beyond
infrastructure development (e.g., policy support) appears to be warranted, given the
substantial potential benefits at minimal budget impact to the State.
For the purposes of expending the Plan’s currently available $6 million for infrastructure
development, candidate fuels assessed in this report include natural gas, propane, ethanol,
methanol, electricity and hydrogen. Recommendations for immediate funding allocations are
provided for certain fuels and applications; for others, monitoring of progress and/or further
assessments are suggested.
Since mid 2000, California has been experiencing an ongoing, major energy crisis. Virtually
all transportation fuel markets have been affected, and new developments are occurring on a
daily basis. A major concern is the rising demand for natural gas by electricity generators,
which may severely constrain available natural gas supplies for the transportation sector, and
may also further affect supply and price for other key fuels (e.g., propane). Based on the best
available information as of early 2001, it appears that supply and/or distribution problems for
alternative fuels such as natural gas and propane will persist in the short term, perpetuating
volatile prices that are higher than conventional fuels on an energy-equivalent basis. Longerterm supply, demand and pricing scenarios suggest there will be a return to more competitive
levels within two to four years.
The recommendations in this report are based on the assumption that, over the longer run,
further investments to diversify fuels in the transportation sector will help alleviate (rather than
exacerbate) California’s current energy crisis. The $6 million that is immediately available for
2001 allocations under the Plan is a relatively small amount, compared to the magnitude of
infrastructure investments needed. Using the best-available information, these
recommendations are focused on the most promising infrastructure deployments that 1) are
most in need of government funds to become commercially self-sustaining, and 2) appear to
entail the lowest risk to become stranded investments.
Currently, the heavy-duty vehicle (HDV) sector offers the best opportunities to displace
consumption of petroleum fuels and achieve air quality benefits. However, the emissions
competitiveness of diesel-fueled HDVs is likely to rapidly improve over the next five years.
As such, it’s difficult to predict the longer-term degree to which emissions-related
regulations will continue to drive AFV commercialization. This makes it even more
important to immediately build momentum towards self-sustainable commercial AFV
markets -- while energy security drivers are complemented by air quality regulations and
related incentives. Fleet applications that make the best candidates for high-priority resource
allocations in the “large” and “medium” project categories (>$250,000 and up to $250,000,
respectively), include refuse haulers, transit buses, class 8 trucks (return to base), high-fuel
use LDV applications (e.g., large taxicab fleets), and high-fuel-use MDV applications such as
airport shuttle buses and package-delivery services. There are also potential AFV
applications that may not currently involve high fuel use, but are capable of significantly
advancing California’s long-term potential to displace petroleum fuels. Such applications are
good candidates for resource allocations in the “small to medium” category (roughly $65,000
to $250,000 per project). These include school buses and small light-and medium-duty fleets
seeking “startup” operations with dedicated AFVs utilizing a single dispenser, or multiple
vehicle refueling appliances (VRAs).
The task to establish sufficient numbers of AFV fueling stations is significant. In the heavyduty sector alone, tens of thousands of AFVs will potentially be deployed in California over
the next decade, either to meet various government regulations or exploit incentive programs.
In the greater Los Angeles area, five new fleet rules from the South Coast Air Quality
Management District’s 1190 Series could potentially deploy more than 16,000 heavy-duty
AFVs over the next 15 years. In other parts of California, the California Air Resources
Board’s newly adopted transit bus fleet rule is already stimulating increased deployments of
alternatively fueled transit buses at an estimated 14 transit districts, including large districts
in Sacramento, San Diego, and the Bay area.
Specific findings and recommendations by vehicle type, application and topic are as follows:
1.1
Natural Gas Vehicles and Infrastructure
Natural gas is currently the leading alternative fuel in California, in terms of commercially
available low-emission vehicles and numbers of fueling stations specifically for automotive
applications. New deployments are already underway in response to the above-noted
regulations, and it appears that most of the demand for heavy-duty AFVs will be met by
natural gas vehicles fueled by CNG and LNG. For LNG alone, it’s possible that as many as
6,000 new HDVs and 44 new fueling stations will be deployed by 2010 in the western United
States, if industry objectives can be met. Corresponding vehicle and infrastructure
investments will cost an estimated $167 million at the low end, and as much as $334 million.
Approximately $9 to $12 million per year will be needed from grants and incentive
programs, to augment industry’s share (roughly 75%). Large investments in fueling
infrastructure are also needed if greater numbers of CNG vehicles are to be deployed,
including a significant portion of funding towards so-called “L/CNG” stations that dispense
both LNG and CNG.
Also, in response to the energy crisis, California will need to be more proactive in developing
new means of production for alternative transportation fuels. New actions are needed to reduce
its ~85% dependency on imported natural gas, currently transported in by pipeline deliveries or
LNG shipments that appear fully subscribed. Potential strategies to augment California’s
supply of clean transportation fuels include further exploiting its large untapped resources of
waste-to-energy technologies, and using emerging gas-to-liquids technology to extract
stranded reserves of associated natural gas, which can yield LNG, zero-sulfur synthetic diesel
fuel, and methanol (among other useful products). These activities are needed in addition to
existing efforts to develop small-scale liquefaction plants to produce LNG, using pipeline gas
or remote gas sources.
To help meet all these needs, the following recommendations are made for the natural gas
fueling infrastructure under the currently available $6 million:
•
Approximately $2.4 million is recommended to cost-share new LNG stations, for use by
refuse hauler fleets, return-to-base delivery fleets, and transit districts.
•
Approximately $1.0 million is recommended to cost-share new L/CNG stations, or add
the L/CNG station feature to conventional LNG stations. These stations can be used by
fleets seeking an integrated strategy to natural gas vehicles, i.e., fueling of light-,
medium-, and heavy-duty vehicles at the same station.
•
Approximately $700,000 to $900,000 is recommended to cost-share new CNG stations
for use by school districts, high-fuel-use medium-duty fleets such as taxicabs, and small
fleets using vehicle refueling appliances.
•
Approximately $1.2 million is recommended to cost-share new gas-to-liquid technologies
that can produce LNG or other useful transportation fuels.
1.2
Propane Vehicles and Fueling Infrastructure
Propane vehicles have potential to significantly displace petroleum fuels and provide air
quality benefits in California. Recent price volatility and supply issues remain a concern in
the propane industry, although this has been the case with many transportation fuels. It is
difficult to estimate the exact potential of propane-fueled vehicles to displace gasoline and
diesel due to the current limited offerings of dedicated propane vehicles, and the lack of any
significant fuel-use requirements affecting bi-fuel vehicles. Significant numbers of bi-fuel
vehicles are currently being operated by California fleets. This includes approximately 700
Ford F-150 pickups operated primarily on gasoline by Caltrans, which is reportedly willing
and able to make the switch to propane. As a modest start to expanding the propane fueling
infrastructure and possibly stimulating greater deployments of dedicated vehicles, it is
recommended that $500,000 to $700,00 be allocated to cost share new automotive-style
propane stations in California.
1.3
Electric Vehicles (EVs) and Recharging Infrastructure
With recent changes adopted in the California Zero-Emission Vehicle (ZEV) program, it
appears that the total number of battery EVs deployed in 2003 will vary from 4,450 to
15,450. This range in part reflects uncertainty about how the modified ZEV program will
alter the relative market shares of conventionally fueled light-duty vehicles versus batteryelectric vehicles and other clean-fuel technologies.
The ramifications of California’s current power crisis to EV commercialization are not clear,
and the potential range of EV numbers that will be deployed is broad. It is recommended
that further assessments are conducted before further consideration is given to funding EV
infrastructure development under Plan funding. Specific topics for assessment are as
follows:
•
Projected numbers and types of EVs that will be deployed in California for the 2003 to
2010 timeframe, by type and end use (government fleets, private users, utilities, etc.)
•
Existing EV stations by location, type and how they are used by end users (fleets as well
as private individuals)
•
Relationships between the density of fast chargers and public charging stations
•
Impacts of neighborhood electric vehicles (NEVs) on EV infrastructure needs (residential
and public stations)
•
Feasibility to adopt statewide ordinances that require construction of new homes and
businesses to be compatible with state-of-the-art EV charging systems
•
Potential to develop and deploy an effective and affordable billing system for public EV
charging stations
•
Progress of hybrid electric vehicle (HEV) technology and special infrastructure
requirements, if any, that may emerge
1.4
Ethanol Vehicles and Fueling Infrastructure
FFVs with capability to operate on ethanol (E85) or gasoline are widely available in
California, but currently there are no E85 fueling stations. Nationally, demand for E85 will
grow significantly over the next 20 years, but there are no known plans to sell meaningful
volumes in California. Beginning in 2003, ethanol will replace MTBE as the oxygenate in
California gasoline, resulting in a major increase in ethanol demand. This will further cloud
the future of E85 in California, because the use of ethanol for FFVs is not currently
economically competitive with its use as an oxygenate for reformulated gasoline. It is
recommended that no 2001 funds are allocated to ethanol infrastructure under the California
Clean Fuels Infrastructure Development Plan, although future market assessments should
revisit this as a possible use of funds.
1.5
Methanol Vehicles and Fueling Infrastructure
Methanol is an excellent carrier of hydrogen for use in fuel cells, and can also work well in
vehicles with internal combustion engines. Currently, no major vehicle manufacturers are
selling on-road vehicles that use methanol fuel, but this situation may change since several
major auto manufacturers have announced plans to sell methanol-fueled fuel cell vehicles by
2004. Members of the California Fuel Cell Partnership are exploring possible scenarios for
developing a methanol fuel distribution system for fuel cell vehicles, and assessing
commercialization issues. Methanol infrastructure should remain a candidate for potential
support under the California Clean Fuels Infrastructure Development Program, but no
funding allocations are recommended under the currently available funding.
1.6
Hydrogen Vehicles and Fueling Infrastructure
Hydrogen is expected to be the long-term fuel for fuel cell vehicles. Achieving widespread
use of direct-hydrogen fuel cell vehicles will require vehicle, fuel-production and
infrastructure investments of very large proportions. Activities under the California Fuel
Cell Partnership and the federal hydrogen program are addressing some of these issues.
Hydrogen infrastructure should remain a primary candidate for future support under the
California Clean Fuels Infrastructure Development Plan. However, it is premature to allocate
Plan funds to hydrogen infrastructure.
1.7
Recommendations for AFV Infrastructure Incentives
An important ongoing need in advancing the commercial viability of clean fuel technologies
is to implement effective, affordable and workable incentives. Many types of incentives have
been used in California and other states to support AFV deployment, but some have clearly
been more effective than others. Generally, state and local grants have provided the best
motivation for fleets to purchase AFVs, whereas tax credits have worked well for individual
AFV owners. In some cases, well-meaning but poorly designed and implemented incentive
programs have resulted in ineffective use of funds or even financial disaster (e.g., the
Arizona program). Greater understanding is needed on the mechanics of effective incentives
for AFVs and fueling stations. It is recommended that the Energy Commission and its
partners conduct a detailed assessment of financial and administrative incentives that can
most effectively help deploy AFVs with maximum displacement of petroleum fuels.
2.
Background and Introduction
2.1
The California Clean Fuel Infrastructure Development Plan
Overall, about 50 percent of California’s energy consumption results from transporting goods
and people. With 34 million people and more than 24 million registered motor vehicles,
California is the world’s second largest consumer of gasoline and diesel fuel, exceeded only
by the remainder of the United States. More than 99 percent of the state’s transportation
energy is derived from petroleum fuels. Statewide, there are approximately 9,500 retail
fueling stations that dispense gasoline and diesel fuel. Each year, a total of 13.5 billion
gallons of gasoline and 4.4 billion gallons of diesel are dispensed at those stations.1 On
average, each station dispenses about 5,000 gallons of petroleum fuel each day.
For several decades, the Energy Commission has worked with the California Air Resources
Board and other California public agencies to diversify the transportation fuels market by
helping to develop a market for vehicles that use cleaner burning alternative fuels. An
essential element of these efforts has been parallel development of the necessary fueling
infrastructures to support such vehicles.
The California Clean Fuel Infrastructure Development Plan (Plan) is an annual resource and
planning tool of the Energy Commission for the integrated development of clean fuels
infrastructure in California. This Plan allows the Energy Commission to track and promote
competitive, non-petroleum energy alternatives throughout California, and oversee
infrastructure development through project funding and incentives. In targeting expansion of
the clean fuels infrastructure, the Plan addresses numerous alternative fuels and vehicle
technologies, and allocates $6 million in currently available funds to support infrastructure
development. Table 1 provides an overview of the Plan. Table 2 provides examples of clean
fuel stations that are candidates for further development under the Plan, along with the
corresponding vehicle types and technologies, and the anticipated timeframe for development
activities.
1
California Energy Commission, various documents from website (http://www.energy.ca.gov/).
Table 1. Overview of the California Fuel Infrastructure Development Plan
Duration
♦
Multi-year, beginning Fiscal Year 2000-2001
Current Funding
♦
♦
$6 million in Petroleum Violation Escrow Account (PVEA) funds
Approximately 4:1 cost sharing from other sources
Major Objectives
♦
Assess existing Alternative Fuel infrastructure
♦
♦
Assess current and potential markets and technologies to set development
goals,
Create economic market for vehicle, market projection
♦
Coordinate infrastructure development,
♦
♦
Determine effective financial and administrative incentives to achieve goals
Establish evaluative framework to measure and determine the success in
attaining annual market development goals
♦
Provide an annual review and planning mechanism to guide future state
investment and encourage private investment
Year 1: Focus
and Key
Deliverables
♦
♦
♦
Clean Fuels Market Assessment
Master plan to guide public and private investments in non-petroleum fueling
infrastructure
Broad-based and targeted clean fuel infrastructure solicitations
Subsequent
Years: Focus and
Key Deliverables
♦
Continuously updated mechanism to determine and implement infrastructure
development priorities
♦
Continued updates and renewed guidelines for investment of state funds in
the clean fuel infrastructure
Sources of Cost
Sharing for
Infrastructure
Development
♦
Federal agencies (e.g., DOE)
♦
Other State agencies (e.g., CARB)
♦
♦
Local agencies (AQMDs and APCDs)
Private industry
Plan Participants,
Stakeholders,
and
Sources of Input
♦
Technical Advisory Group (see table below)
♦
♦
Commission staff
Consultants
♦
Academic community
♦
♦
General public
Associations
Table 2. Examples of candidate clean fuels and vehicle technologies
Type of Clean
Fuel Station
Compressed Natural Gas
(CNG)
♦
♦
Existing or Potential Users
(Vehicles / Technologies)
Internal Combustion Engine Vehicles
Hybrid Electric Vehicles
Anticipated
Timeframe
♦ Near term
♦ Near term
Liquefied Natural Gas (LNG)
L/CNG (capable of supplying
both LNG and CNG)
♦
♦
♦
♦
Internal Combustion Engine Vehicles
Hybrid Electric Vehicles
Internal Combustion Engine Vehicles
Hybrid Electric Vehicles
♦
♦
♦
♦
Near term
Longer term
Near term
Near term
Liquefied Petroleum Gas
(Propane)
♦
♦
Internal Combustion Engine Vehicles
Hybrid Electric Vehicles
♦
♦
Near term
Near term
Electric Charging
♦
♦
Battery Electric Vehicles
“Plug-In” Hybrid Electric Vehicles
♦
♦
Near term
Longer term
Ethanol
♦
♦
Flexible Fuel Vehicles
Hybrid Electric Vehicles
♦
♦
Near term
Longer term
Methanol
Hydrogen
♦
♦
♦
♦
♦
♦
♦
Fuel Cell Vehicles (Reformer)
Internal Combustion Engine Vehicles
Hybrid Electric Vehicles
Fuel Cell Vehicles (Reformer)
Fuel Cell Vehicles (Direct Methanol)
Internal Combustion Engine Vehicles
Fuel Cell Vehicles (Direct Hydrogen)
♦
♦
♦
♦
♦
♦
♦
Longer term
Near/Longer
Longer term
Longer term
Longer Term
Longer term
Longer term
In addition to these mainstream alternative fuels, a variety of “unconventional” liquid fuels
can potentially help displace petroleum fuels in California, while simultaneously providing
significant air quality benefits. These include bio-diesel, Fischer-Tropsch diesel, and Pure
Energy’s P-Series fuel. Such fuels hold clear promise to further diversify the fuel mix in
California’s transportation sector. Although their immediate infrastructure needs in
California may be minimal or require further definition,2 such fuels should remain candidates
for future allocations under the Energy Commission’s Clean Fuel Infrastructure Development
Plan. Moreover, assistance for these fuels beyond infrastructure development (e.g., policy
support) appears to be warranted, given the substantial potential benefits at minimal budget
impact to the State.
For the purposes of expending the currently available $6 million on infrastructure
development, this assessment focuses on the following “conventional” alternative
transportation fuels: natural gas, propane, ethanol, methanol, electricity and hydrogen. These
fuels require challenging and immediate modifications to the existing fueling infrastructure
before greater commercial deployment can occur.
2.2
Technical Advisory Group
To assist the Energy Commission in developing and implementing the Plan, a Technical
Advisory Group (TAG) was formed in mid 2000. As
Table 3 shows, there are five primary types of stakeholders represented on the TAG, with
many different individual organizations contributing a wide range of expertise.
Table 3. Stakeholder organizations represented on the Technical Advisory Group
2
For example, Energy Commission staff have made preliminary estimates about the costs of modifying an existing diesel terminal for FischerTropsch diesel.
Stakeholder Type
Private Sector
Fleets and End
Users
Utilities, Fuel
Suppliers and
Infrastructure
Industry
Government
Agencies
Trade Associations,
Consultants,
Research Institutes
and National
Laboratories
Vehicle and Engine
Manufacturers
2.3
Name of Organization / Agency Represented
on the TAG
♦
♦
♦
♦
♦
♦
♦
♦
♦
♦
♦
♦
♦
♦
♦
♦
♦
♦
♦
♦
♦
♦
♦
♦
♦
♦
♦
♦
♦
♦
♦
♦
♦
Sunline Transit District
Los Angeles County Transit Authority
Jack B. Kelley, Inc
California Fleet
Methanex Corporation
Trillium USA
Pacific Gas & Electric
The Gas Company / Sempra Energy
Pinnacle CNG Systems LLC
Pickens Fuel Corporation
FleetStar / Applied LNG Technologies
Parallel Products
Delta Liquid Energy
California State Department of Education
California Department of General Services
San Joaquin Valley APCD
California Air Resources Board
South Coast AQMD
California Department of Transportation
California Department of Fish & Game
California Department of Parks and Rec.
California Natural Gas Vehicle Coalition
Gas Technology Institute
California Electric Transportation Coalition
Argonne National Laboratory
DOE Clean Cities
Gladstein & Associates
Ford Motor Company
American Honda Motor Company
Toyota Motor Sales
Cummins Engine Company
Daimler-Chrysler Corporation
General Motors
Primary Area of Specific Expertise
and / or Contribution
♦
♦
♦
♦
♦
♦
♦
♦
♦
♦
♦
♦
♦
♦
♦
♦
♦
♦
♦
♦
♦
♦
♦
♦
♦
♦
♦
♦
♦
♦
♦
♦
♦
Transit Buses
Transit Buses
HD Trucks
End User
Methanol Supplier
CNG Turnkey Provider
CNG / LNG Utility
CNG Utility
CNG Turnkey Provider
CNG / LNG Turnkey Provider
CNG, LNG, L/CNG Supplier
Ethanol / E85
LPG / Propane Supplier
AFV User
AFV User
Incentives, Technology
Incentives, Regulations
Incentives, Regulations
AFV User, Traffic mitigation
AFV User
AFV User
NGVs and Infrastructure
NGVs and Infrastructure
EVs and Infrastructure
Various AFV Technologies
Infrastructure Coalitions
ICTC and LNG Consultant
AFVs and Infrastructure
AFVs and Infrastructure
AFVs and Infrastructure
Heavy-Duty AFV Engines
AFVs and Infrastructure
AFVs and Infrastructure
Overview of the Clean Fuels Market Assessment
The Clean Fuels Market Assessment is a foundation and essential element of the California
Fuel Infrastructure Development Plan. The objective of this Assessment is to assist the Plan
in accomplishing the following:
•
•
•
•
•
•
•
•
•
•
Identify and analyze barriers and impediments to expanding the alternative fuels
infrastructure in California
Set realistic and practical development goals for infrastructure
Help develop effective financial and administrative incentives
Assist in the preparation of legislative or administrative remedies
Conduct public outreach to stimulate private participation and investment
Serve as an adjunct to the annual Program Workplan process
Assist in the selection of infrastructure-development activities for funding
Assist to develop priorities and plan activities
Conduct public advertising and information
Identify fuel-specific issues (supply/price)
This inaugural version of the Clean Fuels Market Assessment focuses on assessing the
market potentials for various types of clean fuels in California. In subsequent years, this
Market Assessment will be updated and used as an ongoing tool to set new annual goals and
development priorities, assist in the preparation of legislative or administrative remedies, and
help guide budget appropriations.
2.4
Scope, Information Sources and Limitations
Key California-specific components identified in this Assessment include:
•
•
•
•
•
•
Existing infrastructure and vehicle base, by fuel type
Time horizon for technological maturity
Fuel-specific considerations (e.g., vehicle performance, range, cost, fuel supply, public
access, card reader access)
Building codes and standards
Existing and potential funding sources and mechanisms
Existing and potential incentives (financial and administrative)
A wide variety of data and information were gathered from many sources in preparing this
report and developing this Clean Fuels Market Assessment. A primary source was survey
input received from TAG members of three main groups: 1) the alternative-fuel supply and
infrastructure industry, 2) engine and vehicle manufacturers, and 3) vehicle end users. In
addition, to augment the input received from the TAG through these surveys, extensive input
was obtained from Energy Commission staff and various organized groups with similar
objectives to those of the Clean Fuel Market Assessment. These include the Infrastructure
Working Group of the Gas Technology Institute, the California Fuel Cell Partnership, and
others.
Using information obtained from these various sources, this Market Assessment provides
guidance towards expanded use of the clean fuel infrastructure in California to assist in
displacement of petroleum fuels. The following caveats and limitations are noted:
•
Since mid 2000, California has been experiencing an ongoing, major energy crisis.
Virtually all transportation fuel markets have been affected, and new developments are
occurring on almost a daily basis such as delivery backlogs on new natural gas storage,
dispensing and piping equipment. However, a major concern is the rising demand for
natural gas by electricity generators, which may severely constrain available natural gas
supplies for the transportation sector, and may also further affect supply and price for
other key fuels (e.g., propane). This report attempts to assess likely ways in which the
energy crisis may impact potential AFV infrastructure projects, but comprehensive
analysis is not within its scope. The recommendations provided in this report are based
on the assumption that, over the longer run, further investments to diversify fuels in the
transportation sector will help alleviate (rather than exacerbate) California’s current
energy crisis.
•
Not all TAG members responded to the survey or follow-up telephone calls. For all
information that was received, reasonable attempts were made to corroborate the input
and clarify or expand where important. However, rigorous verification of the information
provided is beyond the scope of this study.
•
2.5
On-road applications for clean fuels are highlighted in this report; however, many offroad vehicles (e.g., construction, military, airport, marine) use the same alternative-fuel
engines that are described in this report. Therefore, much of the findings and conclusions
of this study can be extrapolated to off-road vehicle sectors.
Major Drivers for Use of Clean Fuels
Three main categories of on-road vehicles consume the vast majority of gasoline and diesel
fuel in California: light-duty vehicles (LDVs), medium-duty vehicles (MDVs) and heavyduty vehicles (HDVs). Generally, LDVs and MDVs are powered by gasoline engines, and
HDVs are powered by diesel engines. Effectively, today there are no significant energyrelated regulations that drive the use of alternative fuels in these vehicle sectors, although
some regulations (e.g., the Energy Policy Act and Corporate Average Fuel Economy
standards) have helped deploy vehicles capable of using non-petroleum fuels. Historically, it
has been California’s air pollution control laws that have been the major regulatory driver
towards dedicated, optimized alternative fuel vehicles.
Currently, the commercial viability of specific clean fuels and technologies continues to
depend partially on their ability to provide emissions reductions. In California, LDVs,
MDVs and HDVs each contribute significantly to the overall emissions inventory, and are
being aggressively targeted for further emissions reductions. However, there are significant
differences among these categories in the magnitude of emissions reductions that are likely to
result from alternative fuels. Because the emissions competitiveness of conventionally fueled
vehicles continues to improve, over the longer term it’s unclear to what degree air quality
regulations can continue to be a major driver towards deployment of AFVs.
Appendix A: on page 110 provides a detailed discussion on the emissions competitiveness of
AFVs versus diesel and gasoline vehicles. It focuses on the HDV sector, where currently the
largest emissions reductions can be realized using alternative fuels, yet strong competition to
meet new emissions standards is on the horizon from advanced diesel technologies. By
2007, both diesel and alternative-fuel heavy-duty engines will need to emit about 90% less
NOx and PM than today’s cleanest alternative fuel engines. This will be challenging for both
advanced diesel and alternative fuel engines, but it is noteworthy that diesel engines have
significantly “farther to go” to reach the target levels. Manufacturers that take an alternative
fuel approach may have significant engineering and cost advantages, at least for certain
engines and applications.
Beyond emissions considerations, certain types of HDVs are conducive to using alternative
fuel for the following reasons:
•
Up to 70% of the operating costs of HDVs are attributable to purchasing fuel; this makes
the economics of using clean fuels more attractive (historically, at least, natural gas has
been cheaper than petroleum fuels).
•
Most HDVs are centrally fueled at large yards by professionally trained fueling and
maintenance personnel; this can help defray the higher costs associated with using and
maintaining alternative fuel vehicles and fueling stations.
•
Large HDV “anchor” fleets can provide the minimum fuel throughput levels needed to
make alternative fuel stations economically attractive to entrepreneurs and venture
capitalists.
For all the reasons discussed above, HDVs are currently the most attractive vehicle sector to
target for displacement of petroleum fuel and emissions reductions using alternative-fuel
engines. Specific vehicle types that are well suited include transit buses, return-to-base
delivery trucks, and refuse haulers. Expanded deployment of clean fuel technologies in these
applications (as well as others) largely depends on continued progress with infrastructure
development. High-fuel-use HDV applications offer the best focal point for such
development activities. However, there are also certain LDV and MDV applications (e.g.,
taxicabs and shuttle buses with high fuel use) that also make good candidates for expanded
use of alternative fuels. Detailed findings and recommendations are discussed further in
subsequent sections of this report.
2.6
Avoidance of “Stranded” Investments, and Criteria for “Exit” Strategies
One legitimate concern when allocating public funds towards deployment of alternative fuel
infrastructure is the possibility of “stranded investments.” For the purposes of the Energy
Commission’s alternative fuel infrastructure program, stranded investments might be
considered allocations that ultimately do not significantly displace gasoline or diesel
consumption. Examples of scenarios in which today’s infrastructure investments could
become stranded include the following:
•
A particular alternative fuel becomes cost prohibitive, or its supply can’t meet demand,
leading to severe under-utilization of newly constructed fueling stations
•
Vehicle and/or engine manufacturers fail to sell, manufacture or market sufficient
numbers of an AFV type, or they unexpectedly phase out existing products
•
End users refrain from purchasing today’s AFVs in hopes of obtaining longer-term, more
advanced technology at a later date
•
Miscellaneous unforeseen circumstances occur (e.g., health & safety problems with a fuel
or technology)
•
Technological breakthroughs with conventionally fueled vehicles or competing AFV
types render another AFV type unable to compete
As one example, consider the AFV infrastructure investments currently being made in
natural gas fueling facilities. Some parties have claimed that large investments of this type
for transit buses (in response to CARB’s transit bus rule or SCAQMD’s Rule 1992) could
become stranded when transit districts are required to begin procuring zero-emission buses in
the 2008 to 2010 time frame. CARB considered this issue in adopting its transit rule, but
concluded that the purchase of natural gas buses will have “strong viability” at least until
model year 2015. CARB staff also noted that “the existing natural gas infrastructure will be
transferable to the operation of fuel cell buses and could substantially reduce the
infrastructure cost for fuel cell bus fleets.”3 This is because reforming of natural gas at
transit districts will be one option to obtain hydrogen for fuel cell buses. Also, technologies
used to compress natural gas and store it on buses may be transferable to hydrogen.
A second concern when allocating public funds for AFV fueling stations is how to determine
when such support is no longer needed. Complex issues are involved in defining success,
and determining when it has been achieved. For example, several turnkey natural gas
providers now consider high-throughput CNG and LNG stations to be commercially
sustainable. This is the case largely due to government incentive funds that have encouraged
HDV fleets to procure NGVs. Those same fleets may need additional government funding to
offset higher operational costs. Fleets that don’t consume large fuel volumes often need
subsidization of both vehicles and fueling stations. Building public-access stations is costly
and currently not always profitable for infrastructure providers; consequently, government
funds may be needed if this feature is desirable. In summary, defining success and
determining an exit strategy for government funding can be a complex, dynamic process.
These issues faced by government agencies funding AFV programs – how to avoid stranded
investments and what criteria to use for exit strategies – require careful monitoring and
dynamic response. The stakes are significant, given the magnitude of incentive funding
available in California today for AFVs and fueling infrastructure. As described in this report,
significant new uncertainties have recently emerged regarding price, supply and demand for
virtually all transportation fuels. To determine which of these parameters could negatively
impact AFV markets and lead to stranded infrastructure investments, each year it will be
necessary to assess and update the latest trends. Similarly, it will be necessary to perform
ongoing assessments of progress towards sustainable commercialization, to determine the
appropriate points to phase out government investments. For these reasons, the Clean Fuels
Market Assessment has been designed to be a “living” document.
However, the $6 million immediately available for 2001 allocations under the California
Clean Fuels Infrastructure Development Plan is relatively small compared to the magnitude
of infrastructure investments needed, by both government agencies and the private sector.
Therefore, the recommendations in this Assessment are focused on the most promising
infrastructure deployments that 1) most need government funds to become commercially
self-sustaining, and 2) appear to entail reasonable risk that they won’t lead to stranded
investments.
3
California Air Resources Board, Staff Report: Initial Statement of Reasons – Proposed Regulation for a Public Transit Bus Fleet Rule and
Emission Standards for New Urban Buses, January 27, 2000.
3.
Status of Clean Fuel Vehicle Technologies in California
3.1
Near-Term Fuel / Vehicle Technologies for Potential Development
Over the last decade, alternatively fueled LDVs, MDVs, and HDVs using a wide range of
technologies and fuels have been deployed in California. These include “flexible-fuel”
vehicles using any combination of 85% methanol or ethanol blended with gasoline; “bi-fuel”
light-duty vehicles that were designed to operate on a gaseous fuel or gasoline; and trucks
and buses powered by “dedicated” methanol, propane or natural gas engines. In heavy-duty
applications, many types of alternative-fuel engines have been successful in penetrating the
market. However, these engines are still being deployed in insufficient numbers to achieve
self-sustained commercialization. The major barriers to wide-scale commercialization have
largely been (1) higher costs of the vehicles compared to conventional vehicles, and (2)
higher costs and limited numbers of fueling stations. These barriers are closely related
through a classic “chicken or the egg” problem, i.e., which will come first: adequate numbers
of AFV fueling stations to stimulate production of AFVs, or sufficient sales of AFVs to
justify the building of new alternative fuel stations?
As a prelude to the key issue of this Market Assessment – clean fuel infrastructure
development – the following sections provide an overview of various AFV types that are
now commercially available in California, or are expected to be introduced over the next five
years.
3.1.1
Natural Gas Vehicles
Commercially Available Vehicles / Technological Maturity
Approximately 75 types of natural gas vehicles are commercially available today from U.S.
engine and vehicle manufacturers. Available products have emerged recently in virtually all
on-road applications, including transit buses; school buses; refuse haulers; street sweepers;
light-, medium- and heavy-duty trucks and vans; and passenger cars. Table 4 lists the total
number of natural gas vehicle (NGV) manufacturers and products that are offered for
commercial sale, by each of these vehicle sectors.
The majority of NGVs on the road today are fueled by compressed natural gas (CNG),
although vehicles fueled by liquefied natural gas (LNG) are becoming increasingly
prominent in certain heavy-duty vehicle applications. Figure 3-1 shows a breakdown of the
types of fleets in the United States that typically use CNG-fueled vehicles, by vehicle size
and application. It shows that light-duty cars and pickup trucks are popular platforms for
NGVs.4 It also shows that state and local governments, as well as private fleets, are
4
As the next table shows, bi-fuel vehicles are common in these applications, so minimal volumes of petroleum may be displaced.
significant users of heavy-duty vehicles fueled by CNG. These vehicles by design run on at
least 85% natural gas.5
Table 4. U.S. NGV manufacturers and products
Total # of
Manufacturers
Total # of
Products
Transit / Shuttle Buses
11
34
School Buses
5
8
Medium- and Heavy-Duty Trucks
8
12
Light-Duty Trucks and Vans
4
6
Passenger Cars
5
6
Off-Road Vehicles
8
9
Natural Gas Engines
13
32
Product Category
Source: Gas Technology Institute, “NGVs – Year 2000 Report: Research,
Development Demonstration and Deployment,” 2000
Use of CNG Vehicles in the U.S. by
Vehicle Type and Fleet Type
25,000
20,000
15,000
10,000
5,000
Utility
Private
State
Local
Federal
Fleet Type
Autos
L-D Trucks
M-D Trucks
H-D Trucks and Buses
Source: SAIC Study for GRI, as reported by GRI at NGV IWG, Las Vegas, March 3, 2000
Figure 3-1. Number and type of CNG vehicles used by various fleet types (U.S.)
Table 5 lists recent-model CNG vehicles that are offered in California for light- and mediumduty applications.
5
The diesel pilot Caterpillar C-12 natural gas engine from Power Systems Associates uses 15% diesel and 85% natural gas by volume.
Table 5. Recent model light- and medium-duty CNG vehicles in California
Maker
Ford
a
CNG Vehicle
♦
Econoline E-450 Cut Away
♦
Econoline Van / Wagon
♦
F-Series Light Duty Pickup
Ford
♦
DaimlerChrysler
Engine
Displacement
Type of Natural Gas
Engine
5.4 Liter V8
Dedicated CNG
Crown Victoria Sedan
4.6 Liter V8
Dedicated CNG
♦
Ram Van / Wagon 2500
5.2 LiterV8
Dedicated CNG
♦
Ram Van / Wagon 3500
Acura
♦
MDX SUV
3.5 Liter V6
Dedicated CNG
Honda
♦
Civic GX
1.7 Liter L4
Dedicated CNG
Toyota
♦
Camry Sedan
2.2 Liter L4
Dedicated CNG
Ford
♦
F-Series Light Duty Pickup
5.4 Liter V8
Bi-Fuel CNG / Gasoline
GM
♦
Express / Savana
5.7 Liter V8
Bi-Fuel CNG / Gasoline
GM
♦
Chevy Cavalier Sedan
2.2 Liter L4
Bi-Fuel CNG / Gasoline
a
The Camry was discontinued after the 2000 model year
Despite this variety of vehicle types and applications, the use of natural gas as a motor
vehicle fuel has not increased as rapidly as predicted five years ago. One reason is that
regulatory drivers for alternative fuels have been marginally effective. For example, the
federal Energy Policy Act (EPACT) allows bi-fuel natural gas vehicles (i.e., capable of
running on gasoline or natural gas) to be operated on gasoline while still qualifying as
“alternatively fueled.”6 Affected fleets have therefore been slow to utilize the natural gas
fuel option or incorporate dedicated natural gas vehicles, resulting in very low fuel use. This
perpetuates the biggest barrier for natural gas vehicles: the fueling infrastructure remains
very limited and under utilized. Today, there are approximately 180,000 gasoline stations in
the U.S.7 compared to only 1,200 natural gas vehicle fueling stations8, of which about 240
are in California. Most of these are CNG stations, which have been especially expensive to
build, operate and maintain. About 105 “public-access” CNG stations exist in California –
these stations tend to dispense the lowest volumes of fuel, for reasons further described
below.
To maximize the most favorable economics and address major regulatory drivers (see
Appendix A: Air Quality Regulations and Petroleum Displacement), the focus of NGV
commercialization is shifting towards fleets with heavy-duty trucks, transit buses, and refuse
haulers. As Table 6 shows, on average natural gas vehicles in these categories consume
thousands of gasoline-gallon equivalents (GGEs) of natural gas each year – significantly
6
EPACT has been updated to require a 20% reduction in petroleum use by Federal fleets, but not necessarily through greater use of alternative
fuels. See Footnote #22 on page 25.
7
According to the United States General Accounting Office, February 2000.
8
This refers to all CNG and liquefied natural gas (LNG) stations, excluding home-appliance sized CNG units.
more than natural gas vehicles in the light- and medium-duty categories.9 HDVs are usually
centrally fueled and maintained -- also conducive to natural gas engines and fuels.
Table 6. Largest fuel users by vehicle type / application.
Annual Miles
per Vehicle
Miles Per Gallon (gasoline or
10
diesel equivalent)
Gallons per Year
per Vehicle
Transit Buses
40,000
3.5 dge
11,430
Refuse Trucks
20,000
2.0 dge
10,400
HD Trucks (Class 6-8)
65,000
6.5 dge
10,000
Shuttle Vans
90,000
12.0 gge
7,500
Taxis
90,000
15.0 gge
6,000
School Buses
15,000
5.0 dge
3,000
MD Trucks (Class 3-6)
25,000
11.0 gge
2,270
LD Trucks
15,000
15.0 gge
1,000
Automobiles
19,200
24.0 gge
800
Vehicle Class
Source: Gas Technology Institute, “NGVs – Year 2000 Report: Research, Development Demonstration and
Deployment,” 2000
This trend towards increased usage of natural gas in the heavy-duty sector is reflected in the
growing number of low-emission heavy-duty natural gas engines that are commercially
available. Table 7 lists the 1999 and 2000 model-year heavy-duty natural gas engines that
have been certified to CARB’s Optional Low-NOx Emission Credit Standards. To date, no
conventionally fueled engines have achieved these standards.
The specific natural gas vehicle sectors that use these engines are growing rapidly, as Table 8
shows, and there have been some significant success stories. For example, natural gas
engines now power approximately 6% of all existing U.S. transit buses; the greater Los
Angeles metropolitan area currently has nearly 1,000 such buses.11 CARB estimates that at
least 18 transit districts in California now operate natural gas buses or plan to purchase them.
Nationwide, about 20% of the new buses procured in 2000 are natural gas powered.12 Many
of the same engines that have been used in transit bus applications are also used in heavyduty trucks. Over the last several years, the number of natural-gas-powered heavy-duty
trucks in the U.S. has grown more than four fold (see Table 8).
9
However, this table also shows that in certain applications such as taxicabs and shuttle buses, LDVs and MDVs can consume large amounts of
fuel.
10
GGE = gasoline gallon equivalent and DGE = diesel gallon equivalent (referring to energy content)
11
Most of these are CNG buses at the Los Angeles County Metropolitan Transit Authority, but the Orange County Transit District has recently
taken delivery of 61 LNG buses, under the first of several scheduled procurements.
12
NGV Market Overview” information from “Natural Gas Vehicles Compendium of Market Studies and Research,” GRI document #99/0077, RP
Publishing, April 1999, Market data based on annual surveys conducted by Science Applications International Corporation.
Table 7.
Recent heavy-duty natural gas engines certified to CARB’s Low-NOx
Emission Standards
Manuf.
Service
a
Type
Fuel
Type
Displ
(ltr)
NOx
(g/bhp-hr)
PM
(g/bhp-hr)
NMHC
(g/bhp-hr)
Cert. Std.
NOx/PM
HP
MY
2001
Mack
HHD
L/CNG
11.9
1.8
.03
0.3
2.0/0.10
325
2001
DDC
UB
L/CNG
12.7
2.0
.02
0.8
2.5/0.05
330
2001
DDC
UB
L/CNG
12.7
2.0
.02
0.8
2.0/0.05
325
2001
Deere
MHD
CNG
6.8
2.4
.04
0.3
2.5/0.10
225
2001
Deere
MHD
CNG
8.1
2.2
.02
0.4
2.5/0.10
250
b
5.7
1.3
--
0.00
1.5/NA
211/245
2000
Baytech
MHD
Dual
2000
Baytech
MHD
CNG
5.7
1.3
--
0.00
1.5/NA
211
2000
Baytech
HDG
Dual
b
5.7
1.3
--
0.00
1.5/NA
211/245
2000
Baytech
HDG
CNG
5.7
1.3
--
0.00
1.5/NA
211
f
11.9
2.3
0.03
0.3
2.5/0.05
325/350
12.7
2.0
0.02
0.8
2.5/0.05
330
2000
Mack
UB/HHD
L/CNG
2000
DDC
UB
L/CNG
g
2000
DDC
UB
L/CNG
8.5
1.5
0.01
0.8
2.0/0.05
275
2000
Cummins
MHD
L/CNG
5.9
1.8
0.02
0.10
2.5/0.10
150/195/230
2000
Cummins
HHD
CNG
8.3
1.8
0.02
0.6
2.5/0.10
250/275
2000
Deere
MHD
CNG
8.1
2.2
0.02
0.4
2.5/0.10
225/250
2000
Deere
MHD
CNG
6.8
2.4
0.04
0.3
2.5/0.10
225
2000
PSA
d
MHD
2000
PSA
d
HHD
2000
PSA
HHD
Dual
e
7.2
2.2
0.08
1.2
2.5/0.10
200/240/250
Dual
e
10.3
2.4
0.06
1.1
2.5/0.10
305/350
12.0
2.4
0.10
0.5
2.5/0.10
370/410
Dual
a
b
Service Type: MHD (Medium Heavy-Duty); HHD (Heavy Heavy-Duty); UB (Urban Bus); Dual fuel (CNG + gasoline);
d
e
Total Hydrocarbons; Power Systems Associates (using Caterpillar engines); Dual Fuel (CNG + Diesel; or LNG + Diesel)
f
g
L/CNG: Liquefied Natural Gas or Compressed Natural Gas; It also believed that the 400 HP version of the DDC 12.7 L
engine (Series 60G) is certified to the low-NOx standard for HHD applications, but this has not yet been confirmed by CARB
staff.
c
Source: California Air Resources Board website, updated 3/21/01
Table 8. U.S. Growth of NGV populations in the heavy-duty vehicle sector
Type of Heavy-Duty Vehicle
1996
2000
Buses (Transit, School, Others)
1,800
5,000
180%
Medium-Duty Trucks
4,600
7,500
63%
400
2,200
450%
Heavy-Duty Trucks
Growth
Source: NGV Market Overview, presented to the GTI-IWG by R.Gable of GTI, October 2000
13
The numbers of vehicles fueled by liquefied natural gas (LNG) are expected to increase at an
even more rapid rate than CNG-fueled vehicles (Table 9). The key differences and
opportunities for these two types of natural gas vehicles are discussed further in this Market
Assessment, in the context of infrastructure development.
13
NGV Market Overview”, Information from “Natural Gas Vehicles Compendium of Market Studies and Research,” GRI document #99/0077, RP
Publishing, April 1999, Market data based on annual surveys conducted by Science Applications International Corporation
Table 9. U.S. Growth of CNG and LNG Vehicles
Time Period
CNG Vehicles
(All Vehicle Types)
LNG Vehicles
(HD Trucks and Buses)
End of 1996 (actual)
54,700
N/A
End of 1999 (actual)
72,000
~1,000
By End of 2001 (expected)
90,000
>1,300
Anticipated Increase: 1999 to 2001
25%
>30%
Source: NGV Market Overview, presented to the GTI-IWG by R.Gable of GTI, October 2000
It’s expected that California will continue to lead the accelerated deployment of NGVs,
especially LNG vehicles in the heavy-duty sector. According to an LNG market assessment
recently performed for Arthur D. Little by Zeus Development Corporation14 and surveys
conducted by Gladstein & Associates15, the number of LNG vehicles in California is
expected to increase from approximately 135 in 1999 to 653 by the end of 2001. New LNG
buses (267) will show the largest increase, followed by HD trucks (133) and refuse hauler
trucks (118). These projections are shown in Figure 3-2. Air quality regulations such as
SCAQMD’s 1190 Series of fleet rules are among the unique drivers in California that are
expected to play key roles in expanding use of LNG-fueled HDVs (see Table 14 further
ahead in this section).
LNG Vehicle Projections for California
(from Gladstein & Associates, 9-00)
700
650
600
550
500
450
400
350
300
250
200
150
100
50
0
Estimated Number of Vehicles
Medium duty
Refuse collection
Buses
Class 8 HD trucks
1999
2000
2001
Figure 3-2. Estimated Near-Term Growth of LNG Vehicle Populations in California
14
Market Assessment of LNG as a Transportation Fuel for Vehicles in California, Zeus Development Corporation, July 2000, for Arthur D. Little
under work sponsored by the Gas Technology Institute and Brookhaven National Laboratory.
15
LNG as Heavy Duty Vehicle Fuel Project: Final Report, Gladstein & Associates, September 2000, for Arthur D. Little under work sponsored by
the Gas Technology Institute and Brookhaven National Laboratory.
Vehicle Range and Fuel Economy
Two principal engine types are available for natural gas vehicles: 1) spark ignited (dedicated
or bi-fuel), and 2) diesel pilot ignited. The real-world driving range for natural gas vehicles
depends on which engine type is used, and many other factors that include the following:
•
•
•
•
•
•
Size, weight (including load) and type of vehicle (light-, medium- or heavy-duty)
Specific application (e.g., transit bus, refuse hauler, shuttle van)
Vehicle duty and drive cycle
Type of fuel used (CNG, LNG)
On-board fuel storage capacity (volume per tank, number of tanks)
Volumetric efficiency of engine
The efficiency variable alone is highly dependent on vehicle duty cycle (i.e., the amount of
idling, stop-and-go versus driving at highway speeds). Because of these many variables and a
general lack of verifiable data on AFVs in real-world use, it is difficult to present absolute
values for driving ranges of NGVs. As a general rule, field demonstrations of vehicles with
spark-ignited heavy-duty natural gas engines have shown an efficiency penalty of about 25 to
30 percent compared to compression-ignited (diesel) engines, while diesel-pilot-ignited
natural gas engines are about 5 to 10 percent less efficient then diesel. However, this varies
by manufacturer, and new technology is being developed continually. According to
Cummins Engine Company, its spark-ignited alternative fuel engines currently exhibit an
efficiency loss of 10 to 25 percent, but Cummins expects this to be reduced in the next five
years based on “continued improvement” of its products.”16 John Deere uses a proprietary
low-throttling-loss technology in its CNG-fueled 8.1 liter engine. A current test of refuse
haulers in Irvine California has shown that this engine can achieve equivalent thermal
efficiency to diesel engines used in comparable refuse trucks.17
Table 10 provides an overview of estimated range data for various dedicated NGV types
versus the diesel or gasoline vehicle from which they were derived, or most closely
resembles them.
16
E-mail from Edward J. Lyford-Pike,Chief Engineer, Advanced Engineering, Alternative Fuels, Cummins Engine Company, to Jon Leonard of
Arthur D. Little, 12/12/00.
17
Arthur D. Little, Data Collection and Evaluation for John Deere Corporation’s Demonstration of CNG-Fueled Refuse Haulers at Waste
Management, Inc. , Final Report, March 5, 2001
Table 10. Estimated driving ranges for selected dedicated NGVs
NGV Type
Range on
Baseline Vehicle
Range on Closest
NG Version
% Reduced Range
from Baseline
Honda Civic CNG
~450 miles
200-225 miles
50 to 56%
Ford E-250 CNG Van
(Standard)
580
150 to 275 miles
53 to 74%
Ford E-250 CNG Van
(Extended Range)
580
250 to 425 miles
27 to 57%
CNG Transit Bus with
DDC Series 50G Engine
400
300
25%
LNG Class 8 Semi
Tractor with DDC Series
60G Engine
~600
~450
25%
Source: Ranges for baseline vehicles are from combined city/highway estimates from Edmunds.com, where
available, and from diesel controls in HDV demonstrations. Ranges for NGV versions were obtained from vehicle
manufacture literature, the NGV Coalition’s Natural Gas Vehicle Purchasing Guide, and HDV demonstrations.
Range can be a very important vehicle-selection criterion. It’s a primary factor in
determining how vehicles can be used, and the routes they can serve, which are especially
important issues for fleet managers. For example, Table 11 lists two survey respondents who
operate fleets with an average vehicle range of at least 250 miles. Both would seek
“equivalent range” from clean-fuel vehicles before purchasing them. Maximizing the range
of NGVs (as well as virtually all types of AFVs) is very important to achieving their full
commercialization potential. Vehicles that provide less than an acceptable range18 are likely
to be relegated to restricted use in “niche” applications that ultimately may not significantly
advance commercialization efforts for that particular vehicle type and its fueling
infrastructure.19
Table 11. Survey input from end users on average fleet vehicle range
Fleet / End User
Average Fleet Vehicle Range
on Baseline Vehicles
City of Freemont
250-300 miles (inter-city routes)
Freemont Unified
School District
300 miles (suburban routes)
Comments
Lack of equivalent range is an
“existing utilization barrier”
Lack of equivalent range is an
“existing utilization barrier”
18
“Acceptable” range varies by fleet, application and other factors. For typical medium-duty applications, as a rule of thumb at least a 180-mile
range is needed to operate the average vehicle with full utility.
19
For example, in one current demonstration of Class 8 LNG trucks, the reduced range (about 25%) of the LNG trucks has restricted their use to
local deliveries, while the diesel control vehicle makes interstate deliveries with much higher monthly mileage accumulation. Also, reduced range
of CNG buses versus diesel buses has been a significant issue with some transit districts.
Vehicle and Engine Costs
Natural gas vehicles currently cost significantly more than their gasoline and diesel
counterparts. This is largely due to the higher costs of purchasing and installing the fuel
storage systems. Virtually all light- and medium-duty NGVs run on CNG, requiring onboard storage of compressed gas in high-pressure cylinders. These CNG tanks are
manufactured from steel, fiberglass-reinforced steel, fiberglass-reinforced aluminum or 100%
composite materials. Because they are designed for working pressures of 3,000 or 3,600 psi,
CNG tanks are much heavier and more expensive than gasoline or diesel fuel tanks per
amount of energy stored.
Table 12 lists the approximate incremental costs of several commercially available light- and
medium-duty CNG vehicles.
Table 12. Incremental cost of selected light- and medium-duty CNG vehicles
Light- / Medium-Duty
CNG Vehicle
Approximate
Incremental Cost
Honda Civic GX
$4,500
Dodge Ram Van 2500
$7,800
Ford E-Series Van
$5,000 to $6,000
Source: Edmunds.com and manufacturer literature
Price Premium ($)
60,000
$49,500
50,000
$40,000
$40,000
40,000
$33,000
30,000
$25,000
20,000
10,000
LNG Trash
Hauler (WMI
San Diego)
LNG Transit
Bus (OCTA)
LNG Class-8
Truck (Harris
Ranch)
Avg. CNG
School Bus
CNG Transit
Bus
Sources: survey input, Carl Moyer program applications, and discussions with manufacturers, etc.
Figure 3-3. Incremental cost (over diesel version) of selected natural gas HDVs
Heavy-duty NGVs are commercially available in both CNG and LNG configurations. The
total incremental cost of such vehicles typically ranges from about $24,000 to $50,000. The
engine component of this differential cost is typically about $15,000 to $20,000, regardless of
whether CNG or LNG is the fuel. However, heavy-duty CNG vehicles usually have a higher
price premium than LNG vehicles using the same engine. For example, Figure 3-3 indicates
that the incremental cost of an LNG-fueled transit bus is about $9,500 less than the
incremental cost of an equivalent CNG-fueled transit bus. This is largely due to the higher
cost of CNG storage on an energy equivalent basis. Still, on-board storage of LNG is
expensive; a typical LNG truck configured with two cryogenic 119 gallon LNG tanks costs
about $20,000 ($6,000 per tank, plus installation). A diesel fuel tank with capacity to carry
the same amount of energy is significantly less expensive.
Although heavy-duty natural gas vehicles cost significantly more than comparable diesel
vehicles, most use engines that are certified to CARB’s Optional Low-NOx Emission Credit
Standard. As a result, fleets are eligible to receive funds from various sources (e.g., the Carl
Moyer Program, AB 2766, CMAQ, Discretionary) to offset the higher capital costs of these
engines. Current price premiums are largely a function of low manufacturing volumes.
Cummins Engine Company indicated that the incremental cost of its C8.3G and B5.9G
natural gas engines would be significantly reduced if sold in larger volumes, and these
engines could cost less than their diesel counterparts if sold at equivalent volumes.20
Advanced Vehicle Research, Development and Demonstration (RD&D)
Several major programs are underway to improve the commercial viability of natural gas
vehicles, especially in the heavy-duty sector. These programs involve a wide variety of
public and private entities, but all are basically designed to address the following parameters:
1) improve performance, power density and efficiency, 2) further reduce emissions, 3) reduce
cost, 4) broaden product offerings, and 5) improve on-board fuel storage options and increase
energy volumes. Table 13 summarizes some of the major existing RD&D efforts involving
natural gas vehicles, which are designed to address these needs.
20
E-mail from Edward J. Lyford-Pike,Chief Engineer, Advanced Engineering, Alternative Fuels, Cummins Engine Company, to Jon Leonard of
Arthur D. Little, 12/12/00.
Table 13. Examples of major RD&D efforts to improve NGV commercial viability
Name of RD&D
Program
Major Program Objective(s)
Timeframe
Government-industry
consortium headed by DOENREL, with 33 other agencies /
companies / organizations
Design, develop, and
evaluate prototype highefficiency NGV platforms for:
Build prototype
Class 3-6 CNG
and Class 7-8
LNG vehicles by
2004
Low-NOx HeavyDuty Natural Gas
Engine Program
(Contract #1)
Energy Commission, DOENREL, SCAQMD, Cummins
Engine Company, Westport
Innovations
Develop, certify and
commercialize diesel-pilot
(High Pressure Direct
Injection) ISX engine, at or
below 0.5 g/bhp-hr NOx
Certify engine by
late 2002
Low-NOx HeavyDuty Natural Gas
Engine Program
(Contract#2)
Energy Commission, DOENREL, SCAQMD, Detroit Diesel
Corporation
Develop, certify and
commercialize dedicated
engine at, or below 0.5
g/bhp-hr NOx
Certify engine by
late 2002
Gas Technology
Institute
Infrastructure
Working Group
Government-industry
consortium headed by DOE and
GTI, with ~ 25 other agencies /
companies / organizations
Miscellaneous projects to
improve on-board storage of
CNG and LNG fuel
Ongoing over
next two years
Dedicated LNG
ISX Engine for
Class 8 Trucking
Cummins Engine Company,
Westport Innovation
Demonstrate low-NOx LNG
trucks with 15-liter ISX
engine in California and
Canada
Beginning in
2001
Next-Generation
Natural Gas
Vehicle
Participants
•
•
Class 3-6 CNG (MDV)
Class 7-8 LNG (HDV)
Projection of NGV Populations by 2005
Based on existing regulatory drivers and incentive programs, and the number of commercial
offerings available, there will be high demand for natural-gas-powered HDVs in California
for at least five years, and possibly beyond. Regulatory drivers include CARB’s Transit Bus
Fleet Rule and the South Coast Air Quality Management’s “1190 Series” of fleet rules.
Table 14 lists SCAQMD’s adopted or proposed fleet rules affecting HDVs. It indicates that
roughly 16,000 new HDVs to be purchased under five fleet rules will be candidates for
alternative fuels. Currently, heavy-duty engines certified to California’s optional low-NOx
credit standard are predominantly fueled by CNG or LNG. However, the actual number and
rates of NGVs introduced under these rules will be affected by 1) phase-in rates and
exemptions, 2) availability of various engines and vehicles, 3) fleet turnover rates, and 4)
available funding for vehicles and infrastructure. On average, full phase-in of these rules is
expected to occur between 2010 and 2015.
Table 14. SCAQMD’s adopted or proposed fleet rules affecting HDVs
SCAQMD
Fleet Rule No.
Targeted Fleet Type(s)
Estimated SCAB HDV Population for
Potential Conversion to Alternative Fuels
1192
Transit Buses
5,000
1193
Refuse Haulers
6,000
1194
Airport Support Vehicles
500
1186.1
Street Sweepers
700
1196
Heavy-Duty Public Fleets
4,100
Total
16,300
Sources: SCAQMD staff reports on fleet rules, and personal communication from David Coel, SCAQMD, to Jon
Leonard, ADLittle on 3/27/01
For transit buses, there is major overlap between the requirements of SCAQMD’s Rule 1192
and CARB’s Public Transit Bus Fleet Rule. As of March 2001, 66 of California’s 75 transit
agencies have declared that they will comply with CARB’s rule by taking either the “diesel
path” or “alternative fuel path.” Forty of those 66 have selected the diesel path, while 26
have declared the alternative fuel path. Based on these preliminary estimates, about 2,700 of
the 6,800 buses to be purchased under requirements of the rule will be alternative fueled.21 A
large majority of those will be natural gas buses purchased by transit districts in the South
Coast Air Basin, to meet the requirements of SCAQMD’s Rule 1192.
For LDV and MDV markets, SCAQMD’s fleet rules are unlikely to be strong drivers toward
NGV purchases, since those rules allow requirements to be met with the lowest-emitting
gasoline vehicles. California’s recent modifications to the Zero-Emission Vehicle program
require automakers to produce about 100,000 “other” clean vehicles in 2003, with this
number increasing to more than 400,000 by 2006. Vehicles like Honda’s CNG-powered
Civic, which has been declared the first Advanced Technology Partial Zero-Emission
Vehicle (AT-PZEV), may prove to be cost-effective ways to meet these obligations.
However, the same holds true for advanced gasoline vehicles. Meanwhile, unless energyrelated regulations such as EPACT are modified to include fuel-use requirements,22 they are
unlikely to stimulate sales of dedicated NGVs or natural gas fuel. In sum, compared to the
HDV sector, there is greater uncertainty about the numbers of LDVs and MDVs that are
likely to actually use natural gas by 2005, and help expand the CNG (or L/CNG)
infrastructure.
3.1.2
LPG (Propane) Vehicles
LPG (also known as “propane,” in reference to its primary constituent) has long been one of
the most widely used alternative fuels, including use in the transportation sector. Worldwide,
it is estimated that 2.5 million vehicles use LPG fuel; about 500,000 of these are located in
21
22
Fax from Alvaro Gutierrez, California Air Resources Board, to Jon Leonard on April 10, 2001.
Executive Order 13149 (April 2000) requires Federal agencies to “develop a strategy” to reduce petroleum consumption by 20% by 2005. This
can be achieved by increasing fleet fuel efficiency or reducing miles traveled, as well as by using alternative fuels. (Source:
http://www.ott.doe.gov/epact/pdfs/exorder13149.pdf.)
the United States. Commercial fleets in applications such as pickup trucks, taxis, buses,
airport shuttles, and forklifts operate approximately 60% of the LPG vehicles in the United
States. 23
Commercially Available Vehicles / Technological Maturity
Commercial offerings of LPG-fueled cars and light trucks have been mostly limited to bi-fuel
vehicles, which can run on either LPG or gasoline using the same engine but separate fuel
systems. Bi-fuel engines are convenient to the fleet operator, but they significantly
compromise emissions and slightly compromise efficiency. This is because bi-fuel systems
do not allow optimization for the clean-burning, excellent combustion characteristics of LPG.
In recent model years, two medium-duty LPG vehicles have been available in California, and
both use bi-fuel engines (see Table 15). Caltrans (state of California) recently purchased 678
Ford F-150 bi-fuel pickups, and has ordered 300 additional vehicles. The actual volume of
propane that Caltrans has consumed in these bi-fuel vehicles has been minimal, according to
propane suppliers. However, that may change because the State has established a policy to
be a leader in the use of alternative fuels. Caltrans officials have recently expressed interest
in using its fleet of F-150 pick-ups to anchor new propane stations, to be built by Clean Fuel
USA (see Section 4.3).24
Table 15. 2001 MY medium-duty LPG ULEVs available in California
Manufacturer
Model
Fuel
Emissions Certification
Ford
F-150 Pickup
LPG / Gasoline
ULEV
a
Ford
F Series Super Duty
LPG / Gasoline
ULEV
a
Source: NREL Alternative Fuels Data Center website (http://www.afdc.nrel.gov)
a
NREL lists the emissions certification as ULEV, although this vehicle is not listed on the CARB website as
ULEV certified in California.
In addition to these bi-fuel vehicles, GM recently began selling one of the first dedicatedpropane, medium-duty trucks from an original equipment manufacturer.25 Table 22 provides
an overview of this vehicle.
23
Source: Website of the National Alternative Fuel Training Consortium (http://naftp.nrcce.wvu.edu/).
24
Personal communication from William Platz, Delta Liquid Fuels, to Jon Leonard on April 2, 2001. Platz, a principal in Clean Fuel USA, is
working with Caltrans on this plan.
25
The certification of this engine family is in the name of Impco, which makes the propane-specific hardware and software for the engine.
Table 16. GM / Impco's dedicated propane medium-duty truck for 2001.
MY
Manufacturer
Service
Type
2001
GM
MediumDuty Cab
Chassis
Engine Type /
Displacement
Certification
Typical Uses
Vortec 8100 / 8.1 L
LEV 50 State
School bus, open bed,
closed box, general
cargo
Fuel
Dedicated
LPG
Sources: GM website (http://www.gmaltfuel.com) and NREL AFDC website (www.afdc.nrel.gov)
NOTE: GM will reportedly sell a full-sized dedicated LPG van in the 2002 model year.
Two commercially available, dedicated LPG engines have recently been certified to
California’s heavy-duty optional low-NOx credit standards (see Table 17). These are among
the lowest-emitting heavy-duty engines available in the world, and can work in a variety of
medim-heavy duty applications (on-road and off-road). For example, the Cummins B5.9
engine is a versatile powerplant that can be used in a variety of medium heavy-duty
applications. These include large pickups; small school buses; vehicles operated by transit
properties including shuttle buses; step vans; delivery trucks; and port vehicles such as yard
hostlers. The LPG version of the B5.9 engine (195 hp) is available throughout North
America, and there are significant numbers in revenue service.
Table 17. Recent H-D dedicated LPG engines certified to Low-NOx Standards
MY
Manufacturer
Service
a
Type
Fuel
Displacement (ltr)
NOx
(g/bhp-hr)
PM
(g/bhp-hr)
NMHC
(g/bhp-hr)
Cert. Std.
NOx/PM
HP
2000
IMPCO
MHD
LPG
7.4
0.8
--
0.66
1.5/NA
229
2000
Cummins
MHD
LPG
5.9
2.3
0.01
--
2.5/0.10
195
a
Service Type: MHD (Medium Heavy-Duty8,500 26,000lb. GVWR)
Total Hydrocarbons
c
Source: California Air Resources Board website and Executive Orders
A second heavy-duty LPG option is offered by IMPCO, which sells a certified after-market
LPG kit for the 7.4 liter GM engine that provides exceptionally low NOx emissions.
Vehicle Range and Fuel Economy
A gallon of propane contains about 71% and 65%, respectively, of the energy found in a
gallon of gasoline and diesel. Like spark-ignited natural gas vehicles, LPG engines are
somewhat less efficient than gasoline and diesel engines. A typical medium-duty propane
vehicle holds about 15 gallons of fuel, in a single tank weighing about 138 pounds and taking
up 2.0 cubic feet of space.26 Options are available to add a second fuel tank and approach
the energy storage of an equivalent gasoline vehicle, although this increases vehicle weight
and takes up space on the chassis. The net result is that LPG vehicles can provide equivalent
range to conventionally fueled vehicles, at the expense of lower fuel economy and slightly
less cargo space.
26
Western Propane Gas Association, A Few Reasons Why Propane is the Leading Clean Air Vehicle Fuel, supplement to “Technical Resource
Guide” handed out by the San Diego Regional Clean Fuel Coalition at the 2000 Clean Cities national meeting.
Vehicle/Engine Cost
The costs and prices of LPG vehicles are similar to those of CNG vehicles, although onboard
LPG fuel tanks are less expensive than CNG tanks. Light- and medium-duty LPG vehicles
are typically priced about $4,000 to $5,000 more than the gasoline vehicles from which they
are derived. Table 18 lists the estimated incremental costs of three commercially available
LPG vehicles (bi-fuel and dedicated). The incremental cost for the shuttle bus is primarily
due to its Cummins B5.9LPG engine, which is currently sold in low volumes and carries a
significant price premium over the Cummins’ diesel B5.9 (ISB) engine, or even the natural
gas version (B5.9G), due to smaller volume production. This has been a significant barrier to
deploying greater numbers of this extremely clean, dedicated LPG engine.
Table 18. Incremental costs of selected LPG vehicles
Vehicle Name / Type
Fuel and Engine
Incremental Cost
Ford F-Series Super Duty /
Medium-Duty Truck
Bi-Fuel Triton 6.8 L
$5,245
GMC Pickup / Medium-Duty Truck
Dedicated Vortex 8.1 L
$4,000
Shuttle Bus
Dedicated Cummins
B5.9LPG
$15,000
a
Source: NREL AFDC website (http://afdc.nrel.gov)
a
Estimated based on information from Cummins Engine Company and other sources
Advanced LPG Vehicle RD&D
An advanced type of bi-fuel LPG vehicle is being developed by General Motors and GFI
Control Systems; the targeted application will reportedly be fleet vehicles such as police cars
and taxicabs. Similar efforts are underway by other automakers. Also, the U.S. Department
of Energy is reportedly working with one or more auto-manufacturer to develop an
advanced, dedicated LPG vehicle fully optimized for low emissions and high performance
(high range and power, etc.). At this time, however, the time frame for commercial
introduction of these LPG vehicles has not been announced. The Los Angeles Department of
Transportation is demonstrating two hybrid-electric transit buses powered by LPG-fueled
Capstone microturbines. If successfully demonstrated, this type of advanced powertrain
could significantly advance the potential for wider use of LPG in key heavy-duty vehicle
applications.27 For example, the Orange County Transit Authority still operates on-site
propane stations and is considering deploying LPG hybrids with dual 75 kW Capstone
microturbines.28
Projection of LPG Vehicle Populations by 2005
LPG has proven to be an exceptionally clean-burning fuel in dedicated heavy-duty engines,
and greater deployment could yield both significant emissions and major displacement of
gasoline and diesel fuels. A significant challenge involves getting major vehicle and engine
27
Capstone recently announced that CARB has certified its microturbine fueled by LPG, CNG and diesel for use in commercial HEVs, such as
those demonstrated at LADOT.
28
Jim Ortner, OCTA, personal communication to Jon Leonard, April 4, 2001.
manufacturers to build dedicated LPG platforms that are affordable and optimized for the
fuel’s excellent combustion characteristics. This appears to be underway, to a limited extent.
It’s difficult to estimate the number of LPG vehicles that are likely to be on the road by 2005
in California. In part, this depends on what role bi-fuel vehicles will continue to play. Large
fleets such as Caltrans that operate hundreds of bi-fuel F-150 pickups can help displace
petroleum fuels, but only if propane is used instead of gasoline. Currently, there are no
strong energy-related drivers or incentives toward this end. Air-quality drivers such as
SCAQMD’s fleet rules and CARB’s modified ZEV rule may help deploy dedicated propane
vehicles, but that will depend on the degree to which vehicle and engine manufacturers
commit resources to that particular fuel / technology combination.
3.1.3
Electric Vehicles
In 1990, CARB adopted the Zero-Emission Vehicle (ZEV) mandate, which effectively
required that 10% of the new cars offered for sale in California by 2003 would be powered
by battery-electric propulsion systems.29 Over the last decade, the ZEV requirement has
undergone “biennial reviews” by CARB. At the most recent review in September 2000,
CARB staff proposed a number of significant modifications to the program, which were
adopted by the Board on January 25, 2001. These changes were designed to maintain
mandated production of ZEVs, while giving automakers greater flexibility in meeting
individual requirements, as long as equivalent overall emissions reductions can be achieved.
Commercially Available Vehicles / Technological Maturity
Table 19 lists the light- and medium-duty EVs that have recently been available for lease or
sale in California.30 These EVs offer varying ranges and battery types to meet several types
of market niches. According to recent CARB estimates, the six major automakers (General
Motors, Ford, Daimler Chrysler, Toyota, Nissan, and Honda) have produced about 4,100 of
these “pure ZEVs” for the California market, to date.31 Each of these has been powered by a
battery-electric propulsion system, which is currently the only commercially available
technology that satisfies the ZEV definition. As a result of agreements signed between
CARB and certain automakers, many of these EVs have been equipped with advanced
batteries.
29
It has always been recognized by CARB that other zero-emission technologies might eventually emerge, such as direct-hydrogen fuel cell
vehicles, to enable automakers to meet their ZEV obligations. However, “ZEV” and “battery EV” have essentially been synonymous to CARB
when discussing the early years of the program.
30
All these EVs were reportedly available in 2000 (with the exception of the Honda EV PLUS), but many interested customers have claimed that
they have been unable to actually obtain vehicles.
31
California Air Resources Board, About EVs, http://www.zevinfo.com, information “as of March 2000.”
Table 19. EVs recently offered in California
Make / Model of
Recently Offered*
EV
Battery Technology
Driving Range
City / Hwy
(miles)**
Gen II GM EV-1
Advanced Lead Acid
111/113
Gen II GM EV-1
Nickel-metal Hydride
143/152
Chevrolet S-10 Pickup
Nickel-metal Hydride
92/99
Chevrolet S-10 Pickup
Lead Acid
46/43
Honda EV PLUS
Nickel-metal Hydride
125/105
Ford Ranger Pickup
Nickel-metal Hydride
94/86
Ford Ranger Pickup
Lead Acid
84/69
Toyota RAV4
Nickel-metal Hydride
142/116
Nissan Altra EV
Lithium Ion
120/107
Chrysler EPIC Van
Nickel-metal Hydride
92-97
Chrysler EPIC Van
Lead Acid
70/65
Solectria FORCE
Lead Acid
58/50
NOTE: this list excludes low-speed vehicles, including those that are street legal.
*Current availability of these EVs is very limited, and varies by make / model
**Based on standardized tests
Source: California Air Resources Board, About EVs website, http://www.zev info.com, 3/6/01.
Vehicle Range
Reduced driving range compared to conventional vehicles is a major shortfall of
current–technology battery EVs. Table 19 above provides estimated ranges for recently
available EVs.
Vehicle Cost
Perhaps the most controversial aspect of California’s ZEV regulation has involved how much
it will cost to manufacture EVs in small and large volume production, and what their
incremental cost will be to end users. A wide range of estimates have been made from both
proponents and critics of the ZEV regulation, but it is generally accepted that battery-electric
EVs will cost significantly more to manufacturer than conventional vehicles, at least until
high-volume production is achieved and key technological advancements are realized.
Currently, the main cause of higher EV costs are the battery packs, although the battery
industry anticipates significant cost reductions over the next decade.32
Advanced Electric Vehicle RD&D
Many efforts are underway by major automakers to develop and commercialize advanced
EVs designed for high efficiency and increased driving range, among other attributes.
32
Menahem Anderman, Fritz R. Kalhammer and Donal MacArthur, Advanced Batteries for Electric Vehicles: An Assessment of Performance,
Cost, and Availability, Prepared for the California Air Resources Board, June 2000.
Concept vehicles such as the Chevrolet Triax are being developed for advanced modular
design using light-weight composite materials, with the major goals being increased vehicle
efficiency and range at reduced manufacturing costs. The timeframe for commercialization
of these advanced battery EVs depends largely on progress by the battery industry to lower
manufacturing costs and achieve greater specific energy, which is the major parameter
determining vehicle range.
In addition to “pure-battery” EVs, hybrid electric vehicles (HEVs) are also being developed
by many automakers. These vehicles offer the advantages of electric drive (high torque and
increased efficiency at low speeds) while providing performance and range equivalent to or
better than conventional vehicles. Honda recently launched the first commercially available
gasoline-electric hybrid, the Insight, which delivers 70 miles per gallon and offers a driving
range of about 700 miles. Toyota has also started selling its own gasoline hybrid electric, the
Prius. However, these near-term HEVs do not use alternative fuels or charge from the
electricity grid. Therefore, as yet there are no clean fuel infrastructure implications to their
wide-scale use.
Over the longer term, HEVs are expected to be introduced that use clean fuels and/or
charging from the grid. The infrastructure implications of these technologies will be similar
to other vehicles that use clean fuels or EV charging stations. The Electric Power Research
Institute (EPRI) has assembled a working group to compare the impacts and benefits of
various HEV options. The scope of work includes evaluation of the following areas: 1) HEV
architecture, performance, modeling; and impacts; 2) costs; 3) customer preference; and 4)
commercialization issues. The working group focused on a mid-size vehicle platform,
although additional data is being collected on small car and SUV platforms. Results of the
study are expected by mid 2001.
Fuel cell vehicles are another type of EV that offer special promise for commercial
deployment – this is discussed in the next section, covering medium-term technologies.
Projection of EV Populations by 2005
The timeframe for full (self-sustaining) commercialization of battery EVs will probably be a
function of two key factors: 1) regulatory stability, and 2) competition from other
technologies that can provide equivalent emissions benefits. Regarding the first factor, the
California Electric Transportation Coalition estimates that EVs will achieve full
commercialization no later than 2010 “if regulatory factors remain stable.”33 A key
uncertainty was recently clarified when CARB voted to hold firm on the ZEV mandate, even
though modifications were made that may result in fewer “pure ZEVs” produced in the early
years. Among other modifications, auto manufacturers will be allowed to meet their 4% ZEV
obligations with a 50-50 split of ZEVs (essentially battery electric) and vehicles that use
“advanced technologies” and/or cleaner fuels. CARB now estimates that the total number of
ZEVs deployed in 2003 will vary from 4,450 to 15,450, depending on the type of ZEVs the
33
Survey response received from Cecile Martin, Deputy Executive Director, California Electric Transportation Coalition, December 2000.
individual automakers chose to bring to market.34 A reasonable guess is that approximately
10,000 EVs will be on the road in California by 2005.
One conclusion from CARB’s recent review of the ZEV program is that new incentives are
needed to make the production, marketing and purchase of EVs more attractive. To meet
this need, the Zero Emission Vehicle Incentive Program (Assembly Bill 2061) will provide
$18 million statewide to reduce cost of CARB-certified ZEVs bought or leased on or before
December 31, 2002. On December 7, 2000, CARB approved guidelines for implementation
of this program. Individual air districts are now eligible to submit an application to CARB to
implement this program locally and receive funds. While matching funds are not required
from air districts, CARB has further encouraged them to provide additional incentives for
ZEVs and infrastructure.
3.1.4
Ethanol-Fueled Flexible Fuel Vehicles
Commercially Available Vehicles / Technological Maturity
Flexible-fuel vehicles (FFVs) powered by ethanol35 have been offered in the United States by
major manufacturers for several years. As Table 20 shows, at least eight auto manufacturers
have recently offered FFVs that run on E85. Similar models are offered for the 2001 model
year. On the heavy-duty vehicle side, the Los Angeles County Metropolitan Transit
Authority operated several hundred “neat” ethanol (E95 or E100) transit buses in the mid
1990s. However, those particular buses were either retired or converted back to diesel
operation, due to higher fuel and maintenance costs, as well as a lack of product support from
the bus and engine manufacturers.
Table 20. Recent model year E85 FFVs
Manufacturer
Available Models and Years
Chevrolet
All 2000 2.2L S-10 pickups
Chrysler
1998-2000 3.3L minivans
Dodge
All 1998-2000 3.3L minivans
Ford
2000 3.0L Taurus LX sedans (and no cost option on SE and SES series)
Ford
All 1999-2000 3.0L Ranger pickups
GMC
All 2000 2.2L Sonoma pickups
Mazda
Plymouth
36
All 1999-2000 3.0L B3000 pickups
All 1998-2000 3.3L minivans
Source: National Ethanol Vehicle Coalition website (www. E85fuel.com/ffvs.htm)
34
Source: CARB website, (http://www.arb.ca.gov/newsrel/nr012601.htm), 3/6/01.
35
Ethanol FFVs are capable of running on a blend of 15% gasoline and 85% ethanol (E85), or any mixture of E85 and gasoline. Essentially the
same engine technology is used in FFVs that operate on methanol (M85).
36
Also, many 1995-1999 3.0 L Taurus Sedans were FFVs
Range and Fuel Economy
E85 is a relatively high-octane fuel that contains about three fourths as much energy as
gasoline (approx. 82,000 Btu per gallon). When driven on E85, this translates to a
proportional reduction in driving range (assuming the same size fuel tank) for FFVs
compared to similar gasoline-powered vehicles. Estimates for mid-sized vehicles indicate
that more than 350 miles can be driven on an 18-gallon tank of fuel. FFVs operating on E85
get a horsepower boost of approximately 5%-7%.37
Vehicle Cost
The FFV feature comes standard on the vehicles shown in the table above. Since all models
have this feature, there is no incremental cost to the consumer for this capability to operate
the vehicle on E85.
Projection of Ethanol Vehicle Populations by 2005
FFVs that are designed for operation on E85 are already commercially available, as noted
above. Thousands are currently on the road in California, and this is expected to continue as
long as automakers offer the FFV feature as standard equipment on popular models. Future
developments to market more advanced ethanol-fueled vehicles are unknown. No major
automobile or HDV manufacturers have announced plans to commercialize dedicated ethanol
vehicles (E85 or E100) in California. Like methanol, ethanol can be used as a carrier of
hydrogen for fuel cell vehicles (see section 3.2.1), although on-board reforming of ethanol
presents greater technical challenges than methanol. Several manufacturers of reformer
systems are working on “multi-fuel” reformers that include the capability to use ethanol.
However, no information is available regarding any definitive plans by vehicle manufacturers
to pursue this option on their fuel cell vehicles. In sum, the number of E85 FFVs is irrelevant
to potential ethanol infrastructure development unless E85 is actually used, which to date has
not been the case in California. Prospects appear low for dedicated ethanol vehicles to be
commercially available in California by 2005.
3.2
Longer-Term Fuel / Vehicle Technologies
The California Clean Fuel Infrastructure Development Plan acknowledges that certain notyet-commercial fuel and vehicle technologies have significant potential to displace petroleum
fuels within the next decade, and provide emissions reductions. Among the options included
here are advanced internal combustion engine vehicles and fuel cell vehicles using neat
methanol (M100) or hydrogen. In particular, fuel cells38 using methanol and hydrogen fuel
are expected to play roles in meeting California’s needs for zero- or near-zero-emission
vehicles. However, these fuels can also work well in advanced internal combustion engine
vehicles, while providing extremely low emissions. The following sections focus on the use
of methanol and hydrogen in fuel cell vehicles, but the same infrastructure issues and barriers
apply for ICE vehicles using these fuels.
37
National Renewable Energy Laboratory, Alternative Fuels Data Center website (http://www.afdc.nrel.gov/altfuel/eth_general.html).
38
The leading fuel cell technology for automotive propulsion is the Proton Exchange Membrane Fuel Cell, to which this document refers.
Fuel cells offer the advantages of batteries because they derive power from electrochemical
reactions (i.e., no combustion) and utilize electric propulsion systems. Like engines, fuel
cells generate power from an on-board fuel that can be rapidly replenished at a fueling
station. Thus, they can deliver equivalent range and refueling time. Fuel cells can operate on
several fuels, including gasoline, methanol, ethanol and pure hydrogen. Several auto
manufacturers have announced plans to sell fuel cell vehicles by 2004, and prototype
passenger vehicles are now being tested. However, significant technical and cost hurdles
must be overcome before these vehicles are likely to become commercially viable, and
displace significant numbers of conventional vehicles. Perhaps the biggest hurdle pertains to
fuel logistics and infrastructure.
Recently, the Air Resources Board, the Energy Commission and the South Coast Air Quality
Management District joined with a collaboration of auto manufacturers, fuel providers, and
fuel cell developers to form the California Fuel Cell Partnership. This Partnership has
announced plans to demonstrate both LDVs and HDVs with fuel cell engines. Among the
first vehicles that will be deployed are transit buses powered by fuel cells (similar to those
that are already carrying passengers in public demonstration programs in several North
American cities). Based on these activities, it appears likely that fuel cells will be deployed
in heavy-duty vehicle applications first, for all the factors previously discussed that make this
sector conducive to early adoption of advanced technologies and new fuels. The following
sections describe the commercial status and prospects for fuel cell vehicles fueled by
methanol and hydrogen.
3.2.1
Methanol Fuel Cell Vehicles
Technological Maturity
For much of the late 1980s and early 1990s, many light-duty FFVs powered by M85 were
deployed in California. Over the same approximate time period, heavy-duty engines fueled
by M100 were used to power many transit buses in California, as well as numerous heavyduty trucks. At its peak use, methanol was sold at more than 100 public and private facilities
around the state, and methanol-fueled vehicles accumulated tens of millions of miles.39
However, methanol does not play a significant role in California today as an alternative
transportation fuel.
This may change because methanol is an excellent carrier of hydrogen for use in fuel cells.
Several automakers indicate they will design their fuel cell vehicles to run on methanol.
Among those that have methanol fuel cell programs for light-duty vehicles are DaimlerChysler, Toyota, Honda, GM, Ford, Opel, and Nissan. Other programs are focusing on
methanol fuel cells for transit bus applications. On the nearest horizon are systems that use
on-board reforming of methanol to supply hydrogen to the fuel cell engine. For the longer
term, “direct methanol” fuel cells are being developed that will offer the advantages of using
a liquid fuel without the need for onboard reforming.40
39
According to the California Energy Commission, http://www.energy.ca.gov/afvs/m85/index.html.
40
On-board reforming increases costs, lowers vehicle efficiency and results in tailpipe emissions (albeit, at very low levels).
Projected Methanol Vehicle Populations by 2010
Little detailed information is currently available about the methanol-fueled fuel cell vehicles
that are likely to be deployed in California, and when they will truly be ready for
commercialization. It is expected that additional information will be released in the coming
year, through the California Fuel Cell Partnership.
3.2.2
Hydrogen Fuel Cell Vehicles
Technological Maturity
As noted above, several manufacturers have announced plans to produce fuel cell vehicles
that run on methanol or gasoline by the 2004 time frame. However, many of those same
manufacturers are equally engaged in programs to develop and eventually commercialize
“direct-hydrogen” fuel cell vehicles. 41 Such vehicles have potential to provide the highest
efficiency and fuel economy of any currently known, practicable propulsion technology –
while delivering zero-emissions and strong multi-media environmental benefits. Hydrogen is
therefore expected to be the long-term fuel for fuel cell vehicles. On strictly a demonstration
scale, in certain niche applications such as transit buses, direct-hydrogen fuel cell vehicles
are already displacing conventionally fueled vehicles (see Table 21). Much of this work is
being sponsored by the California Fuel Cell Partnership, of which the Energy Commission is
a member.
As the Fuel Cell Partnership recognizes, both heavy-duty (transit) and light-duty fuel cell
vehicles will probably be deployed initially in fleet applications, to accommodate higher
vehicle costs as well as fueling, operation, and maintenance requirements. A goal of the
Partnership is to deploy up to 50 light-duty fuel cell vehicles in California by the end of
2001. Most or all of these demonstration vehicles will be fueled by compressed hydrogen.
For heavy-duty applications, hydrogen-fueled buses will be deployed initially at progressive
transit agencies already having CNG fueling facilities that can make the transition to
hydrogen. As of early 2001, Sunline Transit in Palm Desert has taken delivery of one directhydrogen bus, manufactured by New Flyer with a “Phase 4” XCELLSiS fuel cell engine.
This is the only such bus currently available in the world,42 although it is not yet being
operated in revenue service. By 2003, larger transit districts (>200 buses) that have opted for
the “diesel path” under CARB’s transit bus fleet regulation must begin demonstrating three
of these Zero-Emission Buses (ZEBs). By 2008, they will be required to begin purchasing
ZEBs (two years sooner than if they had selected the “alternative fuels” path).
To date, Sunline Transit has been California’s most aggressive agency to demonstrate
hydrogen buses, but AC Transit may be the first to deploy them in revenue service. Having
chosen the “diesel path” for compliance with CARB’s transit bus fleet rule, AC Transit is
“marshaling resources” to deploy at least 12 fuel-cell powered buses in 2003, and hopes to
41
For example, Ballard Power’s affiliate, XCELLSiS indicates that by 2004 its fuel cell engine system will be “ready for serial production” for both
automobile and urban transit bus applications. on March 26, 2001 Ballard announced that it will supply Mark 900 stacks for XCELLSiS fuel cell
engines that will be integrated into 30 Daimler Chrysler buses. These will reportedly be deployed in European cities by 2003. However, this may
be too optimistic for the U.S. market.
42
Martin Rogers, XCELLSiS, personal communication to Jon Leonard, April 12, 2001.
operate “a largely zero-emission fleet” by the end of this decade.43 To date, AC Transit has
already procured government grants amounting to more than $13 million, and by 2002 it
expects to have at least two fuel cell buses operational as well as a state-of-the-art fueling and
maintenance facility. Sunline Transit, Santa Clara Valley Transit, and at least one other
transit agency are expected to operate buses from the initial 20-bus procurement. DOE’s
National Renewable Energy Laboratory is working with the University of California, Davis
to assist these agencies in the transition to hydrogen, and provide data collection activities.
Demonstrations aside, achieving widespread use of direct-hydrogen fuel cell vehicles will
require vehicle, fuel-production and infrastructure investments of very large proportions. On
the vehicle side alone, major efforts are needed to develop affordable and workable on-board
hydrogen storage systems. Even as fuel cell vehicles begin to achieve commercial status,
much work needs to be done to educate permitting officials, the general public, and business
communities about hydrogen fuel and fuel cell technologies. According to “early adopters”
of hydrogen-fueled vehicles and fueling stations, the largest barrier may be the current lack
of hydrogen-specific codes and standards that provide for safe use of this unique fuel without
being overly burdensome or costly to meet.44
While the magnitude of the task is large, the planning process for direct-hydrogen fuel cell
vehicles and hydrogen fueling stations is underway today.45 Hydrogen is therefore expected
to play a gradually growing role in the California Clean Fuels Infrastructure Development
Plan over the next decade.
Table 21. Examples of hydrogen fuel cell vehicles under development
Notes / Plans for
Commercialization
Vehicle OEM(s)
Fuel Cell OEM
Vehicle Type
To be determined
International Fuel
Cells
Passenger Car
Under demonstration
Daimler-Chrysler
Ballard / XCELLSiS
Passenger Car
NECAR 2, NECAR 4 (Mercedes
A-class)
Ford
Ballard / XCELLSiS
Passenger Car,
SUV
Timeframe unknown
New Flyer
Ballard/ XCELLSiS
Transit Bus
1 now being demonstrated at
Sunline Transit in Palm Desert
Honda
Celanese Ventures
Passenger Car
Timeframe unknown
Hyundai / Impco
Ballard/ XCELLSiS
SUV
Demonstration phase
Vehicle Range and Fuel Economy
As noted previously, internal combustion engine (ICE) vehicles that use compressed or
liquefied natural gas currently deliver significantly reduced range compared to similar
conventional vehicles. Fuel cell engines operate more efficiently than internal combustion
43
AC Transit website (http://www.ACTransit.org).
44
For example, this is a top concern of Sunline Transit Agency’s management concerning expansion of its hydrogen fuel cell bus program.
45
For example, Arthur D. Little and UC-Davis are working with the National Renewable Energy Laboratory to assess the infrastructure needs of
transit districts that will demonstrate a few hydrogen-fueled demonstration buses in 2003, and begin purchasing them in 2008.
engines (ICEs), enabling fuel cell vehicles to get more miles from a given volume of the
same fuel. Direct-hydrogen fuel cell vehicles are especially efficient, because no on-board
fuel reformation process is needed. Also, electric drive systems offer significant efficiency
gains over conventional drive systems, as demonstrated by the Toyota Prius and Honda
Insight hybrid EVs. Putting these factors together, the improved energy-conversion
efficiency of fuel cell vehicles can have a “dramatic impact” on reducing the weight and size
of the fuel storage system.”46 A direct result is that fuel cell vehicles can provide greater
vehicle range than would be available from an ICE vehicle using hydrogen. On the negative
side, any type of hydrogen-fueled vehicle faces the range constraint of reduced energy
content per volume and/or mass of fuel (depending on which form of on-board hydrogen
storage is used). Determining if direct-hydrogen fuel cell vehicles can achieve nearequivalent range to conventional vehicles will require real-world operating experience. It is
expected that such information will begin to emerge in late 2001 from Sunline Transit’s
experience with California’s first fuel cell bus. Also, in mid 2001, Quantum Technologies
(an Impco subsidiary) introduced advanced hydrogen storage technology for vehicle
applications.
Vehicle Cost
Direct-hydrogen fuel cell vehicles today are generally built by converting an existing LDV or
HDV. This includes adding on-board storage of hydrogen and replacing the conventional
engine and transmission with a fuel cell engine and electric-drive system. Fuel storage is a
particularly challenging and costly issue for hydrogen vehicles. While compressed hydrogen
is typically used in today’s prototype vehicles, at least four additional methods are being
considered: 1) liquefied hydrogen, 2) selected metal hydrides, 3) refrigerated superactive
carbon, and 4) carbon or graphite nanostructure47 technology.
Some manufacturers are building fuel cell electric drive systems that are powered solely by a
fuel cell engine, while others are building hybrid drive systems that include a battery pack or
some other source for peak power requirements. In part, this choice depends on what vehicle
application is desired, e.g., passenger cars or a transit buses. Regardless, fuel cell vehicles are
virtually “hand built” today and their current incremental cost significantly exceeds that of
any other mainstream clean-vehicle alternative. With continued progress in building lowcost, high-power-density fuel cell engines, production costs for fuel cell vehicles can be
dramatically reduced. However, a number of major challenges remain before hydrogen fuel
cell vehicles can become cost comparable with conventional vehicles.48
Projected Hydrogen Vehicle Populations by 2010
Given the current barriers and uncertainty on how manufacturers will meet certain regulatory
drivers, it’s difficult to assess the number of fuel cell vehicles that will actually be on the
46
International Academy of Science, Hydrogen Tech Paper #89001, “Hydrogen Fuel Cell Vehicles, “ 1997, by Dr. Roger E. Billings.
47
Associate Professor J. Lin, National University of Singapore, New Discoveries with Hydrogen Storage for Fuel Cell Application, Fuel Cell
Technology Conference-Asia, December 7, 1999; Eldridge, Ken, Nanotubes for Hydrogen Storage, Internet Web site:
http://www.pa.msu.edu/cmp/csc/NANOTUBE-99/puzzles/4.4.html, May 1999.
48
Challenges include cost and supply issues for precious metals and other materials making up membrane-electrode assemblies; the need for
advanced, lower-cost hydrogen storage technology; tradeoffs associated with on-board air compression versus using ambient pressure stacks;
and difficulties with delivery of constant power during transient operation.
road in California over the next 5 to 10 years. One such assessment was made in a document
entitled Blueprint for Hydrogen Fuel Infrastructure, which included both high and low
scenarios for vehicles powered by hydrogen fuel cells.49 In one scenario, the Blueprint
assumed that up to 10,000 vehicles will appear in the new vehicle market in 2003, driven by
California’s ZEV and ZEB regulations.50 In a second scenario, the Blueprint assumed that
only about 50 hydrogen fuel cell vehicles will be demonstrated over the next five years,
through CARB’s ZEB requirement and projects under the California Fuel Cell Partnership.
It appears that the Blueprint’s second scenario is most likely to come to fruition. Based on
the best available information as of mid 2001, it appears that no more than 25 fuel cell buses
will be deployed in California by 2005,51 with perhaps an equivalent number of light-duty
fuel cell vehicles. In 2008, CARB’s transit bus fleet rule requires that California’s large
transit districts on the diesel path begin phasing in ZEBs. Large districts on the alternative
fuel path must do the same in 2010. While there is considerable uncertainty, it is anticipated
that this will result in up to 20 more hydrogen fuel cell buses deployed over the three years
from 2008 to 2010.52
Over the longer term (20 years or more), prospects look promising to significantly displace
petroleum fuels in California through use of hydrogen vehicles. There is little consensus on
the exact timeframe, but many public- and private-sector experts believe that direct-hydrogen
fuel cell vehicles will gradually replace internal combustion engine vehicles as the
predominant mode of transportation in metropolitan areas throughout California and the
United States.
49
Blueprint for Hydrogen Fuel Infrastructure Development, Jim Ohi, National Renewable Energy Laboratory, based on October 1999 workshop
cosponsored by US DOE, California Energy Commission, and the California Air Resources Board.
50
After these numbers were developed, requirements for the ZEV program were changed by CARB that affect automakers’ incentives to produce
direct-hydrogen fuel cell vehicles.
51
52
Ken Koyama, California Energy Commission, personal communication to Jon Leonard on 02/01/01.
This assumes that there are 5 large transit districts (>200 buses), and each will need to procure an average of 8 buses per year, 15% of which
will need to be ZEBs.
4.
Status of the Clean Fuels Infrastructure in California
The numbers of stations that dispense a given clean fuel type, and the quantities of fuels
dispensed, are directly correlated with the types and numbers of vehicles using the fuel. The
previous section provided an overview of existing clean fuel vehicles in California, as well as
those types expected to emerge over the next five years. This section assesses the commercial
status of the fuels themselves and their corresponding infrastructure in California.
4.1
Natural Gas Supply, Demand and Price
Regardless of how it is stored onboard vehicles (CNG or LNG), the raw commodity of
natural gas must be extracted or produced, transported to the end user’s site (if not produced
on site), and prepared for consumption. Two basic forms of natural gas are produced in
California: “associated gas” and “non-associated gas.” Associated gas is produced along with
crude oil, while non-associated gas is not affiliated with oil fields. About 75% of the natural
gas produced in California is associated gas. In 1999, total natural gas production in
California averaged approximately 1.0 billion cubic feet per day. The average production in
2000 was approximately 920.5 million cubic feet per day – a decrease of about 11%
compared to the previous year. The lowest year on record for natural gas production in
California was 1996, which averaged a production rate of approximately 800 million cubic
feet per day. 53
Today, California’s consumption accounts for about 10% of the total natural gas
consumption in the United States. Only about 16% of this demand for natural gas is
currently met by the in-state production levels noted above. On average, about 6 billion
cubic feet per day of natural gas were consumed in California in 1999.54 During months of
peak consumption (i.e., the winter heating months), as much as 7.5 billion cubic feet per day
can be consumed in California. The total amount of gas delivered to California consumers in
1999 was about 2,100 billion (2.1 trillion) cubic feet. Table 22 provides a breakdown of this
by individual use sectors. It indicates that about half of California’s natural gas deliveries in
1999 were for industrial applications (more than one trillion cubic feet), while only about
0.2% (3.3 million cubic feet) was used as a transportation fuel. Although the volume of
natural gas delivered for vehicle applications was a small part of California’s total
consumption, more than half of the natural gas nationwide for this sector was consumed in
California (see last column of Table 22). This is indicative of the leading role that California
has played over the last decade towards “early adoption” of natural gas vehicles.
53
California Department of Conservation: Division of Oil, Gas, and Geothermal Resources, 2000 Preliminary Report of California oil and Gas
Production Statistics, January 2001, from website (http://www.consrv.ca.gov/dog/publications/whatsup.htm).
54
Estimates for California’s 1999 consumption ranges from 5.7 BCF/day (Energy Information Administration) to 6.1 BCF/day (California Energy
Commission).
Table 22. 1999 Natural Gas Deliveries in California by Consumer Type
Consumer
Sector / Application
Deliveries to
Consumers
(Billion Cubic Feet)
% of Total
California
Deliveries
% of National
Consumption for
Sector / Application
Industrial
Residential
Commercial
Electric Utilities
Transportation Fuel
Totals
1,109.4
568.5
244.7
144.7
0.3
2,067.6
53.5%
27.5%
11.8%
7.0%
0.2%
1%
12.3%
12.0%
8.0%
4.7%
58.5%
10.4%
Source: Energy Information Administration, Natural Gas Annual 1999, "California – Natural Gas 1999" p.100, from
EIA website (http://www.eia.doe.gov/oil_gas/natural_gas/nat_frame.html)
To meet the shortfall of supply versus demand, which is roughly 1,850 billion cubic feet
(BCF) per year, California annually imports about 1,200 BCF from other western states and
650 BCF from Canada. Transport of most natural gas into California is accomplished by an
interstate pipeline system with a capacity of about 7.1 billion cubic feet per day, or 2,600
BCF annually.55 With so much of California’s natural gas supply dependent on this pipeline
system, capacity and operational issues are continually reviewed. In November 2000, an
Energy Commission staff report found that “local constraints” in California’s natural gas
pipeline system can be problematic, but “the physical capacity of interstate pipelines appears
adequate, when used in conjunction with in-state storage capability.”56
55
Information in this paragraph was obtained from various documents on the websites of the California Energy Commission
(http://www.energy.ca.gov.gov/naturalgas) and Energy Information Administration (http://www.eia.doe.gov/oil_gas/natural_gas/nat_frame.html)
56
California Energy Commission, “California Natural Gas Analysis and Issues,” Staff Report P200-00-006, November 2000, from website
(http://www.energy.ca.gov/naturalgas).
$40.00
$49.47 on
Dec 8
$35.00
$30.00
Dollars per MMBtu
Canadian supplies at
Malin, OR
$25.00
$20.00
$15.00
$10.00
$5.00
1/26/01
1/12/01
12/29/00
12/15/00
12/1/00
11/17/00
11/3/00
10/20/00
9/22/00
10/6/00
9/8/00
8/25/00
8/11/00
7/28/00
7/14/00
6/30/00
6/16/00
6/2/00
5/19/00
5/5/00
4/21/00
4/7/00
$0.00
3/24/00
El Paso supplies in New
Mexico
Source: Energy Information Administration, briefing for staff of the U.S. House of Representatives, 02/01/01
Figure 4-1. Natural gas spot prices, March '00 to January '01
Over the last decade, prices of natural gas to the consumer have been relatively low and
stable. However, in the Summer of 2000, natural gas spot prices began significantly
increasing, as shown in Figure 4-1. During late 2000 and early 2001, prices reached all-time
highs exceeding $49.47 per MMBtu. As of March 2001, prices began to stabilize back down
towards recent historical ranges between $5 and $8 per MMBtu. Among the contributing
factors to higher natural gas prices were 1) cold weather, 2) high demand (especially from
natural-gas-fueled electricity generators), 3) tight supply, 4) lack of recent supply
development, 5) lack of alternatives to gas delivered through Topock, Arizona, 6) transport
issues (e.g., pipeline limitations), and 7) low storage levels from slow rate of gas
injection.57,58,59
Energy experts indicate that there may be further volatility and higher prices for natural gas
over the next several years. In part, this is because demand for natural gas in California will
57
Statement of Mark J. Mazur, Acting Administrator, Energy Information Administration, before the Committee on Commerce, Subcommittee on
Energy and Power, U.S. House of Representatives, September 28, 2000.
58
California Energy Commission, “Natural Gas Price Increases
(http://www.energy.ca.gov/naturalgas/natural_gas_faq.html), as of December 10, 2000.
59
–
Frequently
Asked
Questions,”
website
Applications to build new California pipeline capacity have been stepped up in recent months, and the US Federal Energy Regulatory
Commission has pledged that it will act “as quickly as possible” to expedite approval of new pipelines (Oil & Gas Journal, March 2, 2001).
increase significantly to alleviate the current energy crisis. California already has more natural-gas-
fired powerplants than any other state, and is now accelerating efforts to bring major
additional electricity generating capacity on line to alleviate its current energy crisis. On
February 8, 2001 emergency action was taken to expedite the review and permitting process
of power generating facilities in California. An additional 20,000 megawatts will reportedly
be brought online by July 2004, starting with 5,000 additional megawatts by July 2001 and
5,000 more megawatts by July 2002.60 In late March 2001, the Energy Commission
approved applications to build three new natural gas plants in central and southern California,
bringing the total of new plants that have been approved since mid 1999 to 13 (8,405 MW of
added power capacity).61
With efforts recently accelerated to add new natural-gas-fired electricity generation plants,
applications to build new California pipeline capacity have also been stepped up. Several
new pipelines serving California have recently been announced.62 The US Federal Energy
Regulatory Commission has pledged that it will act “as quickly as possible” to expedite
approval of new pipelines. 63 California’s two biggest gas utilities, Southern California Gas
and Pacific Gas & Electric, have acknowledged the potential for natural gas supply
constraints and resulting higher prices. While both utilities forecast that natural gas prices for
electricity generation will remain relatively high for the next two to three years, company
representatives have predicted that prices will re-stabilize in mid 2003 to a range between $2
and $3 per MMBtu.64
Prices at the pump for gasoline and diesel fuels also reached unusually high levels in 2000
(see Figure 4-2 and Figure 4-3). According to the Energy Information Administration, world
oil prices reached a daily peak of $37 per barrel in 2000 – the highest rate since the Persian
Gulf War of 1990-1991. Oil prices have since stabilized in the range of $25 to $28 per
barrel, at which EIA projects they will remain over the next several years.65 However, as of
Spring 2001, the price of regular gasoline reached well over $2.00 per gallon, and could
approach $3.00 per gallon due to limited refining capacity. Similar price volatility is
expected for diesel fuel.
60
Source: California Air Resources Board, press release from website (http://www.arb.ca.gov/energy/energy.htm).
61
Governor Gray Davis, Press Release: “Approved Power Plants Will Add Over 2,000 Megawatts,” March 22, 2001.
62
Source: The Electricity Daily: “Calif. Utilities Spurned Pipeline Projects”, Vol. 16, No. 96, May 18, 2001.
63
Oil & Gas Journal, March 2, 2001.
64
Input from representatives of The Gas Company and PG&E at LNG strategy meeting held at Arthur D. Little on February 12, 2001, Fullerton
California.
65
Energy Information Administration, Press Release: “Strong Growth in World Energy Demand Projected,” 3/28/01, from website
(http://www.eia.doe.gov/neic/press/press176.html).
Figure 4-2. Average retail gasoline prices in California, 2000-2001
Figure 4-3. Average rack prices for California diesel fuel, 2000-2001
Longer-Term Outlook
Nationwide, natural gas consumption is expected to grow by about 60% over the next two decades,
66
from 21.4 trillion cubic feet (TCF) in 1999 to 34 TCF in 2020. Rising demand by electricity
generators is expected to account for more than 50% of the increase, eventually surpassing industrial
uses as the largest consumer of natural gas. Demand for natural gas as a vehicle fuel is also expected
to grow significantly by 2020, but the federal government projects that it will remain a fractional
percentage of total use in the United States (see Figure 4-4).
Source: U.S. Department of Energy, Energy Information Administration, Annual Energy Outlook 2001
Figure 4-4. Existing and Projected Growth in NG Consumption for the U.S., by Sector
For the longer term as well as the near term, California’s accelerated efforts to build new
natural- gas-fired electricity generation plants will lead to significant increases in the
statewide demand for natural gas. The Energy Commission has forecasted that the State’s
total natural gas use will increase from about 6.4 BCF per day in 2000 to 7.5 BCF per day in
2010 – with most of the increase resulting from new electricity generation facilities.67 This
has led to concerns that longer-term supplies of natural gas in California – most of which
must be imported via aging pipeline systems – will be insufficient to meet the state’s growing
demand. Related to this is the concern that high demand and constrained supply will
continue to keep natural gas prices high, well above historical trends.
66
34 TCF for 2020 is the mid estimate provided by the Energy Information Administration, Annual Energy Outlook 2001, Report #DOE/EIA0383(2001), December 22, 2000, from EIA website (http://www.eia.doe.gov).
67
California Energy Commission, “California Natural Gas Analysis and Issues,” Staff Report P200-00-006, November 2000, from website
(http://www.energy.ca.gov/naturalgas).
Recent reports from the Energy Commission as well as federal agencies have addressed these
issues. Commission staff concluded that “the substantial North American natural gas
resources can meet the nation’s demand for at least the next 50 years, at current consumption
levels.” The federal Energy Information Administration also concluded that natural gas is an
abundant resource, and the supply by 2020 will be adequate to meet nationwide demand.
EIA reports indicate that technological improvements will help increase production and
restore reserve levels to historical highs. EIA models have predicted that consumer prices for
natural gas in “all end-use sectors” will be “higher in 2020,” but prices in the residential and
transportation sectors are expected to remain within 5% of 1999 levels. Short-term prices are
likely to remain volatile, but EIA expects them to moderate in 2001 and stabilize back in the
range of $3 to $4 per MMBtu.68
Implications of Natural Gas Market Turmoil to CNG and LNG Infrastructure Development
In summary, there is significant turmoil in current natural gas markets, but the long-term
outlooks for supply and price may be favorable. Recent analyses by the Energy Commission
have concluded that 1) natural gas resources available to California (in state production and
imported gas) are adequate to meet demand for at least 50 years, and 2) current high prices
“are a short-term phenomenon.”69 A key federal agency has made similar projections. For
the purposes of this Clean Fuels Market Assessment, it is reasonable to assume that sufficient
supply will be available to meet the relatively small volumes of natural gas needed in the
transportation sector over the next two decades. However, this situation is dynamic and
subject to change, increasing the normal level of risk associated with funding natural gas
fueling stations.
4.2
Natural Gas Fueling Stations
As previously described, natural gas vehicles are commercially available from numerous
major vehicle and engine manufactures. Natural gas is commonly stored onboard vehicles in
two forms: compressed (CNG) and liquefied (LNG). CNG has been the dominant type of
natural gas vehicle sold in the United States, and is likely to remain the leader for light and
medium-duty applications. However, LNG has become increasingly prevalent as a fuel for
transit buses, and some transit properties are now ordering LNG versions of natural gas buses
instead of CNG versions. Recent regulatory actions by CARB and the South Coast Air
Quality Management District are creating additional pressures for manufacturers and endusers alike to deploy alternative fueled HDVs (see Appendix A), and LNG is proving to be a
promising fuel for such applications. This expanded use of LNG in heavy-duty vehicle
applications has resulted in stepped-up activity to fund and build new LNG stations.
Yet another development is the emergence of the “L/CNG” station as a viable alternative to
building CNG stations. These specialized stations can produce CNG by pumping LNG70 to
high pressure, then vaporizing and dispensing it -- avoiding the high costs associated with
68
Natural Gas Market: Status and Outlook, presentation by Barbara Mariner-Volpe of the Energy Information Administration, January 24, 2001,
from EIA website (http://www.eia.doe.gov/pub/oil_gas/natural_gas/presentations).
69
California Energy Commission, “California Natural Gas Analysis and Issues,” Staff Report P200-00-006, November 2000, from website
(http://www.energy.ca.gov/naturalgas). See Figures 6 and 7 in the report.
70
For more information regarding LNG supply and LNG infrastructure see section 4.2.2 “LNG Fuel and Stations”
gas compression at conventional CNG stations. L/CNG stations provide an integrated NGV
strategy for fleets because light-duty CNG vehicles and heavy-duty LNG vehicles can be
fueled at the same facility.
Today a mix of CNG, LNG and L/CNG stations is beginning to emerge in California as a
solid, potentially sustainable infrastructure. Each of these natural gas station types is
discussed further below.
4.2.1
CNG Stations
Number of Stations
As of early 2001, there are approximately 240 CNG stations operating in California. More
than half of these stations have access that is limited to the immediate on-site fleet, or
perhaps select NGV users by special arrangement. Approximately 106 stations offer full or
partial public access. Table 23 provides an overview of these stations categorized by the
owner / operator, the primary types of vehicles fueled at the station, and the estimated
average throughput that exists at a “typical” station today.
Table 23. Overview of Existing CNG Stations in California, by Owner / Operator
SoCal Gas,
SDG&E and
Long Beach
Gas
Pacific
Gas &
Electric
Existing # of
CNG Stations
131
35
5
9
15
5
Primary Type of
Vehicle Fueled
LDVs, MDVs
LDVs,
MDVs
Transit Buses,
HDVs
LDVs,
MDVs
MDVs, HDVs,
Transit Buses
MDVs,
HDVs
Average
Throughput
(GGE*/month)
8,000
5,000
12,000
(standard),
300,000
(transit)
3,000
20,000
15,600
Trillium USA
Pickens
Fuel
FleetStar,
Inc.
Corporation
Pinnacle
CNG
Company
Source: Fueling Infrastructure Survey, conducted mid 2000, California Energy Commission
*GGE = gasoline gallon equivalent. 1 GGE = 125 scf of natural gas, or 1.25 therms.
Existing and Needed Fuel Throughput
“Throughput” refers to the volume of fuel dispensed over a given period of time at a fueling
station. Throughput at each CNG station is a function of 1) how many natural gas vehicles
are fueled, 2) how frequently they fuel, and 3) the volume of CNG dispensed during each
fueling event. Thus, the highest throughput stations are those that serve large numbers of
HDVs (which hold the most CNG and have the highest fuel consumption rates) on a daily
basis. Currently, this description most consistently fits major transit bus operations with
CNG station capacities exceeding 1000 cubic feet per minute. According to input from one
TAG71 member, natural gas throughput at a large transit district can be as high as 300,000
gasoline gallon equivalents (GGE) per month (see table above).
Stations that dispense medium volumes of CNG tend to be anchored by government or quasigovernment facilities such as military bases, small transit properties, and educational
institutions. The majority of natural gas vehicles operated by these entities are typically
medium- and heavy-duty types such as school buses, shuttle buses, meter trucks, cargo vans,
large pickup trucks, package vans, step vans, flat-bed trucks, and service-body trucks.
Ironically, the lowest-throughput CNG stations today are those that are more optimized for
public access and designed to be as user-friendly as possible. These are the public stations
that are not usually affiliated with anchor fleets, and tend to be located at normal gasoline
stations on busy thoroughfares.
In the post-deregulation era, the CNG business is increasingly shifting from gas utilities to
private-sector “turnkey” providers. One result is that low-throughput CNG stations are
becoming candidates for closing, while new large-throughput stations are being built for
heavy-duty fleets. To further assess this trend, the following four turnkey CNG providers
were surveyed in early 2000: 1) Trillium USA, 2) Fleetstar, 3) Pinnacle CNG Systems, LLC;
and 4) Pickens Fuel Corporation. Each has a strong vested interest in California’s natural gas
vehicle fueling market, and is represented on the TAG. These companies were asked to
briefly characterize their involvement in the natural gas fuel business, and how they structure
arrangements with CNG users. The following summarizes their responses.
•
All four companies seek “take or pay” fuel contracts in which the customer will
guarantee a minimum gas throughput ranging from 150,000 to 260,000 gasoline-gallon
equivalents per year (12,500 to 22,000 GGE / month). Such fuel usage typically requires
a large “anchor” fleet of natural gas vehicles.
•
They typically require a minimum contract commitment of five years.
•
Three out of four indicated that HDVs should be the targeted vehicle type for natural gas
use; one indicated interest in serving MDVs on an equal basis.
In mid 2000, these same four companies as well as several California utilities and natural gas
proponents (all TAG members) were sent new, more detailed surveys. Figure 4-5
summarizes input from these TAG members about the average throughput at CNG stations
today, and the throughput that they believe is necessary to invest capital in a new CNG
station. It is notable that the three turnkey companies most involved in the California CNG
infrastructure today – Trillium USA, Pickens Fuel Corporation, and Pinnacle CNG – operate
the stations with the highest average throughput. These companies require at least 13,000
GGEs per month of gas consumption before they are willing to invest capital in a new
station.
71
For a description and additional information on the TAG please see section 2.2 “Technical Advisory Group”
25,000
20,000
20,000
GGE per Month
20,000
15,600
15,000
15,000
Average
Throughput
at Existing
Stations
13,900
12,000
10,000
10,000
8,000
Needed
Throughput
to Justify
New Station
Investment
5,000
5,000
3,000
0
Fleetstar, Inc.
PG&E
Socal Gas
Trillium USA Pinnacle CNG Pickens Fuel
Co.
Corp.
Source of Estimate
Figure 4-5. CNG throughput estimates from TAG members
A number of important dynamics are at work regarding these critical issues of CNG station
access, size, throughput, and other factors. These dynamics will shape the future expansion
of CNG stations in California, because effectively gas utilities will no longer be in the
business of building, owning, or maintaining CNG stations (except possibly stations for their
own vehicles). Consequently, stations that can’t deliver high fuel throughput and attract
major anchor fleets are likely to be candidates for closure.
As an example of these dynamics at work, in early 2000 Shell Oil Company reportedly made
the decision to discontinue selling CNG at its three stations in San Diego County. However,
all three CNG stations remain operational as of early 2001,72 and Shell was considering
allowing a third party to purchase the CNG station components, enabling the stations to
remain open indefinitely.73 However, it is unlikely that any private company can afford to
take on responsibility for the stations unless it has a plan to significantly increase fuel
throughput at these stations. Also, major new investments may be needed to keep such
stations open and viable. One possible explanation of why Shell continues to operate these
unprofitable stations is that a major auto manufacturer reportedly organized a “grass roots”
72
73
Arthur D. Little staff called all three stations on August 4, 2000 and again on March 6, 2001. Each was still selling CNG.
Personal communication from the Escondido Shell station manager to Jon Leonard, August 4, 2000. Corroborated by the California Natural
Gas Vehicle Coalition website at http:\\www.califngv.org.
effort to keep CNG available to individuals and companies operating its NGVs in San Diego
County.74
Current Price of CNG
Figure 4-6 shows Southern California Gas Company’s commodity cost75 for natural gas over
the last three years, and the price that it has charged for CNG at its public stations during that
same time period. It shows that the natural gas commodity and the price of CNG were both
stable until mid 2000, with the retail price being about $1.00 per gasoline gallon equivalent
(GGE, or 1.25 therms of natural gas). However, from May 2000 to December 2000, the
price at the pump increased to as high as $1.67 per GGE.
4-Year History of Natural Gas Commodity Cost and Price at the
Pump, Southern California Gas CNG Stations
Low CNG Pump Price (per GGE)
High CNG Pump Price (per GGE)
Commodity Cost (Per Therm)
1.800
1.600
1.400
Price in $
1.200
1.000
0.800
0.600
0.400
Nov-00
Jul-00
Sep-00
Mar-00
May-00
Nov-99
Jan-00
Jul-99
Sep-99
Mar-99
May-99
Nov-98
Jan-99
Jul-98
Sep-98
Mar-98
May-98
Nov-97
Jan-98
Jul-97
Sep-97
Mar-97
May-97
0.000
Jan-97
0.200
Month and Year
Figure 4-6. The Gas Company’s commodity cost and price of CNG, 1997-2000.
Figure 4-7 shows the average price of CNG for December 2000 at 15 of The Gas Company’s
public access CNG stations. After this data was provided, the price of CNG has decreased
off its December 2000 peak. As of April 2001, a typical price in Southern California is $1.55
to $1.60 per GGE.
The Gas Company’s amortized cost for providing CNG to its customers breaks down as
follows: 51.1% for core gas procurement, 27.4% for gas compression, 8.7% for
74
Comments (speaker unknown) at the EPA Workshop on AFV Infrastructure, Clean Cities 2000, held in San Diego, May 2000.
75
Commodity Cost = (Pump Price - Compression Costs - Transport Costs - Taxes/Fees)
interstate/intrastate transportation, and the remaining 12.8% for various taxes. Gas
compression costs refer to the fully amortized costs of building, owning, operating and
maintaining CNG fueling stations. These various types of costs are further discussed below.
2.000
$1.69
$1.67
$1.69
$1.69
$1.69
$1.55
$1.55
$1.55
$1.69
$1.64
$1.55
$1.55
$1.55
$1.55
$1.55
Price, $/GGE
1.500
1.000
0.500
n
s
Pa
29
St
lm
at
oo
s
ak
O
es
tw
he
W
na
A
io
d
im
y
ne
e
D
nd
le
ow
al
o
G
Sa
R
co
Pi
n
iv
Pe
er
dr
a
de
si
er
iv
R
xn
ar
d
s
O
uy
Va
M
a
Sa
nt
n
ic
on
G
n
de
ar
N
a
ve
ro
pt
om
C
G
Sa
nt
a
B
ar
ba
ra
on
0.000
Station Location
Figure 4-7. December 2000 CNG prices at 15 public access CNG stations
Station Capital Costs
High throughput is vitally important because the current high costs of CNG stations make it
difficult for private industry to achieve a reasonable return on investment. This is a key
barrier to wider deployment of CNG stations nationwide. As Figure 4-8 shows, fast fill
systems of mainstream size (300 to 400 scfm) can cost $500,000, and public-access stations
are significantly more expensive than private-access versions. The capital costs of CNG
stations for large transit bus fleets can reach several million dollars.
Estimated Capital Costs of Building Private- and
Public-Access CNG Stations
800,000
Capital Costs ($)
700,000
600,000
500,000
400,000
300,000
200,000
100,000
0
Pickens
Fuel
Corp.
Pinnacle
CNG Co.
Socal
Gas Co.
T rillium
USA
Cal NGV
Coalition
Minimum Incremental Cost
of Public Access Station
$25,000
$175,000
$50,000
$200,000 $300,000
$100,000
Capital Cost of PrivateAccess Station
395,000
275,000
450,000
400,000
500,000
PG&E
450,000
Source: survey input from TAG members
Figure 4-8. Estimated costs to build CNG stations (approx. 300 to 400 scfm)
For these reasons, private-sector CNG providers primarily seek contracts with fleets that can
consume very high volumes of fuel over a guaranteed period of multiple years (see below).
Station Operation, Maintenance and Training Costs
High operation and maintenance costs (including personnel training) are also major
contributors to the relatively high life-cycle costs for CNG stations. Operational costs can be
especially hard on user fleets because they are often higher than expected, with insufficient
budgets to cover these expenses. Virtually all CNG station components require preventative
maintenance on a regular basis to maintain station reliability. The station operator must either
pay on-site staff to perform the maintenance, or pay for a contractor’s services. Either case
can be very expensive.
As a result, today’s “turnkey” CNG providers essentially sell natural gas compression
services to their customers. These fuel providers are willing to manage all aspects of a CNG
facility’s installation, operation, and maintenance, in exchange for an agreement by the
customer to purchase a minimum throughput of fuel for a set period of time. Increasingly,
fleets with very large throughputs of CNG fuel are executing agreements with these turnkey
companies. For example, the Los Angeles County Metropolitan Transit Authority
(LACMTA) has executed a 10-year capital lease agreement with Trillium USA, under which
Trillium built, owns and maintains two new CNG fueling stations on LACMTA property.
After ten years LACMTA will reportedly purchase the Trillium USA CNG facilities for $1.
For a 200-bus CNG fueling station, it is estimated that this type of contract can offer a 15%
cost savings over ten years compared to a large transit district purchasing and operating its
own CNG stations.76
Trillium USA’s capital lease agreement with LACMTA was the first of its kind for a transit
district in California. These types of agreements may represent the future, but currently they
are available only to fleets buying high volumes of fuel (approximately 15,000 gasoline
gallon equivalents per month). This equates to approximately 25 heavy-duty CNG vehicles
being operated about 100 miles per day, 30 days per month.
Public Access: Hours and Accommodations
CNG stations equipped with the most sophisticated card lock systems -- networked card
readers -- utilize a variety of payment cards and software. These systems may be more
sophisticated than necessary for private stations but are generally considered essential for
public-access stations. Before fueling at most public-access stations in California today, it is
necessary to establish separate CNG accounts with the operator(s). Each site can vary in
their hours of access, equipment, payment method, and on-site assistance. As Table 24
shows, it would require eight or nine different account cards to access all of the public CNG
stations in California.77 In Arizona, where currently at least four fuel-purchase cards are
used, the problem is being addressed with a new requirement: all stations funded by
government grants must install a card reader system that is compatible with Visa or
Mastercard.78 In some cases dual cards are used-one for access control and the second for
verification of payment.
Table 24. Point-of-sale payment options at California’s public-access CNG stations
Payment Option
Number of Stations
Accepting (as of mid
2001)
% of Public Access CNG Stations in
California That Use Payment Option
SoCalGas Card
38
PG&E Card
27
SDG&E Card
8
Long Beach Gas Card
2
Oil Company, Major CC or Cash
7
FleetStar or CFN Card
8
Pinnacle Card
5
Pickens Fuel Corp Card
1
Trillium USA Card
1
"By Arrangement"
6
"Any California CNG Card"
2
Totals
105
Source: California NGV Coalition website (http://www.califngv.org), list of CNG stations
76
36.2%
25.7%
7.6%
1.9%
6.7%
7.6%
4.8%
1.0%
1.0%
5.7%
1.9%
100.0%
Based on private communications with Jan Hull of Trillium USA, and ADLittle’s ongoing work to assess the costs of CNG infrastructure.
77
78
California Natural Gas Vehicle Coalition website, Fueling Stations Directory.
GRI Final Report, CNG Transit Fueling Station Handbook.
To a limited extent, government and industry representatives have already worked together to
address this barrier. However, there is a consensus in the industry that greater efforts are
needed to establish a single network for user-friendly and affordable point-of-sale payment
options. Table 25 lists the existing and needed efforts in these areas, according to members of
the TAG. Recently, the Energy Commission joined forces with the National Renewable
Energy Laboratory, the South Coast Air Quality Management District (SCAQMD), natural
gas retailers, and the card reader industry to develop an open architecture for card reader
systems that will help expand and streamline the use of natural gas vehicles (as well as other
AFV types).
Table 25. Summary of TAG input on existing and needed CNG payment RD&D
Source
Pickens Fuel
Corporation
Trillium USA
Current Point-of
Sale Options
EJ Ward and Multi
Force (California),
Autogas (Arizona)
Autogas, EJ Ward,
Visa, MasterCard
Issues and/or RD&D Needs
♦
♦
♦
♦
Investigating user-friendly payment, i.e., MasterCard and Visa
accessibility. Demonstrating “beta” station in Los Angeles with Multi Force
Lack of reliable card readers is the “weakest link” in stations
CNG stations must be unattended for cost reasons
Potential conflicts exist with UBC operator training requirements, which
would be detrimental to widespread use
FleetStar
CFN
♦
♦
Assurance of user training
Release of liability
The Gas
Company
EJ Ward
♦
♦
PG&E
Tech 21
♦
Need a debit or credit card or a ubiquitous fueling card
Need special funding to replace all NG card systems and dispensers
throughout the state (like gasoline).
Need dispensing system algorithm
Pinnacle
Pinnacle Card
♦
♦
Need non-attended VDM
Need RS232 plug in for vehicle information and authorization
California NGV
Coalition
CFN, EJ Ward,
♦
Autogas, Gasboy, ♦
Tech 21
♦
Source: surveys received from TAG members
Various cards are incompatible
Very limited Voyager / Visa / cash capability at present
Need fuel network development and demonstration
Building Codes and Standards
There are a number of specific codes and standards that must be met when building and/or
operating CNG stations. Input from TAG members on these requirements are summarized in
Table 26. Of these various codes and standards, the Uniform Building Code and NFPA 52
are the highest tier, and all others are somewhat secondary.
Table 26. TAG member input on codes and standards for CNG stations
Gladstein &
Associates
NFPA 52, CCR
Title 8, Division 1,
Chapter 4,
Subchapter 1,
Unfired Pressure
Vessel Safety
Orders., NFPA 70
SoCal Gas,
SDG&E and
Long Beach
Gas
Pacific Gas
& Electric
UBC, NFPA 52,
NEC, ASME
Standards, etc.
UBC, NFPA
52, NEC,
UFC
Trillium
USA
FleetStar,
Inc.
UBC, NFPA
NFPA 52,
local building
52
codes, etc.
Pickens
Fuel
Corporation
NFPA 52,
NFPA 59
Pinnacle
CNG
Company
California
NGV
Coaltion
NFPA 52,
Retail
NFPA 70,
metering
ANSI, ASME (CA DMS),
NFPA 52,
proposed
NFPA 30
UBC= Unified Building Code; NFPA 52= National Fire Protection Association Code 52: Compressed Natural Gas (CNG)
Vehicular Fuel Systems Code, 1998 Edition; NFPA 70= National Fire Protection Association Code 70: National Electrical
Code; CCR= California Code of Regulations; ASME= American Society of Mechanical Engineers; NEC= National Electrical
Code; ANSI= American National Standards Institute
Time Horizon for Full Technological Maturity
In addition to natural gas supply and price issues, expansion of the CNG infrastructure will
depend on growth in deployment of high-fuel-use vehicle sectors. In the heavy-duty sector,
where the largest volumes of fuel are consumed, CNG is facing a major challenge from LNG
as the preferred form of natural gas fuel. For light- and medium-duty NGV applications,
which have long been dominated by the conventional CNG fueling option, L/CNG is
emerging as a very attractive alternative for certain fleets. In addition, regulatory drivers are
currently minimal for using AFVs in the LDV and MDV sectors: conventionally fueled
vehicles already meet stringent emissions standards, and energy-related regulations such as
EPACT do not include requirements that have been effective in stimulating alternative fuel
use.
In early 2000, the four major “turnkey” providers of CNG were surveyed about the current
and future state of the CNG business in California. Among the findings of the survey were
the following:
•
Two of the three current providers of CNG indicated that their growth projections for the
expansion of CNG stations are high. The third current provider projected medium
growth. The fourth company has decided to focus its business on providing LNG and
L/CNG instead of conventional CNG.
•
Only one of the four companies indicated that government funding is of high importance
in the future of natural gas fueling stations. The far greater driving factor for all of these
companies is a high return on investment through major, immediate fuel demand and
throughput. However, government funding for end users was identified as essential in
the early years of commercialization.
To follow up on this information and expand the database, these same companies were sent
infrastructure surveys in mid 2000. Several of California’s natural gas utilities were also sent
this survey. Table 27 summarizes part of the input that was received from these TAG
members.
Table 27. Summarized survey responses on long-term horizon for CNG
Survey Parameter
Expected Timeframe
for Full
Commercialization
SoCal Gas,
SDG&E and
Long Beach
Gas
Pacific Gas
& Electric
Trillium
USA
FleetStar,
Inc.
Pickens Fuel
Corporation
Pinnacle CNG
Company
~10 years
Now
10 years
5 years
Now
Now
Number of Fueling 100 public
Stations Needed in access stations
California
in the South
Coast region
Throughput Needed 18,000 to
for Full Commercial 21,000
Status (GGE/Month)
Now
Depends on Unknown –
definitions
gasoline
equivalent
should be
the target
Each station is a
stand-alone profit
center. Critical mass
not needed.
Now
Now
20,000
20,000 for
“breakeven” point for
PFC and customer
Now
10,000
These same companies and other TAG members provided input on their existing RD&D
activities for the CNG infrastructure, and their priorities for additional efforts. Table 28
summarizes this information. TAG members were also asked to identify the most important
barriers to a sustainable CNG infrastructure, and the types of existing and new incentives that
can help overcome those barriers. That input is summarized in Table 29.
Table 28. Summarized responses on RD&D for CNG infrastructure
TAG Member
Existing Infrastructure RD&D
The Gas Company
New public dispenser (3600 psig, 10
GGE/min)
Universal control terminal and billing system/system
changeout
New debit card
Standardized fueling pressuretemperature/dispensing controls
Improved billing card system and
dispensers for all public stations
Priority List for Further RD&D
Greater standardization of equipment
Measurement between fuel control terminal and utility
fueling meter
California NGV
Coalition
Ongoing work with GTI IWG
RD&D is focused toward greater
efficiency through standard-ization and
modularity
Standard state-wide design that incorporates all
fire/safety and code conformity
Fuel network development and demonstration
PG&E
Ongoing work with GTI IWG
Dispensing algorithm, low-cost compressor
Trillium USA
Ongoing R&D and commercial
deployments
Access to continuous (web-based) updates of current
infrastructure and related projects
FleetStar, Inc.
Ongoing R&D with GTI IWG
Cost reductions for stations and equipment
Pickens Fuel
Looking at different technologies to
dispense fuel, welcome R&D beta sites
for fuel delivery and production
Reliable card readers
Pinnacle CNG
Higher compression efficiency
(None provided)
South Coast AQMD
Investigating feasibility of modifying
existing stations for greater use by
HDVs
(None provided for CNG)
Table 29. Summarized responses on existing barriers and needed incentives
TAG Member
The Gas Company
Major Barriers to Infrastructure
Expansion
Incentives Needed to Overcome
Throughput requirements
Tax breaks at Federal and State levels
Equipment and station costs
Tax relief for cost of natural gas
Lack of common card system, and
gasoline ease-of-use
More grant funding for capital costs
Rebates from OEMs and regulating
entities
Special funding to convert all card
systems and dispensers in the State
California NGV Coalition
Permitting delays, variable utility
service extension policies, delays in
vehicle incentives, fuel card
authorization
Bare bones “commercial only”
perception
(Funding for) fueling network
demonstration
Pro-CNG PUC policy on service
extensions
Local agency education and incentive
expediting
PG&E
Cost and location with available gas
Tax incentives and grant funding
Trillium USA
Increased fuel demand
Fleet incentives and mandates to use fuel
(not just buy vehicles)
Reduced fuel sales tax
(Expanded access to) HOV lanes
FleetStar, Inc.
High cost of stations
Funding and tax incentives
Pickens Fuel
Slow delivery of OEM vehicles
Greater demand for vehicles (and fuel)
Pinnacle CNG
Available vehicles and mandated
changes
Tax incentives for station operator and
end user / fleet
South Coast AQMD
Cost, cost, cost
A continuing source of infrastructure
funding is needed
Fleet perceptions that fueling must
be on-site
The current CNG network is tailored to
LDVs while demand is for HDVs.
Detailed input about the expected timeframe for full commercialization of the CNG
infrastructure was provided by the California Natural Gas Vehicle Coalition (CNGVC).
Table 30 provides a summary of specific input about station expansion requirements received
from CNGVC executives. CNGVC executives believe that continued growth can be
sustained for the next 15-20 years, after which it may be possible and necessary to convert
the CNG infrastructure over for compression of hydrogen (for fuel cell vehicles) that is
reformed from natural gas on site. The CNGVC acknowledges that continued growth will
require lower-cost stations achieved through a variety of advancements (e.g., increased
efficiency through standardization and modularization of stations).
Table 30. Projected need for expansion of CNG stations in California.
Market Element
Current
Projected Future Need
Number of CNG & L-CNG Stations
230
2,500
Share of Vehicle Fuel Market
(by Volume of Fuel Dispensed)
0.3%
6%
Approximate Gasoline Gallon Equivalents (GGE) Pumped
/ Year
50 Million
1 Billion
Approximate GGE / Station / Year
217,391
400,000
Approximate GGE / Station / Month
18,116
33,333
Source: survey input from the California NGV Coalition, mid 2000
Advanced Infrastructure RD&D for CNG
Several major programs are underway to improve the commercial viability of CNG fueling
stations. These programs involve a wide variety of public and private entities, but all are
basically designed to 1) reduce lifecycle costs, and 2) improve performance, efficiency, and
customer access / ease of use. Table 31 summarizes some of these major efforts.
In addition, there are a number of new activities underway to fund new, state-of-the-art CNG
fueling facilities. For example, the SCAQMD recently approved “creative settlements” with
the Los Angeles Department of Water and Power and AES Alamitos, LLC, for violations of
rules and permit conditions. Included in the settlements is a requirement that each entity
provide $6.0 million towards expansion of public-access natural gas fueling stations in
Southern California. The SCAQMD Board designated $6 million from an AES settlement
of to fund clean fuel infrastructure projects for natural gas vehicles. In March 2001,
SCAQMD issued an RFP allocating $4.6 million to build multiple natural gas fueling station
for public access and up to $1.4 million to construct or upgrade publicly accessible natural
gas fueling stations for use by taxicabs and other natural gas vehicles.79
79
South Coast Air Quality Management District, Board Agenda No. 3, February 16, 2001.
Table 31. Major RD&D efforts to improve the CNG infrastructure
Name of CNG
Infrastructure
Program
Participants
Major Program Objective(s)
and /or Projects
Timeframe
Next-Generation
Natural Gas
Vehicle
Govt.-industry
consortium headed by
DOE-NREL, with 33
other agencies /
companies /
organizations
♦
Support next-generation NGVs by
enhancing CNG fueling and
maintenance infrastructures
Ongoing
through at
least 2004
Gas Technology
Institute
Infrastructure
Working Group,
(CNG
Subcommittee)
Govt.-industry
consortium headed by
DOE and GTI, with ~
25 other agencies /
companies /
organizations
♦
♦
Recommended practices for station
design, construction and operation
Station bid specification handbook
Ongoing
through at
least 2002
♦
♦
Technology exchange forum
Electronic access and billing network
♦
Consistent fuel metering technology
♦
♦
Improve metering systems
Enhanced fueling nozzles
Summary of Major Barriers and Impediments
Removing barriers to the CNG fueling network is a high priority for proponents of natural
gas vehicles. Vehicle expansion will depend on a significant increase in the number of
fueling stations, in parallel with a major increase in vehicle demand. Both private fleet and
public access stations are needed, but neither type is likely to be successful unless the private
sector can achieve a sufficient return on investment by selling high volumes of fuel.
Specific threats and barriers to expansion of the network for conventional CNG stations
include the following:
•
Competition from conventionally fueled vehicles for low emissions, especially in LDVs
and MDVs
•
Lack of effective fuel-use requirements in existing energy-related regulatory drivers
•
California’s ongoing energy crisis in general, and competing demand for natural gas to
fuel new power plants, in particular
•
High capital, operation and maintenance costs for CNG stations
•
Lack of standardized, modular station design
•
Lack of an open architecture for CNG station card readers
•
Constraints in the natural gas pipeline system, or lack of sufficient gas supply for
transportation use in some California regions
•
Competition from LNG to capture greater market share in heavy-duty applications (see
Section 4.2.2)
•
Competition from L/CNG stations to reduce demand for conventional CNG stations (see
Section 4.2.3)
4.2.2
LNG Fuel and Stations
Natural gas liquefies at very low temperatures (minus 258 degrees Fahrenheit at ambient
pressure). Advantages of LNG include the fact that it is relatively free of impurities (98%
methane) and has an energy storage density about 3.5 times that of CNG. While the energy
density of LNG is nearly as high as conventional fuels (gasoline and diesel), it must be stored
at very low temperatures, while controlling its high volatility to minimize boiloff
(evaporation). This requires properly designed cryogenic equipment consisting of doublewalled, stainless steel “superinsulated” vacuum tanks that limit energy transfer (heat) from
outside the tank to the cold liquid inside. Because on-board storage of LNG is most
conducive to larger vehicles, LNG is used primarily in HDV applications such as transit
buses, refuse trucks, long-haul trucks and locomotives. As it is drawn from the onboard fuel
tanks, LNG is vaporized from the engine’s heat. Thus, the fuel that enters the engine is a
gaseous mixture as in CNG vehicles, but of higher purity methane.
Number of Stations
As of early 2001, there are an estimated 135 LNG-fueled vehicles in California. These
vehicles consume about 2.5 to 3.0 million gallons of LNG each year, and are currently
fueled at eight existing LNG stations (see Table 32). With annual demand expected to
grow to approximately 13 million LNG gallons within another year80 (see Figure 4-9),
numerous additional LNG stations are currently under construction in California (see
80
Source: from Zeus Development and Gladstein & Associates, Market Assessment of LNG as a Transportation Fuel in California, July 2000, for
Arthur D. Little.
Table 33) or planned by 2004 (see Table 34). Many of these stations are being financed in
part through government funds (e.g., the Energy Commission and air pollution control
districts). Several existing or future stations include the L/CNG feature – this is discussed in
the next section.
Table 32. Existing LNG and L/CNG stations in California, by owner / operator
Station Operator / Name
Location
Capacity
(LNG gal)
Major Vehicle Type Served
Harris Ranch
Coalinga
15,000
Diesel pilot Class 8 LNG trucks
L.A. Int’l Airport
Los Angeles
20,000
Dedicated LNG buses, dump trucks
Raley’s
Sacramento
13,000
Dedicated LNG Class 8 trucks
Taormina Industries
Anaheim
FleetStar / UPS*
Ontario
6,000
Dedicated LNG Class 8 trucks, misc.
Vons Groceries
Santa Fe Springs
15,000
Dedicated LNG Class 8 trucks
OCTA Garden Grove
Garden Grove
50,000
Dedicated LNG Transit Buses
Palm Desert
15,000
Dedicated LNG refuse packers and 2
“superbuses”
Waste
Management
Sunline Transit
*L/CNG stations
/
Not available
Diesel pilot Class 8 refuse packers
Table 33. LNG and L/CNG stations under construction in California
Station Operator / Name
Location
City of Sacramento*
Sacramento
City of San Diego
San Diego
Expected
Opening
Major Vehicle Type Served
2001
TBD
Early 2001
Diesel pilot / dedicated refuse packers
County of Sacramento*
North Highlands
2001
County Waste Management
Waste Management
City of Tulare*
El Cajon
Tulare
2001
2001
Dedicated refuse packers
Miscellaneous LD, MD & HDVs
*L/CNG stations
Table 34. Planned LNG and L/CNG Stations
Station Operator / Name
Location
Expected
Opening
Expected Major Vehicle
Type to be Served
City of Barstow*
L.A. Dept. of Public Works
OCTA Anaheim
OCTA Santa Ana
Riverside County
Santa Monica Bus
Barstow
Sun Valley / East Valley
Anaheim
Santa Ana
Riverside
Santa Monica
TBD
2003
2001-2002
2004
2001
TBD
Transit buses
Refuse haulers
Transit buses
Transit buses
Burrtec waste haulers
Transit buses
Omnitrans
Omnitrans
Waste Management
City of Bakersfield
Waste Management
Waste Management
USA
Waste
Management)
*L/CNG stations
San Bernardino
Montclaire
Corona
Bakersfield
Simi Valley
Palmdale
Fresno
TBD
TBD
TBD
TBD
TBD
TBD
2001-2002
Transit buses
Transit buses
Refuse haulers
TBD
Refuse haulers
Refuse haulers
Refuse hauler & misc.
(Waste
LNG gallons / year
16,000,000
14,000,000
12,000,000
10,000,000
8,000,000
6,000,000
4,000,000
2,000,000
0
1999
2000
By end of 2001
Source: Zeus Development Corporation
Figure 4-9. Existing and Projected Near-Term LNG Consumption in California
Existing and Needed Fuel Throughput
As with CNG stations, LNG throughput at a given station is a function of the types and
numbers of vehicles fueled, and the frequency of fueling events. Currently, LNG is almost
exclusively used in HDV applications that are conducive to high fuel use (e.g., transit, refuse
haulers, and Class 8 trucks). As a result, the existing LNG stations in California all tend to
have high throughputs. According to input from TAG members, a typical range is 15,000 to
50,000 GGE per month.81 The projected change in consumption of LNG in California shown
in Figure 4-9 assumes that each vehicle will consume 20,000 gallons of LNG per year. At
that rate of consumption, 15,000 to 50,000 GGE per month at a given station requires
between 15 and 50 LNG trucks fueling about 25 days per month.
Current Price of LNG
LNG is taxed less than diesel fuel but more than CNG, although government fleets get
special exemptions. At the time the TAG was surveyed in mid 2000, the average price per
LNG gallon in California was approximately $0.50 without tax, or about $0.65 per gallon
fully taxed.82 Fleets such as Orange County Transit Authority have negotiated long-term
contracts for LNG as low as $0.38 per gallon before tax.83 The price of LNG has generally
been less volatile than that of CNG during the recent energy crisis, suggesting that there is
less direct correlation between the pipeline cost of natural gas in the Western U.S. and the
resale of LNG by suppliers.84 Still, prices have recently increased, and a long-term price for
a large fleet today might cost about $0.55 per gallon or higher.
The economics of using LNG as a heavy-duty fuel largely depend on the relative prices of
diesel and LNG. Table 35 compares a few plausible pricing scenarios for LNG and diesel, to
estimate relative fuel prices to a large private HDV fleet on an energy equivalent basis. 85
This comparison takes into account the higher brake-specific fuel consumption (about 20%)
currently exhibited by most dedicated spark-ignited heavy-duty natural gas engines. As just
one scenario, it shows that LNG can be competitive with diesel (under the assumptions
shown) when their untaxed prices are in the ranges of $0.60 and $1.00 per gallon,
respectively. However, this comparison does not consider all life-cycle factors (e.g., the cost
of maintenance garages, vehicle incremental costs, etc.). A more detailed study is currently
underway that compares the full-annualized life-cycle costs of LNG versus diesel in various
types of a 50-unit HDV fleets. Preliminary estimates indicate that LNG can achieve overall
81
Because LNG displaces diesel and not gasoline fuel, from the perspective of fuel consumption it is most useful to discuss LNG in diesel gallon
equivalents (DGEs) instead of GGE. However, GGEs are the commonly used unit for fueling station throughput.
82
From survey input by Erik Neandross of Gladstein & Associates, October 2000.
83
Jim Ortner, Orange County Transit Authority, personal communication to Jon Leonard, 4/3/01.
84
E-mail from Gary Pope, USA PRO, to Jon Leonard of Arthur D. Little, December 12, 2000.
85
Fleets normally buy fuel before taxes, and then pay all applicable taxes to various agencies – this table assumes a private fleet paying all
potential taxes. The federal excise tax for LNG is assessed on a per-gallon basis, while the State fuel use tax for LNG vehicles is a flat annual
fee. The table shows an estimated conversion of that flat fee to a per-gallon basis.
cost parity with diesel when its before-tax price is roughly $0.64 per (LNG) gallon less than
the untaxed cost of a diesel gallon.86
Table 35. Comparison of diesel and LNG price scenarios
low
$
$
$
$
$
$
Diesel Price ($/gallon)
high
mean
0.800 $ 1.200 $ 1.000
0.243 $ 0.243 $ 0.243
0.180 $ 0.180 $ 0.180
1.223 $ 1.623 $ 1.423
0.101 $ 0.134 $ 0.117
1.324 $ 1.757 $ 1.540
low
wholesale price
$
federal excise tax
$
State fuel use tax
$
Subtotal
$
8.25% sales tax
$
Total Price per LNG Gallon
$
Total Price per DEG
$
Total with 20% BSFC Penalty $
LNG Price ($/gallon)
high
mean
0.500 $ 0.700 $ 0.600
0.119 $ 0.119 $ 0.119
0.008 $ 0.008 $ 0.008
0.627 $ 0.827 $ 0.727
0.052 $ 0.068 $ 0.060
0.679 $ 0.895 $ 0.787
1.152 $ 1.520 $ 1.336
1.383 $ 1.824 $ 1.603
wholesale rack price
federal excise tax
State fuel use tax
Subtotal
8.25% sales tax
Total Price
Best-case LNG pricing
Worst-case LNG pricing
Average LNG pricing
Range of Diesel versus LNG Cost Differentials [$/DEG]
Relative Cost
Diesel
LNG
Difference
$ 1.757 $ 1.383 $ (0.374) LNG cost is -21% lower than diesel
$ 1.324 $ 1.824 $ 0.500 LNG cost is
38% higher than diesel
$ 1.540 $ 1.603 $ 0.063 LNG cost is
4% higher than diesel
Definitions: BSFC = Brake Specific Fuel Consumption, DEG = Diesel Equivalent Gallon
Station Capital Costs
According to input from TAG members involved with LNG infrastructure development, the
capital cost of building an LNG station (~15,000 gallon capacity) ranges from $650,000 to
$800,000 (excluding land costs). These estimates are consistent with information provided by
Chart Applied Technologies, a major vendor of LNG fueling stations. As of early 2001,
Chart’s prices (including setup, installation and operational training) range from about
$50,000 for a single-hose “demonstration fueler,” to about $1.37 million for a top-of-the-line
LNG station with four dispensers (see Table 36). However, other sources indicate that highthroughput LNG stations for large fleets (50,000 gallons of storage) can cost as much as $3.0
million for fueling station hardware, and $4.5 million when taking into account all necessary
site and building upgrades.87
86
Arthur D. Little, Comparison of Annualized Life-Cycle Costs: SI-LNG Versus Diesel in a 50-Unit Fleet with 8-Year Replacement Life,
preliminary model, April 2001.
87
Jim Ortner, Orange County Transit Authority, personal communication to Jon Leonard, April 3, 2001.
Table 36. Ranges of LNG Station Prices from Chart Applied Technologies
# of
Dispensers
Storage
(LNG gal)
Fleet Size (#
of HDVs)
Station Price Range (with
Installation)
Demonstration Fueler
(VLNG 230)
Mobile Refueler without truck
purchase (ORCA)
Lowest Cost Integrated Skid,
no fuel metering (Skidded
6000)
Base Fueling Integrated Skid,
10% accuracy meter (Std.
15/1)
Modular Station, Weights and
Measures Dispenser
(Mod.15+/1)
Modular Station, W&M
Dispensers, capability for
adding more storage
(Mod.15+/2)
Modular Station, W&M
Dispensers, capability for
adding more storage (30+/3)
1
1-2
~$50,000
10-30
~$150,000 to $230,000
1
Not
Available
Not
Available
6,000
27-60
~$250,000 to $500,000
1
15,000
27-60
~$500,000 to $610,000
1
15,000+
27-60
~$600,000 to $650,000
2
15,000+
27-80
~$600,000 to $700,000
3
30,000+
(2X15,000)
75-135
~$1,100,000 to $1,200,000
Modular Station, W&M
Dispensers, capability for
adding more storage (30+/4)
4
30,000+
(2X15,000)
75-175
~$1,200,000 to $1,250,000
Standard Station, W&M
Dispensers (45/4)
4
45,000
(3X15,000)
135-210
~$1,250,000 to $1,375,000
Station Type (Designation)
1
Source: adapted from materials provided by Chart Applied Technologies, LNG Vehicle systems Training
Seminar, February 2001.
Station Operation, Maintenance and Training
On a fuel throughput basis, LNG stations have significantly lower O&M costs than CNG
stations. The main reason is that LNG stations do not need gas compression and drying
systems. Still, LNG stations require significant scheduled maintenance activities. Similar to
the situation with CNG, “turnkey” LNG providers are emerging that are willing to manage
all aspects of a LNG facility’s installation, operation, and maintenance, in exchange for an
agreement by the customer to purchase a minimum throughput of fuel for a set period of
time. Pickens Fuel Corporation is one such operation that offers “take or pay” agreements to
fleets with very large throughputs of LNG. According to Pickens Fuel Corporation, the fully
burdened maintenance costs for a large LNG station (30,000 LNG gallons per month, or
about 17,700 diesel-gallon equivalents) is $0.03 to $0.06 per LNG gallon. This amounts to
an annual maintenance cost of about $16,200 for an LNG station of this size.88 Other LNG
experts have indicated that “typical contracts for LNG station maintenance are $10,000 to
$12,000 per year plus parts.”89
88
Survey received from Jim Harger, Vice President of Marketing, Pickens Fuel Corporation, December 6, 2000.
89
E-mail from Gary Pope, USA PRO, to Jon Leonard of Arthur D. Little, December 12, 2000.
Training for end users (vehicle refueling and safety) is typically provided with the cost of the
station, but it may be limited to one or two days with no provision for follow-up training.
Large anchor fleets such as the Orange County Transit District provide their own training and
safety programs for the use and maintenance of its LNG stations.
Public Access: Hours and Accommodations
Most LNG stations are used primarily by large heavy-duty anchor fleets. Consequently,
providing full public access is not necessarily a priority. However, many stations are
designed for 24-hour access with a cardlock system, with point-of-sale options that are
similar to comparable CNG stations. Table 44 provides a summary of the input received from
TAG members about current point-of-sale options, activities, and needs in this important
area.
Table 37. Point-of-Sale Payment Options, Activities and Needs for LNG Stations
Source
Pickens Fuel
Corporation
ALT-USA
Gladstein &
Associates
Current Point-of Sale
Options
Point-of-Sale Activities and Needs
EJ Ward in California
♦
Autogas in Arizona
♦
CFN
♦
♦
Varies by site. Most stations have ♦
unique card reading systems,
some have no system and
transactions must be manually
recorded
Investigating user-friendly payment, i.e.,
MasterCard and Visa accessibility
Lack of reliable card readers is the “weakest
link” in stations
Need assurance of user training
Need release of liability
Ability for fueling stations to accept Visa or
MasterCard
Source: surveys received from TAG members
Building Codes and Standards
LNG stations must meet similar standards and codes as CNG stations, although the main
requirements are NFPA 57 (Liquefied Natural Gas Vehicular Fuel Systems Code, 1999
Edition) and NFPA 59A (Standard for the Production, Storage, and Handling of Liquefied
Natural Gas, 1996 Edition).
Time Horizon for Full Technological Maturity
Arthur D. Little, in conjunction with Zeus Development Corporation and Gladstein &
Associates, is in the process of performing an assessment of the potential for LNG to become
a major transportation fuel in California.90 Included in the work to date is a preliminary
market assessment by Zeus Development91 that reviews all financial aspects of the LNG
business, i.e., liquefaction plants, on-board LNG fuel tanks, fueling stations, and vehicle
90
91
This work is being funded by Brookhaven National Laboratory and the Gas Technology Institute.
Zeus Development Corporation, Market Assessment of LNG as a Transportation Fuel in California, July 2000, for Arthur D. Little
conversions. Costs amortized over a twenty-year period were estimated for various types of
HDV fleets using LNG.
As might be expected, this study found that the economic viability of LNG in California for
heavy-duty vehicles will be closely tied to several key factors, including the relative prices of
LNG and diesel, the number of LNG vehicles deployed, and the existence of tax deductions
and incentives for end users. Initially at least, competitive economics will most likely be
achievable only in large fleets of transit buses, waste haulers and Class 8 trucks. Arthur D.
Little and its team members are now using such information to develop proposed objectives
for the LNG industry to achieve by 2010. These aggressive objectives are thought to be
achievable, with sufficient levels of investment. Table 38 provides a summary of the key
parameters under the proposed objectives regarding number of vehicles and fueling stations,
fuel throughput, and estimated associated costs.
The number of vehicles cited in Table 38 – 6,000 LNG-fueled trucks, buses and refuse
haulers – is consistent with the expected demand for heavy-duty AFVs that is being created
through key regulatory drivers, such as SCAQMD’s Rules 1192 (transit buses) and Rule
1193 (refuse haulers). Still, it is recognized that many significant barriers must be overcome
for LNG to become a major transportation fuel in California. Table 39 summarizes the input
received from TAG members regarding these key barriers, and their expected timeframe for
full commercialization. Note that one LNG station provider that serves large LNG fleets
considers the technology to be already fully commercialized, because “each station is a
stand-alone profit center.” This is a clear indication that high-volume sales of LNG are the
key to its commercialization.
Table 38. Proposed objectives for LNG industry by 2010
Parameter of LNG Business
Proposed Industry Objectives
92
Number of LNG trucks, buses and refuse haulers
~6,000
~120 million
LNG fuel sales (gallons per year)
Number of LNG stations
44
Number of New LNG Plants and Associated Bulk
Storage Tanks
33
Total needed capital investments (Year 2000 $):
Low Estimate:
High Estimate:
Minimum cost sharing target from government grants
a
and incentive programs, @ 20%
Low Estimate:
High Estimate:
Annual target for gov’t cost share (next 9 years)
Low Estimate:
High Estimate:
$167 million
$334 million
$33 million
$67 million
$4 million
$7 million
a
Source (except ): Preliminary projections made by Arthur D. Little and its subcontractors as part of “Concept Tactical
Plan,” project entitled: LNG as a Heavy-Duty Vehicle Fuel, for the Gas Technology Institute and Brookhaven National
a
Laboratory. Based on 4:1 cost share ratio targeted by Energy Commission and SCAQMD programs. Actual cost
sharing requirements may vary by agency, type of incentive or grant, enabling legislation, etc.
Table 39. Summarized survey responses on long-term horizon for LNG
Issue / Parameter
Gladstein & Associates
ALT USA
Pickens Fuel Corporation
10 Years
5 Years
0 to 1 Years
Equivalent
numbers to
current diesel
stations
Each station is stand-alone
profit center. Critical mass not
needed, profitability guaranteed
in pricing / volume requirements of each station’s contract
Expected Timeframe for
Full Commercialization
Number of Fueling
Stations Needed in
California for Full
Commercialization
20 to 30
Throughput Needed for
Full Commercial Status
15,000 to 25,000 LNG Gal/ 10,000 LNG Gal/
Month
Month
Major Barriers
•
•
Priority R&D Needs
•
•
•
•
•
High capital costs
Lack of acceptance by
trucking industry
Low-cost equipment
Reliable nozzles
Improved saturation
techniques
Common nozzle
fittings
Reduced or zero-loss
(boil-off) fuel storage
About 20,000 LNG Gal/Month
•
High capital
costs
•
Long lead time for OEM
vehicles
•
Low cost
stations
•
Reliable card readers
Table 40 provides examples of RD&D efforts that are underway to help overcome these
barriers.
92
Based on capturing 10% of the estimated 60,000+ HDV market in California conducive to LNG operation.
Table 40. Major RD&D efforts to improve the L/CNG infrastructure
Name of L/CNG
Infrastructure
Program
Next-Generation
Natural Gas
Vehicle
Gas Technology
Institute
Infrastructure
Working Group,
(L/CNG
Subcommittee)
Major Program Objective(s)
and /or Projects
Timeframe
•
Support next-generation NGVs by
enhancing L/CNG fueling and
maintenance infrastructures
Ongoing
through at
least
2004
•
Development and deployment of
small-scale liquefaction plants
Development of low-cost LNG
fueling stations
Development of cost-effective LNG
pumps
Standardized LNG nozzles and
receptacles
Breakaway devices for LNG
dispensing hoses
Economical odorant for LNG
Recommended practices for LNG
Assessment of impact from lowlubricity CNG at L/CNG stations,
and possible solutions
Ongoing
through at
least
2002
Participants
Gov’t.-industry
consortium headed
by DOE-NREL,
with 33 other
agencies /
companies /
organizations
Gov’t.-industry
consortium headed
by DOE and GTI,
with ~ 25 other
agencies /
companies /
organizations
•
•
•
•
•
•
•
LNG-Specific Supply and Demand Issues
Supply and demand for natural gas as a commodity was discussed above, with an emphasis
on ramifications of the current energy crisis. LNG is currently imported to the U.S. on both
the East and Gulf coasts. Virtually all LNG product consumed in California is currently
transported into the state by truck, rail or ship. It is estimated that the near-term potential
supply of LNG in the Western United States is approximately 133 million LNG gallons per
year. The existing demand for LNG in California is about 3 million gallons per year, and the
annual demand by the end of 2001 is expected to be about 13 million gallons (a 400%
increase). Thus, according to at least one source, it appears that there will be a sufficient
supply of LNG to meet the immediate California market demand.93 However, recent
concerns have been expressed that the supply of LNG in California over the next several
years will be insufficient to meet fuel demand from the anticipated growth of LNG vehicles,
due to the ongoing energy crisis and other emerging market factors.
93
Zeus Development Corporation, Market Assessment of LNG as a Transportation Fuel in California, July 2000, for Arthur D. Little
Significant new developments have recently been announced regarding plans to bring more
LNG to California. In early 2001, Phillips Petroleum Co. and El Paso Corp. signed a letter of
intent for El Paso’s long-term purchase of LNG from a plant to be built by Phillips near
Darwin, Australia. According to a joint press release, Phillips and El Paso will develop an
LNG receiving terminal (probably in Mexico) and beginning in 2005 680 million cubic feet
per day of natural gas (about 8.7 million LNG gallons) will be offloaded for delivery to
markets in California and Mexico. However, this LNG will be used for “peak shaving”
purposes and distributed to customers as gaseous methane through existing pipelines.94
Chevron is also investigating a plan to bring LNG to California and re-gasify it for
distribution through the pipeline system, in direct response to the energy crisis. If feasible,
Chevron will ship LNG to California from its “extensive gas holdings in Australia,” with
new supplies arriving in the 2005 timeframe. Chevron did not specify how much LNG it
may import, but stated that the primary end-use target would be to fuel “new and existing
electric power generation plants.”95
If these new LNG sources come to fruition, more pipeline natural gas will be available to fuel
new electricity plants. This will help alleviate the overall natural gas supply crunch, possibly
freeing up additional feedstock to produce LNG for transportation fuel. Still, concerns are
growing that competing demands for natural gas will result in insufficient fuel volumes for
California’s growing LNG vehicle population. As this report was being finalized, Applied
LNG Technologies announced the intention to add several new 5,000 gallon-per-day LNG
liquefaction facilities in California and Texas, specifically to supply the California
transportation market. The source of methane for liquefaction will be landfill gas and other
renewable, indigenous supplies. Still, it is likely that California will need to be proactive in
developing new sources for LNG and other alternative transportation fuels.
Advanced Infrastructure RD&D
One way to increase the natural gas supply for transportation in California is to accelerate
deployment of “waste-to-energy” technologies. For example, decomposition of biomass,
industrial waste, and municipal solid waste produces tremendous amounts of natural gas in
California, as does anaerobic digestion of organic waste. All together, there are more than
100 existing waste-to-energy plants in California. Most of these are used to generate
electricity, and currently supply about two percent of California’s total electrical capacity.
However, waste-to-energy technologies represent a large untapped resource in California for
production of natural gas. These processes typically produce gas that is relatively low in
methane content (between 55 and 75 percent), and therefore considered low to medium in
energy content. However, depending on the extent of the cleanup processes used, the gas can
be used to generate power or electricity in engines and even fuel cells.
Limited efforts are already underway to develop “small-scale liquefaction” plants that can
use remote or renewable gas sources to produce LNG, at or near the end user’s fueling
station. Perhaps the biggest barrier to this approach is that gas cleanup costs from landfill
94
“Philips and El Paso to Bring Australian LNG to California,” Oil & Gas Journal (Online Story), March 8, 2001.
95
Chevron Corporation, “Chevron Announces Gas Utilization Study,” Press Release, March 19, 2001 from http://www.chevron.com/newsvs/.
sources can be significant. As a pilot project, such a gas-to-liquid effort is being attempted at
San Diego County’s South Chollas landfill, with cost sharing from the Energy Commission.
Methane will be captured from the landfill, cleaned up and liquefied to LNG, and used to fuel
the City of San Diego’s LNG refuse haulers.
Meanwhile, efforts are underway in California to develop and demonstrate cost-effective
small-scale liquefaction plants using pipeline gas. For example, PG&E will install a smallscale (10,000 gallon per day) liquefier on the riverfront in Sacramento. The fuel will be used
at a new L/CNG station for the County of Sacramento, which will have two LNG dispensers
and two CNG dispensers. The small-scale liquefier is expected to be in operation by mid
2001, with the L/CNG station coming on line several months later. According to PG&E, the
station will cost less than $500,000 and will fit on a 10 ft. by 12-ft. platform.96
Especially in lieu of the energy crisis, additional efforts are needed to produce LNG and
other clean transportation fuels from unconventional feedstock. Potential strategies include
further exploiting California’s large untapped resources of waste-to-energy technologies, and
using emerging gas-to-liquids technology to extract stranded reserves of associated natural
gas, which can yield LNG, zero-sulfur synthetic diesel fuel, and methanol (among other
useful products).
Summary of Major Barriers and Impediments
There are a number of key barriers and impediments for the LNG infrastructure in California.
Many of these are similar to CNG, except that LNG is fully focused on the HDV sector,
unlike CNG. The most critical barriers for expanding the LNG infrastructure include:
•
California’s ongoing energy crisis in general, and competing demand for natural gas to
fuel new power plants, in particular
•
Relatively few engine and vehicle models compared to diesel
•
Long lead times to obtain vehicles
•
High cost of fueling stations and vehicle components (especially on-board LNG tanks)
•
Lower engine efficiency compared to diesel (for most engines)
•
Insufficient fuel consumption to attract private investment except at big stations with
large HDV anchor fleets
4.2.3
L/CNG Stations
A third type of natural gas fueling facility, known as an “L/CNG” station, is a specialized
LNG station that also supplies CNG. Such stations consist of a conventional LNG system,
with the addition of high-pressure cryogenic pumps that compress some of the LNG to
4,000–4,500 psi, and then vaporize the highly compressed liquid. CNG derived from this
process offers several advantages over conventional CNG. First, cryogenic pumps require
significantly less energy than the compressors used at conventional CNG stations, and are
96
Information provided by Brian Stokes of PGE during LNG Project Advisory Committee Meeting, ADLittle’s Fullerton Office, 2/12/01.
less maintenance intensive. Second, L/CNG is delivered to the natural gas vehicle at ambient
temperature, facilitating complete fills while obviating the need for temperature
compensation systems.97 In addition, since LNG itself is nearly pure methane (98%), L/CNG
is delivered to the vehicle with virtually no contaminants or undesirable fuel elements such as
oil carryover, moisture, and higher hydrocarbons. This eliminates the need for elaborate gas
drying and filtering systems.98
Adding the L/CNG option when building a new LNG station costs approximately $150,000
to $200,000. Retrofitting an existing LNG station with the L/CNG feature costs
approximately $200,000 to $250,000.99 Despite these additional costs, L/CNG stations have
potential to be cost-effective alternatives to conventional CNG stations. The capital costs of
a large (transit-bus-sized) L/CNG station can be nearly 50% lower than a conventional CNG
station of comparable size.100 Operation and maintenance costs can also be significantly
lower. However, L/CNG is currently offered at only a few California locations (refer back to
the tables on page 60).
L/CNG provides an integrated NGV strategy for fleets by enabling refueling of light-duty
CNG vehicles and heavy-duty LNG vehicles at the same facility. For example, at the Ontario
L/CNG station, United Parcel Services refuels both LNG and CNG package-delivery
vehicles, and also offers a public-access side for both fuels. However, it must be emphasized
that L/CNG facilities are integrally linked to LNG fueling stations, because they require an
on-site supply of liquefied natural gas. Only 44 LNG stations are expected to be operational
in California by 2010 (refer back to Table 38 on page 67). By contrast, to sustain NGV
commercialization, approximately 2000 new fueling facilities that dispense CNG will be
needed in California by the same timeframe. Clearly, conventional CNG stations rather than
L/CNG stations will meet the bulk of that demand.
In addition, more information is needed to assess the long-term performance, reliability, and
life-cycle costs of L/CNG stations. One key question about L/CNG involves its lack of
lubricity for some natural gas vehicle fuel injectors. Since compressed fuel from an L/CNG
station has very low lubricity, at least one NGV manufacturer has indicated that injector
warranties may be void when using L/CNG. This is the opposite problem encountered with
conventional CNG, which can have too much “oil carryover” from the natural gas
compressor, resulting in damage to the gas injection system and other parts of the NGV. The
natural gas industry is working to resolve these issues as quickly as possible, but has not
made this a top priority.
97
Different CNG compression strategies have a significant effect on gas temperature, and therefore fill completeness. Pinnacle CNG has been
an industry leader in improving CNG fills using advanced temperature compensation, and other technologies. According to Pinnacle, its Hydraulic
o
Intensifier Compressor (HIC) can discharge 4,000 psi CNG at up to 100 F lower than a conventional 1,800 rpm four-stage reciprocating
compressor.
98
Transportation Research Board, TCRP Report 38: Guidebook for Evaluating, Selecting, and Implementing Fuel Choices for Transit Bus
Operations.
99
This information is based on ADLittle’s experience preparing L/CNG station RFPs, and input provided by 1) Steve Bartlett of ALT USA and 2)
Chart Applied Technologies.
100
Natural Gas Fuels, Fueling Stations from A to Z, article by David Port, May 1999.
4.3
LPG Fuel and Fueling Stations
Propane, the main constituent of LPG, is a colorless, odorless, tasteless, and non-toxic
hydrocarbon. Propane is a gas in its natural state, but it turns to liquid under moderate
pressure. When used in vehicles, propane is stored in special fuel tanks and pressurized to
about 200 psi. Similar to how LNG is used on vehicles, when liquid propane is drawn from
the tank it is vaporized to a gas before being burned in the engine.
Most propane produced today is recovered from natural gas through a separation process
called fractionation, but refining of crude oil is the predominant means of production in
California due to the high concentration of refineries in the state. As a safety measure, ethyl
mercaptan (an odorant that smells like sulfur) is added to propane when it is loaded into
transport trucks or onto railcars. According to the nation’s largest LPG supplier, propane is a
generic commodity, so all retailers provide a very similar product. “Only service, safety, and
dependability of supply differentiate suppliers.”101 Propane is shipped to retail storage sites
through pipelines as well as on railcars, transport trucks, and barges. Bulk trucks typically
make the final delivery in 1,800- to 5,000-gallon cylinder trucks.
Number of Stations
As of early 2001, there are approximately 1200 facilities in California that dispense propane.
According to the Western Propane Gas Association, more than half of these facilities are
capable of providing propane as a motor vehicle fuel. 102 However, today only about 2% of
the total LPG dispensed is used for automotive applications (see Figure 4-10). The vast
majority is used for petrochemical applications, and to fuel residential and commercial
applications such as heaters, recreational vehicles and barbecues.
Farm
8%
Industrial
4%
Residential &
Commercial
39%
Transportation
2%
Petrochemical
47%
Source: National Propane Gas Association
Figure 4-10. Current propane demand sectors
101
From Ferrelgas website (www.ferrelgas.com).
102
Information provided by Mr. Steve Moore of Mutual Liquid Gas.
Existing and Needed Fuel Throughput
California’s existing LPG stations are well-dispersed in key locations, and are already self
sustaining from non-vehicle fuel sales. LPG stations are generally owned and utilized
differently than natural gas stations (CNG or LNG). First, LPG has long been used as a
mainstream fuel for barbecues, outdoor heaters, forklifts and recreational vehicles. Second,
LPG end users often own and operate their fueling stations, because they are inexpensive to
install and have relatively low life-cycle costs.103 As a result, the LPG infrastructure has had
sufficient throughput to be self-sustaining without major use as a fuel for on-road AFVs, and
government financial support has generally not been necessary. However, that would not
necessarily be the case if LPG were to become a mainstream automotive fuel, with multiple
dispensers located on typical gasoline fueling station islands.
LPG Demand, Supply and Price
Propane is produced as a by-product of natural gas processing and petroleum refining.
Figure 4-11 shows the production and distribution chain for propane. Texas produces about
one third of the nation’s supply, and has more than half of the underground storage capacity.
In addition to these two processes, demand is met by imports of propane and by using stored
inventories. Although imports provide the smallest (about 10 percent) component of U.S.
propane supply, they are vital when consumption exceeds available domestic supplies of
propane. Propane is imported by land (via pipeline and rail car from Canada) and by sea (in
tankers from such countries as Algeria, Saudi Arabia, Venezuela, Norway, and the United
Kingdom).
Figure 4-11. Production chain for propane (from http://www.npga.com)
103
For example, LPG stations have no maintenance associated with gas compression and drying.
According to the LPG industry, domestic LPG supply is currently sufficient for 21 million
vehicles per year.104 Worldwide, there is ample LPG supply, but prices drive product
distribution. Since U.S. suppliers compete in a global market for LPG, a sudden, heavy
demand for LPG due to colder weather usually results in prices escalating rapidly.105 The
National Propane Gas Association recently acknowledged this concern with the following
statement:
“It is important to understand that the by-product nature of propane
production means that the volume made available from natural gas processing
and oil refining cannot be adjusted when prices and/or demand for propane
fluctuate.”106
Propane is traded on the commodities market; consequently, the price of LPG changes daily.
LPG prices are subject to a number of influences; some are common to all petroleum
products, and others are unique to LPG. Because LPG is essentially a portable fuel, it is
typically used for home heating where natural gas pipelines don’t exist. It can also serve
many other different markets, from fueling barbecue grills to producing petrochemicals. The
price of LPG in these markets is influenced by many factors, including the prices of its
feedstocks (natural gas and crude oil); prices of competing fuels in each market; the distance
LPG has to travel to reach a customer; and specific issues within individual markets served
(e.g., residential, fork lifts, etc.).
Figure 4-12. Retail LPG prices generally track those of crude oil.
104
Source: Website of the National Alternative Fuel Training Consortium (http://naftp.nrcce.wvu.edu/).
105
The basic source of information from this section is from the websites of the National Propane Gas Association (www.npga.com) and the
National Propane Council (www.propanecouncil.org). The source of most cost and price information is the Department of Energy’s Energy
Information Association (www.eia.doe.gov)
106
National Propane Gas Association website (www.npga.com).
As Figure 4-12 shows, the retail price of propane closely tracks that of crude oil. Continuing
high crude oil prices in late 2000 / early 2001 have impacted propane costs, as well as most
energy prices. According to Purvin & Gertz, Inc., an international energy industry consulting
firm, the following additional factors resulted in increasing LPG prices during the winter of
2000/2001.
• U.S. propane inventory levels are the lowest since 1996, even though stocks are
•
•
•
continuing to build
Record high natural gas prices
Imports of propane to the U.S. are down over the last two years
Demand increased in other regions and countries (especially China, Mexico, and the
Middle East)
3.00
$ per gallon
2.50
2.00
1.50
Per LPG Gallon
1.00
Per GGE
0.50
Per DGE
/0
1
19
/
2/ 01
26
/0
3/ 1
5/
3/ 01
12
/
3/ 01
19
/0
1
2/
1
01
12
5/
2/
2/
1/
29
/0
/0
1
1
/0
22
1/
01
15
8/
1/
1/
1/
1/
01
0.00
Source: Energy Information Administration
Figure 4-13. Recent trend in retail LPG prices, with GGE and DGE prices.
Figure 4-13 shows the average retail price of LPG in California over the first three months of
2001, with comparisons to gasoline gallon equivalents (GGE) and diesel gallon equivalents
(DGE). It shows that LPG prices gradually came down since the beginning of the year.
Recent checks indicate that the price is currently about $1.37 per LPG gallon ($1.92 per
GGE, $2.11 per DGE) for self-service automotive applications. However, according to a
propane distributor, the same dealer would likely sell LPG at a significantly higher price
(currently about $2.00 per LPG gallon) when refilling portable 5-gallon tanks used for LPG
barbecues. Like other types of fuel suppliers, the propane industry is willing to offer
significant price breaks as a function of larger volumes pumped and reduced costs to assist
customers.107
In 2000, the propane industry hired Purvin & Gertz, Inc. to further study propane market
dynamics and industry infrastructure. Among the key conclusions from the study (released
in October 2000) was that “overall propane supplies are adequate to meet the needs of the
existing domestic retail propane market and to support additional growth in that market.”
However, the report went on to note that “the temporary supply outages and distribution
delays encountered by many dealers over the past three years reflect a growing trend that
could lead to far more serious outages and even higher price spikes” should severe winter
weather conditions develop.108
At the time this study was released, U.S. propane inventories had risen to a high of 63 million
barrels. The high level of inventory was attributed primarily to higher gas plant and refinery
production of propane, and reduced consumption by the petrochemical industry. Despite
these high amounts in primary storage, Purvin & Gertz noted concern that many propane
marketers had not filled their secondary (dealer) or tertiary (end user) storage.
In early 2001, the propane industry asked consultant Purvin & Gertz to update its October
2000 propane infrastructure study, to assess the implications of continued low supply and
high price levels. Purvin & Gertz concluded that “propane stock levels are currently
depleting at all-time record rates.” It was further noted that if cold weather conditions
continue “we expect propane stocks in most regions to decline to modern day lows, likely
testing minimum base supply levels.” 109
On February 2, 2001, the National Propane Gas Association released a press release110
stating the following:
“With propane inventories declining at all-time record rates and natural gas prices
still two to three times their normal level, industry experts predict that propane
prices will continue at their unprecedented high levels.”
Station Capital Costs
Figure 4-14 compares the costs of building three types of public-access LPG stations. It
shows that a stand-alone dispenser with point-of-sale networking costs about $30,000. If the
LPG dispenser is built onto the gasoline island at a typical station, the cost is about $70,000.
The same station with a 6,000-gallon, belowground LPG tank would cost about $100,000.
107
Personal communication, Bill Platz, Delta Liquid Energy, to Jon Leonard, April 2, 2001.
108
Propane Education & Research Council, Propane Market Dynamics and Industry Infrastructure, a summary of the Purvin & Gertz study,
October 20, 2000, from the PERC website (http;//www.propanecouncil.org).
109
The Near-Term Outlook for U.S. Propane Supplies, a follow-up study by consultant Pervin & Gertz on behalf of the National Propane Gas
Association
and
other
propane
industry
groups,
February
5,
2001,
obtained
from
NPGA
website
(http://www.npga.org/public/articles/Summary_of_PG_.pdf).
110
National Propane Gas Association, press release, February 2, 2001, from website (http://www.npga.org/public/articles/details.html).
$120,000
$100,000
$100,000
$80,000
$70,000
$60,000
$40,000
$35,000
$20,000
$Stand-Alone Dispenser w/
Networking
Add Dispenser on Gasoline
Island
Add Below-Ground 5,000
Gallon Tank
Source: Delta Liquid Energy Company, October 2000
Figure 4-14. Estimated costs to build various types of LPG stations
Station Operation, Maintenance and Training
LPG stations are relatively simple systems compared to CNG or LNG stations. A typical
station consists of an aboveground storage tank, a 2 to 4 horsepower transfer pump, and a
meter and hose dispensing system. Unlike CNG stations, there is no need for a compressor
or gas dryer. This makes an LPG station relatively easy to operate and maintain. The
estimated cost per year to maintain a station is $1,000, according to Delta Liquid Energy
Company.111
Fuel Quality
LPG comes in three different commercial grades, with varying compositions of propane
other hydrocarbons, and miscellaneous other constituents. A minimum propane content of
90% by liquid volume is necessary for automotive applications, to ensure sufficient vapor
pressure for delivery of the fuel to the engine, even at very low temperatures.112 From an
emissions standpoint, the propylene (also known as propene) content of LPG is of concern
because it has a very high photochemical reactivity. Propylene does not occur in LPG
obtained from natural gas processing plants, but it does in the LPG resulting from petroleum
refinery operations. Primarily to control propylene content, the U.S. propane industry and
regulatory agencies have developed an automotive propane standard known as HD-5. Fuel
111
Survey input received from Bill platz, Delta Liquid Energy Company.
112
Source: Website of the National Alternative Fuel Training Consortium (http://naftp.nrcce.wvu.edu/).
for spark-ignition engines in California must comply with this HD-5 specification, which is
summarized in Table 41.
Table 41. HD-5 Specification for Automotive LPG
Parameter
HD-5 Propane Specification
Propane Content
90% liquid volume (min)
Propylene Content
5% liquid volume (max)
Butane and Heavier HCs Content
2.5% liquid
Moisture Content
Dryness test of NGPA
Residual Matter Content
0.05 ml
Total Sulfur Content
123 ppm by weight fraction
Public Access: Hours and Accommodations
Most public LPG stations to date have not been built for automotive fueling applications.
Future stations designed for that purpose are expected to offer 24 hour access, seven days per
week.
Building Codes and Standards
LPG stations must meet a variety of codes and standards, including but not limited to UPC,
UFC, UBC, and NFPA 58. According to survey input from one TAG member, the need to
comply with highly variable Fire Marshall requirements is a major challenge to building and
installing LPG stations.
Time Horizon for Full Technological Maturity
As Table 42 shows, one LPG vendor hopes to install up to 30 new LPG stations in
California for automotive applications. The timeframe envisioned is 12 to 18 months for this
vendor to achieve these plans. One big challenge is the currently paucity of OEM offerings
for dedicated LPG-fueled vehicles and engines, which may continue to hinder wider
commercialization of LPG as a clean automotive fuel. Table 43 indicates that the average
LPG station in California currently dispenses only about 1000 gallons of LPG per month, and
most of this is for non-automotive applications such as barbecues and heating. A 15-fold
increase in throughput per station is reportedly needed to achieve commercialization goals
for automotive applications.
Table 42. Summarized survey response on horizon for automotive LPG stations
Issue
Response
Expected timeframe for full commercialization
♦
12 to 18 months
Number of fueling stations needed in California
♦
30 public access stations
Needed fuel volume per station
♦
15,000 gallons (one hose)
Methods of financing additional stations
♦
Private capital and government programs
(e.g., Carl Moyer).
Financial incentives and / or administrative
actions needed to overcome barriers
♦
Need co-funding to offset capital costs
(installation, permits, concrete, etc.)
Table 43. Projected need for expansion of LPG stations in California.
Market Element
Current
Projected Future Need
Number of Automotive LPG Stations
7 (for vendor)
At least 30 more
Approximate LPG gallons
pumped per month, per station
1000 (very little for
automotive use)
14,000 to 15,000
Approximate GGE pumped per
month, per station
700 (very little for
automotive use)
10,000 to 10,650
Source: survey input from Delta Liquid Energy
Summary of Major Barriers and Impediments
As previously noted, the LPG infrastructure has essentially already reached sustainable
commercial status due to the fuel’s use in non-vehicle applications. Automotive LPG stations
are more complex and costly than LPG stations designed simply to fuel barbecue cylinders or
forklifts, but they can be built at lower costs than natural gas stations. The biggest challenges
to expanding the automotive LPG charging infrastructure in California are related to vehicle
and fuel issues more than the fueling stations themselves. Specific impediments include the
following:
•
The threat of volatile, high prices due to distribution bottlenecks, storage imbalances,
natural gas market dynamics, and other factors
•
Low demand for LPG (as an automotive fuel), due to lack of commercially available
dedicated LPG vehicles, and the absence of fuel-use requirements for bi-fuel vehicles
•
High incremental cost of LPG-fueled vehicles and engines (especially for the heavy-duty
sector)
4.4
Electric Vehicle Recharging Stations
As previously discussed in Section 3.1.3, electric vehicles (EVs) are expected to play an
important role in California’s long-term strategy to reduce mobile source emissions.
Accordingly, EV charging stations are being installed throughout California. In Southern
California, the Mobile Sources Reduction Review Committee (MSRC) has played a major
role in funding charger installations for public access. Both public and private investors have
begun to establish a skeletal network of EV recharging stations in the major regions of the
state.
Number of Stations
Survey responses were received from two TAG members regarding the EV charging
infrastructure. As shown in Table 44, these estimates indicate that there are nearly 3,300 EV
chargers California. About 59% are inductive chargers and 41% are conductive. Virtually
all provide Level II charging designed for 208 or 220 VAC power sources.
Table 44. Electric Vehicle Recharging Infrastructure in California
Charger / Station Type
Inductive
Conductive
Total
Public Access Charging Stations
617
378
995
Public and Private Fleet and Business Chargers
710
860
1570
Residential Chargers
600
126
726
Total Chargers
1927
1364
3291
Source: California Electric Transportation Coalition, in consultation with Clean Fuel Connection, Inc. and the
Sacramento Municipal Utility District, Electric Transportation Infrastructure
California’s EV charging network has evolved to serve the state’s largest concentrations of
battery-electric vehicles. Consequently, stations are concentrated in three major areas of the
state: the Los Angeles Basin, the North and South Bay Area, and Sacramento.113 Within
these regions, charging sites are generally located in places where people spend time, rather
than along major thoroughfares (e.g., interstates).114 This is because current-technology EVs
require significantly longer time to “refuel” compared to conventionally fueled vehicles, or
other types of alternative fuel vehicles. The basic strategy is to install chargers at key
locations within metropolitan areas, allowing EV users to extend vehicle range through
“opportunity” charging while shopping, attending sporting events, going to movies, etc.
In addition to the EV charging stations that are located throughout California at public
agencies and private businesses, there are approximately 726 private residences in California
wired for EV charging (see Table 44). The capability to “refuel” EVs at home is a significant
advantage compared to using conventional vehicles.115
Existing and Needed Electricity Use Per Charger
More information is needed about the amount of electricity currently used at California’s EV
charging stations (per station and collectively). At this early stage of EV deployment, public
stations do not receive enough use to consume large quantities of electricity. However, for
fleets with large numbers of EVs, such as Southern California Edison’s Toyota RAV EV
fleet, electricity consumption per charger is very high, and substantial quantities of gasoline
fuel are displaced through use of these EVs when comparing the same fleet using petroleum
fuels on a per-capita basis.
113
Survey input from the California Electric Vehicle Coalition, December 2000.
114
Survey input indicated that discussions have occurred about a North-South corridor for EV charging in California, but no concrete plans have
yet been made.
115
NGVs can also be refueled (slow-filled) at home with FuelMaker systems, and some NGV manufacturers have set up incentives for their use
(e.g., Honda sales of its Civic GX).
Electricity Demand, Supply and Price
The cost of electricity in California depends on local utility rates and other factors. For EV
charging, there are a variety of rate structures. Residential EV charging rates currently range
from $.04 to $.12 per kWh for off-peak charging, with on-peak charging costing substantially
more. Also, electricity prices and charging costs change with the seasons and additional
time-of-use and demand charges may be applied. To take full advantage of special off-peak
EV charging rates, residential customers may need to install a second meter or a dual-meter
adapter. As an example, the Sacramento Municipal Utility District (SMUD) offers an EV
charging rate that is approximately half the regular residential rate. To take advantage of the
EV charging rate, SMUD requires that an additional meter with a dedicated EV charging
outlet be installed at the residence.
Figure 4-15 shows the historic average of electricity rates in California for residential and
commercial customers from 1975 to 1998. Since electricity restructuring took effect in 1998,
significant changes have been occurring in the supply and pricing of electricity. During late
2000, the supply of electricity in California reached near-crisis levels and several
emergencies were declared, even though demand was significantly lower than that of the
summer peaks. This problem resulted from complex factors related to deregulation, and
emergency steps are being taken to resolve the crisis (as previously described). As of March
2001, the related issues of electricity supply, demand and price persist as a major crisis for
California. Forecasts indicate that “rolling blackouts” due to insufficient supply will likely
persist until new power plants come on line.
Nominal cents per kW-hr
14
Residential
12
Commercial
10
8
6
4
2
Source: California Energy Commission
7
19
9
95
19
93
19
91
19
89
19
87
19
85
19
83
19
81
19
79
19
77
19
19
75
0
Year
Figure 4-15. Historic avg. electricity rates (residential and commercial) for California,
1975-1998
On March 27, 2001, the California Public Utilities Commission unanimously approved an
immediate increase in electricity rates, by as much as 42% in Southern California and 46% in
Northern California. The rate hike is targeted towards easing California’s ongoing power
crisis and avoiding blackouts during peak-usage summer months. However, as of the writing
of this report, serious concerns are being expressed that it will not solve the fundamental
problem of increasing wholesale electricity prices.116
California’s current power crisis is urgently being addressed by many agencies at the highest
local, state and national levels. Its full ramifications to the Clean Fuels Infrastructure
Development Plan are not clear. On the one hand, at the level of deployment envisioned by
CARB, the anticipated amounts of electricity needed to recharge EVs in California over the
next decade are not expected to significantly impact supply and demand issues. On the other
hand, if high electricity prices and localized supply disruptions persist into 2003, this may
negatively impact consumer choice about purchasing EVs, for those who are depending on
the convenience of on-peak day charging. In lieu of these concerns, it is recommended that
further assessments be conducted on California’s EV market and the corresponding need to
develop charging stations, before further consideration is given to using the Energy
Commission’s infrastructure development funds for this purpose. Specific recommendations
are provided at the end of this section.
Capital Cost of EV Charging Stations
The cost of non-residential EV charging stations can vary significantly. A typical Level II
inductive charger currently costs about $2,200, while a comparable conductive charger costs
from $800 to $2,100 (not including mounting hardware and shipping).117 The total cost
including installation at a new construction site (i.e., where cable and conduit can be laid
during the building process) ranges from $5,000 to $7,000. Total costs as high as $10,000
can result in situations where a charger must be retrofitted at an existing site, or if long
trenches are needed to hook up with the source of electricity.118 Significant cost reductions
can be realized when multiple chargers are installed at the same site.
The current cost of a residential charging station including installation is approximately
$1,500. According to estimates cited by CARB in recent ZEV documents, this cost could be
reduced by about 50% over the next several years. An example of how costs can be reduced
is passing of a local ordinance requiring new housing construction to include 220V wiring to
an electrical panel in the garage. Several cities in both northern and southern California
already have such an ordinance. This reportedly costs as little as $5 extra during the
construction process, where it could cost about $200 to retroactively add a new panel in the
garage.
According to the California Electric Transportation Coalition, station owners have paid
between 25% and 60% of the costs for public charging stations. In other situations such as
fleet and retail EV use, infrastructure costs are correlated to the purchase or lease of EVs.
Cost sharing to assist owners and operators is available on a limited basis. The Energy
Commission offers the only current cost-share program for EV charging; this offers matching
116
Source: The Los Angeles Times, “Largest Rate Increase in State’s History Approved,” March 28,2001, from website (http://www.latimes.com).
Note: no information was available directly from the CPUC website on this action.
117
California Air Resources Board, ZEV Infrastructure: A Report on Infrastructure for Zero-Emission Vehicles, January 2001.
118
According to survey input from CalETC.
funds from the Petroleum Violation Escrow Account (PVEA) and participating automakers
to help buy down capital costs and installation. Over the last several years, there have been
other programs throughout the state funded by the U. S. DOE Clean Cities Grant Program
and the Mobile Source Air Pollution Reduction Review Committee.
Station Operation, Maintenance and Training
EV charging stations are easy to operate and require no maintenance on the part of the end
user.
Public Access: Hours and Accommodations
Hours of access to public charging stations vary. As a general rule, stations are available
during the operating hours of the host site. Most public EV charging stations found in
parking lots are available 24 hours. In the case of garages, operating hours are usually linked
to working hours, e.g., 6:00 a.m. until 8:00 p.m.
Presently, EV charging is free to the user at public stations because the host site pays for the
electricity. Thus, card reader access and point-of-sale billing are not yet issues. Edison EV
reportedly proposed a billing demonstration program, but it was never implemented. Some
billing system and card system mechanisms have been tested, e.g., the Bay Area Rapid
Transit’s kiosk charging system. Development of user-friendly and cost-effective card reader
systems for EV charging will become a priority as greater numbers of EVs are deployed over
the next several years.119
Building Codes and Standards
EV charging stations must meet Article 625 of the 1996 California Electric Code. Building
codes determine how the electrical code is implemented and set the standard for permit
approval. In addition, EV charging stations must meet Interim Disabled Access Guidelines
issued by the California State Architect’s Division – the only fueling station type required to
do so.120 These existing standards and codes are updated as needed, based on technology
changes and other factors.
Time Horizon for Full Technological Maturity
With California’s ZEV requirement recently upheld by CARB, it appears that thousands of
new EVs will be deployed beginning with the 2003 model year. Consequently, more
charging stations will be needed throughout California at publicly accessible sites such as
shopping malls, transportation hubs, private companies, and government facilities. To insure
EV charging locations do not become stranded investments, specific identification of existing
EVs and typical EV owner’s driving patterns must be assessed including projections of future
EV growth patterns and related EV electricity supply/demand issues. Table 45 summarizes
input from the TAG regarding their prognosis for full commercialization of EVs and the
corresponding charging infrastructure.
119
According to survey input from CalETC.
120
Survey input from CalETC and the Clean FuelConnection, Inc.
As this information suggests, the time horizon for full technological maturity of battery EVs
(and the corresponding infrastructure of charging stations) depends on complex and/or
unknown factors. CARB’s newly adopted modifications to the ZEV regulations will allow
greater flexibility for automakers to meet part of their ZEV obligations with other types of
ultra-clean vehicle technologies. This modification could reduce the rate of progress towards
full technological maturity for battery EVs, and deployment of charging stations. In addition,
automakers are pursuing other types of “pure ZEV” technologies” over the longer term (e.g.,
see Section 3.2.2. Hydrogen Fuel Cell Vehicles) that may out-compete battery EVs in the
marketplace. While it’s too soon to fully evaluate the impact of these factors, projections
from CARB indicate that annual production of battery EVs for the California market will be
in the tens of thousands beginning in 2003.
Table 45. Summarized survey response on long-term horizon for EV charging
Issue
Response
Expected Timeframe for ♦
Full Commercialization
Needed actions and
activities to achieve
♦
♦
♦
♦
♦
♦
Existing methods of
financing EV charging
stations and activities
above
♦
♦
♦
♦
♦
New financial incentives ♦
and / or administrative
♦
actions needed to
overcome barriers
♦
♦
♦
Complex –- depends on many factors
121
Easy access to public charging
Approximately 3 chargers per driver—one at home, one at work and
several public locations
More workplace charging and public charging in No. California to stimulate
customer demand for vehicles
“Corridor charging” to enable EV travel from No. CA to So. CA
Low-cost durable unattended system for point of sale and shared car
reservation
Demonstrations / reporting of fleet fast charging, retail fast charging, and
fleet sequential charging
Expanded capacity to charge at high-demand stations such as airports
Common connector standard instead of inductive and conductive
Long-term statewide infrastructure plan, as more EVs are deployed
Funding sources such as the Energy Commission, local APCDs and
participating automakers provide 40% to 75% of the cost for individual
stations
Government and industry sources to cost share a program that graduates
the % of cost share by infrastructure priorities.
Develop a workplace charger program with meaningful credit (i.e.,
rideshare) to employers for installing infrastructure.
Significant cofunding (at least 50%) is needed at the initial stages of the
market for installation of charging at workplaces and good public locations
i.e., shopping malls, entertainment venues.
Financial incentives for installation of charging in new commercial
construction (i.e., developer installs conduit and incentive program pays for
chargers and installation).
Better “packaging” and selling of incentives to potential end users. Focus
on simplicity and strong outreach to public and private fleets.
Availability of conveniently located work parking (Green Vehicle Parking).
However, the types and numbers of vehicles that are ultimately produced and deployed will
drive California’s long-term expansion of the EV charging network. Variables that will
affect charging infrastructure needs include: 1) the mix of battery types used, and their range
capabilities, 2) the mix of EV types by size and use characteristics (e.g., city EVs, low-speed
121
When survey responses were received, EV production scenarios were less certain due to a potential rollback of the ZEV mandate. Since that
time, CARB voted to maintain the mandate, while allowing greater flexibility to automakers in meeting ZEV obligations.
vehicles, full-sized sedan EVs, utility EVs), 3) the mix of EVs by owner type (fleets vs.
private individuals), 4) predominance of fast charging, and 5) potential emergence of plug-in
hybrids that don’t entail deep discharge.
Summary of Major Barriers and Impediments for EV Infrastructure
There are a number of key barriers and impediments for expansion of the EV charging
infrastructure in California. These include the following:
•
California’s ongoing energy crisis and potential competing demand for electricity makes
day charging availability (on-peak) less likely.
•
Lack of EV products (e.g. batteries), especially from the major automakers
•
Past incentives are now being phased out; continued funding is needed in the early stages
of the EV market
•
Resistance from employers to install workplace chargers (e.g., it can be viewed as a
special privilege for a few employees, or a fuel subsidy that others can’t receive)
•
Meaningful incentives for workplace charging are lacking; current Federal tax deductions
are not viewed as significant, as are trip-reduction credits for large employers
•
Lack of a current charger standard results in fleets installing conductive and inductive
chargers, which is expensive
•
Competition from other vehicle technologies either becoming commercially available or
meeting or nearing ZEV standards (e.g. fuel cell technologies, hybrids).
As a result of the most recent biennial review on the ZEV program, CARB staff released a
report assessing and addressing some of these barriers for the EV charging infrastructure.
The report provided background on the status of public charging, EV charging technologies,
safety standards related to EV infrastructure, infrastructure costs, and incentive programs
related to infrastructure as well as recommendations for charger standardization. One broad
recommendation was to establish a stakeholder-based EV infrastructure working group.
Additional, more specific recommendations are summarized in Table 46.
Table 46. CARB staff report recommendations on EV infrastructure
Barrier / Issue
Recommendation
Lack of single standard for
EV charging stations
♦
Work with charging infrastructure industry and automakers to develop
and adopt a single charging standard
Limited public charging
infrastructure
♦
Expand number of public stations, targeting “most critical” locations and
applications
Improper use of EV
charging spaces by nonEVs
♦
Develop local ordinances to discourage non-EV parking in spaces
designated for EV charging
Encourage enforcement of ordinances
Lack of information for EV
users
♦
Develop centralized information center and improved mapping systems
for EV users to keep abreast of where to find charging stations
Lack of EV charging
stations at work locations
♦
Offer greater incentives and grants for employers to install EV charging
stations
Initially target locations having existing EV users as employees
Work with stakeholders to review effectiveness of existing incentives,
and develop new incentives as needed
Need for new / improved
EV incentives
Impact of EV charging on
the electricity grid
♦
♦
♦
♦
Establish working group to further evaluate the issue and prepare
relevant information
Source: California Air Resources Board, ZEV Infrastructure, January 2001
Recommendations for Further Assessments on EV Infrastructure
Many EV-related activities are being spearheaded by CARB, individual air districts, the
Energy Commission and federal entities. It is recommended that additional research be
conducted to assess what level of support, if any, the Energy Commission should allocate for
EV infrastructure under the Clean Fuels Infrastructure Development Plan. Key areas to
further assess include the following:
•
The projected numbers and types of EVs that will be deployed in California for the 2003
to 2010 timeframe, by type and end use (government fleets, private users, utilities, etc.)
•
The exact numbers and types of existing EV stations and how they are currently used by
end users
•
The impact that neighborhood electric vehicles (NEVs) are likely to have on EV
infrastructure needs
•
The feasibility of adopting statewide ordinances that require construction of new homes
and businesses to be compatible with state-of-the-art EV charging systems
•
The potential to develop and deploy an effective, affordable billing system for public EV
charging stations
•
The development of fast charging systems capable of fully charging EVs in comparable
time to that of liquid or gaseous fueling systems.
4.5
E85 Fuel and Fueling Stations
Number of Stations in California
Thousands of E85 FFVs built by several automakers are currently being operated in
California (refer back to section 3.1.4 on page 32 for a list of available models). The FFV
feature is standard equipment for these particular makes and models. For example, every
2000 MY 3.0 Liter Ford Taurus LX, SE, SES Sedan and SE Wagon sold in California (and
throughout America) is an FFV. Although these vehicles were designed to operate on E85 or
any mixture of E85 and gasoline, there are currently no E85 stations in California. This
means that virtually all E85 FFVs in California are being operated on gasoline.
However, E85 stations do exist in other states. Since corn is a primary feedstock for ethanol,
it’s not surprising that America’s highest concentration of E85 use and fueling stations is in
the Midwest. According to the Alternative Fuels Data Center, there are between 41 and 60
stations located in Wisconsin, while numerous states have at least one station.
Existing and Needed Fuel Throughput
No response to the fueling infrastructure survey was received from the ethanol industry.
Therefore, it is unknown how many E85 stations are needed to develop a self-sustaining E85
infrastructure in California, or the corresponding fuel throughput at each station.
Fuel Supply, Demand and Price
U.S. fuel grade ethanol production reached 1.5 billion gallons in 1999, with corn serving as
the primary feedstock. Demand in the same year was approximately 1.35 billion gallons.122
Most of this was consumed in the transportation market through ethanol’s use as a blending
agent with gasoline, either to extend volumes of gasoline, or increase oxygenate levels to
reduce wintertime carbon monoxide emissions from vehicles. Used in these ways, ethanol is
considered a “replacement” fuel instead of an alternative fuel (per the U.S. Energy Policy
Act). As Figure 4-16 shows, between 1.0 and 1.5 billion gallons of ethanol per year were
blended into U.S. gasoline stock over the last several years; most of the resulting blend was
sold in Midwest markets as so-called “gasohol.” The federal Energy Information
Administration projects that by 2020, the use of ethanol for gasohol or as an oxygenate will
grow to about 2.5 billion gallons per year. This projection includes an increase in the
expected role of ethanol as the preferred oxygenate for reformulated gasoline, since
California and seven other states have passed legislation limiting or banning the use of
methyl tertiary butyl ether (MTBE).
122
Energy Information Administration, Energy Outlook 2001, December 22, 2000.
Source: Energy Information Administration, Energy Outlook 2001, December 22, 2000.
Figure 4-16. Past and projected U.S. ethanol consumption (millions of gallons)
The lower curve in Figure 4-16 shows the past and projected consumption trends nationwide
for ethanol used to make E85 fuel for FFVs (see Section 3.1.4). Use of ethanol to make E85
has been very low compared to its use in gasohol. However, the federal Energy Information
Administration projects that the U.S. demand for E85 will grow significantly over the next 20
years, and reach nearly 500 million gallons in 2020.123
Because ethanol is the only approved oxygenate to replace MTBE in California, demand for
ethanol in California (for all transportation applications) could exceed 700 millions gallons a
year, or about 40 percent of the nation's current total output, when MTBE is phased out of
California's gasoline supply by 2003.124 A recent Consultant Report for the Energy
Commission evaluated the costs and benefits of using biomass-based ethanol production in
California to meet this oxygenate demand for California gasoline. The analysis was based on
establishing 200 million gallons per year of ethanol production in California. Many positive
attributes were identified to establishing a biomass-to-ethanol industry in California,
including a finding that the economic benefits are potentially greater than the costs. 125
Currently, in those states where it can be purchased, E85 is more expensive than gasoline on
an energy-content basis. Details on the cost and price dynamics of E85 were not available
from the ethanol industry,126 but a spot check of three stations in the Midwest (March 2001)
indicated that E85 prices at the pump range between $1.40 and $1.60 per gallon. This is
123
Presumably, all this E85 would be used to fuel FFVs, since there are currently no other mainstream uses for E85, and E-100 will be needed if
ethanol is to be used in fuel cell vehicles.
124
California Energy Commission, press release, Report Says California Can Benefit from Biomass-Based Ethanol Industry, March 21, 2001.
125
California Energy Commission, Costs and Benefits of a Biomass-to-Ethanol Production Industry in California, Draft Final Consultants Report
P500-01-002, by Arthur D. Little, March 2001, at http://www.energy.ca.gov/mtbe/ethanol/index.html
126
No survey response was received from the ethanol interest on the TAG.
equivalent to between $1.96 and $2.24 per gallon on an energy-content basis with
gasoline.127
Beginning in 2003, as MTBE is phased out and ethanol is used as its substitute, there will be
a major increase in demand before new ethanol production facilities can come on line in
California. This will likely cause a significant increase in the price of ethanol, causing the
price of E85 to approach or exceed $2.00 per gallon.128 In essence, the use of ethanol for
E85 to fuel FFVs would have to compete with its need as an oxygenate for reformulated
gasoline. This issue further clouds the future potential of ethanol to displace significant
volumes of petroleum fuel in California. Clearly, the use of ethanol in California as a
gasoline blending agent for motor vehicles will increase over the next 20 years, but currently
there is no foreseeable path to commercialization for near-neat (E85) or neat (E-100) ethanol.
Building Codes and Standards
E85 stations must meet similar codes and standards as M85 stations, although the fuel is less
corrosive and therefore creates fewer materials-compatibility issues. A good source for
codes, standards and other issues associated with E85 stations is Guidebook for Handling,
Storing and Dispensing Fuel Ethanol, prepared by the U.S. Department of Energy (see
http://www.afdc.nrel.gov/pdfs/ethguide.pdf).
Time Horizon for Full Technological Maturity
E85 stations are already technologically mature, in those states where they are currently
located.
Summary of Major Barriers and Impediments
There are a number of key barriers and impediments for the E85 fueling infrastructure in
California. These include the following:
•
High production and distribution costs relative to gasoline and diesel fuel.
•
Lack of dedicated ethanol-fueled vehicles
•
Lack of a fuel-use requirement in the federal Energy Policy Act.
•
Lack of a fuel-use requirement in federal Corporate Average Fuel Economy regulations.
•
Lack of ease moving ethanol through the existing petroleum product network to endusers.129
•
Greater demand and more favorable economics to use ethanol as an oxygenate in
reformulated gasoline
127
A gallon of E85 contains about 71% of the energy found in a gasoline gallon.
128
California Energy Commission, Costs and Benefits of a Biomass-to-Ethanol Production Industry in California, Draft Final Consultants Report
P500-01-002, by Arthur D. Little, March 2001, at http://www.energy.ca.gov/mtbe/ethanol/index.html
129
Source - http://www.afdc.doe.gov/altfuel/eth_general.html
4.6
Methanol Fuel and Fueling Stations
Number of Stations in California
Methanol is a liquid fuel made from natural gas or renewable biomass resources. At its peak
use, M85 fuel (85% methanol blended with 15% gasoline) was sold at more than 60 facilities
around California, most of which were public-access stations. During the same period,
several transit districts converted one or more on-site diesel pumps over to neat methanol
(M100) stations. Most notably, the Los Angeles County Metropolitan Transit Authority
operated several M100 facilities to fuel approximately 330 methanol buses (equipped with
Detroit Diesel 6V92 engines). The Energy Commission developed a “California Fuel
Methanol Reserve,” and entered into cooperative agreements with certain oil companies to
dispense competitively priced methanol for at least 10 years. However, with no certified
methanol vehicles on the market today, only a fraction of California’s M85 and M100 fueling
stations remain operational.
Being an excellent carrier of hydrogen for fuel cell applications, methanol may re-emerge as
a transportation fuel in California. Based on announcements made through the California
Fuel Cell Partnership and by individual automakers,130 it appears possible that within a
decade significant numbers of light- and heavy-duty vehicles will be powered by fuel cell
engines using methanol131 reformate. Methanol producers expect to be able to meet the fuel
demand if these fuel cell vehicles come into widespread use. However, there will be many
retail-level issues to resolve. The most likely scenario for developing a methanol fuel
distribution system would be similar to what already occurred in the 1980s and early 1990s -utilizing the existing gasoline distribution system by adding methanol-fueling capacity to
retail gasoline outlets. This would require making sure that station components such as
storage tanks, piping and dispensers are methanol compatible.132
Existing and Needed Fuel Throughput
Methanex Corporation, a global leader in methanol production and marketing, estimates that
widespread acceptance of methanol fuel cell vehicles will require about 10% of California’s
fueling facilities dispensing the fuel. This would roughly equate to 950 methanol stations
statewide. Locations of these stations would need to be coordinated with the heaviest
concentrations of fuel cell vehicles, i.e., in the Los Angeles, Sacramento, San Diego, and San
Francisco metropolitan areas. Methanex indicated that “many factors must be considered to
estimate the fuel volumes per station,” including number of user vehicles, geography and
distribution system efficiency.133
130
The automaker most aggressive in making such announcements has been Daimler Chrysler, which has indicated that it will commercially
introduce methanol-fueled FCVs by 2002 (see http://www.daimlerchrysler.com/index_e.htm?/news/top/2000/t00619_e.htm).
131
Methanol would have to compete with other “hydrogen carrier” fuels, possibly including gasoline, with its fully developed fueling infrastructure.
132
Most underground tanks in the greater Los Angeles area are already methanol-compatible, due to SCAQMD Rule 1170, which requires that
“at least one tank be compatible when one or more underground motor vehicle fuel storage tanks are installed or replaced.”
133
Survey response from Methanex Corporation, October 2000.
Methanol Supply, Demand and Price
Methanol is sold as a chemical commodity and priced accordingly. According to industry
consultant Chemical Market Associates Inc., US Gulf Coast spot pricing for methanol in
March 2001 were at $233 to $238 per tonne (or 70 to 71.5 cents per gallon). As of March 30,
2001, spot pricing of methanol in the Asia/Pacific region was between 57 and 69 cents per
gallon, depending on location. Methanex reports that its average realized price for methanol
increased from $105 per tonne (32 cents per gallon) in 1999 to $160 per tonne (48 cents per
gallon) in 2000.134 On an energy basis, this latter price ($0.48) is equivalent to gasoline at
about $1.00 per gallon.135 The long-term price of methanol (2010 time frame) will be a
function of many factors (e.g., the cost of natural gas feedstock, methanol surpluses resulting
from MTBE phase-out), but projections from government sources indicate that it should be
competitive with gasoline on an energy equivalent basis.136
As previously noted, a consortium has been established to determine methanol fuel
specifications for fuel cell vehicles. Additionally, testing of fuel cell systems is being
conducted using various grades and combinations of methanol, and potential fuel additives.
These results will be utilized in determining the quality of methanol fuel that must be
delivered to fuel cell vehicles.
Station Capital Costs
Based on the M-85 station experience in California, the next-generation of methanol stations
(i.e., M-100 most likely focused on fuel cell vehicle applications) will be very similar to
today's gasoline fueling stations, having the same layout and employing the same types of
equipment. However, before M-100 can be dispensed as a commercial fuel for vehicles, a
number of safety and logistical issues will need to be addressed. These include: lack of flame
luminosity, safety of flammable vapors in storage tanks, prevention of ingestion, safe
handling by the public in a self-serve environment, and managing corporate liability.
According to a 1999 study performed for the methanol industry by EA Engineering, Science,
and Technology, Inc., the capital cost of adding methanol storage and dispensing capabilities
to an existing gasoline station is about $62,400. This retrofit consists of installing a new
double-walled underground storage tank, and methanol-compatible components such as
product and vapor piping, dispensers and valves. Where space is available and local codes
allow, an above-ground tank can be installed, reducing the overall cost to around $54,600.137
If an existing gasoline or diesel underground tank is already double walled and methanol
134
From Methanex Corporation website (http://www.methanex.com/methanol/currentprice.htm).
135
Methanol contains about 57,000 btu/gal, while gasoline contains about 115,000 btu/gal (both LHVs).
136
National Renewable Energy Laboratory, Alternative Fuels Data Center, website (http://www.afdc.nrel.gov/altfuel/met_general.html).
137
Much of this information was obtained from “Methanol Refueling Station Costs,” prepared for the American Methanol
Foundation, by EA Engineering, Science, and Technology, Inc., February 1999.
compatible,138 it can be cleaned and converted for methanol storage. This lower-cost option
would still require installing methanol-compatible piping and dispenser equipment.
Time Horizon for Full Technological Maturity
The strongest indications that commercial “re-deployment’ of methanol fueling stations may
occur in California over the next five to 10 years are the methanol-related activities of the
California Fuel Cell Partnership and its individual members. One associate member of the
Partnership, Methanex Corporation, is a member of the Energy Commission’s TAG, and
responded in October 2000 to the Clean Fuels Market Assessment’s fueling infrastructure
survey. Table 47 summarizes key input received from Methanex.
Table 47. Summary of survey input from Methanex on methanol infrastructure
Expected Timeframe for
Full Commercialization
♦
♦
Number of Methanol
Stations Needed in
California
No estimate given for full ♦
commercialization of
methanol fuel cell
vehicles or corresponding
fueling infrastructure
♦
Initial deployments
expected in 2004.
Approximately 10% ♦
of today’s retail
fueling stations for
♦
vehicles
Level of throughput
needed at each
station for
♦
commercial
success depends
on many factors
♦
RD&D Activities and Plans
Associate member of the California Fuel
Cell Partnership
Partnership will demonstrate different types
of FCVs in the Sacramento area and
“appropriate refueling mechanisms” in 2002
and 2003 timeframe
Also supporting fuel cell demonstration
activities in Europe and Japan
Co-operative agreement with Statoil and
XCELLSIS to evaluate commercialization
needs
Methanol Infrastructure RD&D Activities
Through its involvement in the California Fuel Cell Partnership, the methanol industry is
involved in efforts to prepare for deployment of fueling stations to meet the fuel demands of
fuel cell vehicles as they are deployed. For example, Methanex Corporation, Statoil and
XCELLSiS139 recently announced a co-operative agreement to evaluate how to
commercialize methanol fuel cell vehicles. Under this agreement, health, safety,
environmental and infrastructure issues associated with the use and introduction of methanol
fuel cell vehicles will be evaluated. According to the press release, these parties will publish
the findings and “expect to implement their findings in a real world application in the near
future.”140
138
This is the case for most underground tanks in the greater Los Angeles area. Since 1988, SCAQMD Rule 1170 has required that “at least one
tank be methanol-compatible when one or more underground motor vehicle fuel storage tanks are installed or replaced.”
139
XCELLSiS, formerly known as DBB Fuel Cell Engines, is a collaboration between Daimler-Chrysler, Ballard Power Systems and Ford to build
and deploy fuel cell engines with electric drive systems.
140
From XCELLSiS website (www.xcellsis.com).
Summary of Major Barriers and Impediments
Currently, there are less than ten public methanol stations in California, and possibly several
stations operating for private-fleet applications. The biggest barrier to a resurgence of
California’s methanol infrastructure is that no major vehicle manufacturers are currently
selling on-road vehicles that use methanol fuel.141 This situation may change over the next
several years, since several major auto manufacturers have announced plans to sell fuel cell
vehicles by 2004. If methanol becomes a preferred fuel for such vehicles in California, as is
the stated intention of some fuel cell makers and vehicle manufacturers, methanol stations
will be needed in proportion to the number of fuel cell vehicles deployed. Methanex
estimates that up to 1,000 neat methanol stations will be needed in California to support the
early years of commercialization. The California Fuel Cell Partnership includes participation
by organizations with vested interests in building methanol stations for this purpose, but it
remains to be seen if and when a methanol infrastructure will come to fruition.
4.7
Hydrogen Fuel and Fueling Stations
Number of Stations
As of early 2001, there are only a few facilities in California that are specifically designed to
dispense hydrogen as a motor vehicle fuel. Examples include the two different systems used
by Sunline Transit to fuel its direct-hydrogen fuel cell bus in the Coachella Valley. Today’s
hydrogen stations for vehicle applications are essentially hand-built, first-generation
prototypes. Most likely, they bear little resemblance to how optimized, cost-competitive
hydrogen stations of the future may perhaps operate.
Existing and Needed Fuel Throughput
Throughput at the few existing stations in California that dispense hydrogen fuel for vehicles
is very small, and currently insignificant in terms of petroleum fuel displacement. Although
estimates have been made for numbers of direct-hydrogen fuel cell vehicles in California
over the next decade (see page 35), it is premature to determine the necessary volumes of
hydrogen needed to sustain a hydrogen fueling infrastructure in California.
Hydrogen Supply, Demand and Price
Hydrogen, the simplest and lightest fuel, is the most abundant element on earth. However,
hydrogen normally occurs in a bound state with other elements and requires relatively large
amounts of energy to extract it from compounds such as water and natural gas. Hydrogen is
considered a renewable energy source, and supply is not expected to be a problem, at least in
terms of available feedstocks.
Because hydrogen is in a gaseous state at atmospheric pressure and ambient temperatures, its
use as a transportation fuel presents greater transportation and storage challenges than liquid
fuels. Similar to the case with natural gas fuel, there are a variety of approaches used to
produce hydrogen and store it onboard vehicles. These include the following:
141
It is noteworthy that the various types of E85 FFVs currently available in California use similar technology as formerly available M85 FFVs.
Reintroduction of M85 FFVs to the California market would not involve major changes in vehicle hardware or software.
•
Off-site steam methane reforming of natural gas, with tanker-truck delivery of liquid
hydrogen to the refueling station, and on-site storage of liquid and gaseous hydrogen
•
On-site natural gas reforming, with on-site compression and storage of gaseous hydrogen
•
On-site electrolysis (splitting of water into hydrogen and oxygen), with on-site
compression and storage of gaseous hydrogen
The “best” method for vehicle applications is yet to be determined and depends on the
intended application, as well as many other factors. As noted discussed in Section 3.2.2, the
first commercial direct-hydrogen fuel cell vehicles in California are likely to be transit buses,
deployed at transit districts that have chosen the “diesel” path under CARB’s transit bus fleet
regulation. Transit agencies that deploy a small number of fuel cell buses may choose to
follow the Chicago Transit Authority model, i.e., where liquid hydrogen is produced at a
large centralized plant, and then trucked to the transit agency’s on-site fueling facility for
storage. Liquid hydrogen is then pumped and vaporized for storage on the bus, similar to the
process used on today’s LNG vehicles where onboard LNG is vaporized for engine use.
A second alternative would be to follow British Columbia Transit’s model, and use on-site
electrolysis to produce hydrogen. This option makes most sense if there is an abundance of
renewable energy to power the electrolysis process, as is the case in British Columbia
(hydro-electric power) and the Coachella Valley of Southern California (wind and solar
power). For the electrolysis option, as the hydrogen is generated it is compressed and
pumped into storage tanks on each fuel cell bus. Another possibility would be to use on-site
generation of hydrogen using a small-scale methane reformer. Both of these latter methods
for generating hydrogen are being demonstrated at Sunline Transit in Palm Desert,
California, in conjunction with the California Fuel Cell Partnership.
Regardless of how it is produced, hydrogen for fuel cell applications needs to be free of
impurities (e.g., sulfur). Fuel standards will need to be adopted before significant numbers of
fuel cell vehicles are deployed.
Hydrogen cost and pricing studies have been performed by a variety of entities, including but
not limited to Directed Technologies and Princeton University.142 The price of hydrogen as
an automotive fuel will be a function of many factors, including the following: 1) cost of
feedstocks such as natural gas and methanol, 2) technology and related costs for the fuel
production process (e.g., methane steam reforming, solar electrolysis, hydroelectric
electrolysis), 3) proximity of feedstock supply, and 4) specific issues within individual
markets served. It is generally accepted that the price of hydrogen fuel will be significantly
higher than gasoline and diesel fuel in the early years of fuel cell vehicle deployment.
Station Capital and Operational Costs
The capital costs of hydrogen stations are not fully known at this time. Station designs are
only in the conceptual stage, and few hydrogen-specific codes and standards exist. Capital
142
For example: J.M. Ogden, “Developing a Refueling Infrastructure for Hydrogen Vehicles: A Southern California Case Study,” International
Journal of Hydrogen Energy, 1999, and J.M. Ogden, M. Steinburler and T. Kreutz, “A Comparison of Hydrogen, Methanol and Gasoline as Fuels
for Fuel Cell Vehicles,” Journal of Power Sources, vol. 79, pp. 143-168, 1999.
costs will depend in part on whether a liquefied hydrogen or compressed form of hydrogen
will be stored and/or produced at the station. In either case, costly fire and safety
requirements are likely to be the norm at hydrogen stations in the early years of deployment.
In 1998, it was estimated that the costs of hydrogen fueling stations for a typical 200-bus
transit operation would likely exceed the current cost of large CNG stations (i.e., as much as
$1.5 million).143 Recent estimates for first-generation hydrogen stations being built in West
Sacramento and other areas under the California Fuel Cell Partnership indicate they can cost
between $2 and $3 million, at least in these early developmental years.144 Given that a large
LNG station for transit bus operations can cost as much as $4.5 million when including all
necessary site modifications,145 it’s possible that comparably sized hydrogen stations will
carry even higher price tags initially.
Operation and maintenance costs for hydrogen stations are also likely to be as high or higher
than comparable types of natural gas stations (i.e., compressed or liquefied gas).
Building Codes and Standards
Few (or no) standards and codes have been established specifically for hydrogen vehicle
fueling stations. It is expected that certain existing standards for other compressed or
liquefied fuels will be adapted for hydrogen; however, entirely new standards and codes will
be needed as well. This is one of the most challenging existing barriers to using hydrogen as
a mainstream transportation fuel. Recently, government and industry representatives
discussed this issue in detail at a “Blueprint for Hydrogen” workshop.146 A wide array of
experts at the workshop assigned high priority to addressing hydrogen safety, along with the
accompanying codes and standards.
It was recommended that various federal agencies establish a national entity to prepare and
promulgate uniform codes and standards for hydrogen use as a fuel for light-duty vehicles
and transit buses. Some of these efforts are under way today through the International
Standards Organization's (ISO) Technical Committee (TC197), in conjunction with DOE and
the National Hydrogen Association. DOE is also supporting a comprehensive effort to
incorporate codes for hydrogen applications through the International Code Council (ICC)
process. In addition, this work on hydrogen codes and standards will be coordinated with
similar activities sponsored by the European Union. Sound practices for public safety and
handling of hydrogen fuel were also emphasized at the workshop, including training for end
users such as transit bus districts.
Time Horizon for Full Technological Maturity
As previously noted, a good source of information about hydrogen fuel for automotive
applications is entitled Blueprint for Hydrogen Fuel Infrastructure Development,147 which
143
Source: based on Table 41 of Guidebook for Evaluating, Selecting, and Implementing Fuel Choices for Transit Bus Options, Transportation
Cooperative Research Program Report 38, Transportation Research Board, National Academy Press, 1998
144
Personal communications to Jon Leonard (Arthur D. Little) from Susan Brown and Ken Koyama (California Energy Commission), 02/01/01.
145
This was the case with OCTA’s Garden Grove LNG facility (see LNG station section).
146
Blueprint for Hydrogen Fuel Infrastructure Development, Jim Ohi, National Renewable Energy Laboratory, based on October 1999 workshop
cosponsored by US DOE, California Energy Commission, and the California Air Resources Board.
147
Blueprint for Hydrogen Fuel Infrastructure Development.
summarizes results of a workshop co-sponsored by the U.S. Department of Energy, the
California Air Resources Board, and the Energy Commission. The main objective of the
workshop was to assess immediate actions needed to develop the beginnings of a hydrogen
fuel infrastructure within three to five years (i.e., the stated timeframe for the first hydrogen
fuel cell vehicles in California). This Blueprint documents a consensus among industry and
government participants on the desirable attributes of a hydrogen fuel infrastructure, and
provides estimates of the number, type, and uses of hydrogen vehicles anticipated in the
2000–2005 time period. It also explores how addressing near-term requirements and barriers
will facilitate establishment of a commercial-scale hydrogen fuel infrastructure.
Among the conclusions of the workshop was a consensus that the auto and energy industries
see no apparent “show stoppers” for technological advancement of hydrogen fueling stations
or fuel cell vehicles that might prevent significant deployment of hydrogen vehicles over the
next five years. In the words of the Blueprint for Hydrogen report, “the issue here is timing
and coordination of capital investments.”148 However, the magnitude of needed funding is
very large, with few compelling reasons for private industry to make such investments, as
long as petroleum fuels are abundant and affordable to the motoring public.
Hydrogen Infrastructure RD&D
To address these two major issues of funding and timing, recommendations emerged from
the workshop to develop a roadmap for a commercial-scale hydrogen fuel infrastructure.
While this will be a national and even international collaboration of government and industry
partners, California is clearly the focal point.
148
Blueprint for Hydrogen Fuel Infrastructure Development.
Table 48 summarizes the priorities for hydrogen RD&D that were identified, and the
aggressive schedule for implementation. Major funding appropriations are expected to come
from DOE and other federal agencies, with cost sharing from industry and government
partners.
Table 48. Schedule of tasks for the "Blueprint for Hydrogen" RD&D plan
Task
2000
2001
2002
2003
2004
2005
Standardized
Dispensing
Station
Design
Establish
requirements,
draft/validate
design,
standardize
dispensers
and other key
components
Adopt and
promulgate
design
Install initial
dispensing
stations
Original
equipment
manufacturers
(OEMs) build
standard
dispensing
equipment
Build
dispensing
stations as
needed
Build
dispensing
stations as
needed
Test and
Certify
Hydrogen
Containers
Adopt test
requirements,
conduct
testing, certify
to DOT
standards
Validate
container
systems on
vehicles,
begin fleet
testing
Define O&M
requirements;
OEMs begin
building
containers to
certified
standards
OEMs build
containers to
certified
standards
OEMs build
containers to
certified
standards
OEMs build
containers to
certified
standards
Integrated
Codes and
Standards
(C&S)
Prepare
overall C&S
strategy
Submit draft
code to ICC
ICC publishes
code
Effective date
of code
Prepare
revision if
needed
Submit
revisions to
ICC
Safety RD&D
for Public
Use of H2
Prepare and
initiate RD&D
Plan
Conduct
RD&D,
training
Conduct
RD&D,
training
Publish safety
and training
guidelines
Validate public
safety
Start limited
public fueling
Roadmap
Core group
prepares and
adopts
Roadmap
Begin to
implement
Roadmap
Revise
Roadmap for
longer term
Install initial
infrastructure
Validate fleet
vehicle
refueling
Revise
Roadmap
Source: From Blueprint for Hydrogen Fuel Infrastructure Development, Jim Ohi, National Renewable Energy Laboratory, based on
October 1999 workshop cosponsored by US DOE, California Energy Commission, and the California Air Resources Board.
To obtain further input on hydrogen RD&D, several organizations on the TAG with vested
interests in hydrogen were sent the Energy Commission’s clean fuels infrastructure survey in
mid 2000. Table 49 summarizes the relevant input that was received from these TAG
members regarding priorities for hydrogen RD&D. In several cases there are linkages to the
Blueprint RD&D priorities described above.
Table 49. Summarized responses on RD&D for hydrogen infrastructure
TAG Member
South Coast AQMD
Existing
Infrastructure
RD&D
RFP out for
hydrogen station
demonstration
Ongoing work with
California Fuel Cell
Partnership
Priority List for Further RD&D
AQMD will give top priority to funding hydrogen
infrastructure RD&D involving:
•
•
•
•
Technology/hardware for the distributed (smallscale) generation, compression, and dispensing of
pure hydrogen.
Safety codes and standards development and
adoption for hydrogen refueling stations for motor
vehicles.
Advanced hydrogen storage to reduce cost and
weight while increasing stored hydrogen mass.
Standardization of hydrogen fueling dispensers
California NGV
Coalition
Assorted RD&D
activities for CNG
(that may be
applicable to
hydrogen stations)
Possible conversion / transfer of CNG station technology
to hydrogen station deployment, after 2010
Sunline Transit
Agency
Ongoing work with
California Fuel Cell
Partnership
Complete hydrogen fueling systems are needed for fuel
cell buses
10 direct hydrogen
fuel cell buses,
using 500,000 scf
of hydrogen per
day
Of particular note in the table above is the recent request for proposals (RFP) for hydrogen
infrastructure development, issued by the South Coast AQMD. This effort is outside of the
California Fuel Cell Partnership activities, but closely linked. The RFP seeks proposals to
install and demonstrate “stand-alone hydrogen refueling stations” within the South Coast Air
Basin over an 18-month period. These stations are intended to serve as a distributed
hydrogen infrastructure to support those few early-entry hydrogen-fueled vehicles (fuel cell
as well as hybrid internal combustion engine).
SCAQMD will require the winner(s) to design, fabricate and integrate their hydrogen
refueling system into a compact, easily transportable package. As stand alone units, these
skid-mounted, modular systems will perform all the needed functions to deliver high-quality
hydrogen fuel (e.g., generation, purification, drying, compression, dispensing, and possibly
storage for fast fill). The latest in state-of-the-art hydrogen production technologies will be
sought, including steam reforming, partial oxidation (both thermal and catalytic) and water
electrolysis. As noted in the RFP, “steam reforming and partial oxidation could turn existing
natural gas distribution pipelines to a distributed hydrogen supply at the dispensing site.
Similarly, water electrolysis could rely on electricity and water lines for a distributed
hydrogen system.”149
149
Information about the SCAQMD RFP was obtained from the corresponding Governing Board letter on the AQMD website (www.aqmd.gov).
Projects such as these have potential to significantly advance the timeline for technological
maturity of hydrogen stations in California. However, SCAQMD funding for the project is
only $700,000, and much greater levels of funding are needed. These efforts will in part be
spearheaded by the California Fuel Cell Partnership. In late 2000, four companies -Hydrogen Burner Technology, Pacific Gas and Electric, Proton Energy Systems, Inc., and
Stuart Energy Systems -- were added to the Partnership. Each will reportedly provide at least
one hydrogen fueling station for demonstration in California.150
Summary of Major Barriers and Impediments
Major immediate barriers to wide-scale commercialization of hydrogen-fueled vehicles
include the following:
•
Cost to produce hydrogen
•
Lack of commercially available vehicles (internal combustion engine or fuel cell
vehicles)
•
Lack of low-cost, high-energy-content storage technology for hydrogen
•
Lack of capital currently invested in optimized hydrogen fueling stations
•
Perception of hydrogen as being more dangerous than conventional fuels
•
Need for new codes, standards and safety procedures for the use of hydrogen
150
Press release, ”Four Companies Join California Fuel Cell Partnership To Help Build Hydrogen Fueling Stations,” November 10, 2000, from
website of the California Fuel Cell Partnership (http://www.fuelcellpartnership.org/).
5.
Conclusions and Recommendations
This section summarizes key findings and conclusions, and provides specific
recommendations on how to expend the available $6 million under the California Clean
Fuels Infrastructure Development Plan (“the Plan”).
5.1
Overview and Summary of Target Vehicles / Applications
The Plan targets expansion of fueling infrastructure for alternative-fuel vehicles and
applications that will displace the greatest volumes of petroleum fuels. Whenever possible,
achieving quantifiable air-quality benefits is also an important objective. In addition to
mainstream alternative fuels, a variety of “unconventional” liquid fuels (e.g., biodiesel,
Fischer-Tropsch diesel) can potentially help California meet both objectives. However, the
immediate infrastructure needs of such fuels are minimal or need further definition,
compared to those of the most promising alternative fuels. For the purposes of expending the
Plan’s available $6 million towards expansion of California’s clean fuels infrastructure,
candidate fuels assessed in this report include natural gas, propane, ethanol, methanol,
electricity and hydrogen. Recommendations for immediate funding allocations are provided
for the most pressing fuels and applications; for others, monitoring of progress and/or further
assessments are suggested.
Currently, the heavy-duty vehicle sector offers the best opportunities to displace consumption
of petroleum fuels and achieve air quality benefits. However, the emissions competitiveness
of diesel-fueled HDVs is likely to rapidly improve over the next five years. As such, it’s
difficult to predict the longer-term degree to which emissions-related regulations will
continue to drive AFV commercialization. This makes it even more important to
immediately build momentum towards self-sustainable commercial AFV markets, while
energy security drivers are complemented by air quality regulations and related incentives.
Certain light- and medium-duty vehicle applications that entail high fuel use are also
conducive to fuel displacement.
The task to establish sufficient numbers of AFV fueling stations is significant. In the heavyduty sector alone, tens of thousands of AFVs will potentially be deployed in California over
the next decade, either to meet various government regulations or exploit incentive programs.
In the greater Los Angeles area, five new fleet rules from the South Coast Air Quality
Management District’s 1190 Series could potentially deploy more than 16,000 heavy-duty
AFVs over the next 15 years. In other parts of California, the California Air Resources
Board’s newly adopted transit bus fleet rule is already stimulating increased deployments of
alternatively fueled transit buses at an estimated 14 transit districts, including large districts
in Sacramento, San Diego, and the Bay area.
Near-term alternative fuels that are expected to help displace petroleum fuels in these HDVs
include natural gas (CNG, LNG, and L/CNG) and propane. For LNG alone, it is estimated
that approximately 6,000 new HDVs and 44 new fueling stations will be needed in the
western United States by 2010 to achieve a sustainable vehicle industry. Corresponding
vehicle and infrastructure investments will cost an estimated $167 million at the low end, and
as much as $334 million. Approximately $4 to $7 million per year will be needed from grants
and incentive programs, to augment industry’s share (roughly 75%). Large investments in
fueling infrastructure are also needed if greater numbers of CNG and propane vehicles are to
be deployed.
5.2
California’s Energy Crisis and Other Uncertainties
Since mid 2000, California has been experiencing an ongoing, major energy crisis. Virtually
all transportation fuel markets have been affected, and new developments are occurring on a
daily basis. This report attempts to assess likely ways in which the energy crisis may impact
potential AFV infrastructure projects, but comprehensive analysis is not within its scope. The
recommendations provided below are based on the assumption that, over the longer run, further
investments to diversify fuels in the transportation sector will help alleviate (rather than
exacerbate) California’s current energy crisis.
A major concern is the rising demand for natural gas by electricity generators, which may
severely constrain available natural gas supplies for the transportation sector, and may also
further affect supply and price for other key fuels (e.g., propane). Based on the best available
information as of mid 2001, it appears that supply and/or distribution problems for alternative
fuels such as natural gas and propane will persist in the short term, perpetuating volatile prices
that are currently higher than conventional fuels on an energy-equivalent basis. Longer-term
supply, demand and pricing scenarios from both the California Energy Commission and federal
Energy Information Administration suggest there will be a return to more competitive levels
within two to four years.
However, California will need to be proactive in developing new sources for alternative
transportation fuels, especially in lieu of the energy crisis. New actions are needed to reduce its
~85% dependency on imported natural gas, currently transported in by pipeline deliveries or
LNG shipments that appear fully subscribed. Potential strategies to augment California’s
supply of clean transportation fuels include further exploiting its large untapped resources of
waste-to-energy technologies, and using emerging gas-to-liquids technology to extract
stranded reserves of associated natural gas, which can yield LNG, zero-sulfur synthetic diesel
fuel, and methanol (among other useful products). These activities are needed in addition to
existing efforts to develop small-scale liquefaction plants to produce LNG, using pipeline gas
or remote gas sources.
Other concerns when allocating government funds to build alternative fuel infrastructure
include: 1) how to avoid “stranded” investments that ultimately fail to help displace
significant volumes of petroleum fuels, and 2) establishing criteria to determine when
government funds are no longer needed, i.e., developing “exit strategies” for each supported
fuel. Uncertainty about these complex issues has been magnified recently due to California’s
energy crisis. These issues will be tracked and addressed each year as the Clean Fuels
Market Assessment is updated. The $6 million that is immediately available for 2001
allocations under the Plan is a relatively small amount, compared to the magnitude of
infrastructure investments needed. Using the best-available current information, the
recommendations below are focused on the most promising infrastructure deployments that
1) are most in need of government funds to become commercially self-sustaining, and 2)
appear to entail the lowest risk to become stranded investments.
Related to this issue of minimizing risk is the question: To what degree should governmentsupported alternative fuel stations be required to offer public access and networked card
reader systems? Clearly, major expansion of public-access stations will be needed in the
long run to achieve a sustainable AFV market and maximize gasoline and diesel
displacement. However, at this early stage of commercialization, stations most conducive to
dispensing large volumes of fuel – a critical immediate objective – tend to be private or
“limited-access” stations affiliated with large anchor fleets. To address this dichotomy, it is
recommended that potential projects and applications be evaluated on a case-by-case basis
before determining if public-access capability should be required.
5.3
Funding Recommendations by Vehicle Application
The best use of funds for alternative fuels infrastructure will support end users and vehicle
applications with the following characteristics:
•
Are motivated by compelling reasons (e.g., regulations and/or incentives) to make
alternative fuels work
•
Are most in need of government support
•
Operate large fleets of centrally housed and fueled vehicles, with a significant percentage
of older engines
•
Dispense large volumes of fuel
•
Can utilize commercially available alternative fuel engines and vehicles, certified to
California’s lowest applicable emissions standards
•
Are located close to other fleets that could share a fueling station151
151
While sharing of stations may make sense from an economic standpoint, logistics to actually make such arrangements can be difficult (e.g.,
union issues, liability concerns, billing accuracy concerns, etc.).
Fleet applications that generally meet these characteristics, and therefore make the best
candidates for high-priority resource allocations in the “large” and “medium” project
categories (>$250,000 and up to $250,000, respectively), include the following:
•
Refuse haulers
•
Transit buses
•
Class 8 trucks (return to base)
•
High-fuel use LDV applications (e.g., large taxicab fleets)
•
High-fuel use MDV applications (e.g., airport shuttle buses, package-delivery services)
There are also potential AFV applications that may not currently involve high fuel use, but
are capable of significantly advancing California’s long-term potential to displace petroleum
fuels. Such applications are good candidates for resource allocations in the “small to
medium” category (roughly $65,000 to $250,000 per project). These include:
•
School buses
•
Small MDV and LDV fleets seeking “startup” operations with dedicated AFVs utilizing a
single dispenser, or multiple vehicle refueling appliances (VRAs)
5.4
Recommendations for Specific Resource Allocations by Fuel Type
Taking into account the objectives, issues and criteria discussed above, Table 50 provides
specific recommendations for funding allocations towards alternative fuel infrastructure
activities. These recommended allocations are meant to be approximate; actual allocations
will need to consider many factors, such as vehicle base and throughput, and availability and
timing of cost sharing from other sources.
Table 50. Infrastructure activities recommended for highest priority of resource
allocations
Station
Type
LNG
CNG
Target Fleets
Specific Needs and Priorities
Approximate
Recommended
Allocation
Public and private refuse
hauler companies, returnto-base delivery fleets,
•
Cost-share new stations
~$2.4 Million
•
Expand efforts to use small-scale
liquefaction facilities and indigenous gas
sources to produce LNG in California
~$1.2 Million
School districts and large,
high-fuel-use LDV fleets
•
Cost-share new station(s) for school
district(s) with highest fuel use and
strongest commitment to CNG.
Coordinate use of funds for CNG
infrastructure with bus purchases under
California Lower-Emitting School Bus
Replacement Program.
~$0.4 Million
•
Cost-share new station(s) for taxi fleets or
similar-use LDV fleets
~$0.3 Million
L/CNG
Transit districts or private
refuse haulers with
complement of HDVs and
MDVs/LDVs
•
Cost-share new L/CNG stations in
strategic locations for integrated use of
LNG HDVs and CNG MDVs/LDVs
~$1.0 Million
LPG
High-fuel-use State and/or
private fleets (including
off-road applications)
•
Cost-share optimized “beta” LPG stations
focused on fleets with dedicated vehicles
or large numbers of bi-fuel vehicles that
will guarantee fuel use
~$0.5Million
Small LDV or MDV fleets
starting out with AFVs
•
Cost-share sites that can use multiple
VRAs or small fueling stations to fuel
dedicated AFVs
~$0.2Million
CNG or
LPG
Total of Recommended Resource Allocations
$6.0 Million
A goal under the Clean Fuels Infrastructure Development Plan is to achieve approximately
$4 of cost sharing for every $1 spent by the Energy Commission. Potential sources to
achieve this cost sharing (approximately $24 million) are extensive, as summarized in Table
51.
Table 51. Sources of potential cost sharing
Station Type
LNG and
L/CNG
CNG
LPG
Examples of Potential Cost Sharing Sources for Infrastructure / AFVs
•
Turnkey LNG providers
•
Federal government (per Gas Technology Institute’s Infrastructure Working Group
recommendations)
•
~$7.5 million in MSRC (AB 2766) funds for FY 2001 (partially for infrastructure)
•
DMV fee programs (AB 2766, SCAQMD Clean Fuels Program)
•
Consortiums of LDV, MDV and HDV fleets seeking integrated CNG and LNG fueling
strategy
•
Other APCD programs (e.g., up to $70 million from the Sacramento Emergency Clean
Air Transportation Program, or SECAT)
•
~2.5 million from the Carl Moyer Program – Heavy-Duty Infrastructure Demonstration
(requires minimum monthly throughput for new stations of ~10,000 GGE)
•
Turnkey CNG providers
•
Federal government (per Gas Technology Institute’s Infrastructure Working Group
recommendations)
•
~$7.5 million in MSRC (AB 2766) funds for FY 2001 (partially for infrastructure)
•
SCAQMD Clean Fuels Program
•
Other DMV fee programs (AB 2766)
•
$12 million in SCAQMD funds from recent settlements (Los Angeles metro area)
•
California’s Lower Emitting School Bus Program (new vehicle purchase only)
•
Other APCD programs (e.g., up to $70 million from the Sacramento Emergency Clean
Air Transportation Program, or SECAT)
•
~$2.5 million from the Carl Moyer Program – Heavy-Duty Infrastructure Demonstration
(requires minimum monthly throughput for new stations of ~10,000 GGE)
•
Turnkey LPG providers (e.g., Clean Fuel USA)
•
Propane Trade Associations
•
Petroleum industry
•
LPG technology and engine developers
•
~$7.5 million in MSRC (AB 2766) funds for FY 2001 (partially for infrastructure)
•
SCAQMD Clean Fuels Program
•
Other DMV fee programs
•
Other APCD programs (e.g., up to $70 million from the Sacramento Emergency Clean
Air Transportation Program, or SECAT)
•
~$2.5 million from the Carl Moyer Program – Heavy-Duty Infrastructure Demonstration
(requires minimum monthly throughput for new stations of ~10,000 GGE)
5.5
Recommendations for Further Study and/or Monitoring of Progress
The following recommendations are made regarding other AFV types and their
corresponding infrastructure.
5.5.1
Battery EV Recharging Infrastructure
With recent changes adopted in the California ZEV program, it appears that the total number
of battery EVs deployed in 2003 will vary from 4,450 to 15,450. This range in part reflects
uncertainty about how the modified ZEV program will alter the relative market shares of
conventionally fueled light-duty vehicles versus battery-electric vehicles and other clean-fuel
technologies.
Today there are nearly 3,300 EV charging stations in California, including approximately
726 private residences wired for EV charging. New stations will be needed as EVs become
commercially available, at key locations within metropolitan areas. New activities are
underway to assess and address these needs, spearheaded by the Air Resources Board in
conjunction with the Energy Commission and local air districts.
The ramifications of California’s current power crisis to EV commercialization are not clear,
and the potential range of EV numbers that will be deployed is broad. It is recommended
that further assessments are conducted before further consideration is given to funding EV
infrastructure development under Plan funding. Specific recommendations are as follows:
•
An independent assessment should be conducted of the projected numbers and types of
EVs that will be deployed in California for the 2003 to 2010 timeframe, by type and end
use (government fleets, private users, utilities, etc.)
•
An assessment should be conducted of existing EV stations by location, type and how
they are used by end users (fleets as well as private individuals)
•
An assessment should be conducted on what impact neighborhood electric vehicles
(NEVs) will have on EV infrastructure needs (residential and public stations).
•
An assessment is needed of the feasibility to adopt statewide ordinances that require
construction of new homes and businesses to be compatible with state-of-the-art EV
charging systems.
•
An assessment is needed of the potential to develop and deploy an effective and
affordable billing system for public EV charging stations.
5.5.2
Hybrid Electric Vehicle Infrastructure
Hybrid electric vehicles (HEVs) are being developed that offer the advantages of electric
drive (high efficiency and torque at low speeds), while providing performance, fuel economy
and range equivalent or better than conventional vehicles. HEV types under development or
consideration include grid-connected (plug-in) vehicles as well as those with clean-fueled
ICE engines or microturbines. These vehicles have potential to help displace petroleum fuels
in the near term as well as serve as a bridge to all-electric propulsion systems (e.g., fuel cells
or advanced battery EVs). Since the infrastructure implications are not yet clear, no funding
appropriations are recommended at this time specific to HEVs. However, progress should be
closely monitored in annual updates of this Clean Fuels Market Assessment.
5.5.3
E85 FFV Infrastructure
FFVs powered by E85 are widely available in California at no incremental cost to the
consumer, but currently there are no E85 fueling stations. Virtually all E85 FFVs in
California are therefore being operated exclusively on gasoline. Nationally, demand for E85
will grow significantly over the next 20 years, possibly reaching 500 million gallons in 2020.
However, there are no known significant plans to sell any of this fuel in California. Plans by
vehicle and engine manufacturers to develop and market more advanced ethanol vehicles
(e.g., powered by dedicated E100 engines or fuel cells) are also unknown. These are among
the key barriers that exist to establishing an E85 or E100 fueling infrastructure in California.
Beginning in 2003, when ethanol replaces MTBE as the oxygenate in California gasoline,
there will be a major increase in demand for fuel-grade ethanol. Biomass-based ethanol
production in California is one possible means to meet this oxygenate demand, although
building new ethanol-production facilities will lag demand. This issue further clouds the
future of E85 in California, because the use of ethanol for FFVs is not currently economically
competitive with its use as an oxygenate for reformulated gasoline.
For these reasons, it is recommended that no 2001 funds be allocated to ethanol infrastructure
under the California Clean Fuels Infrastructure Development Plan. However, future market
assessments should revisit this possible use of funds.
5.5.4
Methanol Infrastructure
Methanol is an excellent carrier of hydrogen for use in fuel cells, and can also work well in
vehicles with internal combustion engines. Today there are less than 10 public M85 or M100
fueling stations in California. The biggest barrier to expanding this infrastructure is that no
major vehicle manufacturers are currently selling on-road vehicles that use methanol fuel.
This situation may change over the next several years, since several major auto
manufacturers have announced plans to sell fuel cell vehicles by 2004. It is expected that
additional information will be released through the California Fuel Cell Partnership, as it
becomes available.
Methanol producers such as Methanex expect to be able to meet the fuel demand if these fuel
cell vehicles come into widespread use. The most likely scenario for developing a methanol
fuel distribution system would be similar to what already occurred in the 1980s and early
1990s -- utilizing the existing gasoline distribution system by adding methanol-fueling
capacity to retail gasoline outlets. A consortium has been established to determine methanol
fuel specifications for fuel cell vehicles, and assess commercialization issues.
Methanol infrastructure should remain a candidate for potential support under the California
Clean Fuels Infrastructure Development Program. However, for the currently available
$6,000,000, it is premature to allocate funds to methanol infrastructure.
5.5.5
Hydrogen Infrastructure
Hydrogen is expected to be the long-term fuel for fuel cell vehicles. On strictly a
demonstration scale, in certain niche applications such as transit buses, direct-hydrogen fuel
cell vehicles are already displacing conventionally fueled vehicles. However, achieving
widespread use of direct-hydrogen fuel cell vehicles will require vehicle, fuel-production and
infrastructure investments of very large proportions. Activities under the California Fuel
Cell Partnership and DOE’s hydrogen program are addressing some of these issues.
Hydrogen infrastructure should remain a primary candidate for future support under the
California Clean Fuels Infrastructure Development Program. However, for the currently
available $6,000,000, it is premature to allocate funds to hydrogen infrastructure.
5.6
Recommendations for AFV Infrastructure Incentives
An important ongoing need in advancing the commercial viability of clean fuel technologies
is to implement effective, affordable and workable incentives. Until economies of scale can
be realized to make alternative fuel technologies self sustaining, manufacturers and
consumers need assistance in offsetting higher costs and/or reduced utility compared to
conventional vehicles.
Many types of incentives have been used in California and other states to support AFV
deployment, but some have clearly been more effective than others. Generally, state and local
grants have provided the best motivation for fleets to purchase AFVs, whereas tax credits
have worked well for individual AFV owners. In some cases, well-meaning but poorly
designed and implemented incentive programs have resulted in ineffective use of funds or
even financial disaster (e.g., the Arizona program). Greater understanding is needed on the
mechanics of effective incentives for AFVs and fueling stations. It is recommended that the
Energy Commission and its partners conduct a detailed assessment of financial and
administrative incentives that can most effectively help deploy AFVs with maximum
displacement of petroleum fuels. Examples of the types of incentives that could be further
assessed are listed in Table 52.
Table 52. Potential new incentives for AFVs and fueling stations
Potential New Financial Incentives
•
Allowance for reimbursement of
administrative costs from using clean fuel
vehicles and infrastructure
•
Financial incentives for installation of
AFV stations during new commercial
construction
Potential New Administrative Incentives
•
Expanded HOV access (e.g., for clean-fueled
MDVs and HDVs)
•
Streamlined approval and permitting of AFV
stations from code and fire-safety officials
•
Rideshare or other incentives for employers that
install EV chargers
•
Preferred public parking for SULEV (or better)
AFVs
•
More favorable fuel tax laws
•
Better tax breaks for using AFVs
•
Funding to offset transaction fees when
using credit cards at AFV stations
•
Administrative incentives for installation of AFV
stations during new commercial construction
•
Financial grants for training operators
and maintainers of AFV stations
•
Improve convenience of using AFV stations (or,
minimize inconvenience, which is a disincentive)
•
Re-visit fuel-use incentives such as
those used in methanol program
•
Eliminate federal tax on state incentives
6.
Appendix A: Air Quality Regulations and Petroleum Displacement
6.1
Light-Duty Vehicles
In California, LDVs have been subject to the world’s most stringent emissions standards
since the late 1960s. In recent years especially, major strides have been achieved in reducing
emissions from conventionally fueled LDVs, directly as a result of the California Air
Resources Board’s (CARB) landmark Low-Emission Vehicle regulations adopted in 1990, as
well as “competition” from low-emitting vehicles deployed under the Energy Commission’s
Methanol Program. Gasoline-powered Super-Ultra-Low Emission Vehicles (SULEVs), are
now available at comparable prices to conventional LDVs (see Table 53). These vehicles
emit about 95% less ozone-precursor emissions (reactive hydrocarbons and NOx) compared
to vehicles meeting the basic standard. However, one dedicated natural gas vehicle, the
Honda Civic GX, was recently certified as California’s first Advanced Technology Partial
Zero-Emission Vehicle (ATPZEV).
Table 53. 2001 LDV types certified to CARB’s most stringent emissions standards
No. of MY 2001 Passenger Car
Engine Families Certified in
California to Standard
Technology Type / Fuel
Internal Combustion Engine / Gasoline
Internal Combustion Engine / Compressed Natural Gas
ZEV or
PZEV*
SULEV**
ULEV***
0
2
18
0
1
b
1
a
Hybrid-Electric / Gasoline
0
2
0
Battery Electric / Grid Electricity
4
0
0
Fuel Cell Electric / Methanol or Hydrogen
0
0
0
Source: CARB website, June 2001. Additional certifications may have occurred that were not yet posted on
the website.
*PZEV = Partial Zero-Emission Vehicle, **SULEV = Super-Low Emission Vehicle, ***ULEV = Ultra-Low Emission
Vehicle
a
The CNG-fueled Honda Civic GX was recently designated as an Advanced Technology PZEV
b
Both commercially available hybrid-electric vehicles – the Toyota Prius and the Honda Insight (CVT version) – are
SULEVs and use parallel hybrid configurations (gasoline engine, electric motor / nickel metal hydride battery pack)
With progressively cleaner cars becoming commercially available, operators of LDV fleets
can achieve significant emissions reductions in their fleet simply through the practice of
replacing older vehicles with gasoline-fueled ULEVs and SULEVs. As long as advancedtechnology gasoline LDVs can meet the most stringent standards at little or no incremental
vehicle and infrastructure costs – and gasoline remains affordable and abundantly available –
air quality may not be a driving force to deploy significant numbers of light-duty AFVs in
California over the next five years.152 However, the use of clean fuels in certain light-duty
152
Over the longer term, LDVs using clean fuels (e.g., methanol or direct hydrogen) are expected to deliver zero or near-zero emissions while
simultaneously displacing large volumes of gasoline fuel.
applications can still offer compelling benefits towards sustainable use of alternative fuels in
California, directly resulting in displacement of petroleum fuels.
6.2
Medium-Duty Vehicles
As Table 54 shows, a total of three engine families in the medium-duty sector have been
certified to SULEV standards. Two of these engine families, Chrysler’s 5.2 liter CNG
engine and Ford’s 5.4 liter CNG engine, use alternative fuels, while one engine family
(Acura 3.5 L MDX) has achieved the SULEV standard with gasoline. SULEVs in this
category are 70% lower emitting than average new vehicles of similar weight, according to
CARB (details about these categories can be found at CARB’s “Buyer’s Guide to Cleaner
Cars” at http://www.arb.ca.gov/msprog/). To date, eight medium-duty engine families (from
several manufacturers) have been certified to the next-cleanest (ULEV) standard for the 2001
model year. These MDVs are 50% cleaner than the average new vehicle of similar weight.
The net result is that very low-emitting alternative fuel vehicles are available in medium-duty
applications, and their use will result in direct displacement of gasoline consumption.
However, their use strictly for air quality benefits may be less compelling, given the
improving emissions-competitiveness of gasoline-fueled MDVs.
Table 54. Recent MY medium-duty vehicle certifications by type
No. of MY 2001 MDV Engine
Families Certified in California
to Standard
Technology Type / Fuel
ZEV*
SULEV**
ULEV***
Internal Combustion Engine / Gasoline
0
1
6
Internal Combustion Engine / Compressed Natural Gas
0
2
1
Hybrid-Electric / Gasoline
0
0
0
Battery Electric / Grid Electricity
4
0
0
Fuel Cell Electric / Methanol or Hydrogen
0
0
0
*ZEV = Zero-Emission Vehicle (2000 Model Year)
**SULEV = Super-Low Emission Vehicle
***ULEV = Ultra-Low Emission Vehicle
6.3
Heavy-Duty Vehicles
In the heavy-duty vehicle (HDV) sector, the use of alternative fuels can displace large
volumes of petroleum fuel while also delivering clear and compelling emissions benefits, at
least in the near term. There are approximately 350,000 HDVs registered in California for
on-road vehicle use.153 Including out-of-state vehicles, an estimated 550,000 heavy-duty onroad diesel trucks and buses are driven throughout California. Including off-road dieselfueled HDVs, approximately 1.25 million heavy-duty diesel engines are operated in
California.154 Many of these engines are equipped with little or no emissions control
153
California Energy Commission, California Energy Outlook 2000: Volume II Transportation Energy Systems, August 2000.
154
California Air Resources Board, California’s Plan to Reduce Diesel Particulate Emissions: Fact Sheet, October 2000.
technology. On-road HDVs alone contribute nearly 40% of all NOx emissions from mobile
sources in California. NOx is a major ingredient in the formation of ozone, the main harmful
component of urban smog. Fine particulate matter exhaust from heavy-duty diesel engines
contributes to mortality, and CARB has identified it as a toxic air contaminant.155
Today there are numerous alternative-fuel heavy-duty engines that have demonstrated
superior emissions performance compared to currently available diesel engines. As of early
2001, no diesel-fueled engines have been certified to CARB’s optional low-NOx standard
(2.5 grams per brake horsepower-hour) for HDVs. By contrast, since the 1998 model year
more than a dozen heavy-duty natural gas engines meeting these standards have been offered
commercially in California.
Largely based on the proven emissions-reduction potential of various alternative fuel HDVs
using these engines, California agencies have adopted regulatory drivers and/or incentives to
assist deployment of these vehicles. For example, CARB’s Public Transit Bus Fleet Rule was
specifically designed to increase deployments of low-emission alternative-fuel engines,
including advanced battery and fuel cell technology use. 156 About 8,500 transit buses will be
affected at 75 different transit districts. As of March 2001, 26 transit districts have chosen the
alternative fuels path, 40 have chosen the diesel path, and 9 have not yet declared.157 For
transit agencies that have selected the alternative fuel path, at least 85 percent of all new bus
purchases must be alternative fuel through the 2015 model year.158 Transit agencies that
have chosen the “diesel” path must obtain equivalent fleet-averaged emissions reductions by
2010. Included for larger transit districts (>200 buses) is the requirement to conduct
demonstrations of Zero-Emission Buses (ZEBs) in 2003 and begin purchasing ZEBs in 2008
-- two years before transit districts on the alternative fuel path.
California’s air pollution control districts are also adopting major drivers for HDVs using
alternative fuels. The South Coast Air Quality Management District has adopted a series of
“fleet rules” for end users in the South Coast Air Basin (SCAB) that effectively require a
phasing out of current-technology diesel vehicles in favor or heavy-duty AFVs, or their
emissions equivalent. Table 55 lists SCAQMD’s adopted or proposed fleet rules affecting
HDVs, and the estimated populations for potential conversion to alternative fuels.
155
California Air Resources Board, “CARB Identifies Diesel Particulate Emissions as a Toxic Air Contaminant,” Press Release 98-51, August 27,
1998.
156
California Air Resources Board, Staff Report: Initial Statement of Reasons – Proposed Regulation for a Public Transit Bus Fleet Rule and
Emission Standards for New Urban Buses, January 27, 2000.
157
158
Fax from Alvaro Gutierrez, California Air Resources Board, to Jon Leonard on April 10, 2001.
Although transit agencies are not required to purchase alternative fuel buses certified to an optional low-NOx credit standard (2.5 g/bhp-hr
NOx or lower), those are the only certified alternative fuel bus engines currently available. In addition, bus engines certified to an optional lowNOx credit standard can qualify for incentive funding.
Table 55. SCAQMD’s adopted or proposed fleet rules affecting HDVs
SCAQMD
Fleet Rule No.
Targeted Fleet Type(s)
Estimated SCAB HDV Population for
159
Potential Conversion to Alt. Fuels
1192
Transit Buses
5,000
1193
Refuse Haulers
6,000
1194
Airport Support Vehicles
500
1186.1
Street Sweepers
700
1196
Heavy-Duty Public Fleets
4,100
Total
16,300
Sources: SCAQMD staff reports on fleet rules, and personal communication from David Coel, SCAQMD, to Jon
Leonard, ADLittle on 3/27/01
However, as regulators acknowledge in these rules, the emissions competitiveness of dieselfueled HDVs will rapidly improve over the next decade. The major drivers are a series of
progressively more stringent new heavy-duty engine emission standards, coupled with
requirements for cleaner diesel fuel, promulgated by CARB and EPA. In late 2000, CARB
approved a comprehensive Diesel Risk Reduction Plan that includes 14 measures to reduce
emissions from both new and existing diesel-fueled engines and vehicles. Among these
measures are the establishment of more stringent emissions standards that will take effect in
2002 and 2004. In early 2001, EPA also adopted more stringent emissions requirements for
heavy-duty diesel engines. As part of this program, new emission standards will take effect in
model year 2007 and will apply to HD highway engines and vehicles. To meet these
standards with diesel engines, it is expected that manufacturers will need to incorporate
advanced diesel emission control technologies such as catalyzed diesel particulate filters and
NOx adsorbers. Because sulfur renders these systems ineffective, both CARB and EPA are
requiring sulfur levels in highway diesel fuel to be reduced more than 90% by 2006.160,161
As a result, there is less certainty about the emissions advantages of alternative fuels after the
2002 low-NOx standards are initiated for heavy-duty engines, and the 2004 NOx standards
take full effect. Heavy-duty engine manufacturers have indicated that advanced diesel
engine technologies combined with low-sulfur diesel fuel will be able to duplicate or better
the emissions performance of today’s alternative fuel engines. Meanwhile, several
manufacturers are also involved in efforts to further reduce emissions from their natural gas
engines, to NOx levels about 75% lower than today’s natural gas engines.162
159
These numbers are educated estimates, according to SCAQMD. The actual number and rates of AFVs introduced will be affected by 1) each
fleet rule’s phase-in rate and exemptions, 2) availability of various AFV types, 3) fleet turnover rates, 4) available funding. On average, full
phase-in of these rules is expected to occur between 2010 and 2015.
160
California Air Resources Board, California’s Plan to Reduce Diesel Particulate Emissions: Fact Sheet, October 2000.
161
U.S. Environmental Protection Agency, Heavy-Duty Engine and Vehicle Standards and Highway Diesel Fuel Sulfur Control Requirements,
December 2000.
162
Under a program jointly funded by the Energy Commission, the SCAQMD and NREL, two programs are being initiated to develop and certify
0.5 g/bhp-hr NOx HD engines. The engine OEM participants are Cummins (with Westport Innovations) and Detroit Diesel Corporation.
Looking out past 2004, air-quality drivers for alternatively fueled HDVs become even less
concrete. By 2007, both diesel and alternative-fuel heavy-duty engines will need to emit
about 90% less NOx and PM than today’s lowest-emitting alternative fuel engines. These
fuel-neutral standards will be challenging for both advanced diesel and alternative fuel
engines. However, it is noteworthy that diesel engines have significantly “farther to go” in
reaching the target levels. Taking an alternative fuel approach may offer significant
engineering and cost advantages, at least for certain engines and applications.
7.
Appendix B: Maps and Linkages for AFV Technologies
7.1
Clean Fuel Station Mapping
There are a number of government agencies and private stakeholders that have developed
very effective mapping systems for most of California’s AFV fueling stations. By far the
best available information is focused on “public access” stations. Station operators with
large anchor fleets have less need for maps because vehicles are returned to the same fueling
base each day. Map systems for public-access stations play an important role in assuring
existing and potential AFV users that the vehicle can be driven as needed, without fear of not
finding the alternative fuel in the region of travel.
Increasingly, “hard copy” map systems are being replaced by Internet sites, which enable the
NGV user to quickly go on line and locate an AFV fueling station in the area where he or she
expects to need fuel. Table 56 lists some of the more prominent websites that offer effective
web-based mapping systems for alternative fuels such as CNG, LNG, propane, E85, and
electric charging.
Table 56. Websites with maps for clean fuel stations
Website Name /
Operator
Featured Fuels
Address
California NGV Coalition
http://www.califngv.org
CNG
Calstart / Westart
http://cleancarmaps.com
CNG, LNG, LPG, Methanol,
Ethanol, Hydrogen, Electric
DOE / NREL
http://afdcmap.nrel.gov
CNG, LNG, LPG, Methanol,
Ethanol, Hydrogen, Electric
Trillium USA
http://www.trilliumusa.co
m
CNG
http://www.gladstein.org
LNG, L/CNG
Magnecharge
www.magnecharge.com
Electric (using Magnecharge
system only)
Pinnacle CNG
http://www.pinnaclecng.com
CNG
Pickens Fuel Corp.
Sacramento
Municipal
Utility District
Southern
California
Edison
http://www.pickensfuel.com
http://www.smud.org/evs/
CNG, LNG, L/CNG
Electric (all charging stations
in Sacramento County)
Electric (all charging stations
in Edison’s territory), with
sightseeing “itineraries” that
are within available driving
range of EVs
ICTC / Gladstein
Associates
&
http://www.edisoncars.co
m
Figure 7-1 shows the web-based mapping system of the California Natural Gas Vehicle
Coalition, which allows the user to click on any region of California to find available natural
gas fueling stations. The National Renewable Energy Laboratory’s mapping system is one of
the most comprehensive for various types of clean fuel stations.
While these mapping systems are very user friendly and convenient, a spot check of each
website found that it’s very common for the maps to be out of date, or inaccurate. For
example, Cleancarmaps.com shows that there are currently 13 M85 stations in California, all
of which are operational. This information is out of date, but it’s useful that mapping
systems are in place for fuels such as methanol, if the methanol-refueling infrastructure redevelops to fuel methanol-reformate fuel cell vehicles. Cleancarmaps.com is also already set
up to map hydrogen stations in California. However, it currently shows no existing stations
for automotive applications. The hydrogen station at Sunline Transit Agency in the
Coachella valley is technically open for business, but its use is currently restricted to special
vehicles such as the XCELLSiS fuel cell bus.
Source: http://www.califngv.org/pacificcoastmap.jpg
Figure 7-1. Web-based map system for the California NGV Coalition
7.2
Relationships to Clean Cities
The national Clean Cities program is founded on the use of locally based
government/industry partnerships to encourage the use of alternative fuel vehicles and their
supporting infrastructure. Public and private AFV stakeholders located throughout northern
and southern California have joined into Clean Cities Coalitions, and played an essential role
in expanding the number of clean fuel stations. The Department of Energy and the Energy
Commission are among the many government agencies that have assisted the Clean Cities
program to encourage AFV development, as a means to achieve both energy security and
environmental quality goals.
CNG Vehicles and Stations
California’s CNG stations have been well integrated into these activities. Table 57 lists some
of California’s Clean Cities stakeholders and how they have helped to develop, demonstrate,
and assess CNG vehicles and the associated fueling infrastructure.
Table 57. Relationship of Clean Cities and California’s CNG infrastructure
Clean Cities Stakeholder
Examples of Involvement with CNG Infrastructure
Bay Area AQMD
♦
Use of CNG vehicles and expansion of CNG station network
California Air Resources Board
♦
Use of CNG vehicles and expansion of CNG station network
♦
Promulgation of regulations resulting in expanded NGV use
California Energy Commission
♦
Use of CNG vehicles and expansion of CNG station network
CalStart / WestStart
♦
Cleancarmaps.com mapping of CNG stations
♦
Listing of vendors for CNG fueling stations and NGVs
City of Los Angeles
♦
Use of CNG vehicles and expansion of CNG station network
City of Sacramento
♦
Use of CNG vehicles and expansion of CNG station network
City of Tulare
♦
Use of CNG vehicles and expansion of CNG station network
Coalition for Clean Air
♦
Promotion of heavy-duty CNG vehicles to displace diesel-fueled
vehicles
County of Sacramento
♦
Use of CNG vehicles and expansion of CNG station network
FleetStar Incorporated
♦
Provider of CNG fuel at 9 fueling stations
Pacific Gas and Electric
Company
♦
Provider of CNG fuel at 35 fueling stations
♦
Promoter of NGVs and infrastructure
Paratransit
♦
Operating CNG buses and fueling station
Pickens Fuel Corporation
♦
Turnkey provider of CNG fueling stations
Sacramento Metro AQMD
♦
Use of CNG vehicles and expansion of CNG station network
San Diego County APCD
♦
Working on AFV Master Plan for San Diego County
San Diego Clean Fuels
Coalition
♦
Use of CNG vehicles and expansion of CNG station network
San Joaquin Valley Unified
APCD
♦
Use of CNG vehicles and expansion of CNG station network
South Coast AQMD
♦
Use of CNG vehicles and expansion of CNG station network
♦
Promulgation of fleets rules leading to NGV use and new CNG
fueling stations
SoCal Gas Company
♦
Use of CNG vehicles and expansion of CNG station network
US Department of Energy
♦
Use of CNG vehicles and expansion of CNG station network
♦
EPACT and other efforts that increase NGV use
LNG Vehicles and Stations
Generally, the focus of the Clean Cities program has been on alternative fuels for light and
medium-duty vehicle applications. Since LNG is used primarily for heavy-duty vehicles, to
date it has not been a key fuel in the Clean Cities program. However, California’s Clean Cities
stakeholders tend to have diverse interests (i.e., beyond light-and medium-duty vehicles) that
include activities to deploy LNG vehicles and the associated fueling infrastructure. Also,
Clean Cities activities to deploy CNG vehicles can be tied to LNG activities, because CNG
vehicles can be fueled at L/CNG stations, which are specialized LNG stations that also offer
CNG (see section 4.2.3).
Propane Vehicles and LPG Stations
Many of California’s Clean Cities help to sponsor development and deployment of LPG-fueled
vehicles. LPG suppliers are often involved in their local Clean Cities program, to assist with
infrastructure needs and demonstrations of LPG vehicles. Table 58 provides other examples of
California’s Clean Cities stakeholders involved in activities that directly or indirectly help to
expand the use of LPG vehicles in California.
Table 58. Examples of Clean Cities Involvement in Propane Infrastructure
Examples of Involvement with
LPG Vehicles and Infrastructure
Clean Cities Stakeholder
California Air Resources Board
♦
Promulgation of regulations that may promote greater
deployment of LPG-fueled vehicles
California Energy Commission
♦
Offers infrastructure development activities that can include LPG
stations
City of Los Angeles
♦
Use of LPG vehicles including LPG-fueled hybrid with Capstone
microturbine auxiliary power units
♦
Current RFP to expand clean fuel infrastructure
Coalition for Clean Air
♦
Promotion of clean fuel HDVs including those powered by LPG
County of Sacramento
♦
Potential deployment of agriculture pumps fueled by LPG
Automakers (Ford, GM)
♦
Production at factory of LPG-fueled engines
Sacramento Metro AQMD
♦
Potential Moyer funding of LPG-fueled agriculture pumps
San Diego County APCD
♦
Working on AFV Master Plan for San Diego County
San Joaquin Valley Unified
APCD
♦
Potential Moyer funding of LPG-fueled agriculture pumps
South Coast AQMD
♦
Promulgation of fleet rules that may encourage expanded use of
LPG-fueled low-emission vehicles
Ventura County APCD
♦
Potential Moyer Program funding of LPG-fueled agriculture
pumps
EVs and Electric Charging Stations
Many of California’s Clean Cities help to sponsor development of EV charging stations and
expanded use of EVs. Most Clean Cities have at least one public charging station or fleet
charging station. Table 59 provides other examples of California’s Clean Cities stakeholders
involved in activities that directly or indirectly help to expand California’s EV charging
station infrastructure.
Table 59. Examples of EV infrastructure activities by Clean Cities stakeholders
Examples of Involvement with EVs
and Charging Infrastructure
Clean Cities Stakeholder
California Air Resources Board
♦
Promulgation of ZEV regulations that promote infrastructure
development
Bay Area AQMD and City /
County of San Francisco
♦
Collaborate on EV infrastructure funding program
California Energy Commission
♦
Offers EV infrastructure development activities and charging
stations (residential and public)
CalStart / WestStart
♦
Cleancarmaps.com mapping of EV stations
♦
Listing of vendors for EVs and charging stations
Coalition for Clean Air
♦
Promotion of EVs as foundation of California’s clean air strategy
County of Sacramento
♦
Use of EVs and expansion of the charging station network
Pacific Gas and Electric
Company
♦
Use of EVs and expansion of the charging station network
Automakers (Ford, GM, Honda)
♦
Contribute funding to EV infrastructure development (residential
and/or public)
San Joaquin Valley Unified
APCD
♦
Funds EV infrastructure development activities
South Coast AQMD
♦
Funds EV infrastructure development activities
♦
Promulgation of fleet rules that encourage EV use
Mobile Source Air Pollution
Reduction Review Committee
♦
Completed two large public infrastructure programs to expand EV
charging stations in the South Coast region
Ventura County APCD
♦
Funds EV infrastructure development activities
Hydrogen Vehicles and Fueling Stations
California’s Clean Cities stakeholders are also helping to directly or indirectly promote
hydrogen fuel and fuel cell vehicles. Examples are provided in Table 60 below.
Table 60. Examples of Clean Cities stakeholders involved with hydrogen
infrastructure
Clean Cities Stakeholder
California Air Resources Board
Examples of Involvement with Hydrogen Infrastructure
♦
♦
Promulgation of regulations that ultimately promote deployment
of direct-hydrogen fuel cell vehicles
Member of California Fuel Cell Partnership
Co-sponsor of hydrogen “Blueprint” plan (see text for description)
California Energy Commission
♦
♦
♦
Member of California Fuel Cell Partnership
Ongoing infrastructure support including hydrogen related
Co-sponsor of hydrogen “Blueprint” plan
Automakers (Ford, GM, many
others)
♦
♦
RD&D programs involving direct hydrogen fuel cell vehicles
Member of California Fuel Cell Partnership
South Coast AQMD
♦
♦
♦
Promulgation of fleet rules that may encourage direct-hydrogen
fuel cell vehicles
Funding of H2 infrastructure programs (e.g., RFP# P2001-17)
Member of California Fuel Cell Partnership
U.S. Department of Energy /
NREL
♦
♦
Ongoing work to develop and deploy hydrogen-fueled vehicles
Co-sponsor of hydrogen “Blueprint” plan
Sunline Transit Agency
♦
Demonstration of two different hydrogen fueling station
technologies to fuel California’s only fuel cell bus
7.3
♦
Relationships to Interstate Clean Transportation Corridor
As a general rule, the Interstate Clean Transportation Corridor (ICTC) is focused on the
deployment of heavy-duty vehicles using LNG or L/CNG. Extensive information can be
found about LNG vehicles and fueling stations at the official website of the ICTC
(www.gladstein.org). Gladstein & Associates manages the ICTC program and recently
performed a survey of LNG fleets using the ICTC. Information from those surveys is
incorporated into this report.
Whenever possible, the ICTC project promotes the construction of fueling stations that
dispense both these fuels, such as the L/CNG stations currently under development for the
cities of Tulare and Barstow. While conventional CNG stations are an integrated part of the
corridor concept, and they help increase the density of natural gas stations within the ICTC,
deployment of these stations has been spearheaded by other market forces.
Other fuels may have peripheral existing relationships with the ICTC. According to Delta
Liquid Energy, there is one automotive LPG station along the ICTC, located on Interstate 5
near Santa Clarita. Two more are planned along the ICTC (I-5 in La Mirada and I-80 in
Roseville). In addition, Delta is “researching potential sites with freeway access adjacent to
existing propane powered fleets.”
Hydrogen vehicles in the next five to ten years are most likely to be used only by transit
districts that refuel onsite each night. Therefore, deployment of a hydrogen-fueling
infrastructure along the ICTC corridors is not a high priority in the foreseeable future. This
could change over the longer term, as direct-hydrogen fuel cell vehicles become available
that are conductive to over-the-road use, and assuming the ICTC program is perpetuated.
8.
Appendix C: Summary Tables by Fuel Type
8.1
Near-Term Clean Fuel Infrastructure and Vehicles
Table 61. Summarized status of near-term clean fuel infrastructure and vehicles
Parameter / Issue
Existing and known planned
stations in California
Average throughput at public
access stations, per month
Average throughput for HDV fleet
and transit applications
Existing relative degree of
petroleum displacement in 1)
Transit Buses 2) HD Trucks, 3)
MDVs and LDVs
Current fuel price (retail)
Capital cost for average public
access station (w/o land)
Capital cost for large HDV or
transit bus station (w/o land)
Relative operation and
maintenance costs for station
Commercial availability of vehicles
for fuel (low or zero emission
certified)
Current incremental cost of clean
fuel vehicles
a
b
CNG
LNG
~240 existing
unknown planned
3,000 to 8,000
a
GGE
10,000 to 25,000
b
DGE
1) High
2) Moderate
3) Low
~8 existing
~18 planned
No data
~$1.60 per GGE
~$500,000 to
$750,000
~$1.7 million or
higher
Highest
5,000 to 50,000
DGE
1) Moderate
2) Moderate
3) N/A
~$0.55 per LNG
gal (untaxed)
~$1.24 per DGE
(taxed)
~$500,000 to
$750,000
~$1.5 million or
higher
Moderate
Wide variety of
LDVs, MDVs and
HDVs
~7 HDV engines
Up to $7,800
(LDVs/MDVs), up
to $50,000 for
HDVs
Up to $40,000 for
most HDVs
Type of Clean Fuel Technology (Vehicle and Infrastructure)
L/CNG
LPG (automotive)
EV Charging
~2 existing
~3 planned
No data
15,000 DGE
1)
2)
3)
Very Low
Very Low
Very Low
No data
~$200,000 over LNG
station’s cost
~$400,000 over LNG
station’s cost
Provides CNG at
lower O&M costs
Same as CNG
Same as CNG
~10 existing
up to 30 planned
<1000 GGE (but very
little for vehicles)
No data
1)
2)
3)
Low
Low
Moderate
1)
2)
3)
E85
~3,300 existing
unknown planned
No data
0 existing
unknown planned
None
No data
None
Very Low
None
Very Low
1)
2)
3)
None
None
None
$0.04 to $0.12 per kWhr,
(depending on time of
use and other factors)
$1.40 to $1.60 per
E85 gallon (no fuel
in California)
$35,000 to $100,000
$7,000 to $10,000
No data
~$700,000
N/A
Low
Very Low
~$400,000 for neat
ethanol
Low
Some dedicated and
bi-fuel LDVs /MDVs, 24 dedicated HDV
engines
Limited EVs available,
primarily in LDV and
LDT applications
At least 8 E85
compatible FFVs for
2001 MY
~$5,000 for LDVs and
MDVs, higher for HDVs
Up to $20,000
Manufacturing Cost,
Up to $10,000 consumer
least cost
No incremental cost
(standard equipment
on many LDV
models)
~$1.90 per GGE
Gasoline Gallon Equivalent
Diesel Gallon Equivalent
121
Table 62. Estimated potentials and recommendations for near-term clean fuel infrastructure and vehicles
Parameter / Issue
CNG
LNG
Type of Clean Fuel Technology (Vehicle and Infrastructure)
L/CNG
LPG
EV Charging
Estimated timeframe for full (self
sustained) commercialization
Anticipated relative growth of
vehicle / fuel type by 2005
0 to 5 years
O to 10 years
0 to 10 years
Low to Moderate
High (> 40%)
Estimated vehicle population
using fuel in California by 2005
~5,000
~3,000
Estimated potential to displace
petroleum fuels by 2005 in 1)
Transit Buses 2) HD Trucks, 3)
MDVs and LDVs
1)
2)
3)
1)
2)
3)
High
High
Very Low
Linked to CNG
vehicle supply and
LNG stations
(Unknown fraction of
CNG vehicle
population)
1) Low
2) Low
3) Medium
No data (linked to
CNG vehicle supply
and LNG station
growth)
No data (see above)
Medium
Low
Medium
1 to 1.5 years (for
automotive use
Low to Moderate
Unknown – depends
on bi-fuel and
dedicated products
1) Low
2) Low to Medium
3) Medium
5 to 10 years
Unknown
Low to Moderate
None to Low
(specifically, for fuel
use)
0 (1000s of FFVs,
but not using E85)
5,000 to 15,000
1)
2)
3)
Very Low
Very Low
Low to Medium
Very Low
Very Low
Very Low
2000 to 3000
Estimated minimum monthly fuel
use to justify new stations
Examples of major barriers to
expanding the infrastructure (in
addition to California’s current
energy crisis, which affects
virtually all fuels)
~15,000 GGE
Estimates vary;
survey input: ~20
to 30; LNG market
plan: 30 to 40
~15,000 DGE
-Station capital,
O&M costs
-Vehicle cost
-Fuel quality
-Lack of common
card readers
-Station capital,
O&M costs
-Vehicle cost
-Long lead time to
purchase vehicles
-Fuel tank costs
-Station cost
-Lack of lubricity
-Lack of knowledge
by end users about
options
-Lack of dedicated
OEM vehicles
-Vehicle cost
(especially HDVs)
-Permitting / code
issues
-Cost of EVs (battery
packs)
- Lack of standard for
common charger
-Fuel cost
-Lack of fuel-use
requirements for
FFVs
-Competing demand
as an oxygenate
Medium
High
Linked to LNG
Medium
Needs further study
Very Low
High fuel-use MDV
fleets (e.g., taxis);
school buses
Waste haulers,
transit buses,
Class 8 trucks
Complement of
MDVs and LDVs at
LNG sites
GTI-IWG, fuel
providers,
APCDs, Moyer
Program, MSRC
GTI-IWG, fuel
providers, APCDs,
Moyer Program,
MSRC
Perform assessments to
determine market and
extent of funding needed
(if any)
Utilities, EV producers/
auto OEMs, APCDs,
MSRC
None
GTI-IWG, fuel
providers, APCDs,
Moyer Program,
MSRC
High fuel-use MDVs w/
dedicated engines or
bi-fuel pickups (if fueluse guaranteed)
Clean Fuel USA,
Caltrans, APCDs,
Moyer Program,
MSRC, OEMs
122
No data, depends on
vehicle deployments
1)
2)
3)
Estimated # of stations needed in
California to achieve full
commercial status
Recommended relative priority for
infrastructure funding
Recommended vehicle
applications / activities for highest
priority funding allocations or
further study
Potential sources of cost sharing
for infrastructure development
Unknown – depends
on vehicle
deployments. LPG
vendor: at least 30
~10,000 GGE
E85
No data
FFVs already
commercialized; no
data or input on
station development
No data
No input received
8.2
Longer-Term Clean Fuel Infrastructure and Vehicles
Table 63. Summarized status and recommendations for longer-term clean fuel infrastructure and vehicles
Type of Clean Fuel Technology
(Vehicle and Infrastructure)
Parameter / Issue
Neat Methanol
Hydrogen
Existing fueling stations in California
Approximately 10
Anticipated timeframe for early-deployment vehicles
Anticipated timeframe for commercial vehicles
Estimated potential to displace petroleum fuels by 2010 in 1)
Transit Buses, 2) HD Trucks, 3) MDVs and LDVs
2002
2004 to 2006
1) Low
2) Very Low
3) Very Low
Too many unknowns; Methanex Corporation
estimate: up to 1,000
Equivalent or moderately higher
Estimated number of stations in California needed to
support vehicle demand, 2005-2010
Estimated fuel price compared to gasoline or diesel, 2005
timeframe (equivalent energy basis)
Recommended action under Clean Fuels Infrastructure
Development Plan
Applications for highest priority
Potential sources to carry early cost sharing for
infrastructure development
Track progress and provide ongoing updates in
subsequent Assessments before allocating
funds
Passenger cars, transit buses
DOE, SCAQMD, Fuel Cell Partnership,
Georgetown University , vehicle and engine
manufacturers, fuel cell manufacturers,
methanol producers and trade associations
123
A few demonstration stations exist for vehicle
fueling
2001 (1 to 2 buses)
2008-2010 (transit buses only, limited #s)
1) Low
2) Very Low
3) Very Low
~5 for transit applications, others unknown
Higher to much higher (2 to 4 times is often
cited)
Track progress and provide ongoing updates
in subsequent Assessments before allocating
funds
Transit buses
DOE, SCAQMD, Fuel Cell Partnership, vehicle
and engine manufacturers, fuel cell
manufacturers, hydrogen producers and trade
associations


![[NAME OF COMPANY] BUSINESS PLAN](http://cdn1.abcdocz.com/store/data/000169682_1-44c5047f5f12e6b5bb569cb3e10eef86-250x500.png)
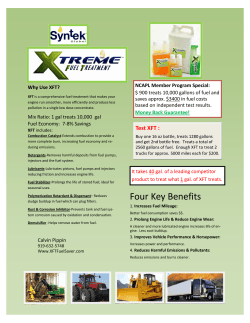
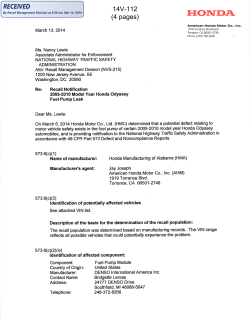


© Copyright 2026