
ELECTED OFFICIALS’ RETIREMENT PLAN
ELECTED OFFICIALS’ RETIREMENT PLAN
A PENSION TRUST FUND OF THE STATE OF ARIZONA
TWENTY-FIRST COMPREHENSIVE ANNUAL FINANCIAL REPORT
FOR THE FISCAL YEAR ENDED
JUNE 30, 2002
This report was prepared by the staff of the EORP
1020 East Missouri Avenue
Phoenix, Arizona 85014
(602) 255-5575
Fax (602) 255-5572
www.psprs.com
STATE OF ARIZONA
ELECTED OFFICIALS’ RETIREMENT PLAN
TWENTY-FIRST COMPREHENSIVE ANNUAL FINANCIAL REPORT
CONTENTS
INTRODUCTORY SECTION
Fund Managers' Report ……………………………………………………………………………………. 3
Letter of Transmittal ………………………………………………………………………………………...
4
Certificate of Achievement for Excellence in Financial Reporting …………………………………….
7
The Retirement Board and Administrative Organization ……………………………………………….
8
Organizational Chart ………………………………………………………………………………………..
9
Summary of Plan Provisions (See Note 1 in Notes to Financial Statements) …………………......... 19
FINANCIAL SECTION
Independent Auditor's Report ……………………………………………………………………………..
13
Management’s Discussion and Analysis …………………………………………………………………
14
Basic Financial Statements
Statements of Plan Net Assets……………………………………………………………………
17
Statements of Changes in Plan Net Assets....................…………………………………………
18
Notes to Financial Statements………………………………………………………………………
19
(These Notes are an Integral Part of the Financial Statements)
Required Supplementary Information
Schedule of Funding Progress ……………………………………………………………………
25
Schedule of Employer Contributions……………………………………………………………….
26
Supporting Schedule of Changes in Fund Balance Reserves ………………………………………...
27
Supporting Schedule of Administrative and Investment Expenses ………………………………...…
28
Supporting Schedule of Payments to Consultants ……………………………………………………...
28
Supplemental Schedule of Cash Receipts and Cash Disbursements ………………………..………
29
INVESTMENT SECTION
Fund Objectives …………………………………………………………………………………………….
33
Investment Performance Data …………………………………………………………………………….
34
Supporting Schedule of Commissions Paid to Brokers ……………………………………...…………
38
Summary of Changes in Investment Portfolio …………………………………………………………...
39
Detailed List of Investments Acquired ……………………………………………………………………
40
Detailed List of Sales and Redemption of Investments ………………………………………………...
46
Detailed List of Investments Owned ………………………………………………………………………
50
ACTUARIAL SECTION
Actuarial Certification Statement ………………………………………………………………………….
61
Aggregate Actuarial Balance Sheet, June 30, 2002 ……………………………………………………
62
Summary of Valuation Methods and Assumptions ……………………………………………………
63
Solvency Test ……………………………………………………………………………………………….
66
Summary of Active Member Data …………………………………………………………………………
67
Summary of Inactive Member Data ……….………………………………………………………………
68
Schedule of Retirants and Beneficiaries…………………………………………………………………
68
Schedule of Experience Gain / (Loss)……………………………………………………………………
69
STATISTICAL SECTION
Schedule of Revenues by Source and Expenses by Type……………………………………………
73
Schedule of Benefit Expenses by Type ……………………………………………………………....….
74
Summary of Retired Member and Survivor Data ………………………………………………….....…
75
Summary of Benefit Increases ……………………………………………………………………….....
76
Participating Employers …………….....................…………………………………………………....….
78
Summary of Growth of the Plan ………………………………………………………………….....…….
79
INTRODUCTORY SECTION
ELECTED OFFICIALS’ RETIREMENT PLAN
TWENTY-FIRST COMPREHENSIVE ANNUAL FINANCIAL REPORT
FOR THE FISCAL YEAR ENDED
JUNE 30, 2002
Fund Managers' Report
Letter of Transmittal
Certificate of Achievement for
Excellence in Financial Reporting
The Retirement Board and
Administrative Organization
Organizational Chart
Summary of Plan Provisions
(See Note 1 in Notes to Financial Statements)
PUBLIC SAFETY PERSONNEL RETIREMENT SYSTEM
CORRECTIONS OFFICER RETIREMENT PLAN
ELECTED OFFICIALS’ RETIREMENT PLAN
1020 East Missouri Avenue
Phoenix, Arizona 85014-2613
Jack M. Cross, C.P.A., C.F.A.
Administrator
TELEPHONE: (602) 255-5575
FAX: (602) 255-5572
James A. Nielsen, C.P.A., J.D.
Assistant Administrator
September 13, 2002
The Honorable Jane Dee Hull
Governor of the State of Arizona
State Capitol
Phoenix, Arizona 85007
Dear Governor Hull:
The Fund Manager of the Public Safety Personnel Retirement System respectfully submits the Twenty-First
Comprehensive Annual Financial Report of the Elected Officials' Retirement Plan for the fiscal year ended June
30, 2002.
We are pleased to report that despite the volatile stock market, the Plan is still in excellent financial and actuarial
condition. In fact, the Plan is 125.5% funded, one of the best funded plans in the country. Set forth below are
some of the highlights for the fiscal year ended June 30, 2002.
Benefits paid to retired Elected Officials and their beneficiaries increased from $16,802,302 to $19,529,287. The
average employer contribution rate as a percentage of gross payroll decreased from a high of 16.83% for the
1992/93 fiscal year to 7.55% for the 2002/03 fiscal year.
For the current year, the Plan had a total rate of return of –15.3%. However, the Plan continues to perform well
against the market indexes (S&P 500/NYSE stock and Shearson Lehman Government/Corporate bond) on a
long-term basis. The 5-year and 10-year total rates of return, which includes realized as well as unrealized gains
and losses, for the entire fund was 2.54% and 8.11%, respectively. The 5-year rate of return for the stock portfolio
and bond portfolios were –0.18% and 7.55%, respectively. The 10-year rate of return for the stock portfolio and
bond portfolios were 8.58% and 7.68%, respectively. The net effective yield, which takes into account only
realized gains and losses, was 2.37%.
Total administrative and investment expenses increased from $82,871 to $100,134. Costs have increased 82%
during the past seventeen years. This increase is incredibly low since the assets managed have increased 390%
and the Plan membership has increased over 90%.
We sincerely appreciate the opportunity of serving the State of Arizona, its political subdivisions, and its elected
officials and judges.
Respectfully submitted,
DON DE MENT/sig.
Don De Ment, Chairman
PAT CANTELME/sig.
RON SNODGRASS/sig.
Pat Cantelme, Member
Ron Snodgrass, Member
BETSEY BAYLESS/sig.
WENDY HANCOCK/sig.
Betsey Bayless, Member
Wendy Hancock, Member
PUBLIC SAFETY PERSONNEL RETIREMENT SYSTEM
CORRECTIONS OFFICER RETIREMENT PLAN
ELECTED OFFICIALS’ RETIREMENT PLAN
1020 East Missouri Avenue
Phoenix, Arizona 85014-2613
Jack M. Cross, C.P.A., C.F.A.
Administrator
TELEPHONE: (602) 255-5575
FAX: (602) 255-5572
www.psprs.com
James A. Nielsen, C.P.A., J.D.
Assistant Administrator
September 13, 2002
The Fund Manager
Public Safety Personnel Retirement System
State of Arizona
Phoenix, Arizona
Gentlemen:
There is presented, herewith, the Twenty-First Comprehensive Annual Financial Report of the operations and financial
conditions of the Elected Officials' Retirement Plan for the fiscal year ended June 30, 2002. Incorporated in this report are
the audited financial statements and other financial data from the June 30, 2002, report of Barrows & Schatza, P.L.C.,
Certified Public Accountants and auditors for the Plan. Also included is the Actuarial Certification Statement and the
Actuarial Balance Sheet from the June 30, 2002, Actuarial Valuation prepared by the Plan’s actuary, Rodwan & Nichols,
Consulting Actuaries.
This report has been organized into five sections: (1) the Introductory Section containing general information regarding the
operations of the Elected Officials' Retirement Plan; (2) the Financial Section containing the new Management’s Discussion
and Analysis and, the financial reports and schedules of the funds administered by the Elected Officials' Retirement Plan; (3)
the Investment Section containing detailed lists of the investment transactions and portfolios of the Plan, along with
investment performance; (4) the Actuarial Section containing actuarial information regarding the funding of the pension trusts,
and (5) the Statistical Section containing statistical data pertaining to the benefits paid by the Elected Officials' Retirement
Plan and growth of the Plan.
FINANCIAL INFORMATION
The primary responsibility for the integrity and objectivity of the financial statements and related financial data rests with the
management of the Plan. The financial statements were prepared in conformity with generally accepted accounting
principles appropriate for government-sponsored defined benefit pension plans. Management believes that all other financial
information included in this annual report is consistent with those financial statements.
It is the Plan's policy to maintain a control-conscious environment through an effective system of accounting controls. These
controls are adequate to provide reasonable assurance that assets are safeguarded against loss or unauthorized use and to
produce the records necessary for the preparation of financial information. There are limits inherent in all systems of internal
control based on the recognition that the costs of such plans should be related to the benefits to be derived. Management
believes the Plan's controls provide this appropriate balance.
The Plan uses the accrual basis of accounting for both revenues and expenses. Contributions to the Plan are based on
principles of level-cost financing with current service financed as a level percent of payroll on a current basis and prior service
amortized as a level percent of payroll over a rolling twenty (20) year period.
REVENUES
Revenues to the Plan are derived from three sources: member contributions, employer contributions, and investment
income. As shown by the Schedule of Revenues by Source included in the Statistical Section later in this report, the Plan
suffered an investment loss this fiscal year that was partly offset by member contributions and employer contributions.
Please refer to the Statistical Section for a ten-year history of revenues and expenses.
ADMINISTRATIVE AND INVESTMENT EXPENSES
The 2001/2002 Administrative and Investment Expenses of the Administrative Office increased to $100,134 compared to
$82,871 for the prior year. This is only 82% higher than the total for fiscal year 1984/1985. This is a compounded annual
Page 4
rate of increase of 3.58% over the last seventeen years. This rate of increase is consistent with the rate of inflation and the
rate of growth of the Plan. A dedicated staff and constantly improving internal expertise has allowed management to keep
costs extremely low for the past seventeen years even though inflation, membership and assets managed have increased
substantially during this same period (over 60%, over 90% and nearly 400%, respectively).
INVESTMENTS
Since the Plan is well funded, the management takes a moderately conservative approach to investing. The Plan invests
primarily in bonds rated A or better and blue chip common stock. A detailed summary of the investment portfolio and all
investment transactions is presented in the Investment Section. At year-end, the investment portfolio was made up of
14.21% U. S. Government Securities, 17.17% Corporate Bonds, 3.98% Corporate Notes, 2.89% Other Investments, 0.09%
insured Money Market Funds and 61.66% Common Stocks. All investments are held in trust by the Arizona subsidiary of
one of the largest banks in the world.
Even with this relatively conservative investment philosophy, the fixed income portfolio has outperformed the Lehman
Government/Corporate Bond Index in twelve of the last sixteen years and the equity portfolio has outperformed the applicable
Index (NYSE until 98/99, then S&P 500) nine of the last sixteen years. The Plan’s performance resulted in a net effective
yield of 2.37% and a 10-year total rate of return of 8.11%. Graphs depicting the Plan’s extraordinary performance since
1987, the year the current Administrator took over the portfolio management, can be found in the Investment Section.
ECONOMIC OUTLOOK
The economy appears to be bottoming out. It is likely the economy will continue to improve this fall and into early 2003.
With interest rates so low, it may be difficult to continue to outperform the Plan’s 9% assumed rate of investment return over
the next couple of years.
ACTUARIAL AND FUNDING INFORMATION
Funding a retirement plan on a sound actuarial reserve basis involves the accumulation of substantial reserves to guarantee
the payment of promised benefits. These reserves are invested and the rate of investment earnings, over time, is a major
factor in determining the employer contribution requirement to meet the calculated level cost of the Plan.
There is no single all-encompassing test to measure a retirement plan's funding progress and current status. A traditional
measure is the ratio of assets to unfunded accumulated normal costs, often referred to as the "percent funded." The percent
funded for the Plan at June 30, 2002, is 125.5%, which is well ahead of schedule.
The Plan is funded through a member contribution of 7% of gross payroll, an employer contribution set by an actuarial
valuation expressed as a percent of gross payroll and a distribution of the net earnings of the Plan. State and county
employers receive credit for a portion of certain fees collected by the Clerks of the Superior Courts, Courts of Appeals, and
the Supreme Court. Currently, these fees are enough to provide all of the state and county employer costs. This is
expected to continue through fiscal year 2002/2003 when the city employer rate will be 6.97%.
POST RETIREMENT BENEFIT INCREASES
State law provides for an annual benefit increase for retirees or their survivors. The increases are effective July 1 of each
year and based on benefits received on the preceding June 30. The maximum amount of the increase is 4% and
contingent upon sufficient excess investment earnings for the fund.
Below is a schedule of the increases in monthly benefits granted since this program began:
July 1, 1990 – 4.0%
July 1, 1991 – 4.0%
July 1, 1992 – 2.0%
July 1, 1993 – 3.5%
July 1, 1994 – 2.0%
July 1, 1995 – no benefit allowed by law
Page 5
July 1, 1996 – no benefit allowed by law
July 1, 1997 – 1.5%
July 1, 1998 – 1.2%
July 1, 1999 – 4.0%
July 1, 2000 – 4.0%
July 1, 2001 – 4.0%
July 1, 2002 – 4.0%
July 1, 2003 – 4.0%
This is a compounded increase of over 40%.
CERTIFICATE OF ACHIEVEMENT
The Government Finance Officers Association of the United States and Canada (GFOA) awarded a Certificate of
Achievement for Excellence in Financial Reporting to the EORP for its comprehensive annual financial report for the fiscal
year ended June 30, 2001. This was the eighth consecutive year that the Plan has achieved this prestigious award. In order
to be awarded a Certificate of Achievement, a government unit must publish an easily readable and efficiently organized
comprehensive annual financial report. This report must satisfy both generally accepted accounting principles and applicable
legal requirements.
A Certificate of Achievement is valid for a period of one year only. We believe our current comprehensive annual financial
report continues to meet the Certificate of Achievement Program’s requirements and we are submitting it to the GFOA to
determine its eligibility for another certificate.
SUMMARY
The Plan's actuary, Rodwan & Nichols, summarized the results of the latest Actuarial Valuation as of June 30, 2002, as
follows:
The results of the valuations indicate that Retirement Plan benefit obligations are being funded as incurred. Favorable
economic experience over the last decade has significantly accelerated the funding progress. Current assets are
125.5% of actuarial accrued liability. We believe the assumptions produce a reasonable estimate of costs likely to
emerge in the operation of the Retirement Plan.
The Plan has experienced great change during the past seventeen years. The Plan's accrual rate was raised to 4% of pay
for each year of credited service. Members can now take normal retirement with twenty years of credited service regardless
of age and they can take a reduced early retirement with five or more years of credited service with no age limit. The Plan
now provides for disability benefits, survivor benefits for spouses and children, post-retirement increases and health
insurance subsidies. Funding has increased to 125.5%. Over just the past seventeen years, membership has grown
dramatically and total assets of the Plan have increased more than six times. I am proud to have been a part of the Plan's
management team and I look forward to the Plan's continued success in the future.
Respectfully submitted,
Jack M. Cross, C.P.A., CFA
Administrator
Page 6
Page 7
STATE OF ARIZONA
ELECTED OFFICIAL’S RETIREMENT PLAN
THE RETIREMENT BOARD AND ADMINISTRATIVE ORGANIZATION
THE FUND MANAGER
Term Expires
Don De Ment
Retired City Clerk
City of Tucson
Chairman
January 2003
Pat Cantelme
Retired Firefighter
City of Phoenix
Member
January 2005
Ron Snodgrass
Police Officer
City of Phoenix
Member
January 2004
Betsey Bayless
Secretary of State
State of Arizona
Member
January 2003
Wendy Hancock
Public Member
Member
January 2005
PROFESSIONAL ADVISORS
Standard & Poor’s Securities, Inc.
Rodwan & Nichols
Barrows & Schatza, P.L.C.
Lieberman, Dodge, Gerding, Kothe & Anderson, Ltd.
Investment Counsel
Consulting Actuaries
Auditors
Legal Counsel
ADMINISTRATIVE STAFF
Jack M. Cross, CPA, CFA
James A. Nielsen, CPA, JD
Tracey D. Peterson, CPA, CFE
Jared A. Smout
Karen L. Lewis, CPA
Donald B. Mineer
Alliene Jonas
Annette L. Jorgensen
D. Steven Williams
Deborah S. Irwin
Eric T. Ellsworth
Joann L. Lowey
Kathleen A. Mattoon
LaDawn M. Snodgrass
Lilian L. Leung
Lori A. Boyle
Scott D. Willard
Sheryl D. Saltsman
Tiffani M. Wright
Administrator
Assistant Administrator
Operations Director
Finance Director
Controller
MIS Manager
Benefits/Insurance Specialist
Insurance Specialist
Legal Assistant
Senior Active Member Specialist
Building Maintenance
Senior Benefits Analyst
Office Specialist
Active Member Supervisor
Senior Accounting Specialist
Office Manager
MIS/Accounting Specialist
Benefits Supervisor
Active Member Specialist
1020 East Missouri Avenue | Phoenix, Arizona 85014
Telephone (602) 255-5575 | Fax (602) 255-5572
www.psprs.com
Page 8
STATE OF ARIZONA
ELECTED OFFICIALS' RETIREMENT PLAN
ORGANIZATION CHART
JUNE 30, 2002
The Fund Manager
|
Investment Counsel
Consulting Actuaries
Auditor
--\
|
----|---|
--/
|
Administrator
(CIO, Portfolio Manager)
|
|
Assistant
Legal
Legal Counsel
--------------Administrator
Assistant
|
Operations
-------- Controller
Director
__________________
__________________
________|________
__________________
__________________
__________________
__________________
____________________________________
______
______
|
|
|
|
|
|
|
Finance Director
(Cash Manager)
|
|
|
|
|
|
|
Active
Benefits
Accounting
MIS
Member
Supervisor
Manager
Manager
Superviser
______ ______|______ ______
|
______ ______|______ ______
______ ______|______ ______
|
|
|
|
|
|
|
|
|
|
Insurance
Specialist
Benefits /
Insurance
Specialist
Senior
Benefits
Analyst
Senior
Accounting
Specialist
Office
Manager
Page 9
MIS /
Accounting
Specialist
Building
Maintenance
Senior Active
Member
Specialist
Active
Member
Specialist
Office
Specialist
Page 10
FINANCIAL SECTION
ELECTED OFFICIALS’ RETIREMENT PLAN
TWENTY-FIRST COMPREHENSIVE ANNUAL FINANCIAL REPORT
FOR THE FISCAL YEAR ENDED
JUNE 30, 2002
Independent Auditor's Report
Management’s Discussion and Analysis
Statements of Plan Net Assets
Statements of Changes in Plan Net Assets
Notes to Financial Statements
Schedule of Funding Progress
Schedule of Employer Contributions
Supporting Schedule of Changes
In Fund Balance Reserves
Supporting Schedule of
Administrative and Investment Expenses
Supporting Schedule of Payments to Consultants
Supplemental Schedule of
Cash Receipts and Cash Disbursements
Phoenix, Arizona
INDEPENDENT AUDITOR'S REPORT
FUND MANAGER
STATE OF ARIZONA PUBLIC SAFETY
PERSONNEL RETIREMENT SYSTEM
PHOENIX, ARIZONA
We have audited the accompanying statements of plan net assets of the STATE OF ARIZONA
ELECTED OFFICIALS’ RETIREMENT PLAN as of June 30, 2002 and 2001, and the related
statements of changes in plan net assets for the years then ended, appearing on pages 17 and 18,
respectively. These financial statements are the responsibility of the Plan’s management. Our
responsibility is to express an opinion on these financial statements based on our audits.
We conducted our audits in accordance with generally accepted auditing standards. Those standards
require that we plan and perform the audit to obtain reasonable assurance about whether the financial
statements are free of material misstatement. An audit includes examining, on a test basis, evidence
supporting the amounts and disclosures in the financial statements. An audit also includes assessing the
accounting principles used and significant estimates made by management, as well as evaluating the
overall financial statement presentation. We believe that our audits provide a reasonable basis for our
opinion.
In our opinion, the financial statements referred to above present fairly, in all material respects, the
financial status of STATE OF ARIZONA ELECTED OFFICIALS’ RETIREMENT PLAN as of June
30, 2002 and 2001, and the results of its operations and the changes in plan net assets for the years then
ended in conformity with generally accepted accounting principles.
As discussed in Note 2 to the financial statements, the STATE OF ARIZONA ELECTED OFFICIALS’
RETIREMENT PLAN adopted the provisions of the Governmental Accounting Standards Board
Statements No. 34, Basis Financial Statements and Management’s Discussion and Analysis for State and
Local Governments, No. 37, Basic Financial Statements and Management’s Discussion and Analysis for
State and Local Governments-Omnibus, and No. 38, Certain Financial Statement Note Disclosures for
fiscal year ended June 30, 2002.
Our audit was made for the purpose of forming an opinion on the financial statements taken as a whole.
The accompanying supplementary information, Management’s Discussion and Analysis, Schedule of
Funding Progress and Schedule of Employer Contributions, are required by the Governmental Accounting
Standards Board and are not a required part of the basic financial statements. Also, the accompanying
additional information, contained on pages 27 to 29, are not required disclosures under Governmental
Accounting Standards Board (GASB) statement No. 25 and are not a required part of the basic financial
statements. We have applied certain limited procedures, which consisted principally of inquiries of
management regarding the methods of measurement and presentation of the supplementary and additional
information. However, we did not audit this information and express no opinion on it.
BARROWS & SCHATZA, P.L.C./sig
September 6, 2002
STATE OF ARIZONA
ELECTED OFFICIALS’ RETIREMENT PLAN
MANAGEMENT’S DISCUSSION AND ANALYSIS
JUNE 30, 2002 AND 2001
The Elected Officials’ Retirement Plan’s discussion and analysis is designed to assist the reader in focusing on
significant financial issues, provide an overview of the Plan’s financial activity, identify changes in the Plan’s financial
position and identify any issues or concerns.
Since the Management’s Discussion and Analysis (MD&A) is designed to focus on the current year’s activities,
resulting changes and currently known facts, it is intended to be read in conjunction with the Transmittal Letter,
Financial Statements and Notes to the Financial Statements.
Financial Highlights
Key financial highlights for 2002 are as follows:
•
As of the close of the fiscal year 2002, the Future Benefit Increase Reserve was $23,400,088. This will enable
another 4% increase for qualifying retirees or their survivors for the seventh consecutive year.
•
Retirement benefits paid totaled $19,529,287 for the current fiscal year, compared to $16,802,302 for the
previous year. This represents a 17% increase from the prior year. The majority of this increase is the result of
increased health insurance benefits and cost of living adjustments (COLAs) paid to the retirees or their survivors
of the Plan.
Using this Comprehensive Annual Financial Report (CAFR)
This annual report consists of a series of financial statements and notes to those financial statements. These
statements are organized so the reader can understand the Plan as an operating entity. The statements and notes
then proceed to provide an increasingly detailed look at specific financial activities.
The Statement of Net Assets and The Statement of Changes in Net Assets
These statements include all assets and liabilities of the Plan using the accrual basis of accounting, which is similar
to the accounting used by most private-sector companies.
These two statements report the Plan’s net assets and changes in them. Net assets are the difference between
assets and liabilities, one way to measure the financial health, or financial position. Over time, increases or
decreases in the net assets are one indicator of the financial health of the Plan.
Notes to the Financial Statements
The notes provide additional information that is essential to a full understanding of the data provided in the financial
statements. The notes can be found immediately following The Statement of Net Assets and The Statement of
Changes in Net Assets.
Required Supplemental Information
The basic financial statements are followed by a section of required supplemental information. This section includes
the Schedule of Funding Progress and the Schedule of Employer Contributions.
The Schedule of Funding Progress shows the ratio of assets as a percentage of the actuarial accrued liability
(funding ratio) and the ratio of unfunded actuarial accrued liabilities to member payroll. The trend in these two ratios
provides information about the financial strength of the Plan. Improvement is indicated when the funding ratio is
increasing and the ratio of the unfunded actuarial liability to payroll is decreasing.
The Schedule of Employer Contributions shows the Annual Required Contributions by fiscal year. The purpose of
this schedule is to provide information about the required contributions of the employers and the extent to which
those contributions are being made. The information should assist users in understanding the changes and possible
reasons for the changes in the Plan’s funding status over time.
Other Supplemental Information
The Other Supplemental Information Section includes the Supporting Schedule of Changes in Fund Balance
Reserves, Supporting Schedule of Payments to Consultants, and a Supplemental Schedule of Cash Receipts and
Page 14
Cash Disbursements. The total columns and information provided on these schedules carry forward to the
applicable financial statement.
Financial Analysis
Net Assets
The Plan’s Net Assets totaled $265,566,712 at the close of the fiscal year 2002, compared to $326,159,456 at the
close of the previous fiscal year. This is a 19% decrease from the prior year. The majority of the decrease is the
direct result of the recent declines in the stock market.
ELECTED OFFICIALS’ RETIREMENT PLAN
NET ASSETS
2002
Book Cost*
Current Assets
Investments
Total Assets
$
Other Liabilities
Total Liabilities
Total Net Assets
1,813,939
369,674,905
371,488,844
$
83,111,845
83,111,845
$
288,376,999
2001
Market Value
1,813,939
347,522,134
349,336,073
Book Cost*
$
83,769,361
83,769,361
$
265,566,712
Market Value
2,211,211
387,246,630
389,457,841
$
95,979,484
95,979,484
$
293,478,357
2,211,211
419,940,645
422,151,856
95,992,400
95,992,400
$
326,159,456
*Cost information is provided for reference only.
The largest portion of the Plan’s Net Assets (62%) are invested in Equity Securities; 17% is invested in high quality
Corporate Bonds; 14% is invested in Government Securities; 4% is invested in Cash or cash equivalents; and, the
remaining 3% is invested in Other investments.
Changes in Net Assets
The recent volatility in the stock market has attributed to the majority of the decrease in net assets, as noted earlier.
Additional key elements of this decrease are as follows:
ELECTED OFFICIALS’ RETIREMENT PLAN
CHANGES IN NET ASSETS
2002
Additions:
Contributions
Net Investment (Loss) Income
Total Additions
$
Deductions:
Pension Benefits
Terminated Members Refunds
Administrative Expenses
Transfers
Total Deductions
7,252,336
(48,685,393)
(41,433,057)
2001
$
7,700,164
(67,059,808)
(59,359,644)
19,529,287
(6,518)
70,983
(434,065)
19,159,687
16,802,302
133,561
58,796
(269,738)
16,724,921
Change in Net Assets
(60,592,744)
(76,084,565)
Net Assets, Beginning of Year
326,159,456
Net Assets, End of Year
$
265,566,712
Page 15
402,244,021
$
326,159,456
Pension benefits and administrative expenses increased from the previous fiscal year. Pension benefits, to include
health insurance subsidies and cost of living adjustments, rose 17% and administrative expenses rose 21% during
the year.
Trend in Expenses – by Type
(Pension Benefits, Refunds and Administrative Expenses) (in 000’s)
$20,000
Pension
Refunds
$15,000
Administrative
$10,000
$5,000
$0
($5,000)
1998
1999
2000
2001
2002
Member contribution rates are set by Statute and were unchanged from the previous fiscal year. Employer
contributions were reduced by $474,858 as a result of the state and counties employer contribution rates going from
0.73% in the previous fiscal year to 0.00%.
Trend in Revenues – by Type
(Member and Employer Contributions, Investment Income (Loss) (in 000’s)
$60,000.00
$40,000.00
Member Contributions
Employer Contributions
$20,000.00
Investment Income (Loss)
$0.00
($20,000.00)
($40,000.00)
($60,000.00)
($80,000.00)
1998
1999
2000
2001
2002
Economic Factors and Employer Rate s
Revenues to the Plan are derived from three sources: member contributions, employer contributions and investment
income. Member contribution rates are set by Statute and will remain unchanged at 7.00%. Employer contribution
rates are determined annually by an actuarial valuation. The valuation encompasses the rate of investment earnings
and the accumulation of substantial reserves to guarantee payment of promised benefits.
Investment gains and losses are smoothed over a four-year period to stabilize the employer contribution rates from
year to year. The investment loss suffered last year was the first substantial loss the Plan had suffered in 14 years.
The investment loss from the current fiscal year, in conjunction with the investment loss from the previous year, will
have a negative impact on the current actuarial valuations. It is anticipated that employer contribution rates will
increase to sustain the funding level.
Requests for Information
This report is designed to provide a general overview of the Elected Officials’ Retirement Plan’s finances. Questions
concerning any of the information provided in this report or requests for additional financial information should be
addressed to: Elected Officials’ Retirement Plan, Operations Director, 1020 E. Missouri, Phoenix, AZ 85014.
Page 16
STATE OF ARIZONA
ELECTED OFFICIALS' RETIREMENT PLAN
STATEMENTS OF PLAN NET ASSETS
AS OF JUNE 30, 2002 AND 2001
2002
2001
ASSETS
Receivables
Members' Contributions
Employers' Contributions
Court Fees
Interest and Dividends
Total Receivables
$
84,518
4,167
288,613
1,436,641
1,813,939
$
[Book Cost -
122,223
19,087
288,265
1,781,636
2,211,211
[Book Cost -
Investments at Fair value (Note 2): For Reference Only]
U.S. Government Securities
$
34,169,572
Corporate Bonds
46,297,202
Corporate Notes
10,494,805
Corporate Stocks
187,762,407
Other Investments
7,612,230
Money Market Account
226,844
Collateral Held in Trust
for Securities on Loan
83,111,845
Total Investments
$ 369,674,905
83,769,361
347,522,134
Total Plan Assets
349,336,073
422,151,856
Liability- Collateral Subject to
Return to Borrower
(83,769,361)
(95,992,400)
Net Assets Held in Trust
for Pension Benefits
265,566,712
326,159,456
For Reference Only]
37,487,412
45,293,655
10,494,805
162,637,827
7,612,230
226,844
$
$
46,007,836
43,552,118
2,998,918
190,250,496
8,113,706
344,072
48,917,129
42,384,670
2,998,918
221,189,750
8,113,706
344,072
95,979,484
387,246,630
95,992,400
419,940,645
Net Asset Reserves
Refundable Members' Reserve
Employers' Reserve
Future Benefit Increase Reserve
Total Net Asset Reserves
$
$
25,853,543
216,313,081
23,400,088
265,566,712
$
$
A schedule of funding progress is presented immediately following the notes to the financial statements.
The accompanying notes are an integral part of these financial statements.
Page 17
24,060,967
267,662,327
34,436,162
326,159,456
STATE OF ARIZONA
ELECTED OFFICIALS' RETIREMENT PLAN
STATEMENTS OF CHANGES IN PLAN NET ASSETS
FOR THE YEARS ENDED JUNE 30, 2002 AND 2001
2002
2001
Additions
Contributions
Member Contributions (Notes 1 and 3)
Employer Contributions (Notes 1 and 3)
Court Fees
Total Contributions
Net (Depreciation) Appreciation
in Fair Value of Investments (Note 2)
Interest
Dividends
Securities Lending Activities
Securities Lending Income
Borrower rebates
Agents Share of Income
Net Securities Lending Income (Note 2)
$
3,595,732
171,945
3,484,659
7,252,336
$
(57,507,423)
7,540,509
1,143,973
$ 2,447,776
(2,191,327)
(89,750)
(75,726,825)
7,337,278
1,238,447
$ 5,433,400
(5,255,919)
(62,114)
166,699
115,367
(48,656,242)
(29,151)
(48,685,393)
Less Investment Expense
Net Investment Income
Amounts Transferred from Other StateSponsored Pension Plans--Net
(67,035,733)
(24,075)
(67,059,808)
434,065
Total Additions
3,544,290
646,803
3,509,071
7,700,164
269,738
(40,998,992)
(59,089,906)
19,529,287
(6,518)
70,983
19,593,752
16,802,302
133,561
58,796
16,994,659
(60,592,744)
(76,084,565)
326,159,456
402,244,021
Deductions
Pension and Insurance Benefits (Note 1)
Refunds to Terminated Members (Note 1)
Administrative Expenses
Total Deductions
Net (Decrease) Increase
Net Assets Held In Trust
for Pension Benefits
Beginning of Year - July 1
Ending of Year - June 30
$ 265,566,712
The accompanying notes are an integral part of these financial statements.
Page 18
$
326,159,456
STATE OF ARIZONA
ELECTED OFFICIALS' RETIREMENT PLAN
NOTES TO FINANCIAL STATEMENTS
JUNE 30, 2002 AND 2001
NOTE 1 - PLAN DESCRIPTION
Organization
The Elected Officials' Retirement Plan (EORP), a pension trust fund of the State of Arizona, is a cost-sharing multipleemployer public employee retirement plan established by Title 38, Chapter 5, Article 3 of the Arizona Revised Statutes, to
provide benefits for elected officials and judges of certain state, county and local governments. The Plan is administered by
the Fund Manager of the Public Safety Personnel Retirement System (PSPRS).
The Fund Manager is a five-member board. Effective August 6, 1999, it became the Governor’s responsibility to appoint all
members of the Fund Manager, who serve a fixed three-year term. The Fund Manager is responsible for the investment of
the Plan's assets, setting employer contribution rates in accordance with an actuarial study, adopting a budget, hiring
personnel to administer the Plan, setting up records, setting up accounts for each member, paying benefits and the general
protection and administration of the Plan.
The addition or deletion of eligible groups does not require the approval of the other participating employers. New eligible
groups are approved for participation by the Fund Manager. The EORP is not reported as a component unit of any other
organization.
The Fund Manager of the EORP is also responsible for the investment and general administration of two other statewide
retirement plans—the Public Safety Personnel Retirement System and the Corrections Officer Retirement Plan. The
investments and expenses of these plans are held and accounted for separately from those of the EORP. Since none of the
plans have the authority to impose their will on any of the other plans, each plan is reported as its own stand-alone
government.
At June 30, 2002 and 2001, the number of participating local government employer groups was:
Cities
Counties
State Agencies
Total Employers
2002
16
15
1
32
2001
16
15
1
32
All state and county elected officials and judges are members of the Plan. Any city in the State of Arizona may elect to
have its’ elected officials covered by the EORP. At June 30, 2002 and 2001, statewide EORP membership consisted of:
Retirees and beneficiaries currently
receiving benefits
Terminated vested employees
Current employees
Vested
Non-vested
Total Members
2002
2001
659
165
647
165
444
294
1,562
409
328
1,549
EORP provides retirement benefits as well as death and disability benefits. Generally, all benefits vest after five years of
credited service. A Summary of Benefits and Plan provisions follows:
SUMMARY OF BENEFITS
Purpose (A.R.S. §38-810.02.B)
To provide a uniform, consistent and equitable statewide program for those eligible elected officials as defined by the Plan.
Eligibility (A.R.S. §38-801 and §38-804.A)
All elected officials are members of the Plan, except that an elected official who is subject to term limits may elect not to
participate in the Plan for that specific term of office. An elected official means every elected official of this state, every
elected official of each county of this state, every justice of the supreme court, every judge of the court of appeals, every
Page 19
judge of the superior court, every full-time superior court commissioner, the administrator of the fund manager if the
administrator is a natural person and each elected official of an incorporated city or town whose employer has executed a
proper joinder agreement for coverage of its elected officials.
Contributions (A.R.S. §38-810.A)
Each member shall contribute 7.00% of salary to the Plan on a pre-tax basis. Each employer shall contribute the following:
For state and county employers, a designated portion of certain fees collected by the Clerks of the Superior Courts,
Courts of Appeals and the Supreme Court plus additional contributions as determined by actuarial valuation to ensure
proper funding for the Plan, but not less than 2% of salary. (A.R.S. §38-810)
For incorporated city or town employers, a level percent of salary as determined by actuarial valuation to ensure proper
funding for the Plan but not less than 2% of salary. (A.R.S. §38-810)
Credited Service (A.R.S. §38-801, ¶ 3)
Means the number of whole and fractional years of a member's service as an elected official after the elected official's
effective date of participation for which member and employer contributions are on deposit with the fund, plus credited service
as an elected official transferred to the Plan from another retirement system or plan for public employees of this state, plus
service as an elected official before the elected official's effective date of participation which is being funded pursuant to a
joinder agreement or which was redeemed pursuant to §38-816.
Average Yearly Salary (A.R.S. §38-801, ¶ 2)
Means the highest average total salary over a period of three consecutive years within the last ten completed years of
credited service which was paid to the elected official at the time of death or retirement or at the time the elected official
ceases to hold office.
Normal Retirement (No Reduction for Age) (A.R.S. Sections 38-805.A and 38-808.B, ¶ 1)
An elected official may retire upon meeting one of the following age and service requirements:
1.
2.
3.
Age sixty-five years, with five or more years of credited service.
Age sixty-two years, with ten or more years of credited service.
Twenty or more years of credited service regardless of age.
The amount of a normal retirement pension is four percent (4%) of the member's average yearly salary multiplied by the
years of the member's credited service. Maximum is eighty percent (80%) of the member's average yearly salary.
Early Retirement (Reduction for Age) (A.R.S. §38-805.B and §38-808.B, ¶ 1)
An elected official who has five or more years of credited service may retire before meeting the age or service requirement for
normal retirement. The amount of an early retirement pension is computed by determining the amount of accrued normal
retirement pension and then reducing the amount determined by three-twelfths of one percent for each month early
retirement precedes the member's normal retirement age as noted above. The maximum reduction is 30%.
Vested Termination (Deferred Retirement)
An elected official with five or more years of credited service retains entitlement to deferred pension, upon ceasing to be an
elected official, if the elected official's accumulated contributions are left on deposit in the retirement plan. The amount of
pension is determined in the same manner as a normal or early pension, whichever is applicable.
Disability Retirement (A.R.S. §38-806 and §38-808.B, ¶ 2)
The Fund Manager may retire an elected official who becomes incapacitated for the purpose of performing the duties of the
member’s office based on a certification by a board of physicians that the member is mentally or physically incapacitated
and qualifies for a disability retirement. The amount of pension is eighty percent (80%) of member's average yearly salary if
the elected official has ten (10) or more years of credited service or forty percent (40%) of the member's average yearly
salary if the elected official has five (5) but less than ten (10) years of credited service or twenty percent (20%) of the
member's average yearly salary if the elected official has fewer than five (5) years of credited service.
Survivor Pension (A.R.S. §38-807)
Payable to the eligible beneficiary of a retired member or an active or inactive member who dies before retirement. An
eligible beneficiary is a surviving spouse who was married to the retired or active or inactive member for at least two years;
or, if there is no eligible spouse, then to a minor child. A surviving spouse's pension terminates upon death. A surviving
child's pension terminates upon marriage, adoption or death or upon attainment of age 18 years, unless the child is a fulltime student under the age of 23 or the child is under a disability which began before the child attained the age of 23. The
Page 20
amount of a surviving spouse's pension is three-fourths of the pension being paid the deceased retired elected official or
three-fourths of the pension which the member would have received assuming he had retired under a disability. The amount
of a surviving child's pension is an equal share of the amount of a surviving spouse's pension.
Death Benefit (A.R.S. §38-807.E)
If a member dies and no pension is payable on account of the member’s death, the deceased member’s accumulated
contributions shall be paid to the beneficiary named by the member.
Termination Refund (A.R.S. §38-804.B)
Upon termination of employment for any reason other than death or retirement, a member shall, within twenty days after
filing an application with the Fund Manager, receive a lump-sum payment, equal to the accumulated contributions, as of the
date of termination, less any benefits paid or any amounts owed to the Plan. A member forfeits all membership rights and
credited service in the Plan upon receipt of refund of contributions. If the member has 5 or more years of credited service
upon termination they shall receive an additional amount according to the schedule below:
5 to 5.9—25% of member contributions deducted from the member’s salary pursuant to ARS 38-810.A
6 to 6.9—40% of member contributions deducted from the member’s salary pursuant to ARS 38-810.A
7 to 7.9—55% of member contributions deducted from the member’s salary pursuant to ARS 38-810.A
8 to 8.9—70% of member contributions deducted from the member’s salary pursuant to ARS 38-810.A
9 to 9.9—85% of member contributions deducted from the member’s salary pursuant to ARS 38-810.A
10 or more—100% of member contributions deducted from the member’s salary pursuant to ARS 38-810.A plus interest
at 3% if left on deposit after 30 days.
Reemployment And Repayment Of Contributions (A.R.S. §38-804.F)
An elected official who terminates membership in the Plan and takes a refund of his contributions and is later re-employed
as an elected official may restore prior service credits, if the elected official signs a written election within ninety days after
re-employment to reimburse the Plan within one year after the date of re-employment. The reimbursement will equal the
amount previously withdrawn plus interest from the date of withdrawal to the date of repayment at the rate of 9%
compounded annually.
Reemployment After Retirement (A.R.S. §38-804.G and §38-804.H)
If a retired member subsequently becomes an elected official, contributions shall not be made to the Plan nor additional
years of credited service accrued. Additionally, if a retired member, by reason of election or reelection, becomes an elected
official of the same office from which the member retired within a time period that is less than one full term for that office, the
member shall not receive a pension until the member ceases to hold the same office.
Redemption Of Prior Service (A.R.S.§38-816)
Active members who had previous service in this state as an elected official with an employer now covered by the Plan
before the effective date of participation and who received a refund of accumulated contributions from the applicable
retirement system upon termination or who was not covered by a retirement system or plan during the elected official’s prior
elected official service may elect to redeem any part of the prior service by paying into the Plan the amounts required in
A.R.S. §38-816.B.
Purchase Of Prior Active Military Service (A.R.S. §38-820)
A member may purchase up to four years of prior active military time that is not on account with any other retirement
system. The member must pay the actuarial present value of the increase of credited service resulting from this purchase.
Transfer Between State Retirement Systems (A.R.S. §38-921 and §38-922)
Members of any of the four Arizona state retirement systems or plans who have credited service under another Arizona state
retirement system or plan may transfer or redeem the credited service to their current Arizona state retirement system or
plan by paying or transferring the full actuarial present value of the credited service into their current Arizona retirement
system or plan with approval of the Fund Manager or retirement boards involved. A reduced credited service amount may be
transferred based on the transfer of the actuarial present value of the credited service under the prior Arizona state system or
plan.
Cola Benefit Increases (A.R.S. §38-818)
Effective July 1 of each year, each retired member or survivor of a retired member may be entitled to a permanent benefit
increase in their base benefit. The maximum amount of the increase is four percent (4%) of the EORP benefit being received
on the preceding June 30 and is contingent upon sufficient excess investment earnings for the fund. To be eligible for the
increase the member or survivor must be age 55 or older on July 1 of the current year and was receiving benefits on or before
Page 21
July 31 of the previous year. A member or survivor is also eligible if they were receiving benefits on or before July 31 of the
two previous years regardless of age.
Health Insurance Premium Subsidy (A.R.S. §38-817)
For EORP retirees who have elected group health and accident insurance coverage provided and administered by the state
or another EORP employer and who had 8 or more years of credited service, the EORP will pay up to the following amounts:
Single
Not Medicare Eligible
$150.00
Family
Medicare Eligible
$100.00
All Not Medicare
Eligible
$260.00
All Medicare Eligible
$170.00
One with Medicare
$215.00
Those retired members who had between 5 and 8 years of credited service would receive a proportionate share of the full
subsidy.
Until June 30, 2003, a retiree or survivor who lives in a nonservice area receives up to the following amounts in addition to the
subsidy listed above. A nonservice area is defined as an area in this state where the state retiree group insurance program
or employer’s retiree health insurance program does not provide or administer a health maintenance organization (HMO) for
which the member or survivor is eligible. The subsidy consists of up to the following amounts:
Single
Not Medicare Eligible
$300.00
Family
Medicare Eligible
$170.00
All Not Medicare
Eligible
$600.00
All Medicare Eligible
$350.00
One with Medicare
$470.00
State Taxation Of EORP Benefits (A.R.S. §38-811 and §43-1022)
Effective tax year commencing January 1, 1989, all EORP retirement benefits in excess of $2500 annually will be subject to
Arizona state tax.
NOTE 2 – SUMMARY OF SIGNIFICANT ACCOUNTING POLICIES AND PLAN ASSET MATTERS
Basis of Accounting
EORP financial statements are prepared using the accrual basis of accounting. Member and employer contributions are
recognized as revenues in the period in which employee services are performed. Benefits due are paid in arrears on the last
working day of each month. Refunds are due and payable by state law within 20 days of receipt of a written application for a
refund. Refunds are recorded when paid. Furniture and equipment purchases, which are not material in amount, are
expensed in the year of purchase. Investment income net of administrative and investment expenses is allocated to each
employer group based on the average relative fund size for each employer group for that year.
The Plan implemented Statement No. 25 of the Governmental Accounting Standards Board for Fiscal Year End 1997. As
such, the Plan reports assets on a Fair Value Basis. Certain cost information is provided for reference only and to comply
with state law.
The Plan implemented GASB Statement No. 34 for the Fiscal Year End 2002. The purpose of Statement No. 34 is to
enhance the understandability and usefulness of state and local government financial reports. To accomplish this,
Statement No. 34 requires supplemental information titled Management’s Discussion and Analysis (MDA) that precedes the
basic financial statements. The MDA will provide an analytical overview of the government’s financial activities.
Other GASB Statements were required to be implemented in conjunction with GASB Statement No. 34. Therefore, the Plan
has also implemented the following GASB Statements in the current fiscal year: Statement No. 37 – Basic Financial
Statements – and MDA for State and Local Governments-Omnibus; and, Statement No. 38 – Certain Financial Statement
Note Disclosures.
By state statute, this Plan is required to provide information in the financial statements used to calculate Net Effective Yield.
Net Effective Yield includes only realized gains and losses. The Net Realized Gain (Loss) used in this calculation totaled
$(2,016,036) for FYE 2002 and $8,601,335 for FYE 2001.
Investments
EORP investments are reported at Fair Value. Fair Values are determined as follows: Short-term investments are reported
Page 22
at Fair Value, which approximates Cost. Equity securities are valued at the last reported sales price. Fixed-income
securities are valued using the last reported sales price or the estimated fair market value as determined by one of the
world's largest and most prominent fixed-income broker/dealers. Investments that do not have an established market are
reported at estimated fair value. Investment income is recognized as earned.
Statutes enacted by the Arizona Legislature authorize the Fund Manager to make investments in accordance with the
"Prudent Man" rule. The Fund Manager is not limited to so-called "Legal Investments for Trustees." (A.R.S. §38-848.D) In
making every investment, the Fund Manager shall exercise the judgment and care under the circumstances then prevailing
which men of ordinary prudence, discretion and intelligence exercise in the management of their own affairs, not in regard to
speculation but in regard to the permanent disposition of their funds, considering the probable income from their funds as
well as the probable safety of their capital, provided:
1) That not more than seventy per cent of the pension fund shall be invested at any given time in corporate stocks, based
on cost value of such stocks irrespective of capital appreciation.
2) That not more than five per cent of the pension fund shall be invested in securities issued by any one institution, agency
or corporation, other than securities issued as direct obligations of and fully guaranteed by the United States
Government.
3) That not more than five per cent of the voting stock of any one corporation shall be owned.
4) That corporate stocks eligible for purchase shall be restricted to stocks that, except for bank stocks and insurance
stocks, are either:
a) Listed or approved on issuance for listing on an exchange registered under the Securities Exchange Act of 1934, as
amended (15 United States Code §78a through §7811);
b) Designated or approved on notice of issuance for designation on the national market system of a national securities
association registered under the Securities Exchange Act of 1934, as amended (15 United States Code §78a
through §7811);
c) Listed or approved on issuance for listing on an exchange registered under the laws of this [Arizona] state or any
other state; or
d) Listed or approved on issuance for listing on an exchange of a foreign country with which the United States is
maintaining diplomatic relations at the time of purchase, except that no more than ten per cent of the pension fund
shall be invested in foreign equity securities on these exchanges, based on the cost value of the stocks irrespective
of capital appreciation.
A.R.S. §38-848.D
The Plan's investment portfolio is in compliance with state law.
Statement No. 3 of the GASB requires government entities to categorize investments for the purpose of giving an indication
of the level of risk assumed by the entity at year-end. Category 1 includes investments that are insured or registered or for
which the Plan or its agent in the name of the Plan holds securities. Category 2 includes uninsured and unregistered
investments for which the securities are held by the counterparty, or by its trust department or agent but not in the Plan's
name.
All investments of the Plan (other than those held by broker/dealers under the security loan program and those investments
categorized as "Other Investments”) meet the criteria of Category 1. "Other Investments", which primarily consists of loans
and real estate investments, are not considered securities for purposes of credit risk classification. Substantially all
investments are held in the name of the Plan by its custodian bank.
Money Market Account
The money market account is on deposit with an Arizona bank. These deposits are insured by federal depository insurance.
The money market account is subject to the general depository laws of the State of Arizona that require deposits to be
either insured by the Federal Deposit Insurance Corporation or collateralized by certain securities including U.S. Government
obligations and first mortgages.
Securities Lending Income
The Plan is party to a securities lending agreement with a bank. The bank, on behalf of the Plan, enters into agreements
with brokers to loan securities and have the same securities returned at a later date. The loans are fully collateralized
primarily by cash. Collateral is marked-to-market on a daily basis. Non-cash collateral can be sold only upon borrower
default. The Plan requires collateral of at least 102% of the fair value of the loaned U.S. Government or corporate security.
Securities on loan are carried at fair value. As of June 30, 2002 and 2001 the fair value of securities on loan was
$81,493,029 (consisting of Stocks-$38,003,099, Corporate Bonds-$8,563,980 and Treasuries and Agencies-$34,925,950)
and $91,481,670 (consisting of Stocks-$47,705,918, Corporate Bonds-$9,303,338 and Treasuries and AgenciesPage 23
$34,472,414), respectively. The Plan receives a negotiated fee for its loan activities and is indemnified for broker default by
the securities lending agent. The Plan participates in a collateral investment pool. Either the pool participants or the
borrower can terminate all securities loans on demand. All term loans have a matched collateral investment. The total cash
collateral investments received for unmatched loans (any loan for which the cash collateral has not been invested for a
specific maturity) will have a maximum average maturity, using the reset date as the maturity date, of not more than 45
days. And, at least 20% of total collateral investments must be invested on an overnight basis and at least 30% of total
collateral investments must be invested with maturity of 7 days or less. Additionally, no more than 20% of the total
collateral investments will be invested in instruments maturing in over 91 days. In lending securities, investments of cash
collateral for open loans as of June 30, 2002 are not matched in maturity and have a weighted average maturity of 17 days, 9
days as of June 30, 2001. The Plan has no credit risk exposure to borrowers, because the amounts the Plan owes to the
borrowers exceed the amounts the borrowers owe the Plan. Under this program, the Plan has not experienced any defaults
or losses on these loans.
NOTE 3 - CONTRIBUTIONS REQUIRED AND CONTRIBUTIONS MADE
The Retirement Plan's funding policy provides for periodic employer contributions at actuarially determined rates that,
expressed as percentages of annual covered payroll, are designed to accumulate sufficient assets to pay benefits when due.
The normal cost and actuarial accrued liability are determined using an entry age actuarial funding method. Unfunded
actuarial accrued liabilities and assets in excess of actuarial accrued liabilities are being amortized as a level percent of
payroll over a rolling twenty (20) year period. Beginning with fiscal year 2001-2002, the employer contribution rate shall not
be less than two per cent of salary.
During the year ended June 30, 2002, contributions totaling $7,252,336 ($3,656,604 employer and $3,595,732 member) were
made in accordance with contribution requirements determined by an actuarial valuation of the Plan as of June 30, 2000. The
employer contributions consisted of approximately $8,573,252 for normal cost less ($4,916,648) for amortization of the
assets in excess of the actuarial accrued liability in aggregate. Employer contributions represented 6.97% of covered
payroll. [16.69% for normal costs and (9.72)% for amortization of assets in excess of the actuarial accrued liability in
aggregate.] Member contributions represented 7.00% of covered payroll and are attributable to normal costs.
During the year ended June 30, 2001, contributions totaling $7,700,164 ($4,155,874 employer and $3,544,290 member) were
made in accordance with contribution requirements determined by an actuarial valuation of the Plan as of June 30, 1999. The
employer contributions consisted of approximately $7,611,766 for normal cost less ($3,455,892) for amortization of the
assets in excess of the actuarial accrued liability in aggregate. Employer contributions represented 8.94% of covered
payroll. [16.49% for normal costs and (7.55)% for amortization of assets in excess of the actuarial accrued liability in
aggregate.] Member contributions represented 7.00% of covered payroll and are attributable to normal costs.
NOTE 4 – REQUIRED SCHEDULES
The Schedule of Funding Progress and the Schedule of Employer Contributions are presented immediately following the
notes to the financial statements.
Page 24
STATE OF ARIZONA
ELECTED OFFICIALS' RETIREMENT PLAN
REQUIRED SUPPLEMENTARY INFORMATION
SCHEDULE OF FUNDING PROGRESS
While not any one or two numeric indices can fully describe the financial condition of a retirement plan, the
ratio of unfunded actuarial accrued liabilities to active member payroll is significant. The ratio of unfunded
actuarial accrued liabilities to member payroll is a relative index of condition where inflation is present in both
items. Observation of the ratio over a period of years gives an indication of funding achievement. The
smaller the index, the stronger the plan's condition. Shown below is a Comparative Schedule ($ in
thousands) since legislation was enacted in 1987, setting up a 40-year amortization schedule. Effective
June 30,1997, Unfunded (Excess) Actuarial Accrued Liabilities are being amortized on a level percent
method over a rolling twenty (20) year period.
Actuarial
Value of
Assets
(a)2
Actuarial
Valuation
Date
6-30-82
6-30-83
6-30-84
6-30-85
6-30-86
6-30-87
6-30-88
6-30-89
6-30-90
6-30-91
6-30-92
6-30-93
6-30-94
6-30-95
6-30-96
6-30-97
6-30-98
6-30-99
6-30-00
6-30-01
6-30-02
*3
1
1
*1
*1
*1
*1
*
1
1
*
*
$
$
$
$
$
$
$
$
$
$
$
$
$
$
$
$
$
$
$
$
$
13,162
15,350
17,694
49,900
58,757
65,818
73,993
84,258
92,421
103,570
115,869
127,984
140,145
159,111
181,754
214,035
241,884
283,337
329,777
355,768
351,349
Actuarial
Accrued
Liability (AAL)
at Entry Age
(b)
$
$
$
$
$
$
$
$
$
$
$
$
$
$
$
$
$
$
$
$
$
18,357
19,013
19,694
48,969
53,427
66,642
77,908
90,951
100,433
109,650
115,098
127,478
138,322
149,366
158,126
169,593
199,662
227,100
253,478
250,987
279,947
Unfunded
(Excess)
AAL
(UAAL)
(b-a)
Funded
Ratio
(a/b)
$
5,195
$
3,663
$
2,000
$
(931)
$
(5,330)
$
824
$
3,915
$
6,693
$
8,012
$
6,080
$
(771)
$
(506)
$
(1,823)
$
(9,745)
$ (23,628)
$ (44,442)
$ (42,222)
$ (56,237)
$ (76,299)
$ (104,781)
$ (71,402)
71.7%
80.7%
89.8%
101.9%
110.0%
98.8%
95.0%
92.6%
92.0%
94.5%
100.7%
100.4%
101.3%
106.5%
114.9%
126.2%
121.1%
124.8%
130.1%
141.7%
125.5%
Covered
Payroll
(c)
$
$
$
$
$
$
$
$
$
$
$
$
$
$
$
$
$
$
$
$
$
7,444
8,087
8,113
17,691
17,842
20,409
21,444
24,605
25,776
27,838
27,777
29,708
29,633
30,324
29,967
33,896
40,441
43,087
45,382
48,669
48,729
UAAL as a
Percentage
of Covered
Payroll
((b-a)/c))
69.8%
45.3%
24.7%
-5.3%
-29.9%
4.0%
18.3%
27.2%
31.1%
21.8%
-2.8%
-1.7%
-6.2%
-32.1%
-78.8%
-131.1%
-104.4%
-130.5%
-168.1%
-215.3%
-146.5%
* One-time cost-of-living adjustments for retired members and survivors, effective July 1 were included in this valuation. Future
increases for retirees and their survivors are dependent upon excess earnings created by the System.
1. Reflects significant Plan amendments or assumption changes.
2. Excludes the amount held in reserve for future benefit increases. Beginning 6-30-95, includes an amount for partial recognition of
the difference between market value and book value of Plan assets amortized over a four-year period.
AAL is calculated using the entry-age normal method. Significant assumptions used in determining AAL include: (a) a
rate of return on the investment of present and future assets of 9.0% per year compounded annually; (b) projected
salary increases of 6.5% per year compounded annually, attributable to an assumed inflation rate of 5.5% and other
across-the-board factors of 1.5%; and (c) additional projected salary increases ranging from 0.0% to 3.0% per year,
depending on age, attributable to seniority/merit.
Page 25
STATE OF ARIZONA
ELECTED OFFICIALS' RETIREMENT PLAN
REQUIRED SUPPLEMENTARY INFORMATION
SCHEDULE OF EMPLOYER CONTRIBUTIONS
Fiscal
Year Ended
June 30
1990
1991
1992
1993
1994
1995
1996
1997
1998
1999
2000
2001
2002
Employer Contributions
Annual
Required
Percentage
Contributions
Contributed
$3,048,190
$4,141,666
$4,830,326
$4,941,470
$5,555,890
$5,224,545
$4,886,479
$4,934,939
$3,668,144
$3,941,018
$4,126,694
$4,155,874
$3,656,604
Page 26
100.0%
100.0%
100.0%
100.0%
100.0%
100.0%
100.0%
100.0%
100.0%
100.0%
100.0%
100.0%
100.0%
STATE OF ARIZONA
ELECTED OFFICIALS' RETIREMENT PLAN
SUPPORTING SCHEDULE OF CHANGES IN FUND BALANCE RESERVES
FOR THE YEARS ENDED JUNE 30, 2002 AND 2001
Balance - June 30, 2000
Distribution of Revenues and Expenses
Members' Contributions
Employers' Contributions
Earnings on Investments Net of Investment Expenses
Pension Benefits
Refunds to Terminated Members
Administrative Expenses
Distribution of Transfers
Excess Investment Earnings to be used
for Future Benefit Increases
Earnings on Excess Investment Earnings Account Assets
Amount Utilized by Benefit Increases Granted
Net Transfers from Other State-Sponsored Pension Plans
Inter-System Transfers -- Member Account
Balances Transferred to Employers' Reserve
due to Retirement
Balance - June 30, 2001
Refundable
Members'
Reserve
Employers'
Reserve
$ 24,038,167
$ 331,297,268
(132,118)
154,128
(3,543,500)
(30,636)
$ 25,853,543
Page 27
46,908,586
4,155,874
(67,059,808)
(16,802,302)
(1,443)
(58,796)
7,953,820
4,518,604
115,610
(7,953,820)
(4,518,604)
3,543,500
$ 267,662,327
$
34,436,162
3,595,732
Distribution of Transfers
Excess Investment Earnings to be used
for Future Benefit Increases
Earnings (Loss) on Excess Investment Earnings Account Assets
Amount Utilized by Benefit Increases Granted
Net Transfers from Other State-Sponsored Pension Plans
156,613
Inter-System Transfers -- Member Account
Balances Transferred to Employers' Reserve
due to Retirement
(1,929,133)
Balance - June 30, 2002
$
3,544,290
$ 24,060,967
Distribution of Revenues and Expenses
Members' Contributions
Employers' Contributions
Earnings (Loss) on Investments Net of Investment Expenses
Pension Benefits
Refunds to Terminated Members
Administrative Expenses
Future Benefit
Increase
Reserve
3,656,604
(48,685,392)
(19,529,287)
37,153
(70,983)
5,234,297
5,801,777
277,452
(5,234,297)
(5,801,777)
1,929,133
$ 216,313,081
$
23,400,088
STATE OF ARIZONA
ELECTED OFFICIALS' RETIREMENT PLAN
SUPPORTING SCHEDULE OF ADMINISTRATIVE AND INVESTMENT EXPENSES
SUPPORTING SCHEDULE OF PAYMENTS TO CONSULTANTS
FOR THE YEAR ENDED JUNE 30, 2002
Administrative
Accounting and Auditing Services
Actuarial Services
Computer Equipment
Contractual Services
Educational Expenses
Furniture and Equipment
Occupancy Expenses
Office Supplies
Payroll Taxes and Fringe Benefits
Postage Expense
Printing, Publications and Subscriptions
Professional Services
Salaries and Wages
Telephone Expense
Travel Expense
Investment
Total
$
4,850
12,800
1,007
3,463
1,408
338
1,655
581
5,573
1,761
7,491
2,674
26,612
639
131
$
493
896
2,457
166
271
213
2,936
173
151
239
20,731
166
259
$
4,850
12,800
1,500
4,359
3,865
504
1,926
794
8,509
1,934
7,642
2,913
47,343
805
390
$
70,983
$
29,151
$
100,134
Consultants
Fees Paid
Standard & Poor's Securities, Inc. - Investment Counsel
Rodwan & Nichols - Consulting Actuaries
Barrows & Schatza, P.L.C. - Auditors
Lieberman, Dodge, Gerding, Kothe & Anderson Ltd. - Legal Counsel
$ (1)
12,800
4,850
2,913
$
(1) This service was provided to the Plan without charge by Standard & Poor's Securities, Inc.
The value of their services is approximately $7,500.00
Page 28
20,563
STATE OF ARIZONA
ELECTED OFFICIALS' RETIREMENT PLAN
SUPPLEMENTAL SCHEDULE OF
CASH RECEIPTS AND CASH DISBURSEMENTS
FOR THE YEARS ENDED JUNE 30, 2002 AND 2001
2002
RECEIPTS
Members' Contributions
Employers' Contributions
Court Fees
Interest
Dividends
Securities Lending Income
Amounts Transferred from Other
State-Sponsored Pension Plans
Maturities and Sales of
U.S. Government Securities
Corporate Bonds
Corporate Notes
Other Investments
Common Stock
Net Decrease in Money Market Funds
$
Total Receipts
DISBURSEMENTS
Pension Benefits
Refunds to Terminated Members
Investment and Administrative Expenses
Amounts Transferred to Other
State-Sponsored Pension Plans
Acquisitions of:
U.S. Government Securities
Corporate Bonds
Corporate Notes
Other Investments
Common Stock
Net Increase in Money Market Fund
3,627,191
186,865
3,484,311
7,825,250
1,143,059
167,127
$
DECREASE IN CASH
BEGINNING CASH BALANCE - July 1
$
Page 29
3,525,605
640,996
3,537,287
7,765,749
1,248,232
111,529
522,745
419,338
14,827,952
6,798,498
678,172,923
1,853,132
33,118,720
117,228
4,033,350
3,029,229
728,948,269
1,220,372
67,105,521
612,216
751,845,001
822,197,693
19,529,287
(6,518)
93,887
Total Disbursements
ENDING CASH BALANCE - June 30
2001
16,802,302
133,561
89,117
88,681
149,600
2,989,688
9,113,875
685,668,810
1,252,715
33,114,576
-
11,731,449
5,152,069
728,952,022
2,472,636
56,714,937
-
751,845,001
822,197,693
-
-
-
-
-
$
-
Page 30
INVESTMENT SECTION
ELECTED OFFICIALS’ RETIREMENT PLAN
TWENTY-FIRST COMPREHENSIVE ANNUAL FINANCIAL REPORT
FOR THE FISCAL YEAR ENDED
JUNE 30, 2002
Fund Objectives
Investment Performance Data
Supporting Schedule of Commissions Paid to Brokers
Summary of Changes in Investment Portfolio
Detailed List of Investments Acquired
Detailed List of Sales and Redemption of Investments
Detailed List of Investments Owned
FUND OBJECTIVES
1. The intent of the Public Safety Personnel Retirement System, the Elected Official's Retirement Plan and the
Corrections Officer Retirement Plan (herein after referred to as the Plan) is to provide the Plan participants
benefits as defined in Title 38, chapter 5, articles 3, 4 and 6 of the Arizona Revised Statutes.
2. The Fund Manager and the Administrator will discharge their duties with respect to the Plan solely in the interest
of the Plan participants, beneficiaries and employer sponsors. In making every investment, the Fund Manager
shall exercise the judgment and care under the circumstances then prevailing which men of ordinary prudence,
discretion and intelligence exercise in the management of their own affairs, not in regard to speculation but in
regard to the permanent disposition of their funds, considering the probable income from their funds as well as
the probable safety of their capital, provided these investments are made in conformity with all applicable laws.
3. The intention of the Plan is to maintain the benefit level as stated in Title 38, chapter 5, articles 3, 4 and 6 of the
Arizona Revised Statutes and as amended from time to time by the Arizona State Legislature. In order to
maintain this benefit level the Plan will annually adjust the employer contribution rate based on the
recommendations made by the annual actuarial valuations. The Plan’s funding goal is for the Plan assets to be
equal to Plan liabilities within any twenty-year period.
4. It is the intent of the Plan to level off or reduce the employer contribution rate to the Plan as well as to provide
the opportunity for increased benefits for retirees as the legislature may from time to time enact, through the
systematic growth of the investments of the fund.
5. The primary objective of the investment program of the Plan is a reasonable, long-range total rate of return.
Inherent in this goal is the preservation and enhancement of capital through effective management of the
portfolio in order to take advantage of attractive opportunities various market sectors have to offer.
Adopted this 17th day of June, 1998, by the Fund Manager.
55 Water Street
New York, NY 10041
Tel 212 438 9546
Fax 212 438 9512
[email protected]
Kenneth A. Shea
Managing Director
Director of Equity Research
August 19, 2002
The Fund Manager
Elected Officials’ Retirement Plan
of the State of Arizona
1020 East Missouri Avenue
Phoenix, Arizona 85014
Dear Sirs:
The attached charts and tables depict the investment performance for the Elected Officials’
Retirement Plan of the State of Arizona. The performance results shown are based entirely on
data provided by the plan's staff and does not constitute an audit on Standard & Poor's part.
We note that Standard & Poor's has assumed that all data that has been supplied by the staff
is accurate and complete and that Standard & Poor's has not taken steps to verify same. We
also note that the performance was calculated under the assumption that cash inflows and
outflows take place uniformly throughout each month.
The performance data include realized and unrealized capital gains and losses, as well as
interest and dividend income earned by the fund. We believe these computations were
performed in accordance with accepted AIMR procedures.
Based on the foregoing, during the past fiscal year, the stock portfolio underperformed the
NYSE and S&P 500 indices, while the bond portfolio outperformed the Lehman
Government/Credit Index. The overall fund underperformed a custom benchmark, using bond
and stock indices weighted in a fixed proportion. The overall fund has attained a rate of return
over the past sixteen years (since inception) that compares favorably with this custom index.
Sincerely,
Kenneth Shea/sig
Kenneth Shea
Managing Director-Global Equity Research
Investment Performance Data
Cumulative Return - Total Fund
Elected Officials' Retirement Plan
$650
$600
$550
EORP Total Fund
$500
Balanced Index
$450
$400
$350
$300
$250
$200
$150
$100
86
87
88
89
FYE
06-30-02
06-30-01
06-30-00
06-30-99
06-30-98
06-30-97
06-30-96
06-30-95
06-30-94
06-30-93
06-30-92
06-30-91
06-30-90
06-30-89
06-30-88
06-30-87
06-30-86
90
$
$
$
$
$
$
$
$
$
$
$
$
$
$
$
$
$
91
92
Fair
Value
263,752,773
323,948,245
399,600,916
356,162,525
308,491,389
257,721,510
209,379,157
180,418,272
153,422,862
153,665,647
139,529,010
119,192,732
105,498,890
93,578,548
79,125,721
76,655,143
68,508,067
Annualized Returns
93
94
95
Contribution
$ (11,539,231)
$ (8,619,538)
$ (3,551,579)
$ (5,775,793)
$ (3,624,820)
$ (2,741,757)
$ (2,779,807)
$ (1,649,899)
$
54,156
$
(794,301)
$
844,693
$
625,797
$
420,839
$
1,095,348
$
1,018,730
$
554,007
5-year
10-year
16-year
96
Total
Return
-15.36%
-16.96%
13.20%
17.51%
21.26%
24.59%
17.70%
18.78%
-0.19%
10.70%
16.29%
12.31%
12.26%
16.61%
1.80%
11.01%
2.54%
8.11%
9.41%
97
98
99
00
01
02
Balanced
Index*
-4.50%
-1.40%
6.02%
12.23%
17.66%
17.87%
13.98%
16.30%
0.25%
12.26%
12.12%
8.32%
9.21%
13.98%
1.19%
12.61%
5.68%
8.77%
9.04%
*The Balanced Index is calculated using the following formula: 45% Stock Benchmark + 45% Lehman
Government/Credit + 10% 91 Day T-bill.
Our investment universe is the New York Stock Exchange (NYSE) prior to July 21, 1997. Prior to FYE June 30,
1998, the Fund's stock benchmark was the NYSE Composite. S&P 500 is the stock benchmark for each FYE
thereafter. The Lehman Government/Credit bond index includes more than 5,000 publicly traded bond issues of
$25 million or more rated Baa or better for a total market value of more than $2 trillion.
Prior to 1990, the weightings in each asset class were calculated using the fiscal year-end market values. Since
1990, the asset class weightings have been calculated using the average weightings of the quarter's beginning and
ending market values.
Page 35
Investment Performance Data
Cumulative Return - Domestic Equities
Elected Officials' Retirement Plan
$1,000
$900
$800
EORP Equities
Stock Benchmark
NYSE
S&P 500
$700
$600
$500
$400
$300
$200
$100
86
FYE
06-30-02
06-30-01
06-30-00
06-30-99
06-30-98
06-30-97
06-30-96
06-30-95
06-30-94
06-30-93
06-30-92
06-30-91
06-30-90
06-30-89
06-30-88
06-30-87
06-30-86
87
$
$
$
$
$
$
$
$
$
$
$
$
$
$
$
$
$
88
89
Fair
Value
162,637,827
221,189,751
310,309,992
268,364,567
219,970,996
172,058,639
130,754,134
100,984,922
84,956,830
84,488,875
68,365,688
52,650,675
37,844,300
26,506,185
24,034,290
27,185,325
18,284,450
Annualized Returns
90
$
$
$
$
$
$
$
$
$
$
$
$
$
$
$
$
91
92
93
Contribution
(1,087,377)
(11,629,031)
(2,522,218)
(2,803,445)
3,973,823
(1,803,251)
2,472,037
(4,284,646)
858,704
9,068,166
6,044,772
9,161,349
5,083,288
(3,016,405)
(805,321)
4,220,210
5-year
10-year
16-year
94
95
96
97
98
99
00
01
Total
Return
-26.20%
-25.47%
16.58%
23.05%
25.61%
33.72%
25.69%
24.88%
-0.41%
9.90%
18.05%
12.20%
22.43%
24.94%
-8.16%
21.22%
Stock*
Benchmark
-17.99%
-14.83%
7.25%
22.76%
27.29%
31.51%
25.91%
22.40%
1.24%
13.32%
11.59%
5.50%
11.25%
16.81%
-8.57%
21.46%
NYSE
Index
-12.80%
-1.77%
0.84%
13.86%
27.29%
31.51%
25.91%
22.40%
1.24%
13.32%
11.59%
5.50%
11.25%
16.81%
-8.57%
21.46%
S&P
500
-17.99%
-14.83%
7.25%
22.76%
30.16%
34.71%
26.00%
26.06%
1.23%
13.52%
13.45%
7.39%
16.44%
20.53%
-6.92%
25.08%
-0.18%
8.58%
10.77%
3.20%
10.53%
10.04%
4.59%
11.28%
10.51%
3.66%
11.40%
11.68%
02
*Our investment universe is the New York Stock Exchange (NYSE) prior to July 21, 1997. Prior to FYE June 30,
1998, the Fund's stock benchmark was the NYSE Composite. S&P 500 is the stock benchmark for each FYE
thereafter.
Prior to 1990, the weightings in each asset class were calculated using the fiscal year-end market values. Since
1990, the asset class weightings have been calculated using the average weightings of the quarter's beginning and
ending market values.
Page 36
Investment Performance Data
Cumulative Return - Fixed Income
Elected Officials' Retirement Plan
$400
$375
$350
EORP Fixed Income
$325
Lehman
T-Bill
$300
$275
$250
$225
$200
$175
$150
$125
$100
86
87
88
FYE
06-30-02
06-30-01
06-30-00
06-30-99
06-30-98
06-30-97
06-30-96
06-30-95
06-30-94
06-30-93
06-30-92
06-30-91
06-30-90
06-30-89
06-30-88
06-30-87
06-30-86
89
$
$
$
$
$
$
$
$
$
$
$
$
$
$
$
$
$
90
91
Fair
Value
101,114,946
102,758,495
89,290,924
87,797,958
88,520,393
85,666,634
78,625,023
79,433,350
68,466,032
69,176,772
71,163,322
66,542,057
67,654,590
67,072,363
55,091,431
49,469,818
50,223,617
Annualized Returns
92
$
$
$
$
$
$
$
$
$
$
$
$
$
$
$
$
93
94
Contribution
(10,451,854)
3,009,493
(1,029,361)
(2,972,348)
(7,598,643)
(938,506)
(5,251,844)
2,634,747
(804,548)
(9,862,467)
(5,200,079)
(8,535,552)
(4,662,449)
4,111,753
1,824,079
(3,666,202)
5-year
10-year
16-year
95
96
97
98
99
00
Total
Return
8.73%
11.58%
2.97%
2.56%
12.29%
9.98%
6.02%
11.67%
0.08%
11.75%
15.01%
11.55%
8.06%
13.40%
7.61%
6.12%
Lehman*
8.24%
11.14%
4.29%
2.69%
11.08%
7.76%
4.65%
12.75%
-1.45%
13.15%
14.17%
10.21%
7.11%
12.33%
7.47%
4.68%
91-Day
T-Bill
2.57%
5.89%
5.53%
4.90%
5.28%
5.43%
5.52%
5.52%
3.37%
3.37%
5.19%
7.55%
8.50%
8.47%
6.75%
6.17%
7.55%
7.68%
8.63%
7.43%
7.33%
8.06%
4.83%
4.73%
5.61%
01
02
*The Lehman Government/Credit bond index includes more than 5,000 publicly traded bond issues of $25 million or
more rated Baa or better for a total market value of more than $2 trillion.
Prior to 1990 the weightings in each asset class were calculated using the fiscal year-end market values. Since
1990, the asset class weightings have been calculated using the average weightings of the quarter's beginning and
ending market values.
Our Fixed Income is comprised of all Bonds, Notes, Other Investments and Money Market securities.
Page 37
STATE OF ARIZONA
ELECTED OFFICIALS' RETIREMENT PLAN
SUPPORTING SCHEDULE OF COMMISSIONS PAID TO BROKERS
FISCAL YEAR ENDED JUNE 30, 2002
Broker
Dain Rauscher
Greenberg Financial Group
Investors Capital Corporation
ISI Group
Merrill Lynch
Morgan Stanley Dean Witter
Pin Oak Partners, Inc.
Salomon Smith Barney (Phoenix)
Salomon Smith Barney (Scottsdale)
Standard & Poor's Securities
U. S. Securities and Futures
UBS | Paine Webber
Wells Fargo / Van Kasper
Total Commissions
Number of Shares
Traded
143,000
24,000
18,000
125,000
206,680
109,000
50,000
198,800
170,186
288,000
245,000
215,765
257,000
2,050,431
Average
Commission
Commissions
0.050
0.050
0.050
0.050
0.020
0.050
0.050
0.016
0.026
0.050
0.050
0.029
0.050
$
$
$
$
$
$
$
$
$
$
$
$
$
7,150.00
1,200.00
900.00
6,250.00
4,100.00
5,450.00
2,500.00
3,240.00
4,359.30
14,400.00
12,250.00
6,238.25
12,850.00
0.039
$
80,887.55
The Plan typically pays $ .05 per share traded plus SEC charges on sale transactions. Over the Counter stocks are
typically traded net of commissions. The firms with an average commission of less than $.05 have traded Over the
Counter stocks net of commissions for the Plan.
Page 38
STATE OF ARIZONA
ELECTED OFFICIALS' RETIREMENT PLAN
SUMMARY OF CHANGES IN INVESTMENT PORTFOLIO
FOR THE FISCAL YEAR ENDED JUNE 30, 2002
Description
U.S. Treasury
Obligations
Percent
at Fair
Value
Balance June 30, 2001
Fair
Book
Value
Value
Acquisitions
3.9%
12,767,960.00
10,968,450.14
Federal Agency
Obligations
11.2%
36,149,168.77
35,039,386.40
2,989,687.50
8,825,262.16
Total U.S. Government
Securities
15.1%
48,917,128.77
46,007,836.54
2,989,687.50
14,826,218.68
Corporate Bonds
13.1%
42,384,669.63
43,552,117.80
9,113,874.59
Total Bond
Portfolio
28.2%
91,301,798.40
89,559,954.34
Corporate Notes
0.9%
2,998,918.34
Common Stock
68.3%
Other Investments
Money Market Account
Total Portfolio
-
Maturites
and Sales
Percent
at Fair
Value
4,965,760.55
1.7%
30,867,401.60
29,203,811.74
10.2%
(1,733.07)
37,487,411.60
34,169,572.29
11.9%
6,354,101.93
(14,688.43)
45,293,654.94
46,297,202.03
16.2%
12,103,562.09
21,180,320.61
(16,421.50)
82,781,066.54
80,466,774.32
28.1%
2,998,918.34
685,668,809.74
678,172,923.09
-
10,494,804.99
10,494,804.99
3.6%
221,189,750.55
190,250,495.59
33,114,575.55
35,602,664.13
-
162,637,826.77
187,762,407.01
65.6%
2.5%
8,113,706.13
8,113,706.13
1,252,714.97
1,754,191.10
-
7,612,230.00
7,612,230.00
2.7%
0.1%
344,071.93
344,071.93
117,227.60
-
226,844.33
226,844.33
0.0%
100.0%
323,948,245.35
291,267,146.33
263,752,772.63
286,563,060.65
100.0%
Page 39
736,827,326.53
(1,733.07)
Balance June 30, 2002
Fair
Book
Value
Value
6,620,010.00
732,139,662.35
6,000,956.52
(Premium)
Discount
(16,421.50)
STATE OF ARIZONA
ELECTED OFFICIALS' RETIREMENT PLAN
INVESTMENTS ACQUIRED
JULY 1, 2001 THROUGH JUNE 30, 2002
BONDS ACQUIRED
Security
Coupon
Maturity
Purchase
Price
(Premium)
Discount
Accrued
Interest
Total Amount
Book
Yield
Par Value
Principal
3,000,000.00
2,989,687.50
10,312.50
9,208.33
2,998,895.83
6.52%
3,000,000.00
2,989,687.50
10,312.50
9,208.33
2,998,895.83
6.52%
500,000.00
500,000.00
500,000.00
500,000.00
500,000.00
1,000,000.00
1,000,000.00
927,506.67
1,000,000.00
627,000.00
1,000,000.00
1,000,000.00
433,800.00
497,395.00
562,425.00
459,300.00
508,810.00
940,900.00
1,010,450.00
1,013,301.04
1,046,780.00
606,089.55
1,021,624.00
1,013,000.00
66,200.00
2,605.00
(62,425.00)
40,700.00
(8,810.00)
59,100.00
(10,450.00)
(85,794.37)
(46,780.00)
20,910.45
(21,624.00)
(13,000.00)
14,354.17
1,178.07
10,546.88
18,107.64
4,934.03
29,750.00
15,946.16
13,333.33
6,309.19
18,562.50
23,499.33
448,154.17
498,573.07
572,971.88
477,407.64
513,744.03
970,650.00
1,010,450.00
1,029,247.20
1,060,113.33
612,398.74
1,040,186.50
1,036,499.33
7.49%
7.75%
8.33%
8.11%
7.12%
8.37%
7.92%
7.26%
7.64%
8.15%
8.08%
8.27%
TOTAL CORPORATE BONDS
9,054,506.67
9,113,874.59
(59,367.92)
156,521.30
9,270,395.89
7.89%
TOTAL BONDS PURCHASED
12,054,506.67
12,103,562.09
(49,055.42)
165,729.63
12,269,291.72
7.55%
FEDERAL AGENCY OBLIGATIONS
GNMA Pool #552514
6.500
04/15/2032
99.65625
TOTAL FEDERAL AGENCY OBLIGATIONS
CORPORATE BONDS
AT&T CORPORATES
DELTA AIRLINES SERIES 01-1B
FORD HOLDINGS INC
FORD MOTOR COMPANY
FORD MOTOR CREDIT
LIBERTY MUTUAL INSURANCE
NATIONAL RURAL UTILITIES
NORTHWEST AIRLINES
STANDARD CHARTERED BANK
UNION CARBIDE CORP
WORLDCOM INC.
ZURICH CAPITAL TRUST I
6.500
7.711
9.375
7.450
7.250
7.875
8.000
7.935
8.000
7.875
8.250
8.376
03/15/2029
09/18/2011
03/01/2020
07/16/2031
10/25/2011
10/15/2026
03/01/2032
04/01/2019
05/30/2031
04/01/2023
05/15/2031
06/01/2037
86.76000
99.47900
112.48500
91.86000
101.76200
94.09000
101.04500
109.25000
104.67800
96.66500
102.16240
101.30000
Page 40
STATE OF ARIZONA
ELECTED OFFICIALS' RETIREMENT PLAN
INVESTMENTS ACQUIRED
JULY 1, 2001 THROUGH JUNE 30, 2002
Page 1 of 3
SHORT TERM INVESTMENTS MATURED
Description
AEGON FUNDING CORP
ALLMERICA FINANCIAL CORP
ALLSTATE CORPORATION
AMGEN INC
AMSTEL FUNDING
AMSTERDAM FUNDING CORP
ASSET ONE SECURITIZATION
ASSET SECURT. COOPERATIVE
AUTOBAHN FUNDING CORP
BANK OF IRELAND
BANNER HEALTH SYSTEMS
BARTON CAPITAL CORP
BAVARIA FINANCE FUNDING
BBL NORTH AMERICA FUNDING
BEETHOVEN FUNDING CORPORATION
BELFORD FUNDING COMPANY LLC
BROADWAY CAPITAL
BRYANT PARK FUNDING LLC
CARGILL INC
CATHOLIC HEALTHCARE PARTNERS
CDC COMMERCIAL PAPER PROGRAM
CHECK POINT CHARLIE INC
CINTAS CORPORATION NO. 2
CLIPPER RECEIVABLES
COCA COLA COMPANY
CONCORD MINUTEMAN CAPITAL
COOPERATIVE ASSN OF TRACTOR DEALERS
COUNTRYWIDE HOME LOANS
CROWN POINT CAPITAL
CVS CORPORATION
CXC INC
DAKOTA NOTES
DEALERS CAPITAL ACCEPTANCE
DEALERS CAPITAL ACCESS TRUST INC.
DELAWARE FUNDING CORP
DOW CHEMICAL COMPANY
DUKE ENERGY CORP
EAGLE FUNDING CAPITAL
EDISON ASSET SECURITIZATION
EMINENT FUNDING
ERASMUS CAPITAL CORP
EXXON PROJECT
EXXON PROJECT INVESTMENT
FALCON ASSET SECURITIZATION
FLORDIA POWER AND LIGHT
FORRESTAL FUNDING MASTER TRUST
FOUR WINDS FUNDING CORP
FPL FUELS, INC.
GALLEON CAPITAL
GE CAPITAL CORP
GENERAL ELECTRIC COMPANY
GIRO FUNDING (US)
Cost
1,499,567.50
999,401.11
1,248,819.10
1,748,906.74
999,770.00
8,246,024.17
6,497,024.30
999,893.61
79,805,628.57
2,024,318.81
999,655.56
1,999,167.50
3,996,519.44
999,261.11
17,194,207.04
999,639.17
1,998,475.28
1,499,325.00
999,667.50
1,548,915.00
2,999,525.55
4,399,690.72
999,104.44
2,998,545.27
999,266.67
5,223,190.02
23,318,590.65
2,249,325.00
3,172,839.02
999,615.56
999,711.67
3,499,443.61
3,174,131.38
21,994,133.19
999,758.33
1,499,794.44
999,255.00
16,890,623.17
1,998,050.83
10,295,819.31
999,511.94
3,796,636.12
2,999,654.17
3,499,155.55
999,583.33
999,849.17
13,998,524.70
999,444.44
46,493,594.08
3,398,766.58
999,570.00
4,498,731.81
Page 41
Amount of
Interest
432.50
598.89
1,180.90
1,093.26
230.00
3,975.83
2,975.70
106.39
19,371.43
681.19
344.44
832.50
3,480.56
738.89
5,792.96
360.83
1,524.72
675.00
332.50
1,085.00
474.45
309.28
895.56
1,454.73
733.33
1,809.98
6,409.35
675.00
2,160.98
384.44
288.33
556.39
868.62
5,866.81
241.67
205.56
745.00
9,376.83
1,949.17
4,180.69
488.06
3,363.88
345.83
844.45
416.67
150.83
1,475.30
555.56
6,405.92
1,233.42
430.00
1,268.19
Maturity
Value
1,500,000.00
1,000,000.00
1,250,000.00
1,750,000.00
1,000,000.00
8,250,000.00
6,500,000.00
1,000,000.00
79,825,000.00
2,025,000.00
1,000,000.00
2,000,000.00
4,000,000.00
1,000,000.00
17,200,000.00
1,000,000.00
2,000,000.00
1,500,000.00
1,000,000.00
1,550,000.00
3,000,000.00
4,400,000.00
1,000,000.00
3,000,000.00
1,000,000.00
5,225,000.00
23,325,000.00
2,250,000.00
3,175,000.00
1,000,000.00
1,000,000.00
3,500,000.00
3,175,000.00
22,000,000.00
1,000,000.00
1,500,000.00
1,000,000.00
16,900,000.00
2,000,000.00
10,300,000.00
1,000,000.00
3,800,000.00
3,000,000.00
3,500,000.00
1,000,000.00
1,000,000.00
14,000,000.00
1,000,000.00
46,500,000.00
3,400,000.00
1,000,000.00
4,500,000.00
STATE OF ARIZONA
ELECTED OFFICIALS' RETIREMENT PLAN
INVESTMENTS ACQUIRED
JULY 1, 2001 THROUGH JUNE 30, 2002
Page 2 of 3
SHORT TERM INVESTMENTS MATURED
Description
GIRO MULTI-FUNDING US CORP
GOTHAM FUNDING
GRAND FUNDING CORP
HALOGEN CAPITAL COMPANY
HANNOVER FUNDING
HOLDENBY CAPITAL COMPANY LLC
HOLLAND LIMITED SECURITZATION
INDIANA GAS COMPANY
K2 (USA) LLC
KITTY HAWK FUNDING CORP
LEXINGTON PARKER CAPITAL CORP
LIBERTY STREET FUNDING
LONG LANE MASTER TRUST
LONG LANE MASTER TRUST IV
MARKET STREET FUNDING
MARSH & MCLENNAN
MEDTRONIC
MIDAMERICAN ENERGY CO
MOAT FUNDING
MONTAUK FUNDING CORP
NEPTUNE FUNDING
NESS LLC
NESTLE CAPITAL CORP
OLD LINE FUNDING
ORANGE & ROCKLAND UTILITY
PARADIGM FUNDING
PEOPLES ENERGY CORPORATION
PREFERRED RECEIVABLES FUNDING CORP
QUESTAR CORP
QUINCY CAPITAL CORPORATION
REGENCY MARKETS NO. 1
REVOLVING COMMITMENT VEHICLE
SOUTHERN COMPANY FUNDING CORP
SPECIAL PURPOSE ACCTS. REC.
STARBIRD FUNDING CORPORATION
STEAMBOAT FUNDING
SUNBELT FUNDING CORP
SUNFLOWERS FUNDING CO
SUPERIOR FUNDING CAPITAL CORP
SWEDBANK
SYDNEY CAPITAL CORP
TEXTRON INC
THAMES ASSET GLOBAL SECURITIZATION
THREE CROWNS FUNDING
THUNDER BAY FUNDING
TOTAL FINA ELF SA
TRANSAMERICA ASSET FUNDING
TRIDENT CAPITAL FINANCE
TRIPLE A-1 FUNDING
UBS AMERICAS INC
UBS FINANCE (DELAWARE)
UNITED TECH CORP
Cost
999,090.00
1,549,123.82
1,499,572.64
3,997,872.50
15,197,382.57
999,949.72
24,987,082.12
999,788.33
499,976.39
3,024,097.88
3,498,227.22
2,999,064.72
998,872.22
499,408.33
6,497,994.59
3,498,043.89
1,499,713.33
499,873.61
3,998,129.16
4,598,303.17
11,344,363.42
1,999,587.50
1,999,901.67
2,898,515.55
999,687.50
5,547,737.81
999,901.94
2,898,556.56
999,300.00
999,655.56
7,021,224.05
999,086.39
1,499,416.67
3,046,702.50
21,792,661.53
7,746,998.88
24,989,529.18
5,499,392.10
999,385.83
999,480.00
3,996,709.45
999,337.78
499,418.61
78,029,051.80
9,997,771.38
1,499,426.67
7,748,339.99
999,222.22
4,498,249.57
19,497,604.78
4,999,436.39
999,562.50
Page 42
Amount of
Interest
910.00
876.18
427.36
2,127.50
2,617.43
50.28
12,917.88
211.67
23.61
902.12
1,772.78
935.28
1,127.78
591.67
2,005.41
1,956.11
286.67
126.39
1,870.84
1,696.83
5,636.58
412.50
98.33
1,484.45
312.50
2,262.19
98.06
1,443.44
700.00
344.44
3,775.95
913.61
583.33
3,297.50
7,338.47
3,001.12
10,470.82
607.90
614.17
520.00
3,290.55
662.22
581.39
20,948.20
2,228.62
573.33
1,660.01
777.78
1,750.43
2,395.22
563.61
437.50
Maturity
Value
1,000,000.00
1,550,000.00
1,500,000.00
4,000,000.00
15,200,000.00
1,000,000.00
25,000,000.00
1,000,000.00
500,000.00
3,025,000.00
3,500,000.00
3,000,000.00
1,000,000.00
500,000.00
6,500,000.00
3,500,000.00
1,500,000.00
500,000.00
4,000,000.00
4,600,000.00
11,350,000.00
2,000,000.00
2,000,000.00
2,900,000.00
1,000,000.00
5,550,000.00
1,000,000.00
2,900,000.00
1,000,000.00
1,000,000.00
7,025,000.00
1,000,000.00
1,500,000.00
3,050,000.00
21,800,000.00
7,750,000.00
25,000,000.00
5,500,000.00
1,000,000.00
1,000,000.00
4,000,000.00
1,000,000.00
500,000.00
78,050,000.00
10,000,000.00
1,500,000.00
7,750,000.00
1,000,000.00
4,500,000.00
19,500,000.00
5,000,000.00
1,000,000.00
STATE OF ARIZONA
ELECTED OFFICIALS' RETIREMENT PLAN
INVESTMENTS ACQUIRED
JULY 1, 2001 THROUGH JUNE 30, 2002
Page 3 of 3
SHORT TERM INVESTMENTS MATURED
Description
USAA CAPITAL CORP
VECTREN UTILITY HOLDING CORP
VISTAONE METAFOLIO LLC
WELLS FARGO & COMPANY
WGL HOLDINGS
WINDMILL FUNDING CORPORATION
WISCONSIN PUBLIC SERVICE
WORLD OMNI VEHICLE LEASING
TOTALS
Cost
Amount of
Interest
Maturity
Value
999,761.11
2,999,729.99
6,997,467.23
5,547,029.44
1,999,499.16
3,796,830.83
999,191.11
3,749,010.00
238.89
270.01
2,532.77
2,970.56
500.84
3,169.17
808.89
990.00
1,000,000.00
3,000,000.00
7,000,000.00
5,550,000.00
2,000,000.00
3,800,000.00
1,000,000.00
3,750,000.00
678,172,923.09
227,076.91
678,400,000.00
Page 43
STATE OF ARIZONA
ELECTED OFFICIALS' RETIREMENT PLAN
INVESTMENTS ACQUIRED
JULY 1, 2001 THROUGH JUNE 30, 2002
COMMON STOCK ACQUIRED
Company
ALBERTO CULVER CO
AMERICAN STANDARD COMPANY INC
BELLSOUTH CORPORATION
BROADWING INC.
CANADIAN NATIONAL RAILWAY
CHEVRON CORPORATION
CHOICEPOINT INCORPORATED
DAL-TILE INTERNATIONAL
ELECTRONICS BOUTIQUE HOLDINGS CORP.
FORTUNE BRANDS, INC.
GENZYME CORPORATION
HEALTHSOUTH CORP
JACOBS ENGINEERING GROUP INC.
JOHNSON & JOHNSON CO
LANDSTAR SYSTEMS, INC
LENNAR CORPORATION
MBNA CORP
MICROCHIP TECHNOLOGY INC.
MOHAWK INDUSTRIES
MOODY'S CORPORATION
OXFORD HEALTH PLANS, INC.
P.F. CHANG'S CHINA BISTRO
PACTIV CORPORATION
PEPSICO INC.
PFIZER INC.
QUALCOMM INCORPORATED
QUEST DIAGNOSTIC
SCP POOL CORPORATION
SEARS, ROEBUCK AND COMPANY
SEI INVESTMENTS COMPANY
SIEBEL SYSTEMS
SPRINT CORPORATION (PCS GROUP)
ST. JUDE MEDICAL
TENET HEALTHCARE CORPORATION
VISHAY INTERTECHNOLOGY INC
WALGREEN COMPANY
WATERS CORPORATION
WHIRLPOOL CORP
No.
Shares
14,000
11,000
29,000
22,000
25,000
14,000
29,000
14,000
40,000
11,000
29,000
14,000
11,000
14,000
6,800
15,000
12,000
14,000
11,000
14,000
14,000
59,000
13,000
36,000
15,000
15,000
11,000
38,000
14,000
15,000
44,000
43,000
22,000
11,000
15,000
14,000
14,000
7,000
Dividend
Rate
0.36
0.76
0.55
2.80
1.00
0.82
0.05
0.40
0.18
0.60
0.52
0.92
0.24
0.04
0.15
1.36
TOTAL COMMON STOCK BOUGHT
Page 44
Annual
Income
Page 1 of 1
Book
Yield
5,040.00
22,040.00
13,670.00
39,200.00
11,000.00
11,480.00
750.00
4,800.00
2,520.00
21,600.00
7,800.00
12,880.00
3,600.00
440.00
2,032.80
9,520.00
0.66%
1.90%
1.16%
3.35%
1.92%
1.52%
0.11%
1.06%
0.46%
1.23%
1.27%
1.63%
0.61%
0.07%
0.37%
1.75%
168,372.80
0.51%
Average
Cost
54.32
76.56
40.08
21.41
47.16
83.70
52.53
17.30
36.74
52.20
57.59
15.03
60.47
53.85
105.54
43.60
37.87
38.79
69.04
38.96
26.29
39.80
16.00
48.65
41.01
45.70
87.08
35.76
56.37
39.18
34.90
26.72
81.57
61.06
23.12
39.62
34.30
77.53
Book
Cost
760,447.26
842,207.68
1,162,315.50
471,109.30
1,179,064.40
1,171,759.20
1,523,421.20
242,179.20
1,469,763.76
574,201.10
1,670,056.65
210,383.60
665,126.40
753,905.60
717,661.60
653,925.40
454,442.40
543,008.00
759,405.10
545,478.67
368,068.30
2,348,438.34
207,950.10
1,751,229.57
615,204.00
685,428.00
957,889.90
1,358,846.62
789,158.88
587,731.50
1,535,404.60
1,148,860.80
1,794,435.30
671,706.60
346,774.50
554,686.60
480,179.00
542,720.92
33,114,575.55
STATE OF ARIZONA
ELECTED OFFICIALS' RETIREMENT PLAN
INVESTMENTS ACQUIRED
JULY 1, 2001 THROUGH JUNE 30, 2002
OTHER INVESTMENTS ACQUIRED
Name
Coupon
Maturity
12.750
12.500
4/30/2002
9/25/2000
Book Cost
BRIDGE FINANCIAL
BRIDGE FINANCIAL-DYNAMITE MTN. RANCH
BRIDGE FINANCIAL-GRAND INN
TOTAL BRIDGE FINANCIAL ACQUIRED
31,089.97
10,000.00
41,089.97
PIVOTAL EQUITY
CENTURY PLAZA HOTEL
NEWS I, LLC
PROMONTORY
PROMONTORY-LOANS
SPA AT RED CANYON
213,750.00
9,000.00
562,500.00
360,000.00
66,375.00
TOTAL PIVOTAL EQUITY ACQUIRED
1,211,625.00
TOTAL OTHER INVESTMENTS ACQUIRED
1,252,714.97
Page 45
STATE OF ARIZONA
ELECTED OFFICIALS' RETIREMENT PLAN
SALES AND REDEMPTION OF INVESTMENTS
JULY 1, 2001 THROUGH JUNE 30, 2002
BONDS SOLD
Security
Coupon
US TREASURY OBLIGATIONS
US TREASURY BOND
14.250
US TREASURY NOTE
7.500
TOTAL US TREASURY OBLIGATIONS
Maturity
2/15/2002
11/15/2001
Par Value
5,000,000.00
1,000,000.00
6,000,000.00
Sale Price
100.00
100.10
Accrued
Interest
-
Principal
Amortized
Cost
4,999,973.61
1,000,982.91
6,000,956.52
4,999,973.61
1,000,982.91
6,000,956.52
Gain or (Loss)
-
Amount Due
4,999,973.61
1,000,982.91
6,000,956.52
FEDERAL AGENCY OBLIGATIONS
Detailed information for the redemptions of Federal Agency Obligations are too lengthy to include in this report; therefore, only totals are given.
TOTAL FEDERAL AGENCY OBLIGATIONS
8,825,262.16
CORPORATE BONDS
ANTHEM INSURANCE COMPANEY
AUTO BOND RECEIVABLE TRUST
AXA SA
FORD MOTOR COMPANY
LEHMAN BROTHERS HOLDINGS
NATIONAL RURAL UTILITIES
OHIO NATIONAL LIFE INSURANCE
OKLAHOMA GAS & ELECTRIC
SECURITY NATIONAL MORTGAGE
TYCO INTERNATIONAL GROUP
TOTAL CORPORATE BONDS
TOTAL BONDS SOLD
9.125
6.400
8.600
7.450
8.750
8.000
8.500
6.500
7.870
6.875
4/1/2010
4/15/2001
12/15/1930
7/16/1931
5/15/2002
3/1/1932
5/15/2026
4/15/2028
8/25/1930
1/15/2029
1,000,000.00
20,238.64
500,000.00
500,000.00
1,000,000.00
1,000,000.00
1,000,000.00
815,000.00
265,746.42
500,000.00
6,600,985.06
92.32
100.00
108.38
91.94
100.06
101.04
99.82
83.67
100.00
90.43
12,600,985.06
Page 46
28,895.83
3,105.56
13,037.50
22,666.67
8,500.00
588.61
1,527.78
78,321.95
1,047,500.00
20,238.64
568,120.00
474,550.00
1,000,609.00
1,125,570.00
1,058,790.00
745,545.70
265,746.42
477,140.00
6,783,809.76
923,246.24
20,238.64
541,920.77
459,719.71
1,000,609.00
1,010,363.87
998,179.71
681,923.74
265,746.42
452,153.83
6,354,101.93
124,253.76
26,199.23
14,830.29
115,206.13
60,610.29
63,621.96
24,986.17
429,707.83
952,142.07
20,238.64
545,026.33
472,757.21
1,000,609.00
1,033,030.54
1,006,679.71
682,512.35
265,746.42
453,681.61
6,432,423.88
78,321.95
12,784,766.28
21,180,320.61
429,707.83
12,433,380.40
STATE OF ARIZONA
ELECTED OFFICIALS' RETIREMENT PLAN
SALES AND REDEMPTION OF INVESTMENTS
JULY 1, 2001 THROUGH JUNE 30, 2002
Page 1 of 2
COMMON STOCK SOLD
Company
3COM SECURITIES LITIGATION
AES CORPORATION
ALLTEL CORPORATION
AMERICAN EXPRESS
AMERICAN INT'L GROUP
AMGEN
BELLSOUTH CORPORATION
BIOGEN INC
BJ'S WHOLESALE CLUB, INC.
BROADWING INC.
CHARTER COMMUNICATIONS, INC
CHOICEPOINT
CISCO SYSTEMS
CORNING INCORPORATED
DEVON ENERGY CORPORATION
ECHOSTAR COMMUNICATIONS 'A'
EL PASO CORPORATION
EMC CORP
ENRON CORPORATION
EXPRESS SCRIPTS
GUIDANT CORPORATION
HELLER FINANCIAL, INC.
HOME DEPOT
INTEL CORPORATION
INTERNATIONAL BUSINESS MACH.
JABIL CIRCUIT
LEXMARK INTERNATIONAL GROUP
MCI Group
MOHAWK (Fractional Shares)
MOHAWK/DAL-TILE MERGER CASH
NEWS CORPORATION
NOKIA CORPORATION
NORTEL NETWORKS CORP
OFFICEMAX INC.
PFIZER INC.
PLANTRONICS, INC.
QUANTA SERVICES, INC.
RAINBOW MEDIA GROUP
SCHERING-PLOUGH CORP
Shares
Sold
14,000
11,000
31,000
33,765
19,000
29,000
35,000
19,000
15,000
15,000
37,000
45,000
11,000
29,000
29,000
43,000
80,000
12,000
14,000
11,000
16,000
55,000
41,000
15,000
21,000
4,180
0.2
58,000
87,000
19,000
185,000
15,000
15,000
14,000
14,000
35,000
Sale
Price
Amount
12.82
60.58
37.09
76.29
58.59
32.34
54.33
42.35
3.34
11.70
19.75
9.80
33.01
23.05
21.92
13.69
20.14
44.30
32.10
53.09
50.46
23.12
108.85
32.91
57.24
15.27
28.20
18.08
7.85
3.08
39.93
20.30
13.98
19.95
36.93
179,464.60
666,429.80
1,149,743.50
2,575,795.10
1,113,286.00
937,764.30
1,901,532.40
804,588.60
50,104.50
175,503.00
730,799.50
440,811.00
363,136.40
668,566.00
635,633.60
588,719.00
1,611,408.50
531,659.70
449,400.00
584,008.70
807,398.40
1,271,654.50
4,463,026.20
493,698.00
1,202,019.00
63,844.48
1,635,828.40
1,572,957.20
149,150.00
569,698.51
598,906.50
304,460.10
195,694.04
279,305.60
1,292,575.80
Commission
+ SEC Fee
Page 47
705.99
572.22
1,567.25
1,755.89
37.11
1,478.23
778.54
974.23
751.51
5.86
24.37
2,264.70
562.11
22.29
1,469.14
2,165.39
1,853.72
7.99
714.98
569.47
812.12
42.40
2,177.93
766.46
1,068.04
2.13
2,933.94
4,385.60
954.98
9,269.11
769.97
760.17
702.96
709.32
1,793.10
Net Amount
178,758.61
665,857.58
1,148,176.25
2,574,039.21
1,113,248.89
936,286.07
1,900,753.86
803,614.37
49,352.99
175,497.14
730,775.13
438,546.30
362,574.29
668,543.71
634,164.46
586,553.61
1,609,554.78
531,651.71
448,685.02
583,439.23
806,586.28
1,271,612.10
4,460,848.27
492,931.54
1,200,950.96
63,842.35
1,632,894.46
1,568,571.60
148,195.02
560,429.40
598,136.53
303,699.93
194,991.08
278,596.28
1,290,782.70
Book Cost
702,056.60
711,026.39
1,083,822.41
792,105.20
737,340.14
1,162,315.50
1,730,555.99
769,792.29
368,755.05
333,346.50
320,846.46
3,126,229.40
632,261.15
1,380,089.56
1,683,906.50
485,357.31
1,445,951.00
239,853.11
914,021.20
289,263.21
163,164.49
1,191,572.91
1,177,848.25
343,426.45
1,561,303.00
133,783.82
1,258,212.58
1,564,224.38
299,416.88
2,544,169.95
361,673.03
414,683.23
475,131.20
223,129.22
597,413.25
Gain (Loss)
on Sale
60,740.54
(523,297.99)
(45,168.81)
64,353.84
1,781,934.01
375,908.75
(226,029.43)
170,197.87
33,822.08
(319,402.06)
(157,849.36)
30.65
409,928.67
(2,687,683.10)
(269,686.86)
(711,545.85)
(1,049,742.04)
101,196.30
163,603.78
291,798.60
(465,336.18)
294,176.02
643,421.79
80,039.19
3,283,000.02
149,505.09
(360,352.04)
(69,941.47)
11.71
154,000.00
374,681.88
4,347.22
(151,221.86)
(1,983,740.55)
236,463.50
(110,983.30)
(280,140.12)
55,467.06
693,369.45
% Gain
on Sale
0.00%
-74.54%
-6.35%
5.94%
224.96%
50.98%
-19.45%
9.83%
4.39%
-86.62%
-47.35%
0.00%
127.76%
-85.97%
-42.65%
-51.56%
-62.34%
20.85%
11.31%
121.66%
-50.91%
101.70%
394.34%
6.72%
278.73%
43.53%
-23.08%
-52.28%
0.00%
0.00%
29.78%
0.28%
-50.51%
-77.97%
65.38%
-26.76%
-58.96%
24.86%
116.06%
STATE OF ARIZONA
ELECTED OFFICIALS' RETIREMENT PLAN
SALES AND REDEMPTION OF INVESTMENTS
JULY 1, 2001 THROUGH JUNE 30, 2002
Page 2 of 2
COMMON STOCK SOLD
Company
SEITEL, INC
SUN MICROSYSTEMS, INC
TARGET CORP
WILLIAMS COMMUNICATIONS GROUP
WORLDCOM INC.
TOTAL STOCK SOLD
Shares
Sold
28,000
29,000
13,000
36,186
67,500
1,300,631
Sale
Price
5.53
17.08
31.46
2.13
10.37
Commission
+ SEC Fee
Amount
Net Amount
Book Cost
Gain (Loss)
on Sale
% Gain
on Sale
154,729.85
495,322.90
408,929.30
77,138.41
700,197.75
1,402.55
1,466.52
663.64
1,811.89
918.57
153,327.30
493,856.38
408,265.66
75,326.52
699,279.18
523,473.17
1,197,633.46
373,689.19
154,760.93
2,135,059.77
(370,145.87)
(703,777.08)
34,576.47
(79,434.41)
(1,435,780.59)
-70.71%
-58.76%
9.25%
-51.33%
-67.25%
32,894,889.14
51,692.39
32,843,196.75
35,602,664.13
(2,544,684.48)
-7.15%
Page 48
STATE OF ARIZONA
ELECTED OFFICIALS' RETIREMENT PLAN
SALES AND REDEMPTIONS OF INVESTMENTS
JULY 1, 2001 THROUGH JUNE 30, 2002
OTHER INVESTMENTS SOLD
Name
Capital
Gains (Loss)
Coupon
Maturity
Book Cost
12.500
13.000
12.750
14.000
12.000
1/5/2001
8/3/2001
6/30/2002
9/15/2001
11/11/2001
61,500.00
46,000.00
6,195.00
19,937.00
1,267.66
-
133,632.00
1,267.66
BRIDGE FINANCIAL
BRIDGE FINANCIAL-15 E. MONROE
BRIDGE FINANCIAL-BEAVER CREEK
BRIDGE FINANCIAL-DYNAMITE MTN. RANCH
BRIDGE FINANCIAL-LAKE PLEASANT
BRIDGE FINANCIAL-VILLAGE AT HASSAYAMPA
TOTAL BRIDGE FINANCIAL SOLD
PIVOTAL
PIVOTAL PROMONTORY
PIVOTAL PROMONTORY-LOANS
TOTAL PIVOTAL SOLD
247,500.00
360,000.00
-
607,500.00
-
DESERT TROON
DESERT TROON EQUITY-LA JOLLA
DESERT TROON EQUITY-TORREON
TOTAL DESERT TROON SOLD
760,000.00
-
96,292.40
1,381.06
760,000.00
97,673.46
MISCELLANEOUS
PEBBLECREEK PROPERTIES
10.000
TOTAL MISCELLANEOUS SOLD
TOTAL OTHER INVESTMENTS SOLD
4/1/2005
253,059.10
-
253,059.10
-
1,754,191.10
Page 49
98,941.12
STATE OF ARIZONA
ELECTED OFFICIALS' RETIREMENT PLAN
INVESTMENTS OWNED
JUNE 30, 2002
Page 1 of 3
BOND PORTFOLIO
Par Value
Security
Coupon
Maturity
Book Cost
Book
Current
Price
Price
Current Value
Gain or
Annual
Book
(Loss)
Income
Yield
YTM
U.S. TREASURY OBLIGATIONS
1,000,000
2,000,000
1,000,000
1,000,000
5,000,000.00
U.S. TREASURY BOND
U.S. TREASURY BOND
U.S. TREASURY BOND
U.S. TREASURY BOND
7.500
9.125
9.000
8.000
11/15/2016
5/15/2018
11/15/2018
11/15/2021
TOTAL U.S. TREASURY OBLIGATIONS
965,760.55
2,000,000.00
1,000,000.00
1,000,000.00
96.57606
100.00000
100.00000
100.00000
4,965,760.55
99.31521
120.34400
138.21900
137.31300
127.90600
1,203,440.00
2,764,380.00
1,373,130.00
1,279,060.00
237,679.45
764,380.00
373,130.00
279,060.00
75,000.00
182,500.00
90,000.00
80,000.00
7.77
9.13
9.00
8.00
6,620,010.00
1,654,249.45
427,500.00
8.61
1,801.00
35,209.61
27,102.07
112,965.74
341,021.33
120,796.49
125,037.73
59,081.19
70,543.96
27,916.26
224,353.24
24,299.26
39,560.72
67,876.52
21,925.24
30,122.82
121,426.92
48,926.22
55,754.15
49,054.38
53,626.08
44,710.32
34,763.33
80,500.25
33,198.55
48,482.80
22,138.08
503,043.35
394,023.54
1,859,664.45
498,302.54
203,535.91
1,262.14
4,153.63
3,521.21
18,130.16
33,785.70
14,702.78
16,758.55
6,789.82
8,946.33
3,132.89
32,069.92
3,477.21
5,554.21
7,858.17
2,938.60
3,552.68
17,838.39
7,049.09
7,243.84
5,873.47
6,420.88
5,992.45
5,677.65
9,638.61
5,534.87
6,203.95
1,926.38
31,751.88
39,697.29
192,510.85
33,326.90
18,178.31
145.50
2,882.41
2,209.27
9,208.58
27,798.89
9,846.92
10,192.65
4,816.10
5,803.12
2,275.64
18,288.51
1,998.92
3,224.85
5,533.06
1,787.27
2,668.69
9,898.31
3,988.30
4,544.89
3,998.75
4,371.41
3,644.63
2,833.79
6,562.10
2,706.23
3,988.31
1,819.05
35,446.56
26,425.53
124,720.01
37,256.26
16,028.38
5.45
5.50
5.52
5.63
5.52
FEDERAL AGENCY OBLIGATIONS
1,711.78
32,026.79
24,547.42
102,317.55
308,876.55
109,410.17
113,251.63
53,512.18
64,479.06
25,284.86
203,205.63
22,210.17
35,831.71
61,478.46
19,858.56
26,686.88
109,981.18
44,314.42
50,498.75
44,430.50
48,571.27
40,495.91
31,486.53
72,912.27
30,069.24
44,314.57
20,211.70
472,620.75
377,507.58
1,781,714.44
465,703.31
188,569.17
GNMA Pool #007766
GNMA Pool #143093
GNMA Pool #148408
GNMA Pool #157733
GNMA Pool #158992
GNMA Pool #163336
GNMA Pool #165863
GNMA Pool #168530
GNMA Pool #181945
GNMA Pool #182127
GNMA Pool #207671
GNMA Pool #208705
GNMA Pool #227210
GNMA Pool #229798
GNMA Pool #230557
GNMA Pool #234695
GNMA Pool #235280
GNMA Pool #247096
GNMA Pool #247310
GNMA Pool #250933
GNMA Pool #251643
GNMA Pool #252138
GNMA Pool #252306
GNMA Pool #252538
GNMA Pool #255161
GNMA Pool #262845
GNMA Pool #305689
GNMA Pool #377589
GNMA Pool #390014
GNMA Pool #391992
GNMA Pool #398831
GNMA Pool #403979
8.500
9.000
9.000
9.000
9.000
9.000
9.000
9.000
9.000
9.000
9.000
9.000
9.000
9.000
9.000
10.000
9.000
9.000
9.000
9.000
9.000
9.000
9.000
9.000
9.000
9.000
9.000
7.500
7.000
7.000
8.000
8.500
2/15/2006
6/15/2016
5/15/2016
5/15/2016
6/15/2016
7/15/2016
8/15/2016
8/15/2016
4/15/2020
11/15/2016
7/15/2018
5/15/2020
9/15/2017
10/15/2017
4/15/2018
12/15/2017
4/15/2018
5/15/2018
4/15/2018
6/15/2018
4/15/2018
10/15/2018
4/15/2018
5/15/2018
3/15/2019
3/15/2020
4/15/2021
8/15/2025
6/15/2024
3/15/2024
8/15/2026
10/15/2024
538.86
31,055.98
23,580.86
94,835.58
307,235.63
106,093.71
108,279.18
52,291.37
61,597.63
24,783.37
192,283.32
20,822.05
34,006.51
60,018.35
18,986.64
26,570.14
103,588.53
41,877.13
48,510.31
43,180.91
47,205.20
38,717.87
29,085.68
70,861.64
27,663.68
42,278.85
20,211.70
471,291.47
354,326.25
1,667,153.60
464,975.64
185,357.60
31.47951
96.96876
96.06248
92.68750
99.46875
96.96878
95.60938
97.71863
95.53122
98.01664
94.62500
93.75007
94.90619
97.62501
95.60935
99.56256
94.18751
94.50001
96.06240
97.18754
97.18749
95.60933
92.37499
97.18754
91.99993
95.40621
100.00000
99.71874
93.85937
93.57019
99.84375
98.29687
Page 50
105.21200
109.93800
110.40700
110.40700
110.40700
110.40700
110.40700
110.40700
109.40600
110.40700
110.40700
109.40600
110.40700
110.40700
110.40700
112.87500
110.40700
110.40700
110.40700
110.40700
110.40700
110.40700
110.40700
110.40700
110.40700
109.40600
109.53100
106.43700
104.37500
104.37500
107.00000
107.93700
27.00
9.28
9.37
9.71
9.05
9.28
9.41
9.21
9.42
9.18
9.51
9.60
9.48
9.22
9.41
10.04
9.56
9.52
9.37
9.26
9.26
9.41
9.74
9.26
9.78
9.43
9.00
7.52
7.46
7.48
8.01
8.65
3.68
3.84
3.84
3.84
3.84
3.84
3.84
3.84
3.84
3.84
3.84
3.84
3.84
3.84
3.84
8.86
3.84
3.84
3.84
3.84
3.84
3.84
3.84
3.84
3.84
3.84
3.84
4.10
5.28
5.28
3.62
3.68
STATE OF ARIZONA
ELECTED OFFICIALS' RETIREMENT PLAN
INVESTMENTS OWNED
JUNE 30, 2002
Page 2 of 3
BOND PORTFOLIO
Par Value
276,867.49
581,059.05
426,947.81
1,568,877.46
122,543.50
812,028.23
476,738.72
1,221,938.82
540,547.24
1,871,668.19
1,413,410.75
1,764,884.35
619,299.15
1,877,064.63
3,144,804.16
2,258,469.29
1,760,605.72
2,994,185.73
998,532.26
29,758,563.54
Security
GNMA Pool #406811
GNMA Pool #427558
GNMA Pool #432701
GNMA Pool #434237
GNMA Pool #439645
GNMA Pool #441619
GNMA Pool #458918
GNMA Pool #472997
GNMA Pool #486761
GNMA Pool #499907
GNMA Pool #507496
GNMA Pool #510958
GNMA Pool #513367
GNMA Pool #530611
GNMA Pool #530631
GNMA Pool #539629
GNMA Pool #548963
GNMA Pool #552514
GNMA Pool #780220
Coupon
7.500
7.500
8.000
6.000
8.000
7.500
7.000
7.000
7.000
7.000
7.000
7.000
7.000
6.500
6.500
6.500
6.500
6.500
7.500
Maturity
1/15/2026
4/15/2026
6/15/2026
3/15/2029
9/15/2026
11/15/2029
8/15/2028
6/15/2029
12/15/2028
5/15/2029
6/15/2029
5/15/2029
8/15/2029
5/15/2031
6/15/2031
4/15/2031
3/15/2031
4/15/2032
8/15/2025
Book Cost
276,521.44
579,334.04
426,947.81
1,452,927.58
122,466.92
808,856.24
468,097.83
1,215,447.26
529,905.21
1,794,169.43
1,370,125.05
1,752,199.24
592,978.92
1,875,451.53
3,130,800.36
2,250,000.03
1,756,204.20
2,983,893.21
998,220.20
Current
Price
Price
99.87501
99.70313
100.00000
92.60937
99.93751
99.60937
98.18750
99.46875
98.03125
95.85938
96.93750
99.28125
95.75000
99.91406
99.55470
99.62500
99.75000
99.65625
99.96875
29,203,811.74
TOTAL FEDERAL AGENCY OBLIGATIONS
Book
106.43700
106.28100
107.00000
100.28100
107.00000
105.46900
103.93700
103.81200
104.11000
104.06800
103.81200
103.81200
104.06800
102.00000
102.00000
102.00000
102.00000
102.00000
106.39000
98.13582
Current Value
Gain or
Annual
Book
(Loss)
Income
Yield
294,689.45
617,555.37
456,834.16
1,573,286.01
131,121.55
856,438.05
495,507.92
1,268,519.13
562,763.73
1,947,807.65
1,467,289.97
1,832,161.74
644,492.24
1,914,605.92
3,207,700.24
2,303,638.68
1,795,817.83
3,054,069.44
1,062,338.47
18,168.01
38,221.33
29,886.35
120,358.43
8,654.63
47,581.81
27,410.09
53,071.87
32,858.52
153,638.22
97,164.92
79,962.50
51,513.32
39,154.39
76,899.88
53,638.65
39,613.63
70,176.23
64,118.27
20,765.06
43,579.43
34,155.82
94,132.65
9,803.48
60,902.12
33,371.71
85,535.72
37,838.31
131,016.77
98,938.75
123,541.90
43,350.94
122,009.20
204,412.27
146,800.50
114,439.37
194,622.07
74,889.92
7.51
7.52
8.00
6.48
8.01
7.53
7.13
7.04
7.14
7.30
7.22
7.05
7.31
6.51
6.53
6.52
6.52
6.52
7.50
30,867,401.60
1,663,589.86
2,071,018.88
7.09
81,700.00
116,250.00
247,500.00
41,750.00
32,500.00
2,433.21
80,000.00
80,900.00
38,555.00
86,250.00
83,430.00
39,750.00
46,875.00
95,000.00
36,250.00
76,250.00
71,000.00
72,680.00
33,000.00
8.03
8.16
8.51
8.23
7.46
6.40
7.80
8.09
7.75
9.29
7.92
8.77
8.34
9.50
7.13
8.53
7.80
8.09
7.20
YTM
4.10
4.10
3.62
6.06
3.62
4.10
5.28
5.28
5.28
5.28
5.28
5.28
5.28
5.95
5.95
5.95
5.95
5.95
4.10
CORPORATE BONDS
1,000,000.00
1,500,000.00
2,750,000.00
500,000.00
500,000.00
38,018.85
1,000,000.00
1,000,000.00
500,000.00
1,000,000.00
1,000,000.00
500,000.00
500,000.00
1,000,000.00
500,000.00
1,000,000.00
1,000,000.00
920,000.00
500,000.00
AGL CAPITAL TRUST
8.170
AMERICAN UNITED LIFE INS CO
7.750
ANTHEM INSURANCE COMPANY INC
9.000
AT&T CORPORATES
8.350
AT&T CORPORATES
6.500
AUTO BOND RECEIVABLE TRUST
6.400
BANC ONE CORP
8.000
BANKERS TRUST CORP 144A
8.090
DELTA AIRLINES SERIES 01-1B
7.711
FARMERS INSURANCE EXCHANGE
8.625
FIRST HAWAIIAN CAPITAL TRUST
8.343
FIRST UNION CAPITAL II
7.950
FORD HOLDINGS INC
9.375
FORD MOTOR COMPANY
9.500
FORD MOTOR CREDIT
7.250
GENERAL AMERICAN LIFE INSURANCE CO7.625
GOODRICH CORPORATION
7.100
GTE CORPORATION
7.900
HUNTINGTON BANKS SUB NTS
6.600
6/1/2037
3/30/2026
4/1/2027
1/15/2025
3/15/2029
4/15/2001
4/29/2027
12/1/2026
9/18/2011
5/1/2024
7/1/2027
11/15/2029
3/1/2020
9/15/2011
10/25/2011
1/15/2024
11/15/2027
2/1/2027
6/15/2018
1,017,704.12
1,423,922.73
2,907,159.67
507,104.49
435,848.95
38,018.85
1,025,190.26
1,000,000.00
497,648.89
928,680.84
1,052,895.96
453,169.83
561,847.00
999,622.17
508,732.04
894,186.05
910,102.27
898,562.48
458,452.82
101.77041
94.92818
105.71490
101.42090
87.16979
100.00000
102.51903
100.00000
99.52978
92.86808
105.28960
90.63397
112.36940
99.96222
101.74641
89.41861
91.01023
97.66983
91.69056
Page 51
97.72500
87.70200
111.00900
76.17700
65.13900
99.87500
112.09300
104.01700
103.85400
93.52400
105.69400
107.82600
114.09800
113.07200
99.93700
103.25400
94.56000
94.97300
97.26200
977,250.00
1,315,530.00
3,052,747.50
380,885.00
325,695.00
37,971.33
1,120,930.00
1,040,170.00
519,270.00
935,240.00
1,056,940.00
539,130.00
570,490.00
1,130,720.00
499,685.00
1,032,540.00
945,600.00
873,751.60
486,310.00
(40,454.12)
(108,392.73)
145,587.83
(126,219.49)
(110,153.95)
(47.52)
95,739.74
40,170.00
21,621.11
6,559.16
4,044.04
85,960.17
8,643.00
131,097.83
(9,047.04)
138,353.95
35,497.73
(24,810.88)
27,857.18
8.37
9.01
7.98
11.29
10.39
6.97
7.72
7.12
9.32
7.82
7.29
7.88
7.48
7.26
7.32
7.59
8.39
6.88
STATE OF ARIZONA
ELECTED OFFICIALS' RETIREMENT PLAN
INVESTMENTS OWNED
JUNE 30, 2002
Page 3 of 3
BOND PORTFOLIO
Par Value
2,000,000.00
1,000,000.00
2,000,000.00
1,000,000.00
1,000,000.00
3,000,000.00
1,000,000.00
2,000,000.00
927,506.67
1,000,000.00
1,000,000.00
1,000,000.00
1,500,000.00
1,000,000.00
1,000,000.00
1,000,000.00
727,490.88
1,000,000.00
1,000,000.00
627,000.00
1,000,000.00
500,000.00
1,000,000.00
1,000,000.00
1,000,000.00
Security
Coupon
JOHN HANCOCK MUTUAL LIFE INS CO
JPM CAPITAL TRUST II
KEY CORP CAPITAL III
LEHMAN BROTHERS HOLDINGS INC
LIBERTY MUTUAL INSURANCE
LUMBERMANS MUTUAL CASUALTY CO
MERRILL LYNCH & COMPANY
NATIONWIDE MUTUAL INS CO
NORTHWEST AIRLINES
PMI CAPITAL
PRINCIPAL MUTUAL LIFE INSURANCE CO
ROCKWELL INTERNATIONAL
SAFECO CAPITAL TRUST
SEARS ROEBUCK & CO.
SECURITY MUTUAL LIFE NEW YORK
SECURITY NATIONAL MORTGAGE 99-1
SECURITY NATIONAL MORTGAGE LOAN
SOUTHERN COMPANY CAPITAL TRUST
STANDARD CHARTERED BANK
UNION CARBIDE CORP
UNION CENTRAL LIFE
US WEST COMMUNICATIONS
USF&G CAPITAL II, SERIES B
WORLDCOM INC.
ZURICH CAPITAL TRUST I
7.375
7.950
7.750
8.800
7.875
9.150
8.000
7.500
7.935
8.309
7.875
6.700
8.072
9.375
9.375
8.353
7.870
8.190
8.000
7.875
8.200
7.500
8.470
8.250
8.376
Maturity
2/15/2024
2/1/2027
7/15/2029
3/1/2015
10/15/2026
7/1/2026
6/1/2007
2/15/2024
4/1/2019
2/1/2027
3/1/2024
1/15/2028
7/15/2037
11/1/2011
12/15/2016
9/25/2030
8/25/2030
2/1/2037
5/30/2031
4/1/2023
11/1/2026
6/15/2023
1/10/2027
5/15/2031
6/1/2037
Book Cost
1,887,045.31
1,040,641.26
1,911,172.09
1,093,791.06
941,690.64
3,412,662.00
1,000,000.00
1,903,828.61
1,012,880.48
1,028,796.97
956,864.54
911,104.15
1,509,228.49
1,000,000.00
1,098,869.73
1,000,000.00
727,490.88
1,073,834.32
1,045,339.80
606,254.19
1,010,951.76
477,466.55
1,094,590.00
1,020,971.26
1,012,878.52
Book
Current
Price
Price
94.35227
104.06413
95.55860
109.37911
94.16906
113.75540
100.00000
95.19143
109.20466
102.87970
95.68645
91.11042
100.61523
100.00000
109.88697
100.00000
100.00000
107.38343
104.53398
96.69126
101.09518
95.49331
109.45900
102.09713
101.28785
104.45500
103.46200
99.60300
117.21200
91.95800
90.88100
112.28000
96.35200
105.92500
93.08300
103.70100
95.48100
94.86000
119.05300
102.40000
102.68000
105.98400
101.93000
102.61100
98.08200
100.80300
70.19000
100.50500
15.75000
94.67700
Gain or
Annual
Book
(Loss)
Income
Yield
2,089,100.00
1,034,620.00
1,992,060.00
1,172,120.00
919,580.00
2,726,430.00
1,122,800.00
1,927,040.00
982,461.44
930,830.00
1,037,010.00
954,810.00
1,422,900.00
1,190,530.00
1,024,000.00
1,026,800.00
771,023.93
1,019,300.00
1,026,110.00
614,974.14
1,008,030.00
350,950.00
1,005,050.00
157,500.00
946,770.00
202,054.69
(6,021.26)
80,887.91
78,328.94
(22,110.64)
(686,232.00)
122,800.00
23,211.39
(30,419.04)
(97,966.97)
80,145.46
43,705.85
(86,328.49)
190,530.00
(74,869.73)
26,800.00
43,533.05
(54,534.32)
(19,229.80)
8,719.95
(2,921.76)
(126,516.55)
(89,540.00)
(863,471.26)
(66,108.52)
147,500.00
79,500.00
155,000.00
88,000.00
78,750.00
274,500.00
80,000.00
150,000.00
73,597.65
83,090.00
78,750.00
67,000.00
121,080.00
93,750.00
93,750.00
83,530.00
57,253.53
81,900.00
80,000.00
49,376.25
82,000.00
37,500.00
84,700.00
82,500.00
83,760.00
7.82
7.64
8.11
8.05
8.36
8.04
8.00
7.88
7.27
8.08
8.23
7.35
8.02
9.38
8.53
8.35
7.87
7.63
7.65
8.14
8.11
7.85
7.74
8.08
8.27
6.97
7.64
7.79
6.74
8.67
10.17
5.18
7.85
7.32
9.01
7.53
7.09
8.54
6.64
9.07
8.11
7.37
8.02
7.77
8.07
8.12
11.22
8.42
52.38
8.87
Current Value
YTM
45,990,016.40
TOTAL CORPORATE BONDS
46,297,202.03
100.66794
45,293,654.94
(1,003,547.09)
3,748,860.64
8.10
8.15
80,748,579.94
BOND PORTFOLIO TOTALS
80,466,774.32
99.65101
82,781,066.54
2,314,292.22
6,247,379.52
7.76
6.88
Page 52
STATE OF ARIZONA
ELECTED OFFICIALS' RETIREMENT PLAN
INVESTMENTS OWNED
JUNE 30, 2002
CORPORATE NOTES
Date
Acquired
6/24/2002
6/28/2002
6/26/2002
6/27/2002
6/24/2002
6/25/2002
6/25/2002
6/27/2002
Description
TRANSAMERICA ASSET FUNDING
EMINENT FUNDING
NEPTUNE FUNDING
STARBIRD FUNDING CORPORATION
BEETHOVEN FUNDING CORPORATION
WORLD OMNI VEHICLE LEASING
THUNDER BAY FUNDING
THREE CROWNS FUNDING
Interest
Rate
Maturity
Date
1.810
2.100
1.860
1.930
1.830
1.840
1.820
1.850
7/1/2002
7/1/2002
7/2/2002
7/2/2002
7/8/2002
7/9/2002
7/9/2002
7/10/2002
TOTALS
Page 53
Cost
Amount of
Interest
Maturity
Value
2,499,120.14
499,912.50
499,845.00
1,999,463.89
2,498,220.83
999,284.44
999,292.22
499,665.97
879.86
87.50
155.00
536.11
1,779.17
715.56
707.78
334.03
2,500,000.00
500,000.00
500,000.00
2,000,000.00
2,500,000.00
1,000,000.00
1,000,000.00
500,000.00
10,494,804.99
5,195.01
10,500,000.00
STATE OF ARIZONA
ELECTED OFFICIALS' RETIREMENT PLAN
INVESTMENTS OWNED
JUNE 30, 2002
Page 1 of 3
COMMON STOCK PORTFOLIO
Shares
74,000
52,000
14,000
63,000
37,000
59,000
82,000
11,000
89,000
48,000
85,800
216,000
29,000
110,000
55,000
65,000
82,000
25,000
14,000
38,666
222,000
138,833
143,000
15,000
185,500
108,000
40,000
117,000
88,000
131,928
29,000
11,000
15,000
29,000
42,000
14,000
107,000
Description
ABBOTT LABORATORIES
ADOBE SYSTEMS
ALBERTO CULVER CO
ALLSTATE CORPORATION
ALLTEL CORPORATION
AMERICAN EXPRESS
AMERICAN INT'L GROUP
AMERICAN STANDARD COMPANY INC
AMGEN
ANALOG DEVICES, INC.
APACHE CORPORATION
APPLIED MATERIALS
BIOGEN INC
BJ SERVICES COMPANY
BJ'S WHOLESALE CLUB, INC.
BROADWING INC.
CABLEVISION SYSTEMS CORP
CANADIAN NATIONAL RAILWAY
CHEVRONTEXACO CORP
CHOICEPOINT INCORPORATED
CISCO SYSTEMS
CITIGROUP, INC.
COMCAST CORP.
CONSTELLATION ENERGY GROUP INC
COVAD COMMUNICATIONS GROUP
CYTYC CORPORATION
ELECTRONICS BOUTIQUE HOLDINGS CORP.
EMC CORP
EXPRESS SCRIPTS
EXXON MOBIL CORP
FLEETBOSTON FINANCIAL CORPORATION
FORTUNE BRANDS, INC.
GENENTECH, INC.
GENZYME CORPORATION
GLOBALSANTAFE CORP
HEALTHSOUTH CORP
HOME DEPOT
Div
Rate
0.94
0.05
0.36
0.84
1.36
0.32
0.19
0.40
0.55
2.80
0.72
0.96
0.92
1.40
1.00
0.13
0.20
Book Cost
per Share
11.3534
34.2924
54.3177
22.2783
64.6388
34.9620
23.4594
76.5643
38.8074
77.9262
48.4493
8.7613
49.4445
38.0749
40.5154
24.5837
44.9040
47.1626
83.6971
39.3995
8.6715
43.1824
32.4440
43.8045
42.1745
16.7000
36.7441
11.2874
19.9878
31.4279
37.8054
52.2001
45.0459
57.5882
34.5314
15.0274
10.1978
Book Cost
840,149.75
1,783,207.10
760,447.26
1,403,533.34
2,391,634.21
2,062,758.79
1,923,667.30
842,207.68
3,453,856.43
3,740,455.90
4,156,953.00
1,892,430.00
1,433,889.25
4,188,241.00
2,228,346.10
1,597,938.55
3,682,129.50
1,179,064.40
1,171,759.20
1,523,421.20
1,925,078.75
5,995,141.68
4,639,486.28
657,067.50
7,823,364.85
1,803,602.40
1,469,763.76
1,320,623.39
1,758,922.85
4,146,224.99
1,096,357.40
574,201.10
675,688.50
1,670,056.65
1,450,316.80
210,383.60
1,091,162.52
Page 54
Market
Price
37.6500
28.5000
47.8000
36.9800
47.0000
36.3200
68.2300
75.1000
41.8800
29.7000
57.4800
19.0200
41.4300
33.8800
38.5000
2.6000
9.4600
51.8000
88.5000
45.4700
13.9500
38.7500
23.8400
29.3400
1.1800
7.6200
29.3000
7.5500
50.1100
40.9200
32.3500
56.0000
33.5000
19.2400
27.3500
12.7900
36.7300
Market Value
2,786,100.00
1,482,000.00
669,200.00
2,329,740.00
1,739,000.00
2,142,880.00
5,594,860.00
826,100.00
3,727,320.00
1,425,600.00
4,931,784.00
4,108,320.00
1,201,470.00
3,726,800.00
2,117,500.00
169,000.00
775,720.00
1,295,000.00
1,239,000.00
1,758,143.02
3,096,900.00
5,379,778.75
3,409,120.00
440,100.00
218,890.00
822,960.00
1,172,000.00
883,350.00
4,409,680.00
5,398,493.76
938,150.00
616,000.00
502,500.00
557,960.00
1,148,700.00
179,060.00
3,930,110.00
Annual
Income
69,560.00
2,600.00
5,040.00
52,920.00
50,320.00
18,880.00
15,580.00
34,320.00
13,750.00
39,200.00
99,959.76
14,400.00
121,373.76
40,600.00
11,000.00
5,460.00
21,400.00
Gain or (Loss)
Amount
1,945,950.25
(301,207.10)
(91,247.26)
926,206.66
(652,634.21)
80,121.21
3,671,192.70
(16,107.68)
273,463.57
(2,314,855.90)
774,831.00
2,215,890.00
(232,419.25)
(461,441.00)
(110,846.10)
(1,428,938.55)
(2,906,409.50)
115,935.60
67,240.80
234,721.82
1,171,821.25
(615,362.93)
(1,230,366.28)
(216,967.50)
(7,604,474.85)
(980,642.40)
(297,763.76)
(437,273.39)
2,650,757.15
1,252,268.77
(158,207.40)
41,798.90
(173,188.50)
(1,112,096.65)
(301,616.80)
(31,323.60)
2,838,947.48
STATE OF ARIZONA
ELECTED OFFICIALS' RETIREMENT PLAN
INVESTMENTS OWNED
JUNE 30, 2002
Page 2 of 3
COMMON STOCK PORTFOLIO
Shares
117,000
29,000
59,000
22,000
81,000
14,000
60,000
44,000
29,000
6,800
25,000
37,000
97,000
120,750
27,000
21,000
74,000
14,098
29,000
44,000
26,000
18,000
51,000
29,000
88,000
13,000
36,000
71,500
30,000
51,000
15,000
11,000
120,000
164,000
83,000
50,500
14,000
Description
Div
Rate
INTEL CORPORATION
0.08
INTERNATIONAL BUSINESS MACH.
0.60
JABIL CIRCUIT
JACOBS ENGINEERING GROUP INC.
JDS UNIPHASE CORPORATION
JOHNSON & JOHNSON CO
0.82
JP MORGAN CHASE & CO
1.36
KIMBERLY-CLARK CORPORATION
1.20
KINDER MORGAN, INC.
0.20
LANDSTAR SYSTEMS, INC
LENNAR CORPORATION
0.05
LEXMARK INTERNATIONAL GROUP
LSI LOGIC
MBNA CORP
0.28
MEDIMMUNE, INC.
MICROCHIP TECHNOLOGY INC.
MICROSOFT CORPORATION
MOHAWK INDUSTRIES
MOODY'S CORPORATION
0.18
NABORS INDUSTRIES, LTD
NATIONAL-OILWELL, INC.
NEWS CORPORATION
0.05
NOBLE CORPORATION
OXFORD HEALTH PLANS, INC.
P.F. CHANG'S CHINA BISTRO
PACTIV CORPORATION
PEPSICO INC.
0.60
PFIZER INC.
0.52
PHARMACEUTICAL PRODUCT DEVELOPMENT, INCPLANTRONICS, INC.
QUALCOMM INCORPORATED
QUEST DIAGNOSTIC
SAFEWAY INC
SANMINA CORP.
SCHOLASTIC CORPORATION
SCP POOL CORPORATION
SEARS, ROEBUCK AND COMPANY
0.92
Book Cost
per Share
21.6650
28.7280
22.8951
30.2330
71.3331
53.8504
52.0203
52.0765
54.0719
105.5385
43.6233
74.3478
37.8078
11.6355
58.2863
25.8575
78.7175
71.0444
35.8629
54.5717
38.4161
21.6933
44.8905
26.9898
26.6868
15.9962
48.6453
27.6574
24.0344
27.6455
45.6952
87.0809
32.1511
26.3013
26.1145
26.9079
56.3685
Book Cost
2,534,800.53
833,112.19
1,350,810.68
665,126.40
5,777,980.25
753,905.60
3,121,220.00
2,291,364.27
1,568,085.80
717,661.60
1,090,583.40
2,750,867.20
3,667,355.00
1,404,991.51
1,573,731.00
543,008.00
5,825,098.10
1,001,584.30
1,040,025.07
2,401,155.17
998,819.20
390,479.77
2,289,416.04
782,702.80
2,348,438.34
207,950.10
1,751,229.57
1,977,505.76
721,032.30
1,409,922.97
685,428.00
957,889.90
3,858,130.50
4,313,410.36
2,167,501.80
1,358,846.62
789,158.88
Page 55
Market
Price
18.2700
72.0000
21.1100
34.7800
2.6700
52.2600
33.9200
62.0000
38.0200
106.8500
61.2000
54.4000
8.7500
33.0700
26.4000
27.4300
54.7000
61.5300
49.7500
35.3000
21.0500
22.9300
38.6000
46.4600
31.4200
23.8000
48.2000
35.0000
26.3400
19.0100
27.4900
86.0500
29.1900
6.3100
37.9000
27.7600
54.3000
Market Value
2,137,590.00
2,088,000.00
1,245,490.00
765,160.00
216,270.00
731,640.00
2,035,200.00
2,728,000.00
1,102,580.00
726,580.00
1,530,000.00
2,012,800.00
848,750.00
3,993,202.50
712,800.00
576,030.00
4,047,800.00
867,449.94
1,442,750.00
1,553,200.00
547,300.00
412,740.00
1,968,600.00
1,347,340.00
2,764,960.00
309,400.00
1,735,200.00
2,502,500.00
790,200.00
969,510.00
412,350.00
946,550.00
3,502,800.00
1,034,840.00
3,145,700.00
1,401,880.00
760,200.00
Annual
Income
9,360.00
17,400.00
11,480.00
81,600.00
52,800.00
5,800.00
1,250.00
33,810.00
5,220.00
900.00
21,600.00
37,180.00
12,880.00
Gain or (Loss)
Amount
(397,210.53)
1,254,887.81
(105,320.68)
100,033.60
(5,561,710.25)
(22,265.60)
(1,086,020.00)
436,635.73
(465,505.80)
8,918.40
439,416.60
(738,067.20)
(2,818,605.00)
2,588,210.99
(860,931.00)
33,022.00
(1,777,298.10)
(134,134.36)
402,724.93
(847,955.17)
(451,519.20)
22,260.23
(320,816.04)
564,637.20
416,521.66
101,449.90
(16,029.57)
524,994.24
69,167.70
(440,412.97)
(273,078.00)
(11,339.90)
(355,330.50)
(3,278,570.36)
978,198.20
43,033.38
(28,958.88)
STATE OF ARIZONA
ELECTED OFFICIALS' RETIREMENT PLAN
INVESTMENTS OWNED
JUNE 30, 2002
Page 3 of 3
COMMON STOCK PORTFOLIO
Shares
51,000
37,000
44,000
89,000
43,000
22,000
158,000
40,000
59,000
33,000
37,000
145,480
9,000
13,000
73,000
149,000
47,000
52,000
14,000
7,000
44,000
37,000
Description
SEI INVESTMENTS COMPANY
SEITEL, INC
SIEBEL SYSTEMS
SOLECTRON
SPRINT CORPORATION (PCS GROUP)
ST. JUDE MEDICAL
SYMANTEC CORPORATION
T. ROWE PRICE GROUP INC
TARGET CORP
TENET HEALTHCARE CORPORATION
TXU CORP
TYCO INTERNATIONAL LTD.
UNITED RENTALS, INC
VALERO ENERGY CORPORATION
VISHAY INTERTECHNOLOGY INC
VODAFONE GROUP PLC
WALGREEN COMPANY
WAL-MART STORES
WATERS CORPORATION
WHIRLPOOL CORP
WILLIAMS COMPANIES, INC.
WORLDCOM INC.
COMMON STOCK PORTFOLIO TOTALS
Div
Rate
0.12
0.64
0.24
2.40
0.05
0.40
0.22
0.15
0.30
1.36
0.80
-
Book Cost
per Share
39.3668
18.6955
34.8956
42.7172
26.7177
81.5652
25.1844
39.5794
28.7453
46.5472
41.1039
32.2399
21.7481
50.0294
26.0956
20.7764
14.9566
54.1842
34.2985
77.5316
39.3771
31.6305
Book Cost
2,007,704.40
691,732.40
1,535,404.60
3,801,831.20
1,148,860.80
1,794,435.30
3,979,131.40
1,583,176.90
1,695,974.03
1,536,056.60
1,520,844.71
4,690,260.12
195,732.90
650,382.20
1,904,976.40
3,095,682.56
702,958.99
2,817,577.20
480,179.00
542,720.92
1,732,593.36
1,170,329.06
187,762,407.01
Page 56
Market
Price
28.1700
1.0000
14.2200
6.1500
4.4700
73.8500
32.8500
32.8800
38.1000
71.5500
51.5500
13.5100
21.8000
37.4200
22.0000
13.6500
38.6300
55.0100
26.7000
65.3600
5.9900
0.8300
Market Value
Annual
Income
Gain or (Loss)
Amount
1,436,670.00
37,000.00
625,680.00
547,350.00
192,210.00
1,624,700.00
5,190,300.00
1,315,200.00
2,247,900.00
2,361,150.00
1,907,350.00
1,965,434.80
196,200.00
486,460.00
1,606,000.00
2,033,850.00
1,815,610.00
2,860,520.00
373,800.00
457,520.00
263,560.00
30,710.00
6,120.00
25,600.00
14,160.00
88,800.00
7,274.00
5,200.00
32,780.00
7,050.00
15,600.00
9,520.00
35,200.00
-
(571,034.40)
(654,732.40)
(909,724.60)
(3,254,481.20)
(956,650.80)
(169,735.30)
1,211,168.60
(267,976.90)
551,925.97
825,093.40
386,505.29
(2,724,825.32)
467.10
(163,922.20)
(298,976.40)
(1,061,832.56)
1,112,651.01
42,942.80
(106,379.00)
(85,200.92)
(1,469,033.36)
(1,139,619.06)
162,637,826.77
1,154,947.52
(25,124,580.24)
STATE OF ARIZONA
ELECTED OFFICIALS' RETIREMENT PLAN
INVESTMENTS OWNED
JUNE 30, 2002
OTHER INVESTMENTS PORTFOLIO
Security
Coupon
Maturity
Book Cost
Current
Value
Gain or
Loss
Annual
Income
Book
Yield
BRIDGE FINANCIAL LOANS
BRIDGE FINANCIAL--Dynamite Mtn. Ranch
BRIDGE FINANCIAL--Grand Inn
12.750 6/30/2002
12.500 9/25/2000
133,805.00
110,000.00
133,805.00
110,000.00
-
17,060.14 12.8%
13,750.00 12.5%
243,805.00
243,805.00
-
30,810.14 12.6%
10,000.00
10,000.00
10,000.00
10,000.00
-
1,000.00 10.0%
253,805.00
253,805.00
-
31,810.14 12.5%
Desert Troon, LLC
Pivotal X, LLC
1,240,000.00
6,118,425.00
1,240,000.00
6,118,425.00
TOTAL LLC
7,358,425.00
7,358,425.00
TOTAL OTHER INVESTMENTS
7,612,230.00
7,612,230.00
TOTAL BRIDGE FINANCIAL LOANS
MISCELLANEOUS
PEBBLECREEK PROPERTIES
10.000
4/1/2005
TOTAL MISCELLANEOUS
TOTAL BEFORE LLC
LLC
Page 57
1,000.00 10.0%
Page 58
ACTUARIAL SECTION
ELECTED OFFICIALS’ RETIREMENT PLAN
TWENTY-FIRST COMPREHENSIVE ANNUAL FINANCIAL REPORT
FOR THE FISCAL YEAR ENDED
JUNE 30, 2002
Actuarial Certification Statement
Aggregate Actuarial Balance Sheet, June 30, 2002
Summary of Valuation Methods and Assumptions
Solvency Test
Summary of Active Member Data
Summary of Inactive Member Data
Schedule of Retirants and Beneficiaries
Schedule of Experience Gain / (Loss)
August 28, 2002
The Fund Manager
Arizona Public Elected Officials’ Retirement Plan
1020 East Missouri
Phoenix, Arizona 85014-2613
Attention: Jack Cross, Administrator
The purpose of the annual actuarial valuations of the Arizona Elected Officials’
Retirement Plan is to determine the liabilities and funding requirements for the
participating groups. We certify that the June 30, 2002 annual actuarial valuations
were made in accordance with recognized actuarial methods.
Data for the annual valuations was fur nished by the Administrator and was checked
by us for internal completeness and year to year consistency, but was not otherwise
audited. The actuary prepared all of the schedules in the Actuarial Section and the
Schedule of Funding Progress in the Financial Section of the Comprehensive Annual
Financial Report.
The actuarial assumptions were adopted by the Fund Manager based upon the
recommendations of the actuary and the results of experience studies, the most recent
of which covered the 5 year period ended June 30, 1998. The assumptions and
methods conform to the parameters established in Governmental Accounting
Standards Board Statement 25. Actuarial gains (losses) are amortized as level
percents of payroll over 20 years.
The funding value of assets is a smoothed market value which spreads differences
between the actual and assumed investment return over a four year period.
On the basis of the June 30, 2002 valuation, it is our opinion that the liabilities of the
Retirement Plan are being funded as incurred in accordance with sound actuarial
principles. The excellent funded condition reflects the very favorable investment
returns experienced by the Retirement Plan earlier over the past decade.
Respectfully submitted,
Joseph A. Nichols/sig
Sandra W. Rodwan/sig
Joseph A. Nichols
Sandra W. Rodwan
Members, American Academy of Actuaries
STATE OF ARIZONA
ELECTED OFFICIALS' RETIREMENT PLAN
AGGREGATE ACTUARIAL BALANCE SHEET
JUNE 30, 2002
Actuarial Assets
Accrued Assets
Member Accumulated contributions
Employer and benefit payment reserves
Funding value adjustment
Total accrued assets*
$
Prospective assets (computed value)
Member contributions
Employer normal costs
Employer unfunded actuarial accrued liability
Total prospective assets
$
25,853,543
285,923,544
62,971,779
$
374,748,866
$
24,421,642
$
399,170,508
24,797,370
71,026,014
(71,401,742)
Total Actuarial Assets
*Includes $23,400,088 reserve for payment of ad-hoc pension increases. The net funding value of assets is
$351,348,778.
Actuarial Present Values (Liability)
Pensions in payment status
Service pensions
Disability pensions
Survivor pensions
Health insurance
Total Benefit values
$
132,335,855
8,234,335
24,099,960
9,909,871
$
Prospective pension payments (future retirements)
174,580,021
193,559,464
Prospective health insurance payments (future retirements)
6,861,483
Prospective refunds of member contributions
769,452
Reserve for future pension increases
$
23,400,088
Total Actuarial Present Values (Liability)
$
399,170,508
Page 62
SUMMARY OF PLAN PROVISIONS
See Note 1 in the Notes to Financial Statements.
SUMMARY OF VALUATION METHODS
Normal Cost. Normal cost and the allocation of actuarial present values between service rendered before and after the
valuation date were determined using an individual entry age actuarial cost method having the following characteristics:
v
The annual normal costs for each individual active member, payable from date of hire to date of retirement, are
sufficient to accumulate the value of the member’s benefit at the time of retirement;
v
Each annual normal cost is a constant percentage of the member’s year-by-year projected covered pay.
Actuarial Accrued Liability. The actuarial accrued liability allocated to service rendered prior to the valuation date,
including experience gains and losses, was computed using the assumptions summarized in this report. Accrued
valuation assets were subtracted from the computed actuarial accrued liability. Any unfunded amount was amortized
as level percent of payroll over an open period of 20 years. If accrued valuation assets exceed the actuarial accrued
liability, the excess is amortized over an open period of 20 years and applied as a credit to reduce the normal cost
which otherwise would be payable.
Active member payroll was assumed to increase % annually for the purpose of computing the amortization payment
(credit) as a level percent of payroll.
SUMMARY OF VALUATION ASSUMPTIONS
Economic Assumptions:
The rate of investment return used was 9.0 percent a year, compounded annually. The assumption consists of
3.5% for assuming maturity and principal risks and 5.5% in recognition of inflation. These components, adopted by
the Fund Manager, as recommended by the Plan’s actuary, were first used for the June 30, 1989 annual valuation.
This assumption is used to discount the value of future payments.
The rates of salary increase used are in accordance with the following table. The assumption is used to project
current salaries to those upon which pension amounts will be based. These components, adopted by the Fund
Manager, as recommended by the Plan’s actuary, were first used for the June 30, 1989 annual valuation.
Sample
Ages
Percent Increase in Salary During Following Year
Inflation
Other
Total
20
25
30
35
40
5.50%
5.50%
5.50%
5.50%
5.50%
1.5%
1.5%
1.5%
1.5%
1.5%
7.00%
7.00%
7.00%
7.00%
7.00%
45
50
55
60
65
5.50%
5.50%
5.50%
5.50%
5.50%
1.5%
1.5%
1.5%
1.5%
1.5%
7.00%
7.00%
7.00%
7.00%
7.00%
Page 63
Demographic Assumptions:
v Non-Disability Mortality rates: 1971 Group Annuity Mortality Table Projected to 2000 (Male), female ages
set back six years (first used for June 30, 1999 valuation).
v Disability Mortality Rates: 1971 Group Annuity Mortality Table Projected to 1984 (Male), female ages set
back six years.
Non-Disability Table
Sample
Ages
Present Value of $100
Monthly For Life
Men
Women
Single Life Retirement Values
Disability Table
Non-Disability Table
Present Value of
$100 Monthly For Life
Men
Women
20
25
30
35
40
$12,930
$13,272
$12,861
45
50
55
60
65
12,522
11,997
11,342
10,513
9,490
12,997
12,613
12,112
11,485
10,694
70
75
80
85
90
8,326
7,124
5,879
4,791
3,864
9,710
8,564
7,371
6,120
4,994
Future Life
Expectancy (Years)
Men
Women
Disability Table
Future Life
Expectancy (Years)
Men
Women
$13,225
56.86
51.98
47.12
42.29
37.51
62.72
57.83
52.95
48.09
43.25
55.98
51.12
46.27
41.46
36.69
61.84
56.96
52.09
47.24
42.42
12,430
11,879
11,199
10,346
9,308
12,933
12,526
11,999
11,347
10,532
32.80
28.28
23.98
19.90
16.09
38.46
33.73
29.17
24.82
20.70
32.01
27.53
23.28
19.27
15.55
37.64
32.93
28.40
24.11
20.05
8,145
6,963
5,748
4,696
3,796
9,530
8,382
7,206
5,983
4,893
12.69
9.82
7.39
5.57
4.19
16.82
13.32
10.36
7.83
5.89
12.25
9.49
7.17
5.43
4.10
16.27
12.87
10.02
7.59
5.74
Termination of Employment: Service-related rates for first five years of employment and age-related rates after first
five years of employment. The sample rates are as follows:
Percent of Active Members
Sample
Ages
Years of
Service
All
0
1
2
3
4
25
30
35
40
45
50
55
60
5 and over
Separating Within the Year
8.0%
8.0
8.0
8.0
8.0
Disabled Within the Year
(all years of service)
6.0
6.0
6.0
6.0
0.04%
0.04
0.04
0.10
6.0
6.0
6.0
6.0
0.13
0.25
0.45
0.71
Retirement Rates: Age-related rates based on the following schedule:
Page 64
Percent of Active Members Retiring within Year
Following Attainment of Indicated Retirement Age
Age
Percent of Active Members
Retiring During Next Year
45 to 54
8%
55 to 59
5
60
61
62
63
64
15
10
25
15
10
65
66
67
69
69
70
20
20
20
20
20
100
Active members with at least 40 years of service are assumed to retire within the year. Members who do not acquire
20 years of service prior to age 62 are assumed to retire upon first eligibility following attainment of age 62.
These rates adopted by the Fund Manager, as recommended by the Plan’s actuary, were first used for the June 30,
1999 valuation.
Page 65
STATE OF ARIZONA
ELECTED OFFICIALS' RETIREMENT PLAN
SOLVENCY TEST
SOLVENCY TEST – Testing the financial solvency of a retirement plan can be done in several ways. The funding objective
is to meet long-term benefit promises through contributions that remain approximately level from year to year as a percent
of member payroll. If the contributions to the plan are level in concept and soundly executed, and if the plan continues its
present operations pattern for the indefinite future, the plan will pay all promised benefits when due—the ultimate test of
financial soundness.
A short term solvency test is one means of checking a plan's progress under its funding program. In a short term solvency
test, the plan's present assets (cash and investments) are compared with:
1. Active member contributions on deposit;
2. The liabilities for future benefits to present retired lives;
3. The liabilities for service already rendered by active members.
In a plan that has been following the discipline of level percent of payroll financing, the liabilities for active member
contributions on deposit (liability 1) and the liabilities for future benefits to present retired lives (liability 2) will be fully
covered by present assets (except in rare circumstances). In addition, the liabilities for service already rendered by active
members (liability 3) will be partially covered by the remainder of present assets. Generally, if the plan has been using level
cost financing, the funded portion of liability 3 will increase over time. Liability 3 being fully funded is very rare. All amounts
presented are in thousands.
Valuation
Date
6-30-85
6-30-86
6-30-87
6-30-88
6-30-89
6-30-90
6-30-91
6-30-92
6-30-93
6-30-94
6-30-95
6-30-96
6-30-97
6-30-98
6-30-99
6-30-00
6-30-01
6-30-02
*3
1
1
*1
*1
*1
*1
*
1
1
*
*
Aggregate Accrued Liabilities for
(3)
Active
(1)
(2)
Members
Active
Retirants
(Employer
Member
And
Financed
Contributions Beneficiaries
Portion)
$
$
$
$
$
$
$
$
$
$
$
$
$
$
$
$
$
$
5,583
6,268
6,866
8,258
9,120
10,772
11,876
13,232
13,308
14,978
15,731
16,931
17,979
20,703
21,506
24,038
24,061
25,854
$
$
$
$
$
$
$
$
$
$
$
$
$
$
$
$
$
$
16,396
19,653
23,660
25,046
34,565
38,246
44,222
47,775
61,992
63,403
73,797
78,507
86,361
91,187
109,582
126,895
151,590
174,580
$
$
$
$
$
$
$
$
$
$
$
$
$
$
$
$
$
$
26,990
27,506
36,116
44,604
47,266
51,415
53,552
54,091
52,178
59,941
59,838
62,688
65,253
87,772
96,013
102,545
75,336
79,513
See notes on page 25.
Page 66
Valuation
Assets
Available for
Benefits (2)
$
$
$
$
$
$
$
$
$
$
$
$
$
$
$
$
$
$
49,900
58,757
65,856
73,993
84,316
92,748
103,570
115,869
127,984
140,145
159,111
181,754
214,035
241,885
283,337
329,777
355,768
351,349
Portion of Accrued Liabilites
Covered by Net Assets
Available for Benefits
(1)
100.0%
100.0%
100.0%
100.0%
100.0%
100.0%
100.0%
100.0%
100.0%
100.0%
100.0%
100.0%
100.0%
100.0%
100.0%
100.0%
100.0%
100.0%
(2)
100.0%
100.0%
100.0%
100.0%
100.0%
100.0%
100.0%
100.0%
100.0%
100.0%
100.0%
100.0%
100.0%
100.0%
100.0%
100.0%
100.0%
100.0%
(3)
100.0%
100.0%
83.8%
91.2%
86.0%
85.1%
88.6%
100.0%
100.0%
100.0%
100.0%
100.0%
100.0%
100.0%
100.0%
100.0%
100.0%
100.0%
STATE OF ARIZONA
ELECTED OFFICIALS' RETIREMENT PLAN
SUMMARY OF ACTIVE MEMBER DATA
Listed below is a summary of Active Members by age group, years of service and annual compensation. The summary points
out that there were 738 active members in the Plan as of June 30, 2002, compared to 737 for the prior year.
Attained
Age
0-4
Years of Service to Valuation Date
10 - 14
15 - 19
20 - 24
25 - 29
5-9
20 - 24
25 - 29
30 - 34
35 - 39
40 - 44
45 - 49
50 - 54
55 - 59
60 - 69
70 - 79
80+
1
4
10
18
36
66
64
43
44
6
2
1
5
5
22
52
53
43
39
5
3
6
19
27
37
19
6
2
4
26
10
17
3
2
6
5
15
1
Totals
294
225
117
62
29
30 Plus
1
1
5
2
1
1
10
1
Totals
Valuation
No.
Payroll
1
5
15
26
66
143
178
139
139
23
3
$
47,900
$
51,600
$
456,697
$ 1,611,466
$ 4,278,212
$ 10,307,049
$ 13,670,162
$ 9,881,412
$ 7,659,869
$
751,242
$
13,580
738
$ 48,729,189
Listed below is a Comparative Schedule of the changes in active members since 6-30-82:
COMPARATIVE SCHEDULE
Averages*
Fiscal
Year
Ended
6-30-82
6-30-83
6-30-84
** 6-30-85
6-30-86
6-30-87
*** 6-30-88
6-30-89
6-30-90
6-30-91
6-30-92
6-30-93
6-30-94
6-30-95
6-30-96
6-30-97
6-30-98
6-30-99
6-30-00
6-30-01
6-30-02
Active
Members
379
372
372
525
517
526
583
596
624
671
658
713
710
725
684
726
713
709
720
737
738
Total
Payroll
(+000)
$
$
$
$
$
$
$
$
$
$
$
$
$
$
$
$
$
$
$
$
$
7,444
8,087
8,113
17,691
17,842
20,409
21,444
24,605
25,776
27,838
27,777
29,708
29,633
30,324
29,967
33,896
40,441
43,087
45,382
48,669
48,729
Age
(years)
Service
(years)
Pay
Increase
in Avg Pay
51.4
51.0
52.0
51.0
51.3
51.2
52.1
52.5
52.0
51.6
52.2
51.8
52.2
51.7
52.7
51.8
52.4
52.6
53.0
52.4
52.9
7.8
6.6
7.2
7.5
7.9
7.7
7.6
7.6
8.0
7.6
8.1
7.2
7.8
7.5
7.8
7.5
7.9
7.7
8.0
7.2
7.8
$19,641
$21,739
$21,809
$33,697
$34,511
$38,800
$36,782
$41,284
$41,308
$41,487
$42,214
$41,666
$41,737
$41,826
$43,811
$46,689
$56,719
$60,772
$63,031
$66,037
$66,028
10.7%
0.3%
54.5%
2.4%
12.4%
-5.2%
12.2%
0.1%
0.4%
1.8%
-1.3%
0.2%
0.2%
4.7%
6.6%
21.5%
7.1%
3.7%
4.8%
0.0%
* Group averages are not used in the actuarial computations but are computed and shown because of their
general interest.
** Reflects the 1985 amendment consolidating the Judges' Retirement System and the Elected Officials'
Retirement Plan.
*** Includes participating municipalities pursuant to a 1987 amendment beginning with the June 30, 1988,
valuation.
Page 67
STATE OF ARIZONA
ELECTED OFFICIALS' RETIREMENT PLAN
SUMMARY OF INACTIVE MEMBER DATA
SCHEDULE OF RETIRANTS AND BENEFICIARIES
As of June 30, 2002, there were 165 inactive members in the Plan who had not withdrawn their
accumulated member contributions. It is assumed that these inactive members are waiting to meet
the age requirements for service retirement. They are broken down by attained age and years of
service as follows:
INACTIVE MEMBERS
Attained
Age
0-4
20 - 29
30 - 39
40 - 44
45 - 49
50 - 54
55 - 59
60 - 69
70+
7
14
10
10
9
8
2
6
11
12
17
15
13
60
74
Totals
Years of Service to Valuation Date
5-9
10 - 14
15 - 19
20+
3
7
8
3
1
3
4
1
1
22
8
1
Totals
13
25
25
37
36
26
3
165
RETIRANTS AND BENEFICIARIES
Valuation
Date
Number
Removed
From Roles
Number
Added to
Roles
Totals
Annual
Pensions
Percent
Increase
6/30/1992
6/30/1993
6/30/1994
6/30/1995
6/30/1996
6/30/1997
6/30/1998
6/30/1999
6/30/2000
6/30/2001
6/30/2002
17
19
19
19
23
22
20
20
21
26
26
27
65
31
52
29
46
37
54
63
84
38
375
421
433
466
472
496
513
547
589
647
659
$ 5,980,662
$ 7,541,157
$ 7,936,942
$ 9,005,617
$ 9,567,636
$ 10,442,249
$ 11,143,500
$ 13,122,722
$ 15,096,774
$ 17,729,482
$ 19,606,416
8.1%
26.1%
5.2%
13.5%
6.2%
9.1%
6.7%
17.8%
15.0%
17.4%
10.6%
Page 68
Average
Pension
$
$
$
$
$
$
$
$
$
$
$
15,948
17,912
18,330
19,325
20,270
21,053
21,722
23,990
25,631
27,403
29,752
STATE OF ARIZONA
ELECTED OFFICIALS' RETIREMENT PLAN
SCHEDULE OF EXPERIENCE GAIN/(LOSS)
YEAR ENDED JUNE 30, 2002
DERIVATION
(1)
(2)
(3)
(4)
(5)
(6)
(7)
(8)
(9)
(10)
(11)
UAAL* at start of year
Normal cost for year
Funding Method Contribution
Interest accrued on (1), (2) and (3)
Expected UAAL before changes
[(1)+(2)-(3)+(4)]
Effect of assumption changes***
Effect of cost method changes
Expected UAAL after changes
Actual UAAL
Gain/(Loss) (9)-(10)
As % of AAL** at beginning of year
$
$
* Unfunded actuarial accrued liability
** Actuarial accrued liability
*** Estimated
Page 69
(104,780,547)
13,627,450
(7,252,336)
(9,143,369)
(107,548,802)
3,153,000
None
(104,395,802)
(71,401,742)
(32,994,060)
13.1%
Page 70
STATISTICAL SECTION
ELECTED OFFICIALS’ RETIREMENT PLAN
TWENTY-FIRST COMPREHENSIVE ANNUAL FINANCIAL REPORT
FOR THE FISCAL YEAR ENDED
JUNE 30, 2002
Schedule of Revenues by Source and Expenses by Type
Schedule of Benefit Expenses by Type
Summary of Retired Member and Survivor Data
Summary of Benefit Increases
Participating Employers
Summary of Growth of the Plan
STATE OF ARIZONA
ELECTED OFFICIALS’ RETIREMENT PLAN
SCHEDULE OF REVENUES BY SOURCE AND EXPENSES BY TYPE
REVENUES
Fiscal
Year
Member*
Contributions
Employer
Contributions
Percent of Annual
Covered Payroll
1993
$2,237,986
11%
$2,184,269
12%
$2,237,578
13%
$2,358,224
6%
$2,579,869
5%
$3,294,906
5%
$2,970,123
5%
$4,164,166
8%
$3,544,290
-6%
$3,595,732
-9%
$4,941,470
26%
$5,555,890
30%
$5,224,545
31%
$4,886,479
13%
$4,934,939
8%
$3,668,144
6%
$3,941,018
6%
$4,126,694
7%
$4,155,875
-7%
$3,656,604
-9%
16.55%
1994
1995
1996
1997
1998
1999
2000
2001
2002
EXPENSES
15.62%
16.01%
15.76%
14.76%
12.64%
8.90%
10.22%
8.94%
6.97%
Net
Investment
Income**
Total
$12,082,441
63%
$10,926,793
58%
$9,446,871
56%
$31,728,664
81%
$51,065,604
87%
$54,378,360
89%
$53,424,808
89%
$46,966,837
85%
($67,059,808)
113%
($48,685,392)
118%
$19,261,897
100%
$18,666,952
100%
$16,908,994
100%
$38,973,367
100%
$58,580,412
100%
$61,341,410
100%
$60,335,949
100%
$55,257,697
100%
($59,359,642)
100%
($41,433,056)
100%
FYE
Benefits
Administrative
Expenses***
Refunds
Total
1993
$6,986,604
94%
$7,877,312
98%
$8,718,621
97%
$9,448,702
98%
$10,177,471
98%
$10,963,879
99%
$11,991,654
98%
$14,347,496
98%
$16,802,302
99%
$19,529,287
100%
$66,053
1%
$65,965
1%
$73,903
1%
$52,053
1%
$50,643
0%
$59,967
1%
$60,307
0%
$59,577
0%
$58,796
0%
$70,983
0%
$346,352
5%
$62,396
1%
$197,465
2%
$105,309
1%
$193,296
2%
$30,960
0%
$168,690
2%
$182,114
2%
$133,561
1%
($6,518)
0%
$7,399,009
100%
$8,005,673
100%
$8,989,989
100%
$9,606,064
100%
$10,421,410
100%
$11,054,806
100%
$12,220,651
100%
$14,589,187
100%
$16,994,660
100%
$19,593,752
100%
1994
1995
1996
1997
1998
1999
2000
2001
2002
NOTE:
*The member contribution rate is 7% of covered payroll.
**Prior to fiscal year 1996, Investment Income included only realized gains and losses. See Note 2.
***Prior to fiscal year 1996, Investment Expenses were not broken out from Administrative and Investment
Expenses. However, for the fiscal years 1996, 1997, 1998, 1999, 2000 and 2001, Investment Expenses were
$22,642, $22,269, $19,556, $22,122, $23,133 and $27,164, respectively. These amounts are now shown net in
Investment Income as opposed to inclusion with Administrative Expenses as in prior reports.
Page 73
STATE OF ARIZONA
ELECTED OFFICIALS’ RETIREMENT PLAN
SCHEDULE OF BENEFIT EXPENSES BY TYPE
Fiscal
Year
Normal
Benefits
Disability
Benefits
Survivor
Benefits
Insurance
Benefits
1987
$2,176,893
78%
$2,409,666
79%
$2,958,726
80%
$3,727,158
81%
$4,148,012
80%
$4,825,146
81%
$5,756,503
82%
$6,399,006
81%
$6,947,365
80%
$7,526,049
80%
$8,074,010
80%
$8,593,838
78%
$9,265,167
77%
$10,966,775
76%
$13,051,530
78%
$14,747,855
75%
$199,226
7%
$227,055
7%
$253,715
7%
$282,133
6%
$350,850
7%
$318,524
6%
$326,01
85%
$443,818
6%
$523,623
6%
$597,617
6%
$546,535
5%
$625,855
6%
$698,545
6%
$657,755
5%
$752,464
4%
$788,587
4%
$404,621
15%
$436,170
14%
$482,157
13%
$557,753
12%
$607,950
11%
$668,752
11%
$762,516
11%
$878,193
11%
$1,081,329
12%
$1,154,800
12%
$1,350,387
13%
$1,516,198
14%
$1,786,989
15%
$2,459,882
17%
$2,680,089
16%
$3,079,725
16%
-
1988
1989
1990
1991
1992
1993
1994
1995
1996
1997
1998
1999
2000
2001
2002
Page 74
$10,369
1%
$90,400
2%
$124,846
2%
$141,567
2%
$156,295
2%
$166,304
2%
$170,236
2%
$206,539
2%
$227,988
2%
$240,953
2%
$263,084
2%
$318,219
2%
$913,120
5%
Totals
$2,780,740
100%
$3,072,891
100%
$3,694,598
100%
$4,577,413
100%
$5,197,212
100%
$5,937,268
100%
$6,986,604
100%
$7,877,312
100%
$8,718,621
100%
$9,448,702
100%
$10,177,471
100%
$10,963,879
100%
$11,991,654
100%
$14,347,496
100%
$16,802,302
100%
$19,529,287
100%
STATE OF ARIZONA
ELECTED OFFICIALS' RETIREMENT PLAN
SUMMARY OF RETIRED MEMBER AND SURVIVOR DATA
The following summary presents an analysis of the benefit changes that have taken place during the past 16
years. The number of retired members and the amount of annual pensions has increased at compounded
annual rates of 5.8% and 13.4% over the last five years.
COMPARATIVE SCHEDULE
Year Ended
June 30
Normal
1982
1983
1984
1985
1986
1987
1988
1989
1990
1991
1992
1993
1994
1995
1996
1997
1998
1999
2000
2001
2002
150
168
175
196
206
225
232
267
272
293
301
342
346
368
368
382
386
408
444
495
500
Retired
Disability Survivors
Totals
9
13
14
47
51
50
52
56
61
62
66
69
75
82
89
101
109
123
130
136
141
4
5
6
7
9
10
10
8
10
12
16
15
13
18
16
15
16
18
Annual
Pensions
159
181
189
247
262
281
291
332
343
365
375
421
433
466
472
496
513
547
589
647
659
$
$
$
$
$
$
$
$
$
$
$
$
$
$
$
$
$
$
$
$
$
844,914
1,011,021
1,120,441
2,142,900
2,564,083
3,056,235
3,238,986
4,236,583
4,830,530
5,532,233
5,980,662
7,541,157
7,936,942
9,005,617
9,567,636
10,442,249
11,143,500
13,122,722
15,096,774
17,729,482
19,606,416
Ratio of
Active to
Retired
Average
Pension
$
$
$
$
$
$
$
$
$
$
$
$
$
$
$
$
$
$
$
$
$
5,314
5,586
5,928
8,676
9,787
10,876
11,131
12,761
14,083
15,157
15,948
17,912
18,330
19,325
20,270
21,053
21,722
23,990
25,631
27,403
29,752
2.4 to 1
2.1 to 1
2.0 to 1
2.1 to 1
2.0 to 1
1.9 to 1
2.0 to 1
1.8 to 1
1.8 to 1
1.8 to 1
1.8 to 1
1.7 to 1
1.6 to 1
1.6 to 1
1.4 to 1
1.5 to 1
1.4 to 1
1.3 to 1
1.2 to 1
1.1 to 1
0 to 1
Set forth below is a summary of pensions being paid to retired members and survivors:
SUMMARY OF RETIRED MEMBERS AND SURVIVORS - JUNE 30, 2002
Pensions Being Paid
Annual
Pensions
Number
Retired Members - Service Pensions
- Disability Pensions
Average
Pensions
500
18
$
$
15,460,464
958,728
$
$
30,921
53,263
518
$
16,419,192
$
31,697
140
1
$
$
3,157,884
29,340
$
$
22,556
29,340
Totals
141
$
3,187,224
$
22,604
Total Pensions Being Paid
659
$
19,606,416
$
29,752
Totals
Survivors of Members - Spouses
- Children with Guardians*
*Does not include pensions payable to children whose parent is being paid a survivor pension
Normal retired members
Disability retired members
Spouse beneficiaries
Average
Age
Average
Service (yrs)
Average Age at
Retirement (yrs)
70.9
63.2
73.8
15.8
12.7
14.1
62.9
56.2
59.3
Page 75
STATE OF ARIZONA
ELECTED OFFICIALS’ RETIREMENT PLAN
SUMMARY OF BENEFIT INCREASES
State law provides for an annual benefit increase for retirees or their survivors who are over age sixty-five on
the effective day of the increase and for disability retirees regardless of age. These increases are dependent
upon the production of excess earnings on part of the assets of the Plan and are limited to four percent of the
average benefit being paid to retirees and their survivors. This program expired after the July 1,1994 increase.
The following schedule summarizes the statutorily-designed process of calculating the monthly benefit
increases effective each July 1st and the increases granted:
BENEFIT INCREASE SCHEDULE
Fiscal
Year
Ended
6/30/1989
6/30/1990
Excess
Yield per
Statute*
3.62%
$ 34,564,836
Investment earnings on balance
Amount utilized:
7-1-90 increase
0.44%
Excess
Earnings
Monthly
Benefit
Increase
Fundable
Maximum
per
Statutory
4% Cap***
Lesser of Two
Increase
Awarded
$ 1,251,247
118,118
(888,720)
5.0%
4.0%
4.0%
4.0%
4.0%
4.0%
2.0%
4.0%
2.0%
3.5%
4.0%
3.5%
2.0%
4.0%
2.0%
Excess
Earnings
Assets**
$
38,245,692
$
Amount available: 7-1-91 increase
Investment earnings on balance
Amount utilized:
7-1-91 increase
6/30/1991
2.60%
$
44,222,354
648,926
75,275
(1,143,432)
$ 1,149,781
Amount available: 7-1-92 increase
Investment earnings on balance
Amount utilized:
7-1-92 increase
6/30/1992
2.43%
$
47,775,043
730,550
83,502
(610,536)
$ 1,160,934
Amount available: 7-1-93 increase
Investment earnings on balance
Amount utilized:
7-1-93 increase
6/30/1993
1.31%
$
60,856,776
Amount available: 7-1-94 increase
Investment earnings on balance
Amount utilized:
7-1-94 increase
168,281
1,364,450
140,675
(1,167,612)
$
797,224
1,134,737
95,999
(868,428)
Page 76
STATE OF ARIZONA
ELECTED OFFICIALS’ RETIREMENT PLAN
SUMMARY OF BENEFIT INCREASES
During the 1996 legislative session, House Bill 2483 was passed and approved by the Governor on April 17,
1996. This bill reinstated this program but with two new limits. The first limit is a 3% maximum. The second
limit is 1/2 of the percentage change in the all items component of the Consumer Price Index for all urban
consumers as published by the United States Department of Labor, Bureau of Labor Statistics, for the calendar
year preceding the year for which the increase is being computed. This bill also lowered the age requirement
to 55. There were no excess earnings in fiscal year 1994/1995 so the first increase was based on excess
earnings for fiscal year 1995/1996 and was effective in July of 1997. Below is a schedule showing the
calculation process.
BENEFIT INCREASE SCHEDULE
Fiscal
Year
Ended
6/30/1996
6/30/1997
6/30/1998
Excess
Yield per
Statute*
Maximum
per
Statutory
4% Cap***
Lesser
of Two
Increase
Awarded
$ 1,347,878
1,347,878
1.5%
1.7%
1.5%
4.5%
1.2%
1.2%
34.5%
4.0%
4.0%
38.5%
4.0%
4.0%
37.5%
4.0%
4.0%
23.0%
4.0%
4.0%
14.0%
4.0%
4.0%
Excess
Earnings
Assets**
1.75%
$ 77,021,628
Amount available: 7-1-97 increase
3.97%
Excess
Earnings
Monthly
Benefit
Increase
Fundable
$
84,334,344
$ 3,348,073
Investment earnings on balance
Amount utilized:
7-1-97 increase
174,820
(1,040,868)
Amount available: 7-1-98 increase
3,829,903
12.23%
$
88,885,855
$ 10,870,740
Investment earnings on balance
Amount utilized:
7-1-98 increase
Amount Transferred by HB 2496
Amount available: 7-1-99 increase
6/30/1999
6/30/2000
6/30/2001
6/30/2002
8.52%
$ 107,153,382
813,088
(888,283)
15,136,519
29,761,967
$ 9,129,468
Investment earnings on balance
Amount utilized:
7-1-99 increase
5,214,297
(3,623,737)
Amount available: 7-1-00 increase
40,481,995
4.20%
$ 124,211,100
$ 5,216,866
Investment earnings on balance
Amount utilized:
7-1-00 increase
5,343,623
(4,133,898)
Amount available: 7-1-01 increase
46,908,586
0.00%
$
-
$
-
Investment earnings on balance
Amount utilized:
7-1-01 increase
(7,953,820)
(4,518,604)
Amount available: 7-1-02 increase
34,436,162
0.00%
$
-
$
-
Investment earnings on balance
Amount utilized:
7-1-02 increase
(5,234,297)
(5,801,777)
Amount available: 7-1-03 increase
23,400,088
*Net effective yield less actuarial yield per statute of 9%. Beginning 6/30/98, total return less actuarial yield per statute of 9%.
** Amount equal to retired reserves.
***Prior to 7/1/99, maximum was the lower of 3% or 1/2 of CPI.
Page 77
STATE OF ARIZONA
ELECTED OFFICIALS’ RETIREMENT PLAN
PARTICIPATING EMPLOYERS
STATE OF ARIZONA
APACHE COUNTY
COCHISE COUNTY
COCONINO COUNTY
GILA COUNTY
GRAHAM COUNTY
GREENLEE COUNTY
LA PAZ COUNTY
MARICOPA COUNTY
MOHAVE COUNTY
NAVAJO COUNTY
PIMA COUNTY
PINAL COUNTY
SANTA CRUZ COUNTY
YAVAPAI COUNTY
YUMA COUNTY
CITY OF APACHE JUNCTION
CITY OF AVONDALE
CITY OF CHANDLER
CITY OF FLAGSTAFF
CITY OF GLENDALE
CITY OF GLOBE
CITY OF MESA
CITY OF PEORIA
CITY OF PHOENIX
CITY OF SAFFORD
CITY OF SCOTTSDALE
CITY OF SOUTH TUCSON
CITY OF TEMPE
CITY OF TOLLESON
CITY OF TUCSON
CITY OF YUMA
TOWN OF THATCHER
Page 78
STATE OF ARIZONA
ELECTED OFFICIALS’ RETIREMENT PLAN
SUMMARY OF GROWTH OF THE PLAN
FUND ASSETS, EARNINGS AND INVESTMENT YIELD
Listed below is a table setting forth the growth of the Plan in some of the major areas since it was
started July 1, 1981.
Total
Assets
at Book
Fiscal
Year
Assets
Transferred
1981-82
1982-83
1983-84
1984-85 1
1985-86
1986-87 2
1987-88 3
1988-89 4
1989-90 5
1990-91 6
1991-92 7
1992-93
1993-94
1994-95
1995-96
1996-97
1997-98
1998-99
1999-00
2000-01
2001-02
$
$
$
$
$
$
$
$
$
$
$
$
$
$
$
$
$
$
$
$
$
$
10,990,215
13,161,720
15,349,948
17,694,262
49,900,086
58,757,374
65,818,230
73,993,374
84,315,654
92,748,274
104,300,471
117,233,179
129,118,529
140,145,022
148,159,074
161,523,416
179,812,810
209,247,828
258,049,796
285,234,761
293,478,357
288,376,999
Realized
Earnings from
Investments
$
$
$
$
$
$
$
$
$
$
$
$
$
$
$
$
$
$
$
$
$
$
838,550
1,588,590
1,749,184
2,049,062
5,987,944
7,724,090
6,419,259
7,031,174
9,391,304
7,980,677
10,845,435
12,081,541
12,082,441
10,926,793
9,446,871
15,800,154
20,807,444
32,818,266
54,086,027
31,431,378
17,402,311
6,835,146
Assumed
Actuarial Yield
Net Effective
Yield
7.50%
8.50%
8.50%
9.00%
9.00%
9.00%
9.00%
9.00%
9.00%
9.00%
9.00%
9.00%
9.00%
9.00%
9.00%
9.00%
9.00%
9.00%
9.00%
9.00%
9.00%
9.00%
8.20%
13.96%
13.09%
13.23%
14.02%
15.32%
10.87%
10.60%
12.62%
9.44%
11.60%
11.54%
10.31%
8.46%
6.77%
10.75%
12.97%
18.41%
26.15%
12.27%
6.19%
2.37%
1. Reflects the 1985 amendment consolidating the Judges' Retirement Plan and the Elected Officials' Retirement Plan.
2. Reflects the 1987 amendment which increased the formula factor to 4% from 3-1/3%.
3. Reflects the 1988 amendment which bases the reduction for early retirement on the normal retirement age rather than age
65 and provided a 3% cost-of-living increase for retired members and survivors.
4.Reflects changes in the estimates of future experience (actuarial assumptions) and the 1989 amendment which provided a
3% increase in the pensions of retired members and survivors.
5. Includes the 1990 amendment which provides a subsidy for post-retirement health insurance, and a 3% increase in
pensions with effective dates between September 15, 1989, and September 15, 1990.
6. Includes the 1991 amendment which provides a 3% increase in pensions with effective dates between September 15, 1990,
and September 15, 1991, and the 1991 amendment increasing benefits for future duty-related deaths.
7. Includes the 1992 amendment which provides a 3% increase in pensions with effective dates between September 15, 1991,
and October 31, 1992.
Page 79


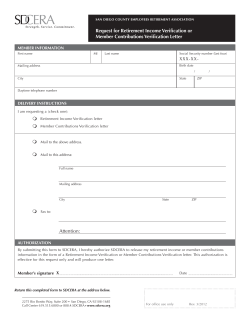


© Copyright 2026