
Document 253747
COVER SHEET
1 6 3 4 2
SEC Registration Number
S M
I N V E S T M E N T S
C O R P O R A T I ON
A N D
S U
B S I D I A R I E S
(Company’s Full Name)
1 0 t h
b o r
F l o o r ,
D r i v e ,
C B P - 1 A ,
O n e
M a l l
P a s a y
E - C o m
C e n t e r ,
o f
A s i a
C i t y
1 3 0 0
H a r
C o m p l e x ,
(Business Address: No. Street City/Town/Province)
Mr. Jose T. Sio
857-0100
(Contact Person)
(Company Telephone Number)
0 3
3 1
1 7 - Q
0 4
3 0
Month
Day
(Form Type)
Month
Day
(Fiscal Year)
(Annual Meeting)
(Secondary License Type, If Applicable)
Dept. Requiring this Doc.
Amended Articles Number/Section
Total Amount of Borrowings
Total No. of Stockholders
Domestic
Foreign
To be accomplished by SEC Personnel concerned
File Number
LCU
Document ID
Cashier
STAMPS
Remarks: Please use BLACK ink for scanning purposes.
SEC Number
PSE Disclosure Security Code
SM INVESTMENTS CORPORATION
(Company’s Full Name)
10th Floor, One E-Com Center, Harbor Drive,
Mall of Asia Complex, CBP-IA, Pasay City 1300
(Company’s Address)
857- 0100
(Telephone Number)
December 31
(Year Ending)
(month & day)
SEC Form 17-Q
1st Quarter Report
Form Type
Amendment Designation (If applicable)
March 31, 2014
Period Ended Date
(Secondary License Type and File Number)
16342
SECURITIES AND EXCHANGE COMMISSION
SEC FORM 17-Q
QUARTERLY REPORT PURSUANT TO SECTION 17 OF THE SECURITIES
REGULATION CODE AND SRC RULE 17(2)(b) THEREUNDER
1. For the quarterly period ended March 31, 2014
2. Commission Identification Number 016342 3. BIR Tax Identification No. 169-020000
4. Exact name of registrant as specified in its charter SM INVESTMENTS
CORPORATION
5. PHILIPPINES
Province, Country or other jurisdiction of incorporation or organization
6. Industry Classification Code:
(SEC Use Only)
7. 10th Floor, One E-Com Center, Harbor Drive, Mall of Asia Complex, CBP-IA,
Pasay City 1300
Address of principal office Postal Code
8. 857-0100
Registrant's telephone number, including area code
9. Former name, former address, and former fiscal year, if changed since last report.
10. Securities registered pursuant to Sections 8 and 12 of the Code, or Sections 4 and 8 of
the
RSA
Title of Each Class
of Common Stock
Outstanding
COMMON STOCK
P10 PAR VALUE
Number of Shares
Amount of Debt Outstanding
796,272,268
N.A.
11. Are any or all of these securities listed on the Philippine Stock Exchange.
Yes [X] No [ ]
12. Indicate by check mark whether the registrant:
(a) has filed all reports required to be filed by Section 11 of the Securities Regulation
Code (SRC)and SRC Rule 11(a)-1 thereunder and Sections 26 and 141 of The
Corporation Code of the Philippines during the preceding 12 months (or for such
shorter period that the registrant was required to file such reports);
Yes [X]
No [ ]
(b) has been subject to such filing requirements for the past 90 days.
Yes [X] No [ ]
TABLE OF CONTENTS
PART I – FINANCIAL INFORMATION
Item 1.
Consolidated Financial Statements
Consolidated Balance Sheets as of March 31, 2014 (Unaudited), December 31, 2013
(Audited)
Consolidated Statements of Income for the Three Months Ended March 31, 2014 and
2013 (Unaudited)
Consolidated Statements of Changes in Stockholders’ Equity for the Three Months
Ended March 31, 2014 and 2013 (Unaudited)
Consolidated Statements of Cash Flows for the Three Months Ended March 31, 2014
and 2013 (Unaudited)
Notes to Consolidated Financial Statements
Item 2.
Management’s Discussion and Analysis of Financial Condition as of
March 31, 2014 and December 31, 2013 and Results of Operations for the
Three Months ended March 31, 2014 and 2013
Item 3.
Aging of Accounts Receivable – Trade as of March 31, 2014
PART II – SIGNATURE
PART I
FINANCIAL INFORMATION
Item 1. Consolidated Financial Statements
SM INVESTMENTS CORPORATION AND SUBSIDIARIES
Consolidated Financial Statements
March 31, 2014 and December 31, 2013
and for the Three Months Ended March 31, 2014 and 2013
SM INVESTMENTS CORPORATION AND SUBSIDIARIES
CONSOLIDATED BALANCE SHEETS
(Amounts in Thousands)
March 31,
2014
(Unaudited)
December 31,
2013
(Audited)
ASSETS
Current Assets
Cash and cash equivalents (Notes 5, 24 and 25)
Time deposits and short-term investments (Notes 6, 24 and 25)
Investments held for trading and sale (Notes 7, 24 and 25)
Receivables (Notes 8, 24 and 25)
Merchandise inventories - at cost (Note 21)
Other current assets (Notes 9, 24 and 25)
Total Current Assets
P
= 37,189,870
28,289,770
2,139,741
30,341,919
13,552,140
40,051,323
151,564,763
P
=50,209,657
28,912,650
1,118,980
26,637,734
13,232,308
42,827,624
162,938,953
Noncurrent Assets
Available-for-sale investments (Notes 10, 24 and 25)
Investments in shares of stock of associates and joint ventures (Note 11)
Time deposits (Notes 6, 24 and 25)
Property and equipment (Note 12)
Investment properties (Notes 13 and 20)
Land and development (Note 14)
Intangibles (Note 15)
Deferred tax assets - net (Note 22)
Other noncurrent assets (Notes 15, 24 and 25)
Total Noncurrent Assets
16,840,422
140,463,864
27,337,150
18,496,200
196,671,843
24,626,259
20,832,179
2,452,895
29,760,445
477,481,257
16,499,092
138,994,366
27,080,950
18,323,380
192,609,189
25,666,930
20,255,055
2,172,799
28,453,455
470,055,216
P
= 629,046,020
P
=632,994,169
LIABILITIES AND EQUITY
Current Liabilities
Bank loans (Notes 16, 18, 24 and 25)
Accounts payable and other current liabilities (Notes 17, 24 and 25)
Income tax payable
Current portion of long-term debt (Notes 18, 24 and 25)
Dividends payable (Notes 24 and 25)
Total Current Liabilities
P
= 20,472,959
52,041,554
2,235,814
37,541,966
209,640
112,501,933
P
=27,588,259
68,088,327
1,612,784
34,566,619
210,189
132,066,178
Noncurrent Liabilities
Long-term debt - net of current portion (Notes 18, 24 and 25)
Deferred tax liabilities - net (Note 22)
Tenants’ deposits and others (Notes 15, 24 and 25)
Total Noncurrent Liabilities
Total Liabilities
177,317,836
7,814,882
19,229,626
204,362,344
316,864,277
175,589,418
6,970,527
18,127,198
200,687,143
332,753,321
7,962,723
57,799,360
(1,856,258)
(25,386)
1,289,414
(195,074)
8,385,099
7,962,723
57,799,360
(2,584,210)
(25,386)
1,233,177
(195,074)
7,338,500
27,000,000
127,144,538
227,504,416
84,677,327
312,181,743
27,000,000
120,904,727
219,433,817
80,807,031
300,240,848
P
= 629,046,020
P
=632,994,169
Equity Attributable to Owners of the Parent
Capital stock (Note 19)
Additional paid-in capital (Note 19)
Equity adjustments from common control transactions (Note 19)
Cost of Parent common shares held by subsidiaries (Note 19)
Cumulative translation adjustment
Remeasurement loss on defined benefit asset/obligation (Note 3)
Net unrealized gain on available-for-sale investments (Notes 10 and 11)
Retained earnings (Note 19):
Appropriated
Unappropriated
Total Equity Attributable to Owners of the Parent
Non-controlling Interests
Total Equity
See accompanying Notes to Consolidated Financial Statements.
SM INVESTMENTS CORPORATION AND SUBSIDIARIES
CONSOLIDATED STATEMENTS OF INCOME
(Amounts in Thousands, Except Per Share Data)
Three months ended March 31
2013
2014
(Unaudited)
(Unaudited)
REVENUE
Sales:
Merchandise
Real estate
Rent (Notes 13, 20 and 23)
Equity in net earnings of associates and joint ventures (Note 11)
Cinema ticket sales, amusement and others
Dividend, management fees and others
COST AND EXPENSES
Cost of sales:
Merchandise (Note 21)
Real estate
Selling, general and administrative expenses
OTHER INCOME (CHARGES)
Interest expense (Note 24)
Interest income
Gain (loss) on fair value changes on derivatives - net (Notes 18 and 25)
Foreign exchange gain and others (Note 24)
INCOME BEFORE INCOME TAX
PROVISION FOR INCOME TAX (Note 22)
Current
Deferred
NET INCOME
Attributable to
Owners of the Parent (Note 26)
Non-controlling interests
Earnings Per Common Share (Note 26)
Basic
See accompanying Notes to Consolidated Financial Statements.
P
= 42,174,625
5,116,461
7,707,521
3,116,466
1,445,848
835,785
60,396,706
P
=36,209,807
5,996,317
6,656,970
5,649,159
1,101,258
1,227,477
56,840,988
31,927,307
2,991,349
13,355,025
48,273,681
26,643,941
3,694,831
11,795,247
42,134,019
(2,540,720)
798,672
53,963
107,663
(1,580,422)
(2,845,525)
1,014,463
(1,310,743)
235,285
(2,906,520)
10,542,603
11,800,449
1,787,772
25,799
1,813,571
1,540,472
105,990
1,646,462
P
= 8,729,032
P
=10,153,987
P
= 6,239,811
2,489,221
P
= 8,729,032
P
=7,421,180
2,732,807
P
=10,153,987
P
=7.84
P
=9.50
SM INVESTMENTS CORPORATION AND SUBSIDIARIES
CONSOLIDATED STATEMENTS OF COMPREHENSIVE INCOME
(Amounts in Thousands)
Three months ended March 31
2013
2014
(Unaudited)
(Unaudited)
NET INCOME
OTHER COMPREHENSIVE INCOME (LOSS)
Items that will be reclassified to profit or loss in subsequent periods
Net unrealized gain on available-for-sale investments (Note 10)
Share in unrealized gain on available-for-sale investments of associates - net
(Notes 10 and 11)
Cumulative translation adjustment of a subsidiary
Actuarial losses (Note 3)
Income tax relating to items to be reclassified to profit or loss in subsequent
periods
TOTAL COMPREHENSIVE INCOME
Attributable to
Owners of the Parent
Non-controlling interests
See accompanying Notes to Consolidated Financial Statements.
P
=8,729,032
P
=10,153,987
1,852,186
1,186,668
317,486
56,237
–
4,853,881
(17,859)
(56,269)
(538,460)
1,687,449
59,207
6,025,628
P
= 10,416,481
P
=16,179,615
P
=7,342,647
3,073,834
P
= 10,416,481
P
=12,356,572
3,823,043
P
=16,179,615
SM INVESTMENTS CORPORATION AND SUBSIDIARIES
CONSOLIDATED STATEMENTS OF CHANGES IN EQUITY
(Amounts in Thousands, Except Per Share Data)
Balance at December 31, 2013
Net income for the period
Other comprehensive income
Total comprehensive income for the period
Common control transactions
Increase in previous year’s non-controlling interests
Balance at March 31, 2014
Capital Stock
(Note 19)
P
= 7,962,723
–
–
–
–
–
P
= 7,962,723
Balance at December 31, 2012
Net income for the period
Other comprehensive income
Total comprehensive income for the period
Issuance of Parent common shares
Increase in previous year’s non-controlling interests
Cash dividends received by non-controlling interests
Balance at March 31, 2013
See accompanying Notes to Consolidated Financial Statements.
P
= 6,229,746
–
–
–
29,514
–
–
P
= 6,259,260
Equity
Adjustments
from Common
Additional
Paid-in Capital Control Transactions
(Note 19)
(Note 19)
P
= 57,799,360
(P
= 2,584,210)
–
–
–
–
–
–
–
727,952
–
–
P
= 57,799,360
(P
= 1,856,258)
P
= 42,858,920
–
–
–
2,928,692
–
–
P
= 45,787,612
(P
= 2,332,796)
–
–
–
–
–
–
(P
= 2,332,796)
Cost of Parent
Common
Shares Held
by
Subsidiaries
(Note 19)
(P
= 25,386)
–
–
–
–
–
(P
= 25,386)
(P
= 125,906)
–
–
–
–
–
–
(P
= 125,906)
Equity Attributable to Owners of the Parent
Net Unrealized
Gain on
Cumulative
AvailableTranslation Remeasurement
for-Sale
Adjustment Loss on Defined
Investments
(Notes 10
of a
Benefit Asset /
and 11)
Subsidiary
Obligation
P
= 1,233,177
(P
= 195,074)
P
= 7,338,500
–
–
–
56,237
–
1,046,599
56,237
–
1,046,599
–
–
–
–
–
–
P
= 1,289,414
(P
= 195,074)
P
= 8,385,099
P
= 266,915
–
(20,357)
(20,357)
–
–
–
P
= 246,558
P
=–
–
(40,577)
(40,577)
–
–
–
(P
= 40,577)
P
= 11,718,559
–
4,996,326
4,996,326
–
–
–
P
= 16,714,885
Appropriated
Retained
Earnings
(Note 19)
P
= 27,000,000
–
–
–
–
–
P
= 27,000,000
P
= 35,000,000
–
–
–
–
–
–
P
= 35,000,000
Unappropriated
Retained
Earnings
(Note 19)
P
= 120,904,727
6,239,811
–
6,239,811
–
–
P
= 127,144,538
P
= 94,458,694
7,421,180
–
7,421,180
–
–
–
P
= 101,879,874
Total
P
= 219,433,817
6,239,811
1,102,836
7,342,647
727,952
–
P
= 227,504,416
Non-controlling
Interests
P
= 80,807,031
2,489,221
584,613
3,073,834
–
796,462
P
= 84,677,327
Total
Equity
P
= 300,240,848
8,729,032
1,687,449
10,416,481
727,952
796,462
P
= 312,181,743
P
= 188,074,132
7,421,180
4,935,392
12,356,572
2,958,206
–
–
P
= 203,388,910
P
= 73,570,846
2,732,807
1,090,236
3,823,043
–
11,415
(149,120)
P
= 77,256,184
P
= 261,644,978
10,153,987
6,025,628
16,179,615
2,958,206
11,415
(149,120)
P
= 280,645,094
SM INVESTMENTS CORPORATION AND SUBSIDIARIES
CONSOLIDATED STATEMENTS OF CASH FLOWS
(Amounts in Thousands)
Three months ended March 31
2013
2014
(Unaudited)
(Unaudited)
CASH FLOWS FROM OPERATING ACTIVITIES
Income before income tax
Adjustments for:
Interest expense
Depreciation and amortization (Notes 12 and 13)
Equity in net earnings of associates and joint ventures (Note 11)
Interest income
Loss (gain) on fair value changes on derivatives - net (Note 25)
Dividend, management fees and others
Unrealized foreign exchange gain (loss) and others
Income before working capital changes
Decrease (increase) in:
Land and development
Merchandise inventories
Receivables
Other current assets
Increase (decrease) in:
Accounts payable and other current liabilities
Tenants’ deposits and others
Net cash used in operations
Income tax paid
Net cash used in operating activities
CASH FLOWS FROM INVESTING ACTIVITIES
Proceeds from sale of:
Property and equipment
Available-for-sale investments
Investment properties
Additions to:
Investment properties (Note 13)
Investments in shares of stock of associates and joint ventures
Property and equipment (Note 12)
Decrease (increase) in:
Other noncurrent assets
Time deposits and short-term investments
Interest received
Dividends received (Note 11)
Net cash used in investing activities
CASH FLOWS FROM FINANCING ACTIVITIES
Availments of:
Long-term debt
Bank loans
Payments of:
Long-term debt
Bank loans
Interest
Dividends paid
Increase in Non-controlling interests
Net cash used in financing activities
(Forward)
P
=10,542,603
P
=11,800,449
2,540,720
2,605,466
(3,116,466)
(798,672)
(53,963)
(4,192)
51,822
11,767,318
2,845,525
2,257,325
(5,649,159)
(1,014,463)
1,310,743
(358,348)
(183,244)
11,008,828
(1,809,247)
(319,833)
(700,561)
3,303,462
(3,973,190)
177,406
(1,562,902)
696,127
(13,424,236)
1,050,939
(132,158)
(1,170,974)
(1,303,132)
(6,984,637)
557,646
(80,722)
(597,831)
(678,553)
62,929
–
25,222
24,556
166,453
–
(8,392,431)
(340)
(1,455,364)
(3,493,078)
–
(1,815,236)
503,133
892,093
873,727
818,562
(6,672,469)
(1,134,829)
1,345,827
1,474,482
354,772
(3,077,053)
P
= 5,000,000
–
P
=9,151,125
10,324,138
(1,593,954)
(7,127,900)
(2,200,513)
(549)
796,462
(5,126,454)
(10,391,830)
(14,004,400)
(3,038,529)
–
11,415
(7,948,081)
-2-
Three months ended March 31
2013
2014
(Unaudited)
(Unaudited)
DECREASE IN CASH AND CASH EQUIVALENTS
EFFECT OF EXCHANGE RATE CHANGES
ON CASH AND CASH EQUIVALENTS
CASH AND CASH EQUIVALENTS
AT BEGINNING OF YEAR
CASH AND CASH EQUIVALENTS
AT THE END OF THE PERIOD
See accompanying Notes to Consolidated Financial Statements.
(13,102,055)
(11,703,687)
82,268
11,016
50,209,657
60,714,720
P
=37,189,870
=49,022,049
P
SM INVESTMENTS CORPORATION AND SUBSIDIARIES
NOTES TO CONSOLIDATED FINANCIAL STATEMENTS
1. Corporate Information
SM Investments Corporation (SMIC or Parent Company) was incorporated in the Philippines on
January 15, 1960. On June 3, 2009, the Philippine Securities and Exchange Commission (SEC)
approved the amendment of SMIC’s articles of incorporation for the extension of the Company’s
corporate life for another 50 years from January 15, 2010. Its registered office address is 10th
Floor, One E-Com Center, Harbor Drive, Mall of Asia Complex, CBP-1A, Pasay City 1300.
The Parent Company and its subsidiaries (collectively referred to as the Group), and its associates
are involved primarily in the property, retail and financial services and other businesses.
The Parent Company’s shares of stock are publicly traded in the Philippine Stock Exchange
(PSE).
2. Basis of Preparation and Statement of Compliance
Basis of Preparation
The consolidated financial statements of the Group have been prepared on a historical cost basis,
except for derivative financial instruments, investments held for trading and available-for-sale
(AFS) investments which have been measured at fair value. The consolidated financial statements
are presented in Philippine Peso, which is the Parent Company’s functional and presentation
currency under Philippine Financial Reporting Standards (PFRS). All values are rounded to the
nearest thousand, except when otherwise indicated.
Statement of Compliance
The consolidated financial statements have been prepared in compliance with PFRS. PFRS
includes statements named PFRS and Philippine Accounting Standards (PAS), including the
interpretations issued by the Philippine Financial Reporting Standards Council (PFRSC).
Basis of Consolidation
The consolidated financial statements comprise the financial statements of the Parent Company
and all of its subsidiaries as at December 31, 2013. Control is achieved when the Group is
exposed, or has rights, to variable returns from its involvement with the investee and has the
ability to affect to those returns through its power over the investee. Specifically, the Group
controls an investee, if and only if, the Group has:
Power over the investee (i.e. existing rights that give it the current ability to direct the relevant
activities of the investee)
Exposure, or rights, to variable returns from its involvement with the investee, and
The ability to use its power over the investee to affect its returns.
-2-
When the Group has less than a majority of the voting or similar rights of an investee, the Group
considers all relevant facts and circumstances in assessing whether it has power over an investee,
including:
The contractual arrangement with the other vote holders of the investee
Rights arising from other contractual arrangements, and
The Group’s voting rights and potential voting rights.
The Group re-assesses whether or not it controls an investee if facts and circumstances indicate
that there are changes to one or more of the three elements of control. Consolidation of a
subsidiary begins when the Group obtains control over the subsidiary and ceases when the Group
loses control of the subsidiary. Assets, liabilities, income and expenses of a subsidiary acquired or
disposed of during the year are included in the statement of comprehensive income from the date
the Group gains control until the date the Group ceases to control the subsidiary.
Profit or loss and each component of other comprehensive income (OCI) are attributed to the
equity holders of the parent of the Group and to the non-controlling interests, even if this results in
the non-controlling interests having a deficit balance. When necessary, adjustments are made to
the financial statements of subsidiaries to bring their accounting policies into line with the Group’s
accounting policies. All intra-group assets and liabilities, equity, income, expenses and cash flows
relating to transactions between members of the Group are eliminated in full on consolidation.
A change in the ownership interest of a subsidiary, without loss of control, is accounted for as an
equity transaction. If the Group loses control over a subsidiary, it:
Derecognizes the assets (including goodwill) and liabilities of the subsidiary;
Derecognizes the carrying amount of any non-controlling interest;
Derecognizes the cumulative translation differences recorded in equity;
Recognizes the fair value of the consideration received;
Recognizes the fair value of any investment retained;
Recognizes any surplus or deficit in profit or loss;
Reclassifies the Parent Company’s share of components previously recognized in other
comprehensive income to profit or loss or retained earnings, as appropriate.
The consolidated financial statements include the accounts of the Parent Company and the
following subsidiaries. The subsidiaries listed below were all incorporated in the Philippines.
Company
Property
SM Prime Holdings, Inc. (SM Prime) and
Subsidiaries
SM Land, Inc. (SM Land) and Subsidiaries*:
SM Development Corporation (SMDC)
and Subsidiaries
Magenta Legacy, Inc. (Magenta)
Associated Development Corporation
Highlands Prime, Inc. (HPI)
Summerhills Home Development Corp.
(SHDC)
CHAS Realty and Development Corporation
and Subsidiaries
Costa del Hamilo, Inc.
Principal Activities
Percentage of Ownership
December 31,
March 31,
2013
2014
Direct Indirect
Direct Indirect
Real estate development
Real estate development
51
–
–
–
51
–
–
–
Real estate development
Real estate development
Real estate development
Real estate development
–
–
–
–
100
100
100
100
–
–
–
–
100
100
100
100
Real estate development
–
100
–
100
Real estate development
Real estate development
–
–
100
100
–
–
100
100
-3-
Company
Prime Metro Estate, Inc. (PMI)
Rappel Holdings, Inc. (Rappel) and
Subsidiaries
SM Arena Complex Corporation
SM Hotels and Conventions Corp.
(SM Hotels) and Subsidiaries
Tagaytay Resort Development Corporation
Mountain Bliss Resort and Development
Corporation (Mt. Bliss) and Subsidiaries
Belleshares Holdings, Inc. (formerly
SM Commercial Properties, Inc.)
and Subsidiaries
Intercontinental Development Corporation
(ICDC)
Prime Central, Inc. (Prime Central)
and Subsidiaries
Bellevue Properties, Inc.
Net Group
Sto. Roberto Marketing Corp.
Nagtahan Property Holdings, Inc.
(formerly AD Farming)
Principal Activities
Real estate development
Percentage of Ownership
December 31,
March 31,
2013
2014
Direct Indirect
Direct Indirect
–
100
–
100
Real estate development
Conventions
–
–
100
100
–
–
100
100
Hotel and tourism
Real estate development
–
–
100
100
–
–
100
100
Real estate development
100
–
100
–
Real estate development
59
40
59
40
Real estate development
97
3
97
3
Real estate development
Real estate development
Real estate development
Real estate development
100
62
90
100
–
–
–
–
100
62
90
100
–
–
–
–
Real estate development
100
–
100
–
Retail
SM Retail, Inc. (SM Retail) and Subsidiaries
Retail
100
–
100
–
Others
Primebridge Holdings, Inc. (Primebridge)
Asia Pacific Computer Technology Center, Inc.
Multi-Realty Development Corporation (MRDC)
Henfels Investments Corp.
Investment
Education
Investment
Investment
80
52
91
99
20
–
–
–
80
52
91
99
20
–
–
–
*On October 10, 2013, SM Land was merged with SM Prime via a share-for-share swap
3. Summary of Significant Accounting Policies, Changes and Improvements
The principal accounting policies adopted in the preparation of the consolidated financial
statements are as follows:
Cash and Cash Equivalents
Cash includes cash on hand and in banks. Cash equivalents are short-term, highly liquid
investments that are readily convertible to known amounts of cash with original maturities of three
months or less from acquisition date and are subject to an insignificant risk of change in value.
Time Deposits and Short-term Investments
Time deposits and short-term investments are cash placements, shown under current assets, with
original maturities of more than three months but less than one year. Time deposits which will
mature twelve months after the reporting period are presented under noncurrent assets.
Determination of Fair Value
Fair value is the price that would be received to sell an asset or paid to transfer a liability in an
orderly transaction between market participants at the measurement date. The fair value
measurement is based on the presumption that the transaction to sell the asset or transfer the
liability takes place either:
-4
in the principal market for the asset or liability, or
in the absence of a principal market, in the most advantageous market for the asset or liability.
The principal or the most advantageous market must be accessible to the Group.
The fair value of an asset or a liability is measured using the assumptions that market participants
would use when pricing the asset or liability, assuming that market participants act in their
economic best interest.
A fair value measurement of a nonfinancial asset takes into account a market participant’s ability
to generate economic benefits by using the asset in its highest and best use or by selling it to
another market participant that would use the asset in its highest and best use.
The Group uses valuation techniques that are appropriate in the circumstances and for which
sufficient data are available to measure fair value, maximizing the use of relevant observable
inputs and minimizing the use of unobservable inputs.
Assets and liabilities for which fair value is measured or disclosed in the consolidated financial
statements are categorized within the fair value hierarchy, described as follows, based on the
lowest level input that is significant to the fair value measurement as a whole:
Level 1 - Quoted (unadjusted) market prices in active markets for identical assets or liabilities;
Level 2 - Valuation techniques for which the lowest level input that is significant to the fair
value measurement is directly or indirectly observable; and
Level 3 - Valuation techniques for which the lowest level input that is significant to the fair
value measurement is unobservable.
For assets and liabilities that are recognized in the consolidated financial statements on a recurring
basis, the Group determines whether transfers have occurred between Levels in the hierarchy by
re-assessing categorization (based on the lowest level input that is significant to the fair value
measurement as a whole) at the end of each reporting period.
The Group determines the policies and procedures for both recurring and non-recurring fair value
measurements. For the purpose of fair value disclosures, the Group has determined classes of
assets and liabilities on the basis of the nature, characteristics and risks of the asset or liability and
the level of the fair value hierarchy.
The Group recognizes transfers into and transfers out of fair value hierarchy levels by re-assessing
categorization (based on the lowest level input that is significant to the fair value measurement as
a whole) as at the date of the event or change in circumstances that caused the transfer.
“Day 1” Difference. Where the transaction price in a non-active market is different from the fair
value of other observable current market transactions in the same instrument or based on a
valuation technique whose variables include only data from observable market, the Group
recognizes the difference between the transaction price and fair value (a “Day 1” difference) in the
consolidated statement of income unless it qualifies for recognition as some other type of asset or
liability. In cases where use is made of data which is not observable, the difference between the
transaction price and model value is only recognized in the consolidated statement of income
when the inputs become observable or when the instrument is derecognized. For each transaction,
the Group determines the appropriate method of recognizing the “Day 1” difference amount.
-5-
Financial Instruments - Initial Recognition and Subsequent Measurement
Date of Recognition. The Group recognizes a financial asset or a financial liability in the
consolidated balance sheets when it becomes a party to the contractual provisions of the
instrument. In the case of a regular way purchase or sale of financial assets, recognition and
derecognition, as applicable, are done using settlement date accounting. Regular way purchases or
sales are purchases or sales of financial assets that require delivery of assets within the period
generally established by regulation or convention in the market place. Derivatives are recognized
on a trade date basis.
Initial Recognition of Financial Instruments. Financial instruments are recognized initially at fair
value, which is the fair value of the consideration given (in case of an asset) or received (in case of
a liability). The initial measurement of financial instruments, except for those classified as fair
value through profit or loss (FVPL), includes transaction cost.
Subsequent to initial recognition, the Group classifies its financial instruments in the following
categories: financial assets and financial liabilities at FVPL, loans and receivables, HTM
investments, AFS investments and other financial liabilities. The classification depends on the
purpose for which the instruments are acquired and whether they are quoted in an active market.
Management determines the classification at initial recognition and, where allowed and
appropriate, re-evaluates this classification at every reporting date.
Financial Assets and Liabilities at FVPL. Financial assets and liabilities at FVPL include
financial assets and liabilities held for trading and financial assets and liabilities designated upon
initial recognition as at FVPL.
Financial assets and liabilities are classified as held for trading if they are acquired for the purpose
of selling or repurchasing in the near term. Gains or losses on investments held for trading are
recognized in the consolidated statement of income under “Gain on sale of available-for-sale
investments and fair value changes on investments held for trading - net” account. Interest income
earned on investment held for trading are recognized in “Interest income” account in the
consolidated statement of income.
Financial assets and liabilities may be designated by management at initial recognition as FVPL
when any of the following criteria is met:
the designation eliminates or significantly reduces the inconsistent treatment that would
otherwise arise from measuring the assets and liabilities or recognizing gains or losses on a
different basis; or
the assets and liabilities are part of a group of financial assets, financial liabilities or both
which are managed and their performance are evaluated on a fair value basis, in accordance
with a documented risk management or investment strategy; or
the financial instrument contains an embedded derivative, unless the embedded derivative
does not significantly modify the cash flows or it is clear, with little or no analysis, that it
would not be separately recorded.
-6-
The Group’s investments held for trading and derivative assets are classified as financial assets at
FVPL, while the Group’s derivative liabilities arising from issuance of convertible bonds and
derivative financial instruments with negative fair values are also included as financial liabilities at
FVPL.
Loans and Receivables. Loans and receivables are nonderivative financial assets with fixed or
determinable payments that are not quoted in an active market. They are not entered into with the
intention of immediate or short-term resale and are not designated as AFS investments or financial
assets at FVPL.
After initial measurement, loans and receivables are subsequently measured at amortized cost
using the effective interest method, less allowance for impairment. Amortized cost is calculated
by taking into account any discount or premium on acquisition and fees that are an integral part of
the effective interest rate. Gains and losses are recognized in the consolidated statement of
income when the loans and receivables are derecognized and impaired, as well as through the
amortization process. Loans and receivables are included under current assets if realizability or
collectibility is within twelve months after the reporting period. Otherwise, these are classified as
noncurrent assets.
The Group’s cash and cash equivalents, time deposits and short-term investments (including
noncurrent portion) and receivables (including noncurrent portion of receivables from real estate
buyers), advances and other receivables (included under “Other current assets” account),
receivable from a related party and long-term notes (included under “Other noncurrrent assets”
account) are classified under this category.
HTM Investments. HTM investments are quoted nonderivative financial assets with fixed or
determinable payments and fixed maturities for which the Group’s management has the positive
intention and ability to hold to maturity. Where the Group sells other than an insignificant amount
of HTM investments, the entire category would be tainted and reclassified as AFS investments.
After initial measurement, these investments are measured at amortized cost using the effective
interest method, less impairment in value. Amortized cost is calculated by taking into account any
discount or premium on acquisition and fees that are an integral part of the effective interest rate.
Gains and losses are recognized in the consolidated statement of income when the HTM
investments are derecognized or impaired, as well as through the amortization process. Assets
under this category are classified as current assets if maturity is within twelve months from
reporting period. Otherwise, these are classified as noncurrent assets.
The Group’s investment in quoted Philippine government treasury bonds are classified under this
category.
AFS Investments. AFS investments are nonderivative financial assets that are designated under
this category or are not classified in any of the other categories. These are purchased and held
indefinitely, and may be sold in response to liquidity requirements or changes in market
conditions. Subsequent to initial recognition, AFS investments are carried at fair value in the
consolidated balance sheets. Changes in the fair value of such assets are reported as net unrealized
gain or loss on AFS investments in the consolidated statement of comprehensive income under
“Net unrealized gain (loss) on available-for-sale investments” account until the investment is
derecognized or the investment is determined to be impaired. On derecognition or impairment,
the cumulative gain or loss previously reported in consolidated statement of comprehensive
income is transferred to the consolidated statement of income. Interest earned on holding AFS
investments are recognized in the consolidated statement of income using the effective interest
method. Assets under this category are classified as current assets if expected to be disposed of
-7-
within 12 months after the reporting period and as noncurrent assets if expected date of disposal is
more than 12 months after the reporting period.
The Group’s investments in shares of stock, bonds and corporate notes, redeemable preferred
shares and club shares are classified under this category. The current portion is included under
“Investments held for trading and sale” account in the consolidated balance sheets.
Other Financial Liabilities. This category pertains to financial liabilities that are not held for
trading or not designated as at FVPL upon the inception of the liability. These include liabilities
arising from operations or borrowings.
Other financial liabilities are recognized initially at fair value and are subsequently carried at
amortized cost, taking into account the impact of applying the effective interest method of
amortization (or accretion) for any related premium, discount and any directly attributable
transaction costs. Gains and losses on other financial liabilities are recognized in the consolidated
statement of income when the liabilities are derecognized, as well as through the amortization
process.
The Group’s bank loans, accounts payable and other current liabilities, dividends payable,
long-term debt and tenants’ deposits and others are classified under this category.
Classification of Financial Instruments Between Liability and Equity
A financial instrument is classified as liability if it provides for a contractual obligation to:
deliver cash or another financial asset to another entity; or
exchange financial assets or financial liabilities with another entity under conditions that are
potentially unfavorable to the Group; or
satisfy the obligation other than by the exchange of a fixed amount of cash or another financial
asset for a fixed number of own equity shares.
If the Group does not have an unconditional right to avoid delivering cash or another financial
asset to settle its contractual obligation, the obligation meets the definition of a financial liability.
The components of issued financial instruments that contain both liability and equity elements are
accounted for separately, with the equity component being assigned the residual amount after
deducting from the instrument as a whole the amount separately determined as the fair value of the
liability component on the date of issue.
Debt Issue Costs
Debt issue costs are presented as reduction in long-term debt and are amortized over the terms of
the related borrowings using the effective interest method.
Derivative Financial Instruments
The Group uses derivative financial instruments such as long-term currency swaps, foreign
currency call options, interest rate swaps, foreign currency range options and non-deliverable
forwards to hedge the risks associated with foreign currency and interest rate fluctuations.
Derivative financial instruments, including bifurcated embedded derivatives, are initially
recognized at fair value on the date on which the derivative contract is entered into and are
subsequently re-measured at fair value. Derivatives are carried as assets when the fair value is
positive and as liabilities when the fair value is negative.
The Group’s derivative instruments provide economic hedges under the Group’s policies but are
not designated as accounting hedges. Consequently, any gains or losses arising from changes in
fair value are taken directly to profit or loss for the year.
-8-
Cash Flow Hedges. Cash flow hedges are hedges of the exposure to variability in cash flows that
is attributable to a particular risk associated with a recognized asset, liability or a highly probable
forecast transaction and could affect the consolidated statements of income. Changes in the fair
value of a hedging instrument that qualifies as a highly effective cash flow hedge are recognized
as “Cumulative translation adjustment of a subsidiary” in the consolicated statements of
comprehensive income, whereas any hedge ineffectiveness is immediately recognized in the
consolidated statements of income under “Gain (loss) on fair value changes on derivatives”
account (see Note 25).
Amounts taken to equity are transferred to the consolidated statements of income when the hedged
transaction affects profit or loss, such as when the hedged financial income or financial expense is
recognized. However, if an entity expects that all or a portion of a loss recognized in other
comprehensive income will not be recovered in one or more future periods, it shall reclassify from
equity to profit or loss as a reclassification adjustment the amount that is not expected to be
recovered.
Hedge accounting is discontinued prospectively when the hedge ceases to be highly effective.
When hedge accounting is discontinued, the cumulative gains or losses on the hedging instrument
that has been reported as “Cumulative translation adjustment of a subsidiary” is retained in the
other comprehensive income until the hedged transaction impacts the consolidated statements of
income. When the forecasted transaction is no longer expected to occur, any net cumulative gains
or losses previously reported in the consolidated statements of comprehensive income is
recognized immediately in the consolidated statements of income.
Other Derivative Instruments Not Accounted for as Hedges. Certain freestanding derivative
instruments that provide economic hedges under the Company’s policies either do not qualify for
hedge accounting or are not designated as accounting hedges. Changes in the fair values of
derivative instruments not designated as hedges are recognized immediately under “Gain (loss) on
fair value changes on derivatives - net” account in the consolidated statements of income
(see Note 25). Derivatives are carried as assets when the fair value is positive and as liabilities
when the fair value is negative.
Embedded Derivative. An embedded derivative is a component of a hybrid (combined)
instrument that also includes a nonderivative host contract with the effect that some of the cash
flows of the combined instrument vary, in a way similar to a stand-alone derivative. The Group
assesses whether embedded derivatives are required to be separated from host contracts when the
Group first becomes a party to the contract. An embedded derivative is separated from the host
contract and accounted for as a derivative if all of the following conditions are met: a) the
economic characteristics and risks of the embedded derivative are not closely related to the
economic characteristics and risks of the host contract; b) a separate instrument with the same
terms as the embedded derivative would meet the definition of a derivative; and c) the hybrid or
combined instrument is not recognized as at FVPL.
Subsequent reassessment is prohibited unless there is a change in the terms of the contract that
significantly modifies the cash flows that otherwise would be required under the contract, in which
case reassessment is required. The Group determines whether a modification to cash flows is
significant by considering the extent to which the expected future cash flows associated with
embedded derivative, the host contract or both have changed and whether the change is significant
relative to the previously expected cash flows on the contract.
Options arising from the Group’s investment in bonds and convertible bonds payable are the
Group’s bifurcated embedded derivatives.
-9-
Derecognition of Financial Assets and Liabilities
Financial Assets. A financial asset (or, where applicable a part of a financial asset or part of a
group of similar financial assets) is derecognized when:
the rights to receive cash flows from the asset have expired;
the Group retains the right to receive cash flows from the asset, but has assumed an
obligation to pay them in full without material delay to a third party under a “pass-through”
arrangement; or
the Group has transferred its rights to receive cash flows from the asset and either (a) has
transferred substantially all the risks and rewards of the asset, or (b) has neither transferred nor
retained substantially all the risks and rewards of the asset, but has transferred control of the
asset.
When the Group has transferred its rights to receive cash flows from an asset and has neither
transferred nor retained substantially all the risks and rewards of the asset, the asset is recognized
to the extent of the Group’s continuing involvement in the asset. Continuing involvement that
takes the form of a guarantee over the transferred asset is measured at the lower of original
carrying amount of the asset and the maximum amount of consideration that the Group could be
required to repay.
Financial Liabilities. A financial liability is derecognized when the obligation under the liability
is discharged or cancelled or has expired.
When an existing financial liability is replaced by another from the same lender on substantially
different terms, or the terms of an existing liability are substantially modified, such modification is
treated as a derecognition of the original liability and the recognition of a new liability, and the
difference in the respective carrying amounts is recognized in profit or loss.
Impairment of Financial Assets
The Group assesses at each reporting period whether a financial asset or a group of financial assets
is impaired. A financial asset or a group of financial assets is deemed to be impaired, if and only
if, there is objective evidence of impairment as a result of one or more events that occurred after
the initial recognition of the asset (an incurred loss event) and that loss event has an impact on the
estimated future cash flows of the financial asset or a group of financial assets that can be reliably
estimated. Objective evidence of impairment may include indications that the borrower or a group
of borrowers is experiencing significant financial difficulty, default or delinquency in interest or
principal payments, the probability that they will enter bankruptcy or other financial
reorganization and where observable data indicate that there is measurable decrease in the
estimated future cash flows, such as changes in arrears or economic conditions that correlate with
defaults.
Financial Assets Carried at Amortized Cost. The Group first assesses whether objective evidence
of impairment exists for financial assets that are individually significant, and individually or
collectively for financial assets that are not individually significant. If it is determined that no
objective evidence of impairment exists for an individually assessed financial asset, whether
significant or not, the asset is included in a group of financial assets with similar credit risk
characteristics and that group of financial assets is collectively assessed for impairment. Assets
that are individually assessed for impairment and for which an impairment loss is or continues to
be recognized are not included in the collective impairment assessment.
If there is objective evidence that an impairment loss on loans and receivables carried at amortized
cost has been incurred, the amount of the loss is measured as the difference between the asset’s
carrying amount and the present value of estimated future cash flows (excluding future credit
- 10 -
losses that have not been incurred) discounted at the financial asset’s original effective interest
rate (i.e., the effective interest rate computed at initial recognition).
The carrying amount of the impaired asset shall be reduced through the use of an allowance
account. The amount of the loss shall be recognized in the consolidated statement of income.
Interest income continues to be accrued on the reduced carrying amount based on the original
effective interest rate of the asset. Loans and receivables together with the associated allowance
are written off when there is no realistic prospect of future recovery and all collateral, if any, has
been realized or has been transferred to the Group. If, in a subsequent period, the amount of the
impairment loss increases or decreases because of an event occurring after the impairment was
recognized, the previously recognized impairment loss is increased or decreased by adjusting the
allowance account. If a future write-off is later recovered, the recovery is recognized in the
consolidated statement of income to the extent of the carrying amount that would have been
determined had no impairment loss been recognized.
Financial Assets Carried at Cost. If there is objective evidence that an impairment loss has been
incurred in an unquoted equity instrument that is not carried at fair value because its fair value
cannot be reliably measured, or on a derivative asset that is linked to and must be settled by
delivery of such an unquoted equity instrument, the amount of the loss is measured as the
difference between the asset’s carrying amount and the present value of estimated future cash
flows discounted at the current market rate of return for a similar financial asset.
AFS Investments. The Group assesses at each reporting period whether there is objective evidence
that an investment or a group of investments is impaired. In the case of equity investments
classified as AFS investments, an objective evidence of impairment would include a significant or
prolonged decline in the fair value of the investments below its cost. Significant decline in fair
value is evaluated against the original cost of the investment, while prolonged decline is assessed
against the periods in which the fair value has been below its original cost. Where there is
evidence of impairment, the cumulative loss, measured as the difference between the acquisition
cost and the current fair value, less any impairment loss on that financial asset previously
recognized in the consolidated statement of income, is removed from the consolidated statement
of comprehensive income and recognized in the consolidated statement of income. Impairment
losses on equity investments are not reversed through the consolidated statement of income;
increases in fair value after impairment are recognized directly in the consolidated statement of
comprehensive income.
In the case of debt instruments classified as AFS investments, impairment is assessed based on the
same criteria as financial assets carried at amortized cost. Future interest income is based on the
reduced carrying amount of the asset and is accrued based on the rate of interest used to discount
future cash flows for the purpose of measuring impairment loss. Such accrual is recorded as part
of “Interest income” account in the consolidated statement of income. If, in subsequent year, the
fair value of a debt instrument increased and the increase can be objectively related to an event
occurring after the impairment loss was recognized in the consolidated statement of income, the
impairment loss is reversed through the consolidated statement of income.
Offsetting Financial Instruments
Financial assets and financial liabilities are offset and the net amount is reported in the
consolidated balance sheets if, and only if, there is a currently enforceable legal right to offset the
recognized amounts and there is an intention to settle on a net basis, or to realize the asset and
settle the liability simultaneously. This is not generally the case with master netting agreements,
and the related assets and liabilities are presented at gross in the consolidated balance sheets.
- 11 -
Merchandise Inventories
Merchandise inventories are valued at the lower of cost and net realizable value. Cost, which
includes all costs directly attributable to acquisition, such as purchase price and transport costs, is
primarily determined using the weighted average method. Net realizable value is the estimated
selling price in the ordinary course of business, less estimated costs necessary to make the sale.
Land and Development and Condominium Units for Sale
Land and development and condominium units for sale (included under “Other current assets”
account in the consolidated balance sheets) are stated at the lower of cost and net realizable value.
Net realizable value is the selling price in the ordinary course of business, less costs to complete
and the estimated cost to make the sale. Cost includes those costs incurred for development and
improvement of the properties.
Land and development includes properties held for future development and properties being
constructed for sale in the ordinary course of business, rather than to be held for rental or capital
appreciation. Cost incurred for the development and improvement of the properties includes the
following:
Land cost
Amounts paid to contractors for construction and development
Borrowing costs, planning and design costs, costs of site preparation, professional fees,
property transfer taxes, construction overheads and other related costs.
Investments in Shares of Stock of Associates and Joint Ventures
An associate is an entity over which the Group has significant influence. Significant influence is
the power to participate in the financial and operating policy decisions of the investee, but is not
control or joint control over those policies.
A joint venture is a joint arrangement whereby the parties that have joint control of the
arrangement have rights to the net assets of the arrangement. Joint control is the contractually
agreed sharing of control of an arrangement, which exists only when decisions about the relevant
activities require unanimous consent of the parties sharing control.
The considerations made in determining significant influence or joint control are similar to those
necessary to determine control over subsidiaries.
The Group’s investments in shares of stock of associates and joint ventures are accounted for
under the equity method of accounting.
Under the equity method, investment in an associate or a joint venture is carried in the
consolidated balance sheets at cost plus post-acquisition changes in the Group’s share in net assets
of the associate or joint venture.
On acquisition of the investment, any difference between the cost of the investment and the
investor’s share in the net fair value of the associate’s or joint venture’s identifiable assets,
liabilities and contingent liabilities is accounted for as follows:
a. goodwill relating to an associate or joint venture is included in the carrying amount of the
investment. However, amortization of that goodwill is not permitted and is therefore not
included in the determination of the Group’s share in the associate’s or joint venture’s profits
or losses.
b. any excess of the Group’s share in the net fair value of the associate’s and joint venture’s
identifiable assets, liabilities and contingent liabilities over the cost of the investment is
- 12 -
included as income in the determination of the investor's share of the associate's or joint
venture’s profit or loss in the period in which the investment is acquired.
The consolidated statement of income reflect the share in the results of operations of the associate
or joint venture. Where there has been a change recognized directly in the equity of the associate
or joint venture, the Group recognizes its share in any changes and discloses this in the
consolidated statement of comprehensive income. Profits and losses resulting from transactions
between the Group and the associate or joint venture are eliminated to the extent of the Group’s
interest in the associate or joint venture.
Also, appropriate adjustments to the investor’s share of the associate’s or joint venture’s profit or
loss after acquisition are made to account for the depreciation of the depreciable assets based on
their fair values at the acquisition date and for impairment losses recognized by the associate or
joint venture, such as for goodwill or property, plant and equipment.
After application of the equity method, the Group determines whether it is necessary to recognize
any impairment loss with respect to the Group’s net investment in the associate or joint venture.
The Group discontinues the use of equity method from the date when it ceases to have significant
influence over an associate or joint control over a joint venture and accounts for the retained
investment in accordance with PAS 39, from that date, provided the associate or joint venture does
not become a subsidiary. Upon loss of significant influence over the associate or joint control
over the joint venture, the Group measures and recognizes any retained investment at its fair value.
Any difference in the carrying amount of the associate or joint venture upon loss of significant
influence or joint control and the fair value of the retained investment and proceeds from disposal
is recognized in the consolidated statement of income. When the Group’s interest in an
investment in associate or joint venture is reduced to zero, additional losses are provided only to
the extent that the Group has incurred obligations or made payments on behalf of the associate or
joint venture to satisfy obligations of the investee that the Group has guaranteed or otherwise
committed. If the associate or joint venture subsequently reports profits, the Group resumes
recognizing its share of the profits only after its share of the profits equals the share of net losses
not recognized.
The financial statements of the associates and joint ventures are prepared for the same reporting
period as the Parent Company. The accounting policies of the associates and joint ventures
conform to those used by the Group for like transactions and events in similar circumstances.
Property and Equipment
Property and equipment, except land, is stated at cost less accumulated depreciation and
amortization and any accumulated impairment in value. Such cost includes the cost of replacing
part of the property and equipment at the time that cost is incurred, if the recognition criteria are
met, and excludes the costs of day-to-day servicing. Land is stated at cost less any impairment in
value.
The initial cost of property and equipment consists of its purchase price, including import duties,
taxes and any directly attributable costs necessary in bringing the asset to its working condition
and location for its intended use. Cost also includes any related asset retirement obligation and
interest incurred during the construction period on funds borrowed to finance the construction of
the projects. When each major inspection is performed, its cost is recognized in the carrying
amount of the property and equipment as a replacement if the recognition criteria are satisfied.
Expenditures incurred after the item has been put into operation, such as repairs, maintenance and
overhaul costs, are normally recognized as expense in the period such costs are incurred. In
situations where it can be clearly demonstrated that the expenditures have improved the condition
- 13 -
of the asset beyond the originally assessed standard of performance, the expenditures are
capitalized as additional cost of property and equipment.
Depreciation and amortization are calculated on a straight-line basis over the following estimated
useful lives of the assets:
Buildings, condominium units and improvements
Store equipment and improvements
Data processing equipment
Furniture, fixtures and office equipment
Machinery and equipment
Leasehold improvements
Transportation equipment
5–25 years
5–10 years
5 years
3–10 years
5–10 years
5–10 years or term of the lease,
whichever is shorter
5–10 years
The residual values, useful lives and method of depreciation and amortization of the assets are
reviewed and adjusted, if appropriate, at the end of each reporting period.
The carrying values of property and equipment are reviewed for impairment when events or
changes in circumstances indicate that the carrying values may not be recoverable.
Fully depreciated assets are retained in the accounts until they are no longer in use and no further
depreciation and amortization is credited or charged to current operations.
An item of property and equipment is derecognized when either it has been disposed or when it is
permanently withdrawn from use and no future economic benefits are expected from its use or
disposal. Any gains or losses arising on the retirement and disposal of an item of property and
equipment are recognized in the consolidated statement of income in the period of retirement or
disposal.
Investment Properties
Investment properties are measured initially at cost. The cost of a purchased investment property
comprises of its purchase price and any directly attributable costs. Subsequently, investment
properties, except land, are measured at cost, less accumulated depreciation and amortization and
accumulated impairment in value. The carrying amount includes the cost of replacing part of an
existing investment property at the time that cost is incurred if the recognition criteria are met, and
excludes the costs of day-to-day servicing of an investment property. Land is stated at cost less
any impairment in value.
Property under construction or development for future use as an investment property is classified
as investment property.
Depreciation and amortization are calculated on a straight-line basis over the following estimated
useful lives of the assets:
Land improvements
Land use rights
Buildings and improvements
Building equipment, furniture and others
3–5 years
40–60 years
10–35 years
3–15 years
The residual values, useful lives and method of depreciation and amortization of the assets are
reviewed and adjusted, if appropriate, at the end of each reporting period.
- 14 -
Investment property is derecognized when either it has been disposed or when it is permanently
withdrawn from use and no future economic benefit is expected from its disposal. Any gains or
losses on the retirement or disposal of an investment property are recognized in the consolidated
statement of income in the period of retirement or disposal.
Transfers are made to investment property when, and only when, there is a change in use,
evidenced by ending of owner-occupation or commencement of an operating lease to another
party. Transfers are made from investment property when, and only when, there is a change in
use, evidenced by commencement of owner-occupation or commencement of development with a
view to sell.
For a transfer from investment property to owner-occupied property or inventories, the cost of
property for subsequent accounting is its carrying value at the date of change in use. If the
property occupied by the Group as an owner-occupied property becomes an investment property,
the Group accounts for such property in accordance with the policy stated under property and
equipment up to the date of change in use.
Construction in Progress
Construction in progress represents structures under construction and is stated at cost. This
includes cost of construction, property and equipment, and other direct costs. Cost also includes
interest on borrowed funds incurred during the construction period. Construction in progress is
not depreciated until such time that the relevant assets are completed and are ready for use.
Tenants’ Deposits
Tenants’ deposits are measured at amortized cost. Tenants’ deposits refers to security deposits
received from various tenants upon inception of the respective lease contracts on the Group’s
investment properties. At the termination of the lease contracts, the deposits received by the
Group are returned to tenants, reduced by unpaid rental fees, penalties and/or deductions from
repairs of damaged leased properties, if any. The related lease contracts usually have a term of
more than twelve months.
Property Acquisitions, Business Combinations and Acquisitions of Non-controlling Interests
Property Acquisitions and Business Combinations. When property is acquired, through corporate
acquisitions or otherwise, management considers the substance of the assets and activities of the
acquired entity in determining whether the acquisition represents an acquisition of a business.
When such an acquisition is not judged to be an acquisition of a business, it is not treated as a
business combination. Rather, the cost to acquire the entity is allocated between the identifiable
assets and liabilities of the entity based on their relative fair values at the acquisition date.
Accordingly, no goodwill or additional deferred tax arises. Otherwise, the acquisition is
accounted for as a business combination.
Business combinations are accounted for using the acquisition method except for business
combinations under common control in which an accounting similar to pooling of interest method
is used. Business combinations under common control are those in which all of the combining
entities or businesses are controlled by the same party or parties both before and after the business
combination, and that control is not transitory. Under the acquisition method, the cost of an
acquisition is measured as the aggregate of the consideration transferred, measured at acquisition
date fair value and the amount of any non-controlling interest in the acquiree. For each business
combination, the acquirer measures the non-controlling interest in the acquiree either at fair value
or at the proportionate share of the acquiree’s identifiable net assets. Transaction costs incurred
are expensed and included in “Selling, general and administrative expenses” account in the
consolidated statement of income.
- 15 -
For accounting similar to pooling of interest method, the assets, liabilities and equity of the
acquired companies for the reporting period in which the common control business combinations
occur, and for any comparative periods presented, are included in the consolidated financial
statements of the Group at their carrying amounts as if the combinations had occurred from the
date when the acquired companies first became under the control of the Group. The excess of the
cost of business combinations over the net carrying amounts of the assets and liabilities of the
acquired companies is recognized under “Equity adjustments from business combination under
common control” account in the equity section of the consolidated balance sheet.
When the Group acquires a business, it assesses the financial assets and liabilities assumed for
appropriate classification and designation in accordance with the contractual terms, economic
circumstances and pertinent conditions as at the acquisition date. This includes the separation of
embedded derivatives in host contracts by the acquiree.
If the business combination is achieved in stages, the acquisition date fair value of the acquirer’s
previously held equity interest in the acquiree is remeasured at its acquisition date fair value and
any resulting gain or loss is recognized in profit or loss. It is then considered in the determination
of goodwill.
Any contingent consideration to be transferred by the acquirer will be recognized at fair value at
the acquisition date. Subsequent changes to the fair value of the contingent consideration which is
deemed to be an asset or liability, will be recognized in accordance with PAS 39 either in profit or
loss or as a change to other comprehensive income. If the contingent consideration is classified as
equity, it should not be remeasured and subsequent settlement is accounted for within equity.
Acquisitions of Non-controlling Interests. Changes in the Parent Company’s ownership interest in
a subsidiary that do not result in a loss of control are accounted for as equity transactions
(i.e., transactions with owners in their capacity as owners). In such circumstances, the carrying
amounts of the controlling and non-controlling interests shall be adjusted to reflect the changes in
their relative interests in the subsidiary. Any difference between the amount by which the
non-controlling interests are adjusted and the fair value of the consideration paid shall be
recognized directly in equity.
Goodwill
Initial Measurement of Goodwill or Gain on a Bargain Purchase. Goodwill is initially measured
by the Group at cost being the excess of the aggregate of the consideration transferred and the
amount recognized for non-controlling interest over the net identifiable assets acquired and
liabilities assumed. If this consideration is lower than the fair value of the net assets of the
subsidiary acquired, the difference is recognized in profit or loss as gain on a bargain purchase.
Before recognizing a gain on a bargain purchase, the Group determines whether it has correctly
identified all of the assets acquired and all of the liabilities assumed and recognize any additional
assets or liabilities that are identified.
Subsequent Measurement of Goodwill. Following initial recognition, goodwill is measured at cost
less any accumulated impairment losses.
Impairment Testing of Goodwill. For the purpose of impairment testing, goodwill acquired in a
business combination is, from the acquisition-date, allocated to each of the Group’s
cash-generating units (CGU), or groups of CGUs, that are expected to benefit from the synergies
of the combination, irrespective of whether other assets or liabilities of the acquiree are assigned
to those units or groups of units. Each unit or group of units to which the goodwill is allocated:
represents the lowest level within the Group at which the goodwill is monitored for internal
management purposes; and
- 16 is not larger than an operating segment as defined in PFRS 8, Operating Segments, before
aggregation.
Frequency of Impairment Testing. Irrespective of whether there is any indication of impairment,
the Company tests goodwill acquired in a business combination for impairment at least annually.
Allocation of Impairment Loss. An impairment loss is recognized for a CGU if the recoverable
amount of the unit or group of units is less than the carrying amount of the unit or group of units.
The impairment loss is allocated to reduce the carrying amount of the assets of the unit or group of
units first to reduce the carrying amount of goodwill allocated to the CGU or group of units and
then to the other assets of the unit or group of units pro rata on the basis of the carrying amount of
each asset in the unit or group of units.
Measurement Period. If the initial accounting for a business combination is incomplete by the end
of the reporting period in which the combination occurs, the Group reports in its consolidated
financial statements provisional amounts for the items for which the accounting is incomplete. The
measurement period ends as soon as the Group receives the information it was seeking about facts
and circumstances that existed as of the acquisition date or learns that more information is not
obtainable. The measurement period shall not exceed one year from the acquisition date.
Intangible Assets
The cost of trademarks and brand names acquired in a business combination is the fair value as at
the date of acquisition. The Group assessed the useful life of the trademarks and brand names to
be indefinite because based on an analysis of all of the relevant factors, there is no foreseeable
limit to the period over which the asset is expected to generate cash inflows for the Group.
Trademarks and brand names with indefinite useful lives are not amortized but are tested for
impairment annually either individually or at the cash generating unit level. The useful life of an
intangible asset is reviewed annually to determine whether the indefinite life assessment continues
to be supportable. If not, the change in the useful life assessment from indefinite to finite is made
on a prospective basis.
Gains or losses arising from derecognition of an intangible asset are measured as the difference
between the net disposal proceeds and the carrying amount of the asset at the date of disposal and
are recognized in the consolidated statement of income when the asset is derecognized.
Impairment of Nonfinancial Assets
The carrying values (property and equipment, investment properties and investments in shares of
stock of associates and joint ventures, intagibles and other noncurrent assets) are reviewed for
impairment when events or changes in circumstances indicate that the carrying value may not be
recoverable. If any such indication exists, and if the carrying value exceeds the estimated
recoverable amount, the assets or CGUs are written down to their recoverable amounts. The
recoverable amount of the asset is the greater of fair value less costs to sell or value in use. The
fair value less costs to sell is the amount obtainable from the sale of an asset in an arm’s-length
transaction between knowledgeable, willing parties, less costs of disposal. In assessing value in
use, the estimated future cash flows are discounted to their present value using a pre-tax discount
rate that reflects current market assessments of the time value of money and the risks specific to
the asset. For an asset that does not generate largely independent cash inflows, the recoverable
amount is determined for the CGU to which the asset belongs. Impairment losses are recognized
in the consolidated statement of income in those expense categories consistent with the function of
the impaired asset.
- 17 -
An assessment is made at each reporting date as to whether there is any indication that previously
recognized impairment loss may no longer exist or may have decreased. If such indication exists,
the recoverable amount is estimated. A previously recognized impairment loss is reversed only if
there has been a change in the estimates used to determine the asset’s recoverable amount since
the last impairment loss was recognized. If that is the case, the carrying amount of the asset is
increased to its recoverable amount. That increased amount cannot exceed the carrying amount
that would have been determined, net of depreciation and amortization, had no impairment loss
been recognized for the asset in prior years. Such reversal is recognized in consolidated statement
of income. After such a reversal, the depreciation or amortization charge is adjusted in future
periods to allocate the asset’s revised carrying amount, less any residual value, on a systematic
basis over its remaining useful life.
Capital Stock
Capital stock is measured at par value for all shares issued. Incremental costs incurred directly
attributable to the issuance of new shares are shown in equity as deduction from proceeds, net of
tax. Proceeds and/or fair value of considerations received in excess of par value, if any, are
recognized as additional paid-in capital.
Revenue
Revenue is recognized when it is probable that the economic benefits associated with the
transaction will flow to the Group and the amount of the revenue can be reliably measured.
Revenue is measured at the fair value of the consideration received or receivable, excluding
discounts, rebates and sales taxes or duties. The Group assesses its revenue arrangements against
specific criteria in order to determine if it is acting as a principal or as an agent. The Group has
concluded that it is acting as principal in majority of its revenue arrangements. The following
specific recognition criteria must also be met before revenue is recognized:
Sale of Merchandise Inventories. Revenue is recognized when the significant risks and rewards of
ownership of the goods have passed to the buyer, which is normally upon delivery. Sales returns
and sales discounts are deducted from sales to arrive at sales shown in the consolidated statement
of income.
Sale of goods under consignment arrangements with suppliers is recognized as revenue upon
billing, delivery and transfer of goods to customers.
Sale of Real Estate. The Group assesses whether it is probable that the economic benefits will
flow to the Group when the sales prices are collectible. Collectibility of the contract price is
demonstrated by the buyer’s commitment to pay, which is supported by the buyer’s initial and
continuous investments that motivates the buyer to honor its obligation. Collectibility is also
assessed by considering factors such as collections, credit standing of the buyer and location of the
property.
Revenue from sales of completed real estate projects is accounted for using the full accrual
method. In accordance with Philippine Interpretations Committee Q&A No. 2006-01, the
percentage-of-completion method is used to recognize income from sales of projects where the
Group has material obligations under the sales contract to complete the project after the property is
sold, the equitable interest has been transferred to the buyer, construction is beyond preliminary
stage (i.e., engineering, design work, construction contracts execution, site clearance and
preparation, excavation and the building foundation are finished), and the costs incurred or to be
incurred can be measured reliably. Under this method, revenue is recognized as the related
obligations are fulfilled, measured principally on the basis of the estimated completion of a
physical proportion of the contract work.
- 18 -
Any excess of collections over the recognized receivables are included in the “Tenants’ deposits
and others” account in the consolidated balance sheets. If any of the criteria under the full accrual
or percentage-of-completion method is not met, the deposit method is applied until all the
conditions for recording a sale are met. Pending recognition of sale, cash received from buyers
are presented under the “Tenants’ deposits and others” account in the consolidated balance sheets.
Revenue from construction contracts included in the “Revenue from real estate and others”
account in the consolidated statement of income is recognized using the percentage-of-completion
method, measured principally on the basis of the estimated physical completion of the contract
work.
Rent. Revenue is recognized on a straight-line basis over the lease term or based on the terms of
the lease as applicable.
Sale of Cinema and Amusement Tickets. Revenue is recognized upon receipt of cash from the
customer which coincides with the rendering of services.
Gain on Sale of Investments in Shares of Stock and Available-for-Sale Investments. Revenue is
recognized upon delivery of the securities to and confirmation of the sale by the broker.
Dividend. Revenue is recognized when the Group’s right as a shareholder to receive the payment
is established.
Management and Service Fees. Revenue is recognized when earned in accordance with the terms
of the agreements.
Marketing Support. Revenue is recognized when the performance and provision of contractually
agreed marketing tasks have been rendered and store facilities have been used. Marketing support
is shown under “Others” account in the consolidated statement of income.
Interest. Revenue is recognized as the interest accrues, taking into account the effective yield on
the asset.
Management Fees
Management fees are recognized as expense in accordance with the terms of the agreements.
Cost and Expenses
Cost of Real Estate Sales. Cost of real estate sales is recognized consistent with the revenue
recognition method applied. Cost of condominium units sold before the completion of the
development is determined on the basis of the acquisition cost of the land plus its full development
costs, which include estimated costs for future development works.
The cost of inventory recognized in the consolidated statement of income upon sale is determined
with reference to the specific costs incurred on the property, allocated to saleable area based on
relative size and takes into account the percentage of completion used for revenue recognition
purposes.
Expected losses on contracts are recognized immediately when it is probable that the total contract
costs will exceed total contract revenue. Changes in the estimated cost to complete the
condominium project which affects cost of real estate sold and gross profit are recognized in the
year in which changes are determined.
- 19 -
Selling, General, Administrative and Other Expenses. Costs and expenses are recognized as
incurred.
Pension Benefits
The net defined benefit liability or asset is the aggregate of the present value of the defined benefit
obligation at the end of the reporting period reduced by the fair value of plan assets (if any),
adjusted for any effect of limiting a net defined benefit asset to the asset ceiling. The asset ceiling
is the present value of any economic benefits available in the form of refunds from the plan or
The cost of providing benefits under the defined benefit plans is actuarially determined using the
projected unit credit method.
Defined benefit costs comprise the following:
Service cost
Net interest on the net defined benefit liability or asset
Remeasurements of net defined benefit liability or asset
Service costs which include current service costs, past service costs and gains or losses on
non-routine settlements are recognized as expense in profit or loss. Past service costs are
recognized in profit or loss on the earlier of the date of the plan amendment or curtailment, and the
date the Group recognizes restructuring-related costs. These amounts are calculated periodically
by independent qualified actuaries.
Net interest on the net defined benefit liability or asset is the change during the period in the net
defined benefit liability or asset that arises from the passage of time which is determined by
applying the discount rate based on government bonds to the net defined benefit liability or asset.
Net interest on the net defined benefit liability or asset is recognized as expense or income in
profit or loss.
Remeasurements comprising actuarial gains and losses, return on plan assets and any change in
the effect of the asset ceiling (excluding net interest on defined benefit liability) are recognized
immediately in other comprehensive income in the period in which they arise. Remeasurements
are not reclassified to profit or loss in subsequent periods.
Plan assets are assets that are held by a long-term employee benefit fund or qualifying insurance
policies. Plan assets are not available to the creditors of the Group, nor can they be paid directly to
the Group. Fair value of plan assets is based on market price information. When no market price
is available, the fair value of plan assets is estimated by discounting expected future cash flows
using a discount rate that reflects both the risk associated with the plan assets and the maturity or
expected disposal date of those assets (or, if they have no maturity, the expected period until the
settlement of the related obligations). If the fair value of the plan assets is higher than the present
value of the defined benefit obligation, the measurement of the resulting defined benefit asset is
limited to the present value of economic benefits available in the form of refunds from the plan or
reductions in future contributions to the plan.
The Group’s right to be reimbursed of some or all of the expenditure required to settle a defined
benefit obligation is recognized as a separate asset at fair value when and only when
reimbursement is virtually certain.
Foreign Currency-denominated Transactions
The consolidated financial statements are presented in Philippine peso, which is the Parent
Company’s functional and presentation currency. Transactions in foreign currencies are initially
- 20 -
recorded in the functional currency rate at the date of the transaction. Monetary assets and
liabilities denominated in foreign currencies are restated at the functional currency rate of
exchange as at reporting date. Nonmonetary items denominated in foreign currency are translated
using the exchange rates as at the date of initial recognition. All differences are taken to the
consolidated statement of income.
Foreign Currency Translation
The assets and liabilities of foreign operations are translated into Philippine peso at the rate of
exchange ruling as at reporting date and their respective statements of income are translated at the
weighted average rates for the year. The exchange differences arising on the translation are
included in the consolidated statement of comprehensive income and are presented within the
“Cumulative translation adjustment of a subsidiary” account in the consolidated statement of
changes in equity. On disposal of a foreign entity, the deferred cumulative amount of exchange
differences recognized in equity relating to that particular foreign operation is recognized in the
profit or loss.
Leases
The determination of whether an arrangement is, or contains a lease is based on the substance of
the arrangement and requires an assessment of whether the fulfillment of the arrangement is
dependent on the use of a specific asset or assets and the arrangement conveys a right to use the
asset.
Group as Lessee. Finance leases, which transfer to the Group substantially all the risks and
benefits incidental to ownership of the leased item, are capitalized at the inception of the lease at
the fair value of the leased property or, if lower, at the present value of the minimum lease
payments. Lease payments are apportioned between the finance charges and reduction of the lease
liability so as to achieve a constant rate of interest on the remaining balance of the liability.
Finance charges are reflected in the consolidated statement of income.
Capitalized leased assets are depreciated over the shorter of the estimated useful life of the asset
and the lease term, if there is no reasonable certainty that the Group will obtain ownership by the
end of the lease term.
Leases which do not transfer to the Group substantially all the risks and benefits of ownership of
the asset are classified as operating leases. Operating lease payments are recognized as expense in
the consolidated statement of income on a straight-line basis over the lease term. Associated
costs, such as maintenance and insurance, are expensed as incurred.
Group as Lessor. Leases where the Group does not transfer substantially all the risks and benefits
of ownership of the asset are classified as operating leases. Lease income from operating leases
are recognized as income on a straight-line basis over the lease term. Initial direct costs incurred
in negotiating an operating lease are added to the carrying amount of the leased asset and
recognized over the lease term on the same basis as rental income. Contingent rents are
recognized as revenue in the period in which they are earned.
Provisions
Provisions are recognized when the Group has a present obligation (legal or constructive) as a
result of a past event, it is probable that an outflow of resources embodying economic benefits will
be required to settle the obligation, and a reliable estimate can be made of the amount of the
obligation. If the effect of the time value of money is material, provisions are determined by
discounting the expected future cash flows at a pre-tax rate that reflects current market
assessments of the time value of money and, where appropriate, the risks specific to the liability.
- 21 -
Where discounting is used, the increase in the provision due to the passage of time is recognized
as interest expense. Where the Group expects a provision to be reimbursed, the reimbursement is
recognized as a separate asset but only when the receipt of the reimbursement is virtually certain.
Borrowing Costs
Borrowing costs are capitalized as part of the cost of the asset if they are directly attributable to
the acquisition or construction of a qualifying asset. Capitalization of borrowing costs commences
when the activities to prepare the asset are in progress and expenditures and borrowing costs are
being incurred. Borrowing costs are capitalized until the assets are substantially ready for their
intended use. Borrowing costs are capitalized when it is probable that they will result in future
economic benefits to the Group. All other borrowing costs are expensed as incurred. For
borrowing associated with a specific asset, the actual rate on that borrowing is used. Otherwise, a
weighted average cost of borrowings is used.
Taxes
Current Tax. Current tax assets and liabilities for the current and prior periods are measured at the
amount expected to be recovered from or paid to the taxation authorities. The tax rates and tax
laws used to compute the amount are those that are enacted or substantively enacted as at the end
of the reporting period.
Deferred Tax. Deferred tax is provided, using the balance sheet liability method, on temporary
differences at the end of the reporting period between the tax bases of assets and liabilities and
their carrying amounts for financial reporting purposes. Deferred tax liabilities are recognized for
all taxable temporary differences, except:
where the deferred tax liability arises from the initial recognition of goodwill or of an asset or
liability in a transaction that is not a business combination and, at the time of the transaction,
affects neither the accounting profit nor taxable profit or loss; and
with respect to taxable temporary differences associated with investments in subsidiaries,
associates and interests in joint ventures, where the timing of the reversal of the temporary
differences can be controlled and it is probable that the temporary differences will not reverse
in the foreseeable future.
Deferred tax assets are recognized for all deductible temporary differences and carryforward
benefits of excess MCIT and NOLCO, to the extent that it is probable that taxable profit will be
available against which the deductible temporary differences and the carryforward benefits of
excess MCIT and NOLCO can be utilized, except:
where the deferred tax asset relating to the deductible temporary difference arises from the
initial recognition of an asset or liability in a transaction that is not a business combination
and, at the time of the transaction, affects neither the accounting profit nor taxable profit or
loss; and
with respect to deductible temporary differences associated with investments in subsidiaries,
associates and interests in joint ventures, deferred tax assets are recognized only to the extent
that it is probable that the temporary differences will reverse in the foreseeable future and
taxable profit will be available against which the temporary differences can be utilized.
The carrying amount of deferred tax assets is reviewed at the end of each reporting period and
reduced to the extent that it is no longer probable that sufficient taxable profit will be available to
allow all or part of the deferred income tax assets to be utilized. Unrecognized deferred tax assets
are reassessed at the end of each reporting period and are recognized to the extent that it has
become probable that future taxable profit will allow the deferred tax assets to be recovered.
- 22 -
Deferred tax assets and liabilities are measured at the tax rates that are expected to apply to the
period the asset is realized or the liability is settled, based on tax rates and tax laws that have been
enacted or substantively enacted as at reporting date.
Income tax relating to items recognized directly in the consolidated statement of comprehensive
income is recognized in the consolidated statement of comprehensive income and not in the
consolidated statement of income.
Deferred tax assets and deferred tax liabilities are offset, if a legally enforceable right exists to
offset current tax assets against current tax liabilities and the deferred taxes relate to the same
taxable entity and the same taxation authority.
Value-added Tax (VAT). Revenue, expenses and assets are recognized net of the amount of VAT,
except:
where the tax incurred on a purchase of assets or services is not recoverable from the taxation
authority, in which case the tax is recognized as part of the cost of acquisition of the asset or
as part of the expense item as applicable; and
for receivables and payables that are stated with the amount of tax included.
The net amount of VAT recoverable from, or payable to, the taxation authority is included as part
of “Other current assets” or “Accounts payable and other current liabilities” accounts in the
consolidated balance sheets.
Business Segments
The Group is organized and managed separately according to the nature of business. The three
major operating businesses of the Group are property, retail and financial services and others.
These operating businesses are the basis upon which the Group reports its segment information
presented in Note 6 to the consolidated financial statements.
Basic/Diluted Earnings Per Common Share (EPS)
Basic EPS is computed by dividing the net income for the period attributable to owners of the
Parent by the weighted-average number of issued and outstanding common shares during the
period, with retroactive adjustment for any stock dividends declared.
For the purpose of computing diluted EPS, the net income for the period attributable to owners of
the Parent and the weighted-average number of issued and outstanding common shares are
adjusted for the effects of all dilutive potential ordinary shares.
Contingencies
Contingent liabilities are not recognized in the consolidated financial statements. They are
disclosed unless the possibility of an outflow of resources embodying economic benefits is
remote. Contingent assets are not recognized in the consolidated financial statements but are
disclosed when an inflow of economic benefits is probable.
- 23 -
Events after the Reporting Period
Post year-end events that provide additional information about the Group’s position at the end of
the reporting period (adjusting events) are reflected in the consolidated financial statements. Post
year-end events that are not adjusting events are disclosed in the notes to the consolidated
financial statements when material.
Cha nges in Accounting Policies and Disclosures
The accounting policies adopted are consistent with those of the previous financial year, except for
the adoption of the following amended PFRS, which were adopted starting January 1, 2013. The
adoption of the following amended standards and interpretations did not have any impact on the
Group’s consolidated financial statements, except when otherwise indicated:
PFRS 7, Financial Instruments: Disclosures – Offsetting Financial Statements and Financial
Liabilities (Amendments)
PFRS 10, Consolidated Financial Statements
PFRS 11, Joint Arrangements
PFRS 12, Disclosure of Interests in Other Entities
PFRS 13, Fair Value Measurement
PAS 1, Presentation of Financial Statements - Presentation of Items of Other Comprehensive
Income or OCI (Amendments)
PAS 19, Employee Benefits (Revised)
PAS 27, Separate Financial Statements (as revised in 2011)
PAS 28, Investments in Associates and Joint Ventures (as revised in 2011)
Philippine Interpretation IFRIC 20, Stripping Costs in the Production Phase of a Surface Mine
Philippine Interpretations Committee Q&A No. 2013-03, Accounting for Employee Benefits
under a Defined Contribution Plan Subject to Requirements of Republic Act 7641, The
Philippine Retirement Law
2012 improvements to PFRSs, effective 2013.
Adoption of Revised PAS 19
For defined benefit plans, the Revised PAS 19 requires all remeasurements actuarial gains and
losses to be recognized in other comprehensive income and unvested past service costs previously
recognized over the average vesting period to be recognized immediately in profit or loss when
incurred.
Prior to adoption of the Revised PAS 19, the Group recognized actuarial gains and losses as
income or expense when the net cumulative unrecognized gains and losses for each individual
plan at the end of the previous period exceeded 10% of the higher of the defined benefit obligation
and the fair value of the plan assets and recognized unvested past service costs as an expense on a
straight-line basis over the average vesting period until the benefits become vested.
- 24 -
Upon adoption of the Revised PAS 19, the Group changed its accounting policy to recognize all
remeasurements in other comprehensive income, which will not be reclassified to profit or loss in
subsequent periods, and all past service costs in profit or loss in the period they occur. Moving
forward, the Group will retain the remeasurements in other comprehensive income and will not
transfer this to other items of equity.
The revised PAS 19 replaced the interest cost and expected return on plan assets with the concept
of net interest on defined benefit liability or asset which is calculated by multiplying the net
balance sheet defined benefit liability or asset by the discount rate used to measure the employee
benefit obligation, each as at the beginning of the annual period.
The revised PAS 19 also amended the definition of short-term employee benefits and requires
employee benefits to be classified as short-term based on expected timing of settlement rather than
the employee’s entitlement to the benefits. In addition, the Revised PAS 19 modifies the timing of
recognition for termination benefits. The modification requires the termination benefits to be
recognized at the earlier of when the offer cannot be withdrawn or when the related restructuring
costs are recognized.
The changes to the definition of short-term employee benefits and the timing of recognition for
termination benefits do not have any impact to the Group’s financial position and financial
performance.
The Group reviewed its existing employee benefits and determined that the amended standard has
an impact on its accounting for pension benefits. The effect of the adoption of the
Revised PAS 19 as at January 1, 2013 amounted to P
=38.2 million. This was recorded in the
current year profit or loss as reduction pension benefit expense, instead of a retrospective
adjustment as required by the Revised PAS 19, as the impact is not material. On this basis, the
Group’s consolidated statement of financial position at the beginning of the earliest comparative
period was also not presented.
The adoption increased earnings per share by P
=0.05 in 2013 (see Note 26). It did not have impact
on the consolidated statement of cash flows for the three months ended March 31, 2014.
Future Changes in Accounting Policies
The following are the new standards, interpretations, amendments and improvements to PFRS and
Philippine Interpretations that were issued but are not yet effective as at December 31, 2013. The
Group intends to adopt the applicable standards, interpretations, amendments and improvements
when these become effective.
New Standards and Interpretations
PAS 36, Impairment of Assets - Recoverable Amount Disclosures for Non-Financial Assets
(Amendments). These amendments remove the unintended consequences of PFRS 13 on the
disclosures required under PAS 36. In addition, these amendments require disclosure of the
recoverable amounts for the assets or cash-generating units (CGUs) for which impairment loss
has been recognized or reversed during the period. These amendments are effective
retrospectively for annual periods beginning on or after January 1, 2014 with earlier
application permitted, provided PFRS 13 is also applied. The amendments affect disclosures
only and have no impact on the Group’s financial position or performance.
Investment Entities (Amendments to PFRS 10, PFRS 12 and PAS 27). These amendments are
effective for annual periods beginning on or after January 1, 2014. They provide an exception
- 25 -
to the consolidation requirement for entities that meet the definition of an investment entity
under PFRS 10. The exception to consolidation requires investment entities to account for
subsidiaries at fair value through profit or loss. It is not expected that this amendment would
be relevant to the Group since none of the entities in the Group would qualify to be an
investment entity under PFRS 10.
Philippine Interpretation IFRIC 21, Levies (IFRIC 21). IFRIC 21 clarifies that an entity
recognizes a liability for a levy when the activity that triggers payment, as identified by the
relevant legislation, occurs. For a levy that is triggered upon reaching a minimum threshold,
the interpretation clarifies that no liability should be anticipated before the specified minimum
threshold is reached. IFRIC 21 is effective for annual periods beginning on or after January 1,
2014. The Group does not expect that IFRIC 21 will have material financial impact in future
financial statements.
PAS 39, Financial Instruments: Recognition and Measurement - Novation of Derivatives and
Continuation of Hedge Accounting (Amendments). These amendments provide relief from
discontinuing hedge accounting when novation of a derivative designated as a hedging
instrument meets certain criteria. These amendments are effective for annual periods
beginning on or after January 1, 2014. The Group has not novated its derivatives during the
current period. However, these amendments would be considered for future novations.
PAS 32, Financial Instruments: Presentation - Offsetting Financial Assets and Financial
Liabilities (Amendments). The amendments clarify the meaning of “currently has a legally
enforceable right to set-off” and also clarify the application of the PAS 32 offsetting criteria to
settlement systems (such as central clearing house systems) which apply gross settlement
mechanisms that are not simultaneous. The amendments affect presentation only and have no
impact on the Group’s financial position or performance. The amendments to PAS 32 are to
be retrospectively applied for annual periods beginning on or after January 1, 2014.
PAS 19, Employee Benefits – Defined Benefit Plans: Employee Contributions (Amendments),
apply to contributions from employees or third parties to defined benefit plans. Contributions
that are set out in the formal terms of the plan shall be accounted for as reductions to current
service costs if they are linked to service or as part of the remeasurements of the net defined
benefit asset or liability if they are not linked to service. Contributions that are discretionary
shall be accounted for as reductions of current service cost upon payment of these
contributions to the plans. The amendments to PAS 19 are to be retrospectively applied for
annual periods beginning on or after July 1, 2014. The amendments have no impact in the
Group’s financial position and performance.
Annual Improvements to PFRSs (2010–2012 cycle)
The Annual Improvements to PFRSs (2010–2012 cycle) contain non-urgent but necessary
amendments to the following standards:
•
PFRS 2, Share-based Payment – Definition of Vesting Condition. The amendment
revised the definitions of vesting condition and market condition and added the
definitions of performance condition and service condition to clarify various issues.
This amendment shall be prospectively applied to share-based payment transactions for
which the grant date is on or after July 1, 2014. This amendment does not apply to the
Group as it has no share-based payments.
•
PFRS 3, Business Combinations – Accounting for Contingent Consideration in a
Business Combination. The amendment clarifies that a contingent consideration that
meets the definition of a financial instrument should be classified as a financial liability
- 26 -
or as equity in accordance with PAS 32. Contingent consideration that is not classified
as equity is subsequently measured at fair value through profit or loss whether or not it
falls within the scope of PFRS 9 (or PAS 39, if PFRS 9 is not yet adopted). The
amendment shall be prospectively applied to business combinations for which the
acquisition date is on or after July 1, 2014. The Group shall consider this amendment in
future business combinations.
•
PFRS 8, Operating Segments – Aggregation of Operating Segments and Reconciliation
of the Total of the Reportable Segments’ Assets to the Entity’s Assets. The amendments
require entities to disclose the judgment made by management in aggregating two or
more operating segments. This disclosure should include a brief description of the
operating segments that have been aggregated in this way and the economic indicators
that have been assessed in determining that the aggregated operating segments share
similar economic characteristics. The amendments also clarify that an entity shall
provide reconciliations of the total of the reportable segments’ assets to the entity’s
assets if such amounts are regularly provided to the chief operating decision maker.
These amendments are effective for annual periods beginning on or after July 1, 2014
and are applied retrospectively. The amendments affect disclosures only and have no
impact on the Group’s financial position or performance.
•
PFRS 13, Fair Value Measurement – Short-term Receivables and Payables. The
amendment clarifies that short-term receivables and payables with no stated interest
rates can be held at invoice amounts when the effect of discounting is immaterial.
•
PAS 16, Property, Plant and Equipment – Revaluation Method – Proportionate
Restatement of Accumulated Depreciation. The amendment clarifies that, upon
revaluation of an item of property, plant and equipment, the carrying amount of the asset
shall be adjusted to the revalued amount, and the asset shall be treated in one of the
following ways:
a. The gross carrying amount is adjusted in a manner that is consistent with the
revaluation of the carrying amount of the asset. The accumulated depreciation at
the date of revaluation is adjusted to equal the difference between the gross carrying
amount and the carrying amount of the asset after taking into account any
accumulated impairment losses.
b. The accumulated depreciation is eliminated against the gross carrying amount of the
asset.
The amendment is effective for annual periods beginning on or after July 1, 2014. The
amendment shall apply to all revaluations recognized in annual periods beginning on or
after the date of initial application of this amendment and in the immediately preceding
annual period. The amendment has no impact on the Group’s financial position or
performance as it does not have property, plant and equipment carried at revalued
amounts.
•
PAS 24, Related Party Disclosures – Key Management Personnel. The amendments
clarify that an entity is a related party of the reporting entity if the said entity, or any
member of a group for which it is a part of, provides key management personnel
services to the reporting entity or to the parent company of the reporting entity. The
amendments also clarify that a reporting entity that obtains management personnel
services from another entity (also referred to as management entity) is not required to
disclose the compensation paid or payable by the management entity to its employees or
- 27 -
directors. The reporting entity is required to disclose the amounts incurred for the key
management personnel services provided by a separate management entity. The
amendments are effective for annual periods beginning on or after July 1, 2014 and are
applied retrospectively. The amendments affect disclosures only and have no impact on
the Group’s financial position or performance.
•
PAS 38, Intangible Assets – Revaluation Method – Proportionate Restatement of
Accumulated Amortization. The amendments clarify that, upon revaluation of an
intangible asset, the carrying amount of the asset shall be adjusted to the revalued
amount, and the asset shall be treated in one of the following ways:
a. The gross carrying amount is adjusted in a manner that is consistent with the
revaluation of the carrying amount of the asset. The accumulated amortization at
the date of revaluation is adjusted to equal the difference between the gross carrying
amount and the carrying amount of the asset after taking into account any
accumulated impairment losses.
b. The accumulated amortization is eliminated against the gross carrying amount of the
asset.
The amendments also clarify that the amount of the adjustment of the accumulated
amortization should form part of the increase or decrease in the carrying amount
accounted for in accordance with the standard.
The amendments are effective for annual periods beginning on or after July 1, 2014.
The amendments shall apply to all revaluations recognized in annual periods beginning
on or after the date of initial application of this amendment and in the immediately
preceding annual period. The amendments have no impact on the Group’s financial
position or performance as it does not have intangible assets carried at revalued
amounts.
Annual Improvements to PFRSs (2011–2013 cycle)
The Annual Improvements to PFRSs (2011–2013 cycle) contain non-urgent but necessary
amendments to the following standards:
•
PFRS 1, First-time Adoption of Philippine Financial Reporting Standards – Meaning of
‘Effective PFRSs’. The amendment clarifies that an entity may choose to apply either a
current standard or a new standard that is not yet mandatory, but that permits early
application, provided either standard is applied consistently throughout the periods
presented in the entity’s first PFRS financial statements. This amendment is not
applicable to the Group as it is not a first-time adopter of PFRS.
•
PFRS 3, Business Combinations – Scope Exceptions for Joint Arrangements. The
amendment clarifies that PFRS 3 does not apply to the accounting for the formation of a
joint arrangement in the financial statements of the joint arrangement itself. The
amendment is effective for annual periods beginning on or after July 1 2014 and is
applied prospectively.
•
PFRS 13, Fair Value Measurement – Portfolio Exception. The amendment clarifies that
the portfolio exception in PFRS 13 can be applied to financial assets, financial liabilities
and other contracts. The amendment is effective for annual periods beginning on or
- 28 -
after July 1 2014 and is applied prospectively. The amendment has no significant
impact on the Group’s financial position or performance.
•
PAS 40, Investment Property. The amendment clarifies the interrelationship between
PFRS 3 and PAS 40 when classifying property as investment property or owneroccupied property. The amendment stated that judgment is needed when determining
whether the acquisition of investment property is the acquisition of an asset or a group
of assets or a business combination within the scope of PFRS 3. This judgment is based
on the guidance of PFRS 3. This amendment is effective for annual periods beginning
on or after July 1, 2014 and is applied prospectively. The Group shall consider this
amendment in future acquisitions of investment properties.
PFRS 9, Financial Instruments. PFRS 9, as issued, reflects the first and third phases of the
project to replace PAS 39 and applies to the classification and measurement of financial assets
and liabilities and hedge accounting, respectively. Work on the second phase, which relate to
impairment of financial instruments, and the limited amendments to the classification and
measurement model is still ongoing, with a view to replace PAS 39 in its entirety. PFRS 9
requires all financial assets to be measured at fair value at initial recognition. A debt financial
asset may, if the fair value option (FVO) is not invoked, be subsequently measured at
amortized cost if it is held within a business model that has the objective to hold the assets to
collect the contractual cash flows and its contractual terms give rise, on specified dates, to
cash flows that are solely payments of principal and interest on the principal outstanding. All
other debt instruments are subsequently measured at fair value through profit or loss. All
equity financial assets are measured at fair value either through other comprehensive income
(OCI) or profit or loss. Equity financial assets held for trading must be measured at fair value
through profit or loss. For liabilities designated as at FVPL using the fair value option, the
amount of change in the fair value of a liability that is attributable to changes in credit risk
must be presented in OCI. The remainder of the change in fair value is presented in profit or
loss, unless presentation of the fair value change relating to the entity’s own credit risk in OCI
would create or enlarge an accounting mismatch in profit or loss. All other PAS 39
classification and measurement requirements for financial liabilities have been carried forward
to PFRS 9, including the embedded derivative bifurcation rules and the criteria for using the
FVO. The adoption of the first phase of PFRS 9 will have an effect on the classification and
measurement of the Group’s financial assets, but will potentially have no impact on the
classification and measurement of financial liabilities.
On hedge accounting, PFRS 9 replaces the rules-based hedge accounting model of
PAS 39 with a more principles-based approach. Changes include replacing the rules-based
hedge effectiveness test with an objectives-based test that focuses on the economic
relationship between the hedged item and the hedging instrument, and the effect of credit risk
on that economic relationship; allowing risk components to be designated as the hedged item,
not only for financial items, but also for non-financial items, provided that the risk component
is separately identifiable and reliably measurable; and allowing the time value of an option,
the forward element of a forward contract and any foreign currency basis spread to be
excluded from the designation of a financial instrument as the hedging instrument and
accounted for as costs of hedging. PFRS 9 also requires more extensive disclosures for hedge
accounting.
PFRS 9 currently has no mandatory effective date. PFRS 9 may be applied before the
completion of the limited amendments to the classification and measurement model and
impairment methodology. The Group will not adopt the standard before the completion of the
limited amendments and the second phase of the project.
- 29 Philippine Interpretation IFRIC 15, Agreements for the Construction of Real Estate, covers
accounting for revenue and associated expenses by entities that undertake the construction of
real estate directly or through subcontractors. The interpretation requires that revenue on
construction of real estate be recognized only upon completion, except when such contract
qualifies as construction contract to be accounted for under PAS 11, Construction Contracts,
or involves rendering of services in which case revenue is recognized based on stage of
completion. Contracts involving provision of services with the construction materials and
where the risks and reward of ownership are transferred to the buyer on a continuous basis
will also be accounted for based on stage of completion. The SEC and the Financial
Reporting Standards Council have deferred the effectivity of this interpretation until the final
Revenue standard is issued by the International Accounting Standards Board and an
evaluation of the requirements of the final Revenue standard against the practices of the
Philippine real estate industry is completed. The adoption of this interpretation will result to a
change in the revenue and cost recognition from percentage of completion method to
completed contract method. The Group has made an assessment and is continuously
monitoring the impact of this new interpretation to its consolidated financial statements.
4. Segment Information
For management purposes, the Group is organized into business units based on their products and
services. As a result of the corporate restructuring in 2013, the Group changed the presentation of
its segment information and has identified three reportable operating segments as follows:
property, retail, and financial services and others. Segment information in the comparative years
were restated for this change.
The property segment is involved in mall, residential and commercial development and hotels and
convention centers operations. The mall segment develops, conducts, operates and maintains the
business of modern commercial shopping centers and all businesses related thereto such as the
conduct, operation and maintenance of shopping center spaces for rent, amusement centers, or
cinema theaters within the compound of the shopping centers. Residential and commercial
segments are involved in the development and transformation of major residential, commercial,
entertainment and tourism districts through sustained capital investments in buildings and
infrastructure. The hotels and convention centers segment engages in and carries on the business
of hotels and convention centers and operates and maintains any and all services and facilities
incident thereto.
The retail segment is engaged in the retail/wholesale trading of merchandise, such as dry goods,
wearing apparels, food and other merchandise.
The financial services and others segment primarily includes the Parent Company which engages
in asset management and capital investments, and associates which are involved in financial
services.
Management monitors the operating results of its business units separately for the purpose of
making decisions about resource allocation and performance assessment. Segment performance is
evaluated based on operating profit or loss and is measured consistently with the operating profit
or loss in the consolidated financial statements.
The amount of segment assets and liabilities and segment profit or loss are based on measurement
principles that are similar to those used in measuring the assets and liabilities and profit or loss in
the consolidated financial statements, which is in accordance with PFRS.
- 30 -
Inter-segment transactions are eliminated in the consolidated financial statements.
Business Segment Data
Revenue:
External customers
Inter-segment
Property
Retail
P
= 15,110,292
1,543,111
P
=16,653,403
P
= 42,820,667
597
P
= 42,821,264
March 31, 2014
Financial Services
and Others
(In Thousands)
Eliminations
Consolidated
P
= 2,465,747
2,393,301
P
= 4,859,048
P
=–
(3,937,009)
(P
= 3,937,009)
P
= 60,396,706
–
P
= 60,396,706
Segment results:
Income before income tax
Provision for income tax
Net income
P
= 5,919,781
(1,205,678)
P
= 4,714,103
P
= 1,788,139
(531,553)
P
= 1,256,586
P
= 1,842,432
(76,340)
P
= 1,766,092
P
= 992,251
–
P
= 992,251
P
= 10,542,603
(1,813,571)
P
= 8,729,032
Net income attributable to:
Owners of the Parent
Non-controlling interests
P
= 4,588,547
125,557
P
= 1,246,564
10,023
P
= 1,766,092
–
(P
= 1,361,392)
2,353,641
P
= 6,239,811
2,489,221
Segment assets (excluding
deferred tax)
P
= 357,612,092
P
= 59,042,809
P
= 262,609,796
(P
= 52,671,570)
P
= 626,593,127
Segment liabilities (excluding
deferred tax)
P
= 171,111,015
P
= 32,930,459
P
= 140,422,226
(P
= 35,414,304)
P
= 309,049,396
=
P 17,678,257
P
= 133,988
P
= 122,651,619
P
=–
P
= 140,463,864
311,535
10,064,193
1,521,680
4,322
1,334,669
913,511
2,800,609
258,180
170,275
–
–
–
3,116,466
11,657,042
2,605,466
Other information:
Investments in shares of stock
of associates and joint ventures
Equity in net earnings
of associates and joint ventures
Capital expenditures
Depreciation and amortization
Property
Revenue:
External customers
Inter-segment
=14,448,243
P
3,298,879
=17,747,122
P
Retail
March 31, 2013
Financial Services
and Others
(In Thousands)
Eliminations
=36,850,674
P
(786)
=36,849,888
P
=5,542,071
P
4,804,053
=10,346,124
P
=–
P
(8,102,146)
(P
=8,102,146)
Consolidated
=
P56,840,988
–
=
P56,840,988
Segment results:
Income before income tax
Provision for income tax
Net income
=7,537,502
P
(995,119)
=6,542,383
P
=1,704,364
P
(485,064)
=1,219,300
P
=
P1,282,487
(142,021)
=1,140,466
P
=1,276,095
P
(24,258)
=1,251,837
P
=
P11,800,448
(1,646,462)
=
P10,153,986
Net income attributable to:
Owners of the Parent
Non-controlling interests
=5,969,520
P
572,863
=1,162,328
P
56,972
=1,140,466
P
–
(P
=851,134)
2,102,972
=
P7,421,180
2,732,807
Segment assets (excluding
deferred tax)
=325,295,849
P
=54,627,376
P
=234,368,488
P
(P
=45,180,871)
=569,110,842
P
Segment liabilities (excluding
deferred tax)
=145,417,619
P
=29,621,668
P
=141,156,972
P
(P
=31,702,368)
=284,493,891
P
=12,094,306
P
=92,158
P
=126,682,596
P
=–
P
=138,869,060
P
560,784
6,692,673
1,269,734
2,120
1,649,928
793,744
5,086,255
938,903
193,847
–
–
–
5,649,159
9,281,504
2,257,325
Other information:
Investments in shares of stock
of associates and joint ventures
Equity in net earnings (losses)
of associates and joint ventures
Capital expenditures
Depreciation and amortization
- 31 -
5. Cash and Cash Equivalents
This account consists of:
March 31,
2014
December 31,
2013
(In Thousands)
Cash on hand and in banks (see Note 20)
Temporary investments (see Notes 16 and 20)
P
=7,880,073
29,309,797
P
=37,189,870
=10,202,986
P
40,006,671
=50,209,657
P
Cash in banks earn interest at the respective bank deposit rates. Temporary investments are made
for varying periods of up to three months depending on the immediate cash requirements of the
Group, and earn interest at the respective temporary investment rates.
6. Time Deposits and Short-Term Investments
This account consists of:
March 31,
2014
December 31,
2013
(In Thousands)
Time deposits:
Pledged (see Notes 18 and 20)
Not pledged (see Note 20)
Short-term investments (see Note 20)
Less current portion
Noncurrent portion
P
=21,287,125
34,339,795
55,626,920
–
55,626,920
28,289,770
P
=27,337,150
=21,087,625
P
34,018,075
55,105,700
887,900
55,993,600
28,912,650
=27,080,950
P
A portion of the time deposits amounting to US$475.0 million, with peso equivalents of
P
=21,287.1 million and P
=21,087.6 million as at March 31, 2014 and December 31, 2013,
respectively and bear interest ranging from 4.1% to 5.4%, are used as collateral for loans obtained
by the Group (see Note 18).
- 32 -
7. Investments Held for Trading and Sale
This account consists of :
March 31,
2014
December 31,
2013
(In Thousands)
Investments held for trading
Bonds (see Note 20)
AFS investments
Bonds
Shares of stock
P
=458,931
=459,754
P
1,019,018
661,792
P
=2,139,741
–
659,226
=1,118,980
P
The Group recognized a loss of P
=3.0 million and P
=0.7 million from fair value adjustments of
investments held for trading for the three months ended March 31, 2014 and 2013, respectively.
The amounts are included under “Dividend, management fees and others” account in the
consolidated statements of income.
8. Receivables
This account consists of receivable from tenants and real estate buyers (net of noncurrent portion),
due from related parties, management and service fees, and dividends.
The terms and conditions of the above receivables are as follows:
Trade receivables from tenants and management and service fee receivables are noninterestbearing and are normally collectible on a 30 to 90 days’ term. Receivables from real estate
buyers mainly consist of receivables subject to financing from banks and other financial
institutions with interest at market rates ranging from 13% to 18% per annum and normally
collectible on a 3 to 5 years term.
The terms and conditions of related party receivables are further discussed in Note 20.
Dividend receivables are noninterest-bearing and are normally collectible within the next
financial year.
Allowance for impairment loss amounting to P
=362.4 million and P
=334.9 million as at March 31,
2014 and December 31, 2013, respectively, pertains to receivables from tenants which were
identified through specific assessment.
Receivables, other than those identified as impaired, are assessed by the Group’s management as
good and collectible.
- 33 -
9. Other Current Assets
This account consists of:
March 31,
2014
December 31,
2013
(In Thousands)
Land and development (see Note 14)
Prepaid taxes and other prepayments
Condominium units for sale (see Note 14)
Non-trade receivables, net of allowance for
impairment loss of P
=5.7 million
Advances and deposits
Input tax
Escrow fund (see Note 15)
Accrued interest receivable
Receivable from banks and credit cards
Advances for project development (see Note 20)
Others
P
=13,146,912
6,126,683
5,489,506
=12,542,783
P
5,652,642
6,213,523
5,148,760
3,215,342
3,010,843
1,025,850
884,709
591,384
48,448
1,362,886
P
=40,051,323
5,086,936
5,091,059
2,987,264
439,118
959,763
2,423,215
88,615
1,342,706
=42,827,624
P
Non-trade receivables include interest-bearing advances to third parties which are normally
collectible within the next financial year.
Receivable from banks and credit cards are noninterest-bearing and are normally collectible
on a 30 to 90 days term.
Accrued interest receivable relates mostly to time deposits which will be collected at
respective maturity dates.
Advances for project development mostly pertain to advances made to related parties for the
acquisition of land for future development.
10. Available-for-sale Investments
This account consists of investments in shares of stocks and corporate bonds, net of allowance for
impairment losses amounting to P
=31.3 million as at March 31, 2014 and December 31, 2013.
Investments in bonds and corporate notes as at March 31, 2014 and December 31, 2013 include
third party convertible bonds and corporate notes with fixed interest rates ranging from 2.5% to
8.25%. These investments will mature on various dates beginning on February 9, 2015 until April
15, 2018.
Gain and loss on disposal of AFS investments recognized under “Dividend, management fees and
others” account in the consolidated statements of income amounted to nil and gain of P
=166.5
million for the three months ended March 31, 2014 and 2013, respectively. Listed shares of stock
of the Group pertain to investments in pubslicly-listed companies. These are measured at the
quoted market price of the shares. A portion of these investments amounting to P
=4,011.0 million
and P
=10,365.0 million as at March 31, 2014 and December 31, 2013, respectively, are pledged as
collateral for a portion of the Group’s long-term loans (see Note 18).
- 34 -
11. Investments in Shares of Stock of Associates and Joint Ventures
The details of and movements in this account are as follows:
March 31,
2014
Cost:
Balance at the beginning of the year
Additions
Acquisition of controlling interest of HPI and SHDC
Disposals - net of realized deferred gain
Balance at the end of the period
Accumulated equity in net earnings:
Balance at the beginning of the year
Equity in net earnings
Dividends received
Accumulated equity in net earnings
of investments – HPI and SHDC
Accumulated equity in net earnings
of investments sold
Balance at the end of the period
Share in net unrealized gain (loss) on AFS
investments of associates
Translation adjustment
Allowance for impairment loss:
Balance at the beginning of the year
Recovery
Balance at the end of the period
December 31,
2013
(In Thousands)
=
P92,840,123
5,492,653
(1,710,703)
(21,556)
96,600,517
P
=96,600,517
340
–
–
96,600,857
36,388,668
13,602,269
(4,499,652)
42,393,849
3,116,466
(1,955,012)
–
(338,474)
–
43,555,303
(2,208)
45,150,603
(2,756,754)
–
317,486
(9,782)
–
–
–
P
=140,463,864
775,047
(775,047)
–
=138,994,366
P
The major associates and joint venture of the Group, all of which were incorporated in the
Philippines, are as follows:
Percentage of Ownership
March 31, 2014 December 31, 2013
Company
Associates
BDO Unibank Inc. and Subsidiaries (BDO)
China Banking Corporation (China Bank)
Belle Corporation and Subsidiaries (Belle)
Atlas Consolidated Mining, Inc.
Sodexo Motivation Solutions Philippines, Inc.
Fast Retailing Philippines, Inc.
CityMall Commercial Center Inc. (CMCCI)
Joint Venture
Waltermart Mall
Gross Effective
Principal Activities
Gross
Effective
48
23
32
29
40
25
34
47
20
28
29
40
25
34
48
23
32
29
40
25
–
47
20
28
29
40
25
–
Financial services
Financial services
Real estate development and tourism
Mining
Retail
Retail
Shopping mall development
51
26
51
26
Shopping mall development
China Bank
In May 2013, China Bank declared a stock dividend to stockholders of record as of July 19, 2013.
The BSP and SEC approved the dividend declaration on June 21, 2013.
- 35 -
On August 24, 2012, SEC approved the Amended Articles of Incorporation of China Bank to
effect a ten-for-one stock split of the common shares. This resulted in an increase in the number
of shares from 200 million to 2,000 million, and a reduction in par value of shares from =
P100.00 to
=10.00 per share. The stock split by China Bank did not result to a change in the ownership
P
interest of the Group.
Belle
In April 2011, the Group, increased its ownership interest in Belle, an associate, by 20.78% and
12.58% gross and effective ownership, respectively, via share swap wherein the entire outstanding
shares of Premium Leisure Amusement, Inc. (a subsidiary) was exchanged for certain number of
common shares of Belle valued at P
=1.95 per share (shares swap). The valuation of the PLAI
shares was made by an independent appraiser and approved by the SEC on October 6, 2010. This
is the same valuation used in recording the share swap transaction in its 2011 financial statements
upon receipt of the approval from the Bureau of Internal Revenue on March 31, 2011 and issuance
of stock certificates by Belle on April 14, 2011. The transaction resulted in a net gain on share
swap amounting to P
=2,604.2 million, net of the eliminated portion of the gain pertaining to the
retained interest of the Group in Belle and is recognized under “Gain on disposal of investments
and properties - net” account in the consolidated statement of income. The Group will realize the
deferred income as the investment in the associate is disposed.
In 2013, SMIC acquired 100% ownership in Sto. Roberto. The acquisition of Sto. Roberto
increased the Group’s effective interest in Belleshares Holdings, Inc. to 99% which resulted to an
increase in the Group’s effective ownership in Belle.
On various dates in 2013, the Group sold 20.2 million Belle shares, on which the Group realized =
P
10.8 million of the deferred gain in 2013, and was recognized under “Gain on disposal of
investments and properties - net” account in the consolidated statement of income. The remaining
balance of the deferred gain as at December 31, 2013 amounted to P
=1,065.7 million.
HPI
In 2013, through the corporate restructuring, HPI became a subsidiary of SMIC, indirectly though
SM Prime. The acquisition of the controlling interest of HPI was considered as a business
combination under common control. Thus, this was accounted for as a step-up acquisition using
the pooling of interest method.
SHDC
In February 2013, SHDC became a subsidiary of SM Land through the latter’s acquisition of the
51.0% ownership in SHDC for a total consideration of P
=20.4 million. This was accounted for as a
step-up acquisition using the pooling of interest method.
Waltermart Mall
On January 7, 2013, SM Prime entered into a Shareholders Agreement and Share Purchase
Agreement for the acquisition of 51% ownership interest in the following companies (collectively,
Waltermart Mall):
Winsome Development Corporation
Willin Sales, Inc.
Willimson, Inc.
Waltermart Ventures, Inc.
Waltermart Development, Inc.
- 36 -
On July 12, 2013, the Deeds of Absolute Sale were executed between SM Prime and shareholders
of Waltermart Mall. Waltermart Mall is involved in shopping mall operations and currently owns
nineteen (19) malls across Metro Manila and Luzon. The investments in Waltermart Mall were
accounted as investment in joint venture using equity method of accounting because the
contractual arrangement between the parties establishes joint control.
As at March 31, 2014 and December 31, 2013 the fair values of investments in associates which
are listed in the PSE are as follows:
March 31,
2014
December 31,
2013
(In Thousands)
BDO
China Bank
Belle
Atlas
P
=158,844,179
18,826,049
18,672,245
8,426,945
=158,844,179
P
19,003,197
16,434,274
8,764,505
- 37 -
12. Property and Equipment
The movements in this account are as follows:
Buildings,
Condominium
Units and
Improvements
Land
Cost
Balance as at December 31, 2012
Additions
Effect of business combination
Reclassifications
Disposals/retirements
Balance as at December 31, 2013
Additions
Reclassifications
Disposals/retirements
Balance as at March 31, 2014
Accumulated Depreciation and Amortization
Balance as at December 31, 2012
Depreciation and amortization
Effect of business combination
Reclassifications
Disposals/retirements
Balance as at December 31, 2013
Depreciation and amortization
Reclassifications
Disposals/retirements
Balance as at March 31, 2014
Net Book Value
As at March 31, 2014
As at December 31, 2013
=2,412,990
P
–
–
(2,382,990)
(30,000)
–
–
2,703,377
–
=2,703,377
P
=–
P
–
–
–
–
–
–
–
–
P
=–
P
=2,703,377
=–
P
Store Equipment
and
Improvements
Data
Processing
Equipment
Furniture,
Fixtures
and Office
Equipment
Machinery
and
Equipment
(In Thousands)
Leasehold
Improvements
Transportation
Equipment
=4,369,288
P
566,841
8,066
67,187
(605,516)
4,405,866
319,777
6,601,149
(1,026)
=11,325,766
P
=7,576,904
P
1,194,897
865,036
1,410,778
(8,598)
11,039,017
125,894
(8,632,042)
17,084
=2,549,953
P
=4,538,804
P
325,373
74,265
265,870
(580,863)
4,623,449
143,925
(26,722)
(1,571)
=4,739,081
P
=3,982,501
P
520,580
1,410
139,905
(29,769)
4,614,627
133,225
(135,216)
(17,562)
=4,595,074
P
=3,369,046
P
604,179
1,418
(285,449)
(37,616)
3,651,578
128,445
217,307
–
=3,997,330
P
=4,989,941
P
1,071,236
–
1,678,823
(36,577)
7,703,423
96,079
(1,558,566)
(59,436)
=6,181,500
P
=593,227
P
66,081
2,596
30,713
(5,923)
686,694
56,440
8,056
(109)
=751,081
P
=1,226,734
P
338,054
–
323,592
(558,336)
1,330,044
306,259
4,731,756
18,417
P
=6,386,476
=5,010,515
P
616,380
725,138
966,206
(130,529)
7,187,710
66,853
(5,792,689)
(12)
P
=1,461,862
=3,110,454
P
532,018
60,658
48,100
(552,812)
3,198,418
144,710
(72,306)
(1,157)
P
=3,269,665
=2,003,860
P
603,746
75
48,567
(16,421)
2,639,827
157,254
(13,755)
(5,529)
P
=2,777,797
=1,878,250
P
962,994
76
(513,915)
(19,823)
2,307,582
128,402
42,108
(11)
P
=2,478,081
=2,336,997
P
666,619
–
(309,346)
(15,873)
2,678,397
211,644
196,382
(15,068)
P
=3,071,355
=314,327
P
54,461
1,851
19,067
(3,056)
386,650
12,925
9,848
(109)
P
=409,314
P
=4,939,290
=3,075,822
P
P
=1,088,091
=3,851,307
P
P
=1,469,416
=1,425,031
P
P
=1,817,277
=1,974,800
P
P
=1,519,249
=1,343,996
P
P
=3,110,145
=5,025,026
P
P
=341,767
=300,044
P
Construction
in Progress
Total
=1,234,953
P
782,608
263,643
(776,681)
(177,169)
1,327,354
451,579
(268,137)
(3,208)
=1,507,588
P
=–
P
–
–
–
–
–
–
–
–
P
=–
P
=1,507,588
=1,327,354
P
=33,067,654
P
5,131,795
1,216,434
148,156
(1,512,031)
38,052,008
1,455,364
(1,090,794)
(65,828)
=38,350,750
P
=15,881,137
P
3,774,272
787,798
582,271
(1,296,850)
19,728,628
1,028,047
(898,656)
(3,469)
P
=19,854,550
P
=18,496,200
=18,323,380
P
As at March 31, 2014 and December 31, 2013, the Group has no idle property and equipment and the gross carrying amount of fully depreciated property and
equipment still in use amounted to P
=9,502.6 million and P
=8,455.8 million respectively.
- 38 -
13. Investment Properties
The movements in this account are as follows:
Land and
Improvements
and
Land Use
Rights
Cost
Balance as at December 31, 2012
Additions
Effect of business combination
Reclassifications
Translation adjustment
Disposals
Balance as at December 31, 2013
Additions
Reclassifications
Translation adjustment
Capitalized interest
Disposals
Balance as at March 31, 2014
Accumulated Depreciation, Amortization
and Impairment Loss
Balance as at December 31, 2012
Depreciation and amortization
Reclassifications
Translation adjustment
Disposals
Balance as at December 31, 2013
Depreciation and amortization
Reclassifications
Translation adjustment
Disposals
Balance as at March 31, 2014
Net Book Value
As at March 31, 2014
As at December 31, 2013
Building
Equipment,
Buildings
and
Furniture
and Others
Improvements
(In Thousands)
Construction
in Progress
Total
=34,990,179
P
4,800,290
–
746,887
347,920
(747,287)
40,137,989
3,790,393
283,034
(105,569)
–
–
P
= 44,105,847
=112,061,331
P
5,307,963
20,774,116
6,770,851
1,706,129
(11,389,188)
135,231,202
1,984,466
9,918,817
(295,453)
–
(74)
P
= 146,838,958
=21,617,309
P
1,619,709
–
6,196,877
206,315
(876,904)
28,763,306
236,307
(4,804,221)
(37,059)
–
(59)
P
= 24,158,274
=17,061,279
P
14,157,130
–
(4,637,452)
587,066
(837,905)
26,330,118
2,381,265
(2,445,546)
(153,491)
213,759
(6,551)
P
= 26,319,554
=185,730,098
P
25,885,092
20,774,116
9,077,163
2,847,430
(13,851,284)
230,462,615
8,392,431
2,952,084
(591,572)
213,759
(6,684)
P
= 241,422,633
=916,514
P
155,598
(493,837)
47,656
(41)
625,890
166,455
586,372
(11,640)
–
P
=1,367,077
=24,018,736
P
3,788,648
8,730,336
783,816
(12,698,071)
24,623,465
961,906
4,596,228
(42,803)
(74)
P
= 30,138,722
=10,700,594
P
1,795,066
1,059,532
76,446
(1,151,131)
12,480,507
449,059
206,737
(14,817)
(59)
P
= 13,121,427
=123,564
P
–
–
–
–
123,564
–
6,551
–
(6,551)
P
=123,564
=35,759,408
P
5,739,312
9,296,031
907,918
(13,849,243)
37,853,426
1,577,420
5,395,888
(69,260)
(6,684)
P
= 44,750,790
P
= 42,738,770
=39,512,099
P
P
= 116,700,236
=110,607,737
P
P
= 11,036,847
=16,282,799
P
P
= 26,195,990
=26,206,554
P
P
= 196,671,843
=192,609,189
P
As at March 31, 2014 and December 31, 2013, the allowance for impairment loss on land and
improvements and land use rights, and construction amounted to P
=923.3 million.
Included under “Land” account are the 212,119 square meters of real estate properties with a
carrying value of P
=478.0 million and P
=494.0 million as at March 31, 2014 and December 31,
2013, respectively, and a fair value of P
=13,531.0 million as at August 2007, planned for residential
development in accordance with the cooperative contracts entered into by SMPH with Grand
China International Limited (Grand China) and Oriental Land Development Limited (Oriental
Land) on March 15, 2007. The value of these real estate properties was not part of the
consideration paid by SM Prime of P
=10,827.0 million paid by Grand China and Oriental Land.
Accordingly, the assets were recorded at carrying values under “Investment properties” account
and a corresponding liability equivalent to the same amount is shown as part of “Tenants’ deposits
and others” account in the consolidated balance sheets.
Portions of investment properties located in China with carrying value of P
=4,572.0 million and
=5,001.0 million as at March 31, 2014 and December 31, 2013, respectively, and estimated fair
P
value of P
=17,685.0 million and P
=20,109.0 million as at March 31, 2014 and December 31, 2013,
respectively, were mortgaged as collaterals to secure the domestic borrowings in China (see Note
18).
- 39 -
Rent income from investment properties, which is primarily attributable to SM Prime, amounted
to P
=8,556.0 and P
=7,629.0 million for the three months ended March 31, 2014 and 2013,
respectively. Consolidated direct operating expenses from investment properties which generate
income amounted to P
=4,491.0 million and P
=3,591.0 million for the three months ended March 31,
2014 and 2013, respectively.
Construction in progress includes shopping mall complex under construction amounting to
=20,093.0 million and P
P
=18,279.0 million, and landbanking and commercial building constructions
amounting to P
=5,782.0 million and P
=5,080.0 million as at March 31, 2014 and December 31,
2013, respectively.
In 2014, shopping mall complex under construction mainly pertains to costs incurred for the
development of SM Seaside City Cebu, SM City Cauayan, SM City Cabanatuan, SM City
Angono, SM Tianjin and SM Zibo and the ongoing expansions and renovations of SM City
Bacolod, SM City Lipa and SM City Sta. Rosa. In 2013, shopping mall complex under
construction mainly pertains to costs incurred for the development of SM Seaside City Cebu, SM
City Cauayan, SM Tianjin and SM Zibo and the ongoing expansions and renovations of SM
Megamall, SM City Bacolod and SM City Lipa.
Shopping mall complex under construction includes cost of land amounting to P
=2,153.0 million
and P
=2,149.0 million as at March 31, 2014 and December 31, 2013, respectively.
Construction contracts with various contractors related to the construction of the above-mentioned
projects amounted to P
=59,341 million and P
=82,058 million as at March 31, 2014 and December
31, 2013, respectively, inclusive of overhead, cost of labor and materials and all other costs
necessary for the proper execution of the works. The outstanding contracts are valued at P
=10,076
million and P
=28,857 million as at March 31, 2014 and December 31, 2013, respectively.
Interest capitalized to the construction of investment properties amounted to P
=214.0 million and
=77.0 million as at March 31, 2014 and December 31, 2013, respectively. Capitalization rates
P
used ranged from 4.12% to 5.99% and 5.83% to 7.20% as at March 31, 2014 and December 31,
2013, respectively.
14. Land and Development and Condominium Units for Sale
This account consists of the following:
March 31,
2014
December 31,
2013
(In Thousands)
Condominium units for sale (see Note 9)
Land and development:
Current portion (see Note 9)
Noncurrent portion
P
=5,489,506
=6,213,523
P
13,146,912
24,626,259
P
=43,262,677
12,542,783
25,666,930
=44,423,236
P
Land and development, which amounted to P
=37,773.2 million and P
=38,209.7 million as at March
31, 2014 and December 31, 2013, respectively, include land and cost of ongoing condominium
projects.
- 40 -
Condominium units for sale amounting to P
=5,489.5 million and P
=6,213.5 million as at March 31,
2014 and December 31, 2013, respectively, pertain to completed projects of SMDC, Costa and
HPI. The amounts were included under “Other current assets” account in the consolidated balance
sheets (see Note 9).
The condominium units for sale and land and development are stated at cost as at March 31, 2014
and December 31, 2013.
Borrowing costs capitalized by the Group to land and development account amounted to
=136.0 million and P
P
=866.0 million as at March 31, 2014 and December 31, 2013, respectively.
The average rates used to determine the amount of borrowing costs eligible for capitalization
range from 3.8% to 5.3% and 3.6% to 5.1% as at March 31, 2014 and December 31, 2013,
respectively.
15. Intangibles and Other Noncurrent Assets
Intangible Assets
This account consists of:
March 31,
2014
December 31,
2013
(In Thousands)
Goodwill
Less accumulated impairment loss
Net book value
P
=14,799,036
91,619
14,707,417
=14,221,912
P
91,619
14,130,293
Trademarks and brand names
6,124,762
P
=20,832,179
6,124,762
=20,255,055
P
Goodwill is allocated to SM Prime, Supervalue, Inc. (SVI), Super Shopping Market, Inc. (SSMI),
Prime Metroestate, Inc. and others as separate cash generating units.
Trademarks and brand names pertain to that of the supermarket and hypermarket business of the
Group which were acquired in a business combination in 2006. The trademarks and brand names
were assessed to have an indefinite life and was valued using the Relief-from-Royalty Method.
The royalty rate was 3.5%, which was the prevailing royalty rate in 2006 in the retail assorted
category where the two entities fall.
The recoverable amount of goodwill, trademarks and brand names have been determined based on
value-in-use caluculations using the cash flow projections from the financial budgets approved by
senior management covering a three-year period and fair value less costs of disposal calculations
of the underlying net assets of the CGUs.
Management assessed that no reasonably possible change in pre-tax discount rates and future cash
inflows would cause the carrying value of goodwill, trademarks and brand names in 2013 and
2012 to materially exceed its recoverable amount.
Fair value less cost of disposal. The fair values of the assets and liabilities of the CGUs were
determined by independent appraisers and in reference to the available market price for quoted
instruments. Management assessed that no reasonably possible change in the fair values would
cause the carrying value of goodwill in 2013 and 2012 to materially exceed its recoverable
amount.
- 41 -
Other Noncurrent Assets
This account consists of:
March 31,
2014
December 31,
2013
(In Thousands)
Receivables from real estate buyers
(see Note 8)
Deposits and advance rentals
Advances for project development
(see Note 20)
Derivative assets
Deferred input VAT
Defined benefit asset
Escrow fund (see Note 20)
Long-term notes (see Note 20)
Others
P
=8,192,999
7,958,941
=10,636,503
P
6,362,347
3,649,049
3,009,315
2,405,001
613,007
132,460
–
3,799,673
P
=29,760,445
3,607,169
2,643,487
1,554,256
615,982
556,206
218,124
2,259,381
=28,453,455
P
Deposits and advance rentals substantially pertain to the lease agreements entered into by SM
Prime for certain parcels of land where some of its malls are constructed. The lease
agreements provide that the security deposits will be applied to future rentals. Consequently,
the said deposits and advance rentals are not remeasured at amortized cost.
Long-term notes pertain to unquoted and unsecured subordinated debt instruments which
carry fixed interest rate of 7.5% per annum as at December 31, 2013. In March 2014, the
Group received full payment from BDO for the early redemption of the long term note
amounting to P
=218.1 million.
Escrow fund pertains mainly to the amounts deposited in the account of an escrow agent as
required by the Housing and Land Use Regulatory Board (HLURB) in connection with
SMDC’s temporary license to sell prior to HLURB’s issuance of a license to sell and
certificate of registration. In 2013, the Parent Company deposited cash in escrow amounting
to P
=130.0 million in the account of an escrow agent as required by the SEC in connection with
the corporate restructuring.
- 42 -
16. Bank Loans
This account consists of:
March 31,
2014
December 31,
2013
(In Thousands)
Parent Company:
U.S. dollar-denominated loans
Peso-denominated loans
Subsidiaries Peso-denominated loans
P
=1,344,450
1,000,000
=2,219,750
P
6,550,000
18,128,509
P
=20,472,959
18,818,509
P27,588,259
=
The U.S. dollar-denominated loans amounting to US$30.0 million and US$50.0 million with peso
equivalent of P
=1,344.5 million and P
=2,219.8 million as at March 31, 2014 and December 31, 2013,
respectively, bear interest ranging from 1.08% to 1.79% as at March 31, 2014 and December 31,
2013 (see Note 24).
The peso-denominated loans bear annual interest rates ranging from 3.25% to 2.85% and 1.06% to
6.75% as at March 31, 2014 and December 31, 2013, respectively.
These loans have maturities of less than one year (see Note 24).
17. Accounts Payable and Other Current Liabilities
This account consists of:
March 31,
2014
December 31,
2013
(In Thousands)
Trade
Nontrade
Accrued expenses
Payable arising from acquisition of land
Accrued interest
Payable to government agencies
Due to related parties (see Note 20)
Derivative liabilities
Gift checks redeemable and others
P
=31,766,752
4,430,703
3,927,955
3,367,172
2,416,180
2,037,645
1,541,859
787,109
1,766,179
P
=52,041,554
=39,580,013
P
8,013,509
3,967,472
4,838,686
1,784,520
3,671,601
2,091,305
845,429
3,295,792
=68,088,327
P
The terms and conditions of the above liabilities follow:
Trade payables primarily consist of liabilities to suppliers and contractors, which are
noninterest-bearing and are normally settled on a 30 to 60 days term.
Nontrade payables, accrued interest and others are expected to be settled within the next
financial year.
- 43 Payable arising from acquisition of land is expected to be settled within the following year.
The terms and conditions relating to due to related parties are discussed in Note 20.
Gift checks are redeemable at face value.
Payable to government agencies mainly consists of output tax which are normally settled
within the next financial year.
Accrued expenses pertain to accrued and unpaid selling, general and administrative expenses
which are normally settled within the next financial year.
- 44 -
18. Long-term Debt
This account consists of:
March 31, 2014
Debt Issue
Gross Amount
Cost
Net Amount
(In Thousands)
Parent Company
U.S. dollar-denominated:
Fixed rate bonds
Convertible bonds
Five-year term loans
Peso-denominated:
Five-year and seven-year retail bonds
Seven-year and ten-year retail bonds
Bank loans collateralized with time deposits
Other bank loans
Subsidiaries
U.S. dollar-denominated:
Five-year term loans
Two-year, three-year and five-year bilateral
loans
Five-year syndicated loan
Other U.S. dollar loans
China Yuan Renminbi-denominated:
Three-year loan
Five-year loan
Peso-denominated:
Three-year and five-year fixed rate notes
Five-year and ten-year fixed and floating rate
notes
Five-year, seven-year and ten-year fixed and
floating rate notes
Five-year, seven-year and ten-year corporate
notes
Five-year and ten-year corporate notes
Five-year floating rate notes
Five-year, seven-year and ten-year fixed rate
notes
Five-year bilateral loans
Other bank loans
Less current portion
Noncurrent portion
December 31, 2013
Debt Issue
Gross Amount
Cost
Net Amount
P
=56,611,608
3,732,919
13,444,500
(P
=339,625)
(56,739)
(271,377)
P
=56,271,983
3,676,180
13,173,123
P
=56,053,998
3,732,919
13,318,500
(P
=365,270)
(60,787)
(16,893)
P
=55,688,728
3,672,132
13,301,607
9,400,000
13,082,270
2,900,000
14,350,000
(8,418)
(87,357)
(2,554)
(53,659)
9,391,582
12,994,913
2,897,446
14,296,341
9,400,000
13,082,270
3,000,000
9,350,000
(13,794)
(89,961)
(3,457)
(294,476)
9,386,206
12,992,309
2,996,543
9,055,524
12,100,050
(127,431)
11,972,619
11,986,650
(141,857)
11,844,793
1,120,375
22,407,500
4,481,500
(5,278)
(451,172)
(52,224)
1,115,097
21,956,328
4,429,276
1,109,875
22,197,500
4,439,500
(5,994)
(473,025)
(55,869)
1,103,881
21,724,475
4,383,631
–
1,952,729
961,827
2,235,771
–
–
961,827
2,235,771
–
1,952,729
–
–
17,075,000
(74,620)
17,000,380
17,075,000
(80,100)
16,994,900
7,375,500
(45,366)
7,330,134
7,375,500
(47,692)
7,327,808
4,272,800
(24,975)
4,247,825
4,316,400
(25,877)
4,290,523
6,596,000
1,100,000
4,850,000
(22,518)
(6,657)
(18,141)
6,573,482
1,093,343
4,831,859
6,596,000
1,100,000
4,900,000
(25,068)
(6,906)
(20,390)
6,570,932
1,093,094
4,879,610
8,200,000
500,000
11,025,660
216,578,411
37,827,316
P
=178,751,095
(50,010)
(1,424)
(19,064)
(1,718,609)
(285,350)
(P
=1,433,259)
8,149,990
498,576
11,006,596
214,859,802
37,541,966
P
=177,317,836
8,200,000
500,000
11,026,060
211,957,770
34,858,218
P
=177,099,552
(51,445)
(1,547)
(21,325)
(1,801,733)
(291,599)
(P
=1,510,134)
8,148,555
498,453
11,004,735
210,156,037
34,566,619
P
=175,589,418
- 45 -
Parent Company
Fixed Rate Bonds
US$500.0 million Senior Bonds
On October 17, 2012, SMIC issued US$500.0 million senior bonds, with peso equivalent of
=22,407.5 million and P
P
=22,197.5 million as at March 31, 2014 and December 31, 2013, which
bear a fixed interest rate of 4.25% per annum, payable semi-annually in arrears. The bonds will
mature on October 17, 2019.
US$400.0 million Exchanged Bonds
On October 13, 2010, SMIC issued US$400.0 million bonds with peso equivalents of
=17,212.2 million and P
P
=17,023.9 million as at March 31, 2014 and December 31, 2013,
respectively, which bear a fixed interest rate of 5.5% per annum, payable semi-annually in arrears
and will mature on October 13, 2017. This issuance is comprised of US$186.3 million (P
=8,030.9
million) additional bonds, and US$82.9 million (P
=3,549.8 million) and US$130.8 million (P
=
5,631.6 million) exchanged bonds from the existing US$350.0 million 6.75% bonds due 2013 and
US$500.0 million 6.0% bonds due 2014, respectively. The exchange was not accounted for as an
extinguishment but merely a modification of terms because the terms of the exchanged bonds are
not substantially different from the existing bonds (i.e., the difference between the present value of
the cash flows of the exchanged bonds and the present value of the remaining cash flows of the
existing bonds discounted using the original effective interest rate did not exceed 10%).
US$500.0 million Bonds
On September 22, 2009, SMIC issued US$500.0 million bonds, with peso equivalent of
=16,991.9 million and P
P
=16,832.6 million as at March 31, 2014 and December 31, 2013, which
bear a fixed interest rate of 6.0% per annum, payable semi-annually in arrears. The bonds will
mature on
September 22, 2014.
Convertible Bonds
US$250.0 million Convertible Bonds
On February 15, 2012, SMIC issued at face value 1.625% coupon US$250.0 million
(P
=9,407.6 million) convertible bonds, with a yield to maturity of 2.875% due on February 15,
2017 at 106.67%. The bonds bear coupon interest of 1.625% and has a yield-to-maturity of
2.875% at inception. Interest on the bonds is payable semi-annually in arrears. The bonds contain
multiple embedded derivatives (i.e., conversion option, call option and put option) which was
bifurcatedby SMIC at inception. See Note 29 for further discussion.
Unless previously redeemed, converted or purchased and cancelled, the holder has the right to
convert its outstanding bonds for SMIC’s common shares at any time, on or after June 15, 2012
until the close of business on February 5, 2017, at an initial conversion price of P
=781.45 per share
translated into U.S. dollars at a fixed conversion rate of P
=42.711 to US$1.00. Effective July 8,
2013, the new conversion price is P
=624.625 after giving effect to the 25% stock dividends
declared on April 25, 2013. If a bondholder exercises its conversion option, the Company can
choose either to settle the bonds in cash or issue common shares. At various dates in 2013, the
bondholders of US$150.8 million (P
=5,778.9 million) opted to convert their holdings into
8,390,334 of SMIC’s shares.
The put option entitles the bondholders to require the Parent Company to redeem all or some of its
bonds on February 15, 2015 (put date) at 103.89%.
- 46 -
Lastly, the call option gives right to the Parent Company to redeem the Bonds, in whole but not in
part at their early redemption amount on the date fixed for redemption, provided, however, that no
such redemption may be made unless the closing price of the shares of the Parent Company
(translated into US Dollars at the prevailing rate) for each of the 30 consecutive trading days, the
last of which occurs no more than five days prior to redemption notice, was at least 130% of the
applicable early redemption amount divided by the conversion ratio.
Five-year U.S. Dollar Loans
In 2013, the Company obtained a five-year loan amounting to US$300.0 million with Phillippine
peso equivalent of P
=13,444.5 million and P
=13,318.5 million as at March 31, 2014 and December
31, 2013, respectively which bears floating interest rate of six-month LIBOR plus margin. Portion
of the loan amounting to US$180.0 million is hedged against interest rate and foreign exchange
risks using cross currency swap contract (see Notes 24 and 25).
Seven-year and Ten-year Retail Bonds
On July 16, 2012, SMIC issued fixed rate bonds, which comprised of seven-year or Series C
Bonds and ten-year or Series D Bonds due on July 16, 2019 and July 16, 2022, respectively. The
total issuance amounted to P
=5,623.5 million and P
=8,658.8 million for the Series C and Series D
Bonds, respectively.
The Series C Bonds have a term of seven years from the issue date, with a fixed interest rate
equivalent to 6.00% per annum payable semi-annually in arrears starting January 16, 2013. The
Series D Bonds have a term of ten years from the issue date, with a fixed interest rate equivalent to
6.94% per annum payable semi-annually in arrears starting January 16, 2013.
At various dates in 2013, the SMIC redeemed P
=1,317.7 million for Series C and P
=600.0 million
for Series D Bonds.
Outstanding balance as at March 31, 2014 and December 31, 2013 for Series C and Series D
bonds amounted to P
=5,023.5 million and P
=8,058.8 million, respectively.
Five-year and Seven-year Retail Bonds
On June 25, 2009, SMIC issued fixed rate bonds, which comprised of five-year or Series A Bonds
and seven-year or Series B Bonds due on June 26, 2014 and June 25, 2016, respectively. The total
issuance amounted to P
=9,000.0 million and P
=1,000.0 million for the Series A and Series B Bonds,
respectively.
The Series A Bonds have a term of five years and one day from the issue date, with a fixed interest
rate equivalent to 8.25% per annum payable semi-annually in arrears starting December 26, 2009.
The Series B Bonds have a term of seven years from the issue date, with a fixed interest rate
equivalent to 9.10% per annum payable semi-annually in arrears starting December 25, 2009.
Outstanding balance as at March 31, 2014 and December 31, 2013 amounted to P
=9,400.0 million.
Bank Loans Collateralized with Time Deposits
On January 8, 2010, SMIC obtained two five-year term loans amounting to P
=1,500.0 million each.
The loans are based on a three-month Philippine Dealing System Treasury-Fixing (PDST-F) rate
plus an agreed margin. Interest on these loans is payable quarterly in arrears. On January 3, 2014,
SMIC paid P
=50.0 million each of the two five-year loans. Outstanding balances as at March 31,
2014 and December 31, 2013 amounted to P
=2,900.0 million and P
=3,000.0 million, respectively.
- 47 -
These loans are collateralized by a portion of SMIC’s time deposits amounting to
US$475.0 million with peso equivalents of P
=21,287.0 million and P
=21,087.6 million as at March
31, 2014 and December 31, 2013, respectively (see Note 6).
Other Peso Bank Loans
This account includes the following:
March 31,
2014
December 31,
2013
(In Thousands)
Ten-year term loans
Seven-year term loans
Five-year term loans
P
=100,000
11,250,000
3,000,000
P
=14,350,000
=100,000
P
9,250,000
–
=9,350,000
P
In January 2014, SMIC obtained five-year and seven-year term loans amounting to P
=3,000.0
million and P
=2,000.0 million, which bear fixed interest rates of 5.40% and 5.24% per annum
respectively.
In August 2013, SMIC obtained a seven-year term loan amounting to P
=2,000.0 million which
bears a fixed interest rate of 4.47% per annum.
In June 2013, the Company obtained a seven-year term loan amounting to P
=3,000.0 million
which bears a fixed interest rate of 4.39% per annum.
In April 2013, SMIC obtained seven-year and ten-year term loans amounting to
=2,250.0 million and P
P
=100.0 million, which bear fixed interest rates ranging from 4.03% to
4.64% per annum, respectively.
The seven-year term loans also include a P
=2,000.0 million fixed rate loan which bear a fixed
rate of 2.80% per annum.
Subsidiaries
U.S. Dollar-denominated Five-Year Term Syndicated Loans
This represents a US$300 million unsecured loan obtained on various dates in 2013. The loan
bears an interest rate based on London Inter-Bank Offered Rate (LIBOR) plus spread, with a bullet
maturity on March 25, 2018. Portion of the loan amounting to US$150 million is hedged against
interest rate and foreign exchange risks using cross currency swap contracts.
U.S. Dollar-denominated Five-Year Term Loans
This represents a US$270 million unsecured loan obtained on various dates in 2012 and 2011 from
a US$270 million facility. The loans bear interest rates based on LIBOR plus spread, with a bullet
maturity on March 21, 2016.
U.S. Dollar-denominated Five-Year Term Syndicated Loans
This represents a US$200 million unsecured loan obtained on January 29, 2013. The loan bears an
interest rate based on LIBOR plus spread, with a bullet maturity on January 29, 2018. This loan is
hedged against interest rate and foreign exchange risks using cross currency swap contracts.
U.S. Dollar-denominated Five-Year, Three-Year and Two-Year Bilateral Loans
This consists of the following:
- 48 The US$75 million unsecured loans were initially obtained in November 2008. The loans
bear interest rates based on LIBOR plus spread, with maturities in November 2018. The
remaining balance of US$25 million will mature on November 20,2018.
US$10 million and US$40 million, out of US$50 million five-year bilateral unsecured loan,
obtained in 2012 and 2013, respectively. The loan bears interest rate based on LIBOR plus
spread, with a bullet maturity on August 30, 2017.
US$30 million and US$20 million five-year bilateral unsecured loan drawn on
November 30, 2010 and April 15, 2011, respectively. The loans bear interest rate based on
LIBOR plus spread, with a bullet maturity on November 30, 2015.
Other Peso Bank Loans
Philippine Peso-denominated Five-Year and Ten-Year Floating and Fixed Rate Notes
This represents five-year and ten-year floating and fixed rate notes obtained on June 19, 2012
amounting to P
=3,450 million and P
=1,000 million for the floating and P
=680 million and
=2,370 million for the fixed, respectively. The loans bear an interest rate based on Philippine
P
Dealing System Treasury Fixing (PDST-F) plus margin for the floating and 6.22% and 6.81% for
the five-year and ten-year fixed, respectively. The loans have bullet maturities in 2017 and 2022,
respectively. The Company prepaid a portion of fixed rate notes amounting to P
=50 million on
March 19, 2013. The related unamortized debt issuance costs charged to expense amounted to
=0.4 million in 2013.
P
Philippine Peso-denominated Five-Year, Seven-Year and Ten-Year Corporate Notes
This represents a five-year floating and five-year, seven-year and ten-year fixed rate notes
amounting to P
=3,000 million, P
=1,134 million, P
=52 million and P
=814 million, respectively, out of
=7,000 million facility obtained on December 20, 2010. The remaining P
P
=2,000 million floating
rate note was obtained on June 13, 2011. The loans bear an interest rate based on PDST-F plus
margin for the five-year floating and 5.79%, 5.89% and 6.65% for the five-year, seven-year and
ten-year fixed, respectively. The loans have bullet maturities in 2015, 2017 and 2020,
respectively. The Company prepaid a portion of fixed rate notes amounting to P
=196 million on
March 20, 2013. The related unamortized debt issuance costs charged to expense amounted to
=2 million in 2013.
P
Philippine Peso-denominated Five-Year Floating Rate Notes
This represents five-year floating rate notes obtained on March 18, 2011 and June 17, 2011
amounting to P
=4,000 million and P
=1,000 million, respectively. The loans bear an interest rate
based on PDST-F plus margin and will mature on March 19, 2016 and June 18, 2016,
respectively.
Philippine Peso-denominated Five-Year, Seven-Year and Ten-Year Fixed and Floating Rate Notes
This represents five-year floating, five-year, seven-year and ten-year fixed rate notes obtained on
January 12, 2012 amounting to P
=200 million, P
=1,012 million, P
=133 million, and P
=3,655 million,
respectively. The loans bear an interest rate based on PDST-F plus margin for the five-year
floating and 5.86%, 5.97% and 6.10% for the five-year, seven-year and ten-year fixed,
respectively. The loans have bullet maturities in 2017, 2019 and 2022, respectively. The
Company prepaid a portion of fixed rate notes amounting to P
=634 million on April 12, 2013. The
related unamortized debt issuance costs charged to expense amounted to P
=5 million in 2013.
- 49 -
Philippine Peso-denominated Five-Year and Ten-Year Corporate Notes
This represents five-year floating and fixed rate and ten-year fixed rate notes obtained on April 14,
2009 amounting to P
=200 million, P
=3,700 million and P
=1,100 million, respectively. The loans bear
an interest rate based on PDST-F plus margin for the five-year floating and 8.4% and 10.11% for
the five-year and ten-year fixed, respectively. The loans have bullet maturities in 2014 and 2019,
respectively. The Company prepaid the P
=200 million and P
=3,700 million loans on April 15, 2012,
with original maturity date of April 15, 2014. The related unamortized debt issuance costs
charged to expense amounted to P
=17 million in 2012.
Philippine Peso-denominated Five-Year, Seven-Year and Ten-Year Fixed Rate Notes
This represents five-year, seven-year and ten-year fixed rate notes obtained on June 17, 2008
amounting to P
=1,000 million, P
=1,200 million and P
=800 million, respectively. The loans bear fixed
interest rates of 9.31%, 9.60% and 9.85%, respectively, and will mature on June 17, 2013, 2015
and 2018, respectively. The loans amounting to P
=1,000 million, P
=1,200 and P
=800 were prepaid on
June 17, 2011, 2012 and 2013, respectively. The related unamortized debt issuance costs charged
to expense amounted to P
=4 million in 2011, P
=5 million in 2012 and P
=4 million in 2013.
Other Bank Loans
This consists of the following:
Five-year term loans amounting to P
=1,625 million obtained in 2009 and 2010. The loans bear
fixed interest rates ranging from 5.00% to 6.75%. Portion of the loans is collateralized by
AFS investments. Portion of the principal amount was paid amounting to
=9 million in 2012 and 2013, respectively.
P
Five-year loan obtained on June 29, 2010 amounting to P
=1,000 million and will mature on
June 29, 2015. The loan carries an interest rate based on PDST-F plus an agreed margin.
Five-year inverse floating rate notes obtained on June 23, 2010 amounting to P
=1,000 million.
The loans bear an interest rate based on agreed fixed rate less PDST-F and will mature on
June 23, 2015. The Company prepaid P
=175 million of the loan as at September 30, 2013. The
related balance of unamortized debt issuance costs charged to expense amounted to P
=2 million
in 2013.
Five-year bullet loan obtained on January 13, 2010 amounting to P
=1,000 million and will
mature on January 13, 2015. The loan carries an interest rate based on PDST-F plus an agreed
margin.
Five-year bullet loan obtained on November 3, 2009 amounting to P
=1,000 million and will
mature on November 3, 2014. The loan carries interest based on PDST-F plus on agreed
margin.
Five-year bullet loan obtained on October 16, 2009 amounting to P
=2,000 million. The loan
bears an interest rate based on PDST-F plus an agreed margin and will mature on
October 16, 2014.
Ten-year bullet fixed rate loan obtained on August 16, 2006 amounting to P
=1,200 million.
The loan carries a fixed interest rate of 9.75% and will mature on August 16, 2016.
All the above Philippine peso-denominated loans are unsecured except as otherwise indicated.
- 50 -
China Yuan Renminbi-denominated Five-Year Loan
This consists of the following:
A five-year loan obtained on August 26, 2009 amounting to ¥350 million to finance the
construction of shopping malls. The loan is payable in semi-annual installments until 2014.
The loan has a floating rate with an annual re-pricing at prevailing rate dictated by Central
Bank of China less 10%. The loan carries an interest rate of 5.76% in 2014 and 2013.
A five-year loan obtained on August 27, 2010 amounting to ¥150 million to finance the
construction of shopping malls. Partial drawdown totaling ¥61 million was made as at
December 31, 2013. The loan is payable in 2015. The loan has a floating rate with an annual
re-pricing at prevailing rate dictated by Central Bank of China less 10%. The loan carries an
interest rate of 5.76% in 2014 and 2013.
China Yuan Renminbi-denominated Three-Year Loan
This represents a three-year loan obtained on March 28, 2011 amounting to ¥187 million out of
¥250 million loan facility to finance the construction of shopping malls. The Company prepaid
portion of this loan amounting to ¥37 million in 2013 and ¥18 million in 2012. The remaining
¥132 loan was paid in March 2014. The loan has a floating rate with an annual re-pricing at
prevailing rate dictated by Central Bank of China less 5%. The loan bears interest rate of 6.20%
in 2014 and 2013.
The China yuan renminbi-denominated loans are secured by investment properties in China.
Philippine Peso-denominated Fixed Rate Term Loans
This consists of the following:
Long-term loans amounting to P
=12,075 million obtained on various dates in 2013. The loans
bear fixed interest rates ranging from 4.00% to 5.88% with maturities ranging from three to
ten years.
Long-term loan amounting to P
=5,000 million obtained on September 27, 2013. The loan bears
fixed interest rate of 4.77% and will mature on September 27, 2018.
Long-term loan amounting to P
=2,000 million obtained on December 27, 2012. The loan bears
fixed rate of 4.72% and will mature on December 23, 2015.
Three-year loan obtained on October 4, 2013 amounting to P
=315 million. The loan carries an
interest rate of 4.50% and will mature on October 4, 2016.
Philippine Peso-denominated Fixed Rate Corporate Notes
This consists of the following:
Series “A” and Series “B” peso-denominated fixed rate corporate notes amounting to
=3,740 million and P
P
=2,460 million, respectively, issued on June 3, 2013. The Series “A” and
Series “B” notes have fixed interest rates of 5.57% and 5.88%, which are payable semiannually, and with maturity dates of June 3, 2020 and June 3, 2023, respectively.
Peso-denominated fixed rate corporate notes amounting to P
=2,000 million issued on June 28,
2013. The loan bears fixed interest rate at 5.71% payable semi-annually with maturity date of
June 28, 2020.
- 51 Series “A” and Series “B” peso-denominated fixed rate corporate notes amounting to
=2,000 million and P
P
=8,000 million, respectively, on June 1, 2010. The Series “A” and Series
“B” notes have fixed interest rates of 6.76% and 7.73%, which are payable semi-annually,
with maturity dates of June 1, 2013 and June 2, 2015, respectively. The notes were preterminated in June 2013.
Peso-denominated fixed rate corporate notes amounting to P
=6,313 million, issued on April 27,
2012. The notes have fixed interest rate of 6.01% payable semi-annually with maturity date
of July 27, 2017. The notes were pre-terminated in June 2013.
Philippine Peso-denominated Five-Year Bilateral Loans
This consists of the following:
Five-year term loan obtained on October 24, 2011 amounting to P
=500 million and will mature
on October 24, 2016. The loan carries an interest rate based on PDST-F plus an agreed
margin.
Five-year term loans amounting to P
=40 million and P
=80 million obtained in 2010 with fixed
interest rate of 5%. Both loans will mature in 2015. Portion of the principal amount was paid
amounting to P
=0.40 million in 2014 and P
=1 million in 2013 and 2012.
The above loan agreements of the Company provide certain restrictions and requirements
principally with respect to maintenance of required financial ratios (i.e., current ratio of not less
than 1.00:1.00, debt to equity ratio of not more than 0.70:0.30 and debt service coverage ratio of
not less than 1.10:1.00) and material change in ownership or control. As at March 31, 2014 and
December 31, 2013, the Company is in compliance with the terms of its loan covenants.
The re-pricing frequencies of floating rate loans range from three to nine months.
19. Equity
Capital Stock
a. Common stock
Authorized - P
=10 par value per share
Issued:
Balance at the beginning of the year
Issuances
Balance at the end of the year
Subscribed:
Balance at the beginning of the year
Issuances
Balance at the end of the year
Issued and subscribed
Number of Shares
March 31, 2014 December 31, 2013
1,190,000,000
1,190,000,000
796,272,268
–
796,272,268
622,974,620
173,297,648
796,272,268
796,272,268
–
796,272,268
796,272,268
622,974,620
173,297,648
796,272,268
796,272,268
On June 14, 2013, the SEC approved the increase in authorized capital stock of SMIC from
=6,900.0 million to P
P
=11,900.0 million.
- 52 -
On August 7, 2013, the SMIC entered into a Placement Agreement with certain shareholders
and UBS AG, Hong Kong Branch (the “Placement Agent”), where the selling shareholders
shall sell 7.3 million common shares (the “Sale Shares”) at P
=900.00 per share to the Placement
Agent, or to investors that the Placement Agent may procure outside the Philippines.
On August 24, 2012, SMIC entered into a Placement Agreement with certain shareholders and
Macquarie Capital PTE. Limited (the “Placement Agent”), where the selling shareholders
shall sell 9.1 million SMIC common shares (the “Sale Shares”) at P
=700.00 per share to the
Placement Agent, or to investors that the Placement Agent may procure outside the
Philippines.
In 2013 and 2012, the SMIC simultaneously entered into a Subscription Agreement with the
selling shareholders, where the Company agreed to issue new common shares (out of its
authorized but unissued capital stock) in an amount equal to the aggregate number of the Sale
Shares sold by the Selling Shareholders and the Selling Shareholders agreed to subscribe to
the said shares.
The placement and subscription agreements increased “Capital Stock” and “Additional paid-in
capital” in the amount of P
=72.5 million and P
=6,370.6 million in 2013.
In 2013 and 2012, 8,390,334 common shares and 1,710,587 common shares, respectively,
were issued as a result of conversion of SMIC’s convertible bonds (see Note 18). The excess
of the conversion price over par value totaling P
=8,449.7 million in 2013, are presented under
“Additional paid-in capital” account in the consolidated balance sheets.
As at March 31, 2014 and December 31, 2013, the Parent Company is compliant with the
minimum public float as required by the PSE.
The following summarizes the information on the Parent Company’s registration of securities
under the Securities Regulation Code:
Date of SEC Approval
March 2005
November 6, 2007
June 14, 2007
April 25, 2007
October 4, 2010
November 3, 2010
November 25, 2010
August 17, 2011
September 26, 2011
January 2, 2012
January 10, 2012
January 11, 2012
January 26, 2012
February 3, 2012
February 8, 2012
March 8, 2012
March 12, 2012
(Forward)
Authorized
Shares
No. of
Shares Issued
105,000,000
56,000,000
100,000,000
25,023,038
340,858
309,387
309,386
10,668
170,696
21,337
16,002
298,718
90,682
679,584
279,515
250,070
10,668
Issue/Offer
Price
=250
P
218
10
10
453
453
453
453
453
453
453
453
453
453
453
453
453
- 53 -
Date of SEC Approval
March 13, 2012
September 24, 2012
January 23, 2013
January 24, 2013
February 20, 2013
February 25, 2013
February 28, 2013
March 4, 2013
March 6, 2013
March 8, 2013
March 12, 2013
March 14, 2013
March 15, 2013
March 18, 2013
March 19, 2013
March 20, 2013
March 22, 2013
March 25, 2013
April 2, 2013
April 3, 2013
April 5, 2013
April 10, 2013
April 11, 2013
April 12, 2013
April 15, 2013
April 16, 2013
April 17, 2013
April 18, 2013
April 19, 2013
April 22,2013
April 23, 2013
April 24, 2013
April 26, 2013
May 6, 2013
May 7, 2013
May 8, 2013
May 9, 2013
May 10, 2013
May 13, 2013
May 16, 2013
May 17, 2013
May 20, 2013
May 24, 2013
May 28, 2013
May 29, 2013
June 4, 2013
June 5, 2013
June 6, 2013
(Forward)
Authorized
Shares
No. of
Shares Issued
64,011
9,100,000
10,931
32,793
688,668
87,450
109,312
76,518
54,656
109,312
349,797
459,113
109,312
163,968
218,625
153,037
120,243
207,693
546,563
174,900
163,969
109,312
109,312
109,312
54,656
109,312
109,312
229,556
32,793
109,312
185,830
87,449
54,656
120,243
382,594
65,587
21,862
207,693
54,656
109,312
546,562
54,656
163,968
185,831
207,693
163,968
54,656
32,793
Issue/Offer
Price
=453
P
700
781
781
781
781
781
781
781
781
781
781
781
781
781
781
781
781
781
781
781
781
781
781
781
781
781
781
781
781
781
781
781
781
781
781
781
781
781
781
781
781
781
781
781
781
781
781
- 54 -
Date of SEC Approval
June 7, 2013
June 14, 2013
June 24, 2013
July 5, 2013
July 18, 2013
July 19, 2013
July 26, 2013
July 29, 2013
July 30, 2013
August 1, 2013
August 1, 2013
October 17, 2013
October 17, 2013
October 25, 2013
November 1, 2013
Authorized
Shares
No. of
Shares Issued
21,862
500,000,000
10,931
109,312
82,053
164,108
82,054
41,027
136,757
157,629,986
7,250,000
27,328
68,378
136,755
27,351
Issue/Offer
Price
=781
P
10
781
781
625
625
625
625
625
10
900
10
625
625
625
The Company declared stock dividends in 2013 and 2007. The total number of shareholders
of the Parent Company was 1,249 and 1,263 as at December 31, 2013 and 2012, respectively.
b. Redeemable preferred shares
Authorized - P
=10 par value per share
Number of shares
December 31,
March 31,
2013
2014
10,000,000
10,000,000
There are no issued and subscribed preferred shares as at March 31, 2014 and December 31,
2013.
Cost of Parent Common Shares Held by Subsidiaries
Certain subsidiaries hold common shares of the Parent Company. This is presented as “Cost of
Parent common shares held by subsidiaries” and is treated as a reduction in equity as shown in the
consolidated balance sheets and consolidated statements of changes in equity.
The cost of common shares held by subsidiaries as at March 31, 2014 and December 31, 2013
amounting to P
=25.4 million pertains to 879 shares with an average cost of P
=257.7 per share.
In 2013, SM Land disposed 389,612 Parent Company common shares for P
=371.0 million. The
disposal resulted in a total gain of P
=267.7 million where the portion of the gain pertaining to the
interest of the Parent Company and Non-controlling interest is recognized under
“Additional paid-in capital” and “Non-controlling interests” account, respectively, in the
consolidated balance sheets.
Equity Adjustments from Common Control Transactions
Equity adjustments from business combination under common control mainly pertains to the
acquisitions of the various SM China Companies by SM Prime in 2007 and various service
companies by SM Retail in 2009. These acquisitions were considered as business reorganizations
of companies under common control. Thus, the acquisitions were accounted for similar to pooling
of interest method.
- 55 -
In 2013, the Group entered into a corporate restructuring to consolidate all of the SM Group’s real
estate subsidiaries and real estate assets under one single listed entity. At the consolidated level,
all transactions with the subsidiaries were considered as equity transactions. The adjustment
resulting from these transactions was also recorded in this account.
Retained Earnings
a. Appropriated
On December 14, 2012, the BOD approved the appropriation of P
=35,000.0 million retained
earnings.
On April 25, 2013, the BOD approved to reverse P
=8,000.0 million of the appropriation.
As at March 31, 2014 and December 31, 2013, the appropriated retained earnings is intended
for the following projects:
Projects
Timeline
(In Thousands)
Hotel projects
Commercial buildings
Acquisition of investments
2013–2015
2012–2016
2012–2018
P8,000,000
=
10,000,000
9,000,000
=27,000,000
P
b. Unappropriated
On April 25, 2013, the BOD approved the declaration of cash dividends of 118.0% of the par
value or P
=11.80 per share for a total amount of P
=7,402.0 million in favor of stockholders on
record as at May 24, 2013. This was paid on June 20, 2013. On the same date, the BOD
approved the declaration of 25% stock dividends in favor of stockholders on record to be fixed
by the SEC.
On June 24, 2013 and July 12, 2013, the SEC approved the issuance of 157,000,000 and
629,986 shares as stock dividends to stockholders on record as of July 8, 2013. The stock
dividends were issued on August 1, 2013.
The balance of retained earnings includes the accumulated equity in net earnings of
subsidiaries, associates and joint ventures amounting to P
=112,960.5 million and
P
=93,346.9 million as at December 31, 2013 and 2012, respectively. Such amounts are not
available for distribution until such time that the Parent Company receives the dividends from
the respective subsidiaries, associates and joint ventures.
20. Related Party Transactions
Parties are considered to be related if one party has the ability, directly and indirectly, to control
the other party or exercise significant influence over the other party in making financial and
operating decisions. Parties are also considered to be related if they are subject to common
control.
The following are the significant transactions with related parties:
a. Rent
- 56 -
The Group have existing lease agreements for office and commercial spaces with related
companies (retail entities under common stockholder, banking group and other related parties
under common stockholder).
b. Management and Service Fees
The Group pays management fees to Shopping Center Management Corporation, Leisure
Center, Inc., West Avenue Theaters Corporation and Family Entertainment Center, Inc. (related
parties under common stockholder) for the management of the office and mall premises. The
Group also provides manpower and other services to related parties under common
stockholder.
SMIC and SM Retail also receive management and service fees from retail entities under
common stockholder for management, consultancy, manpower and other services.
c. Dividend Income
The Group has investment in certain related parties under common stockholder classified as
AFS equity instruments. The Group earn income from these investments upon the declaration
of dividends by the investees.
d. Cash Placements and Loans
The Group has certain bank accounts and cash placements that are maintained with BDO
and China Bank (Bank Associates). Such accounts earn interest based on prevailing market
interest rates (see Notes 5 and 7).
The Group also availed of bank loans and long-term debt from BDO and China Bank and pays
interest based on prevailing market interest rates (see Note 18).
e. Others
The Group, in the normal course of business, has outstanding receivables from and payables to
related companies as at reporting period which are unsecured and normally settled in cash.
- 57 -
Following is the summary of related party transactions and outstanding balances as at March 31,
2014 and 2013 and December 31, 2013.
Outstanding Amount
Amount of Transactions
Asset (Liability)
March 31,
December 31,
March 31,
March 31,
2013
2013
2014
2014
(In Thousands)
Banking Group
Cash placement and
investment in debt
securities
Interest income
Loans
Interest expense
Rent income
Dividend receivable
(P
=14,952,453)
=–
P
=
P84,669,137
=99,621,590
P
619,020
885,718
731,736
798,688
2,210,000
–
24,400,000
22,190,000
265,963
194,801
62,006
41,054
140,929
20,360
95,582
3,060
1,317,292
–
1,317,292
–
861,396
1,088,743
1,405,099
2,611,290
173,998
150,817
70,815
54,533
277,192
231,920
134,641
109,177
2,583
–
588,496
719,861
175,849
138,213
141,795
4,998
(280,764)
–
1,000,512
1,281,276
(566,790)
–
1,524,515
2,091,305
–
–
52,800
52,800
417,377
–
3,649,049
3,231,672
Terms
Conditions
Interest bearing
0.5% to 6.55%
Unsecured;
no impairment
Interest bearing
4.9% to 6.47%
Interest-bearing
3.25% to 8.79%
Interest-bearing
3.25% to 8.79%
Noninterest
bearing
Noninterest
bearing
Unsecured;
no impairment
Noninterest
bearing
Noninterest
bearing
Noninterest
bearing
Noninterest
bearing
Noninterest
bearing
Noninterest
bearing
Noninterest
bearing
Unsecured;
no impairment
Unsecured;
no impairment
Unsecured;
no impairment
Unsecurehbgd;
no impairment
Unsecured;
no impairment
Interest-bearing
fixed at 4.5%
Noninterestbearing
Unsecured;
no impairment
Unsecured;
no impairment
Unsecured
Unsecured
Unsecured;
no impairment
Unsecured;
no impairment
Retail Entities under
common Stockholders
Rent income
Management fee income
Management fee expense
Dividend income
Service income
Due from related parties
Due to related parties
Other Related Parties
Receivable under common
Stockholders
Receivable for project
development
Unsecured
Unsecured
Terms and Conditions of Transactions with Related Parties
For the periods ended March 31, 2014 and December 31, 2013, the Group did not make any
provision for doubtful accounts relating to amounts owed by related parties. An assessment is
undertaken at each financial report cutoff date by examining the financial position of the related
party and the market in which the related party operates. There have been no guarantees provided
or received for any related party receivables or payables. Related parties under common
stockholders refer to an entity, that is neither a parent, subsidiary, nor an associate, with
stockholders common to the SM Group or under common control.
- 58 -
21. Cost of Merchandise Sales
This account consists of:
March 31,
2014
March 31,
2013
(In Thousands)
Merchandise inventories at the beginning of the year
Purchases
Total goods available for sale
Less merchandise inventories at the end of the year
P
=13,232,308
32,247,139
45,479,447
13,552,140
P
=31,927,307
P13,402,762
=
26,466,535
39,869,297
13,225,356
=26,643,941
P
22. Income tax
The deferred tax assets of P
=2,452.9 million and P
=2,172.8 million as at as at March 31, 2014 and
December 31, 2013, respectively, represent the tax effects of defined benefit liability, unamortized
past service cost, unrealized foreign exchange loss and others, accrued leases, MCIT, unrealized
marked-to-market loss on investments, deferred income on sale of real estate and NOLCO.
The deferred tax liabilities of P
=7,814.9 million and P
=6,970.5 million as at March 31, 2014 and
December 31, 2013 respectively, consist of the tax effects of trademarks and brand names,
capitalized interest, unrealized foreign exchange gain, unrealized gross profit on sale of real estate,
accrued/deferred rent income, unrealized marked-to-market gain on investments, and Unamortized
past service cost and defined benefit asset. The disproportionate relationship between income
before income tax and the provision for income tax is due to various factors such as interest
income already subjected to final tax, non-deductible interest expense, equity in net earnings of
associates, and dividend income exempt from tax.
The Group’s consolidated deferred tax assets as at March 31, 2014 and December 31, 2013 have
been reduced to the extent that part or all of the deferred tax assets may no longer be utilized in the
future.
23. Lease Agreements
The lease agreements of SM Prime and its subsidiaries with their tenants are generally granted for
a term of one year, with the exception of some of the larger tenants operating nationally, which are
granted initial lease terms of five years, renewable on an annual basis thereafter. Upon inception
of the lease agreement, tenants are required to pay certain amounts of deposits. Tenants likewise
pay either a fixed monthly rent, which is calculated by reference to a fixed sum per square meter
of area leased, or pay rent on a percentage rental basis, which comprises of a basic monthly
amount and a percentage of gross sales or a minimum set amount, whichever is higher.
The Parent Company’s lease agreements with its tenants are generally granted for a term of one to
twenty-five years. Tenants likewise pay a fixed monthly rent which is calculated by reference to a
fixed sum per square meter of area leased except for few tenants, which pay either a fixed monthly
rent or a percentage of gross sales, whichever is higher.
- 59 -
Upon inception of the lease agreement, tenants are required to pay certain amounts of deposits.
Tenants’ deposits amounted to P
=10,690.3 million million and P
=10,527.6 million as at March 31,
2014 and December 31, 2013, respectively.
The minimum lease receivables under the noncancellable operating leases of the Parent Company
as at March 31, 2014 and December 31, 2013 are as follows:
December 31,
2013
March 31,
2014
(In Millions)
Within one year
After one year but not more than five years
After five years
Balance at end of year
=791
P
2,903
1,792
=5,486
P
P
=–
2,995
2,303
P
=5,298
SM Prime and its subsidiaries also lease certain parcels of land where some of their malls are
situated or constructed. The terms of the lease are for periods ranging from 15 to 50 years,
renewable for the same period under the same terms and conditions. Rental payments are
generally computed based on a certain percentage of the gross rental income or a certain fixed
amount, whichever is higher.
The minimum lease payables under the noncancellable operating leases of SM Prime as at March
31, 2014 and December 31, 2013 are as follows:
March 31, 2014
December 31, 2013
(In Millions)
Within one year
After one year but not more than five years
After five years
Balance at end of year
P
=739
3,275
27,140
P
=31,154
=735
P
3,261
27,330
=31,326
P
24. Financial Risk Management Objectives and Policies
The Group’s principal financial instruments, other than derivatives, comprise of bank loans,
long-term debt, AFS investments, investments held for trading, time deposits and short-term
investments and cash and cash equivalents. The main purpose of these financial instruments is to
finance the Group’s operations. The Group has other financial assets and liabilities such as
receivables and accounts payable and other current liabilities, which arise directly from its
operations.
The Group also enters into derivative transactions, principally, cross currency swaps, interest rate
swaps, foreign currency call options, non-deliverable forwards and foreign currency range options.
The purpose is to manage the interest rate and foreign currency risks arising from the Group’s
operations and its sources of finance.
The main risks arising from the Group’s financial instruments are interest rate risk, foreign
currency risk, liquidity risk, credit risk and equity price risk. The BOD reviews and agrees
policies for managing each of these risks and they are summarized in the following tables. The
Group’s accounting policies in relation to derivatives are set out in Note 3.
- 60 -
Interest Rate Risk
The following tables set out the carrying amount, by maturity, of the Group’s long-term financial liabilities that are exposed to interest rate risk as at March 31, 2014 and
December 31, 2013:
March 31, 2014
Fixed Rate
Foreign Currency Loans:
US$400 million fixed rate bonds
Interest rate
US$500 million fixed rate bonds
Interest rate
US$250 million convertible bonds
Interest rate
US$500 million Senior bonds
Interest rate
Peso Loans:
Three-year, five-year, seven-year and
ten-year fixed rate notes
Interest rate
Five-year and seven-year retail bonds
Interest rate
Seven-year and ten-year retail bonds
Interest rate
Ten-year corporate notes
Interest rate
Other bank loans
Interest rate
Variable Rate
Foreign Currency Loans:
US$ five-year term loans
Interest rate
China Yuan renminbi loans
(Forward)
3–5 Years
Over 5 Years
(In Thousands)
Total
Debt Issue
Cost/Discount
Below 1 Year
1–2 Years
2–3 Years
$–
–
379,156
6.00%
–
–
–
–
$–
–
–
–
–
–
–
–
$384,073
5.50%
–
–
–
–
–
–
$–
–
–
–
84,084
1.63%
500,000
4.25%
$–
–
–
–
–
–
–
–
P
=17,212,232
(P
=106,930)
P
=17,105,302
16,991,876
(28,129)
16,963,747
3,732,919
(56,739)
3,676,180
22,407,500
(204,566)
22,202,934
P
=38,200
5.57%-6.81%
8,400,000
8.25%
–
–
–
–
1,384,550
5.00%-7.00%
P
=7,238,600
4.32%-6.81%
1,000,000
9.10%
–
–
–
–
1,853,650
4.50%-9.75%
P
=11,639,400
4.00%-6.81%
–
–
–
–
–
–
8,070,700
3.98%-5.88%
P
=8,933,220
5.40%-6.81%
–
–
5,023,460
6.00%
1,100,000
10.11%
5,254,000
4.39%-5.88%
P
=9,668,380
5.24%-6.81%
–
–
8,058,810
6.94%
–
–
2,086,000
4.03%-5.88%
37,517,800
(196,494)
37,321,306
9,400,000
(4,852)
9,395,148
13,082,270
(90,923)
12,991,347
1,100,000
(6,657)
1,093,343
18,648,900
(157,475)
18,491,425
–
–
¥244,000
$320,000
LIBOR+margin%
¥60,900
$50,000
LIBOR+margin%
–
–
–
–
–
–
–
16,581,550
(179,655)
16,401,895
1,952,729
–
Carrying Amount
1,952,729
- 61 March 31, 2014
Below 1 Year
Interest rate
US$ bilateral loans
Interest rate
US$ five-year syndicated loans
Interest rate
Other bank loans
Interest rate
Peso Loans:
Peso loans collateralized with time deposits
Interest rate
Five-year, seven-year and ten-year corporate notes
Interest rate
Five-year and ten-year corporate notes
Interest rate
Five-year floating rate loan
Interest rate
Five-year bilateral loans
Interest rate
Other bank loans
Interest rate
1–2 Years
2–3 Years
3–5 Years
Over 5 Years
(In Thousands)
5.76%
5.76%
–
–
–
–
–
$25,000
–
–
–
–
LIBOR+margin%
–
–
–
–
$500,000
–
–
–
–
LIBOR+margin%
–
–
–
–
$120,000
–
–
–
–
LIBOR+margin%
–
–
–
–
–
–
–
P
=–
P
=–
P
=2,900,000
P
=–
P
=–
–
– PDST-F+margin%
–
–
68,000
5,776,000
16,000
736,000
–
PDST-F+margin% PDST-F+margin% PDST-F+margin% PDST-F+margin%
–
44,500
89,000
3,332,000
20,000
920,000
PDST-F+margin% PDST-F+margin% PDST-F+margin% PDST-F+margin% PDST-F+margin%
–
4,850,000
–
–
–
– PDST-F+margin%
–
–
–
–
500,000
–
–
–
– PDST-F+margin%
–
–
–
5,008,180
2,785,280
–
2,000,000
–
PDST-F+margin% PDST-F+margin%
– PDST-F+margin%
–
Total
Debt Issue
Cost/Discount
Carrying Amount
P
=1,120,375
(P
=5,278)
P
=1,115,097
22,407,500
(451,172)
21,956,328
5,377,800
(144,164)
5,233,636
2,900,000
(2,554)
2,897,446
6,596,000
(22,610)
6,573,390
4,405,500
(22,683)
4,382,817
4,850,000
(18,048)
4,831,952
500,000
(1,424)
498,576
9,793,460
(18,256)
9,775,204
P
=216,578,411
(P
=1,718,609)
P
=214,859,802
- 62 -
December 31, 2013
Fixed Rate
Foreign Currency Loans:
US$400 million fixed rate bonds
Interest rate
US$500 million fixed rate bonds
Interest rate
US$250 million convertible bonds
Interest rate
US$500 million Senior bonds
Interest rate
Peso Loans:
Three-year, five-year, seven-year and
ten-year fixed rate notes
Interest rate
Five-year and seven-year retail bonds
Interest rate
Seven-year and ten-year retail bonds
Interest rate
Ten-year corporate notes
Interest rate
Other bank loans
Interest rate
Variable Rate
Foreign Currency Loans:
US$ five-year term loans
Interest rate
China Yuan renminbi loans
3–5 Years
Over 5 Years
(In Thousands)
Total
Debt Issue
Cost/Discount
Below 1 Year
1–2 Years
2–3 Years
$–
–
379,156
6.00%
–
–
–
–
$–
–
–
–
–
–
–
–
$383,463
5.50%
–
–
–
–
–
–
$–
–
–
–
84,084
1.63%
–
–
$–
–
–
–
–
–
500,000
4.25%
P
=17,023,867
(P
=112,588)
P
=16,911,280
16,832,631
(42,037)
16,790,593
3,732,919
(60,787)
3,672,132
22,197,500
(210,645)
21,986,855
P–
=
–
8,400,000
8.25%
–
–
–
–
1,379,500
5.00%-5.68%
P–
=
–
–
–
–
–
–
–
1,538,100
5.00%-9.75%
=2,000,000
P
4.72%
1,000,000
9.10%
–
–
–
–
315,000
4.50%
=18,757,800
P
4.00%-6.81%
–
–
–
–
–
–
–
–
P
=11,605,600
5.90%-10.11%
–
–
13,082,270
6.00%-6.94%
1,100,000
10.11%
7,350,000
4.03%-5.88%
32,363,400
(175,781)
32,187,619
9,400,000
(13,795)
9,386,205
13,082,270
(89,961)
12,992,309
1,100,000
(6,906)
1,093,094
10,582,600
(26,880)
10,555,720
–
–
¥386,761
–
–
¥62,782
$570,000
LIBOR+margin%
–
–
–
–
–
–
–
25,305,150
(426,877)
24,878,273
3,197,597
–
Carrying Amount
3,197,597
- 63 December 31, 2013
Below 1 Year
Interest rate
US$ bilateral loans
Interest rate
US$ five-year syndicated loans
Interest rate
Other bank loans
Interest rate
Peso Loans:
Peso loans collateralized with time deposits
Interest rate
Five-year, seven-year and ten-year corporate notes
Interest rate
Five-year and ten-year corporate notes
Interest rate
Five-year floating rate loan
Interest rate
Five-year bilateral loans
Interest rate
Other bank loans
Interest rate
5.76%-6.20%
–
–
–
–
–
–
–
=–
P
–
–
–
–
–
–
–
–
–
5,000,000
PDST-F+margin%
1–2 Years
5.76%-6.20%
–
–
–
–
–
–
–
=–
P
–
–
–
–
–
–
–
–
–
2,793,460
PDST-F+margin%
2–3 Years
–
–
–
–
–
50,000
LIBOR+margin%
–
=3,000,000
P
PDST-F+margin%
1,746,000
PDST-F+margin%
–
–
4,900,000
PDST-F+margin%
500,000
PDST-F+margin%
–
3–5 Years
Over 5 Years
(In Thousands)
–
$25,000
LIBOR+margin%
500,000
LIBOR+margin%
50,000
LIBOR+margin%
–
P
=–
–
–
–
3,415,500
PDST-F+margin%
–
–
–
–
198,000
PDST-F+margin%
–
–
–
–
–
–
–
–
P
=–
–
4,850,000
PDST-F+margin%
990,000
PDST-F+margin%
–
–
–
–
2,000,000
PDST-F+margin%
Total
Debt Issue
Cost/Discount
Carrying Amount
P
=1,109,876
(P
=5,995)
P
=1,103,881
22,197,500
(473,025)
21,724,475
4,439,500
(55,869)
4,383,631
3,000,000
(3,457)
2,996,543
6,596,000
(25,068)
6,570,932
4,405,500
(28,297)
4,377,203
4,900,000
(20,390)
4,879,610
500,000
(1,545)
498,455
9,991,460
(21,830)
9,969,630
P
=211,957,770
(P
=1,801,733)
P
=210,156,037
- 64 -
Fixed rate financial instruments are subject to fair value interest rate risk while floating rate
financial instruments are subject to cash flow interest rate risk.
Repricing of floating rate financial instruments is mostly done at intervals of three months or six
months.
The Group’s policy is to manage its interest cost using a mix of fixed and variable rate debts. The
Group’s guideline is to keep between 50% to 60% of its borrowings at fixed interest rates. To
manage this mix in a cost-efficient manner, the Group enters into interest rate swaps and
cross-currency swaps, in which the Group agrees to exchange, at specified intervals, the difference
between fixed and variable rate interest amounts calculated by reference to an agreed notional
amount. The interest rate swaps economically hedge the underlying debt obligations. The crosscurrency swaps were designated by the Group under cash flow hedge accounting (see Note 25).
As at March 31, 2014 and December 31, 2013, after taking into account the effect of the swaps,
approximately 65.0% and 63.0%, respectively, of the Group’s borrowings are kept at a fixed rate
of interest, considering market conditions.
Foreign Currency Risk
The Group’s exposure to foreign currency risk arises as the Parent Company and SM Prime have
significant investments and debt issuances which are denominated in U.S. dollars. To manage its
foreign exchange risk, stabilize cash flows and improve investment and cash flow planning, the
Group enters into foreign currency swap contracts, foreign cross-currency swaps, foreign currency
call options, non-deliverable forwards and foreign currency range options (see Note 25) with the
aim of reducing and/or managing the adverse impact of changes in foreign exchange rates on
financial performance and cash flows.
The Group’s foreign currency-denominated monetary assets and liabilities amounted to P
=87,456.3
million (US$1,951.3 million) and P
=93,127.9 million (US$2,078.0 million), respectively, as at
March 31, 2014, and P
=84,970.2 million (US$1,914.0 million) and P
=100,887.5 (US$2,272.5
million), respectively, as at December 31, 2013.
As at March 31, 2014 and December 31, 2013, approximately 39.9% and 41.7%, respectively, of
the Group’s total consolidated bank loans and long-term debt were denominated in US Dollars.
Thus, appreciation of the Philippine peso against the US Dollar will decrease both the principal
amount of the foreign currency-denominated debt and interest expense on the Group’s debt in
Philippine peso terms.
In translating the foreign currency-denominated monetary assets and liabilities to peso amounts,
the exchange rate used were P
=44.82 to US$1.00, and P
=44.40 to US$1.00, the Philippine peso to
U.S. dollar exchange rates as of March 31, 2014 and December 31, 2013, respectively.
Liquidity Risk
Liquidity risk arises from the possibility that the Group may encounter difficulties in raising funds
to meet commitments from financial instruments.
The Group seeks to manage its liquidity profile to be able to finance capital expenditures and
service maturing debts. To cover its financing requirements, the Group intends to use internally
generated funds and proceeds from debt and equity issues and sales of certain assets.
As part of its liquidity risk management program, the Group regularly evaluates its projected and
actual cash flow information and continuously assesses conditions in the financial markets for
- 65 -
opportunities to pursue fund-raising initiatives. These initiatives may include bank loans, export
credit agency-guaranteed facilities and debt capital and equity market issues.
The Group’s financial assets, which have maturities of less than 12 months and used to meet its
short-term liquidity needs, include cash and cash equivalents, current portion of time deposits and
short-term investments, investments held for trading and current portion of AFS investments bonds amounting to P
=37,189.9 million, P
=28,289.8 and P
=458.9 million, respectively, as at March
31, 2014 and P
=50,209.7 million, P
=28,912.7 million and P
=459.8 million, respectively, as at
December 31, 2013 (see Notes 5, 6 and 7). The Group also has readily available credit facility
with banks and related parties to meet its long-term financial liabilities.
The tables below summarize the maturity profile of the Group’s financial liabilities as at March
31, 2014 and December 31, 2013 based on the contractual undiscounted payments:
March 31, 2014
On Demand Less than 1 Year
Bank loans
Accounts payable and other
current liabilities*
Long-term debt (including
current portion)
Derivative liabilities:**
Interest rate swaps
Multiple derivatives
on convertible bonds
Dividends payable
Tenants’ deposits
2 to 5 Years
(In Thousands)
More than
5 Years
Total
P
=–
P
=20,472,959
P
=–
P
=–
P
=20,472,959
–
50,003,909
–
–
50,003,909
–
39,837,873
138,743,211
68,553,739
247,134,823
–
–
159,356
–
159,356
–
–
–
P
=–
787,109
209,640
–
P
=111,311,490
–
–
10,690,301
P
= 149,592,868
–
–
–
P
= 68,553,739
787,109
209,640
10,690,301
P
=329,458,097
More than
5 Years
Total
December 31, 2013
Bank loans
Accounts payable and other
current liabilities*
Long-term debt (including
current portion)
Derivative liabilities:**
Interest rate swaps
Multiple derivatives
on convertible bonds
Dividends payable
Tenants’ deposits
On Demand
Less than 1 Year
2 to 5 Years
(In Thousands)
=
P–
=
P27,588,259
=
P–
=
P–
=
P27,588,259
–
64,416,727
–
–
64,416,727
–
38,296,386
138,091,911
66,216,033
242,604,330
–
–
159,974
–
159,974
–
845,429
–
–
845,429
–
210,189
–
–
210,189
–
–
10,527,581
–
10,527,581
=
P–
=
P131,356,990
=
P148,779,466
=
P66,216,033
=
P346,352,489
** Excluding payable to government agencies of =
P 2,037.6 million and =
P 3,671.6 million as at March 31, 2014 and December 31, 2013,
respectively, the amounts of which are not considered as financial liabilities.
** Based on estimated future cash flows.
Credit Risk
The Group trades only with recognized, creditworthy related and third parties. It is the Group’s
policy that all customers who wish to trade on credit terms are subject to credit verification
procedures. In addition, receivable balances are monitored on a regular basis which aims to
reduce the Group’s exposure to bad debts at a minimum level. Given the Group’s diverse base of
customers, it is not exposed to large concentrations of credit risk.
With respect to credit risk arising from the other financial assets of the Group, which comprise of
cash and cash equivalents, time deposits and short-term investments, investments held for trading,
- 66 -
AFS investments and certain derivative instruments, the Group’s exposure to credit risk arises
from default of the counterparty, with a maximum exposure equal to the carrying amount of these
instruments, without considering the effects of collateral.
Since the Group trades only with recognized related and third parties, there is no requirement for
collateral.
Receivable from sale of real estate has minimal credit risk and is effectively collateralized by
respective unit sold since title to the real estate properties are not transferred to the buyers until
full payment is made.
As at March 31, 2014 and December 31, 2013, the financial assets, except for certain receivables
and AFS investments, are generally viewed by management as good and collectible considering
the credit history of the counterparties. Past due or impaired financial assets are very minimal in
relation to the Group’s total financial assets.
Credit Quality of Financial Assets
The credit quality of financial assets is managed by the Group using high quality and standard
quality as internal credit ratings.
High Quality. This pertains to a counterparty who is not expected by the Group to default in
settling its obligations, thus credit risk exposure is minimal. This normally includes large prime
financial institutions, companies and government agencies.
Standard Quality. Other financial assets not belonging to high quality financial assets are
included in this category.
As at March 31, 2014 and December 31, 2013, the credit analyses of the Group’s financial assets
that are neither past due nor impaired are as follows:
Cash and cash equivalents
(excluding cash on hand)
Time deposits and short-term investments
(including noncurrent portion)
Investments held for trading Bonds
AFS investments
Receivables - net (including noncurrent
portion of receivables from real
estate buyers)
Advances and other receivables - net
(includes non-trade receivables,
advances and deposits, receivable
from banks and credit card, accrued
interest receivable, and advances for
project development under “Other
current assets” account in the
consolidated balance sheet)
Derivative assets (included under “Other
noncurrent assets” account in the
consolidated balance sheet)
High Quality
March 31, 2014
Standard Quality
(In Thousands)
Total
P
=36,388,575
P
=–
P
=36,388,575
55,626,920
–
55,626,920
458,931
18,513,084
–
8,148
458,931
18,521,232
26,410,276
4,801,166
31,211,442
11,832,822
–
11,832,822
3,009,315
P
=152,239,923
–
P
=4,809,314
3,009,315
P
=157,049,237
- 67 -
Cash and cash equivalents
(excluding cash on hand)
Time deposits and short-term investments
(including noncurrent portion)
Investments held for trading Bonds
AFS investments
Receivables - net (including noncurrent
portion of receivables from real
estate buyers)
Advances and other receivables - net
(includes non-trade receivables,
advances and deposits, receivable
from banks and credit card, accrued
interest receivable, and advances for
project development under “Other
current assets” account)
Long-term notes (included under “Other
noncurrent assets” account)
Derivative assets (included under “Other
noncurrent assets” account)
High Quality
December 31, 2013
Standard Quality
(In Thousands)
Total
=48,999,592
P
=–
P
=48,999,592
P
55,993,600
–
55,993,600
459,754
17,154,400
–
3,918
459,754
17,158,318
30,313,593
5,802,860
36,116,453
13,649,588
–
13,649,588
218,124
–
218,124
2,643,487
=169,432,138
P
–
=5,806,778
P
2,643,487
=175,238,916
P
Equity Price Risk
The Group’s exposure to equity price pertains to its investments in quoted equity shares which are
classified as AFS investments in the consolidated balance sheets. Equity price risk arises from the
changes in the levels of equity indices and the value of individual stocks traded in the stock
exchange.
As a policy, management monitors the equity securities in its investment portfolio based on
market expectations. Material equity investments within the portfolio are managed on an
individual basis and all buy and sell decisions are approved by management.
Capital Management
Capital includes equity attributable to the owners of the Parent.
The primary objective of the Group’s capital management is to ensure that it maintains a strong
credit rating and healthy capital ratios in order to support its business and maximize shareholder
value.
The Group manages its capital structure and makes adjustments to it, in the light of changes in
economic conditions. To maintain or adjust the capital structure, the Group may adjust the
dividend payment to shareholders, pay-off existing debts, return capital to shareholders or issue
new shares.
The Group monitors its capital gearing by measuring the ratio of net interest-bearing debt divided
by total capital plus net interest-bearing debt and interest-bearing debt divided by total capital plus
interest-bearing debt. Net interest-bearing debt includes all short-term and long-term debt,
reduced by related pledged time deposits, net of cash and cash equivalents, time deposits and
short-term investments, investments in bonds held for trading, AFS investments (redeemable
preferred shares and bonds and corporate notes) and long-term notes included under “Other
noncurrent assets” account, while interest-bearing debt includes all short-term and long-term debt,
- 68 -
reduced by related pledged time deposits. The Group’s guideline is to keep the gearing ratio at not
lower than 50:50.
As at March 31, 2014 and December 31, 2013, the Group’s ratio of net interest-bearing debt to
total capital plus net interest-bearing debt and ratio of interest-bearing debt to total capital plus
interest-bearing debt were as follows:
Net Interest-bearing Debt to Total Capital plus Net Interest-bearing Debt
December 31,
2013
March 31,
2014
(In Thousands)
Bank loans
Long-term debt
Less:
Cash and cash equivalents
(excluding cash on hand)
Time deposits and short-term investments
AFS investments (bonds and corporate notes)
Investments held for trading-bonds
Long-term notes included under
“Other noncurrent assets” account
Total net interest-bearing debt (a)
Total equity attributable to owners of the Parent
Total net interest-bearing debt and equity
attributable to owners of the Parent (b)
P
=20,472,959
214,859,802
P27,588,259
=
210,156,037
(36,388,575)
(55,626,920)
(5,639,475)
(458,932)
(48,999,592)
(55,993,600)
(5,539,822)
(457,754)
–
137,218,859
227,504,416
(218,124)
126,535,404
219,433,817
=345,969,221
P
P
=364,723,275
Gearing ratio (a/b)
37%
38%
Interest-bearing Debt to Total Capital plus Interest-bearing Debt
March 31,
2014
December 31,
2013
(In Thousands)
Bank loans
Long-term debt
Total interest-bearing debt (a)
Total equity attributable to owners of the Parent
Total interest-bearing debt and equity attributable to
owners of the Parent (b)
Gearing ratio (a/b)
P
=20,472,959
214,859,802
235,332,761
227,504,416
P27,588,259
=
210,156,037
237,744,296
219,433,817
P
=462,837,177
=457,178,113
P
51%
52%
- 69 -
25. Financial Instruments
Fair Values
The following table sets forth the carrying values and estimated fair values of financial assets and
liabilities, by category and by class, recognized as at March 31, 2014 and December 31, 2013:
Carrying
Value
Assets Measured at Fair Value
Financial assets at FVPL:
Investments held for trading Bonds
Derivative assets
AFS investments:
Shares of stock
Bonds and corporate notes
Club shares
Assets for which Fair Values are Disclosed
Loans and receivables:
Cash and cash equivalents
Time deposits and short-term investments
(including noncurrent portion)
Receivables - net (including noncurrent portion
of receivables from real estate buyers)
Advances and other receivables - net (included
under “Other current assets” account in the
consolidated balance sheets)
Liabilities Measured at Fair Value
Financial Liabilities at FVPL:
Derivative liabilities
Liabilities for which Fair Values are Disclosed
Other Financial Liabilities:
Bank loans
Accounts payable and other current liabilities*
Long-term debt (including current portion and
net of unamortized debt issue cost)
Dividends payable
Tenants’ deposits and others
March 31, 2014
Quoted Prices
in Active
Markets
Total
(Level 1)
(In Thousands)
Significant
Significant
Observable Unobservable
Inputs
Inputs
(Level 2)
(Level 3)
=
P458,931
3,009,315
3,468,246
=
P458,931
3,009,315
3,468,246
=
P458,931
–
458,931
=
P–
3,009,315
3,009,315
=
P–
–
–
13,888,805
4,620,457
11,970
18,521,232
21,989,478
13,888,805
4,620,457
11,970
18,521,232
21,989,478
13,888,805
4,620,457
11,970
18,521,232
18,980,163
–
–
–
–
3,009,315
–
–
–
–
–
37,189,870
37,189,870
–
–
37,189,870
55,626,920
57,629,001
–
–
57,629,001
38,534,919
38,534,919
–
–
38,534,919
11,832,822
143,184,531
=
P165,174,009
11,832,822
145,186,612
=
P167,176,090
–
–
=
P18,980,163
–
–
=
P3,009,315
11,832,822
145,186,612
=
P145,186,612
=
P946,465
=
P946,465
=
P–
=
P159,356
=
P787,109
20,472,959
50,003,909
20,472,959
50,003,909
–
–
–
–
–
–
20,472,959
50,003,909
214,859,802
223,658,773
223,658,773
209,640
209,640
–
–
209,640
18,910,095
13,260,702
–
–
13,260,702
304,456,405
307,605,983
–
–
307,605,983
=
P305,402,870 =
P308,552,448
=
P–
=
P159,356 =
P308,393,092
*Excluding payable to government agencies of =
P2,037.6 million at March 31, 2014, the amounts of which are not considered as
financial liabilities.
Carrying
Value
Assets Measured at Fair Value
Financial assets at FVPL:
Investments held for trading Bonds
Derivative assets
AFS investments:
Shares of stock
Bonds and corporate notes
December 31, 2013
Quoted Prices
in Active
Markets
Total
(Level 1)
(In Thousands)
Significant
Significant
Observable Unobservable
Inputs
Inputs
(Level 2)
(Level 3)
=
P459,754
2,643,487
3,103,241
=
P459,754
2,643,487
3,103,241
=
P459,754
–
459,754
=
P–
2,643,487
2,643,487
=
P–
–
–
11,607,236
5,539,822
11,539,018
5,539,822
11,539,018
5,539,822
–
–
–
–
- 70 -
Carrying
Value
Club shares
Assets for which Fair Values are Disclosed
Loans and receivables:
Cash and cash equivalents
Time deposits and short-term investments
(including noncurrent portion)
Receivables - net (including noncurrent portion
of receivables from real estate buyers)
Advances and other receivables - net (included
under “Other current assets” account in the
consolidated balance sheets)
Long-term notes (included under “Other
noncurrent assets” account in the
consolidated balance sheets)
Liabilities Measured at Fair Value
Financial Liabilities at FVPL:
Derivative liabilities
Liabilities for which Fair Values are Disclosed
Other Financial Liabilities:
Bank loans
Accounts payable and other current liabilities*
Long-term debt (including current portion and
net of unamortized debt issue cost)
Dividends payable
Tenants’ deposits and others
December 31, 2013
Quoted Prices
in Active
Markets
Total
(Level 1)
(In Thousands)
Significant
Significant
Observable Unobservable
Inputs
Inputs
(Level 2)
(Level 3)
11,260
17,158,318
20,261,559
11,260
17,090,100
20,193,341
11,260
17,090,100
17,549,854
–
–
2,643,487
–
–
–
50,209,657
50,209,657
–
–
50,209,657
55,993,600
58,549,481
–
–
58,549,481
37,274,237
37,274,237
–
–
37,274,237
13,649,588
13,649,588
–
–
13,649,588
218,124
157,345,206
=
P177,606,765
264,656
159,947,619
=
P180,140,960
–
–
=
P17,549,854
–
–
=
P2,643,487
264,656
159,947,619
=
P159,947,619
=
P1,005,403
=
P1,005,403
=
P–
=
P159,974
=
P845,29
27,588,259
64,416,727
27,588,259
64,416,727
27,588,259
–
–
–
–
64,416,727
210,156,037
224,775,629
–
–
224,775,629
210,189
210,189
–
–
210,189
17,967,224
13,047,622
–
13,047,622
320,338,436
330,038,426
27,588,259
–
302,450,167
=
P321,343,839 =
P331,043,829
=
P27,588,259
=
P159,974 =
P303,295,596
*Excluding payable to government agencies of =
P3,671.6 million at December 31, 2013, the amounts of which are not considered as
financial liabilities.
During the three-month period ended March 31, 2014 and the year ended December 31, 2013,
there were no transfers between Level 1 and Level 2 fair value measurements and no transfers into
and out of Level 3 fair value measurements.
Fair Value Hierarchy
All financial instruments for which fair value is recognised or disclosed are categorised within the
fair value hierarchy, based on the lowest level input that is significant to the fair value
measurement as a whole, as follows:
Level 1 - Quoted (unadjusted) market prices in active markets for identical assets or liabilities
Level 2 - Valuation techniques for which the lowest level input that is significant to the fair
value measurement is directly or indirectly observable
Level 3 - Valuation techniques for which the lowest level input that is significant to the fair
value measurement is unobservable
For assets and liabilities that are recognised at fair value on a recurring basis, the Group
determines whether transfers have occurred between levels in the hierarchy by re-assessing
categorisation (based on the lowest level input that is significant to the fair value measurement as
a whole) at the end of each reporting period.
- 71 -
Derivative Financial Instruments
To address the Group’s exposure to market risk for changes in interest rates arising primarily from
its long-term floating rate debt obligations and to manage its foreign exchange risks, the Group
entered into various derivative transactions such as cross-currency swaps, interest rate swaps,
foreign currency call options, non-deliverable forwards and foreign currency range options. The
Group also has embedded derivatives bifurcated from the Parent Company’s convertible bonds.
Derivative Assets
March 31,
2014
December 31,
2013
(In Thousands)
Parent (see Note 15):
Cross-currency swaps
SM Prime (see Note 15):
Cross-currency swaps
Interest rate swaps
P
=998,850
=864,677
P
1,935,814
74,651
P
=3,009,315
1,668,400
110,410
=2,643,487
P
March 31,
2014
December 31,
2013
Derivative Liabilities
(In Thousands)
Parent:
Options arising from convertible bonds
SM Prime Interest rate swaps
P
=787,109
=845,429
P
159,356
P
=946,465
159,974
=1,005,403
P
Cross Currency Swaps. In 2013, the SM Prime entered into cross-currency swap transactions to
hedge both the foreign currency and interest rate exposures on its U.S. dollar-denominated fiveyear term loans (the hedged loans) obtained on January 29, 2013, April 16, and June 2013.
Details of the hedged loans are as follows:
(In US$)
Outstanding Principal Balance
(In Thousands)
(In PhP
=)
Interest Rate
Parent Unsecured loans
180,000
7,425,450
6-month US LIBOR + 1.70%
SM Prime:
Unsecured loan
Unsecured loan
200,000
150,000
8,963,000
6,722,250
6-month US LIBOR + 1.70%
6-month US LIBOR + 1.70%
The table below provides the details of the Group’s outstanding cross-currency swaps as at
March 31, 2014:
Notional Amounts
(In Thousands)
(In US$)
(In PhP
=)
Parent:
Floating-to-Fixed
Floating-to-Fixed
50,000
60,000
2,059,250
2,478,000
Receive
Pay
US$:P
= Rate
Maturity
6M US LIBOR + 1.70% 4.05%
6M US LIBOR + 1.70% 4.03%
=
P41.19
41.30
May 15, 2018
May 15, 2018
- 72 -
Floating-to-Fixed
SM Prime:
Floating-to-Fixed
Floating-to-Fixed
Floating-to-Fixed
Floating-to-Fixed
Floating-to-Fixed
Notional Amounts
(In Thousands)
(In US$)
(In PhP
=)
70,000 2,888,200
Pay
US$:P
= Rate
Maturity
6M US LIBOR + 1.70% 3.98%
41.26
May 15, 2018
150,000
50,000
50,000
50,000
50,000
6M US LIBOR + 1.70%
6M US LIBOR + 1.70%
6M US LIBOR + 1.70%
6M US LIBOR + 1.70%
6M US LIBOR + 1.70%
3.70%
3.70%
3.90%
3.90%
3.90%
40.67
40.67
41.10
41.10
41.10
January 29, 2018
January 29, 2018
March 23, 2018
March 23, 2018
March 23, 2018
6,100,500
2,033,500
2,055,000
2,055,000
2,055,000
Receive
Under the floating-to-fixed cross-currency swaps, the Parent Company and SM Prime effectively
converted the hedged US dollar-denominated loans into Philippine peso-denominated loans where,
at inception, it agreed to swap US dollar principal equal to the face amount of the loans for their
agreed Philippine peso equivalents with the counterparty banks and to exchange, at maturity date,
the principal amount originally swapped. The agreements also require the Parent Company and
SM Prime to pay fixed interest at the Philippine peso notional amount and receives floating
interest on the US$ notional amount, on a semi-annual basis, simultaneous with the interest
payments on the hedged loans.
Other Derivative Instruments Not Designated as Hedges
The table below shows information on the Group’s interest rate swaps presented by maturity
profile:
<1 Year
March 31, 2014
>1-<2 Years
>2-<5 Years
Floating-Fixed
Outstanding notional amount
Receive-floating rate
Pay-fixed rate
$145,000,000
6 months LIBOR+margin%
2.91%–3.28%
$–
$–
Outstanding notional amount
Receive-floating rate
Pay-fixed rate
$30,000,000
$30,000,000
6 months LIBOR+margin% 6 months LIBOR+margin%
3.18%
3.18%
$–
Outstanding notional amount
Receive-floating rate
Pay-fixed rate
$20,000,000
6 months LIBOR+margin%
3.53%
$–
$–
Outstanding notional amount
Receive-floating rate
Pay-fixed rate
P
= 174,720,000
3MPDST-F
3.65%
P
= 174,720,000
3MPDST-F
3.65%
$–
Outstanding notional amount
Receive-floating rate
Pay-fixed rate
P
= 174,720,000
3MPDST-F+margin%
4.95%
P
= 174,720,000
3MPDST-F+margin%
4.95%
$–
Fixed-Floating
Outstanding notional amount
Receive-fixed rate
Pay-floating rate
P
= 960,000,000
5.44%
3MPDST-F
P
= 950,000,000
5.44%
3MPDST-F
$–
Outstanding notional amount
Receive-fixed rate
Pay-floating rate
P
= 960,000,000
7.36%
3MPDST-F+margin%
P
= 950,000,000
7.36%
3MPDST-F+margin%
$–
(Forward)
December 31, 2013
Floating-Fixed
Outstanding notional amount
Receive-floating rate
Pay-fixed rate
<1 Year
>1-<2 Years
>2-<5 Years
$145,000,000
6 months LIBOR+margin%
2.91%–3.28%
$145,000,000
6 months LIBOR+margin%
2.91%–3.28%
$–
- 73 March 31, 2014
>1-<2 Years
$30,000,000
6 months LIBOR+margin%
3.18%
Outstanding notional amount
Receive-floating rate
Pay-fixed rate
<1 Year
$30,000,000
6 months LIBOR+margin%
3.18%
>2-<5 Years
$–
Outstanding notional amount
Receive-floating rate
Pay-fixed rate
$20,000,000
6 months LIBOR+margin%
3.53%
$–
$–
Outstanding notional amount
Receive-floating rate
Pay-fixed rate
=174,720,000
P
3MPDST-F
3.65%
=174,720,000
P
3MPDST-F
3.65%
$–
Outstanding notional amount
Receive-floating rate
Pay-fixed rate
=174,720,000
P
3MPDST-F+margin%
4.95%
=174,720,000
P
3MPDST-F+margin%
4.95%
$–
Fixed-Floating
Outstanding notional amount
Receive-fixed rate
Pay-floating rate
=960,000,000
P
5.44%
3MPDST-F
=950,000,000
P
5.44%
3MPDST-F
$–
Outstanding notional amount
Receive-fixed rate
Pay-floating rate
=960,000,000
P
7.36%
3MPDST-F+margin%
=950,000,000
P
7.36%
3MPDST-F+margin%
$–
Derivative Liabilities
Options Arising from Investment in Convertible Bonds. The Parent Company invested in US$
denominated convertible bonds of a public company which it classified as AFS investments. The
bonds contain multiple embedded derivatives such as long equity call, short call and long put
options. Such multiple embedded derivatives were bifurcated by the Parent Company from the
host bonds on the respective purchase dates of the bonds and were accounted for as single
compound derivative. The net positive fair value of the options at inception amounted to
=3.7 million. The long equity call option pertains to the right of the Parent Company to convert
P
the bonds into common shares of the issuer at the conversion price of P
=63.7 (P
=26.9 at present) per
share at the fixed exchange rate of P
=40.6 per US$1.0 until January 31, 2013, subject to a cash
settlement option on the part of the issuer. The short call option pertains to the right of the issuer
to early redeem the bonds on or after February 11, 2010 subject to the conditions stated in the
bond agreement. On the other hand, the long put option, which expired on February 11, 2011,
pertains to the right of the Parent Company to require the issuer to redeem the bonds at 115.6%.
As at March 31, 2014 and December 31, 2013, all outstanding embedded derivatives of the
convertible bonds have nil values.
Options Arising from Convertible Bonds. The Parent Company’s and SM Prime’s convertible
bonds contain multiple embedded derivatives such as short equity call option, long call option and
short put option, which were bifurcated and accounted for as single compound derivative.
- 74 -
US$250.0 million Convertible Bonds
As at March 31, 2014 and December 31, 2013, the negative fair value of the multiple embedded
derivatives, which is shown as a current liability in the parent company balance sheets, amounted
to P
=787.1 million and P
=845.4 million, respectively. At inception date, the negative fair value of
the options amounted to P
=1,193.9 million. In 2014 and 2013, the Parent Company recognized a
net fair value change from these options amounting to P
=67.6 million gain and P
=1,321.0 million
loss which is recognized under “Gain (loss) on fair value changes on derivatives - net” account
and P
=9.3 million loss which is recognized under “Foreign exchange gain - net” account in the
consolidated statements of income. Also, as a result of the exercise of the conversion option at
various dates in 2013, P
=2,962.9 million of the option value was transferred from derivative
liabilities to “Additional paid-in capital” (APIC) account in the parent company balance sheets.
Interest Rate Swaps. In 2013, SM Prime entered into two floating to fixed Philippine peso interest
rate swap agreements with a notional amount of P
=175.0 million each to offset the cash flows of the
two fixed to floating Philippine peso interest rate swaps entered in 2010 to reflect SM Prime’s
partial prepayment of the underlying Philippine peso loan. As at March 31, 2014 and December
31, 2013, these interest rate swaps have negative fair value of P
=5.0 million and P
=9.0 million,
respectively. In 2011, SM Prime entered into floating to fixed US$ interest rate swap agreements
with aggregate notional amount of US$145.0 million. Under the agreements, SM Prime
effectively converts the floating rate U.S. dollar-denominated term loan into fixed rate loan with
semi-annual payment intervals up to March 21, 2015. As at March 31, 2014 and December 31,
2013, the floating to fixed interest rate swaps have aggregate negative fair value of P
=112.0 million
and P
=114.0 million, respectively.
SM Prime also entered into US$ interest rate swap agreement with notional amount of
US$20.0 million in 2011. Under the agreement, SM Prime effectively converts the floating rate
U.S. dollar-denominated five-year bilateral unsecured loan into fixed rate loan with semi-annual
payment intervals up to November 30, 2014. As at March 31, 2014 and December 31, 2013, the
floating to fixed interest rate swap has negative fair value of P
=11.0 million and P
=10.0 million,
respectively.
In 2010, SM Prime entered into the following interest rate swap agreements:
A US$ interest rate swap agreement with nominal amount of US$30.0 million. Under the
agreement, SM Prime effectively converts the floating rate U.S. dollar-denominated five-year
bilateral unsecured loan into fixed rate loan with semi-annual payment intervals up to
November 30, 2015. As at March 31, 2014 and December 31, 2013, the floating to fixed
interest rate swap has negative fair value of P
=36.0 million.
Two Philippine peso interest rate swap agreements with notional amount of P
=1,000.0 million
each, with amortization of P
=10.0 million every anniversary. The consolidated net cash flows
of the two swaps effectively converts the Philippine peso-denominated five-year inverse
floating rate notes into floating rate notes with quarterly payment intervals up to June 2015.
In 2013, SMPH entered into two floating to fixed opposite-side Philippine peso interest rate
swap agreements for a partial notional amount of P
=174.7 million each to effectively unwind
the original swap in line with the Company’s partial prepayment of the loan. As at March 31,
2014 and December 31, 2013, these swaps have positive fair value of P
=80.0 million and P
=
110.0 million, respectively.
- 75 -
In 2009, SM Prime entered into US$ interest rate swap agreements with aggregate notional
amount of US$25.0 million. Under these agreements, SM Prime effectively converts the
floating rate US dollar-denominated five-year bilateral loan into fixed rate loan with semiannual payment intervals up to November 2013. Fair value changes from the matured swaps
recognized in the consolidated statements of income amounted to P
=10.0 million gain in 2013.
Non-deliverable Forwards. In 2013, 2012 and 2011, the Parent Company and SM Prime entered
into sell P
= and buy US$ forward contracts. It also entered into sell US$ and buy P
= with the same
aggregate notional amount. The Group recognized derivative assets amounting to nil and P
=18.5
million from the outstanding forward contracts as at March 31, 2014 and December 31, 2013,
respectively.
The reconciliation of the amounts of derivative assets and liabilities recognized in the consolidated
balance sheets is as follows:
March 31,
2014
December 31,
2013
(In Thousands)
Derivative assets
Derivative liabilities
Balance at end of period
3,009,315
(946,465)
P
=2,062,850
P2,643,487
=
(1,005,403)
=1,638,084
P
26. EPS Computation
March 31,
2014
March 31,
2013
(In Thousands, Except for Per Share
Data)
Net Income Attributable to Common
Owners of the Parent
Net income attributable to common owners of the Parent for
basic earnings (a)
Weighted Average Number of Common Shares
Outstanding
Weighted average number of common shares outstanding for
the period (b)
Basic EPS (a/b)
P
=6,239,811
P
=7,421,180
796,272
781,176
P
=7.84
P
=9.50
27. Reclassification
The comparative information in the consolidated financial statements for the period ended March
31, 2013 has been reclassified to conform to the presentation of the financial statements for the
period ended March 31, 2014.
- 76 -
28. Events After the Reporting Period
On April 25, 2014, SMIC invested an additional P
=103.0 million in CityMall Commercial Center
Inc. (CMCCI) equivalent to 1.0 million shares.
On April 30, 2014, the BOD approved the declaration of cash dividends of 103.4% of the par
value or P
=10.34 per share for a total amount of P
=8,233.5 million in favor of stockholders on record
as at May 30, 2014. This will be paid on or before June 26, 2014.
- 77 -
PART 1
Item 2.
FINANCIAL INFORMATION
Management’s Discussion and Analysis of Financial Condition and Results of
Operations
Results of Operations
For the Three Months Ended March 31, 2014 and 2013
(Amounts in Billion Pesos)
Three Months Ended
03/ 31 / 2014
03 / 31 / 2013
Revenues
Cost and Expenses
Income from Operations
Other Income (Charges)
Provision for Income Tax
Non-controlling Interests
Net Income Attributable to
Owners of the Parent
P
P
P
60.4
48.3
12.1
(1.6)
1.8
2.5
P
6.2
P
P
% Change
56.8
42.2
14.6
(2.9)
1.6
2.7
6.3%
14.6%
-17.6%
-45.6%
10.2%
-8.9%
7.4
-15.9%
For the three months ended March 31, 2014, SM Investments Corporation (SMIC) posted a net
income of P6.2 billion from P7.4 billion in the same period in 2013. Revenues grew by 6.3% to
P60.4 billion, as against last year’s P56.8 billion.
Income from operations decreased by 17.6% to P12.1 billion compared to P14.6 billion in the
same period last year. Operating income margin and Net profit margin is at 20.0% and 10.3%,
respectively.
The decline in profitability is attributable to exceptional trading gains recorded by SMIC’s
associate banks. On an underlying basis, Revenues grew by P6.7 billion or 12.4%, Income from
operations grew by P0.5 billion or 4.6% and Net income grew by P0.6 billion or 11.0%.
Merchandise sales grew by 16.5% in 2014 mainly due to the opening of the following new stores
from April 01, 2013 to March 31, 2014:
SM Department
Stores
1
SM Aura
2
3
SM BF Parañaque
-
4
5
-
6
7
-
8
-
-
SM Supermarket
SaveMore Stores
SM Hypermarkets
Aura
SaveMore TM
Centerpoint
SaveMore Acacia
SaveMore Project 8
SaveMore Sta. Maria
Ilocos
SaveMore ARCC
Bacoor
SaveMore Pili
SaveMore San
Ildefonso
SaveMore Marulas
Jazz
BF Parañaque
-
FTI
Daet
-
-
- 78 -
9
10
11
12
13
14
15
SM Department
Stores
-
SM Supermarket
SaveMore Stores
SM Hypermarkets
-
SaveMore Free Choice
SaveMore Star J
SaveMore Lumina
SaveMore Meridien
Savenore Nunez
Savemore San Pedro
Savemore Sta. Cruz
-
Of the P42.2 billion merchandise sales in 2014, the non-food group and food group contributed
37.8% and 62.2%, respectively. Of the P36.2 billion merchandise sales in 2013, the non-food
group and food group contributed 41.2% and 58.8%, respectively.
As of March 31, 2014, SMIC’s retail subsidiaries operate 245 stores nationwide. These consist of
48 SM stores, 39 SM Supermarkets, 96 SaveMore stores, 40 SM Hypermarkets and 22 WalterMart
stores.
Real estate sales recorded a 14.7% decrease to P5.1 billion in 2014 from P6.0 billion in 2013. The
decrease is primarily due to sales take-up attributable to only two project launches in 2012 of
about 4,600 units from Breeze and Grace Residences compared to the nine project launches in
2010 and 2011 of about 26,700 units mainly from Jazz, Light, Wind, Shell and Green Residences.
On the average, it takes about two years before revenues are recognized due to the percentage of
completion accounting.
Rent revenues, derived mainly from the mall operations of SM Prime Holdings, Inc. (SM Prime),
increased by 15.8% to P7.7 billion in 2014 from P6.6 billion in 2013. SM Prime is the country’s
leading shopping mall developer and operator which owns 48 malls in the Philippines and five
malls in China. The increase in Rent revenues is primarily due to the new malls which opened in
2012 and 2013, namely, SM City Olongapo, SM City Consolacion, SM City San Fernando, SM
City General Santos and SM Lanang Premier, SM Aura Premier and SM City BF Parañaque, with
a total gross floor area of 818,000 square meters. Excluding the new malls and expansions, samestore rental growth is at 7%. Rental from commercial operations also increased, primarily due to
the increase in occupancy rates and rental escalations based on lease agreements.
Cinema ticket sales and amusement revenues increased by P0.3 billion or 31.3% to P1.4 billion
due to the opening of digital cinemas at the new malls and the showing of local blockbuster
movies with 100% sales growth year-on-year. The opening of Sky Ranch in Tagaytay last March
2013 and the reopening of the ice skating rink in SM Megamall last January 2014 also contributed
to the increase. Amusement revenue is mainly composed of income from rides, bowling and ice
skating operations including the SM Science Discovery Center and the SM Storyland,
merchandise sales from snack bars and food and beverages from hotels and convention centers.
Equity in net earnings of associates and joint ventures decreased by 44.8% to P3.1 billion in 2014
from P5.6 billion in 2013, primarily due to the 46% drop in net income of BDO which is attributed
to the bank’s exceptional trading gains in 2013. However, it is noteworthy that BDO’s core
businesses remained in high gear with further gains in loans and low cost deposits. BDO will
continue to focus on its core lending and deposit-taking operations as well as its service businesses
to drive earnings in 2014.
- 79 -
Dividend, management fees and other revenues decreased by 31.9% or P0.4 billion to P0.8 billion
from P1.2 billion in 2013 due mainly to gain on sale of certain AFS investment in 2013 and none
in 2014.
Cost and expenses increased by 14.6% to P48.3 from P42.2 billion in 2013. Selling, general and
administrative expenses increased by 13.2% to P13.4 billion due mainly to additional operating
expenses associated with mall expansions and new malls, retail stores, store renovations and
current real estate projects.
Net other charges decreased by 45.6% to P1.6 billion. Interest expense decreased by 10.7% to
P2.5 billion from P2.8 billion in 2013 due mainly to loan terminations in 2014 and the last three
quarters of 2013. Interest income decreased by 21.3% to P0.8 billion from P1.0 billion in 2013
due to lower average of temporary investments. The P1.4 billion or -104.1% change in the loss on
fair value changes on derivatives pertain mainly to the P1.3 billion fair value loss on the US$250.0
million convertible bonds of SMIC incurred in 2013 (refer to Note 16 of the consolidated financial
statements). Foreign exchange gains and others decreased by 54.2% to P107.7 million from
P235.3 million in 2013 due mainly to decrease in foreign exchange rate from P40.80:US$1.00 in
2013 to P44.815:US$1.00 in 2014.
Provision for income tax increased by 10.2% to P1.8 billion from P1.6 billion in 2013 due mainly
to higher taxable income. The effective income tax rate is 17% in 2014 and at 14% in 2013.
Non-controlling interests decreased by 8.9% to P2.5 billion from P2.7 billion in 2013 due to
reduced net income of certain subsidiaries that are not wholly owned.
Financial Position
As of March 31, 2014 and December 31, 2013
(Amounts in Billion Pesos)
03 / 31 / 2014
(Unaudited)
12 / 31 / 2013
(Audited)
%
Change
Current assets
Noncurrent assets
Total assets
P 151.6
477.5
P 629.1
P 162.9
470.1
P 633.0
-7.0%
1.6%
-0.6%
Current liabilities
Noncurrent Liabilities
Total Liabilities
Equity
Total Liabilities and
Equity
P 112.5
204.4
316.9
312.2
P 132.1
200.7
332.8
300.2
-14.8%
1.8%
-4.8%
4.0%
P 629.1
P 633.0
-0.6%
Total assets decreased by 0.6% to P629.0 billion from P633.0 billion in 2013. On the other hand,
total liabilities decreased by 4.8% to P316.9 billion from P332.8 billion in 2013.
Current assets decreased by 7.0% to P151.6 billion from P162.9 billion in 2013. Cash and cash
equivalents decreased by 25.9% to P37.2 billion from P50.2 billion in 2013 due mainly to
payments of loans and capital expenditures. Time deposits and short term investments decreased
by 2.2% to P28.3 billion from P28.9 billion in 2013. Investments held for trading and sale
- 80 -
increased by 91.2% to P2.1 billion from P1.1 billion in 2013 due to reclassification from noncurrent to current of maturing Available-for-sale investments. Other current assets decreased by
6.5% to P40.1 billion from P42.8 billion in 2013 due to collection of advances, non-trade
receivables and receivable from banks. These were partially offset by the increase in Receivables
of 13.9% to P30.3 billion from P26.6 billion in 2013 due mainly to the increase in receivable from
real estate buyers resulting from higher sales volume and construction accomplishments.
Noncurrent assets increased by 1.6% to P477.5 billion from P470.1 billion in 2013. Investments
in shares of stock of associates and joint ventures increased by 1.1% to P140.5 billion from P139.0
billion in 2013 while Available-for-sale investments increased by 2.1% to P16.8 billion from
P16.5 billion in 2013. Time deposits increased by 0.9% to P27.4 billion from P27.1 billion in
2013. Investment properties increased by 2.1% to P196.7 billion from P192.6 billion in 2013
while Other non-current assets increased by 4.6% to P29.8 billion from P28.4 billion in 2013.
Deferred tax assets increased by 12.9% to P2.4 billion from P2.2 billion in 2013 due mainly to
NOLCO and difference between the financial and taxable gross profit on sale of real estate
properties. These are partially offset by the decrease in Land and development by 4.1% to P24.6
billion from P25.7 billion in 2013.
Current liabilities decreased by 14.8% to P112.5 billion from P132.1 billion in 2013 due mainly to
loan payments in 2014 which decreased Bank loans by 25.8% to P20.5 billion from P27.6 billion
in 2013 and Accounts payable and other current liabilities by 23.6% to P52.0 billion from P68.1
billion in 2013 resulting from settlement of payables. These were partially offset by the increase
in Current portion of long term debt by 8.6% to P37.5 billion from P34.6 billion in 2013 due to
reclassification of maturing loans from non-current to current portion and increase in Income tax
payable by 38.6% to P2.2 billion from P1.6 billion in 2013 which was subsequently paid in April
2014.
Noncurrent liabilities increased by 1.8% to P204.4 billion from P200.7 billion in 2013 due mainly
to the 1.0% increase in Long-term debt - net of current portion from P175.6 billion to P177.3
billion in 2014 (See Note 16 to the consolidated financial statements) and 6.1% increase in
Tenants’ deposits and others to P19.1 billion from P18.0 billion in 2013 due mainly to new malls
and expansions and new condominium projects of the Real Estate group. The P0.8 billion or
12.1% increase in Deferred tax liabilities arose mainly from fair value gain on investment
properties.
Equity amounted to P312.2 billion as of March 31, 2014, while Equity attributable to owners of
the parent amounted to P227.5 billion. The 4.6% or P0.1 billion decrease in Cumulative
translation adjustment resulted mainly from the translation of the financial accounts of SM China
malls from China Yuan Renminbi to Philippine Peso. Net unrealized mark-to-market gain on AFS
investments increased by 14.3% to P8.4 billion from P7.3 billion in 2013 mainly due to the
increase in the market value of AFS investments of subsidiaries and associates. Non-controlling
interests increased by 4.8% to P84.7 billion from P80.8 billion mainly due to increase in the net
assets of certain subsidiaries that are not wholly owned.
The Company has no known direct or contingent financial obligation that is material to the
Company operations, including any default or acceleration of an obligation. The Company has no
off-balance sheet transactions, arrangements, obligations during the reporting year and as of the
balance sheet date.
There are no known trends, events, material changes, seasonal aspects or uncertainties that are
expected to affect the company’s continuing operations.
- 81 -
Key Financial Ratios
The following are the key financial ratios of SMIC for the three months ended March 31, 2014 and
2013 and for the year ended December 31, 2013:
Current Ratio
Asset to Equity Ratio
Debt-equity Ratios:
On Gross Basis
On Net Basis
Revenue Growth
Net Income to Revenues
Net Income Growth
Return on Equity
EBITDA (In Billions of Pesos)
Interest Coverage Ratio
03 / 31 / 2014
(Three months)
1.35
2.01
12 / 31 / 2013
(One Year)
1.23
2.11
51: 49
38: 62
52 : 48
37 : 63
03 / 31 / 2014
(Three months)
6.3%
10.3%
-15.9%
12.1%
P14.7B
6.69x
03 / 31 / 2013
(Three months)
14.6%
13.1%
22.8%
13.5%
P17.0B
5.58x
Current ratio improved to 1.35 from 1.23 in 2013 due mainly to higher decrease in Current
liabilities of 14.8% as compared to decrease in Current assets of 7.0%. The decrease in Current
assets was partially offset by reclassifications from non-current to current of Receivable from real
estate buyers, Land and development, and Available-for-sale investments.
Asset to equity ratio decreased to 2.01 from 2.11 in 2013 due mainly to a 0.6% lower asset base,
mainly cash and cash equivalents, and 4.0% higher equity base, mainly comprised of P8.7 billion
net income earned in Q1 2014, P1.0 billion increase in market value of AFS investments, and, the
P0.7 billion adjustment in Equity adjustments from common control transactions resulting from
the finalization of values relative to the acquisition of a subsidiary.
Gross debt-equity ratio decreased to 51:49 from 52:48 in 2013 due to a higher increase in equity
base of 3.7% compared to a 1.0% decrease in gross debts.
Net debt-equity ratio increased to 38:62 from 37:63 in 2013 due to a P12.6 billion or 25.7% lower
cash and cash equivalents which was used to pay off trade payables and capital expenditures.
Revenue growth decreased to 6.3% in 2014 due mainly to the 2013 extra-ordinary trading gains of
SMIC’s bank associates. On an underlying basis, revenue growth is 12.4% mainly coming from
merchandise sales, rent, and, equity in earnings of SMIC’s bank associates.
Net income declined by 15.9% from a growth of 22.8% in 2013 due mainly to the 2013
exceptional trading gains of SMIC’s bank associates. On an underlying basis, net income growth
is at 11.0%.
Return on equity decreased slightly to 12.1% from 13.5%.
EBITDA decreased to P14.7 billion from P17.0 billion in 2013. On an underlying basis, EBITDA
increased by P13.8 billion or 6.3%.
- 82 -
The manner by which the Company calculates the foregoing indicators is as follows:
1. Current Ratio
Current Assets
Current Liabilities
2. Asset to Equity Ratio
Assets
Equity
3. Debt-Equity Ratio
a. Gross Basis
b. Net Basis
Interest Bearing Debt
Equity Attributable to Owners of the Parent + Interest Bearing
Debt
Interest Bearing Debt less cash and cash equivalents (excluding
cash on hand), time deposits, investment in bonds held for
trading and available- for- sale
Equity Attributable to Owners of the Parent + Interest Bearing
Debt less cash and cash equivalents (excluding cash on hand),
time deposits and investments in bonds held for trading and
available-for-sale
4. Return on Equity
Net Income Attributable to Owners of the Parent
Average Equity Attributable to Owners of the Parent
5. Net Income to
Revenues
Net Income Attributable to Owners of the Parent
Revenues
6. Revenue Growth
Revenues (Current Period) - 1
Revenues (Prior Period)
7. Net Income Growth
Net Income Attributable to Owners of Parent (Current Period) - 1
Net Income Attributable to Owners of Parent (Prior Period)
8. EBITDA
Income from Operations + Depreciation & Amortization
9. Interest Coverage
Ratio
EBITDA
Interest Paid
- 83 -
Expansion Plans / Prospects for the Future
For the rest of 2014, SM Prime will open three new malls, located in Cauayan and Angono in the
Philippines and Zibo in China, as well as expansion of four existing malls. By year end, SM
Prime will have an estimated 7.5 million square meters of gross floor area.
SM Prime currently has twenty-one residential projects in the market, twenty of which are in
Metro Manila and one in Tagaytay. For the rest of 2014, SM Prime will launch four new projects
and four expansions of existing towers all in Metro Manila, except Wind in Tagaytay, equivalent
to about 15,000 additional units. For its commercial operations, SM Prime has topped off the
third E-com building. It will also break ground on another E-com building in the third quarter.
For hotels and convention centers, SM Prime is slated to open SMX Convention Center in
Bacolod in the second half of the year. Park Inn by Radisson in Pampanga and Conrad Hotel
Manila in the Mall of Asia Complex are expected to be opened in the last quarter of 2015.
The Property Group’s land banking initiatives will continue in 2014.
For the rest of the year, the Retail Group will be opening two SM Stores, one SM Supermarket,
twelve SaveMore stores and two SM Hypermarkets.
The above expenditures will be funded through internally generated sources and other capital
raising initiatives such as bond issuances and loan availments.
- 84 -
PART I
FINANCIAL INFORMATION
Item 3. Aging of Accounts Receivable – Trade
SM Investments Corporation and Subsidiaries
Aging of Accounts Receivable - Trade
As of March 31, 2014
(Amounts in Thousands)
Receivable from Tenants
Third-party tenants
Related-party tenants
Receivables from Real Estate Buyers & others
- net of non-current portion
Total
P
P
3,073,015
2,166,316
22,018,888
27,258,219
Aging:
Neither past due nor impaired
31-90 days
91-120 days
Over 120 days
Impaired
P
19,572,302
2,068,811
767,940
4,136,273
712,893
Total
P
27,258,219


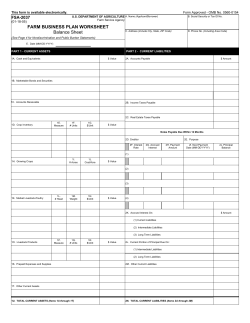

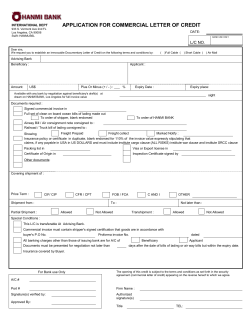

© Copyright 2026