
COVER SHEET 1 P
COVER SHEET
P
W
9
4
S.E.C. Registration Number
P
A
L
H
O
L
D
I
N
G
S
,
I
N
C
.
(Company’s Full Name)
7
T
H
6
7
5
F
L
O
O
R
A
L
L
I
E
D
B
A
N
K
A
Y
A L A
A V E
.
M A
(Business Address: No. Street City / Town / Province)
K
A
C
E
N
T
E
R
C
I
T
Y
.
4
SUSAN LEE
Contact Persons
0
3
3
T
I
7368466
Company Telephone Number
1
1
7
-
Q
Month
Day
Fiscal Year
Month
Day
Annual Meeting
Secondary License Type, If Applicable
Dept. Requiring this Doc.
Amended Articles Number/Section
Total Amount of Borrowings
Total No. of Stockholders
Domestic
------------------------------------------------------------------------------------------------------------------------------
Foreign
To be accomplished by SEC Personnel concerned
File Number
Document I.D.
LCU
Cashier
STAMPS
Remarks = pls. use black ink for scanning purposes
1
SECURITIES AND EXCHANGE COMMISSION
SEC FORM 17-Q
QUARTERLY REPORT PURSUANT TO
SECTION 17 OF THE SECURITIES REGULATION CODE
1.
For the quarter period ended
2.
SEC Identification Number PW- 94
4.
its
Exact name of registration as specified in
charter
5.
September 30, 2008
3. BIR Tax Identification No. 430-000-707-922
Metro Manila, Philippines
(Province, country or other jurisdiction of
incorporation or organization)
PAL HOLDINGS, INC.
6.
( SEC Use Only)
Industry Classification Code:
7.
7/F Allied Bank Center, 6754 Ayala Avenue, Makati City
Address of principal office including postal code
8.
(632) 816-33-11 loc. 3785; 736-8466
Registrant’s telephone number, including area code
9.
10.
1200
Postal Code
Not Applicable
Former name, former address, former fiscal year, if changed since last report
Securities registered pursuant to Section 8 and 12 of the SRC
Title of Each Class
Number of Shares of Common Stock
Outstanding and Amount of Debt Outstanding
Common Stock
5,421,512,096
11. Are any or all of these securities listed on the Philippine Stock Exchange?
Yes [ X ]
12.
No [
]
Check whether the registrant:
(a) has filed all reports required to be filed by Section 17 of the SRC and SRC Rule 17
thereunder or Sections 11 of the RSA and RSA Rule 11(a)-1 thereunder, and Sections 26
and 141 of the Corporation Code of the Philippines, during the preceding twelve (12)
months (or for such shorter period the registrant was required to file such reports)
Yes [ X ]
(b)
No [
]
has been subject to such filing requirements for the past 90 days.
Yes [ X ]
No [ ]
2
3
Annex “A”
PAL HOLDINGS, INC.
AND SUBSIDIARIES
Quarterly Consolidated Financial Statements
For the Six Months Ended September 30, 2008
4
PAL HOLDINGS, INC.
AND SUBSIDIARIES
CONSOLIDATED STATEMENTS OF FINANCIAL POSITION
(Amounts in Thousands)
September 30,
2008
( Unaudited)
March 31,
2008
( Audited)
ASSETS
Current Assets
Cash and cash equivalents
Available-for-sale-investments
Receivables - net
Expendable parts, fuel, materials and supplies
Other current assets
Total Current Assets
Noncurrent Assets
Property, plant and equipment -net
Deposits on aircraft leases
Deferred tax assets
Available-for-sale-investments
Investment properties
Other noncurrent assets
Total Noncurrent Assets
TOTAL ASSETS
P
P
13,493,721
104,548
5,054,412
2,549,373
6,363,068
27,565,122
63,469,502
2,984,674
362,609
957,137
1,733,266
6,039,016
75,546,204
103,111,326
P
P
14,783,695
92,364
5,756,942
1,486,013
5,397,117
27,516,131
48,522,977
2,534,673
320,352
916,797
1,533,364
3,840,967
57,669,130
85,185,261
LIABILITIES AND EQUITY
Current Liabilities
Notes payable
Current portion of long-term liabilities
Accounts payable
Accrued liabilities
Due to related parties
Income tax payable
Unearned transportatin revenue
Total Current Liabilities
Noncurrent Liabilities
Long-term liabilities - net of current portion
Accrued employee benefits payable
Reserves and other noncurrent liabilities
Total Noncurrent Liabilities
TOTAL LIABILITIES
Equity
Attributable to the equity holders of the parent:
Capital stock
Additional paid-in capital
Other components of equity
Treasury Stock
P
Minority interest
Total Equity
TOTAL LIABILITIES AND EQUITY
P
8,222,518
9,499,355
7,685,416
16,049,531
481,090
5,347,260
47,285,170
P
-
3,440,235
5,368,235
5,583,487
11,136,180
481,090
187,109
6,127,234
32,323,570
34,433,809
3,646,181
6,579,763
44,659,753
91,944,923
30,511,652
3,237,802
4,504,136
38,253,590
70,577,160
5,421,568
17,517,283
(13,529,647)
(56)
9,409,148
1,757,255
11,166,403
5,421,568
17,517,283
(10,614,212)
(56)
12,324,583
2,283,518
14,608,101
103,111,326
P
85,185,261
5
Note:
PAL HOLDINGS, INC.
AND SUBSIDIARIES
CONSOLIDATED STATEMENTS OF COMPREHENSIVE INCOME
(Amounts in Thousands)
(Unaudited)
SIX MONTHS ENDING
9/30/2008
9/30/2007
REVENUE
Passenger
Cargo
Interest income
Others
P
EXPENSES
Flying Operations
Maintenance
Aircraft and traffic servicing
Financing charges
Passenger service
Reservation and sales
General and administrative
Others
NET INCOME (LOSS)
OTHER COMPREHENSIVE INCOME
Net changes in fair value of available-for-sale
Investments
Net changes in fair value of derivative assets
Increase in revaluation increment due to appraisal
QUARTER ENDING
9/30/2008
9/30/2007
32,451,993 P
2,666,732
250,969
2,158,810
37,528,504
28,705,703 P
2,537,348
479,368
2,095,437
33,817,856
15,899,428 P
1,379,129
159,737
1,069,265
18,507,559
13,804,832
1,322,173
267,517
867,264
16,261,786
22,141,390
4,769,488
4,211,666
1,692,726
2,507,377
2,420,009
1,930,432
3,393,133
43,066,221
14,755,929
4,484,240
4,011,906
2,210,903
2,444,599
1,948,519
1,690,419
1,292,560
32,839,075
11,996,454
2,281,443
2,179,347
761,808
1,250,517
1,192,006
1,093,335
1,128,176
21,883,086
7,455,698
2,472,875
1,993,732
1,124,992
1,183,934
1,049,353
991,141
611,481
16,883,206
(5,537,717)
978,781
(3,375,527)
(621,420)
(33,195)
395,511
34,627
172,482
89,037
-
(32,427)
(3,715,246)
-
43,968
180,312
-
Effect of foreign exchange translation
1,699,075
(1,082,340)
TOTAL OTHER COMPREHENSIVE INCOME
2,096,018
(820,821)
491,108
(338,959)
(3,256,565)
(114,679)
TOTAL COMPREHENSIVE INCOME
P
(3,441,699) P
157,960 P
(6,632,092) P
(736,099)
Net income (loss) attributable to:
Equity Holders of the Parent
Minority interest
P
P
(4,688,763) P
(848,954) P
827,416 P
151,365 P
(2,858,447) P
(517,080) P
(526,620)
(94,800)
Total comprehensive income attributable to:
Equity Holders of the Parent
Minority Interest
P
P
(2,915,437) P
(526,262) P
148,626 P
9,334 P
(5,620,467) P
(1,011,625) P
(627,090)
(109,009)
P
(0.86) P
(0.54)
0.15 P
0.03
(0.53) P
(1.04)
(0.10)
(0.12)
EARNINGS (LOSS) PER SHARE
Computed based on net income (loss)
Computed based on total comprehensive income
Earnings per share is determined by dividing net income/total comprehensive income by the number of shares outstanding
Computed based on net income
9/30/2008 six months = (4,688,763)/5,421,512
9/30/2007 six months = 827,416/5,421,512
9/30/2008 three months= ( 2,858,447)/5,421,512
9/30/2007 three months= ( 526,620)/5,421,512
Computed based on total comprehensive income
9/30/2008 six months = ( 2,915,437)/5,421,512
9/30/2007 six months = 148,626/5,421,512
9/30/2008 three months= ( 5,620,467)/5,421,512
9/30/2007 three months= ( 627,090)/5,421,512
6
PAL HOLDINGS, INC.
AND SUBSIDIARIES
CONSOLIDATED STATEMENTS OF CHANGES IN EQUITY
FOR THE SIX MONTHS ENDED SEPTEMBER 30, 2008 AND 2007
(Amounts in Thousands)
(Unaudited)
Cummulative
Translation
Adjustment
Net Changes
in Fair
Values for
Available-forsale
Invesments
Revaluation
Increment in
Property
Capital Stock
Additional
paid- in capital
BALANCES AT MARCH 31, 2007
P
Total comprehensive income for the year
Adjustment resulting from change in equity structure
Conversion of advances from parent company to equity
Transfer of portion of revaluation increment in
property realized through depreciation - net of
related deferred tax and foreign exchange adjustment
Total income and expense for the year
BALANCES AT SEPTEMBER 30, 2007
P
5,421,568
-
4,029,287
3,079,568
(3,331,586)
(841,018)
-
197,687
162,228
-
1,270,393
3,079,568
7,108,855 P
(841,018)
(4,172,604) P
162,228
359,915 P
BALANCES AT MARCH 31, 2008
Total comprehensive income for the year
Transfer of portion of revaluation increment in
property realized through depreciation - net of
related deferred tax and foreign exchange adjustment
Total income and expense for the year
BALANCES AT SEPTEMBER 30, 2008
P
5,421,568
-
(4,066,367)
1,773,462
1,773,462
(2,292,905) P
5,421,568
5,421,568
P
17,517,283
-
P
17,517,283
P
Deficit
Treasury
Stock
Total
Minority
Interest
(8,559,400)
827,416
10,662,157
-
(56)
-
(972,107)
148,626
10,662,157
3,079,568
(60,112)
(60,112)
1,210,281 P
60,112
11,549,685
2,990,285 P
(56) P
13,890,351
12,918,244 P
9,334
2,376,359 P
1,394,918
157,960
10,662,157
3,079,568
13,899,685
15,294,603
270,239
(29,455)
1,424,267
29,319
(8,242,351)
(4,688,763)
(56)
12,324,583
(2,915,437)
2,283,518
(526,262)
14,608,101
(3,441,698)
(29,455)
240,784 P
(61,783)
(32,464)
1,391,803 P
(2,915,437)
9,409,148 P
(526,262)
1,757,255 P
(3,441,698)
11,166,403
-
61,783
(4,626,980)
(12,869,331) P
(56) P
2,367,025
9,334
Total
7
PAL HOLDINGS, INC.
AND SUBSIDIARIES
CONSOLIDATED STATEMENTS OF CASH FLOWS
(Amounts in Thousands)
(Unaudited)
FOR THE SIX MONTHS ENDED SEPTEMBER 30,
2008
2007
CASH FLOWS FROM OPERATING ACTIVITIES
Net Income (Loss)
P
(5,537,717) P
978,781
Adjustments for:
Depreciation
2,821,448
2,947,653
569,331
297,344
3,710,791
371,845
Provision for doubtful accounts,retirement benefits,
contingencies and others-net
Effect of remeasurement of derivative financial instruments
Interest income
Dividend income
Loss (gain) on disposal of property and equipment and others
Operating income (loss) before working capital changes
(59)
(110)
(152,528)
(206,076)
869,392
851,461
2,280,658
5,240,898
Decrease (increase) in:
595,432
Receivables
(283,156)
(867,342)
Expendable parts, fuel, materials and supplies
Other current assets
59,006
40,691
(1,179,502)
184,981
(751,175)
Increase (decrease) in:
Accounts payable
(1,588,212)
Unearned transportation revenue
Net increase (decrease)of accrued employee benefits payable
Net cash generated from operations
Interest received
Dividend received
Net cash provided by operating activities
(58,850)
66,311
451,404
712,519
3,478,625
59
110
152,528
865,106
206,076
3,684,811
CASH FLOWS FROM INVESTING ACTIVITIES
(6,873,887)
Additions to property and equipment
(1,474,653)
-
Proceeds from disposal of available-for-sale investments
Net changes in other noncurrent assets
Net cash used in investing activities
535,955
(1,461,970)
(8,335,857)
372,295
(566,403)
(236,745)
(5,740,391)
CASH FLOWS FROM FINANCING ACTIVITIES
Payment of long term obligations
Availments of notes payable
4,846,734
Net cash provided by (used in) financing activities
4,609,989
(5,190,404)
549,987
1,570,788
(1,242,199)
NET DECREASE IN CASH AND CASH EQUIVALENTS
(1,289,974)
(3,314,195)
CASH AND CASH EQUIVALENTS AT BEGINNING OF PERIOD
14,783,695
20,563,883
EFFECT OF EXCHANGE RATE CHANGES
ON CASH AND CASH EQUIVALENTS
CASH AND CASH EQUIVALENTS AT END OF THE PERIOD
P
13,493,721
P
17,249,688
8
PAL HOLDINGS, INC. AND SUBSIDIARIES
SELECTED EXPLANATORY NOTES
AS OF SEPTEMBER 30, 2008 AND 2007
Par. 7 (d) Selected Explanatory Notes Required Under SRC Rule 68.1
i)
The Company’s consolidated interim financial reports are in compliance with
generally accepted accounting principles (GAAP) in the Philippines as set forth in
the Philippine Financial Reporting Standards (PFRS). The financial statements
of Philippine Airlines, Inc were originally presented in United States dollars, which
is their functional currency were restated to Philippine peso for purposes of
business combination in accordance with PAS 27.
ii)
Explanatory comments on the seasonality or cyclicality of interim operations.
PAL experiences a peak in holiday travel during the months of January, April,
May, June and December.
iii)
The nature and amount of items affecting assets, liabilities, equity, net income, or
cash flows which are unusual because of their nature, size, or incidence.
Not applicable. There were no items affecting assets, liabilities, equity, net
income, or cash flows that are unusual because of their nature, size, or
incidence.
iv)
The nature and amount of changes in estimates of amounts reported in prior
interim periods of the current financial year or changes in estimates of amounts
reported in prior financial years, if those changes have a material effect in the
current interim period.
Not Applicable. There were no changes in estimates of amounts reported in
prior interim periods of the current financial year or changes in estimates of
amounts reported in prior financial years.
v)
Issuances, repurchases, and repayments of debt and equity securities.
Not Applicable. There were no issuances, repurchases, and repayments of
debt and equity securities.
vi)
Dividends paid (aggregate or per share) separately for ordinary shares and other shares.
Not applicable. There were no dividends paid during the period.
9
vii)
Segment revenue and segment result for business segments or geographical
segments, whichever is the issuer’s primary basis of segment reporting.
Segment Information of Philippine Airlines, Inc. :
PAL’s domestic and international destinations constitute its reportable geographical
segments, which is consistent with how PAL’s management internally disaggregates
financial information for the purpose of evaluating performance and making operating
decisions. Segment information for each reportable geographical segment is shown in the
following table:
International
Revenue
Income (Loss)
Domestic
Revenue
Income (Loss)
System
Revenue
Income (Loss)
Quarter Ended
September 2008
Quarter Ended
September 2007
14,817,269
(217,562)
13,292,240
766,774
3,438,659
(1,058,879)
18,255,928
(1,276,441)
2,807,201
(419,221)
16,099,441
347,553
The reconciliation of the total net income reported by reportable segments to the net income
in the Statements of Income from July to September 2008 are as follows:
Income (Loss)
Add(Deduct) Unallocated Items:
Non-transport revenues and other
income
Non-transport expenses & other
charges
Net Loss
viii)
Quarter Ended
September 2008
(1,276,441)
Quarter Ended
September 2007
347,553
251,601
162,298
(2,347,912)
(3,372,752)
(1,128,203)
( 618,652)
Material events subsequent to the end of the interim period that have not been
reflected in the financial statements for the interim period.
Not applicable. The Company has no material event subsequent to the end
of the interim period that have not been reflected in the financial statements for
the interim period.
ix)
The effect of changes in the composition of the issuer during the interim period,
including business combinations, acquisition or disposal of subsidiaries and longterm investments, restructurings, and discontinuing operations.
Not applicable. There were no changes in the composition of the Company
during the interim period.
10
x)
Changes in contingent liabilities or contingent assets since the last annual
balance sheet date.
Not applicable. The Company has no contingent liabilities or assets.
xi)
Existence of material contingencies and any other events or transactions that are material
to an understanding of the current interim period.
Not applicable. There were no contingencies and any other events or transactions
that are material to an understanding of the current interim period.
11
Annex “B”
PAL HOLDINGS, INC.
AND SUBSIDIARIES
Management Discussion and Analysis of
Financial Condition and Results of Operations
12
PART I – FINANCIAL INFORMATION
ITEM 1. Financial Statements
The financial statements form part of this 17Q.
Summary of Significant Accounting and Financial Reporting Policies
Basis of Preparation
The accompanying consolidated financial statements have been prepared using the historical cost
convention, except for land and buildings and improvements which are carried at revalued
amounts and available-for-sale investments and derivative financial instruments which are carried
at fair value. The consolidated financial statements are presented in Philippine peso the Parent
Company’s functional and presentation currency, and rounded to the nearest thousand, except
when otherwise indicated.
Statement of Compliance
The consolidated financial statements have been prepared in compliance with Philippine
Financial Reporting Standards (PFRS).
Future Changes in Accounting Policies
The following are the new and revised accounting standards and Philippine Interpretations that
will become effective to the Group subsequent to March 31, 2008.
•
Amendments to PAS 23, Borrowing Costs (Revised) (effective for annual periods beginning
on or after January 1, 2009). PAS 23 has been revised to require capitalization of borrowing
costs related to a qualifying asset.
•
PFRS 3R, Business Combinations, and PAS 27R, Consolidated and Separate
Financial Statements (effective for financial years beginning on or after July 1, 2009). PFRS
3R introduces a number of changes in the accounting for business combinations that will
impact the amount of goodwill recognized, the reported results in the period that an
acquisition occurs, and future reported results. PAS 27R requires that a change in the
ownership interest of a subsidiary is accounted for as an equity transaction. Therefore, such a
change will have no impact on goodwill, nor will it give rise to a gain or loss. Furthermore,
the amended standard changes the accounting for losses incurred by the subsidiary as well as
the loss of control of a subsidiary.
•
PFRS 8, Operating Segments (effective for annual periods beginning on or after
January 1, 2009), requires a management approach to reporting segment information. PFRS
8 will replace PAS 14, Segment Reporting, and is required to be adopted only by entities
whose debt or equity instruments are publicly traded, or are in the process of filing with the
Philippine SEC for purposes of issuing any class of instruments in a public market.
•
Philippine Interpretation IFRIC 12, Service Concession Arrangements (effective for annual
periods beginning on or after January 1, 2008), covers contractual arrangements arising from
private entities providing public services.
•
Philippine Interpretation IFRIC 13, Customer Loyalty Programmes (effective for annual
periods beginning on or after July 1, 2008), requires disclosure of customer loyalty award
credits to be accounted for as a separate component of the sales transaction in which they are
13
granted and therefore part of the fair value of the consideration received is allocated to award
credits and deferred over the period that the award credits are fulfilled.
•
Philippine Interpretation IFRIC 14, IAS 19: The Limit on a Defined Benefit Asset, Minimum
Funding Requirement and their Interaction (effective for annual periods beginning on or
after January 1, 2008), provides guidance on how to assess the limit on the amount of surplus
in a defined benefit scheme that can be recognized as an asset under PAS 19, Employee
Benefits.
The Group is currently assessing the impact of these standards, amendments and interpretations.
The effects and required disclosures of the adoption of the relevant standards, amendments and
interpretations, if any, will be included in the consolidated financial statements when these are
adopted.
Consolidation
The consolidated financial statements consist of the financial statements of the Parent Company
and its subsidiaries. The financial statements of the subsidiaries are prepared using consistent
accounting policies as those of the Parent Company. The following are subsidiaries of the Parent
Company as of September 30, 2008.
Nature of Operations
Percentage of Ownership
Through direct holdings:
PAL
PR
Air transport
Holding company
81.57%
82.33%*
Through indirect holdings:
Abacus Distribution Systems
Philippines, Inc.
Pacific Aircraft Ltd.
Pearl Aircraft Ltd.
Peerless Aircraft Ltd.
Synergy Services Corp.
Lessor of computerized
reservations systems
Aircraft financingrelated company
Aircraft financiangrelated company
70.23%
84.67%
84.67%
Aircraft financingrelated company
84.67%
Manpower supply
54.19%
* Indirect holdings in PAL is 3.8%
Subsidiaries are consolidated from the date on which control is transferred to the Group and
cease to be consolidated from the date on which control is transferred out of the Group. All
intercompany accounts and transactions with subsidiaries are eliminated in full.
The equity and net income attributable to minority interests of the consolidated subsidiaries are
recognized and, where material, are shown separately in the consolidated statement of financial
position and consolidated statement of comprehensive income, respectively.
14
Minority interest represents the interest in a subsidiary, which is not owned, directly or indirectly
through subsidiaries, by the Parent Company. If losses applicable to the minority interest in a
subsidiary exceed the minority interest’s equity in the subsidiary, the excess, and any further
losses applicable to the minority interest, are charged against the majority interest except to the
extent that the minority has a binding obligation to, and is able to, make good the losses. If the
subsidiary subsequently reports profits, the majority interest is allocated all such profits until the
minority interest’s share of losses previously absorbed by the majority interest has been
recovered.
Cash and Cash Equivalents
Cash includes cash on hand and in banks. Cash equivalents are short-term, highly liquid
investments that are readily convertible to known amounts of cash with original maturities of
three months or less from dates of acquisition and that are subject to an insignificant risk of
change in value.
Financial and Derivative Instruments
Financial assets and financial liabilities carried in the Group’s consolidated statement of financial
position include cash and cash equivalents, receivables, available-for-sale investments, deposits
on aircraft leases, short-term and long-term loans, and derivative instruments such as fuel,
interest rate and currency derivative instruments.
The Group recognizes a financial asset or a financial liability in the consolidated statement of
financial position when it becomes a party to the contractual provisions of the instrument. All
regular way purchases and sales of financial assets are recognized on the trade date, i.e., the date
the Group commits to purchase the assets. Regular way purchases or sales are purchases or sales
of financial assets that require the delivery of assets within the period generally established by
regulation or convention in the market place.
The fair value for financial instruments including derivatives traded in active markets at the
statement of financial position date is based on their quoted market prices or dealer price
quotations (bid price for long positions and ask price for short positions), without any deduction
for transaction costs. When current bid and asking prices are not available, the price of the most
recent transaction is used since it provides evidence of the current fair value as long as there has
not been a significant change in economic circumstances since the time of the transaction.
For all other financial instruments not listed in an active market, the fair value is determined by
using appropriate valuation techniques. Valuation techniques include discounted cash flow
methodologies, comparison to similar instruments for which market observable prices exist,
option pricing models, and other relevant valuation models. In the absence of a reliable basis of
determining fair value, investments in unquoted equity securities are carried at cost, net of
impairment.
The Group considers the market for a financial instrument as active when transactions regularly
take place on an arm’s length basis. On the other hand, market for a financial instrument is
considered as inactive when market price is not current or when there is a significant decline in
the volume and level of trading activity and the available prices vary.
Financial instruments are classified as debt or equity in accordance with the substance of the
contractual arrangement. Interest, dividends, gains, and losses relating to a financial instrument
15
classified as a debt, are reported as expense or income. Distributions to holders of financial
instruments classified as equity are charged directly to equity.
Financial assets are classified as either financial assets at fair value through profit or loss, loans
and receivables, held-to-maturity investments or available-for-sale investments, as appropriate.
Financial liabilities are classified as either financial liabilities at fair value through profit or loss
or other financial liabilities.
When financial assets and financial liabilities are recognized initially, they are measured at fair
value. In the case of financial assets not classified as at fair value through profit or loss and other
liabilities, fair value at initial recognition includes any directly attributable transaction cost. The
Group determines the classification of its financial instruments upon initial recognition and,
where allowed and appropriate, reevaluates this designation at each financial year-end.
“Day 1” difference
Where the transaction price in a non-active market is different to the fair value from other
observable current market transactions in the same instrument or based on a valuation technique
whose variables include only data from observable market, the Group recognizes the difference
between the transaction price and the fair value (a “Day 1” difference) in the consolidated
statement of comprehensive income. In cases where use is made of data which is not observable,
the difference between the transaction price and model value is only recognized in the
consolidated net income or loss when the inputs become observable or when the instrument is
derecognized. For each transaction, the Group determines the appropriate method of recognizing
the “Day 1” difference amount.
Financial Assets and Financial Liabilities at Fair Value Through Profit or Loss (FVPL)
Financial assets and financial liabilities at fair value through profit or loss include financial
instruments held for trading and financial instruments designated upon initial recognition as at
fair value through profit or loss.
Financial assets are classified as held for trading if they are acquired for the purpose of selling in
the near term. Derivatives, including separated embedded derivatives, are also classified as held
for trading unless they are designated as effective hedging instruments or a financial guarantee
contract. Gains or losses on investments held for trading are recognized in the consolidated
statements of comprehensive income. Interest earned or incurred and dividend income is recorded
when the right of payments has been established.
Where a contract contains one or more embedded derivatives, the hybrid contract may be
designated as financial asset at FVPL, except where the embedded derivative does not
significantly modify the cash flows or it is clear that separation of the embedded derivative is
prohibited.
Financial instruments may be designated as at fair value through profit or loss by management on
initial recognition when the following criteria are met:
•
The designation eliminates or significantly reduces the inconsistent treatment that would
otherwise arise from measuring the assets and liabilities or recognizing gains or losses on
them on a different basis, or
•
The assets or liabilities are part of a group of financial assets or financial liabilities, or both
financial assets and financial liabilities, which are managed and their performance is
evaluated on a fair value basis, in accordance with a documented risk management or
investment strategy, or
16
•
The financial instrument contains an embedded derivative, unless the embedded derivative
does not significantly modify the cash flows or it is clear, with little or no analysis, that it
would not be separately recorded.
Assets and liabilities classified under this category are carried at fair value in the consolidated
statement of financial position, with any gains or losses being recognized in the consolidated net
income or loss.
The Group accounts for its derivative transactions (including embedded derivatives) under this
category with fair value changes being reported directly to profit or loss, except when the
derivative is treated as an effective accounting hedge, in which case the fair value change is
either reported in profit or loss with the corresponding adjustment from the hedged transaction
(fair value hedge) or deferred in equity (cash flow hedge) under “Cumulative Translation
Adjustment” account.
Loans and Receivables
Loans and receivables are nonderivative financial assets with fixed or determinable payments that
are not quoted in an active market. This category includes trade receivables arising from
operations, deposits for aircraft leases and security and refundable deposits. Such assets are
carried at amortized cost using the effective interest rate method. Gains and losses are
recognized in income when the loans and receivables are derecognized or impaired, and through
the amortization process. Loans and receivables are included in current assets if maturity is
within 12 months from the statement of financial position date. Otherwise, these are classified as
noncurrent assets.
Held-to-Maturity Investments
Held-to-maturity investments are quoted nonderivative financial assets with fixed or determinable
payments and fixed maturities are classified as held-to-maturity when the Group has the positive
intention and ability to hold them to maturity. Investments intended to be held for an undefined
period are not included in this classification. Where the Group sells other than an insignificant
amount of held-to-maturity investments, the entire category would be tainted and reclassified as
available-for-sale investments. Other long-term investments that are intended to be held-tomaturity, such as bonds, are subsequently measured at amortized cost. This cost is computed as
the amount initially recognized minus principal repayments, plus or minus the cumulative
amortization using the effective interest method of any difference between the initially
recognized amount and the maturity amount. This calculation includes fees paid or received
between parties to the contract that are an integral part of the effective interest rate, issuance
costs and all other premiums and discounts. For investments carried at amortized cost, gains and
losses are recognized in income when the investments are derecognized or impaired, and through
the amortization process. Assets under this category are classified as current assets if maturity is
within 12 months from the statement of financial position date and as noncurrent assets if
maturity date is more than a year from the statement of financial position date.
Available-for-Sale Investments
Available-for-sale investments are nonderivative financial assets that are designated as availablefor-sale or are not classified in any of the three preceding categories. After initial recognition,
available-for-sale investments are measured at fair value with gains or losses being recognized as
part of other comprehensive income until the investment is derecognized or until the investment
is determined to be impaired at which time the cumulative gain or loss previously reported in
equity is included in the consolidated net income or loss in the consolidated statement of
comprehensive income. The effective yield and (where applicable) results of foreign exchange
restatement for available-for-sale investments are reported immediately in the consolidated net
17
income or loss. These financial assets are classified as noncurrent assets unless the intention is to
dispose such assets within 12 months from the statement of financial position date.
Other Financial Liabilities
Other financial liabilities pertain to financial liabilities that are not held for trading nor
designated as at fair value through profit or loss upon the inception of the liability. These include
liabilities arising from operations (e.g., payables and accruals) or borrowings (e.g., Long-term
obligations).
The liabilities are recognized initially at fair value and are subsequently carried at amortized cost,
taking into account the impact of applying the effective interest rate method of amortization (or
accretion) for any related premium, discount and any directly attributable transaction costs.
Derivatives and Hedge Accounting
Freestanding derivatives
For the purpose of hedge accounting, hedges are classified primarily either as: a) a hedge of the
fair value of an asset, liability or a firm commitment (fair value hedge); or b) a hedge of the
exposure to variability in cash flows attributable to an asset or liability or a forecasted transaction
(cash flow hedge); or hedge of a net investment in a foreign operation. The Group did not
designate any of its derivatives as fair value hedges. The Group designated its pay-fixed, receivefloating interest rate swaps and certain fuel derivatives as cash flow hedges.
At the inception of a hedge relationship, the Group formally designates and documents the hedge
relationship to which the Group wishes to apply hedge accounting and the risk management
objective and strategy for undertaking the hedge. The documentation includes identification of
the hedging instrument, the hedged item or transaction, the nature of the risk being hedged and
how the entity will assess the hedging instrument’s effectiveness in offsetting the exposure to
changes in the hedged item’s fair value or cash flows attributable to the hedged risk. Such
hedges are assessed on an ongoing basis to determine that they actually have been highly
effective throughout the financial reporting periods for which they were designated.
In cash flow hedges, changes in the fair value of a hedging instrument that qualifies as a highly
effective cash flow hedge are included in the consolidated statement of changes in equity under
“Cumulative translation adjustment” account, net of related deferred tax. The ineffective portion
is immediately recognized as part of “Other Income or Expense” in the consolidated statement of
comprehensive income. The early adoption of the amendments to PAS 1, Presentation of
Financial Statements, allowed all non owner changes in equity, included under the “Cumulative
translation adjustment” account in the statement of changes in equity, to be recognized as other
comprehensive income in the Group’s consolidated statement of comprehensive income. This
non owner changes in equity represents mainly the net gains arising from fair value changes of
outstanding derivative instruments which qualify for hedge accounting.
For cash flow hedges with critical terms that match those of the hedged items and where there are
no basis risks (such as the pay-fixed, receive-floating interest rate swaps), the Group expects the
hedges to exactly offset changes in expected cash flows relating to the hedged risk (e.g.,
fluctuations in fuel price and benchmark interest rates). This assessment on hedge effectiveness
is performed on a quarterly basis by the Group by comparing the critical terms of the hedges and
the hedged items to ensure that they continue to match and by evaluating the continued ability of
the counterparties to perform their obligations under the derivatives contracts.
For cash flow hedges with basis risks (such as crude oil derivatives entered into as proxy hedges
for forecasted jet fuel purchases), the Group assesses the effectiveness of its hedges (both on a
prospective and retrospective basis) by using a regression model to determine the correlation of
the percentage change in prices of underlying commodities used to hedge jet fuel to the
18
percentage change in prices of jet fuel over a specified period that is consistent with the hedge
time horizon or 30 data points whichever is longer.
If the hedged cash flow results in the recognition of an asset or a liability, gains and losses
initially recognized in equity are transferred from equity to income or loss in the same period or
periods during which the hedged forecasted transaction or recognized asset or liability affect the
consolidated statement of comprehensive income.
When the hedge ceases to be highly effective, hedge accounting is discontinued prospectively. In
this case, the cumulative gain or loss on the hedging instrument that has been reported directly in
equity is retained in equity until the forecasted transaction occurs. When the forecasted
transaction is no longer expected to occur, any net cumulative gain or loss previously reported in
equity is charged against the consolidated statement of comprehensive income.
For derivatives that are not designated as effective accounting hedges, any gains or losses arising
from changes in fair value of derivatives are recognized directly in the consolidated statement of
comprehensive income.
Embedded derivatives
Embedded derivatives are accounted for at fair value through profit or loss when the entire hybrid
contracts (composed of the host contract and the embedded derivative) are not accounted for at
fair value through profit or loss the economic risks of the embedded derivatives are not closely
related to those of their respective host contracts, and a separate instrument with the same terms
as the embedded derivative would meet the definition of a derivative.
Embedded derivatives that are bifurcated from the host contracts are accounted for as financial
assets at FVPL. Changes in fair values are included in the consolidated statement of
comprehensive income. Derivatives are carried as assets when the fair value is positive and as
liabilities when the fair value is negative.
The Group assesses whether an embedded derivative is required to be separated from the host
contract and accounted for as a derivative when the entity first becomes a party to the contract.
Subsequent reassessment is prohibited unless there is a change in the terms of the contract that
significantly modifies the cash flows that otherwise would be required under the contract, in
which case reassessment is required. The Group determines whether a modification to cash flows
is significant by considering the extent to which the expected future cash flows associated with
the embedded derivative, the host contract or both have changed and whether the change is
significant relative to the previously expected cash flows on the contract.
Derecognition of Financial Assets and Financial Liabilities
A financial asset (or, where applicable, a part of a financial asset or part of a group of similar
financial assets) is derecognized when:
•
the rights to receive cash flows from the asset have expired;
•
the Group retains the right to receive cash flows from the asset, but has assumed an
obligation to pay them in full without material delay to a third party under a “pass-through”
arrangement; or
•
the Group has transferred its rights to receive cash flows from the asset and either (a) has
transferred substantially all the risks and rewards of the asset, or (b) has neither transferred
nor retained substantially all the risks and rewards of the asset, but has transferred control of
the asset.
19
When the Group has transferred its rights to receive cash flows from an asset and has neither
transferred nor retained substantially all the risks and rewards of the asset nor transferred control
of the asset, the asset is recognized to the extent of the Group’s continuing involvement in the
asset.
A financial liability is derecognized when the obligation under the liability is discharged,
cancelled or has expired.
When an existing financial liability is replaced by another from the same lender on substantially
different terms, or the terms of an existing liability are substantially modified, such modification
is treated as a derecognition of the carrying value of the original liability and the recognition of a
new liability at fair value, and any resulting difference is recognized in profit or loss.
Impairment of Financial Assets
The Group assesses at each statement of financial position date whether there is objective
evidence that a financial asset may be impaired.
Financial assets carried at amortized cost
For financial assets carried at amortized cost, whenever it is probable that the Group will not
collect all amounts due according to the contractual terms of receivables, an impairment loss has
been incurred. The amount of the loss is measured as the difference between the asset’s carrying
amount and the present value of estimated future cash flows discounted at the financial asset’s
original effective interest rate. The carrying amount of the asset is reduced either directly or
through the use of an allowance account. Any loss determined is recognized in income.
The Group initially assesses whether objective evidence of impairment exists individually for
financial assets that are individually significant, and individually or collectively for financial
assets that are not individually significant. If it is determined that no objective evidence of
impairment exists for an individually assessed financial asset, whether significant or not, the asset
is included in a group of financial assets with similar credit risk characteristics and that group of
financial assets is collectively assessed for impairment. Assets that are individually assessed for
impairment and for which an impairment loss is or continues to be recognized are not included in
a collective assessment of impairment.
If, in a subsequent period, the amount of the impairment loss decreases and the decrease can be
related objectively to an event occurring after the impairment was recognized, the previously
recognized impairment loss is reversed. Any subsequent reversal of an impairment loss is
recognized in the consolidated statement of comprehensive income, to the extent that the carrying
value of the asset does not exceed its amortized cost at the reversal date.
In relation to trade receivables, a provision for impairment is made when there is objective
evidence (such as the probability of insolvency or significant financial difficulties of the debtor)
that the Group will not be able to collect all of the amounts due under the original terms of the
invoice. The carrying amount of the receivable is reduced through the use of an allowance
account. Impaired receivables are derecognized when they are assessed as uncollectible.
Receivables, together with the associated allowance accounts, are written off when there is no
realistic prospect of future recovery and all collateral has been realized. If, in a subsequent
period, the amount of the estimated impairment loss decreases because of an event occurring after
the impairment was recognized, the previously recognized impairment loss is reversed. Any
subsequent reversal of an impairment loss is recognized in profit or loss, to the extent that the
carrying value of the asset does not exceed its amortized cost at the reversal date.
20
Assets carried at cost
If there is objective evidence that an impairment loss on financial assets carried at cost such as an
unquoted equity instrument that is not carried at fair value because its fair value cannot be
reliably measured, or on a derivative asset that is linked to and must be settled by delivery of such
an unquoted equity instrument has been incurred, the amount of the loss is measured as the
difference between the asset’s carrying amount and the present value of estimated future cash
flows discounted at the current market rate of return for a similar financial asset.
Available-for-sale (AFS) investments
In case of equity investments classified as AFS financial assets, impairment would include a
significant or prolonged decline in the fair value of the investments below its cost. Where there
is evidence of impairment loss, the cumulative loss - measured as the difference between the
acquisition cost and the current fair value, less any impairment loss on that financial asset
previously recognized in income - is removed from equity and recognized in income. Impairment
losses on equity investments are not reversed through income. Increases in fair value after
impairment are recognized directly in the consolidated statement of changes in equity.
In the case of debt instruments classified as AFS, impairment is assessed based on the same
criteria as financial assets carried at amortized cost. Interest continues to be accrued at the
original effective interest rate on the reduced carrying amount of the asset and is recorded in
income. If, in subsequent year, the fair value of a debt instrument increased and the increase can
be objectively related to an event occurring after the impairment loss was recognized in income,
the impairment loss is reversed through income.
Offsetting Financial Instruments
Financial assets and financial liabilities are offset and the net amount reported in the consolidated
statement of financial position if, and only if, there is a currently enforceable legal right to offset
the recognized amounts and there is an intention to settle on a net basis, or to realize the asset and
settle the liability simultaneously. This is not generally the case with master netting agreements,
and the related assets and liabilities are presented gross in the consolidated statement of financial
position.
Expendable Parts, Fuel, Materials and Supplies
Expendable parts, fuel, materials and supplies are stated at the lower of cost and net realizable
value. Cost is determined using the weighted average method. Net realizable value represents the
current replacement cost.
Property and Equipment
Property and equipment (except land and buildings and improvements) are stated at cost less
accumulated depreciation and any impairment in value. Land is stated at revalued amount, less
any impairment in value. Buildings and improvements are stated at revalued amounts less
accumulated depreciation and any impairment in value. Revalued amounts were determined
based on valuations undertaken by professionally qualified appraisers. Revaluations are made
with sufficient regularity.
For subsequent revaluations, the accumulated depreciation at the date of the revaluation is
eliminated against the gross carrying amount of the asset and the net amount restated to the
revalued amount of the asset. Effective April 1, 2007, any resulting increase in the asset’s
carrying amount as a result of the revaluation is recognized as other comprehensive income
credited directly to equity as Revaluation increment in property, net of the related deferred tax
liability. Any resulting decrease is directly charged against the related revaluation increment to
the extent that the decrease does not exceed the amount of the revaluation increment in respect of
the same asset.
21
The initial cost of property and equipment comprises its purchase price, any related capitalizable
borrowing costs attributed to progress payments incurred on account of aircraft acquisition and
other significant assets under construction and other directly attributable costs of bringing the
asset to its working condition and location for its intended use. Manufacturers’ credits that
reduce the price of the aircraft, received from aircraft and engine manufacturers are recorded
upon delivery of the related aircraft and engines. Such credits are applied as a reduction from the
cost of the property and equipment (including those under finance lease).
Expenditures incurred after the property and equipment have been put into operation, such as
repairs and maintenance costs, are normally charged to income in the period in which the costs
are incurred. In situations where it can be clearly demonstrated that the expenditures have
resulted in an increase in the future economic benefits expected to be obtained from the use of an
item of property and equipment beyond its originally assessed standard of performance, the
expenditures are capitalized as additional cost of property and equipment.
Depreciation, which commences when the asset is available for use, is computed on a straight-line
basis over the following estimated useful lives of the assets:
Buildings and improvements
Passenger aircraft (owned and under finance lease)
Other aircraft
Spare engines
Rotable and reparable parts
Other ground property and equipment
Number of Years
8 to 40
18 to 20
10
18 to 20
3 to 18
3 to 8
Expenditures for heavy maintenance on passenger aircraft are capitalized at cost and depreciated
over the estimated number of years until the next major overhaul or inspection. Generally, heavy
maintenance visits are required every five to six years for airframe and 10 years for landing gear.
Other maintenance and repair costs are expensed as incurred.
The estimated useful lives, depreciation method and residual values are reviewed periodically to
ensure that the periods and method of depreciation and residual values are consistent with the
expected pattern of economic benefits from items of property and equipment. Any changes in
estimate arising from the review are accounted for prospectively.
When assets are sold or retired, their costs, accumulated depreciation and any impairment in
value and related revaluation increment are eliminated from the accounts. Any gain or loss
resulting from their disposal is recognized as income and included in the consolidated statement
of comprehensive income.
The portion of Revaluation increment in property, net of related deferred tax, realized through
depreciation or upon the disposal or retirement of the property is transferred to retained earnings.
Construction in progress represents the cost of aircraft and engine modifications in progress and
buildings and improvements and other ground property under construction. Construction in
progress is not depreciated until such time when the relevant assets are completed and available
for use.
Asset Retirement Obligation
The Parent Company is required under various aircraft lease agreements to restore the leased
aircraft to their original condition and to bear the cost of dismantling and restoration at the end of
the lease term. The Parent Company provides for these costs over the terms of the leases, based
on aircraft hours flown until the next scheduled checks.
22
Investment Properties
Investment properties include parcels of land and building and building improvements not used in
operations.
Investment properties are measured initially at cost, including any transaction costs. The carrying
amount includes the cost of replacing part of an existing investment property at the time that cost
is incurred if the recognition criteria are met; and excludes the costs of day-to-day servicing of an
investment property.
Investment properties are subsequently measured at cost less accumulated depreciation (except
land) and any impairment in value. Land is subsequently carried at cost less any impairment in
value.
Depreciation and amortization of building and building improvements is calculated on a straightline basis over the estimated useful lives ranging from six to eight years.
Transfers are made to investment properties when, and only when, there is a change in use,
evidenced by cessation of owner-occupation, commencement of an operating lease to another
party or completion of construction or development. Transfers are made from investment
properties when, and only when, there is a change in use, evidenced by commencement of owneroccupation or commencement of development with a view to sale.
When an item of property and equipment previously carried at revalued amount is transferred to
investment properties, the carrying value at the date of reclassification is treated as the deemed
cost of the investment property. The corresponding revaluation increment, net of the related
deferred tax liability, of the asset is retained in equity and released to retained earnings when the
asset is derecognized.
Investment properties are derecognized when they are either disposed of or permanently
withdrawn from use and no future economic benefit is expected from its disposal. Any gains or
losses on the retirement or disposal of an investment property are recognized as income in the
consolidated statement of comprehensive income in the year of retirement or disposal.
Impairment of Property and Equipment and Investment Properties
The carrying values of property and equipment and investment properties are reviewed for
impairment when events or changes in circumstances indicate that the carrying values may not be
recoverable. If any such indication exists and where the carrying values exceed the estimated
recoverable amounts, the assets or cash generating units are written down to their recoverable
amounts. The recoverable amount is the greater of net selling price and value-in-use. In
assessing value-in-use, the estimated future cash flows are discounted to their present value using
a pretax discount rate that reflects current market assessments of the time value of money and the
risks specific to the asset. For an asset that does not generate largely independent cash inflows,
the recoverable amount is determined for the cash generating unit to which the asset belongs.
Impairment losses, if any, are recognized as expense in the consolidated statement of
comprehensive income.
Leases
The determination of whether the arrangement is, or contains a lease is based on the substance of
the arrangement at inception date of whether the fulfillment of the arrangement depends on the
use of a specific asset or assets or the arrangement conveys a right to use the asset. A
reassessment is made after the inception of the lease, if any, of the following applies: (a) there is
a change in contractual terms, other than a renewal or extension of the arrangement; (b) a renewal
option is exercised or extension granted, unless the term of the renewal or extension was initially
23
included in the lease term; (c) there is a change in the determination of whether fulfillment is
dependent on a specified asset; or (d) there is substantial change to the asset.
Where the reassessment is made, lease accounting shall commence or cease from the date when
the change in circumstances gave rise to the reassessment for scenarios (a), (c), or (d) above, and
at the date of renewal or extension period for scenario (b).
Finance leases, which transfer to the Group substantially all the risks and benefits incidental to
ownership of the leased item, are capitalized at the inception of the lease at the fair value of the
leased property or, if lower, at the present value of the minimum lease payments. Obligations
arising from aircraft under finance lease agreements are classified in the consolidated statements
of financial position as part of Long-term obligations.
Lease payments are apportioned between financing charges and reduction of the lease liability so
as to achieve a constant rate of interest on the remaining balance of the liability. Financing
charges are charged directly against income.
Leases where the lessor retains substantially all the risks and benefits of ownership of the asset
are classified as operating leases. Operating lease expense is recognized in the consolidated
statement of comprehensive income on a straight-line basis over the terms of the lease
agreements.
Provisions and Contingencies
Provisions are recognized when (i) the Group has a present obligation (legal or constructive) as a
result of a past event, (ii) it is probable that an outflow of resources embodying economic
benefits will be required to settle the obligation, and (iii) a reliable estimate can be made of the
amount of the obligation. Where the Group expects a provision to be reimbursed, for example
under an insurance contract, the reimbursement is recognized as a separate asset but only when
the reimbursement is virtually certain. If the effect of the time value of money is material,
provisions are determined by discounting the expected future cash flows at a pretax rate that
reflects current market assessments of the time value of money and, where appropriate, the risks
specific to the liability. Where discounting is used, the increase in the provision due to the
passage of time is recognized as interest expense.
Contingent liabilities are not recognized in the consolidated statement of financial position. They
are disclosed unless the possibility of an outflow of resources embodying economic benefits is
remote. A contingent asset is not recognized in the consolidated statement of financial position
but disclosed when an inflow of economic benefits is probable. If it is virtually certain that an
inflow of economic benefits will arise, the asset and the related income are recognized in the
consolidated financial statements.
Revenue and Related Commissions
Passenger ticket and cargo waybill sales are initially recorded as Unearned transportation revenue
in the consolidated statement of financial position until recognized as Revenue in the
consolidated statement of comprehensive income when the transportation service is rendered.
Revenue also includes recoveries from surcharges during the year.
The related commission is recognized as expense in the same period when the transportation
service is provided and is included as part of Reservation and sales in the consolidated statement
ofcomprehensive income. The amount of commission not yet recognized as expense is treated as
a prepayment and is reflected as a reduction of Unearned transportation revenue in the
consolidated statement of financial position.
24
Other Comprehensive Income
Other comprehensive income comprises items of income and expense (including items previously
presented under the consolidated statement of changes in equity) that are not recognized in profit
or loss for the year in accordance with PFRS. Other comprehensive income includes changes in
revaluation increment in property, gains and losses on re-measuring available-for-sale financial
assets, and any effective portion of gains and losses on hedging instruments in cash flow hedges.
Interest and Dividend Income
Interest on cash, cash equivalents and other short-term cash investments and investments in bonds
is recognized as the interest accrues using the effective interest rate method. Dividend income
from available-for-sale equity investments is recognized when the Group’s right to receive
payment is established.
Liability Under Frequent Flyer Program
PAL operates a frequent flyer program called “Mabuhay Miles.” The incremental cost of
providing awards in exchange for redemption of miles earned by members is accrued in the
accounts as an operating cost and a liability after allowing for miles which are not expected to be
redeemed. The liability is adjusted periodically based on awards earned, awards redeemed, and
changes in the frequent flyer program.
Retirement Benefits Cost
Retirement benefits cost under the defined benefit plan is actuarially determined using the
projected unit credit method. This method reflects services rendered by employees up to the date
of valuation and incorporates assumptions concerning employees’ projected salaries. Actuarial
valuations are conducted with sufficient regularity with option to accelerate when significant
changes to underlying assumptions occur. Actuarial gains and losses are recognized as income or
expense when the net cumulative unrecognized actuarial gains and losses for the plan at the end
of the previous reporting year exceeded 10% of the higher of the present value of defined benefit
obligation and the fair value of plan assets at that date. These gains or losses are recognized over
the expected average remaining working lives of the employees participating in the plan.
Past service cost is recognized as an expense on a straight-line basis over the average period
when the benefits become vested. If the benefits are already vested immediately following the
introduction of, or changes to, the retirement plan, past service cost is recognized immediately.
Retirement benefits cost includes current service cost, interest cost, amortization of unrecognized
past service costs, actuarial gains and losses, experience adjustments, effect of any curtailment or
settlement and changes in actuarial assumptions over the expected average remaining working
lives of covered employees. The defined benefit liability is the aggregate of the present value of
the defined benefit obligation and actuarial gains and losses not recognized, reduced by past
service cost not yet recognized, and the fair value of plan assets out of which the obligations are
to be settled directly. If such aggregate is negative, the asset is measured at the lower of such
aggregate or the aggregate of cumulative unrecognized net actuarial losses and past service cost
and the present value of any economic benefits available in the form of refunds from the plans or
reductions in the future contributions to the plan.
Retirement benefits cost under the defined contribution plan is based on the established amount
of contribution and is recognized as expense in the same year as the related employee services are
rendered.
Borrowing Costs
Borrowing costs are generally expensed as incurred. Borrowing costs are capitalized if they are
directly attributable to the acquisition or construction of a qualifying asset. Capitalization of
borrowing costs commences when the activities to prepare the asset are in progress and
25
expenditures and borrowing costs are being incurred. Borrowing costs are capitalized until the
assets are substantially ready for their intended use.
Income Taxes
Current tax
Current tax assets and liabilities for the current and prior periods are measured at the amount
expected to be recovered from or paid to the taxation authorities. The tax rates and tax laws used
to compute the amounts are those that have been enacted or substantively enacted as of the
statement of financial position date.
Deferred tax
Deferred tax is provided, using the balance sheet liability method, on all temporary differences at
the statement of financial position date between the tax bases of assets and liabilities and their
carrying amounts for financial reporting purposes.
Deferred tax liabilities are recognized for all taxable temporary differences, including asset
revaluations. Deferred tax assets are recognized for all deductible temporary differences,
carryforward benefits of unused tax credits and unused net operating loss carryover (NOLCO), to
the extent that it is probable that sufficient taxable profit will be available against which the
deductible temporary differences and carryforward benefits of unused tax credits and unused
NOLCO can be utilized. Deferred tax, however, is not recognized when it arises from the initial
recognition of an asset or liability in a transaction that is not a business combination and, at the
time of the transaction, affects neither the accounting profit nor taxable profit or loss.
Deferred tax liabilities are not provided on non-taxable temporary differences associated with
investments in domestic subsidiaries and associates. With respect to investments with other
subsidiaries and associates, deferred tax liabilities are recognized except where the timing of
reversal of the temporary differences can be controlled and it is probable that the temporary
difference will not reverse in the foreseeable future.
The carrying amount of deferred tax assets is reviewed at each statement of financial position
date and reduced to the extent that it is no longer probable that sufficient taxable profit will be
available to allow all or part of the deferred tax asset to be utilized. Unrecognized deferred tax
assets are reassessed at each statement of financial position date and are recognized to the extent
that it has become probable that future taxable profit will allow the deferred tax asset to be
recovered.
Deferred tax assets and liabilities are measured at the tax rates that are expected to apply to the
period when the asset is realized or the liability is settled, based on tax rates (and tax laws) that
have been enacted or substantively enacted as of statement of financial position date.
Income tax relating to items recognized directly in equity is recognized in equity and not included in
the calculation of comprehensive income for the period.
Deferred tax assets and deferred tax liabilities are offset if a legally enforceable right exists to set
off current tax assets against current tax liabilities and the deferred taxes relate to the same
taxable entity and the same taxation authority.
Functional Currency and Foreign Currency Translation
Each entity in the Group determines its own functional currency and the items included in the
separate financial statements of each entity are measured using the functional currency.
Transactions in foreign currencies are initially recorded in the functional currency rate at the date
of the transaction. Outstanding monetary assets and liabilities denominated in foreign currencies
26
are translated using the functional currency rate of exchange at balance sheet date. All
differences are taken to profit or loss. Non-monetary items that are measured in terms of
historical cost in a foreign currency are translated using the exchange rates at the dates of the
transactions. Non-monetary items measured at fair value in a foreign currency are translated
using the exchange rates at the date when the fair value was determined.
The results of operations and financial position of all Group entities (none of which has the
functional currency of a hyperinflationary economy) that have functional currencies different
from the Philippine peso presentation currency, which is the functional and presentation currency
of the Parent Company, are translated into the presentation currency as follows:
a. assets and liabilities for each financial position presented are translated at the closing rate at
the closing rate at statement of financial position date;
b. income and expenses for each income statement presented are translated at the monthly
average exchange rates (unless this average is not a reasonable approximation of the
cumulative effect of the rates prevailing on the transaction dates, in which case income and
expenses are translated at the dates of the transactions);
c. capital stock and other equity items resulting from transactions with equity holders
(i.e., additional paid-in capital) and equity items resulting from income and expenses directly
recognized in equity (i.e., revaluation increment in property) are translated using the rates
prevailing on the transaction dates; and
d. all resulting exchange differences are recognized as a separate component of equity, in the
account “Cumulative translation adjustment”.
On consolidation, exchange differences arising from the translation of the net investment in
foreign operations are taken to equity. When a foreign operation is sold or disposed of, exchange
differences that were recorded in equity are recognized in the consolidated statement of income.
Earnings (Loss) Per Share
Basic earnings (loss) per share (EPS) is calculated based on net income (loss) before other
comprehensive income and total comprehensive income for the year. EPS is calculated by
dividing net income (loss) before other comprehensive income or total comprehensive income for
the quarter, as applicable, by the number of issued and outstanding shares of stock during the
quarter.
II: Financial Risk Management Objectives and Policies
Risk Management Structure
Board of Directors (BOD)
The BOD is mainly responsible for the overall risk management approach and for the
approval of risk strategies and policies of the Group.
Financial Risk Committee
The Financial Risk Committee has the overall responsibility for the development of
financial risk strategies, principles, frameworks, policies and limits. It establishes a
forum of discussion of the Group approach to financial risk issues in order to make
relevant decisions.
Finance Risk Office
27
The Finance Risk Office is responsible for the comprehensive monitoring, evaluating
and analyzing of the Group financial risks in line with the policies and limits set by the
Finance Risk Committee.
Financial Risk Management
The Group’s principal financial instruments, other than derivatives, comprise of loans,
cash and cash equivalents, investments in bonds and equities, and deposits. The main
purpose of these financial instruments is to raise financing for the Group’s operations.
The Group has various other financial assets and liabilities such as trade receivables
and trade payables, which arise directly from its operations.
The main risks arising from the use of financial instruments are market risks (consisting
of foreign exchange risk, cash flow interest rate risk, price interest rate risk, equity price
risk and fuel price risk), liquidity risk, counterparty risk and credit risk.
PAL uses derivative financial instruments to manage its exposures to currency, interest
and fuel price risks arising from the PAL’s operations and its sources of financing. The
details of PAL’s derivative transactions, including the risk management objectives and
the accounting results, are discussed in this note.
Market risks
Increasing market fluctuations may result in significant equity, cash flow and profit
volatility risks for the Group. Its operating activities as well as its investing and financing
activities are affected by changes in foreign exchange rates, interest rates and fuel
prices. The Group seeks to manage and control these risks primarily through its regular
operating and financing activities, and through execution of a documented hedging
strategy.
Management of financial market risk is a key priority for the Group. The Group generally
applies sensitivity analysis in analyzing and managing its market risks. Sensitivity
analysis enables the management to identify the risk position of the Group as well as
provide an approximate quantification of the risk exposures. Estimates provided for
foreign exchange risk, cash flow interest rate risk, price interest rate risk and fuel price
risk are based on the historical volatility for each market factor, with adjustments being
made to arrive at what the Group considers to be reasonably possible.
Foreign exchange risk
The Group is exposed to foreign exchange rate fluctuations arising from its revenue,
expenses and borrowings in currencies other than its functional currency. The Group
manages this exposure by matching its receipts and payments for each individual
currency. Any surplus is sold as soon as practicable. PAL also uses foreign currency
forward contracts and options to hedge a portion of its exposure. The Group’s
significant foreign currency-denominated monetary assets and liabilities (in US$
equivalent) as of September 30, 2008 and March 31, 2008 are as follows:
(Amounts in 000’s )
Financial assets and financial liabilities:
Financial Assets:
Cash
Receivables
Others*
September 30,
2008
P745,401
5,958,809
1,506,115
8,210,325
March 31, 2008
P1,181,068
4,401,834
1,509,813
7,092,715
28
Financial Liabilities:
Accounts payable
Accrued expenses
Others**
Net foreign currency-denominated
financial assets
Nonfinancial assets and nonfinancial
liabilities:
Accrued employee benefits
Unremitted tax collections
Net foreign currency-denominated
monetary liabilities
645,626
4,015,266
1,505,311
6,166,203
767,434
4,077,181
1,083,067
5,927,682
2,044,122
1,165,033
(3,664,142)
(1,106,545)
(4,770,686)
(3,237,802)
(1,166,162)
(4,403,934)
(P2,726,565)
(P3,238,931)
* Includes miscellaneous deposits, security deposits and currency forwards
** Substantially pertaining to notes payable to a local bank
The Group’s foreign currency-denominated exposures comprise primarily of Philippine peso (PHP)
and Japanese yen (JPY). Other foreign currency exposures include Canadian Dollar (CAD), Euro
(EUR), Australian Dollar (AUD), Singaporean Dollar (SGD), and Hong Kong Dollar (HKD).
The Group recognized P642,028 foreign exchange gain for the period April to September 2008
and a foreign exchange loss of P1,013,441 in March 2008.
Cash flow interest rate risk
The Group’s policy on interest rate risk is designed to limit the Group’s exposure to fluctuating
interest rates. Before taking into account the effects of interest hedging, the ratio of floating rate to
the total borrowings is 0.61:1 and 0.54:1 as of September 30, 2008 and March 31, 2008,
respectively.
PAL has interest rate swap agreements (either as freestanding instruments or embedded in
certain long-term liabilities) to manage its interest rate exposure relative to the financing of three
Airbus 330-300, two Airbus 340-300 and one Boeing 747-400 aircraft. The interest rate swap
agreements relative to the financing of two Airbus 330-300 aircraft require the exchange, at semiannual intervals, the difference between the Group’s fixed interest rates and the counterparties’
floating interest rates. The effect of these swap agreements (aggregate notional amount of
P2,097,765 and P2,188,557 as of September 30, 2008 and March 31, 2008, respectively) is to
effectively fix the Group interest rate exposure under these financing agreements to rates ranging
from 6.50% to 6.61%.
With respect to the junior loan financing of one Airbus 330-300, two Airbus 340-300 and one
Boeing 747-700 aircraft, the Group agreed with the counterparties to exchange, at semi-annual
intervals, the difference between the Group’s floating interest rates and the counterparties’ fixed
interest rates. These swap agreements (aggregate notional amounts of P284,057 and P274,796
as of September 30, 2008 and March 31, 2008, respectively) effectively convert the Group’s fixed
interest rate exposure relative to these junior loan financing agreements ranging from 7.20% to
7.95% into floating rate exposure based on six-month LIBOR plus margin.
Price interest rate risk
PAL’s investments in US Treasury bonds, classified as available-for-sale, and interest rate swaps,
designated as cash flow hedges are subject to price interest rate risk. The prices of these
investments are monitored based on their current fair values, which are affected by the changes in
market factors such as interest rates.
29
Equity price risk
Equity price risk is the risk that the fair values of equity securities decrease as the result
of changes in the levels of equity indices and the value of individual stocks. The prices of
these investments are monitored based on their current fair values.
Fuel price risk
The group is exposed to price risk on jet fuel purchases. This risk is managed by a
combination of strategies with the objective of managing price levels within an
acceptable band through various types of derivative and hedging instruments. In
managing this significant risk, the Group has a portfolio of swaps, collars, and
compound structures with sold options or option combinations with extendible or
cancellable features. The Group implements such strategies to manage and minimize
the risks within acceptable risk parameters.
PAL’s fuel derivatives are viewed as economic hedges and are not held for speculative
purposes. Short-term exposures are hedged primarily with fuel derivatives indexed to jet
fuel. On long-term exposures, the Group also uses fuel derivatives indexed to crude oil
as proxy hedges due to liquidity constraints in the refined oil products market (i.e., jet
fuel).
The Group uses a Value-at-Risk (VaR) computation to estimate the potential three-day
loss in the fair value of its fuel derivatives. The VaR computation is a risk analysis tool
designed to statistically estimate the maximum potential loss from adverse movement in
fuel prices.
Assumptions and Limitations of VaR
The VaR methodology employed by the Group uses a three-day period due to the
assumption that not all positions could be undone in a single day given the size of the
positions. The VaR computation makes use of Monte Carlo simulation with multi-factor
models. Multi-factor models ensure that the simulation process takes into account mean
reversion and seasonality. It captures the complex dynamics of the term structure of
commodity markets, such as contango and backwardation. The VaR estimates are
made assuming normal market conditions using a 95% confidence interval and are
determined by observing market data movements over a 90-day period.
The estimated potential three-day losses on its fuel derivative transactions, as calculated
in the VaR model, amounted to P1,091,373 and P191,500 as of September 30, 2008
and March 31, 2008, respectively.
The high, average and low VaR amounts for the following periods are as follows:
(Amounts in ‘000’s)
April 1, 2008 to September 30,
2008
April 1, 2007 to March 31, 2008
High
Average
Low
P1,022,931
322,621
P447,076
156,359
P157,442
92,878
Liquidity risk
Liquidity risk arises from the possibility that the Group may encounter difficulties in
raising funds to meet commitments from financial instruments (e.g., Long-term
Obligations) or that a market for derivatives may not exist in some circumstances.
30
The Group’s objectives to manage its liquidity profile are: a) to ensure that adequate
funding is available at all times, b) to meet commitments as they arise without incurring
unnecessary
costs,
c) to be able to access funding when needed at the least possible cost and d) to
maintain an adequate time spread of refinancing maturities.
The tables below summarize the maturity analysis of the Group’s financial liabilities
based on contractual undiscounted payments (principal and interest):
September 30, 2008
<1 year
Accounts Payable and Accrued
Liabilities
Notes Payable (noncurrent portion is
included under Other Noncurrent
Liabilites)
Obligation under Finance Lease
Other liability
(under accrued expense and other
noncurrent liabilities) (Note 16)
Other Long Term Liabilities
Due to related parties
Derivative Instruments:
Contractual receivable
Contractual payable
Fuel derivatives
P17,090,001
>1-<2
years
$–
>2-<3
years
$–
>3-<4
years
>4-<5
years
>5 years
$–
$–
$–
8,352,919
11,774,360
–
10,798,595
–
7,353,428
–
3,399,369
–
4,561,590
414,033
235,091
481,090
414,033
198,603
--
414,033
623,554
--
414,033
604,459
--
(551,476)
554,265
3,459,347
–
–
(1,824,627)
1,886,259
5,827,651
Total
P17,090,001
–
11,013,363
8,352,919
48,900,705
414,033
578,228
--
241,519
1,908,614
--
2,311,684
4,148,549
481,090
–
–
–
–
–
–
–
–
–
(2,376,103)
2,440,524
9,286,998
>3-<4
years
>4-<5
years
>5 years
–
–
–
March 31, 2008
<1 year
Accounts Payable and Accrued
Liabilities
Notes Payable (noncurrent portion is
included under Other Noncurrent
Liabilites)
Obligation under Finance Lease
Other liability
(under accrued expense and other
noncurrent liabilities) (Note 16)
Due to related parties
Derivative Instruments:
Contractual receivable
Contractual payable
Fuel derivatives
P13,766,349
>1-<2
years
–
>2-<3
years
–
Total
13,766,349
3,464,871
7,224,164
–
9,883,269
–
9,135,712
–
7,072,798
–
1,804,569
–
9,804,058
3,464,871
44,924,570
414,011
481,090
414,011
--
414,011
--
414,011
--
414,011
--
448,501
--
2,518,556
481,090
(20,794)
50,065
1,248,421
–
–
249,409
–
–
–
–
–
–
–
–
–
(1,778,972)
2,091,057
3,467,586
(1,758,178))
2,040,992
1,969,756
Note: Coupon cash flows on floating rate liabilities are determined using projected rates. In the case of derivatives,
where the settlement mechanism is gross, the contractual cash inflows and outflows are presented by time bucket. Where
the settlement mechanism is net, the future undiscounted ash flows are used, where the estimated forward or swap curve
are compared against contractually agreed rates or prices.
Counterparty risk
The Group’s counterparty risk encompasses issuer risk on investment securities; credit
risk on cash in bank, time deposits, and security deposit; and settlement risk on
derivatives. The Group manages its counterparty risk by transacting with counterparties
of good financial condition and selecting investment grade securities. Its existing
investments (i.e., US treasury bonds) are AAA rated. Settlement risk on derivatives is
managed by limiting aggregate exposure on all outstanding derivatives to any individual
counterparty, taking into account its credit rating. Credit limits are set in line with the
long-term rating of the counterparty as determined by Standard & Poor’s and Moody’s.
These limits are regularly monitored, reviewed and adjusted as deemed necessary. PAL
also enters into master netting arrangements and implements counterparty and
transaction limits to avoid a concentration of counterparty risk.
The table below shows the maximum counterparty exposure of the Group as of
September 30, 2008 and March 31, 2008:
31
( Amounts in ‘000s)
Cash in bank and cash equivalents
Investment in US treasury bonds
Investment in MAC
Derivative instruments
Deposit on aircraft leases and others
Total
September 30, 2008
P13,415,687
104,548
321,200
6,654,771
6,060,805
P26,557,011
March 31, 2008
P14,709,678
92,364
330,000
4,830,459
4,012,376
P23,974,877
Credit risks
The Group’s exposure to credit risk arises from the possibility that agents and other
counterparties may fail to fulfill their agreed obligations and that the collaterals held may
not
be
sufficient
to
cover the Group’s claims. To manage such risk, the Group, through its Credit and
Collection Department, employs a credit evaluation process prior to the accreditation or
re-accreditation of its travel and cargo agents. The Group considers, among other
factors, the size, paying habits and the financial condition of the agents. To further
mitigate the risk, the Group requires from its agents financial guarantees in the form of
cash bonds, letters of credit and assignment of time deposits.
The maximum exposure of the Group on the receivables is equal to the carrying amount
of these instruments less the value of the collaterals provided to the Group.
The Group, to the best of its knowledge, has no significant concentration of credit risk
with any counterparty.
III: Financial Instruments
Fair Values of Financial Instruments
The table below presents a comparison by category of the carrying amounts and fair
values of the
Group’s financial instruments:
September 30, 2008
( Amounts in ‘000s)
Financial Assets
Cash
Loans and Receivables
Cash equivalents
Accounts receivable - net:
General traffic:
Passenger
Cargo
IATA
Others
Non-trade*
Deposit on aircraft leases and
others
Available-for-sale Investments:
Debt investments - quoted
Equity investments:
Quoted
Unquoted
Derivative Assets:
FVPL
March 31, 2008
Carrying Value
Fair Value
Carrying Value
Fair Value
P1,843,428
P1,843,428
P1,822,048
P1,822,048
11,649,631
11,649,631
12,961,647
12,961,647
3,054,152
589,193
199,832
124,966
556,864
3,054,152
589,193
199,832
124,966
556,864
3,444,035
441,403
347,744
16,368
1,129,542
3,444,035
441,403
347,744
16,368
1,129,542
6,060,805
24,078,871
5,586,747
23,604,813
4,012,376
24,175,163
3,192,121
23,354,908
104,548
104,548
92,364
92,364
660,603
296,487
1,061,638
660,603
296,487
1,061,638
652,482
264,315
1,009,161
652,482
264,315
1,009,161
4,235,800
4,235,800
1,536,287
1,536,287
32
Accounted for as cash flow
hedges
Financial Liabilities
Financial liabilities carried at
amortized cost:
Accounts payable and accrued
expenses
Notes payable
Obligations under finance
leases
Due to related parties
Other liability (under accrued
expense and other noncurrent
liabilities)
Other Long Term Liabilities
Derivative liability:
FVPL
Accounted for as cash flow
hedges
2,418,972
6,654,772
31,795,281
2,418,972
6,654,771
31,321,222
3,294,173
4,830,460
P30,014,784
3,294,173
4,830,460
P29,194,529
P17,090,001
8,222,518
P17,090,001
8,222,518
P13,766,349
3,440,235
P13,766,349
3,440,235
40,790,108
481,090
43,106,233
481,090
35,879,887
481,090
38,882,394
481,090
1,813,142
1,836,301
1,929,169
3,143,056
71,539,915
3,168,200
73,904,343
–
–
55,496,730
58,526,587
9,206,649
9,206,649
3,549,176
3,549,176
184,188
9,390,837
P80,930,752
184,188
9,390,837
P83,295,180
264,399
3,813,575
P59,310,305
264,399
3,813,575
P62,340,162
* Excluded from non-trade receivables are receivables arising from statutory requirements (net of allowance
amounting to P529,404 and P377,892 as of September 30, 2008 and March 31, 2008, respectively).
The following methods and assumptions are used to estimate the fair value of each
class of financial instruments:
Cash, Cash equivalents and Receivables
The carrying amounts of cash and cash equivalents approximate fair value. The
carrying amounts of receivables approximate fair value due to their short-term
settlement period.
Current financial instruments
Similarly, the historical cost carrying amounts of receivables, miscellaneous deposits,
notes payable, accounts payable and accrued liabilities approximate their fair values due
to the short-term nature of these accounts.
Debt investments (Available-for-sale investments)
The fair values of debt investments are generally based upon quoted market prices. If
market prices are not readily available, fair values are estimated by obtaining quotes
from counterparties or from independent entities that offer pricing services, by adjusting
the quoted market prices of comparable investments.
Equity investments (Available-for-sale investments)
The fair values of equity investments are generally based upon quoted market prices.
Unquoted equity investments are carried at cost (subject to impairment) if the fair value
cannot be reliably determined or where the variability in the range of fair value estimates
is significant.
33
Security deposits
The fair value of refundable deposits is determined using discounted cash flow
techniques based on prevailing market rates. Discount rates used are 3.0% and 6.66%
for September 30, 2008 and March 31, 2008, respectively.
Long-term Obligations
The fair value of long-term obligations (whether fixed or floating) is generally based on
the present value of expected cash flows with discount rates that are based on riskadjusted benchmark rates (in the case of floating rate liabilities with quarterly repricing,
the carrying value approximates the fair value in view of the recent and regular repricing
based on current market rates).The discount rate used range from 5.33% to 1.12% and
5.09% to 2.04% for US dollar denominated loans in September 2008 and March 2008
respectively. The discount rates used amounted to 2.3% and 2.10% for JPY
denominated loans in September 2008 and March 2008 respectively.
Derivatives
The fair value of forward exchange contracts is calculated by reference to current
forward exchange rates for contracts with similar maturity profiles.
The fair value of interest rate swap transactions is the net present value of estimated
future cash flows.
The fair values of fuel derivatives that are actively traded on an organized and liquid
market are based on published prices. In the absence of an active and liquid market,
and depending on the type of instrument and the underlying commodity, the fair value of
fuel derivatives is determined by the use of either present value methods or standard
option valuation models. The valuation inputs on these fuel derivatives are based on
assumptions developed from observable information, including (but not limited to) the
forward curve derived from published or futures prices adjusted for factors such as
seasonality considerations and the volatilities that take into account the impact of spot
prices and the long-term price outlook of the underlying commodity. The fair values of
fuel derivatives with extendible or cancelable features are based on quotes provided by
counterparties.
Derivative Financial Instruments
The derivative financial instruments set out in this section have been entered into to
achieve the Group’s risk management objectives. PAL’s derivative financial instruments
are accounted for at fair value through profit or loss, except for interest rate swaps and
certain fuel derivatives (which are accounted for as cash flow hedges).
The following table provides information about PAL’s derivative financial instruments
outstanding as of September 30, 2008 and March 31, 2008 and the related fair values:
(Amounts in “000s)
Fuel derivatives
Interest rate swaps
Currency forwards
Structured currency derivatives
Asset
P6,637,851
1,229
15,692
P6,654,771
9/30/08
Liability
P9,286,998
75,102
5,530
23,207
P9,390,837
Asset
P4,823,570
–
6,890
–
P4,830,460
3/31/08
Liability
P3,467,627
107,938
39,585
198,425
P3,813,575
34
As of September 30, 2008 and March 31, 2008, the positive and negative fair values of
derivative positions that will settle in 12 months or less are classified under Other current
assets (P4,400,846 in September 2008 and P3,074,453 in March 2008 ) and Accrued
liabilities (P5,856,388 in September 2008 and P2,207,807 in March 2008 ), respectively.
The positive and negative fair values of derivative positions that will settle in more than
12 months are classified under Other noncurrent assets (P2,253,926 in September 2008
and P1,756,007 in March 2008 ) and Other noncurrent liabilities (P3,534,449 in
September 2008 and P1,605,769 in March 2008), respectively. The derivative liability
balance include amounts arising from derivative settlements currently payable by the
Group. The amount payable totaled P103,461 as of September 30, 2008 as compared
with the amount due to the Group of P308,452 as of March 31, 2008.
Fuel derivatives
PAL is dependent to jet fuel to run its operation. Approximately 44.9% and 33.1% of its
operating expenses represent jet fuel consumption for the period ending September
2008 and 2007 respectively.
The dramatic increase in all energy prices over the years is another reason why jet fuel
and oil has become a large portion of its expenses. In order to hedge against adverse
market condition and to be able to acquire jet fuel at the lowest possible cost, PAL
enters into fuel derivatives. PAL does not purchase or hold any derivative financial
instruments for trading purposes.
PAL accounted for certain fuel derivatives as cash flow hedges as such instruments are
utilized to reduce the variability of the cash flows of forecasted jet fuel purchases. These
hedges, consisting of fuel caps and floors (collar structures), and fixed swaps are linked
to specified fuel indices and have various monthly maturities up to June 30, 2010. The
net positive fair value of these fuel derivatives as of September 30, 2008 and March 31,
2008 amounted to P2,309,839 and P3,137,713 respectively.
PAL’s other fuel derivatives, which provide economic hedges against jet fuel price risk,
are not accounted for as accounting hedges. These derivatives include leveraged
collars, written calls, swaps and other structures with extendible or cancelable features
and are carried at fair values in the consolidated statement of financial position, with fair
value changes being reported immediately in the consolidated statement of
comprehensive income. The net negative fair value of these fuel derivatives as of
September 30, 2008 and March 31, 2008 amounted to P4,855,573 and P2,090,138
respectively.
Interest rate swaps
The interest rate swap agreements relative to the financing of two Airbus 330-300
aircraft have aggregate notional amounts of P2,097,765 and P2,188,557 as of
September 30, 2008 and March 31, 2008, respectively, and have expiry dates from
August 27, 2009 to September 24, 2009. Under the agreements, PAL agreed with the
counterparties to exchange, at semi-annual intervals, the difference between PAL’s fixed
interest rates and the counterparties’ floating interest rates. The effect of these swap
agreements is to effectively fix PAL’s interest rate exposures under these financing
agreements to rates ranging from 6.50% to 6.61%. The unpaid swap costs amounting
to P51,940 million as of March 31, 1999 were converted into long-term liabilities in 1999
and included as part of the outstanding principal balances of the related Aircraft Secured
Claims.
35
Currency forwards
The Group’s currency forwards are carried at fair value in the consolidated statements of
financial position, with the fair value changes being reported immediately in the
consolidated statements of comprehensive income. Impact of fair value changes are not
significant.
Structured currency derivatives
The Group entered into structured currency derivatives during the fiscal year 2008. The
instruments consist of compound option structures with combination of long calls with
knockout and short put with leverage features. These contracts are carried at fair value
in the consolidated statement of financial position. The fair value changes of the
derivative instruments are recognized directly in the consolidated statement of
comprehensive income.The structured currency derivatives are The Group’s foreign
currency-denominated exposures comprise primarily of Philippine peso (PHP) and
Japanese yen (JPY). Other foreign currency exposures include Canadian Dollar (CAD),
Euro (EUR), Australian Dollar (AUD), Singaporean Dollar (SGD), and Hong Kong Dollar
(HKD).
Item 2. Management's Discussion and Analysis of Financial Condition and Results of
Operations.
Results of Operations
PAL Holdings’ consolidated total comprehensive income for the six months ended
September 30, 2008 amounted to (PHP3,441.7) million a significant decrease of 2,279%
from the same period of the previous fiscal year of PHP 158.0 million. Consolidated net
income (loss) from operations also showed a decline of 666% from PHP 978.8 million as of
September 30, 2007 to (PHP 5,537.7) million in the current period.
Consolidated revenues for the six months ended September 30, 2008 amounted to PHP
37,528.5 million, 11% higher than last year’s same period figure of PHP 33,817.9 million.
The increase was brought about mainly by the increase in passenger revenues due to
higher net yield per Revenue Passenger Kilometer (RPK) and in the number of passengers
carried. Revenues also include cargo, recoveries arising from surcharges, and other income
earned during the period.
Consolidated expenses for the current period rose by PHP10,227.1 million or 31% versus
the previous year’s period total of PHP 32,839.1 million. This was largely due to higher
expenses related to flying operations, maintenance, aircraft & traffic servicing, passenger
service, reservation and sales, general and administrative and other expenses.
The increase in flying operations by 50% was attributable mainly to the increase in fuel
costs. The rise in fuel expenses for the period ended September 2008 was a result of the
escalation in the average price per barrel of aviation fuel from US$ 80.91 in 2007 to US$
144.79 in 2008 as well as higher fuel consumption as a result of the increase in flights.
Higher aircraft, component and engine repair costs contributed mainly to the increase in
maintenance expenses by 6%. The increase in flights operated resulted in higher aircraft &
traffic servicing cost by 5% or PHP 199.8 million as compared with last year’s figure of PHP
4,011.9 million.
36
Growth in the volume of passengers carried as well as improvements implemented by PAL
in the cabin crew benefits increased the passenger service expense by PHP 62.8 million or
2.6% compared with the previous six months total of PHP 2,444.6 million.
Increase in selling expenses recognized related to transportation service provided as well as
in the cost incurred under the frequent flyer program resulted in an increase in reservation
and sales by 24%.
Improvements in employee benefits implemented by PAL as well as fees incurred relative to
various legal matters, change in aircraft registration, and new aircraft delivery resulted in
higher general and administrative expenses by 14% in 2008.
Recognition of changes in the fair value of outstanding derivative instruments which did not
qualify for hedge accounting, net of foreign exchange gains arising from the movements of
the Philippine peso vis a vis the US dollar, contributed mainly to the increase in “Other
Expenses” by 163 % over the same period figure of the previous year. These expenses,
however, were offset in part by the corresponding gains recognized from changes in the fair
valuation of outstanding derivative assets amounting to PHP 395.5 million classified as part
of “Other Comprehensive Income”.
Another significant portion of the other comprehensive income is the effect of foreign
exchange translation which resulted to a gain of PHP 1,699 million or an increase of 257%
from last year. This is due to the increase in the monthly average of the US $ rates vis-à-vis
the Philippine peso from PHP 41.756 as of March 31, 2008 to PHP 47.264 as of September
30, 2008.
Financial Condition
The Company’s consolidated total assets as of September 30, 2008 amounted to PHP
103,111.3 million or 21% higher than the March 31, 2008 balance of PHP 85,185.3 million.
The difference was brought about mainly by the net increase in property and equipment
balance of PHP14,946.5 million or 31% attributable to the acquisition of three (3) Airbus
A320-200 aircraft delivered in April, July and August 2008 as part of PAL’s refleeting
program; and eight (8) turbo-prop aircraft (three Q300s and five Q400s) delivered in May,
June, July and August 2008 used in PAL’s “PAL Express” flights. The increase was also
due to the pre delivery payments made for the Boeing B777-300 aircraft scheduled for
delivery in March 2010. However, the increases were offset in part by the depreciation
expense recognized during the period, which had the effect of reducing the carrying values
of the assets.
Other non current assets also increased by 57% principally due to the upward movement in
security deposits used as collateral for certain derivative instruments.
The minimal increase in total current assets was mainly due to the effect of the depreciation
of the Philippine peso vis a vis the US dollar from PHP 41.756 per US$ 1.00 in March 2008
to PHP 47.264 per US$ 1.00 in September 2008. Had there been no change in exchange
rate, current assets balance would have decreased by 11% or PHP 3,160.8 million as
compared with the March 31, 2008 balance of PHP 27,516.1 million. The decrease was
attributable to the decline in cash and cash equivalent balance by 9% due to servicing of
debts, payments made for the turbo-prop aircraft, and advance payments made for the
purchase of the B777-300 aircraft as well as by the 12% decrease in the receivable balance
from the March 31, 2008 balance of PHP 5,756.9 million as a result of lower ticket sales.
37
These reductions, however, were offset in part by the increase in expendable parts, fuel,
materials and supplies by 72% principally due to higher fuel inventory.
Total liabilities rose by 30%. The growth in liabilities was due to the availment of short term
notes payable from several local banks as well as additional long term obligations secured in
support of the acquisition of the turboprops and the Airbus A320-200 aircraft under capital
lease. The remeasurement to fair value of certain derivative instruments also had the effect
of increasing the accrued liabilities balance grouped under current liabilities by 44% and in
the other liabilities balance grouped under reserves and other liabilities.
As of September 30, 2008, the Company’s equity balance amounted to PHP 11,166.4
million, down by PHP 3,441.7 million or 24% from the March 31, 2008 balance of PHP
14,608.1 million. The decline can be attributed mainly to the decrease in consolidated net
income by 666% notwithstanding the increase brought about by the effect of the changes in
fair value of outstanding derivative instruments included under the cumulative translation
adjustment caption.
The Company’s key performance indicators are the following:
1. Total Comprehensive Income
The Company’s consolidated total comprehensive income attributable to parent for the
six months ended September 30, 2008 amounted to (PHP 2,915.4) million lower by
2,279% from last years’ level of PHP 148.6 million.
2. Current Ratio
The Company has a current ratio of 0.58 as of September 30, 2008 compared to 0.85
as of March 31, 2008.
3. Debt to Equity ratio
Debt to Equity ratio as of September 30, 2008 was 8.23 compared to 4.83 as of March
31, 2008
4. Earnings Per Share
The Company reported an Earnings (Loss) per share based on net income (loss) of
( PHP0.86 ) as of September 30, 2008 as compared to PHP 0.15 as of September 30,
2007 and based on total comprehensive income of( PHP 0.54) per share as of
September 30, 2008 as compared to PHP 0.03 as of September 30, 2007.
The manner by which the Company calculates the above indicator is as follows:
Current ratio – Current assets/Current liabilities
Debt to equity ratio – Total liabilities/Total Equity
Earnings (Loss) per share – Net income (loss) or total comprehensive income attributable
to holders of parent company over common shares issued and outstanding
38
PAL’S TOP FIVE KEY PERFORMANCE INDICATORS –QUALITATIVE FACTORS
Mission
Statement
To maintain aircraft with the
highest degree of
airworthiness, reliability and
presentability in the most costeffective manner
To conduct & maintain safe,
reliable, cost & effective flight
operations
To achieve On Time
Performance on all flights
operated
Key Performance Indicator
Aircraft Maintenance Check
Completion
Number of aircraft related
accidents/ incidents
Percentage Deviation from
Industry Standards (OTP
Particpation)
To provide safe, on time,
Number of safety violations
quality and cost effective
incurred by cabin crew
inflight service or total
passenger satisfaction
To maximize the revenue
Net Revenues generated
generation in passenger and
from passengers and cargoes
cargo sales through increased carried
yields by diversifying market
segments and efficient
management of seat inventory
and cargo space
I There are no known trends, demands, commitments, events
have a material impact on the Group’s liquidity.
Measurement
Methodology
Number of checks
performed less number of
maintenance delay over
number of checks
performed
By occurrence and
monitoring by Flight
Operations Safety Office
Number of flights operated
less number of flights
delayed over total flights
operated
Number of incidents of
safety violation incurred by
cabin crew per month
Percentage Deviation from
Budget/Forecasted
Revenues
or uncertainties that may
ii. There are no known events that will trigger direct or contingent financial obligation that is
material to the Group, including any default or acceleration of an obligation.
iii. There are no material off-balance sheet transactions, arrangements, obligations
(including contingent obligations), and other relationships of the Group with unconsolidated
entities or other persons created during the reporting period.
iv. Commitments for capital expenditures
As part of its refleeting program, PAL entered into a Purchase Agreement with Airbus for
nine (9) Airbus A320-200 on firm order for delivery in 2008 and 2009 with options for five (5)
more aircraft for delivery from 2010 to 2013. As of October 2008 , eight (8) Airbus A 320200 are already part of PAL’s operating fleet. The remaining Airbus 320-200 are scheduled
for delivery in December 2008.
In May 2008, PAL started the operations of “PAL Express”. This low fare unit of PAL
operates a fleet of turbo-prop aircraft to service inter-island routes and provincial points. As
of October 2008, three (3) Bombardier Q300 aircraft and five (5) Bombardier Q400 aircraft
are already part of PAL’s operating fleet.
39
Also, two (2) brand new Boeing 777-300ER aircraft on operating leases are scheduled to be
delivered in fiscal year 2010; while four (4) new Boeing 777-300ER aircraft directly ordered
by PAL from Boeing are scheduled to be delivered in fiscal years 2010 to 2012.
PAL is also in the midst of a comprehensive cabin refurbishment on its current wide body
fleet, which will see a new bi-class product alongside a major upgrade of interiors and
amenities.
iv. There are no known trends, events or uncertainties that have had or that are reasonably
expected to have a material favorable or unfavorable impact on net sales/revenues/income
from the Group’s continuing operations.
v.
There are no significant elements of income or loss that did not arise from the
Company’s continuing operations.
vi. The causes for any material change from period to period which shall include vertical
and horizontal analyses of any material item:
1.
2.
3.
4.
5.
6.
7.
8.
9.
10.
11.
12.
13.
14.
15.
16.
17.
18.
19.
20.
21.
22.
23.
24.
25.
26.
27.
28.
29.
30.
31.
32.
33.
34.
35.
36.
Cash and cash equivalents- H-(9%)
Available-for-sale- investments – H -13%
Receivables – net H - (12%)
Expendable parts, fuel, materials and supplies – H- 72%
Other Current Assets – H- 18%
Property, plant and equipment –net – H- 31%
Deposits on aircraft leases –H-18%
Deferred tax assets –H 13%
Investment properties – 13%
Other noncurrent assets – H –57%
Notes payable – H-139%
Current portion of long-term liabilities – H-77%
Accounts payable– H- 38%
Accrued liabilities – H-44%
Income tax payable – H-(100%)
Unearned transportation revenue – H-( 13%)
Long-term liabilities –net of current portion – H-13%
Accrued employee benefits payable – H-13%
Reserves and other noncurrent liabilities –H- 46%
Other components of equity– H-(27%
Passenger – H-13%
Cargo H-5%
Interest income – H-(48%)
Flying Operations – H-50% V-15%
Maintenance – H-6%
Aircraft and traffic servicing – H-5%
Financing charges – H- (23%)
Reservation and sales – H-24%
General and administrative – H –14%
Others – H- 163% V-5%
Net income (loss) – H-(666%) V -(18%)
Net changes in fair value of available-for-sale investments – H-(119%)
Net changes in fair value of derivative assets – H-344%
Increase in revaluation increment due to appraisal – H-100%
Effect of foreign exchange translation – H-257% V-8%
Total Comprehensive income – H- (2,279%) V- (10)%
40
All of these material changes were explained in detail in the management’s
discussion and analysis of financial condition and results of operations stated above.
vi. Generally, PAL experiences a peak in holiday travel during the months of January,
April, May, June and December.
41
PAL HOLDINGS, INC. AND SUBSIDIARIES
AGING OF ACCOUNTS RECEIVABLE
AS OF SEPTEMBER 30, 2008 (UNAUDITED)
(in thousand PHP)
31-90 Days
91-180 Days 181-360 Days Over 360 days
Past Due accounts
& Items in Litigation
Total
Current
TRADE RECEIVABLES
4,288,260
3,648,361
75,658
350,545
104,370
109,325
NON-TRADE RECEIVABLES
4,849,988
44,263
1,038,794
191,566
527,384
2,046,347
1,001,633
TOTAL
9,138,248
3,692,625
1,114,453
542,111
631,754
2,155,672
1,001,633
ALLOWANCE FOR D.A.
4,083,836
RECEIVABLES - NET
5,054,412
TYPE OF ACCOUNTS RECEIVABLE
-
Average Collection Period - trade receivables - 30 days
Normal Operating Cycle = 365 days
42


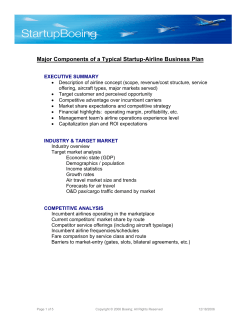
© Copyright 2026