
COVER SHEET P S.E.C. Registration Number
COVER SHEET
P
W -
9
4
S.E.C. Registration Number
P A
L
H
O
L
D
I
N
G
S
,
I
N
C
.
(Company’s Full Name)
7
T
H
6
7
5
F
L
O
O
R
A
L
L
I
E
D
B
A
N
K
A
Y
A L A
A V E
.
M A
(Business Address: No. Street City / Town / Province)
K
A
C
E
N
T
E
R
C
I
T
Y
.
4
SUSAN LEE
Contact Persons
0
3
3
T
I
5197982
Company Telephone Number
1
1
7
-
Q
Month
Day
Fiscal Year
Month
Day
Annual Meeting
Secondary License Type, If Applicable
Dept. Requiring this Doc.
Amended Articles Number/Section
Total Amount of Borrowings
Total No. of Stockholders
Domestic
-----------------------------------------------------------------------------------------------------------------------------To be accomplished by SEC Personnel concerned
File Number
Document I.D.
STAMPS
Remarks = pls. use black ink for scanning purposes
LCU
Cashier
Foreign
SECURITIES AND EXCHANGE COMMISSION
SEC FORM 17-Q
QUARTERLY REPORT PURSUANT TO
SECTION 17 OF THE SECURITIES REGULATION CODE
1.
For the quarter period ended
2.
SEC Identification Number PW- 94
September 30, 2010
3. BIR Tax Identification No. 430-000-707-922
Exact name of registration as specified in its
4.
charter
5.
PAL HOLDINGS, INC.
( SEC Use Only)
6
Metro Manila,
Philippines
(Province, country or other jurisdiction of
incorporation or organization)
Industry Classification Code:
7.
7/F Allied Bank Center, 6754 Ayala Avenue, Makati City
Address of principal office including postal code
8.
632 - 5197982
Registrant’s telephone number, including area code
9.
Not Applicable
Former name, former address, former fiscal year, if changed since last report
10.
Securities registered pursuant to Section 8 and 12 of the SRC
1200
Postal Code
Title of Each Class
Number of Shares of Common Stock Outstanding
and Amount of Debt Outstanding
Common Stock
5,421,512,096
11. Are any or all of these securities listed on the Philippine Stock Exchange?
Yes [ X ]
12.
No [
]
Check whether the registrant:
(a) has filed all reports required to be filed by Section 17 of the SRC and SRC Rule 17 thereunder
or Sections 11 of the RSA and RSA Rule 11(a)-1 thereunder, and Sections 26 and 141 of the
Corporation Code of the Philippines, during the preceding twelve (12) months (or for such shorter
period the registrant was required to file such reports)
Yes [ /]
No [
]
(b) has been subject to such filing requirements for the past 90 days.
Yes [ / ]
No [ ]
Annex “A”
PAL HOLDINGS, INC.
AND SUBSIDIARIES
Quarterly Consolidated Financial Statements
For the Six Months Ended September 30, 2010
PAL HOLDINGS, INC. AND SUBSIDIARIES
CONSOLIDATED STATEMENTS OF FINANCIAL POSITION
(Amounts in Thousands)
September 30,
2010
(Unaudited)
March 31,
2010
(Audited)
ASSETS
Current
Cash andAssets
cash equivalents & available-for-sale
investments
Receivables - net
Expendable parts, fuel, materials and supplies
Other current assets
Total Current Assets
Noncurrent Assets
Property, plant and equipment -net
Deposits on aircraft leases
Deferred tax assets
Available-for-sale-investments
Investment properties
Other noncurrent assets
Total Noncurrent Assets
TOTAL ASSETS
LIABILITIES AND EQUITY
Current Liabilities
Notes payable
Current portion of long-term obligations
Accounts payable
Accrued liabilities
Due to related parties
Unearned transportatin revenue
Total Current Liabilities
Noncurrent Liabilities
Long-term obligations - net of current portion
Accrued employee benefits
Reserves and other noncurrent liabilities
Total Noncurrent Liabilities
TOTAL LIABILITIES
Equity
Capital stock - P 1 par value
Capital in excess of par
Other components of equity:
Cumulative translation adjustment
Net changes in FV of available- for- sale investments
Revaluation increment
Deficit
Treasury Stock
P
P
P
Minority interest
Total Equity
TOTAL LIABILITIES AND EQUITY
P
4,063,589
6,020,471
1,219,555
1,613,738
12,917,353
50,607,621
3,153,747
865,332
540,076
1,310,954
2,554,531
59,032,261
71,949,614
5,805,873
8,076,633
3,797,346
10,885,670
6,097,816
34,663,338
P
P
P
3,397,021
5,839,686
1,234,497
1,775,350
12,246,554
56,469,815
3,152,118
722,844
532,677
1,352,163
2,279,632
64,509,249
76,755,803
6,432,590
8,378,382
5,262,182
11,032,328
481,090
5,997,253
37,583,825
23,554,130
4,952,620
3,919,860
32,426,610
67,089,948
28,941,764
4,724,440
3,810,242
37,476,446
75,060,271
5,421,568
17,998,373
5,421,568
17,517,283
(4,615,163)
82,626
1,069,769
(15,825,264)
(56)
4,131,853
727,813
4,859,666
(4,342,769)
66,440
1,309,159
(18,595,127)
(56)
1,376,498
319,034
1,695,532
71,949,614
P
76,755,803
PAL HOLDINGS, INC. AND SUBSIDIARIES
Note:
CONSOLIDATED STATEMENTS OF COMPREHENSIVE INCOME
(Amounts in Thousands)
( UNAUDITED)
FOR THE THREE MONTHS ENDED
30-Sep-10
30-Sep-09
REVENUE
Passenger
Cargo
Interest income
Others
EXPENSES AND OTHER CHARGES (INCOME)
Flying Operations
Maintenance
Aircraft and traffic servicing
Financing charges
Passenger service
Reservation and sales
General and administrative
Others
P
15,149,730
1,532,684
60,189
1,354,155
18,096,758
P
9,542,608 P
1,886,786
2,338,382
331,421
1,214,822
1,106,554
679,848
(286,678)
16,813,743
NET INCOME (LOSS)
OTHER COMPREHENSIVE INCOME/(LOSS)
Net changes in fair value of available-for-sale
Investments
Net changes in fair value of derivative assets
Increase in revaluation increment due to appraisal
Effect of foreign exchange translation
TOTAL COMPREHENSIVE INCOME (LOSS)
P
1,283,015
P
11,970,191
1,093,302
59,814
1,310,113
14,433,420
FOR THE SIX MONTHS ENDED
30-Sep-10
30-Sep-09
(As restated)
P
8,661,356 P
3,077,624
2,300,282
585,186
1,175,929
1,000,052
850,451
(992,395)
16,658,485
(2,225,065)
(3,948) P
15,840
(340,950)
(237,983)
(567,041)
(79,661) P
(295,049)
(30,341)
(405,051)
32,101,868
3,055,404
102,252
2,263,437
37,522,961
P
19,737,492 P
4,287,870
4,668,332
923,803
2,463,397
2,200,032
1,355,621
(999,813)
34,636,734
2,886,227
25,650,080
1,935,123
116,969
2,419,662
30,121,834
16,334,673
5,716,607
4,578,678
1,526,299
2,443,174
2,000,902
1,731,732
(4,000,282)
30,331,783
(209,949)
409 P
(143,292)
(238,665)
(162,586)
(544,134)
(79,152)
(619,931)
(32,996)
(732,079)
P
715,974
P
(2,630,116) P
2,342,093
P
(942,028)
Net income (loss) attributable to:
Equity Holders of the Parent
Non-controlling Interest
P
P
1,085,869
197,146
P
P
(1,883,536) P
(341,529) P
2,443,870
442,357
P
P
(177,629)
(32,320)
Total comprehensive income (loss) attributable to:
Equity Holders of the Parent
Non-controlling Interest
P
P
607,515
108,459
P
P
(2,226,488) P
(403,628) P
1,985,586
356,507
P
P
(798,147)
(143,881)
EARNINGS (LOSS) PER SHARE
Computed based on net income (loss)
Computed based on total comprehensive income
P
P
0.20
0.11
P
P
(0.35) P
(0.41) P
0.45
0.37
P
P
(0.03)
(0.15)
Earnings per share is determined by dividing net income / total comprehensive income by the number of shares outstanding
Computed based on net income
9/30/2010 six months = P 2,443,870 / 5,421,512
9/30/2009 six months = P (177,629) / 5,421,512
9/30/2010 three months = P 1,085,869 / 5,421,512
9/30/2009 three months = P (1,883,536) / 5,421,512
Computed based on total comprehensive income
9/30/2010 six months = P 1,985,586 / 5,421,512
9/30/2009 six months = P (798,147) / 5,421,512
9/30/2010 three months = P 607,515 / 5,421,512
9/30/2009 three months = P (2,226,488) / 5,421,512
P A L H O LD IN G S , IN C . A N D S UB S ID IA R IE S
C O N S O LID A T E D S T A T E M E N T S O F C H A N G E S IN E Q UIT Y
( A m o unt s in T ho us a nds )
C a pit a l in
E xc e s s
o f P ar
C a pit a l
Sto ck
B A LA N C E S A T M A R C H 3 1, 2 0 0 9 ,
A S R EST A T ED
Net inco me fo r the perio d
Other co mprehensive lo ss
To tal co mprehensive lo ss fo r the year
Effect o f fo reign exchange translatio n
difference
Net effect o f transfer o f po rtio n o f
revaluatio n increment in pro perty
realized thro ugh depreciatio n - net o f
deferred inco me tax , fo reign exchange
adjustment and o ther changes
B A LA N C E S A T S E P T 3 0 . 2 0 0 9
O t he r C o m po ne nt s o f E quit y
N e t C ha nge s
in F a ir
V a lue s o f
C um ula t iv e
A v a ila ble R e v a lua t io n
T ra ns la t io n
f o r- S a le
Inc re m e nt in
A djus t m e nt Inv e s t m e nt s
P ro pe rt y
17 ,5 17 ,2 8 3
-
( 3 ,5 10 ,3 13 )
-
-
(27,938)
-
5 ,4 2 1,5 6 8
17 ,5 17 ,2 8 3
( 4 ,0 5 9 ,4 14 )
5 3 ,7 2 6
(134,387)
1,3 6 2 ,9 15
(134,387)
( 2 ,6 4 2 ,7 7 3 )
134,387
( 18 ,9 8 4 ,2 0 9 )
B A LA N C E S A T M A R C H 3 1, 2 0 10
5 ,4 2 1,5 6 8
A djustment in capital sto ck issued
Net inco me fo r the perio d
Other co mprehensive lo ss
To tal co mprehensive lo ss fo r the year
Effect o f fo reign exchange translatio n
difference
Net effect o f transfer o f po rtio n o f
revaluatio n increment in pro perty
realized thro ugh depreciatio n - net o f
deferred inco me tax , fo reign exchange
adjustment and o ther changes
Net effect o f transfer o f po rtio n o f
revaluatio n increment in pro perty
realized thro ugh dispo sal - net o f
deferred inco me tax , fo reign exchange
adjustment and o ther changes
Co nversio n o f advances fro m parent co mpany to equity
To tal transfer
B A LA N C E S A T S E P T 3 0 , 2 0 10
5 ,4 2 1,5 6 8
17 ,5 17 ,2 8 3
( 4 ,3 4 2 ,7 6 7 )
-
6 6 ,4 3 9
-
1,3 0 9 ,15 8
-
-
( 18 ,5 9 5 ,12 7 )
2,443,870
(134,735)
(134,735)
16,187
16,187
-
( 2 ,9 6 7 ,17 0 )
(118,548)
(118,548)
-
(137,661)
-
-
481,090
481,090
17 ,9 9 8 ,3 7 3
( 4 ,6 15 ,16 3 )
(71,417)
(71,417)
8 2 ,6 2 6
1,4 9 7 ,3 0 2
-
( 1,8 8 7 ,8 6 8 )
(592,580)
(592,580)
-
(27,938)
R e t a ine d
E a rnings
( D e f ic it )
5 ,4 2 1,5 6 8
-
(521,163)
(521,163)
12 5 ,14 3
S ub- t o t a l
T o t a l E quit y
A t t ribut a ble
t o E quit y
T re a s ury H o lde rs o f
Sto ck
t he P a re nt
( 18 ,9 4 1,0 11)
(177,585)
(177,585)
(56)
-
M ino rit y
Int e re s t
T o tal
2 ,10 9 ,9 16
(177,585)
(592,580)
(770,165)
4 4 8 ,4 5 8
(32,313)
(106,503)
(138,816)
2 ,5 5 8 ,3 7 3
(209,898)
(699,083)
(908,981)
(27,938)
(5,058)
(32,996)
1,3 11,8 13
3 0 4 ,5 8 4
1,6 16 ,3 9 6
3 19 ,0 3 4
1,6 9 5 ,5 3 2
2,443,870
1,3 7 6 ,4 9 8
2,443,870
(118,548)
2,325,322
(137,661)
-
(137,661)
(37,314)
(37,314)
37,314
-
-
-
(202,075)
(202,075)
(239,389)
( 3 ,4 6 2 ,7 6 8 )
288,679
86,604
481,090
567,694
4 ,13 1,8 5 3
15,681
102,285
481,090
583,375
4 ,8 5 9 ,6 6 6
(239,389)
1,0 6 9 ,7 6 9
325,993
( 15 ,8 2 5 ,2 6 4 )
(56)
(56)
(56)
442,357
(24,334)
418,023
2,886,227
(142,882)
2,743,345
(24,925)
(162,586)
15,681
7 2 7 ,8 13
PAL HOLDINGS, INC. AND SUBSIDIARIES
CONSOLIDATED STATEMENTS OF CASH FLOWS
(Amounts in Thousands)
(Unaudited)
FOR THE SIX (6) MONTHS ENDED
SEPTEMBER 30,
2010
2009
CASH FLOWS FROM OPERATING ACTIVITIES
Net Income (Loss)
P
2,886,227
P
(209,949)
Adjustments for:
Depreciation
3,504,487
Provision for doubtful accounts,retirement benefits, contingencies and others-net
Gain on buyback of unsecured claims
3,699,418
249,500
352,946
-
Effect of remeasurement of derivative financial instruments
(1,509,638)
(305,971)
Interest income
Dividend income
Operating income (loss) before working capital changes
(2,063,141)
(16)
(29)
(187,774)
(303,243)
6,146,453
(33,636)
Decrease (increase) in:
Receivables
Expendable parts, fuel, materials and supplies
Other current assets
(549,979)
(411,166)
(22,400)
(346,100)
(319,066)
581,911
(344,047)
1,429,117
Increase (decrease) in:
Accounts payable
Due to related parties
(4)
Unearned transportation revenue
Net increase in accrued employee benefits and other noncurrent liabilities
Others
-
281,973
497,004
390,677
399,879
(311,625)
Net cash generated from operations
469,698
5,271,982
Interest received
Net cash provided by (used in) operating activities
2,586,707
16
29
5,271,998
2,586,736
CASH FLOWS FROM INVESTING ACTIVITIES
Additions to property and equipment
(385,714)
Proceeds from disposal of property and equipemnt
Dividend income received
Net decease in short-term investments
(1,490,821)
2,178,043
16,504
187,774
303,243
-
Predelivery payment to Boeing B777 aircraft
13,990
(581,207)
Proceeds from cancellation of predelivery payments
-
320,755
Net changes in other noncurrent assets
-
(326,201)
Net cash used in investing activities
899,301
1,393,450
(257,783)
CASH FLOWS FROM FINANCING ACTIVITIES
Payments of :
Notes payable
Long-term obligations
Advances from related parties
(269,543)
(384,988)
(4,724,363)
(8,320,351)
(878,420)
Net cash used in financing activities
3,210,463
(5,872,326)
(5,494,876)
EFFECT OF EXCHANGE RATE CHANGES
ON CASH AND CASH EQUIVALENTS
(126,555)
NET INCREASE IN CASH AND CASH EQUIVALENTS
CASH AND CASH EQUIVALENTS AT BEGINNING OF PERIOD
CASH AND CASH EQUIVALENTS AT END OF THE PERIOD
(54,942)
666,567
P
3,397,022
4,063,589
(3,220,865)
P
5,836,989
2,616,124
PAL HOLDINGS, INC. AND SUBSIDIARIES
SELECTED EXPLANATORY NOTES
AS OF SEPTEMBER 30, 2010 and 2009
Par. 7 (d) Selected Explanatory Notes Required Under SRC Rule 68.1
i)
The Company’s consolidated interim financial reports are in compliance with generally
accepted accounting principles (GAAP) in the Philippines as set forth in the Philippine
Financial Reporting Standards (PFRS). The financial statements of Philippine Airlines,
Inc were originally presented in United States dollars, which is their functional currency
were restated to Philippine peso for purposes of business combination in accordance with
PAS 27.
ii)
Explanatory comments on the seasonality or cyclicality of interim operations.
PAL experiences a peak in holiday travel during the months of January, April, May, June
and December.
iii)
The nature and amount of items affecting assets, liabilities, equity, net income, or cash
flows which are unusual because of their nature, size, or incidence.
Not applicable. There were no items affecting assets, liabilities, equity, net income,
or cash flows that are unusual because of their nature, size, or incidence.
iv)
The nature and amount of changes in estimates of amounts reported in prior interim
periods of the current financial year or changes in estimates of amounts reported in prior
financial years, if those changes have a material effect in the current interim period.
Not Applicable. There were no changes in estimates of amounts reported in prior
interim periods of the current financial year or changes in estimates of amounts reported
in prior financial years.
v)
Issuances, repurchases, and repayments of debt and equity securities.
Not Applicable. There were no issuances, repurchases, and repayments of debt and
equity securities.
vi)
Dividends paid (aggregate or per share) separately for ordinary shares and other shares.
Not applicable. There were no dividends paid during the period.
vii)
Segment revenue and segment result for business segments or geographical segments,
whichever is the issuer’s primary basis of segment reporting.
Segment Information of Philippine Airlines, Inc.:
PAL has one reportable operating segment, which is the airline business (system-wide). This is
consistent with how the Group’s management internally monitors and analyzes the financial
information for reporting to the chief operating decision-maker, who is responsible for allocating
resources, assessing performance and making operating decisions.
The revenue of the operating segment are mainly derived from rendering transportation services
and all sales are made to external customers.
Revenue
Interest income
Interest expense
Depreciation
Net income (loss)
Quarter Ended
September 2010
P17,338,751
60,189
(331,421)
(1,709,135)
P1,510,106
Quarter Ended
September 2009
P13,647,985
59,802
(585,186)
(1,895,946)
(P1,509,519)
The reconciliation of total revenue reported by reportable operating segment to revenue in the
consolidated statements of comprehensive income is presented in the following table:
Quarter Ended
September 2010
Total segment revenue of reportable
operating segments
Nontransport revenue and other income
Total Revenue
P17,398,940
697,802
P18,096,742
Quarter Ended
September 2009
P13,707,787
720,341
P14,428,128
The reconciliation of total income reported by reportable operating segment to total
comprehensive loss in the consolidated statements of comprehensive income is presented in the
following table:
Quarter Ended
September 2010
Total segment income (loss) of
reportable segments
Add (deduct) unallocated items:
Nontransport revenue and
other income
Nontransport expenses and
other income (charges)
Net income
Other comprehensive income (loss)
Total comprehensive income
P1,510,106
697,802
(921,985)
1,285,923
452
P1,286,375
Quarter Ended
September 2009
(P1,509,519)
720,341
(1,438,512)
(2,227,690)
(374,711)
(P2,602,401)
PAL’s major revenue-producing asset is the fleet owned by the Group, which is employed across
its route network.
viii)
Material events subsequent to the end of the interim period that have not been reflected
in the financial statements for the interim period.
Not applicable. The Company has no material event subsequent to the end of the
interim period that have not been reflected in the financial statements for the interim
period.
ix)
The effect of changes in the composition of the issuer during the interim period,
including business combinations, acquisition or disposal of subsidiaries and long-term
investments, restructurings, and discontinuing operations.
Not applicable. There were no changes in the composition of the Company during
the interim period.
x)
Changes in contingent liabilities or contingent assets since the last annual balance sheet
date.
Not applicable. The Company has no contingent liabilities or assets.
xi)
Existence of material contingencies and any other events or transactions that are material
to an understanding of the current interim period.
Not applicable. There were no contingencies and any other events or transactions
that are material to an understanding of the current interim period.
Annex “B”
PAL HOLDINGS, INC.
AND SUBSIDIARIES
Management Discussion and Analysis of
Financial Condition and Results of Operations
For the period ended September 30, 2010
PART I – FINANCIAL INFORMATION
ITEM 1. Financial Statements
The financial statements form part of this 17Q.
Summary of Significant Accounting and Financial Reporting Policies
Basis of Preparation
The accompanying consolidated financial statements have been prepared using the historical cost
convention, except for land and buildings and improvements which are carried at revalued
amounts and available-for-sale investments and derivative financial instruments which are carried
at fair value. The consolidated financial statements are presented in Philippine peso, the Parent
Company’s functional and presentation currency, and rounded to the nearest thousand, except
when otherwise indicated.
Statement of Compliance
The consolidated financial statements have been prepared in compliance with Philippine
Financial Reporting Standards (PFRS).
Future Changes in Accounting Policies
Following are the new and amended accounting standards and interpretations that will become
effective subsequent to March 31, 2010 and have not been early adopted by the Group.
Effective in fiscal year 2011
•
Revised PFRS 3, Business Combinations and PAS 27, Consolidated and Separate Financial
Statements, introduces a number of changes in the accounting for business combinations that
will impact the amount of goodwill recognized, the reported results in the period that an
acquisition occurs, and future reported results. The revised PAS 27 requires, among others,
that (a) change in ownership interests of a subsidiary (that do not result in loss of control)
will be accounted for as an equity transaction and will have no impact on goodwill nor will it
give rise to a gain or loss; (b) losses incurred by the subsidiary will be allocated between the
controlling and non-controlling interests (previously referred to as “minority interests”); even
if the losses exceed the non-controlling equity investment in the subsidiary; and (c) on loss of
control of a subsidiary, any retained interest will be remeasured to fair value and this will
impact the gain or loss recognized on disposal. The changes introduced by the revised
PFRS 3 must be applied prospectively, while the revised PAS 27 must be applied
retrospectively, with certain exceptions. These changes will affect future acquisitions and
transactions with non-controlling interests.
•
Amendments to PFRS 2, Share-based Payment - Group Cash-settled Share-based Payment
Transactions, clarifies the scope and the accounting for group cash-settled share-based
payment transactions.
•
Amendment to PAS 39, Financial Instruments: Recognition and Measurement - Eligible
Hedged Items, addresses only the designation of a one-sided risk in a hedged item, and the
designation of inflation as a hedged risk or portion in particular situations. The amendment
clarifies that an entity is permitted to designate a portion of the fair value changes or cash
flow variability of a financial instrument as a hedged item.
•
Philippine Interpretation IFRIC 17, Distributions of Non-cash Assets to Owners, covers
accounting for all non-reciprocal distribution of non-cash assets to owners. It provides
guidance on when to recognize a liability, how to measure it and the associated assets, and
when to derecognize the asset and liability and the consequences of doing so. This
interpretation does not apply to a distribution of a non-cash asset that is ultimately controlled
by the same party or parties before and after the distribution.
Improvements to PFRSs 2009
The omnibus amendments to PFRSs released in 2009 were issued primarily to remove
inconsistencies and clarify wordings. The amendments are effective for annual periods
beginning January 1, 2010, except otherwise stated. There are separate transitional provisions for
each standard.
•
PFRS 2, Share-based Payment, clarifies that the contribution of a business on formation of a
joint venture and combinations under common control are not within the scope of PFRS 2
even though they are out of scope of PFRS 3, Business Combinations (Revised).
•
PFRS 5, Non-current Assets Held for Sale and Discontinued Operations, clarifies that the
disclosures required in respect of non-current assets and disposal groups classified as held for
sale or discontinued operations are only those set out in PFRS 5. The disclosure
requirements of other PFRSs only apply if specifically required for such non-current assets or
discontinued operations.
•
PFRS 8, Operating Segments, clarifies that segment assets and liabilities need only be
reported when those assets and liabilities are included in measures that are used by the chief
operating decision maker.
•
PAS 1, Presentation of Financial Statements, clarifies that the terms of a liability that could
result at anytime in its settlement by the issuance of equity instruments at the option of the
counterparty do not affect its classification.
•
PAS 7, Statement of Cash Flows, explicitly states that only expenditure that results in a
recognized asset can be classified as a cash flow from investing activities.
•
PAS 17, Leases, removes the specific guidance on the classification of leases of land. Prior
to the amendment, leases of land were classified as operating leases. The amendment now
requires that leases of land are classified as either “finance” or “operating” in accordance
with the general principles of PAS 17. The amendments will be applied retrospectively.
•
PAS 36, Impairment of Assets, clarifies that the largest unit permitted for allocating goodwill,
acquired in a business combination, is the operating segment as defined in PFRS 8 before
aggregation for reporting purposes.
•
PAS 38, Intangible Assets, clarifies that if an intangible asset acquired in a business
combination is identifiable only with another intangible asset, the acquirer may recognize the
group of intangible assets as a single asset provided the individual assets have similar useful
lives. Also clarifies that the valuation techniques presented for determining the fair value of
intangible assets acquired in a business combination that are not traded in active markets are
only examples and are not restrictive on the methods that can be used.
•
PAS 39, Financial Instruments: Recognition and Measurement, clarifies the following:
(a) that a prepayment option is considered closely related to the host contract when the
exercise price of a prepayment option reimburses the lender up to the approximate present
value of lost interest for the remaining term of the host contract; (b) that the scope exemption
for contracts between an acquirer and a vendor in a business combination to buy or sell an
acquiree at a future date applies only to binding forward contracts, and not derivative
contracts where further actions by either party are still to be taken; and (c) that gains or losses
on cash flow hedges of a forecast transaction that subsequently results in the recognition of a
financial instrument or on cash flow hedges of recognized financial instruments should be
reclassified in the period that the hedged forecast cash flows affect profit or loss.
•
Philippine Interpretation IFRIC 9, Reassessment of Embedded Derivatives, clarifies that it
does not apply to possible reassessment at the date of acquisition, to embedded derivatives in
contracts acquired in a business combination between entities or businesses under common
control or the formation of joint venture.
•
Philippine Interpretation IFRIC 16, Hedge of a Net Investment in a Foreign Operation, states
that, in a hedge of a net investment in a foreign operation, qualifying hedging instruments
may be held by any entity or entities within the group, including the foreign operation itself,
as long as the designation, documentation and effectiveness requirements of PAS 39 that
relate to a net investment hedge are satisfied.
Effective in fiscal year 2013
•
Philippine Interpretation IFRIC 15, Agreement for Construction of Real Estate, covers
accounting for revenue and associated expenses by entities that undertake the construction of
real estate directly or through subcontractors. This interpretation requires that revenue on
construction of real estate be recognized only upon completion, except when such contract
qualifies as construction contract to be accounted for under PAS 11, Construction Contracts,
or involves rendering of services in which case revenue is recognized based on stage of
completion.
The Group is currently assessing the impact of these accounting standards, amendments and
interpretations. The effects and required disclosures of the adoption of the relevant standards,
amendments and interpretations, if any, will be included in the consolidated financial statements
when these are adopted subsequent to fiscal year 2010.
Consolidation
The consolidated financial statements consist of the financial statements of the Parent Company
and its subsidiaries. The financial statements of the subsidiaries are prepared using consistent
accounting policies as those of the Parent Company. The following are subsidiaries of the Parent
Company as of September 30, 2010.
Nature of Operations
Percentage of Ownership
Through direct holdings:
PAL
PR
Air transport
Holding company
81.57%
82.33%*
Through indirect holdings:
Abacus Distribution Systems
Philippines, Inc.
Pacific Aircraft Ltd.
Pearl Aircraft Ltd.
Peerless Aircraft Ltd.
Synergy Services Corp.
Lessor of computerized
reservations systems
Aircraft financingrelated company
Aircraft financingrelated company
84.67%
Aircraft financingrelated company
84.67%
Manpower supply
54.19%
70.23%
84.67%
* Indirect holdings in PAL is 3.8%
Subsidiaries are consolidated from the date on which control is transferred to the Group and
cease to be consolidated from the date on which control is transferred out of the Group. All
intercompany accounts and transactions with subsidiaries are eliminated in full.
The equity and net income attributable to minority interests of the consolidated subsidiaries are
recognized and, where material, are shown separately in the consolidated statement of financial
position and consolidated statement of comprehensive income, respectively.
Minority interest represents the interest in a subsidiary, which is not owned, directly or indirectly
through subsidiaries, by the Parent Company. If losses applicable to the minority interest in a
subsidiary exceed the minority interest’s equity in the subsidiary, the excess, and any further
losses applicable to the minority interest, are charged against the majority interest except to the
extent that the minority has a binding obligation to, and is able to, make good the losses. If the
subsidiary subsequently reports profits, the majority interest is allocated all such profits until the
minority interest’s share of losses previously absorbed by the majority interest has been
recovered.
Cash and Cash Equivalents
Cash includes cash on hand and in banks. Cash equivalents are short-term, highly liquid
investments that are readily convertible to known amounts of cash with original maturities of
three months or less from dates of acquisition and that are subject to an insignificant risk of
change in value.
Financial and Derivative Instruments
The Group recognizes a financial asset or a financial liability in the consolidated statement of
financial position when it becomes a party to the contractual provisions of the instrument. All
regular way purchases and sales of financial assets are recognized on the trade date, i.e., the date
the Group commits to purchase the assets. Regular way purchases or sales are purchases or sales
of financial assets that require the delivery of assets within the period generally established by
regulation or convention in the market place.
The fair value for financial instruments including derivatives traded in active markets at the
statement of financial position date is based on their quoted market prices or dealer price
quotations (bid price for long positions and ask price for short positions), without any deduction
for transaction costs. When current bid and asking prices are not available, the price of the most
recent transaction is used since it provides evidence of the current fair value as long as there has
not been a significant change in economic circumstances since the time of the transaction.
For all other financial instruments not listed in an active market, the fair value is determined by
using appropriate valuation techniques. Valuation techniques include discounted cash flow
methodologies, comparison to similar instruments for which market observable prices exist,
option pricing models, and other relevant valuation models. In the absence of a reliable basis of
determining fair value, investments in unquoted equity securities are carried at cost, net of
impairment.
Financial instruments are classified as debt or equity in accordance with the substance of the
contractual arrangement. Interest, dividends, gains, and losses relating to a financial instrument
classified as a debt, are reported as expense or income. Distributions to holders of financial
instruments classified as equity are charged directly to equity.
Financial assets are classified as either financial assets at fair value through profit or loss, loans
and receivables, held-to-maturity investments or available-for-sale investments, as appropriate.
Financial liabilities are classified as either financial liabilities at fair value through profit or loss
or other financial liabilities.
When financial assets and financial liabilities are recognized initially, they are measured at fair
value. In the case of financial assets not classified as at fair value through profit or loss and other
liabilities, fair value at initial recognition includes any directly attributable transaction cost. The
Group determines the classification of its financial instruments upon initial recognition and,
where allowed and appropriate, reevaluates this designation at each financial year-end.
Financial assets and financial liabilities carried in the Group’s consolidated statement of financial
position include cash and cash equivalents, short-term investments, receivables, available-for-sale
investments, deposits on aircraft leases, short-term and long-term obligations, and derivative
instruments such as fuel, interest rate and currency derivative instruments.
“Day 1” difference
Where the transaction price in a non-active market is different to the fair value from other
observable current market transactions in the same instrument or based on a valuation technique
whose variables include only data from observable market, the Group recognizes the difference
between the transaction price and the fair value (a “Day 1” difference) in the consolidated
statement of comprehensive income. In cases where use is made of data which is not observable,
the difference between the transaction price and model value is only recognized in the
consolidated net income or loss when the inputs become observable or when the instrument is
derecognized. For each transaction, the Group determines the appropriate method of recognizing
the “Day 1” difference amount.
Financial Assets and Financial Liabilities at Fair Value Through Profit or Loss
Financial assets and financial liabilities at fair value through profit or loss include financial
instruments held for trading and financial instruments designated upon initial recognition as at
fair value through profit or loss.
Financial assets are classified as held for trading if they are acquired for the purpose of selling in
the near term. Derivatives, including separated embedded derivatives, are also classified as held
for trading unless they are designated as effective hedging instruments or a financial guarantee
contract. Gains or losses on investments held for trading are recognized in the consolidated
statements of comprehensive income. Interest earned or incurred and dividend income is recorded
when the right of payments has been established.
Where a contract contains one or more embedded derivatives, the hybrid contract may be
designated as financial asset at FVPL, except where the embedded derivative does not
significantly modify the cash flows or it is clear that separation of the embedded derivative is
prohibited.
Financial instruments may be designated as at fair value through profit or loss by management on
initial recognition when the following criteria are met:
•
The designation eliminates or significantly reduces the inconsistent treatment that would
otherwise arise from measuring the assets and liabilities or recognizing gains or losses on
them on a different basis, or
•
The assets or liabilities are part of a group of financial assets or financial liabilities, or both
financial assets and financial liabilities, which are managed and their performance is
evaluated on a fair value basis, in accordance with a documented risk management or
investment strategy, or
•
The financial instrument contains an embedded derivative, unless the embedded derivative
does not significantly modify the cash flows or it is clear, with little or no analysis, that it
would not be separately recorded.
Assets and liabilities classified under this category are carried at fair value in the consolidated
statement of financial position, with any gains or losses being recognized in the consolidated net
income or loss.
The Group accounts for its derivative transactions (including embedded derivatives) under this
category with fair value changes being reported directly to profit or loss, except when the
derivative is treated as an effective accounting hedge, in which case the fair value change is
either reported in profit or loss with the corresponding adjustment from the hedged transaction
(fair value hedge) or deferred in equity (cash flow hedge) under “Cumulative Translation
Adjustment” account.
Loans and Receivables
Loans and receivables are nonderivative financial assets with fixed or determinable payments that
are not quoted in an active market. This category includes trade receivables arising from
operations, deposits for aircraft leases and security and refundable deposits. Such assets are
carried at amortized cost using the effective interest rate method. Gains and losses are
recognized in income when the loans and receivables are derecognized or impaired, and through
the amortization process. Loans and receivables are included in current assets if maturity is
within 12 months from the statement of financial position date. Otherwise, these are classified as
noncurrent assets.
The Group classified its cash equivalents, short-term investments, accounts receivable, margin
deposits and lease deposits as loans and receivables.
Held-to-Maturity Investments
Held-to-maturity investments are quoted nonderivative financial assets with fixed or
determinable payments and fixed maturities are classified as held-to-maturity when the Group has
the positive intention and ability to hold them to maturity. Investments intended to be held for an
undefined period are not included in this classification. Where the Group sells other than an
insignificant amount of held-to-maturity investments, the entire category would be tainted and
reclassified as available-for-sale investments. Other long-term investments that are intended to
be held-to-maturity, such as bonds, are subsequently measured at amortized cost. This cost is
computed as the amount initially recognized minus principal repayments, plus or minus the
cumulative amortization using the effective interest method of any difference between the
initially recognized amount and the maturity amount. This calculation includes fees paid or
received between parties to the contract that are an integral part of the effective interest rate,
issuance costs and all other premiums and discounts. For investments carried at amortized cost,
gains and losses are recognized in income when the investments are derecognized or impaired,
and through the amortization process. Assets under this category are classified as current assets if
maturity is within 12 months from the statement of financial position date. Otherwise, these are
classified as noncurrent assets.
Available-for-sale Investments
Available-for-sale investments are nonderivative financial assets that are designated as availablefor-sale or are not classified in any of the three preceding categories. After initial recognition,
available-for-sale investments are measured at fair value with gains or losses being recognized as
part of other comprehensive income until the investment is derecognized or until the investment
is determined to be impaired at which time the cumulative gain or loss previously reported in
equity is included in the consolidated net income or loss in the consolidated statement of
comprehensive income. The effective yield and (where applicable) results of foreign exchange
restatement for available-for-sale investments are reported immediately in the consolidated net
income or loss. These financial assets are classified as noncurrent assets unless the intention is to
dispose such assets within 12 months from the statement of financial position date.
Other Financial Liabilities
Other financial liabilities pertain to financial liabilities that are not held for trading nor
designated as at fair value through profit or loss upon the inception of the liability. These include
liabilities arising from operations (e.g., payables and accruals) or borrowings (e.g., Long-term
obligations).
The liabilities are recognized initially at fair value and are subsequently carried at amortized cost,
taking into account the impact of applying the effective interest rate method of amortization (or
accretion) for any related premium, discount and any directly attributable transaction costs.
Derivatives and Hedge Accounting
Freestanding derivatives
For the purpose of hedge accounting, hedges are classified primarily either as: a) a hedge of the
fair value of an asset, liability or a firm commitment (fair value hedge); or b) a hedge of the
exposure to variability in cash flows attributable to an asset or liability or a forecasted transaction
(cash flow hedge); or hedge of a net investment in a foreign operation. The Group did not
designate any of its derivatives as fair value hedges. The Group designated its pay-fixed, receivefloating interest rate swaps and certain fuel derivatives as cash flow hedges.
At the inception of a hedge relationship, the Group formally designates and documents the hedge
relationship to which the Group wishes to apply hedge accounting and the risk management
objective and strategy for undertaking the hedge. The documentation includes identification of
the hedging instrument, the hedged item or transaction, the nature of the risk being hedged and
how the entity will assess the hedging instrument’s effectiveness in offsetting the exposure to
changes in the hedged item’s fair value or cash flows attributable to the hedged risk. Such
hedges are assessed on an ongoing basis to determine that they actually have been highly
effective throughout the financial reporting periods for which they were designated.
In cash flow hedges, changes in the fair value of a hedging instrument that qualifies as a highly
effective cash flow hedge are included in the consolidated statement of changes in equity under
“Cumulative translation adjustment” account, net of related deferred tax. The ineffective portion
is immediately recognized as part of “Other Income or Expense” in the consolidated statement of
comprehensive income.
For cash flow hedges with critical terms that match those of the hedged items and where there are
no basis risks (such as the pay-fixed, receive-floating interest rate swaps), the Group expects the
hedges to exactly offset changes in expected cash flows relating to the hedged risk (e.g.,
fluctuations in fuel price and benchmark interest rates). This assessment on hedge effectiveness
is performed on a quarterly basis by the Group by comparing the critical terms of the hedges and
the hedged items to ensure that they continue to match and by evaluating the continued ability of
the counterparties to perform their obligations under the derivative contracts.
For cash flow hedges with basis risks (such as crude oil derivatives entered into as proxy hedges
for forecasted jet fuel purchases), the Group assesses the effectiveness of its hedges (both on a
prospective and retrospective basis) by using a regression model to determine the correlation of
the percentage change in prices of underlying commodities used to hedge jet fuel to the
percentage change in prices of jet fuel over a specified period that is consistent with the hedge
time horizon or 30 data points whichever is longer.
If the hedged cash flow results in the recognition of an asset or a liability, gains and losses
initially recognized in equity are transferred from equity to income or loss in the same period or
periods during which the hedged forecasted transaction or recognized asset or liability affect the
consolidated statement of comprehensive income.
When the hedge ceases to be highly effective, hedge accounting is discontinued prospectively. In
this case, the cumulative gain or loss on the hedging instrument that has been reported directly in
equity is retained in equity until the forecasted transaction occurs. When the forecasted
transaction is no longer expected to occur, any net cumulative gain or loss previously reported in
equity is charged against the consolidated statement of comprehensive income.
For derivatives that are not designated as effective accounting hedges, any gains or losses arising
from changes in fair value of derivatives are recognized directly in the consolidated statement of
comprehensive income.
Embedded derivatives
Embedded derivatives are accounted for at fair value through profit or loss when the entire hybrid
contracts (composed of the host contract and the embedded derivative) are not accounted for at
fair value through profit or loss the economic risks of the embedded derivatives are not closely
related to those of their respective host contracts, and a separate instrument with the same terms
as the embedded derivative would meet the definition of a derivative.
Embedded derivatives that are bifurcated from the host contracts are accounted for as financial
assets at fair value through profit or loss. Changes in fair values are included in the consolidated
statement of comprehensive income. Derivatives are carried as assets when the fair value is
positive and as liabilities when the fair value is negative.
The Group assesses whether an embedded derivative is required to be separated from the host
contract and accounted for as a derivative when the entity first becomes a party to the contract.
Subsequent reassessment is prohibited unless there is a change in the terms of the contract that
significantly modifies the cash flows that otherwise would be required under the contract, in
which case reassessment is required. The Group determines whether a modification to cash flows
is significant by considering the extent to which the expected future cash flows associated with
the embedded derivative, the host contract or both have changed and whether the change is
significant relative to the previously expected cash flows on the contract.
Derecognition of Financial Assets and Financial Liabilities
A financial asset (or, where applicable, a part of a financial asset or part of a group of similar
financial assets) is derecognized when:
•
the rights to receive cash flows from the asset have expired;
•
the Group retains the right to receive cash flows from the asset, but has assumed an
obligation to pay them in full without material delay to a third party under a “pass-through”
arrangement; or
•
the Group has transferred its rights to receive cash flows from the asset and either (a) has
transferred substantially all the risks and rewards of the asset, or (b) has neither transferred
nor retained substantially all the risks and rewards of the asset, but has transferred control of
the asset.
When the Group has transferred its rights to receive cash flows from an asset and has neither
transferred nor retained substantially all the risks and rewards of the asset nor transferred control
of the asset, the asset is recognized to the extent of the Group’s continuing involvement in the
asset.
A financial liability is derecognized when the obligation under the liability is discharged,
cancelled or has expired.
When an existing financial liability is replaced by another from the same lender on substantially
different terms, or the terms of an existing liability are substantially modified, such modification
is treated as a derecognition of the carrying value of the original liability and the recognition of a
new liability at fair value, and any resulting difference is recognized in profit or loss.
Impairment of Financial Assets
The Group assesses at each statement of financial position date whether there is objective
evidence that a financial asset may be impaired.
Financial assets carried at amortized cost
For financial assets carried at amortized cost, whenever it is probable that the Group will not
collect all amounts due according to the contractual terms of receivables, an impairment loss has
been incurred. The amount of the loss is measured as the difference between the asset’s carrying
amount and the present value of estimated future cash flows discounted at the financial asset’s
original effective interest rate. The carrying amount of the asset is reduced either directly or
through the use of an allowance account. Any loss determined is recognized in income.
The Group initially assesses whether objective evidence of impairment exists individually for
financial assets that are individually significant, and individually or collectively for financial
assets that are not individually significant. If it is determined that no objective evidence of
impairment exists for an individually assessed financial asset, whether significant or not, the
asset is included in a group of financial assets with similar credit risk characteristics and that
group of financial assets is collectively assessed for impairment. Assets that are individually
assessed for impairment and for which an impairment loss is or continues to be recognized are
not included in a collective assessment of impairment.
In relation to trade receivables, a provision for impairment is made when there is objective
evidence (such as the probability of insolvency or significant financial difficulties of the debtor)
that the Group will not be able to collect all of the amounts due under the original terms of the
invoice. The carrying amount of the receivable is reduced through the use of an allowance
account. Impaired receivables are derecognized when they are assessed as uncollectible.
Receivables, together with the associated allowance accounts, are written off when there is no
realistic prospect of future recovery and all collateral has been realized. If, in a subsequent
period, the amount of the estimated impairment loss decreases because of an event occurring
after the impairment was recognized, the previously recognized impairment loss is reversed. Any
subsequent reversal of an impairment loss is recognized in profit or loss, to the extent that the
carrying value of the asset does not exceed its amortized cost at the reversal date.
Assets carried at cost
If there is objective evidence that an impairment loss on financial assets carried at cost such as an
unquoted equity instrument that is not carried at fair value because its fair value cannot be
reliably measured, or on a derivative asset that is linked to and must be settled by delivery of such
an unquoted equity instrument has been incurred, the amount of the loss is measured as the
difference between the asset’s carrying amount and the present value of estimated future cash
flows discounted at the current market rate of return for a similar financial asset.
Available-for-sale (AFS) investments
In case of equity investments classified as AFS financial assets, impairment would include a
significant or prolonged decline in the fair value of the investments below its cost. Where there
is evidence of impairment loss, the cumulative loss - measured as the difference between the
acquisition cost and the current fair value, less any impairment loss on that financial asset
previously recognized in income - is removed from equity and recognized in income. Impairment
losses on equity investments are not reversed through income. Increases in fair value after
impairment are recognized directly in the consolidated statement of changes in equity.
In the case of debt instruments classified as AFS, impairment is assessed based on the same
criteria as financial assets carried at amortized cost. Interest continues to be accrued at the
original effective interest rate on the reduced carrying amount of the asset and is recorded in
income. If, in subsequent year, the fair value of a debt instrument increased and the increase can
be objectively related to an event occurring after the impairment loss was recognized in income,
the impairment loss is reversed through income.
Offsetting Financial Instruments
Financial assets and financial liabilities are offset and the net amount reported in the consolidated
statement of financial position if, and only if, there is a currently enforceable legal right to offset
the recognized amounts and there is an intention to settle on a net basis, or to realize the asset and
settle the liability simultaneously. This is not generally the case with master netting agreements,
and the related assets and liabilities are presented gross in the consolidated statement of financial
position.
Expendable Parts, Fuel, Materials and Supplies
Expendable parts, fuel, materials and supplies are stated at the lower of cost and net realizable
value. Cost is determined using the weighted average method. Net realizable value represents the
current replacement cost.
Asset Held-for-Sale
Noncurrent assets and disposal groups are classified as held-for-sale if their carrying amount will
be recovered principally through a sale transaction rather than through continuing use. This
condition is considered met only when the sale is highly probable and the asset (or disposal
group) is available for immediate sale at its present condition. Management must be committed
to the sale, which should be expected to qualify for recognition as a completed sale within one
year from the date of classification. However, events or circumstances may extend the period to
complete the sale beyond one year. An extension of the period required to complete a sale does
not preclude an asset (or disposal group) from being classified as held-for-sale if the delay is
caused by events or circumstances beyond the Group’s control and there is sufficient evidence
that the entity remains committed to its plan to sell the asset (or disposal group).
Property and Equipment
Property and equipment (except land and buildings and improvements) are stated at cost less
accumulated depreciation and any impairment in value. Land is stated at revalued amount, less
any impairment in value. Buildings and improvements are stated at revalued amounts less
accumulated depreciation and any impairment in value. Revalued amounts were determined
based on valuations undertaken by professionally qualified appraisers. Revaluations are made
with sufficient regularity. The latest appraisal report is as of March 31, 2009.
For subsequent revaluations, the accumulated depreciation at the date of the revaluation is
eliminated against the gross carrying amount of the asset and the net amount restated to the
revalued amount of the asset. Any resulting increase in the asset’s carrying amount as a result of
the revaluation is recognized as other comprehensive income credited directly to equity as
Revaluation increment in property, net of the related deferred tax liability. Any resulting
decrease is directly charged against the related revaluation increment to the extent that the
decrease does not exceed the amount of the revaluation increment in respect of the same asset.
The initial cost of property and equipment comprises its purchase price, any related capitalizable
borrowing costs attributed to progress payments incurred on account of aircraft acquisition and
other significant assets under construction and other directly attributable costs of bringing the
asset to its working condition and location for its intended use. Manufacturers’ credits that
reduce the price of the aircraft, received from aircraft and engine manufacturers are recorded
upon delivery of the related aircraft and engines. Such credits are applied as a reduction from the
cost of the property and equipment (including those under finance lease).
Expenditures incurred after the property and equipment have been put into operation, such as
repairs and maintenance costs, are normally charged to income in the period in which the costs
are incurred. In situations where it can be clearly demonstrated that the expenditures have
resulted in an increase in the future economic benefits expected to be obtained from the use of an
item of property and equipment beyond its originally assessed standard of performance, the
expenditures are capitalized as additional cost of property and equipment.
Depreciation, which commences when the asset is available for use, is computed on a straightline basis over the following estimated useful lives of the assets:
Buildings and improvements
Passenger aircraft (owned and under finance lease)
Other aircraft
Spare engines
Number of Years
8 to 40
12 to 20
5 to 10
12 to 20
Rotable and reparable parts
Other ground property and equipment
3 to 18
3 to 8
Expenditures for heavy maintenance on passenger aircraft are capitalized at cost and depreciated
over the estimated number of years until the next major overhaul or inspection. Generally,
heavy maintenance visits are required every five to six years for airframe and 10 years for
landing gear. Other maintenance and repair costs are expensed as incurred.
The estimated useful lives, depreciation method and residual values are reviewed periodically to
ensure that the periods and method of depreciation and residual values are consistent with the
expected pattern of economic benefits from items of property and equipment. Any changes in
estimate arising from the review are accounted for prospectively.
When assets are sold or retired, their costs, accumulated depreciation and any impairment in
value and related revaluation increment are eliminated from the accounts. Any gain or loss
resulting from their disposal is recognized as income and included in the consolidated statement
of comprehensive income.
The portion of Revaluation increment in property, net of related deferred tax, realized through
depreciation or upon the disposal or retirement of the property is transferred to retained earnings.
Construction in progress represents the cost of aircraft and engine modifications in progress and
buildings and improvements and other ground property under construction. Construction in
progress is not depreciated until such time when the relevant assets are completed and available
for use.
Asset Retirement Obligation
PAL is required under various aircraft lease agreements to restore the leased aircraft to their
original condition and to bear the cost of dismantling and restoration at the end of the lease term.
PAL provides for these costs over the terms of the leases, based on aircraft hours flown until the
next scheduled checks.
Investment Properties
Investment properties include parcels of land and building and building improvements not used in
operations.
Investment properties are measured initially at cost, including any transaction costs. The
carrying amount includes the cost of replacing part of an existing investment property at the time
that cost is incurred if the recognition criteria are met; and excludes the costs of day-to-day
servicing of an investment property.
Investment properties are subsequently measured at cost less accumulated depreciation (except
land) and any impairment in value. Land is subsequently carried at cost less any impairment in
value.
Depreciation and amortization of depreciable investment properties is calculated on a straightline basis over the estimated useful lives ranging from six to eight years.
Transfers are made to investment properties when, and only when, there is a change in use,
evidenced by cessation of owner-occupation, commencement of an operating lease to another
party or completion of construction or development. Transfers are made from investment
properties when, and only when, there is a change in use, evidenced by commencement of owneroccupation or commencement of development with a view to sale.
When an item of property and equipment previously carried at revalued amount is transferred to
investment properties, the carrying value at the date of reclassification is treated as the deemed
cost of the investment property. The corresponding revaluation increment, net of the related
deferred tax liability, of the asset is retained in equity and released to retained earnings when the
asset is derecognized.
Investment properties are derecognized when they are either disposed of or permanently
withdrawn from use and no future economic benefit is expected from its disposal. Any gains or
losses on the retirement or disposal of an investment property are recognized as income in the
consolidated statement of comprehensive income in the year of retirement or disposal.
Impairment of Property and Equipment and Investment Properties
The carrying values of property and equipment and investment properties are reviewed for
impairment when events or changes in circumstances indicate that the carrying values may not be
recoverable. If any such indication exists and where the carrying values exceed the estimated
recoverable amounts, the assets or cash generating units are written down to their recoverable
amounts. The recoverable amount is the greater of net selling price and value in use. In
assessing value in use, the estimated future cash flows are discounted to their present value using
a pretax discount rate that reflects current market assessments of the time value of money and the
risks specific to the asset. For an asset that does not generate largely independent cash inflows,
the recoverable amount is determined for the cash generating unit to which the asset belongs.
Impairment losses, if any, are recognized as expense in the consolidated profit or loss.
Leases
The determination of whether the arrangement is, or contains a lease is based on the substance of
the arrangement at inception date of whether the fulfillment of the arrangement depends on the
use of a specific asset or assets or the arrangement conveys a right to use the asset. A
reassessment is made after the inception of the lease, if any, if the following applies: (a) there is a
change in contractual terms, other than a renewal or extension of the arrangement; (b) a renewal
option is exercised or extension granted, unless the term of the renewal or extension was initially
included in the lease term; (c) there is a change in the determination of whether fulfillment is
dependent on a specified asset; or (d) there is substantial change to the asset.
Where the reassessment is made, lease accounting shall commence or cease from the date when
the change in circumstances gave rise to the reassessment for scenarios (a), (c), or (d) above, and
at the date of renewal or extension period for scenario (b).
Group as Lessee
Finance leases, which transfer to the Group substantially all the risks and benefits incidental to
ownership of the leased item, are capitalized at the inception of the lease at the fair value of the
leased property or, if lower, at the present value of the minimum lease payments. Obligations
arising from aircraft under finance lease agreements are classified in the consolidated statements
of financial position as part of “Long-term obligations”.
Lease payments are apportioned between financing charges and reduction of the lease liability so
as to achieve a constant rate of interest on the remaining balance of the liability. Financing
charges are charged directly against income.
Leases where the lessor retains substantially all the risks and benefits of ownership of the asset
are classified as operating leases. Operating lease expense is recognized in the consolidated
statement of comprehensive income on a straight-line basis over the terms of the lease
agreements.
Group as Lessor
Leases where the Group does not transfer substantially all the risks and rewards of ownership of
the assets are classified as operating leases. Initial direct costs incurred in negotiating operating
leases are added to the carrying amount of the leased asset and recognized over the lease term on
the same basis as the rental income. Contingent rents are recognized as revenue in the period in
which they are earned.
Provisions and Contingencies
Provisions are recognized when (a) the Group has a present obligation (legal or constructive) as a
result of a past event; (b) it is probable that an outflow of resources embodying economic
benefits will be required to settle the obligation; and (c) a reliable estimate of the amount of the
obligation can be made. Where the Group expects a provision to be reimbursed, for example
under an insurance contract, the reimbursement is recognized as a separate asset but only when
the reimbursement is virtually certain. If the effect of the time value of money is material,
provisions are determined by discounting the expected future cash flows at a pretax rate that
reflects current market assessments of the time value of money and, where appropriate, the risks
specific to the liability. Where discounting is used, the increase in the provision due to the
passage of time is recognized as interest expense.
Contingent liabilities are not recognized in the consolidated statement of financial position. They
are disclosed in the notes to consolidated financial statements unless the possibility of an outflow
of resources embodying economic benefits is remote. A contingent asset is not recognized in the
consolidated statement of financial position but disclosed in the notes to consolidated financial
statements when an inflow of economic benefits is probable. If it is virtually certain that an
inflow of economic benefits will arise, the asset and the related income are recognized in the
consolidated financial statements.
Equity
Capital stock is measured at par value for all shares issued. Incremental costs incurred directly
attributable to the issuance of new shares are shown in equity as a deduction from proceeds, net
of tax.
When the shares are sold at premium, the difference between the proceeds and the par value is
credited to the “Capital in excess of par” account.
Deficit represents the cumulative balance of net income or loss, net of any dividend declaration
and other capital adjustments.
Revenue and Related Commissions
Passenger ticket and cargo waybill sales are initially recorded as “Unearned transportation
revenue” in the consolidated statement of financial position until recognized as “Revenue” in the
consolidated statement of comprehensive income when the transportation service is rendered
(e.g., when passengers and cargo are lifted). Revenue is measured at fair value of the
consideration received of receivable. Revenue also includes recoveries from surcharges during
the year.
The related commission is recognized as expense in the same period when the transportation
service is provided and is included as part of “Reservation and sales” in the consolidated
statement of comprehensive income.
Liability Under Frequent Flyer Program
PAL operates a frequent flyer program called “Mabuhay Miles.” A portion of passenger revenue
attributable to the award of frequent flyer miles, estimated based on expected utilization of these
benefits, is deferred until utilized. The miles expected to be redeemed are measured at fair value
which is estimated using the applicable fare based on the historical redemption. The deferred
revenue is included under “Reserves and other noncurrent liabilities” in the consolidated
statement of financial position. Any remaining unutilized benefits are recognized as revenue
upon redemption or expiry.
Other Comprehensive Income
Other comprehensive income comprises items of income and expense (including items previously
presented under the consolidated statement of changes in equity) that are not recognized in profit
or loss for the year in accordance with PFRS. Other comprehensive income of the Group
includes changes in revaluation increment in property, gains and losses on remeasuring availablefor-sale financial assets, and any effective portion of gains and losses on hedging instruments in
cash flow hedges.
Interest and Dividend Income
Interest on cash, cash equivalents and other short-term cash investments and investments in bonds
is recognized as the interest accrues using the effective interest rate method. Dividend income
from available-for-sale equity investments is recognized when the Group’s right to receive
payment is established.
Retirement Benefits Cost
Retirement benefits cost under the defined benefit plan is actuarially determined using the
projected unit credit method. This method reflects services rendered by employees up to the date
of valuation and incorporates assumptions concerning employees’ projected salaries. Actuarial
valuations are conducted with sufficient regularity with option to accelerate when significant
changes to underlying assumptions occur. Actuarial gains and losses are recognized as income or
expense when the net cumulative unrecognized actuarial gains and losses for the plan at the end
of the previous reporting year exceeded 10% of the higher of the present value of defined benefit
obligation and the fair value of plan assets at that date. These gains or losses are recognized over
the expected average remaining working lives of the employees participating in the plan.
Past service cost is recognized as an expense on a straight-line basis over the average period
when the benefits become vested. If the benefits are already vested immediately following the
introduction of, or changes to, the retirement plan, past service cost is recognized immediately.
Retirement benefits cost includes current service cost, interest cost, amortization of unrecognized
past service costs, actuarial gains and losses, experience adjustments, effect of any curtailment or
settlement and changes in actuarial assumptions over the expected average remaining working
lives of covered employees. The defined benefit liability is the aggregate of the present value of
the defined benefit obligation and actuarial gains and losses not recognized, reduced by past
service cost not yet recognized, and the fair value of plan assets out of which the obligations are
to be settled directly. If such aggregate is negative, the asset is measured at the lower of such
aggregate or the aggregate of cumulative unrecognized net actuarial losses and past service cost
and the present value of any economic benefits available in the form of refunds from the plans or
reductions in the future contributions to the plan.
Retirement benefits cost under the defined contribution plan is based on the established amount
of contribution and is recognized as expense in the same year as the related employee services are
rendered.
Borrowing Costs
Borrowing costs are generally expensed as incurred. Borrowing costs are capitalized if they are
directly attributable to the acquisition or construction of a qualifying asset. Capitalization of
borrowing costs commences when the activities to prepare the asset are in progress and
expenditures and borrowing costs are being incurred. Borrowing costs are capitalized until the
assets are substantially ready for their intended use.
Income Taxes
Current income tax
Current income tax assets and liabilities for the current and prior periods are measured at the
amount expected to be recovered from or paid to the taxation authorities. The tax rates and tax
laws used to compute the amounts are those that have been enacted or substantively enacted as of
the statement of financial position date.
Deferred income tax
Deferred income tax is provided, using the balance sheet liability method, on all temporary
differences at the statement of financial position date between the tax bases of assets and
liabilities and their carrying amounts for financial reporting purposes.
Deferred income tax liabilities are recognized for all taxable temporary differences, including
asset revaluations. Deferred income tax assets are recognized for all deductible temporary
differences, carryforward benefits of unused tax credits and unused net operating loss carryover
(NOLCO), to the extent that it is probable that sufficient taxable profit will be available against
which the deductible temporary differences and carryforward benefits of unused tax credits and
unused NOLCO can be utilized. Deferred income tax, however, is not recognized when it arises
from the initial recognition of an asset or liability in a transaction that is not a business
combination and, at the time of the transaction, affects neither the accounting profit nor taxable
profit or loss.
Deferred income tax liabilities are not provided on nontaxable temporary differences associated
with investments in domestic subsidiaries and associates. With respect to investments with other
subsidiaries and associates, deferred income tax liabilities are recognized except where the timing
of reversal of the temporary differences can be controlled and it is probable that the temporary
difference will not reverse in the foreseeable future.
The carrying amount of deferred income tax assets is reviewed at each statement of financial
position date and reduced to the extent that it is no longer probable that sufficient taxable profit
will be available to allow all or part of the deferred income tax asset to be utilized. Unrecognized
deferred income tax assets are reassessed at each statement of financial position date and are
recognized to the extent that it has become probable that future taxable profit will allow the
deferred income tax asset to be recovered.
Deferred income tax assets and deferred income tax liabilities are measured at the tax rates that
are expected to apply to the period when the asset is realized or the liability is settled, based on
tax rates and tax laws that have been enacted or substantively enacted as of statement of the
financial position date.
Income tax relating to items recognized directly in equity is recognized in equity and not included
in the calculation of comprehensive income for the period.
Deferred income tax assets and deferred income tax liabilities are offset if a legally enforceable
right exists to set off current income tax assets against current income tax liabilities and the
deferred income taxes relate to the same taxable entity and the same taxation authority.
Foreign Currency-Denominated Transactions and Translations
Transactions denominated in currencies other than the USD are recorded using the exchange rate
prevailing at the date of the transaction. Outstanding monetary assets and liabilities denominated
in foreign currencies are translated using the closing rate of exchange at statement of financial
position date. Any resulting foreign exchange gains or losses are taken to income or loss in the
consolidated statement of comprehensive income.
Earnings (Loss) Per Share
Basic earnings (loss) per share (EPS) is calculated based on net income (loss) before other
comprehensive income and total comprehensive income for the year. EPS is calculated by
dividing net income (loss) before other comprehensive income or total comprehensive income for
the year, as applicable, by the weighted average number of issued and outstanding shares of stock
during the year, after giving retroactive effect to any stock dividends declared or stock rights
exercised. The Group has no dilutive potential common shares.
Events After the Reporting Period Date
Post year-end events that provide additional information about the Group’s position at the
statement of financial position date (adjusting events), if any, are reflected in the consolidated
financial statements. Post year-end events that are not adjusting events are disclosed in the notes
to consolidated financial statements when material.
II: Financial Risk Management Objectives and Policies
Risk Management Structure
Board of Directors (BOD)
The BOD is mainly responsible for the overall risk management approach and for the approval
of risk strategies and policies of the Group.
Financial Risk Committee
The Financial Risk Committee has the overall responsibility for the development of financial
risk strategies, principles, frameworks, policies and limits. It establishes a forum of discussion
of the Group approach to financial risk issues in order to make relevant decisions.
Finance Risk Office
The Finance Risk Office is responsible for the comprehensive monitoring, evaluating and
analyzing of the Group financial risks in line with the policies and limits set by the Finance Risk
Committee.
Financial Risk Management
The Group’s principal financial instruments, other than derivatives, consist of loans, cash and
cash equivalents, short-term investments, investments in bonds and equities, and deposits. The
main purpose of these financial instruments is to raise financing for the Group’s operations. The
Group has various other financial assets and financial liabilities such as trade receivables, trade
payables and accrued expenses which arise directly from its operations.
The main risks arising from the use of financial instruments are market risks (consisting of
foreign exchange risk, cash flow interest rate risk, price interest rate risk, equity price risk and
fuel price risk), liquidity risk, counterparty risk and credit risk.
The Group uses derivative financial instruments to manage its exposures to currency, interest and
fuel price risks arising from the Group’s operations and its sources of financing. The details of
PAL’s derivative transactions, including the risk management objectives and the accounting
results, are discussed in this note.
Market risks
Increasing market fluctuations may result in significant equity, cash flow and profit volatility
risks for the Group. Its operating activities as well as its investing and financing activities are
affected by changes in foreign exchange rates, interest rates and fuel prices. The Group seeks to
manage and control these risks primarily through its regular operating and financing activities,
and through execution of a documented hedging strategy.
Management of financial market risk is a key priority for the Group. The Group generally
applies sensitivity analysis in analyzing and managing its market risks. Sensitivity analysis
enables management to identify the risk position of the Group as well as provide an approximate
quantification of the risk exposures. Estimates provided for foreign exchange risk, cash flow
interest rate risk, price interest rate risk and fuel price risk are based on the historical volatility
for each market factor, with adjustments being made to arrive at what the Group considers to be
reasonably possible.
Foreign exchange risk
The Group is exposed to foreign exchange rate fluctuations arising from its revenue, expenses
and borrowings in currencies other than its functional currency. The Group manages this
exposure by matching its receipts and payments for each individual currency. Any surplus is sold
as soon as practicable. The Group also uses foreign currency forward contracts and options to
hedge a portion of its exposure. The Group’s significant foreign currency-denominated monetary
assets and liabilities (in PHP equivalent) as of September 30, 2010 and March 31, 2010 are as
follows:
September 30, March 31, 2010
2010
Financial assets and financial liabilities
Financial Assets:
Cash
Receivables
Others*
Financial Liabilities:
Accounts payable
Accrued expenses
Others**
Net foreign currency-denominated financial
assets (liabilities)
Nonfinancial liabilities
P1,741,336
4,659,974
659,430
P7,060,740
P1,320,821
5,522,920
1,686,320
P8,530,061
1,492,963
4,336,145
856,943
6,686,051
956,591
4,389,106
1,271,998
6,617,695
374,689
1,912,366
Accrued employee benefits
Provisions
Net foreign currency-denominated monetary
liabilities
(4,952,620)
(2,534,813)
(7,487,433)
(4,724,440)
(2,611,388)
(7,335,828)
(P7,112,744)
(P5,423,462)
* Includes miscellaneous deposits and security deposits.
** Substantially pertaining to notes payable to a local bank.
The Group recognized a PHP 79,065 foreign exchange gain for the period April to September
2010 and P96,606 foreign exchange loss in March 31, 2010.
The Group’s foreign currency-denominated exposures comprise primarily of Philippine peso
(PHP) and JPY. Other foreign currency exposures include Canadian dollar (CAD), Euro (EUR),
Australian dollar (AUD), Singaporean dollar (SGD), and Hong Kong dollar (HKD).
Cash flow interest rate risk
The Group’s policy on interest rate risk is designed to limit the Group’s exposure to fluctuating
interest rates. Before taking into account the effects of interest hedging, the ratio of floating rate
to the total borrowings is 0.70:1 and 0.72:1 as of September 30, 2010 and March 31, 2010,
respectively.
Price interest rate risk
PAL’s interest rate swaps, designated as cash flow hedges, classified as available for sale, are
subject to price interest rate risk. The prices of these investments are monitored based on their
current fair values, which are affected by the changes in market factors such as interest rates.
Equity price risk
Equity price risk is the risk that the fair values of equity securities decrease as the result of
changes in the levels of equity indices and the value of individual stocks. The prices of these
investments are monitored based on their current fair values.
Fuel price risk
PAL is exposed to price risk on jet fuel purchases. This risk is managed by a combination of
strategies with the objective of managing price levels within an acceptable band through various
types of derivative and hedging instruments. In managing this significant risk, PAL has a
portfolio of swaps, collars, and compound structures with sold options or option combinations
with extendible or cancellable features. PAL implements such strategies to manage and minimize
the risks within acceptable risk parameters.
PAL’s fuel derivatives are viewed as economic hedges and are not held for speculative purposes.
Short-term exposures are hedged primarily with fuel derivatives indexed to jet fuel. On longterm exposures, PAL also uses fuel derivatives indexed to crude oil as proxy hedges due to
liquidity constraints in the refined oil products market (i.e., jet fuel). PAL uses a Value-at-Risk
(VaR) computation to estimate the potential three-day loss in the fair value of its fuel derivatives.
The VaR computation is a risk analysis tool designed to estimate statistically the maximum
potential loss from adverse movement in fuel prices.
Assumptions and limitations of VaR
The VaR methodology employed by PAL uses a three-day period due to the assumption that not
all positions could be undone in a single day given the size of the positions. The VaR
computation makes use of Monte Carlo simulation with multi-factor models. Multi-factor
models ensure that the simulation process takes into account mean reversion and seasonality. It
captures the complex dynamics of the term structure of commodity markets, such as contango
and backwardation. The VaR estimates are made assuming normal market conditions using a
95% confidence interval and are determined by observing market data movements over a 90-day
period.
The estimated potential three-day losses on its fuel derivative transactions, as calculated in the
VaR model, amounted to P31,857 and P50,592 as of September 30, 2010 and March 31, 2010,
respectively.
The high, average and low VaR amounts are as follows:
High
P104,648
P153,806
April 1, 2010 to September 30, 2010
April 1, 2009 to March 31, 2010
Average
P63,896
P86,884
Low
P31,721
P9,958
Liquidity risk
Liquidity risk arises from the possibility that the Group may encounter difficulties in raising
funds to meet commitments from financial instruments (e.g., long-term obligations) or that a
market for derivatives may not exist in some circumstances.
The Group’s objectives to manage its liquidity profile are: (a) to ensure that adequate funding is
available at all times; (b) to meet commitments as they arise without incurring unnecessary costs;
(c) to be able to access funding when needed at the least possible cost; and (d) to maintain an
adequate time spread of refinancing maturities.
The tables below summarize the maturity analysis of the Group’s financial liabilities based on
contractual undiscounted payments (principal and interest):
As of September 30, 2010
>1-<2 Years
>2-<3 Years
>3-<4 Years
>4-<5 Years
<1 Year
Financial Liabilities
Accounts payable and accrued expenses
Notes payable (noncurrent portion is
included under “Other noncurrent
liabilities”)
Obligation under finance lease
Other long-term liabilities
Other liability (under “Accrued expense”
and “Other noncurrent liabilities”)
(Note 16)
Due to related parties
Derivative instruments:
Contractual receivable
Contractual payable
Fuel derivatives
>5 Years
Total
P13,453,585
P–
P–
P–
P–
P–
P13,453,585
5,670,816
19,124,401
6,890,239
2,252,401
–
–
3,842,429
888,258
–
–
4,990,524
900,600
–
–
5,041,340
843,635
–
–
1,497,223
2,825,701
–
–
5,820,543
–
5,670,816
19,124,401
28,082,298
7,710,595
413,999
–
413,999
–
413,999
–
241,522
–
–
–
–
1,483,519
–
(52,178)
53,144
143,710
9,701,315
P28,825,716
–
–
–
5,144,686
P5,144,686
–
–
–
6,305,123
P6,305,123
–
–
–
6,126,497
P6,126,497
–
–
–
4,322,924
P4,322,924
–
–
–
5,820,543
P5,820,543
(52,178)
53,144
143,710
37,421,088
P56,545,489
>1-<2 Years
>2-<3 Years
>3-<4 Years
>4-<5 Years
>5 Years
Total
P–
P13,773,385
As of March 31, 2010
<1 Year
Financial Liabilities
Accounts payable and accrued expenses
Notes payable (noncurrent portion is
P13,773,385
P–
P–
P–
P–
included under “Other noncurrent
liabilities”)
Obligation under finance lease
Other long-term liabilities
Other liability (under “Accrued expense”
and “Other noncurrent liabilities”)
(Note 16)
Due to related parties
Derivative instruments:
Contractual receivable
Contractual payable
Fuel derivatives
6,103,098
19,876,483
7,067,751
2,439,102
–
–
6,039,147
2,343,039
–
–
3,242,020
1,008,585
–
–
8,074,072
965,423
–
–
1,936,870
907,315
–
–
6,592,377
2,513,288
6,103,098
19,876,483
32,952,237
10,176,752
414,005
481,090
414,005
414,005
414,005
34,557
-
1,690,577
481,090
(1,219,687)
1,327,072
97,285
10,606,618
P30,483,101
–
–
166,897
8,963,088
P8,963,088
–
–
–
4,664,610
P4,664,610
–
–
–
9,453,500
P9,453,500
–
–
–
2,878,742
P2,878,742
–
–
–
9,105,665
P9,105,665
(1,219,687)
1,327,072
264,182
45,672,223
P65,548,706
Note: Coupon cash flows on floating rate liabilities are determined using projected rates. In the case of derivatives, where
the settlement mechanism is gross, the contractual cash inflows and outflows are presented by time bucket. Where
the settlement mechanism is net, the future undiscounted cash flows are used, where the estimated forward or swap
curve is compared against contractually agreed rates or prices.
The Group’s total financial liabilities due to be settled amounting to PHP28,825,221 in September
30, 2010 and P29,094,893 in March 31, 2010, include liabilities that management considers as
working capital aggregating to PHP19,123,906 and P18,969,365, respectively. Accounts payable
and accrued expenses of P13,453,090 in September 30, 2010 and P12,866,267 in March 31, 2010
include liabilities that are payable on demand but are expected to be renegotiated in the future.
For the other liabilities amounting to P9,701,315 in September 30, 2010 and P10,125,528 in
March 31, 2010, management expects to settle these from the Group’s cash to be generated from
operations and the Group’s financial assets as shown below:
September 30, 2010
Financial Assets
Cash
Loans and receivables
Cash equivalents
Receivables – net
<1 Year
>1-<2
Years
>2-<3
Years
>3-<4
Years
>4-<5
Years
>5 Years
Total
P2,570,758
P–
P–
P–
P–
P–
P2,570,758
1,492,831
5,421,872
P9,485,461
–
–
P–
–
–
P–
–
–
P–
–
–
P–
–
–
P–
1,492,831
5,421,872
P9,485,461
<1 Year
>1-<2
Years
>2-<3
Years
>3-<4
Years
>4-<5
Years
>5 Years
Total
P1,946,622
P–
P–
P–
P–
P–
P1,946,622
1,450,399
5,279,662
P8,676,683
–
–
P–
–
–
P–
–
–
P–
–
–
P–
–
–
P–
1,450,399
5,279,662
P8,676,683
March 31, 2010
Financial Assets
Cash
Loans and receivables
Cash equivalents
Receivables - net
Counterparty risk
The Group’s counterparty risk encompasses issuer risk on investment securities; credit risk on
cash in banks, time deposits, and security deposits; and settlement risk on derivatives. The Group
manages its counterparty risk by transacting with counterparties of good financial condition and
selecting investment grade securities. Settlement risk on derivatives is managed by limiting
aggregate exposure on all outstanding derivatives to any individual counterparty, taking into
account its credit rating. Credit limits are set in line with the long-term rating of the counterparty
as determined by Standard & Poor’s and Moody’s. These limits are regularly monitored,
reviewed and adjusted as deemed necessary. The Group also enters into master netting
arrangements and implements counterparty and transaction limits to avoid concentration of
counterparty risk.
The table below shows the maximum counterparty exposure before taking account any collateral
and other credit enhancements of the Group as of September 30, 2010 and March 31, 2010:
( In Thousand)
September 30, 2010
Cash in banks and cash equivalents, excluding
P3,993,262
cash on hand
Accounts receivable - net
5,421,872
Investment in MAC
257,840
Derivative instruments
62,719
Margin deposits, lease deposits and others
5,498,865
P15,234,558
March 31,2010
P3,150,673
5,279,662
242,000
193,211
5,360,643
P14,226,189
Credit risks
The Group’s exposure to credit risk arises from the possibility that agents and other
counterparties may fail to fulfill their agreed obligations and that the collaterals held may not be
sufficient to cover the Group’s claims. To manage such risk, the Group, through its Credit and
Collection Department, employs a credit evaluation process prior to the accreditation or reaccreditation of its travel and cargo agents. The Group considers, among other factors, the size,
paying habits and the financial condition of the agents. To further mitigate the risk, the Group
requires from its agents financial guarantees in the form of cash bonds, letters of credit and
assignment of time deposits.
The Group, to the best of its knowledge, has no significant concentration of credit risk with any
counterparty.
III: Financial Instruments
Classification of financial instruments
The Group exercises judgment in classifying a financial instrument, or its component parts, on
initial recognition as either a financial asset, a financial liability or an equity instrument in
accordance with the substance of the contractual arrangement and the definitions of a financial
asset, a financial liability or an equity instrument. The substance of a financial instrument, rather
than its legal form, governs its classification in the consolidated statement of financial position.
Fair Values of Financial Instruments
The table below presents a comparison by category of the carrying amounts and fair values of the
Group’s financial instruments:
September 30, 2010
Carrying
Fair Value
Value
Financial Assets
Cash
Loans and Receivables:
Cash equivalents
Receivables - net
General traffic
Non-trade*
Margin deposits, lease deposit
and others
March 31, 2010
Carrying
Fair Value
Value
P2,570,758
P2,570,758
P1,946,622
P1,946,622
1,492,831
1,492,831
1,450,399
1,450,399
4,256,867
1,165,005
4,256,867
1,165,005
4,289,465
990,197
4,289,465
990,197
5,498,865
12,413,568
5,398,418
12,313,121
5,360,643
12,090,704
5,081,560
11,811,621
Available-for-sale Investments
Equity investments:
Quoted
Unquoted
Derivative Asset - Fair value
through profit or loss
Financial Liabilities
Financial liabilities carried at
amortized cost:
Accounts payable and accrued
expenses
Notes payable
Obligations under finance
leases
Other long-term liabilities
Due to related parties
Other liability (under accrued
expense and other noncurrent
liabilities)
Derivative liabilities:
Fair value through profit or
loss
264,780
275,297
540,077
264,780
275,297
540,077
248,794
283,884
532,678
248,794
283,884
532,678
62,719
P15,587,122
62,719
P15,486,675
193,211
P14,763,215
193,211
P14,484,132
P13,453,585
5,645,474
P13,453,585
5,645,474
P13,773,385
6,101,830
P13,773,385
6,101,830
24,919,809
6,710,909
-
26,093,422
6,811,005
-
28,675,906
P8,644,240
481,090
29,350,153
P8,830,432
481,090
1,245,248
51,975,025
1,357,335
53,360,821
1,424,991
59,101,442
1,521,687
60,058,577
223,909
223,909
453,453
453,453
223,909
P52,198,934
223,909
P53,584,730
453,453
P59,554,895
453,453
P60,512,030
* Excludes receivables arising from statutory requirements (net of allowance amounting to PHP598,555 and
P560,023 as of September 30, 2010 and March 31, 2010, respectively).
The following methods and assumptions are used to estimate the fair value of each class of
financial instruments:
Cash and cash equivalent, short-term investments and receivables
The carrying amounts of cash and cash equivalents approximate fair value. The carrying
amounts of receivables approximate fair value due to their short-term settlement period.
Current financial instruments
Similarly, the historical cost carrying amounts of receivables, miscellaneous deposits, accounts
payable and accrued expenses approximate their fair values due to the short-term nature of these
accounts.
Equity investments (available-for-sale investments)
The fair values of equity investments are generally based upon quoted market prices. Unquoted
equity investments are carried at cost (subject to impairment) if the fair value cannot be
determined reliably or where the variability in the range of fair value estimates is significant.
Security deposits
The fair value of refundable deposits is determined using discounted cash flow techniques
based on prevailing market rates. Discount rates used are 0.78% to 2.73% and 2.12% to 4.21%
for September 30, 2010 and March 31, 2010, respectively.
Long-term obligations and short-term, fixed rate notes payable
The fair value of long-term obligations (whether fixed or floating) is generally based on the
present value of expected cash flows with discount rates that are based on risk-adjusted
benchmark rates (in the case of floating rate liabilities with quarterly repricing, the carrying value
approximates the fair value in view of the recent and regular repricing based on current market
rates). The discount rates used range from 0.94% to 6.41% and 0.95% to 5.20% for USDdenominated loans in SeptemberJune 30, 2010 and March 31, 2010, respectively. The discount
rates used amounted to 1.45% and 1.60% for JPY-denominated loans in September 30, 2010 and
March 31, 2010, respectively.
The carrying value of the short-term, fixed rate notes payable approximates its fair value due to
the short-term settlement period of the notes (i.e., effect of discounting is minimal)
Derivatives
The fair value of forward exchange contracts is calculated by reference to current forward
exchange rates for contracts with similar maturity profiles.
The fair values of fuel derivatives that are actively traded on an organized and liquid market are
based on published prices. In the absence of an active and liquid market, and depending on the
type of instrument and the underlying commodity, the fair value of fuel derivatives is determined
by the use of either present value methods or standard option valuation models. The valuation
inputs on these fuel derivatives are based on assumptions developed from observable
information, including (but not limited to) the forward curve derived from published or futures
prices adjusted for factors such as seasonality considerations and the volatilities that take into
account the impact of spot prices and the long-term price outlook of the underlying commodity.
The fair values of fuel derivatives with extendible or cancelable features are based on quotes
provided by counterparties.
Derivative Financial Instruments
The derivative financial instruments set out in this section have been entered into to achieve the
PAL’s risk management objectives. PAL’s derivative financial instruments are accounted for at
fair value through profit or loss, except for interest rate swaps and certain fuel derivatives (which
are accounted for as cash flow hedges).
The following table provides information about PAL’s derivative financial instruments
outstanding as of September 30, 2010 and March 31, 2010 and the related fair values:
March 31, 2010
September 30, 2010
Asset
Liability
Asset
Liability
Fuel derivatives
P62,719
P206,429
P179,307
P443,444
Currency forwards
–
12,605
13,451
1,766
Structured currency derivatives
–
4,875
453
8,243
P62,719
P223,909
P193,211
P453,453
As of September 30, 2010 and March 31, 2010, the positive and negative fair values of derivative
positions that will settle in 12 months or less are classified under “Other current assets” (P62,719
in September 30, 2010 and P193,211 in March 31, 2010) and “Accrued expenses” (P223,909 in
September 30, 2010 and P286,556 in March 31, 2010), respectively. The positive and negative
fair values of derivative positions that will settle in more than 12 months “Other noncurrent
liabilities” (P166,897 in March 31, 2010), respectively. The derivative asset (liability) balances
include amounts arising from derivative settlements that are currently due to (due from) PAL
which amounted to (P49,499) and (P60,056) as of September 30, 2010 and March 31, 2010,
respectively.
Fuel derivatives
PAL is dependent on jet fuel to run its operations. Approximately 39.08% and 33.89% of its
operating expenses represent jet fuel consumption for September 30, 2010 and March 31, 2010,
respectively.
The dramatic increase in all energy prices over the years is another reason why jet fuel and oil
have become a large portion of its expenses. In order to hedge against adverse market condition
and to be able to acquire jet fuel at the lowest possible cost, PAL enters into fuel derivatives.
PAL does not purchase or hold any derivative financial instruments for trading purposes.
As of September 30, 2010, there are no outstanding fuel derivatives accounted for as cash flow
hedges.
PAL’s other fuel derivatives, which provide economic hedges against jet fuel price risk, are not
accounted for as accounting hedges. These derivatives include leveraged collars, written calls,
swaps and other structures with extendible or cancelable features and are carried at fair values in
the consolidated statement of financial position, with fair value changes being reported
immediately in the consolidated statement of comprehensive income. The net negative fair value
of these fuel derivatives as of September 30, 2010 and March 31, 2010 amounted to P94,211 and
P204,081, respectively.
Currency forwards
PAL’s currency forwards are carried at fair value in the consolidated statements of financial
position, with the fair value changes being reported immediately in the consolidated statements of
comprehensive income. Impact of fair value changes are not significant.
Structured currency derivatives
PAL entered into currency derivative options. These contracts are carried at fair value in the
consolidated statement of financial position. The fair value changes of the derivative instruments
are recognized directly in the consolidated statement of comprehensive income. The outstanding
structured currency derivatives are composed of buy USD in various currencies (i.e., JPY, CAD,
AUD and SGD).
Fair Value Hierarchy
The Group’s quoted available-for-sale financial investments measured at fair value under the
Level 1 hierarchy amounted to P6,940 in September 30, 2010 and P6,794 in March 31, 2010.
The Group’s financial assets measured at Level 2, which consist of derivative assets, amounted to
P62,719 in September 30, 2010 and P193,211 in March 31, 2010. The Group’s financial
liabilities measured at Level 2, which consist of derivative liability amounted to P223,909 in
September 30, 2010 and P453,453 in March 31, 2010. There were no transfers between the
levels of hierarchies in September 30, 2010 and March 31, 2010.
Item 2. Management's Discussion and Analysis of Financial Condition and Results of
Operations.
Results of Operations
PAL Holdings’ consolidated total comprehensive income for the six months ended
September 30, 2010 amounted to PHP2,342.1 million, a significant increase of 349% from the same
period of the previous fiscal year of (PHP942.0) million. This increase can also be attributed to the
positive results of operations which increased by 1475% from a Consolidated net loss from
operations of PHP209.9 million last year to a consolidated net income of PHP2,886.2 in the current
period.
Consolidated revenues for the period of the current fiscal year amounted to PHP 37,523.0 million, up
by 25% from last year’s same period figure of PHP30,121.8 million. The increase in revenues was
attributable mainly to higher passenger and cargo revenues earned during the period. Passenger and
cargo traffic grew as much as 16.4% and 80.5% respectively over the same period the year before,
reflecting an upturn in global economy. An improvement by 13.4% in yields generated from
passenger seat offerings complemented the boost in passenger traffic.
Total expenses and other charges (income) for the period April to September 2010 rose by 14% over
the previous year’s same period total of PHP30,331.8 million. This was primarily due to higher
expenses related to flying operations, aircraft & traffic servicing , reservation & sales and other
expenses offset by the decrease in maintenance, financing charges and general & administrative
costs.
Flying operations expenses which increased by 21% is attributable mainly to higher fuel costs and
aircraft lease rentals. Fuel expenses which registered an increase of PHP 3,047.6 million was brought
about by the increase in the average fuel price per barrel from US$ 79.06 in 2009 to US$ 97.73 in
2010. The phase in of two (2) Boeing 777 aircraft in November 2009 and January 2010 likewise
resulted in the increase of aircraft lease rentals by 45.7%.
More international flights were operated during the period, thus resulting in higher aircraft & traffic
servicing cost by 2.0% or PHP 89.7 million over the previous year’s level of PHP 4,578.7 million.
Increase in selling expenses recognized related to the transportation service provided increased
reservation and sales by PHP199.1 million or 10.0%.
“Other Income” shown as part of “Other Expenses” decreased by 75% or PHP 3,000.5 million lower
than the same period figure of the previous year of PHP 4,000.3 million. The reduction was
accounted for mainly by lower unrealized gain recognized in the current period resulting from
changes in the fair valuation of outstanding derivative instruments which did not qualify for hedge
accounting. The effect of the one time gain on debt buyback of certain unsecured claims, representing
the difference between the purchase price and the cost as carried in PAL’s books realized in 2009
also contributed to the decrease in “Other Income”.
Lower aircraft, component and engine repair costs incurred during the period had the effect of
decreasing maintenance expense by 25% from last year’s total of PHP 5,716.6 million.
Debt servicing of various long term obligations resulted in lower financing charges of PHP 602.5
million or a reduction of 39%.
Cost cutting measures implemented by PAL resulted in the reduction of general & administrative
expenses by 22% or PHP 376.5 million.
The reduction in the net changes in the value of derivative assets resulting from the fair valuation of
outstanding fuel hedges by 77% recognized in equity had the effect of decreasing the “Other
Comprehensive Loss” account by 26%.
Financial Condition
The Company’s consolidated total assets as of September 30, 2010 amounted to PHP 71,949.6
million or 6% lower than the March 31, 2010 balance of PHP 76,755.8 million.
The difference was brought about by the downward movement in total noncurrent assets by 9%.
This was attributable mainly to the decrease in property and equipment by 10% due mainly to the
depreciation expense recognized during the period, which had the effect of reducing the carrying
values of the assets.
Total current assets increased by 6% which is due mainly to the increase in cash and cash equivalents
by 20% as a result of higher cash earnings generated from operations.
Total liabilities decreased by 11%. This is on account of lower long-term liabilities by 19% due to the
principal payments made on various loans and the effect of the debt buyback of certain unsecured
claims from Trustmark Holdings Corporation. Payments made on certain current liabilities and the
assignment of Maxell Holdings’ receivable from The Company to Trustmark Holdings which
reduced the advances from related parties also contributed to the decrease in total current liabilities
by 8%.
As of September 30, 2010 the Company’s equity balance amounted to PHP4,859.7 million, up by
187% from the March 31, 2010 balance of PHP 1,695.5 million. The increase was mainly the result
of net income recognized for the period ended September 30, 2010.
The Company’s key performance indicators are the following:
1. Total Comprehensive Income
The Company’s consolidated total comprehensive income attributable to parent for the six
months ended September 30, 2010 amounted to PHP 1,985.6 million an improvement of 349%
from last years’ level of (PHP 798.1) million.
2. Current Ratio
The Company has a current ratio of 0.37 as of September 30, 2010 compared to 0.33 as of March
31, 2010.
3. Debt to Equity ratio
Debt to Equity ratio as of September 30,2010 was 13.81 compared to 44.27 as of March 31, 2010
4. Earnings Per Share
The Company reported an Earnings (Loss) per share based on net income (loss) of PHP0.45 as of
September 30,2010 as compared to (PHP 0.03) as of September 30, 2009 and based on total
comprehensive income of PHP0.37 per share as of September 30, 2010 as compared to (PHP
0.15) as of September 30, 2009.
The manner by which the Company calculates the above indicator is as follows:
Current ratio – Current assets/Current liabilities
Debt to equity ratio – Total liabilities/Total Equity
Earnings (Loss) per share – Net income (loss) or total comprehensive income attributable to holders
of parent company over common shares issued and outstanding
PAL’S TOP FIVE KEY PERFORMANCE INDICATORS –QUALITATIVE FACTORS
Mission
Statement
To maintain aircraft with the
highest degree of airworthiness,
reliability and presentability in
the most cost-effective manner
To conduct & maintain safe,
reliable, cost & effective flight
operations
To achieve On Time Performance
on all flights operated
To provide safe, on time, quality
and cost effective inflight service
or total passenger satisfaction
To maximize the revenue
generation in passenger and cargo
sales through increased yields by
diversifying market segments and
efficient management of seat
inventory and cargo space
Key Performance Indicator
Measurement Methodology
Aircraft Maintenance Check
Completion
Number of checks performed
less number of maintenance
delay over number of checks
performed
By occurrence and monitoring
by Flight Operations Safety
Office
Number of flights operated
less number of flights delayed
over total flights operated
Number of incidents of safety
violation incurred by cabin
crew per month
Percentage Deviation from
Budget/Forecasted Revenues
Number of aircraft related
accidents/ incidents
Percentage Deviation from
Industry Standards (OTP
Participation)
Number of safety violations
incurred by cabin crew
Net Revenues generated from
passengers and cargoes carried
i. There are no known trends, demands, commitments, events or uncertainties that may have a
material impact on the Group’s liquidity.
ii. On July 22, 2008, the Supreme Court rendered an adverse decision in the case entitled “Flight
Attendants and Stewards Association of the Philippines (FASAP) vs. the Philippine Airlines”
ordering PAL to reinstate the retrenched FASAP members and pay back wages inclusive of
allowances and other monetary benefits plus 10% attorney’s fees. PAL filed a motion for
reconsideration. On October 2, 2009, the motion for reconsideration was denied with finality. On
November 3, 2009, PAL filed a second motion for reconsideration, which is pending resolution
before the Supreme Court. Other than this, there are no known events that will trigger direct or
contingent financial obligation that is material to the Group, including any default or acceleration of
an obligation.
iii. There are no material off-balance sheet transactions, arrangements, obligations (including
contingent obligations), and other relationships of the Group with unconsolidated entities or other
persons created during the reporting period.
iv. Commitments for capital expenditures
On October 30, 2006, PAL finalized a Purchase Agreement with Boeing wherein PAL placed a firm
order for two Boeing 777-300ER aircraft for delivery in fiscal year 2010 to fiscal year 2011 and
purchase rights for two additional aircraft.
In May 2007, PAL finalized a supplemental agreement with Boeing relating to its exercise of
purchase rights for two Boeing 777-300ER aircraft for delivery in fiscal year 2012.
On July 28, 2008 , PAL exercised its right to purchase two (2) of the five (5) option Airbus 320-200
aircraft scheduled for delivery in fiscal year ending March 2011. As of November 14, 2010 the first
A320 option aircraft has been delivered and subleased to Air Philippines for a lease period of six (6)
years.
On June 2, 2009, PAL and Boeing agreed to reschedule the deliveries of four Boeing 777-300ER
aircraft from their original delivery schedules of fiscal year 2010, 2011 and 2012 to fiscal years 2013
and 2014.
In March 2010, PAL signed operating lease agreements for the lease of two brand new Airbus 320200 aircraft for delivery in October and November 2010. As of November 14, 2010, the first A320
operating lease aircraft has been delivered and subleased to Air Philippines for a lease period of 6
years.
To improve its financial condition and results of operations, PAL has lined up various revenue
enhancement programs, cash generation strategies and cost control initiatives. Part of these
initiatives is the spin-off of its Inflight Catering operations, Airport Services operations and Call
Center Reservation operations. In April 2010, PAL released a memorandum informing its employees
and the general public of its plan to spin-off a significant number of employees. Members of the
employees’ union lobbied for reconsideration to the Department of Labor and Employment (DOLE).
On June 15, 2010, PAL received a favorable decision from the DOLE confirming the legality of the
spin-off/outsourcing program. On October 29, 2010, DOLE affirmed its earlier ruling on PAL’s right
to spin-off/outsource its Inflight Catering, Airport Services and Call Center units.
iv. There are no known trends, events or uncertainties that have had or that are reasonably expected
to have a material favorable or unfavorable impact on net sales/revenues/income from the Group’s
continuing operations.
v. There are no significant elements of income or loss that did not arise from the Company’s
continuing operations.
vi. The causes for any material change from period to period which shall include vertical and
horizontal analyses of any material item:
1.
2.
3.
4.
5.
6.
7.
8.
9.
10.
11.
12.
13.
14.
Cash and cash equivalents & available-for-sale investment – H- 20%
Other current assets- H- (9%)
Property, plant and equipment-net- H- (10%)
Deferred tax assets- H- 20%
Other noncurrent assets – H- 12%
Notes payable- H- (10%)
Accounts payable– H- (28%)
Advances from related parties- H- (100%)
Long-term liabilities –net of current portion– H- (19%); V- (5%)
Accrued employee benefits payable- H- 5%
Other components of equity- H- 17%
(Deficit)- H- (15%)
Minority interests- H- 128%
Passenger – H- 25%
15.
16.
17.
18.
19.
20.
21.
22.
23.
24.
25.
26.
27.
28.
29.
Cargo- H- 58%
Interest income – H- (13%)
Other revenue- H- (6%)
Flying Operations – H- 21%
Maintenance – H- (25%); V- (8%)
Financing charges – H- (39%)
Reservation and sales – H- 10%
General and administrative – H- (22%)
Others-net – H- (75%) V- 11%
Net income– H- 1475% V- 8%
Net changes in fair value of available-for-sale investments – H- 101%
Net changes in fair value of derivative assets – H- (77%)
Increase in revaluation increment due to appraisal – H- 100%
Effect of foreign exchange translation – H- 393%
Total comprehensive income- H- 349%; V- 9%
All of these material changes were explained in detail in the management’s discussion and
analysis of financial condition and results of operations stated above.
vi. Generally, PAL experiences a peak in holiday travel during the months of January, April,
May, June and December.
PAL HOLDINGS, INC. AND SUBSIDIARIES
AGING OF ACCOUNTS RECEIVABLE (in PHP)
AS OF September 30, 2010
(in thousands)
Outstanding
Amount
TRADE RECEIVABLES
NON-TRADE RECEIVABLES
TOTAL
Current
Over
30 Days
Over
60 Days
Over
Over
Over
90 Days 120 Days 180 Days
4,568,091
5,674,330
3,545,874
99,437
308,633
30,130
225,403
132,378
132,554
199,533
6,896
122,232
187,762
197,425
160,969
3,930,446
962,749
10,242,421
3,645,311
338,763
357,781
332,087
129,128
385,187
4,091,415
962,749
ALLOWANCE FOR D.A.
4,221,950
RECEIVABLES - NET
6,020,471
Average Collection Period-trade receivables - 30 days
Normal Operating Cycle - 365 days
Over
1 Year
Items under
Litigation


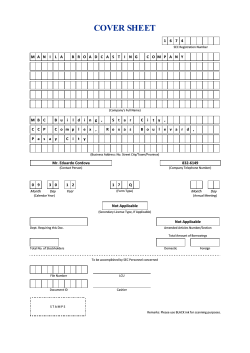

© Copyright 2026