
COVER SHEET
COVER SHEET
RESPONSIBLE AGENCY:
TITLE:
CONTACT:
National Nuclear Security Administration (NNSA)
Final Site-Wide Environmental Assessment (SWEA)
for Sandia National Laboratories/California (DOE/EA-1422)
For further information concerning the Draft Site-Wide
Environmental Assessment (SWEA), contact:
Susan Lacy, NEPA Document Manager
NNSA, Sandia Site Office
P.O. Box 5400, Albuquerque, NM 87185
Telephone: 1-505-845-5542, Fax: 505-845-4710
For further information by way of electronic mail, contact:
[email protected]
Abstract: The NNSA proposes to continue operating Sandia National Laboratories/California
(SNL/CA) located in Livermore, California. The NNSA has identified and assessed three alternatives
for the operation of SNL/CA: (1) No Action, (2) Planned Utilization and Operations, and (3) Maximum Operations. Under the No Action Alternative, the NNSA would continue the historical mission
support activities SNL/CA has conducted at planned operational levels. NNSA and interagency programs and activities at SNL/CA would increase to the highest reasonable activity levels, as set forth in
this SWEA, that could be supported by current facilities and their potential expansion and construction
of new facilities for future actions specifically identified in the SWEA. Under the Planned Utilization
and Operations Alternative, the NNSA would operate SNL/CA at the minimum levels of activity necessary to maintain the capabilities to support the NNSA mission in the near term. Under all of the alternatives, the affected environment is primarily within Livermore area. Analyses indicate little difference
in the environmental impacts among alternatives.
Public Comments: The Draft SWEA was released to the public for review and comment on November 1,
2002. The comment period ended on November 30, 2000. All comments were considered in preparation of
the Final SWEA1. The NNSA will use the analysis in this Final SWEA and determine whether to prepare an
Environmental Impact Statement or make a Finding of No Significant Impact.
1
Changes made to this SWEA since publication of the Draft SWEA are marked with a vertical bar to
the right or left of the text.
Table of Contents
Table of Contents
Chapter 1, Introduction.......................................................................................... 1-1
1.1
1.2
1.3
Introduction ............................................................................................................. 1-1
Purpose and Need for Agency Action ...................................................................... 1-2
Alternatives .............................................................................................................. 1-3
1.3.1
1.3.2
1.3.3
1.4
1.5
1.6
Objective of the Site-wide Environmental Assessment ........................................... 1-4
Decisions to be Supported by the Site-wide Environmental Assessment ............... 1-5
Public Participation ................................................................................................. 1-5
1.6.1
1.6.2
1.7
Scoping Process ............................................................................................................................ 1-5
Summary of Scoping Issues and Concerns ................................................................................ 1-5
Related National Environmental Policy Act Documents .......................................... 1-5
1.7.1
1.7.2
1.7.3
1.7.4
1.7.5
1.7.6
1.8
No Action Alternative ................................................................................................................. 1-3
Planned Utilization and Operations Alternative ...................................................................... 1-3
Maximum Operations Alternative ............................................................................................. 1-4
Final (September 1996) Stockpile Stewardship and Management
Programmatic Environmental Impact Statement (DOE/EIS-0236-F) .................................... 1-6
Final (May 1997) Waste Management Programmatic Environmental Impact
Statement for Managing Treatment, Storage, and Disposal of Radioactive and
Hazardous Waste (DOE/EIS-0200-F) ........................................................................................ 1-6
Nonnuclear Consolidation Environmental Assessment
(June 1993) (DOE/EA-0792) ..................................................................................................... 1-6
Final (August 1992) Environmental Impact Statement and Environmental
Impact Report for Continued Operation of Lawrence Livermore National
Laboratory and Sandia National Laboratories, Livermore (DOE/EIS-0157) ......................... 1-6
Supplement Analysis (March 1999) for Continued Operation of Lawrence
Livermore National Laboratory and Sandia National Laboratories, Livermore
(DOE/EIS-0157-SA-01) ............................................................................................................... 1-6
Draft (May 2002) Environmental Assessment for the East Avenue Security
Upgrade at Lawrence Livermore National Laboratory/Sandia National Laboratory,
Livermore, California (DOE/EA-1439) ..................................................................................... 1-6
The Site-Wide Environmental Assessment .............................................................. 1-6
Chapter 2, Operations Overview of Sandia National Laboratories, California ........ 2-1
2.1
Sandia National Laboratories, California Support for the
U.S. Department of Energy Mission Lines .............................................................. 2-1
2.1.1
2.1.2
2.1.3
2.1.4
2.2
Sandia National Laboratories, California Support for Others ................................ 2-2
2.2.1
2.2.2
2.2.3
ii
Sandia National Laboratories, California Support for the U.S. Department
of Energy’s National Security Mission Line .............................................................................. 2-2
Sandia National Laboratories, California Support for the U.S. Department
of Energy’s Energy Resources Mission Line .............................................................................. 2-2
Sandia National Laboratories, California Support for the U.S. Department
of Energy’s Environmental Quality Mission Line .................................................................... 2-2
Sandia National Laboratories, California Support for the U.S. Department
of Energy’s Science and Technology Mission Line ................................................................... 2-2
Laboratory Directed Research and Development ..................................................................... 2-2
Work for Others ........................................................................................................................... 2-3
Partnerships ................................................................................................................................. 2-3
Final SNL/CA SWEA DOE/EA-1422—January 2003
Table of Contents
2.3
Sandia National Laboratories, California Facilities:
A Framework for Impacts Analysis ......................................................................... 2-3
2.3.1
2.3.2
2.3.3
2.3.4
Framework for Analysis ............................................................................................................. 2-3
Site-Wide Environmental Assessment Facilities ....................................................................... 2-3
Activities Common to All Alternatives ..................................................................................... 2-6
Sandia National Laboratories, California Facilities .................................................................. 2-9
Facility Descriptions............................................................................................ FD-1
Chapter 3, Alternatives for Continuing Operations
at Sandia National Laboratories, California ............................................................ 3-1
3.1
3.2
Introduction ............................................................................................................. 3-1
No Action Alternative .............................................................................................. 3-3
3.2.1
3.2.2
3.2.3
3.2.4
3.2.5
3.2.6
3.2.7
3.2.8
3.2.9
3.2.10
3.2.11
3.2.12
3.2.13
Combustion Research Facility .................................................................................................... 3-4
Building 910 ................................................................................................................................. 3-4
Building 914 ................................................................................................................................. 3-4
Building 916 ................................................................................................................................. 3-4
Building 927 ................................................................................................................................. 3-4
Micro and Nano Technologies Laboratories ............................................................................. 3-4
Chemical and Radiation Detection Laboratory ......................................................................... 3-5
Area 8 Facilities ........................................................................................................................... 3-5
Explosive Storage Area ............................................................................................................... 3-5
Hazardous and Radioactive Waste Storage Facilities ................................................................ 3-5
LIGA Technologies Facility ........................................................................................................ 3-5
Distributed Information Systems Laboratory ........................................................................... 3-5
Glass Furnace and Melting Laboratory ..................................................................................... 3-6
3.3 Planned Utilization and Operations Alternative .................................................... 3-6
3.3.1
3.3.2
3.3.3
3.3.4
3.3.5
3.3.6
3.3.7
3.3.8
3.3.9
3.3.10
3.3.11
3.3.12
3.3.13
Combustion Research Facility .................................................................................................... 3-6
Building 910 ................................................................................................................................. 3-6
Building 914 ................................................................................................................................. 3-6
Building 916 ................................................................................................................................. 3-6
Building 927 ................................................................................................................................. 3-8
Micro and Nano Technologies Laboratory ................................................................................ 3-8
Chemical and Radiation Detection Laboratory ......................................................................... 3-8
Area 8 Facilities ........................................................................................................................... 3-8
Explosive Storage Area ............................................................................................................... 3-8
Hazardous and Radioactive Waste Storage Facilities ................................................................ 3-8
LIGA Technologies Facility ........................................................................................................ 3-8
Distributed Information Systems Laboratory ........................................................................... 3-8
Glass Furnace and Melting Laboratory ..................................................................................... 3-8
3.4 Maximum Operations Alternative ........................................................................... 3-8
3.4.1
3.4.2
3.4.3
3.4.4
3.4.5
3.4.6
3.4.7
3.4.8
3.4.9
Combustion Research Facility .................................................................................................... 3-9
Building 910 ................................................................................................................................. 3-9
Building 914 ................................................................................................................................. 3-9
Building 916 ................................................................................................................................. 3-9
Building 927 ................................................................................................................................. 3-9
Micro and Nano Technologies Laboratory ................................................................................ 3-9
Chemical and Radiation Detection Laboratory ......................................................................... 3-9
Area 8 Facilities ......................................................................................................................... 3-10
Explosive Storage Area ............................................................................................................. 3-10
Final SNL/CA SWEA DOE/EA-1422—January 2003
iii
Table of Contents
3.4.10
3.4.11
3.4.12
3.4.13
3.5
3.6
Hazardous and Radioactive Waste Storage Facilities .............................................................. 3-10
LIGA Technologies Facility ...................................................................................................... 3-10
Distributed Information Systems Laboratory ......................................................................... 3-10
Glass Furnace and Melting Laboratory ................................................................................... 3-10
Balance of Operations ............................................................................................ 3-10
Data Used to Analyze Alternatives ....................................................................... 3-10
Chapter 4, Affected Environment .......................................................................... 4-1
4.1
4.2
4.3
Introduction ............................................................................................................. 4-1
General Location ...................................................................................................... 4-1
Land Use and Visual Resources ............................................................................... 4-1
4.3.1
4.3.2
4.4
Geology and Soils ..................................................................................................... 4-6
4.4.1
4.4.2
4.4.3
4.5
Definition of Resource .............................................................................................................. 4-27
Region of Influence ................................................................................................................... 4-27
Affected Environment ............................................................................................................... 4-28
Infrastructure ......................................................................................................... 4-35
4.9.1
4.9.2
4.9.3
4.10
Definition of Resource .............................................................................................................. 4-26
Region of Influence ................................................................................................................... 4-26
Affected Environment ............................................................................................................... 4-26
Cultural Resource Protection at Sandia National Laboratories, California .......................... 4-27
Air Quality ............................................................................................................. 4-27
4.8.1
4.8.2
4.8.3
4.9
Definition of Resource .............................................................................................................. 4-21
Region of Influence ................................................................................................................... 4-21
Affected Environment ............................................................................................................... 4-21
Cultural Resources ................................................................................................. 4-26
4.7.1
4.7.2
4.7.3
4.7.4
4.8
Groundwater .............................................................................................................................. 4-11
Surface Water ............................................................................................................................. 4-16
Biological Resources ............................................................................................... 4-21
4.6.1
4.6.2
4.6.3
4.7
Definition of Resource ................................................................................................................ 4-6
Region of Influence ..................................................................................................................... 4-6
Affected Environment ................................................................................................................. 4-6
Water Resources and Hydrology ............................................................................. 4-11
4.5.1
4.5.2
4.6
Land Use ....................................................................................................................................... 4-1
Visual Resources .......................................................................................................................... 4-5
Definition of Resource .............................................................................................................. 4-35
Region of Influence ................................................................................................................... 4-35
Affected Environment ............................................................................................................... 4-35
Transportation ....................................................................................................... 4-38
4.10.1 Definition of Resource .............................................................................................................. 4-38
4.10.2 Region of Influence ................................................................................................................... 4-38
4.10.3 Affected Environment ............................................................................................................... 4-38
4.11
Waste Generation ................................................................................................... 4-40
4.11.1 Definition of Resource .............................................................................................................. 4-40
4.11.2 Region of Influence ................................................................................................................... 4-40
4.11.3 Affected Environment ............................................................................................................... 4-40
4.12
Noise
.................................................................................................................. 4-43
4.12.1 Definition of Resource .............................................................................................................. 4-43
4.12.2 Region of Influence ................................................................................................................... 4-43
4.12.3 Affected Environment ............................................................................................................... 4-43
iv
Final SNL/CA SWEA DOE/EA-1422—January 2003
Table of Contents
4.13
Human Health and Worker Safety ......................................................................... 4-45
4.13.1 Definition of the Resource ........................................................................................................ 4-45
4.13.2 Region of Influence ................................................................................................................... 4-45
4.13.3 Affected Environment ............................................................................................................... 4-45
4.14
Socioeconomics ....................................................................................................... 4-48
4.14.1 Definition of Resource .............................................................................................................. 4-48
4.14.2 Region of Influence ................................................................................................................... 4-48
4.14.3 Affected Environment ............................................................................................................... 4-49
4.15
Environmental Justice ............................................................................................ 4-52
4.15.1
4.15.2
4.15.3
4.15.4
4.15.5
Definition of the Resource ........................................................................................................ 4-52
Region of Influence ................................................................................................................... 4-52
Identifying Minority and Low-Income Populations ............................................................... 4-52
Minority Populations ................................................................................................................ 4-53
Low-income Populations ........................................................................................................... 4-53
Chapter 5, Environmental Consequences ............................................................... 5-1
5.1
5.2
Introduction ............................................................................................................. 5-1
Methodology ............................................................................................................. 5-1
5.2.1
5.2.2
5.2.3
5.2.4
5.2.5
5.2.6
5.2.7
5.2.8
5.2.9
5.2.10
5.2.11
5.2.12
5.2.13
5.2.14
5.3
No Action Alternative ............................................................................................ 5-10
5.3.1
5.3.2
5.3.3
5.3.4
5.3.5
5.3.6
5.3.7
5.3.8
5.3.9
5.3.10
5.3.11
5.3.12
5.3.13
5.4
Land Use and Visual Resources ................................................................................................. 5-1
Geology and Soils ........................................................................................................................ 5-1
Water Resources and Hydrology ................................................................................................ 5-3
Biological Resources .................................................................................................................... 5-3
Cultural Resources ....................................................................................................................... 5-3
Air Quality ................................................................................................................................... 5-3
Infrastructure ............................................................................................................................... 5-6
Transportation ............................................................................................................................. 5-6
Waste Generation ......................................................................................................................... 5-6
Noise ............................................................................................................................................. 5-6
Human Health and Worker Safety ............................................................................................. 5-6
Socioeconomics ............................................................................................................................ 5-8
Environmental Justice ................................................................................................................. 5-8
Accident Analysis ........................................................................................................................ 5-8
Land Use and Visual Resources ............................................................................................... 5-10
Geology and Soils ...................................................................................................................... 5-10
Water Resources and Hydrology .............................................................................................. 5-12
Biological Resources .................................................................................................................. 5-12
Cultural Resources ..................................................................................................................... 5-12
Air Quality ................................................................................................................................. 5-12
Infrastructure ............................................................................................................................. 5-15
Transportation ........................................................................................................................... 5-16
Waste Generation ....................................................................................................................... 5-16
Noise ........................................................................................................................................... 5-20
Human Health and Worker Safety ........................................................................................... 5-21
Socioeconomics .......................................................................................................................... 5-22
Environmental Justice ............................................................................................................... 5-23
Planned Utilization and Operations Alternative .................................................. 5-23
5.4.1
5.4.2
5.4.3
Land Use and Visual Resources ............................................................................................... 5-23
Geology and Soils ...................................................................................................................... 5-26
Water Resources and Hydrology .............................................................................................. 5-26
Final SNL/CA SWEA DOE/EA-1422—January 2003
v
Table of Contents
5.4.4
5.4.5
5.4.6
5.4.7
5.4.8
5.4.9
5.4.10
5.4.11
5.4.12
5.4.13
5.5
Maximum Operations Alternative ......................................................................... 5-41
5.5.1
5.5.2
5.5.3
5.5.4
5.5.5
5.5.6
5.5.7
5.5.8
5.5.9
5.5.10
5.5.11
5.5.12
5.5.13
5.6
Land Use and Visual Resources ............................................................................................... 5-41
Geology and Soils ...................................................................................................................... 5-41
Water Resources and Hydrology .............................................................................................. 5-41
Biological Resources .................................................................................................................. 5-41
Cultural Resources ..................................................................................................................... 5-42
Air Quality ................................................................................................................................. 5-42
Infrastructure ............................................................................................................................. 5-45
Transportation ........................................................................................................................... 5-45
Waste Generation ....................................................................................................................... 5-46
Noise ........................................................................................................................................... 5-50
Human Health and Worker Safety ........................................................................................... 5-50
Socioeconomics .......................................................................................................................... 5-51
Environmental Justice ............................................................................................................... 5-52
Accidents ................................................................................................................ 5-52
5.6.1
5.6.2
5.7
Biological Resources .................................................................................................................. 5-27
Cultural Resources ..................................................................................................................... 5-30
Air Quality ................................................................................................................................. 5-30
Infrastructure ............................................................................................................................. 5-31
Transportation ........................................................................................................................... 5-31
Waste Generation ....................................................................................................................... 5-34
Noise ........................................................................................................................................... 5-38
Human Health and Worker Safety ........................................................................................... 5-38
Socioeconomics .......................................................................................................................... 5-39
Environmental Justice ............................................................................................................... 5-40
Postulated Event Initiated by Natural Phenomena ................................................................. 5-52
Postulated Material Event Initiated by Unspecified Accident ............................................... 5-53
Comparison of data analyzed and Environmental
Consequences Among Alternatives ........................................................................ 5-53
Chapter 6, Cumulative Effects Analysis ................................................................... 6-1
6.1
6.2
Methods of Analysis ................................................................................................. 6-1
Potentially Affected Resources ................................................................................ 6-1
6.2.1
6.2.2
6.2.3
6.2.4
6.2.5
6.2.6
6.2.7
6.2.8
6.2.9
6.2.10
6.3
Resources with Potential Cumulative Impacts ........................................................ 6-5
6.3.1
6.3.2
6.3.3
6.4
vi
Land Use and Visual Resources ................................................................................................. 6-3
Geology and Soils ........................................................................................................................ 6-3
Water Resources ........................................................................................................................... 6-3
Cultural Resources ....................................................................................................................... 6-4
Infrastructure ............................................................................................................................... 6-4
Human Health and Worker Safety ............................................................................................. 6-4
Waste Generation ......................................................................................................................... 6-4
Noise ............................................................................................................................................. 6-4
Socioeconomics ............................................................................................................................ 6-4
Environmental Justice ................................................................................................................. 6-4
Biological Resources .................................................................................................................... 6-5
Air Quality ................................................................................................................................... 6-5
Transportation ............................................................................................................................. 6-5
Conclusion ................................................................................................................ 6-5
Final SNL/CA SWEA DOE/EA-1422—January 2003
Table of Contents
Chapter 7, Applicable Laws, Regulations, and Other Requirements ........................ 7-1
7.1
7.2
Introduction ............................................................................................................. 7-1
General Environment, Health and Safety Laws,
Regulations, and Other Requirements ..................................................................... 7-1
7.2.1
7.2.2
7.2.3
7.2.4
7.2.5
7.2.6
7.2.7
7.2.8
7.3
Atomic Energy Act of 1954 (42 U.S.C. §2011) ........................................................................... 7-1
National Environmental Policy Act of 1969, as Amended (42 U.S.C. §4321) ........................ 7-1
Regulations for Implementing the Procedural Provisions of the
National Environmental Policy Act (40 CFR Parts 1500-1508) ............................................... 7-1
National Environmental Policy Act Implementing Procedures
(10 CFR Part 1021) ...................................................................................................................... 7-1
Protection and Enhancement of Environmental Quality (EO 11514) .................................... 7-2
Federal Compliance with Pollution Control Standards (EO 12088) ....................................... 7-2
DOE O 451.1A, National Environmental Policy Act Compliance Program .............................. 7-2
DOE O 5400.1, General Environmental Protection Program ................................................. 7-2
Environment, Health and Safety Laws, Regulations, and
Other Requirements for Each Resource Area ......................................................... 7-2
7.3.1
7.3.2
7.3.3
7.3.4
7.3.5
7.3.6
7.3.7
7.3.8
7.3.9
7.3.10
7.3.11
Land Use and Visual Resources ................................................................................................. 7-2
Infrastructure ............................................................................................................................... 7-3
Geology and Soils ........................................................................................................................ 7-3
Water Resources and Hydrology ................................................................................................ 7-3
Biological Resources .................................................................................................................... 7-5
Cultural Resources ....................................................................................................................... 7-6
Air Quality ................................................................................................................................... 7-7
Human Health and Worker Safety (Including Accidents) ....................................................... 7-8
Transportation ........................................................................................................................... 7-11
Waste Generation ....................................................................................................................... 7-11
Noise ........................................................................................................................................... 7-14
Chapter 8, References ............................................................................................ 8-1
8.1
8.2
8.3
8.4
8.5
8.6
General References ...................................................................................................
Code of Federal Regulations .......................................................................................
Federal Register ........................................................................................................
Public Law ................................................................................................................
United States Code .....................................................................................................
U.S. Department of Energy ......................................................................................
8-1
8-6
8-7
8-7
8-7
8-8
Chapter 9, Conflict of Interest Statement ............................................................... 9-1
Chapter 10, List of Preparers ................................................................................ 10-1
Chapter 11, List of Agencies, Organizations, and Individuals to Whom
Copies of this Site-Wide Environmental Assessment were Sent ......... 11-1
Chapter 12, List of Agencies and People Contacted .............................................. 12-1
Chapter 13, Glossary............................................................................................ 13-1
Chapter 14, Notice of Intent ................................................................................ 14-1
Final SNL/CA SWEA DOE/EA-1422—January 2003
vii
Table of Contents
List of Figures
Figure 1-1.
Figure 2-1.
Figure 2-2.
Figure 4-1.
Figure 4-2.
Figure 4-3.
Figure 4-4.
Figure 4-5.
Figure 4-6.
Figure 4-7.
Figure 4-8.
Figure 4-9.
Figure 4-10.
Figure 4-11.
Figure 4-12.
Figure 4-13.
Figure 4-14.
Figure 4-15.
Figure 4-16.
Figure 4-17.
Figure 4-18.
Figure 5-1.
Figure 5-2.
Figure 5-3.
Figure 5-4.
Figure 5-5.
Figure 5-6.
Sandia National Laboratories, California is
Located East of Livermore in Alameda County, California ...................................................................... 1-2
A Number of Sandia National Laboratories, California
Facilities/Areas were selected for In-Depth Analysis ............................................................................... 2-4
Conceptual Illustration of the Site-Wide Environmental Assessment Analysis ...................................... 2-5
The Sandia National Laboratories, California Site, Occupying 410 Acres,
is Owned by the U.S. Department of Energy ............................................................................................ 4-3
Land Use in the Areas Adjacent to Sandia National Laboratories, California ......................................... 4-4
Generalized Geologic Map of the San Francisco Bay Area Illustrating the
Location of Sandia National Laboratories, California .............................................................................. 4-7
Generalized Geologic Structures Including Faults Mapped in the
Vicinity of Sandia National Laboratories, California ............................................................................... 4-9
Generalized Schematic Stratigraphic Column for the Livermore Valley ................................................ 4-10
Four Drainage Basins and Watershed Boundaries in the Livermore Valley .......................................... 4-12
Existing and Former Groundwater Monitoring Well Locations excluding Fuel Oil Spill Wells ........... 4-14
Fuel Oil Spill Groundwater Monitoring Well Locations ........................................................................ 4-15
Storm Water Outfall Locations ............................................................................................................... 4-17
Storm Water Sampling Locations ........................................................................................................... 4-19
Site Sanitary Sewer System and the Liquid Effluent Control System Locations .................................. 4-20
Wildlife and Habitat at Sandia National Laboratories, California, as of May 2001 .............................. 4-22
Critical Habitat for California Red-legged Frog at Sandia National Laboratories, California ............... 4-25
Wind Rose 1996 through 2000 .............................................................................................................. 4-29
Locations of Bay Area Air Quality Management District Ambient
Air Monitoring Stations near Sandia National Laboratories, California .............................................. 4-33
Road Network in the Sandia National Laboratories, California Area ................................................... 4-37
Sandia National Laboratories, California Site Noise Measurement Map 2001 ..................................... 4-45
Most Sandia National Laboratories, California Employees Live
in a Three-County Area near the Site .................................................................................................... 4-49
Data and Analytical Contributions to the Sandia National Laboratories,
California Site-Wide Environmental Assessment .................................................................................... 5-2
Methodology for Air Quality Environmental Consequences ................................................................... 5-4
Methodology for Noise Environmental Consequences ............................................................................ 5-7
Sandia National Laboratories, California Facilities ................................................................................ 5-11
Construction and Wildlife Areas ........................................................................................................... 5-25
Future Construction and Maintenance Activities at Sandia National Laboratories, California .......... 5-29
List of Tables
Table 2-1.
Table 3-1.
Table 3-2.
Table 3-3.
Table 3-4.
Table 4-1.
Table 4-2.
viii
Other Common Activities ......................................................................................................................... 2-9
Comparison of Activity Levels at 13 Specific Facilities under the No Action,
Planned Utilization and Operations, and Maximum Operations Alternatives ........................................ 3-2
Summary of Improvements to Arroyo Seco by Priority ........................................................................... 3-7
Comparison of Data Used to Analyze Specific Facilities under the No Action,
Planned Utilization and Operations, and Maximum Operations Alternatives ...................................... 3-11
Comparison of Parameters Used to Analyze Sandia National Laboratories,
California under the No Action, Planned Utilization and Operations, and
Maximum Operations Alternative ......................................................................................................... 3-15
Federal and California Species with Protected or Sensitive Status Reported at or
in the Vicinity of Sandia National Laboratories, California .................................................................. 4-25
Comparison of 1996 to 2000 Criteria Pollutant Monitoring Results with
Applicable National and California Ambient Air Quality Standards .................................................... 4-31
Final SNL/CA SWEA DOE/EA-1422—January 2003
Table of Contents
Table 4-3.
Table 4-4.
Table 4-5.
Table 4-6.
Table 4-7.
Table 4-8.
Table 4-9.
Table 4-10.
Table 4-11.
Table 4-12.
Table 4-13.
Table 4-14.
Table 4-15.
Table 4-16.
Table 4-17.
Table 4-18.
Table 4-19.
Table 4-20.
Table 4-21.
Table 5-1.
Table 5-2.
Table 5-3.
Table 5-4.
Table 5-5.
Table 5-6.
Table 5-7.
Table 5-8.
Table 5-9.
Table 5-10.
Table 5-11.
Table 5-12.
Table 5-13.
Table 5-14.
Table 5-15.
Table 5-16.
Table 5-17.
Table 5-18.
Table 5-19.
Table 5-20.
Sandia National Laboratories, California Permitted Sources and Types of Pollutants Reported ......... 4-34
Criteria Pollutant Emission Rates .......................................................................................................... 4-35
Toxic Air Pollutant Emission Rates ....................................................................................................... 4-35
Utility Capacities and Quantities Used by Sandia National Laboratories, California ........................... 4-36
Building Types at Sandia National Laboratories, California ................................................................. 4-36
Sandia National Laboratories, California Organizations Responsible for the
Transportation of Hazardous and Nonhazardous Material .................................................................. 4-39
Waste Shipments during Calendar Year 2000 ........................................................................................ 4-39
Radioactive Waste Generated from 1996 through 2000 ......................................................................... 4-41
Hazardous Waste Generated from 1996 through 2000 ......................................................................... 4-42
Material Recycled in Calendar Year 2000 .............................................................................................. 4-42
Alameda County Noise Level Standards ................................................................................................ 4-44
Twenty-Four Hour Onsite Ambient Noise Monitoring ........................................................................ 4-44
Sandia National Laboratories (Labs-Wide) Radiation Exposure Data (1998 through 2000) .............. 4-47
Facilities Containing More than 500 Hazardous Chemicals .................................................................. 4-47
Sandia National Laboratories, California Injury and Illness Data
(1999 through 2001) Based on 200,000 Work Hours (100 workers) ................................................... 4-48
Demographic Profile of the Population in the Three-County Region of Influence ............................... 4-50
Population Estimates and Projections to 2010 ....................................................................................... 4-50
Employment and Income Profile in the Three-County Region of Influence. ........................................ 4-50
Housing and Education in the Region of Influence ............................................................................... 4-52
Natural Gas Fuel Usage at Sandia National Laboratories, California during Calendar Year 2000 ....... 5-13
Criteria Pollutant Emission Rates for the No Action Alternative ......................................................... 5-13
Air Toxic Emission Rates for the No Action Alternative ...................................................................... 5-14
Estimated Carbon Monoxide Emissions Associated with
LIGA Technologies Facility Construction Activities ............................................................................. 5-14
Carbon Monoxide Emissions from Sandia National Laboratories, California
under the No Action Alternative (Tons per Year) and Calendar Year 2000 (Baseline) ........................ 5-15
Annual Sandia National Laboratories, California Utility Usage and
Capacities under the No Action Alternative .......................................................................................... 5-16
Annual Sandia National Laboratories, California Transportation Activities
under the No Action Alternative ........................................................................................................... 5-16
Average Annual Radioactive Waste Generation under the No Action Alternative .............................. 5-17
Average Annual Generation by Specific Sandia National Laboratories, California
Facilities under the No Action Alternative ............................................................................................ 5-18
Average Annual Hazardous Waste Generated under the No Action
Alternative by Waste Type ..................................................................................................................... 5-19
Peak Attenuated Noise Levels (dBA) Expected from Operation of Construction Equipment .............. 5-21
Permissible Noise Exposure .................................................................................................................... 5-21
Estimated Radiological Dose and Health Impacts to Sandia National Laboratories,
California Workers for the No Action Alternative (Based on 3-Year Average) ..................................... 5-22
Estimated Occupational Safety Impacts to Sandia National Laboratories,
California Workers for the No Action Alternative ................................................................................ 5-22
Summary of Potential Environmental Justice Impacts under the No Action Alternative .................... 5-24
Criteria Pollutant Emission Rates for the Planned Utilization
Alternative and Operations Alternative ................................................................................................ 5-30
Air Toxic Emission Rates for the Planned Utilization Alternative and Operations Alternative .......... 5-31
Estimated Carbon Monoxide Emissions Associated with Representative Construction Activities ..... 5-32
Estimated Carbon Monoxide Emissions Associated with Soil and Fill Material
during Arroyo Seco Improvement .......................................................................................................... 5-32
Carbon Monoxide Emissions from Sandia National Laboratories, California
under the Planned Utilization and Operations Alternative and Calendar Year 2000 ........................... 5-33
Final SNL/CA SWEA DOE/EA-1422—January 2003
ix
Table of Contents
Table 5-21. Annual Sandia National Laboratories, California Utility Usage and
Capacities under the Planned Utilization and Operations Alternative ................................................. 5-34
Table 5-22. Transportation Activities under the Planned Utilization and Operations Alternative ........................ 5-34
Table 5-23. Average Annual Radioactive Waste Generation under the Planned Utilization
Alternative and Operations Alternative ................................................................................................ 5-35
Table 5-24. Average Annual Generation by Specific Sandia National Laboratories,
California Facilities under the Planned Utilization and Operations Alternative .................................. 5-36
Table 5-25. Average Annual Hazardous Waste Generation under the
Planned Utilization Alternative and Operations Alternative ................................................................ 5-37
Table 5-26. Estimated Radiological Dose and Health Impacts to Sandia National
Laboratories, California Workers by Alternative ................................................................................... 5-39
Table 5-27. Estimated Occupational Safety Impacts to Sandia National
Laboratories, California Workers ........................................................................................................... 5-39
Table 5-28. Sandia National Laboratories, California’s Current Impact on the Regional Economy ....................... 5-40
Table 5-29. Sandia National Laboratories, California’s Estimate of Planned
Utilization and Operations Alternative Impacts on the Regional Economy ......................................... 5-40
Table 5-30. Criteria Pollutant Emission Rates for the Maximum Operations Alternative ...................................... 5-42
Table 5-31. Air Toxic Emission Rates for the Maximum Operations Alternative .................................................. 5-43
Table 5-32. Estimated Carbon Monoxide Emissions Associated with Representative
Project Construction Activities .............................................................................................................. 5-43
Table 5-33. Carbon Monoxide Emissions from Sandia National Laboratories,
California under the Maximum Operations Alternative and Calendar Year 2000 ............................... 5-44
Table 5-34. Annual Sandia National Laboratories, California Utility Usage and
Capacities under the Maximum Operations Alternative ....................................................................... 5-45
Table 5-35. Transportation Activities under the Maximum Operations Alternative .............................................. 5-45
Table 5-36. Average Annual Radioactive Waste Generation under the Maximum Operations Alternative ........... 5-46
Table 5-37. Average Annual Waste Generation by Specific Sandia National Laboratories,
California Facilities under the Maximum Operations Alternative ........................................................ 5-47
Table 5-38. Average Annual Hazardous Waste Generation
under the Maximum Operations Alternative ........................................................................................ 5-49
Table 5-39. Estimated Radiological Dose and Health Impacts to Sandia National
Laboratories, California Workers by Alternative ................................................................................... 5-50
Table 5-40. Estimated Occupational Safety Impacts to Sandia National Laboratories,
California Workers by Alternative ......................................................................................................... 5-50
Table 5-41. Sandia National Laboratories, California’s Current Impact on the Regional Economy ........................ 5-51
Table 5-42. Sandia National Laboratories, California’s Estimate of Maximum
Operations Alternative Impacts on the Regional Economy .................................................................. 5-52
Table 5-43. Physical Effects as a Function of Distance for the Postulated Flammable Gas Explosions .................. 5-53
Table 5-44. Comparison of Potential Consequences of Continued Operations at
Sandia National Laboratories, California ............................................................................................... 5-54
Table 6-1. Comparison of Potential Cumulative Impact Data by Resource Area ...................................................... 6-2
x
Final SNL/CA SWEA DOE/EA-1422—January 2003
Acronyms
Acronyms
ALARA ............................................................ as low as reasonably achievable
AAQS ............................................................... ambient air quality standards
ABAG ............................................................... Association of Bay Area Governments
ACGIH ............................................................. American Conference of Governmental Industrial Hygienists
AEA ................................................................. Atomic Energy Act
AT&T ............................................................... American Telephone and Telegraph
BAAQMD ........................................................ Bay Area Air Quality Management District
BEA .................................................................. Bureau of Economic Analysis
CAA .............................................................................. Clean Air Act
CARB ................................................................ California Air Resources Board
CDC .................................................................. Center for Disease Control
CDFG ............................................................... California Department of Fish and Game
CDRL ............................................................... Chemical and Radiation Detection Laboratory
CEQ .................................................................. Council on Environmental Quality
CERCLA ........................................................... Comprehensive Environmental Response Compensation and Liability Act
CESA ................................................................ California Endangered Species Act
CFR .................................................................. Code of Federal Regulations
CIS .................................................................... Chemical Information System
CMSA ............................................................... Consolidated Metropolitan Statistical Area
CO ..................................................................... carbon monoxide
CO2 ................................................................... carbon dioxide
CRADA ............................................................ Cooperative Research and Development Agreements
CRF .................................................................. Combustion Research Facility
CWA ................................................................. Clean Water Act
CY ..................................................................... calendar year
D&D ................................................................. decontamination and decommissioning
DISL ................................................................. Distributed Information Systems Laboratory
DoD .................................................................. Department of Defense
DOE .................................................................. U.S. Department of Energy
DOI ................................................................... U.S. Department of the Interior
DOT ................................................................. U.S. Department of Transportation
DP ..................................................................... Defense Programs
DTSC ................................................................ California Department of Toxic Substance Control
EDE .................................................................. effective dose equivalent
EDS .................................................................. Explosive Destruction System
EID ................................................................... environmental information document
EIR ................................................................... Environmental Information Report
EIS .................................................................... Environmental Impact Statement
EO ..................................................................... Executive Order
EPA ................................................................... U.S. Environmental Protection Agency
EPCRA ........................................................................ Emergency Planning and Community Right-to-Know Act
ER ..................................................................... Environmental Restoration
ERPG-2 ............................................................ Emergency Response Planning Guideline Level 2
ES&H ............................................................... environment, safety, and health
ESA .................................................................. Explosive Storage Area
FAA .................................................................. Federal Aviation Administration
FEMA ............................................................... Federal Emergency Management Agency
Final SNL/CA SWEA DOE/EA-1422—January 2003
xi
Acronyms
FFCA ............................................................................ Federal Facility Compliance Act
FONSI .............................................................. Finding of No Significant Impact
FOS ................................................................... fuel oil spill
FSID ................................................................. Facilities and Safety Information Document
FY ..................................................................... fiscal year
GWPMPP ......................................................... groundwater protection management program plan
HSWA ............................................................... Hazardous and Solid Waste Amendments of 1984
I ......................................................................... Interstate
IMTL ................................................................ Integrated Manufacturing Technology Laboratory
ISMS ................................................................. Integrated Safety Management System
JIT .................................................................... “just-in-time”
LANL ............................................................... Los Alamos National Laboratory
lcf ...................................................................... latent cancer fatalities
LDRD ............................................................... Laboratory Directed Research and Development
LECS ................................................................. Liquid Effluent Control System
LIGA ................................................................ Lithographie Galvanoformung and Abformung
LLMW .............................................................. low-level mixed waste
LLNL ................................................................ Lawrence Livermore National Laboratory
LLW .................................................................. low-level waste
LTF ................................................................... LIGA Technologies Facility
LVJUSD ............................................................ Livermore Valley Joint Unified School District
LWC .................................................................. lost work day case
LWRP ............................................................... Livermore Wastewater Reclamation Plant
M&O ................................................................ management and operating
MANTL ........................................................... Micro and Nano Technologies Laboratory
MCL .................................................................. maximum contaminant level
MEI ................................................................... maximally exposed individual
MTRU .............................................................. mixed transuranic waste
MWMA ............................................................ Medical Waste Management Act
NA .................................................................... not applicable/not available
NAAQS ............................................................ National Ambient Air Quality Standards
NASA ............................................................... National Aeronautics and Space Administration
NCA .................................................................. Noise Control Act
NCCP ................................................................ Natural Community Conservation Planning
NEPA ................................................................ National Environmental Policy Act
NESHAP .......................................................... National Emission Standards for Hazardous Air Pollutants
NMED .............................................................. New Mexico Environment Department
NMFS ............................................................... National Marine Fisheries Service
NNSA ............................................................... National Nuclear Security Administration
NO2 ................................................................... nitrogen dioxide
NOI ................................................................... Notice of Intent
NOx ................................................................... oxides of nitrogen
NPDES ............................................................. National Pollutant Discharge Elimination System
NPS ................................................................... National Park Service
NR .................................................................... National Register
NR .................................................................... not reported
NRC .................................................................. U.S. Nuclear Regulatory Commission
NRHP ............................................................... National Register of Historic Places
xii
Final SNL/CA SWEA DOE/EA-1422—January 2003
Acronyms
O3 ...................................................................... ozone
ORPS ................................................................ Occurrence Reporting and Processing System
OSHA ............................................................... Occupational Safety and Health Act of 1970
Pb ...................................................................... lead
PCB ................................................................... polychlorinated biphenyl
PDD .................................................................. Presidential Decision Directive
PEIS .................................................................. Programmatic Environmental Impact Statement
PG&E ............................................................... Pacific Gas and Electric Company
PHS ................................................................... preliminary hazard screening
PMSA ............................................................... Primary Metropolitan Statistical Area
R&D ................................................................. research and development
RCRA ............................................................... Resource Conservation and Recovery Act
RMMA ............................................................. Radioactive Materials Management Areas
ROD .................................................................. Record of Decision
RPM ................................................................. Risk Management Plan
RPPM ............................................................... Radiological Protection Procedures Manual
RWQCBs .......................................................... Regional Water Quality Control Boards
SAAQS ............................................................. State Ambient Air Quality Standards
SARA ............................................................... Superfund Amendments and Reauthorization Act, Title III
SDWA ............................................................... Safe Drinking Water Act
SHPO ................................................................ State Historic Preservation Officer
SIP .................................................................... state implementation plan
SNL ................................................................... Sandia National Laboratories
SNL/CA ............................................................ Sandia National Laboratories/California
SNL/NM .......................................................... Sandia National Laboratories/New Mexico
SO2 .................................................................... sulfur dioxide
SSM .................................................................. Stockpile Stewardship and Management
SSO ................................................................... Sandia Site Office
START ............................................................. Strategic Arms Reduction Treaty
SWEA ............................................................... Site-Wide Environmental Assessment
SWEIS .............................................................. Site-Wide Environmental Impact Statement
SWPPP ............................................................. Storm Water Pollution Prevention Plan
TAC .................................................................. toxic air contaminant
TLV ................................................................... threshold limit value
TNT ................................................................. trinitrotoluene
TPH .................................................................. total petroleum hydrocarbons
TRC .................................................................. total reportable case
TRU .................................................................. transuranic waste
TSCA ................................................................ Toxic Substances Control Act
U.S.C. . ............................................................. United States Code
USFWS ............................................................. U.S. Fish and Wildlife Service
UST .................................................................. underground storage tanks
VOC .................................................................. volatile organic compound
WFO ................................................................. work for others
WM PEIS ......................................................... Waste Management Programmatic Environmental Impact Statement
WMSF .............................................................. Waste Management Storage Facilities
Final SNL/CA SWEA DOE/EA-1422—January 2003
xiii
Units of Measure
Units of Measure
% ...................................................................... percent
< ...................................................................... less than
> ...................................................................... greater than
cfs ..................................................................... cubic ft per second
cy ...................................................................... cubic yards
dB ...................................................................... decibel
dBA ................................................................... decibel, A-weighted sound levels
F ........................................................................ Fahrenheit
ft/sec ................................................................. feet per second
ft3 ...................................................................... cubic feet
FY ..................................................................... fiscal year
g ........................................................................ gram
gsf ..................................................................... gross square feet
kg ...................................................................... kilograms
kg/year ............................................................. kilograms per year
km ..................................................................... kilometers
kV ..................................................................... kilovolt
lbs ..................................................................... pounds
lbs/hour peak ................................................... pounds per hour peak
Ld ....................................................................... day noise level
Ldn ..................................................................... average day to night noise level
Ln ...................................................................... night noise level
M ft3 .................................................................. million cubic feet per year
M gal ................................................................. millions of gallons
m ....................................................................... meters
M ....................................................................... million
m3 ...................................................................... cubic meters
MGY ................................................................. million gallons per year
mi ...................................................................... mile/miles
mrem ................................................................ millirem
mrem/yr ........................................................... millirem per year
MSL .................................................................. mean sea level
MW ................................................................... megawatt
MWh ................................................................ megawatt hour
nCi/g ................................................................. nanocuries per gram
pH ..................................................................... relative acidity
PM10 .................................................................. particulate matter less than 10 microns in diameter
ppmv ................................................................. parts per million by volume
psi ..................................................................... pounds per square inch
rem .................................................................... Roentgen equivalent, man
sq ft ................................................................... square feet/foot
sq mi ................................................................. square mile
xiv
Final SNL/CA SWEA DOE/EA-1422—January 2003
Chapter 1, Introduction and Purpose and Need for Agency Action
CHAPTER 1
Introduction and Purpose and Need for Agency Action
This chapter introduces Sandia National Laboratories’ (SNL’s) role in supporting the United States (U.S.) Department
of Energy’s (DOE’s) and National Nuclear Security Administration’s (NNSA’s) statutory missions and operations. It
also provides a statement of the purpose and need for the Agency’s action, a description of the DOE missions for SNL, an
overview of the alternatives to be considered, and discusses the public participation process and related National Environmental Policy Act (NEPA) documents. Finally, it discusses the organization and contents of the remaining chapters in
the Site-Wide Environmental Assessment (SWEA).
1.1
INTRODUCTION
Sandia National Laboratories (SNL) is one of three
national laboratories that support the DOE’s statutory
responsibilities for nuclear weapons research and design,
development of energy technologies, and basic scientific
research. SNL is composed of four geographically separated facilities: Albuquerque, New Mexico (SNL/NM);
Tonopah, Nevada; Kauai, Hawaii; and Livermore, California (SNL/CA). This SWEA focuses on SNL/CA.
SNL/CA has an annual budget estimated at $130 million
and a workforce of approximately 1,080. SNL/CA comprises approximately 410 acres of Federal land (owned by
the DOE) east of the City of Livermore, California (Figure
1-1). SNL/CA is located directly south of Lawrence Livermore National Laboratory (LLNL). East Avenue separates
the two facilities. The NNSA, responsible for carrying out
the national security responsibilities of DOE, has prepared the SNL/CA SWEA to examine the environmental
impacts associated with three alternatives for SNL/CA’s
continued operation. In the SNL/CA SWEA, the NNSA
describes the consequences, both onsite and offsite, of
ongoing and proposed SNL/CA operations, and compares
the potential consequences to three alternative levels of
future operations. DOE and NNSA activities, at the national laboratories and production facilities, are known as
mission/business lines. Descriptions of the DOE mission/
business lines are:
❍
National Security—enhancing national security
through military application of nuclear technology
and by reducing global danger from the potential
spread of weapons of mass destruction.
❍
Energy Resources—promoting the development
and deployment of systems and practices that provide
energy that is clean, efficient, reasonably priced,
and reliable.
❍
Environmental Quality—cleaning up the legacy
of nuclear weapons and nuclear research activities,
safely managing nuclear materials, and disposing
of radioactive wastes.
❍
Science—advancing science and scientific tools to
provide the foundation for the DOE’s applied mis-
Final SNL/CA SWEA DOE/EA-1422—January 2003
sions and to provide insights into our physical
and biological world.
In 2000, the NNSA was created within the DOE to
carry out the department’s national security responsibilities. Its mission includes maintenance of a safe, secure
and reliable stockpile of nuclear weapons and associated
materials capabilities and technologies; promotion of
international nuclear safety and nonproliferation; and
administration and management of the naval nuclear
propulsion program. The NNSA officially began operations on March 1, 2000 (NNSA 2002a). The majority
of activities, operations, and facilities at SNL/CA are
under the responsibility of the NNSA.
The U.S. Department of Energy’s
Mission Statement
To foster a secure and reliable energy system that
is environmentally and economically sustainable;
to be a responsible steward of the Nation’s nuclear
weapons; to clean up the DOE’s facilities; to lead
in the physical sciences and advance the biological,
environmental, and computational sciences; and
to provide premier scientific instruments for the
Nation’s research enterprise (DOE 2002a).
The National Nuclear Security
Administration’s Mission Statement
To enhance United States national security through
the military application of nuclear energy; to maintain
and enhance the safety, reliability, and performance of
the United States nuclear weapons stockpile, including
the ability to design, produce, and test, in order to meet
national security requirements; to provide the United
States Navy with safe, militarily effective nuclear
propulsion plants and to ensure the safe and reliable
operation of those plants; to promote international
nuclear safety and nonproliferation; to reduce global
danger from weapons of mass destruction; and to
support United States leadership in science and
technology (NNSA 2002a).
1-1
Chapter 1, Introduction and Purpose and Need for Agency Action
Source: CDT 2002a
Figure 1-1. Sandia National Laboratories, California
is Located East of Livermore in Alameda County, California
Historically, national security has meant defense against
foreign military threats. However, over time the threats to
our nation have become increasingly varied and complex.
To meet these challenges, the DOE/NNSA missions for
SNL have evolved in response to emerging national needs.
As a result of the terrorist attacks on September 11, 2001,
the NNSA believes SNL capabilities in enhancing national security through military application of nuclear technology and developing technologies to reduce the global
danger from weapons of mass destruction are needed to
support the Office of Homeland Security. Support of the
1-2
Office of Homeland Security is part of the ongoing
mission lines of the DOE and NNSA.
1.2
PURPOSE AND NEED
FOR AGENCY ACTION
The DOE needs to continue to meet its responsibilities
for national security (including homeland security),
energy resources, environmental quality, and science
at SNL/CA. The DOE needs to continue to fulfill its responsibilities as mandated by statute, Presidential Decision Directive (PDD), and congressional authorization
Final SNL/CA SWEA DOE/EA-1422—January 2003
Chapter 1, Introduction and Purpose and Need for Agency Action
The Office of Homeland Security
Mission Statement
On October 8, 2001, the President established
within the Executive Office of the President an Office
of Homeland Security and the Homeland Security
Council (Executive Order [EO] 13228). The mission
of the Office will be to develop and coordinate the
implementation of a comprehensive national strategy
to secure the United States from terrorist threats or
attacks. The Office will coordinate the executive
branch’s efforts to detect, prepare for, prevent, protect
against, respond to, and recover from terrorist attacks
within the United States (66 FR 51812).
and appropriation, while meeting this need in a manner
that protects human health and the environment. As
previously stated, the DOE missions for SNL have evolved
over time in response to national needs (for example,
EO 13228). When assigning missions to SNL, the DOE
considers many factors, including the following PDDs;
the National Defense Authorization Act of 2002 (P.L. 107107); the Department of Defense (DoD) Nuclear Posture
Review; and treaties, both implemented and proposed,
including the Nuclear Nonproliferation Treaty, Strategic
Arms Reduction Treaty (START) I, proposed START II,
and the proposed Comprehensive Test Ban Treaty. Operations at SNL/CA comprise four broad areas: weapons,
integrated systems and technologies, research, and exemplary operations. Following are specialized capabilities
SNL/CA provides in support of the DOE’s mission/
business lines:
❍
science-based performance and reliability testing
and computer-based modeling of nuclear weapon
components;
❍
development, design, and testing of nonnuclear
components for nuclear weapon systems;
❍
materials and diagnostic equipment research and
testing (involves biological, chemical, waste, and
radiological materials including research and testing
associated with Homeland Defense);
❍
energy and environmental research;
❍
microelectronics, microsystems, and nanotechnologies.
1.3
that will meet its purpose and need for agency action
and support existing and potential future program-related
activities at SNL/CA.
1.3.1
The No Action Alternative includes continuing and
historical research and development operations and
related activities of SNL/CA. Specifically, the No
Action Alternative includes:
❍
continuing the level of activity at 10 existing
facilities/groups as discussed in Section 3.2
❍
continuing the level of support specified as
“balance of operations” as detailed in Section 3.5
❍
constructing and operating (details in Section 3.2)
the LIGA Technologies Facility (see LIGA text box
in Section 2.3.2), Distributed Information Systems
Laboratory, and the Glass Furnace and Melting
Laboratory
❍
continuing modifications to the Hazardous Waste
Storage Facilities
❍
continuing removal of several small structures
totaling approximately 15,000 square feet (sq ft)
❍
continuing routine SNL/CA activities such as
maintenance support, environmental monitoring,
chemical materials management, and waste
management (see Section 2.3.3)
❍
completing several General Plant Projects
previously approved.
1.3.2
Final SNL/CA SWEA DOE/EA-1422—January 2003
PLANNED UTILIZATION AND
OPERATIONS ALTERNATIVE
The Planned Utilization and Operations Alternative
would include all the operations and activities identified
in the No Action Alternative, plus implementing planned
facility operations in support of SNL/CA’s assigned missions (see Section 3.3), and changing current land use.
This alternative differs from the No Action Alternative
in that:
❍
Thirteen facilities/groups would operate at generally
higher levels of activity and staffing (see Section 3.3).
❍
“Balance of operations” (see Section 3.5) would increase to support higher levels of activity and staffing.
In general, the increase would be based on a 13 percent
site-wide staffing increase above current levels.
❍
Arroyo Seco would undergo improvements as
described in the Management Plan for Arroyo Seco
and the Biological Assessment.
ALTERNATIVES
The NNSA proposes to continue operating SNL/CA
and managing its resources in a manner that meets evolving DOE mission lines and that responds to the concerns
of affected and interested individuals and agencies. The
NNSA identified three alternatives—No Action, Planned
Utilization and Operations, and Maximum Operations—
NO ACTION ALTERNATIVE
1-3
Chapter 1, Introduction and Purpose and Need for Agency Action
❍
A 30-acre wildlife reserve would be established.
❍
A Grant of Easement and Agreement would be
made with the landowner concerning the land
along the SNL/CA western boundary.
❍
93 acres would be designated as future construction
sites including onsite soil management.
❍
122 acres would, for future land use, be identified
as undesignated.
❍
Storm water runoff areas would be upgraded
including new sewer line supports and East
Avenue security grate.
❍
Onsite soil management (25 acres within the
93 acres designated as future construction) of clean
dirt/fill from Arroyo Seco improvements, storm
water projects, and construction projects would
be established.
❍
General Plant Projects including upgrades to the
water distribution system would be completed.
❍
Renovation of Building 916 would be completed.
❍
A new 5,000 sq ft badge office complex including
parking, bus turnaround, and lane improvements
would be constructed (8 acres within the 93 acres
designated for future construction).
1.3.3
MAXIMUM OPERATIONS ALTERNATIVE
The Maximum Operations Alternative would include
all the operations and activities identified in the Planned
Utilization and Operations Alternative, plus implementing two shifts at specific facilities in support of SNL/CA’s
assigned missions (see Section 3.4), changing current land
uses, and constructing two new facilities.
This alternative differs from the Planned Utilization and
Operations Alternative in that:
❍
Most of 13 facilities/groups would operate with two
shifts (see Section 3.4).
❍
“Balance of operations” (see Section 3.5) would
increase to support higher levels of activity and
staffing. In general, the increase would be based
on a 53 percent site-wide staffing increase above
current levels.
❍
Building 916 (42,000 sq ft) would be replaced with
a building twice the size (84,000 sq ft).
❍
A new 16,000 sq ft facility, similar to the existing
Chemical and Radiation Detection Laboratory
(CRDL), would be constructed for research and
development.
❍
1-4
Up to 100,000 sq ft of facilities determined to be
beyond economically useful life would be removed.
1.4
OBJECTIVE OF THE SITE-WIDE
ENVIRONMENTAL ASSESSMENT
The DOE established its NEPA implementing regulations (10 Code of Federal Regulations [CFR] Part 1021.
330) that allow preparation of site-wide documents for
certain large, multiple-facility sites, such as SNL/CA.
Pursuant to NEPA of 1969 (42 United States Code [U.S.C.]
§4321 et seq.), the Council on Environmental Quality’s
(CEQ’s) NEPA regulations (40 CFR Parts 1500-1508)
and the DOE NEPA regulations (10 CFR Part 1021),
the DOE/NNSA decided to complete a SWEA for the
SNL/CA site.
The objective of the SNL/CA SWEA is to provide the
DOE, NNSA, other agencies, and the public with:
❍
an analysis of the potential environmental impacts
caused by ongoing and reasonably foreseeable new
operations and facilities and reasonable alternatives
at SNL/CA;
❍
a basis for site-wide decision making;
❍
improved coordination of agency plans, functions,
programs, and resource utilization;
❍
a clearer understanding of the impacts created by
SNL/CA operations separate from LLNL operations;
❍
sufficient information to facilitate routine decisions
by the DOE regarding verification of operational
status; and
❍
an understanding of SNL/CA’s contribution to
cumulative environmental impacts for inclusion in
the proposed 2003 LLNL SWEIS (DOE/EIS-0157)
(DOE 1992a).
The SNL/CA SWEA provides authorization limits for the
Laboratory. The SNL/CA SWEA will also enable NNSA
to “tier” its NEPA documentation, to eliminate repetitive
discussion of the same issues in future NEPA reviews,
and to focus on the actual issues ready for decisions at
each level of environmental review.
In February 2002, the NNSA identified the need to
update baseline information and impact analysis to
support the current SNL/CA site planning. To meet
this need, NNSA decided to prepare a SWEA and sepa-
Sandia Site Office (SSO)
The OKSO is the DOE/NNSA onsite presence
and serves as a steward for the preservation and
enhancement of SNL as a national resource for
science and technology. The main office of OKSO
is located on Kirtland Air Force Base in Albuquerque,
New Mexico.
Final SNL/CA SWEA DOE/EA-1422—January 2003
Chapter 1, Introduction and Purpose and Need for Agency Action
rate the analysis of SNL/CA operations from those
at LLNL. The previous site-wide analysis of SNL/CA
operations was contained in a joint 1992 Environmental
Impact Statement (EIS)/ Environmental Impact Report
(EIR) (DOE 1992a) prepared for the two sites. At the
time that the SWEA decision was made, a revision date
for the LLNL EIS/EIR had not been set. The LLNL sitewide EIS/EIR has since been proposed for 2003. The
NNSA recognizes and understands that the SNL/CA
SWEA will provide valuable information for use in the
LLNL NEPA process and analysis of cumulative impacts.
NNSA also recognizes that waiting for the next LLNL
site-wide EIS (SWEIS) would delay planned actions at
SNL/CA and place unnecessary burdens on the NNSA/
Sandia Site Office (SSO) NEPA compliance and decisionmaking process. As a result, the NNSA decided to continue with preparation of a SWEA to provide a thorough
environmental analysis and description of impacts for
ongoing and proposed SNL/CA operations.
Scoping for the SWEA consisted of both internal NNSA
scoping and external public scoping processes. The internal NNSA scoping process began with working groups
comprised of DOE/NNSA managers and SNL/CA managers. The external scoping process period began after the
publication of the NOI (67 FR 5089) on February 4, 2002,
and continued until March 6, 2002. The NOI notified the
public that the NNSA was intending to prepare a SWEA
on SNL/CA operations and to invite other Federal agencies, Native American tribes, state and local governments,
and the general public to participate in the scoping process. The NOI also presented background information
on SNL/CA and preliminary alternatives and issues
identified through the internal scoping process.
1.5
The public was invited to present oral and/or written
comments at the scoping meetings. Comments were
accepted by mail, facsimile, electronic mail, or by a
toll-free telephone number.
DECISIONS TO BE SUPPORTED
BY THE SITE-WIDE ENVIRONMENTAL ASSESSMENT
The SWEA will be used to support the DOE/NNSA’s
decisions on the levels of operations at SNL/CA, and
serve as a basis for tiering future NEPA analyses and
decisions regarding specific activities. If mitigation
measures, monitoring, or other conditions are adopted
as part of the DOE/NNSA decision, these too, will be
summarized. The NNSA’s Notice of Intent (NOI)
(67 FR 5089) proposed two preliminary alternatives,
the No Action and Expanded Operations Alternatives,
to be considered in the SWEA. The SWEA analyzes
the environmental impacts of activities at SNL/CA
associated with three alternatives, as well as activities
common to all alternatives including maintenance
support and material management.
1.6
PUBLIC PARTICIPATION
Public participation is part of the process used in the
preparation of the SWEA. This section summarizes
the public scoping process.
1.6.1
SCOPING PROCESS
Scoping is a process for determining the range of issues
addressed in a NEPA document and for identifying significant issues associated with the alternatives (40 CFR Part
1501.7). The objectives of the scoping process are to
notify interested persons, agencies, and other groups
about the proposed action and the alternatives being considered; solicit comments about environmental issues,
alternatives, and other items of interest; and consider
those comments in the preparation of the SWEA.
Final SNL/CA SWEA DOE/EA-1422—January 2003
Public scoping meetings for the general public were
held on February 20, 2002. At these meetings, the DOE/
NNSA presented information on its proposal to prepare
the SWEA and the alternatives to be analyzed.
1.6.2
SUMMARY OF SCOPING ISSUES AND CONCERNS
During the public scoping process, no individuals or
organizations submitted requests for information or
made oral or written comments.
1.6.3
PUBLIC COMMENT PROCESS
The NNSA released the Draft SWEA in November 2002
for review and comment by the state of California, Native
American tribes, local governments, other Federal agencies, and the general public. The formal public comment
period lasted 30 days, ending on November 30, 2002.
The NNSA anticipated answering all comments received
during the public comment period, to evaluate the accuracy and adequacy of the Draft SWEA and to determine
whether it needed to correct, clarify, or otherwise revise
the SWEA text. During the Draft SWEA comment period, a limited number of comments were received, a summary of the changes to the SWEA are found in Section
1.6.4 below.
1.6.4
CHANGES TO THE DRAFT SWEA
The NNSA revised the Draft SWEA in response to the
limited number of comments received from other Federal
agencies; tribal, state, and local governments; nongovernmental organizations; the general public and internal
reviews. The NNSA received no comments from other
Federal agencies; tribal, local governments, or nongovernmental organizations. One member of the general public
submitted comments primarily associated with geology,
1-5
Chapter 1, Introduction and Purpose and Need for Agency Action
soils, and water resources. A letter from the State of California Governor’s Office of Planning and Research was
received with no comments attached. All comments received were considered and every effort was made to
incorporate changes to the document.
In addition, revisions were made on internal reviews. The
text was changed to provide additional environmental
baseline information, correct inaccuracies, make editorial
correction, and provide additional discussions of technical considerations and clarify text.
1.6.5
RELATED NATIONAL ENVIRONMENTAL
POLICY ACT DOCUMENTS
The following NEPA documents analyzed ongoing
programs and activities at SNL/CA:
❍
❍
Final (September 1996) Programmatic EIS (PEIS)
for Stockpile Stewardship and Management (SSM)
(DOE/EIS 0236-F).
Final (May 1997) Waste Management PEIS for
Managing Treatment, Storage, and Disposal of
Radioactive and Hazardous Waste (DOE/EIS-0200-F).
❍
Nonnuclear Consolidation Environmental
Assessment (EA) (June 1993) (DOE/EA-0792).
❍
Final (August 1992) EIS and EIR for Continued
Operation of LLNL and SNL/CA (DOE/EIS-0157).
❍
Supplement Analysis (March 1999) for Continued
Operation of LLNL and SNL/CA (DOE/EIS-0157-SA-01).
❍
Draft (May 2002) EA for the East Avenue Security
Upgrade at LLNL and SNL/CA (DOE/EA 1439).
1.7.1
FINAL (SEPTEMBER 1996) STOCKPILE
STEWARDSHIP AND MANAGEMENT
PROGRAMMATIC ENVIRONMENTAL IMPACT
STATEMENT (DOE/EIS-0236-F)
The DOE prepared the SSM PEIS to evaluate stockpile
stewardship activities required to maintain a high level
of confidence in the safety, reliability, and performance
of nuclear weapons in the absence of underground testing and to be prepared to resume underground testing of
nuclear weapons if directed by the President. Stockpile
management activities include maintenance, evaluation,
repair, or replacement of weapons in existing stockpiles.
1-6
1.7.2
NEXT STEPS
Based on the analysis in the SWEA, NNSA will determine
whether the three alternatives are a major federal action
significantly affecting the quality of the human environment within the meaning of NEPA, 42 U.S.C. 4321, et seq.
NNSA will publish the decision to issue a Finding of No
Significant Impact (FONSI) or to prepare an EIS.
1.7
The SSM PEIS examined the existing basic capabilities
of the DOE laboratory and industrial complex, including
those of SNL. The Record of Decision (ROD) for the PEIS
determined SNL would continue as one of three weapons
laboratories possessing most of the core intellectual and
technical competencies of the U.S. in nuclear weapons.
FINAL (MAY 1997) WASTE MANAGEMENT
PROGRAMMATIC ENVIRONMENTAL IMPACT
STATEMENT FOR MANAGING TREATMENT,
STORAGE, AND DISPOSAL OF RADIOACTIVE
AND HAZARDOUS WASTE (DOE/EIS-0200-F)
In the Waste Management PEIS (WM PEIS), the DOE
evaluated the environmental impacts of alternatives
for managing five types of radioactive and/or hazardous
waste generated by defense and research activities at a
variety of DOE sites around the United States. SNL/CA
manages three of the five waste types: low-level waste
(LLW), low-level mixed waste (LLMW), and hazardous
waste.
On January 23, 1998, the DOE decided SNL/CA would
continue to ship its hazardous waste offsite for treatment
(DOE 1998a). The DOE decided on a national strategy
for treatment and disposal of LLW and LLMW; SNL/CA
would ship both waste types offsite for disposal.
1.7.3
NONNUCLEAR CONSOLIDATION ENVIRONMENTAL
ASSESSMENT (JUNE 1993) (DOE/EA-0792)
The DOE prepared the Nonnuclear Consolidation EA
to evaluate the consolidation of nonnuclear component
manufacturing, storage, and surveillance functions (DOE
1993a). The EA discussed six categories of capabilities:
electrical/mechanical; tritium handling; detonation; beryllium technology and pit support; neutron generators, cap
assemblies, and batteries; and special products. The Finding of No Significant Impact (FONSI) for the EA determined the significance of impacts for the continuation
of SNL/CA’s existing research, development, testing,
and prototyping capability (DOE 1993a).
1.7.4
FINAL (AUGUST 1992) ENVIRONMENTAL
IMPACT STATEMENT AND ENVIRONMENTAL
IMPACT REPORT FOR CONTINUED OPERATION
OF LAWRENCE LIVERMORE NATIONAL
LABORATORY AND SANDIA NATIONAL
LABORATORIES, LIVERMORE (DOE/EIS-0157)
In the Final EIS and EIR for Continued Operation of
LLNL and SNL/CA, the DOE evaluated the environmental impacts of alternatives for continuing operations,
program-matic enhancements, and near-term proposed
projects (DOE 1992a).
Final SNL/CA SWEA DOE/EA-1422—January 2003
Chapter 1, Introduction and Purpose and Need for Agency Action
1.7.5
SUPPLEMENT ANALYSIS (MARCH 1999)
FOR CONTINUED OPERATION OF LAWRENCE
LIVERMORE NATIONAL LABORATORY AND
SANDIA NATIONAL LABORATORIES, LIVERMORE
(DOE/EIS-0157-SA-01)
The DOE prepared the Supplement Analysis for
Continued Operation of LLNL and SNL/CA to consider whether the 1992 EIS/EIR should be supplemented, a new environmental impact statement should
be prepared, or no further NEPA documentation
was required.
In March 1999, the DOE decided that supplementation
of the 1992 EIS/EIR was not needed and therefore, no
further NEPA documentation was required (DOE 1999a).
1.7.6
DRAFT (MAY 2002) ENVIRONMENTAL
ASSESSMENT FOR THE EAST AVENUE SECURITY
UPGRADE AT LAWRENCE LIVERMORE NATIONAL
LABORATORY/SANDIA NATIONAL LABORATORIES,
LIVERMORE (DOE/EA-1439)
The DOE is preparing the East Avenue EA to evaluate
the upgrade of the 1.25-mi roadway running between the
LLNL and SNL/CA. The EA discusses three alternatives:
the Proposed Action, No Action, and construction of new
facilities and relocation of personnel and equipment. The
Proposed Action would restrict the roadway to the general public on either a temporary or a permanent basis to
improve security.
1.8
THE SITE-WIDE
ENVIRONMENTAL ASSESSMENT
The remaining chapters in the SWEA include an overview of SNL/CA operations, alternatives for continuing
operations at SNL/CA, the affected environment, the
environmental consequences, and cumulative impacts.
Final SNL/CA SWEA DOE/EA-1422—January 2003
1-7
This page intentionally left blank.
Chapter 2, Operations Overview of Sandia National Laboratories, California
CHAPTER 2
Operations Overview of Sandia National Laboratories, California
Chapter 2 provides an overview of Sandia National Laboratories, California (SNL/CA) operations, programs, and facilities.
It begins with a brief history of the laboratories and site-wide operations, followed by a discussion of SNL/CA support for the
United States (U.S.) Department of Energy (DOE) mission lines, programs, and projects. Descriptions of specific facilities
and their operations are located at the end of the chapter.
During World War II, nuclear weapons were designed,
developed, and tested at Los Alamos National Laboratories (LANL) in New Mexico. In late 1945, LANL began
transferring its field-testing and engineering organization,
known as Z-Division, to Sandia Base near Albuquerque,
New Mexico. This organization was the nucleus of what
became Sandia National Laboratories (SNL) in 1949.
The initial focus of the newly formed SNL was on nuclear
weapons engineering and production coordination, with
a growing emphasis on research and development (R&D)
to improve weapons design. By 1952, SNL focused on
weapons development. The Laboratories undertook extensive field testing of components, supported the atmospheric tests conducted by its partner laboratories, and
established an advanced development group to anticipate
future nuclear weapons proliferation, weapons development, and treaty monitoring technological projects.
In 1956, SNL established the SNL/CA location to provide
a closer relationship with Lawrence Livermore National
Laboratory (LLNL) design work. The SNL/CA facility
evolved into an engineering research and development
laboratory by the early 1960s and into a multiprogram
engineering and science laboratory during the 1970s.
As international arms control efforts increased in the
late 1970s and throughout the 1980s, the U.S. emphasized treaty monitoring, safety, security, and control of
the national nuclear weapons stockpile. With the end of
the Cold War in the late 1980s, the role of SNL/CA to
support stockpile stewardship ensuring nonproliferation
and continued safety, security, and reliability, took on
greater importance.
The DOE uses management and operating (M&O)
contractors to manage its facilities, including SNL/CA.
SNL/CA (Sandia Corporation) was managed and operated by American Telephone and Telegraph (AT&T) from
1956 to 1993. In 1993, the M&O contract was awarded
to Martin Marietta Corporation, now known as Lockheed
Martin Corporation.
2.1
SANDIA NATIONAL LABORATORIES, CALIFORNIA SUPPORT
FOR THE U.S. DEPARTMENT OF
ENERGY MISSION LINES
As discussed in Chapter 1, the DOE is responsible for
ensuring the safety, reliability, and effectiveness of the
Final SNL/CA SWEA DOE/EA-1422—January 2003
nation’s nuclear deterrent; fostering a secure and
reliable energy system that is environmentally and
economically sustainable; reducing the environmental,
safety, and health risks and impacts from the DOE
facilities and materials; maintaining leadership in
basic research; and advancing scientific knowledge.
SNL/CA’s primary capabilities are:
❍
Supporting stockpile surveillance activities of
hardened weapons systems and components to
ensure these systems function properly when
exposed to radiation from hostile sources, whether
encountered by satellites and reentry vehicles in space
or by the conditions created by nuclear detonations.
SNL/CA integrates experimentation and computational simulation in support of radiation effects
testing, radiation transport, diagnostics, and analyses
to certify that electrical, mechanical, energetic, and
other nonnuclear components will operate as
designed in such hostile radiation environments.
❍
Developing specific, limited “piece parts” required
to repair deterioration or defects in existing weapons
components or to make modifications essential to
maintaining deterrent credibility as the existing
stockpile continues to shrink and age.
❍
Developing fundamental capabilities required to
take advantage of technologies in state-of-the-art large
computers and networked computers. Expertise ranges from fundamental, broadly applicable efforts to
those of a developmental nature, all of which support
both high-end computing and specific stockpile
systems simulations.
❍
Conducting computer science research that addresses
computational methods and technologies such as
numerical methods for designing and processing new
stockpile materials, new massively parallel (many
calculators working simultaneously) numerical algorithms (repetitive calculations), and new strategies
for code reusability, portability, and debugging.
❍
Providing sensor development and technical analysis
support for the control and prevention of nuclear and
nonnuclear (chemical, biological, explosive, and missiles) proliferation. Detection technology capabilities
include airborne, satellite, seismic, and chemical-based
monitoring systems.
2-1
Chapter 2, Operations Overview of Sandia National Laboratories, California
❍
❍
❍
Conducting fundamental energy research in a wide
variety of energy resources including electrical energy,
energy storage, hydrogen storage (fuel cells), fossil
fuels, geothermal technology (wireless telemetry),
solar energy technology, and applied wind power
technology.
Conducting numerous projects that contribute to
the DOE’s science and technology mission. These
include activities in scientific computing and basic
energy conducting sciences; developing methods using computational science research for solving scientific and engineering problems with state-of-the-art
software; using massively parallel computers (many
computers working simultaneously) to meet critical
DOE mission requirements in advanced computing;
conducting scientific research, development, and
applied engineering on materials and systems in areas
of chemistry, physics, material science, biology, and
environmental sciences.
Developing technology to improve waste processing
and reduce impacts to the environment, including
pollution prevention projects.
The DOE directs SNL/CA activities in support of its
programs and missions. In turn, SNL/CA’s facilities
and operations are designed to meet the requirements
of the programs, projects, and activities assigned to the
laboratory.
2.1.1
SANDIA NATIONAL LABORATORIES, CALIFORNIA
SUPPORT FOR THE U.S. DEPARTMENT OF
ENERGY’S NATIONAL SECURITY MISSION LINE
SNL/CA’s principal DOE assignments under the National
Security mission line focus on the nuclear stockpile and
reducing the vulnerability of a reduced stockpile; managing nonnuclear components; and reducing the vulnerability of the U.S. to threats of proliferation and the use of
weapons of mass destruction, nuclear incidents, and
environmental damage.
2.1.2
SANDIA NATIONAL LABORATORIES, CALIFORNIA
SUPPORT FOR THE U.S. DEPARTMENT OF
ENERGY’S ENERGY RESOURCES MISSION LINE
SNL/CA supports the DOE assignments under the
Energy Resources mission line to enhance the safety,
security, and reliability of energy supplies. This work
focuses on implications for our nation’s security related
to the increasing interdependencies among domestic elements and global resources. SNL/CA helps develop strategies to protect the supply of the nation’s energy resources.
SNL/CA applies science and technology capabilities to
develop various technologies.
2-2
2.1.3
SANDIA NATIONAL LABORATORIES,
CALIFORNIA SUPPORT FOR THE U.S.
DEPARTMENT OF ENERGY’S ENVIRONMENTAL
QUALITY MISSION LINE
SNL/CA supports the DOE assignments under the
Environmental Quality mission line with onsite waste
operations and by developing technology for national
environmental problems. Activities include treatment
(such as elemental neutralization), temporary storage,
and offsite disposal of hazardous waste, low-level waste
(LLW), low-level mixed waste (LLMW), and solid wastes
generated by ongoing mission-related activities. Environmental restoration activities at SNL/CA were completed
in 1999. However, monitoring activities and regulatory
agency interaction are expected to continue.
2.1.4
SANDIA NATIONAL LABORATORIES,
CALIFORNIA SUPPORT FOR THE U.S.
DEPARTMENT OF ENERGY’S SCIENCE
AND TECHNOLOGY MISSION LINE
SNL/CA’s facilities and expertise are used in support of
the Science and Technology mission line through R&D
in modeling and simulation testing, physical sciences,
and advanced chemical and materials sciences. SNL/CA
activities include developing microelectronic components,
computer-based testing, modeling, and simulation.
2.2
SANDIA NATIONAL LABORATORIES,
CALIFORNIA SUPPORT FOR OTHERS
SNL/CA performs work for other sponsors, which falls
into three general categories: Laboratory Directed Research
and Development (LDRD), Work for Others (WFO), and
Partnerships. This work must be compatible with the DOE
mission work conducted at SNL/CA and must be work
that cannot reasonably be performed by the public sector.
Details regarding this type of support activities and projects
are provided in SNL/CA’s Facilities and Safety Information
Document (FSID) (SNL/CA 2002a), and the SNL Institutional Plan FY 2002-2007 (SNL 2001a). Each category is
discussed below.
2.2.1
LABORATORY DIRECTED
RESEARCH AND DEVELOPMENT
The National Defense Authorization Act (P.L. 103-160)
for fiscal year (FY) 1991 established the LDRD Program
at DOE national laboratories. This Act authorized expenditures up to six percent of a laboratory’s total budget
to “maintain the scientific and technical vitality of the
laboratories; enhance the laboratory’s ability to address
future DOE missions; foster creativity and stimulate
exploration of forefront science and technology; serve as
a proving ground for new research; and support high-risk,
Final SNL/CA SWEA DOE/EA-1422—January 2003
Chapter 2, Operations Overview of Sandia National Laboratories, California
potentially high-value R&D.” LDRD supports DOE’s
four primary mission lines identified in Section 2.1.
2.2.2
WORK FOR OTHERS
SNL/CA performs reimbursable work for other Federal
agencies and sponsors, including the private sector. This
work, also known as WFO, must be compatible with the
DOE mission work conducted at SNL/CA and must be
work that cannot reasonably be performed by the public
sector. SNL/CA activities support major agencies including the Department of Defense (DoD), U.S. Nuclear
Regulatory Commission (NRC), U.S. Department of
Transportation (DOT), National Aeronautics and Space
Administration (NASA), Department of State, and
U.S. Environmental Protection Agency (EPA).
2.2.3
PARTNERSHIPS
SNL/CA performs research and development under
several teaming efforts including Established Partnerships, cooperative Research and Development Agreements (CRADA), Funds-in Agreements, Licenses,
Memoranda of Understanding, and other mechanisms
including teaming with universities for foundation grants.
Universities and approved researchers are allowed to use
select SNL/CA facilities to conduct research.
2.3
SANDIA NATIONAL LABORATORIES,
CALIFORNIA FACILITIES: A FRAMEWORK FOR IMPACTS ANALYSIS
As discussed above, SNL/CA provides a diverse set of
capabilities that support DOE’s mission lines through
various programs. The major consideration in deciding to
analyze impacts by facility rather than by program was
the complexity of the analysis. Any given program may
use operations in more than one facility, and SNL/CA
facilities serve multiple programs. An analysis of environmental impacts requires knowledge of particular activities
in a particular place over a known span of time in order
to project the effect those activities will have on the surrounding environment. A presentation of impacts by
program would require that impacts from operations at
each facility be subdivided into the contribution from
each program using the facility. The resulting impacts
would then have to be reassembled by program. The complexity of analysis would greatly increase, and the clarity
of the presentation would suffer. Therefore, the National
Nuclear Security Administration (NNSA) chose to group
the operations to be analyzed by facility.
The operations within these facilities or areas are the
basis for differentiating among the three alternatives
analyzed in the SWEA and any associated environmental
impacts. Taken together, these facilities and areas represent the majority of exposure risks associated with
continuing operations at SNL/CA.
Final SNL/CA SWEA DOE/EA-1422—January 2003
2.3.1
FRAMEWORK FOR ANALYSIS
The SWEA evaluates SNL/CA facilities, operations, and
their effects on environmental conditions under the three
alternatives. Because of their importance, potential environmental impacts from some facilities are described and
evaluated in greater detail than from other SNL/CA facilities. This in-depth look at these specific facilities provides
the framework for analyzing impacts.
For completeness of analysis, the DOE also gathered
information on the balance of operations at SNL/CA.
Information regarding other facilities, site support
services, water and utility use, waste generation, hazardous chemicals purchased for use, and process wastewater
data were incorporated into the analysis. The NNSA
examined preliminary hazard screening for SNL/CA
facilities. In addition, facility walk-throughs and interviews were performed to ensure that hazards and safety
concerns were properly captured in the accident analysis.
This information is included in the current environmental consequences (Chapter 5).
The following sections provide an overview of the facilities and areas at SNL/CA and describe the facilities the
DOE identified for detailed analysis.
2.3.2
SITE-WIDE ENVIRONMENTAL
ASSESSMENT FACILITIES
The 13 facilities or areas selected for in-depth analysis are
identified below. Taken together, these facilities represent
the main activities at SNL/CA that have the potential to
affect the environment, safety, and health have generated
public concern, are critical to SNL/CA’s missions, or are
anticipated to expand over the next 10 years. Figure 2-1
is a site map. Figure 2-2 illustrates the SNL/CA facility
selection process used during the SWEA analysis of
potential impacts.
1. Combustion Research Facility (CRF)—Supports
R&D in combustion science and technology.
2. Building 910—Supports R&D in science-based
engineering and technology in a wide variety of
sciences including advanced electronics prototype
and development, surface physics, neutron detector
research, and telemetry systems.
3. Building 914—Conducts weapons test, assembly,
and machine shop activities.
4. Building 916—Provides R&D of ceramics,
semiconductors, organic polymers, and metals,
including thin film interface science, mechanics,
ion implantation, gases in metals, hydrogen storage,
plasma, annealing, detectors, science-based modeling,
extreme ultraviolet lithography, microsystems, and
fluidics.
2-3
Chapter 2, Operations Overview of Sandia National Laboratories, California
Source: SNL 2001a
Figure 2-1. A Number of Sandia National Laboratories,
California Facilities/Areas were selected for In-Depth Analysis
2-4
Final SNL/CA SWEA DOE/EA-1422—January 2003
Chapter 2, Operations Overview of Sandia National Laboratories, California
Source: Original
Figure 2-2. Conceptual Illustration of the Site-Wide Environmental Assessment Analysis
Final SNL/CA SWEA DOE/EA-1422—January 2003
2-5
Chapter 2, Operations Overview of Sandia National Laboratories, California
LIGA–What is it?
LIGA is an acronym derived from Lithographie and
Galvanoformung and Abformung, which mean electroforming and molding, respectively. This technology
allows for defining high aspect ratio structures in nickel.
The process consists of exposing a sheet of film bonded
to a wafer using X-ray lithography. The film is then developed and the exposed material is removed. Nickel
is then electroplated onto the open areas of the film.
The nickel over-plate is removed by polishing, leaving
high aspect ratio nickel parts. The film is removed, and
the nickel parts may remain anchored to the substrate or
be released. The actual X-ray lithography is done at the
Stanford linear accelerator or Lawrence Berkeley
National Laboratory.
5. Building 927—Stores nuclear and classified
materials, assembles subsystems, conducts system
verification, and stores equipment.
6. Micro and Nano Technologies Laboratory
(MANTL)—Supports a wide variety of operations
involving micromachining, miniature component
fabrication, fuel cell R&D, sensors, and signal
processing, and extreme ultraviolet lithography.
7. Chemical and Radiation Detection Laboratory
(CDRL)—Supports R&D and fabrication of
chemical and radiation detection systems.
8. Area 8 Facilities—Provides testing activities
involving high-pressure hydrogen, mechanical,
high explosives, vibration, climate, temperature,
and high acceleration.
9. Explosive Storage Area—Receives, handles,
packages and stores explosives, and onsite transports.
10. Hazardous and Radioactive Waste Storage
Facilities—Supports waste generation, waste
management, and waste disposal.
11. LIGA Technologies Facility (LTF)—A new
facility, for providing microfabrication processes
involving electrodeposition and replication. Activities
would focus on R&D, and prototyping of LIGA and
LIGA-like microdevices necessary to meet defense
program objectives.
12. Distributed Information Systems Laboratory
(DISL)—A new facility, for supporting a wide
variety of technologies including secure networking, high performance distributed computing,
visualization and collaboration technologies,
and design and manufacturing of productivity
environments.
2-6
13. Glass Furnace Combustion and Melting
Laboratory (part of the CRF)—A new facility,
for conducting studies in glass manufacturing
processes. The R&D would focus on increasing
production efficiency, improving product quality,
and maintaining industry competitiveness.
2.3.3
ACTIVITIES COMMON TO ALL ALTERNATIVES
Some activities at SNL/CA are not expected to change
significantly, regardless of which alternative the NNSA
selects for continued operations. In general, these balance
of operations activities involve little or no toxic materials,
and are of low hazard. Balance of operations analyses
were included for each resource area. These analyses are
evaluated along with the more detailed analyses of the
specific facilities for each alternative to provide the total
impacts from SNL/CA operations. The balance of operations activities include other R&D activities, maintenance
support, material management, chemical material management, explosive material management, radioactive
material management, waste management, pollution
prevention, recycling, and fire hazard management. Other
common activities include balance of operations, safety
and health enhancements, environmental monitoring,
asbestos management, custodial services, D&D projects,
modification of research facilities, and infrastructure
projects.
The following sections provide brief descriptions of these
common activities.
2.3.3.1
Research and Development Activities
R&D activities at SNL/CA are focused in materials and
process science, computational and information sciences,
microelectronics and microsystems, basic sciences, engineering sciences, and bioagent sciences. Many aspects
of the missions described in Section 2.1 are R&D activities conducted in facilities other than those described in
Section 2.3. This section is intended to capture those
activities, including testing of subassemblies under extreme “G” forces (see Chapter 11 of the FSID for additional details) (SNL/CA 2002a, SNL 2001b).
SNL/CA’s research expertise in materials and process
science develops the scientific basis for current and future
mission needs. New and replacement materials are created for refurbished weapons components, enhanced safety
subsystems, and advanced energy storage devices.
SNL/CA’s research expertise in computational and
information sciences develops technology using modeland simulation-based life-cycle engineering. Increases in
supercomputing capabilities are needed to analyze complicated accident scenarios, to design weapons components
and systems, and to predict the aging of key stockpile
materials.
Final SNL/CA SWEA DOE/EA-1422—January 2003
Chapter 2, Operations Overview of Sandia National Laboratories, California
SNL/CA’s research expertise in microelectronics and
microsystems provides the science and technology to
ensure implementation of its electronics systems. This
research ranges from fundamental solid-state physics to
design and fabrication of radiation-hardened integrated
circuits.
SNL/CA’s research expertise in engineering sciences
focuses on model- and simulation-based, life-cycle engineering. Life-cycle engineering at SNL/CA occurs within
a comprehensive validated modeling and simulation
environment required for validation and verification
of simulations.
SNL/CA’s research expertise in micro- and nanotechnology applies various technological advances
in conjunction with other DOE laboratories, U.S.
industry, and universities.
SNL/CA supports science-based experiments to certify
the survivability of strategic systems in the stockpile.
SNL/CA has produced a unique opportunity to collaborate with LLNL in weapons physics and experimentation.
These capabilities are especially critical in the absence of
underground nuclear testing for certification of weapons
survivability and performance (SNL 2001b).
Other areas include extreme ultraviolet lithography, fuel
cell prototyping, lightweight components, signal processing, modeling and simulation sensors, information systems, micro parts, and bench- and small-scale chemical,
bioagent, and radiation detection research (DOE 2001a,
DOE 2001b).
2.3.3.2
Maintenance Support Activities
Maintenance and support activities are frequently
and routinely requested services for operational support
of SNL/CA facilities and associated DOE properties
(see Table 2-1). Activities range from ongoing custodial
services to corrective, preventive, predictive, and training
actions required to maintain and preserve buildings,
structures, roadways (including widening in disturbed
areas), and equipment in a condition suitable for fulfilling
their designated purposes. While these activities are
intended to maintain current operations, they would
not substantially extend the life of a facility or allow
for substantial upgrades or improvements.
2.3.3.3
Material Management and Operations
Routine operations at SNL/CA require the management
of hazardous, industrial, commercial, and recyclable
materials. Both the FSID and the SNL/CA Environmental
Information Document (EID) (SNL/CA 2002b) contain
information regarding the responsible organizations,
regulatory requirements, and types and quantities of
material at SNL/CA. SNL/CA standards, which were
developed in accordance with the DOE, Occupational
Final SNL/CA SWEA DOE/EA-1422—January 2003
Safety and Health Administration (OSHA), U.S. Environmental Protection Agency (EPA), DOT, and State of
California policies, determine if a material constitutes an
onsite hazard.
Four types of hazardous material regulated by the DOT
are tracked by SNL/CA: radioactive materials, chemicals,
explosive materials, and fuels.
2.3.3.4
Chemical Materials
Management and Control
The primary goal for managing and controlling chemicals
at SNL/CA is to protect the health and safety of workers,
the public, and the environment.
Chemical Materials
SNL/CA handles more than 8,000 chemicals in 35,000
chemical containers annually (SNL/CA 2002b). Chemicals defined as hazardous materials are listed in 29 CFR
Parts 1900-1999, 40 CFR Parts 300-372, and 49 CFR
Part 172. 101. Chemicals are managed using administrative and physical controls designed to minimize exposure
to an identified hazard. Facilities that use and store
chemicals are evaluated using SNL’s Integrated Safety
Management System to determine appropriate
approaches to managing and controlling hazards.
Historic Chemical Materials Use
SNL/CA previously maintained inventories of hazardous
chemicals at levels sufficient to meet immediate needs
that could arise at any time. This approach involved economical bulk chemical purchases; however, this approach
also led to the shelf life of some chemicals expiring before
they could be used. These chemical procurement practices
created legacy chemicals that had to be disposed of properly. Now, SNL/CA orders chemicals on an as-needed
basis (SNL/CA 2002b).
Baseline Hazardous Chemical Materials Use
SNL/CA tracks chemicals using a chemical inventory
tracking system known as the Chemical Information
System (CIS). This system requires bar coding of chemical
containers as they enter SNL/CA that allows tracking
of individual containers by an online chemical inventory
database. This system interfaces readily with other environment, safety, and health programs, including those
for industrial hygiene, hazardous waste management,
radioactive and mixed waste management, waste minimization, emergency preparedness, fire protection, and
NEPA. For NEPA, the CIS database provides essential
information on the chemical inventory and is a necessary element for calculating potential health effects.
The CIS database is used for the Federal Emergency
Planning and Community Right-to-Know Act (EPCRA),
also known as Superfund Amendments and Reauthoriza2-7
Chapter 2, Operations Overview of Sandia National Laboratories, California
tion Act, Title III (SARA) (42 U.S.C. §11001), reporting,
and the California Community Right-to-Know regulations. Both the Federal and state regulations require that a
facility generate an annual list documenting the presence
of certain hazardous chemicals in quantities exceeding
prescribed safety thresholds and provide the list to emergency planning officials in the state and local community.
2.3.3.5
Explosive Material
Management and Control
SNL/CA manages explosive material through the
Explosive Inventory System, a comprehensive database
that tracks explosives and explosive-containing devices
and assemblies from acquisition through use, storage,
reapplication, and transfer or disposal. It provides information on material composition, characteristics, shipping
requirements, life-cycle cost, plan of use, and duration
of ownership. This system includes an inventory of
explosive material owned or controlled by SNL/CA
line organizations.
2.3.3.6
Radioactive Material
Management and Control
SNL/CA uses a twofold approach to radioactive material
management: reduce surplus legacy radioactive material
inventories and manage current nuclear material inventories at mission-essential levels. SNL/CA maintains an
inventory of radioactive isotopes used in laboratory
research and radiation monitoring activities.
2.3.3.7
Waste Management and Operations
Waste Operations
This section generally describes waste operations that are
not analyzed in detail, as noted in Section 2.3.3. SNL/CA
manages all wastes in accordance with applicable Federal,
state, and local laws and regulations and DOE Orders.
The EPA, the DOE, and the California Department of
Toxic Substance Control (DTSC) primarily regulate these
wastes. All current waste operations are implemented
following SNL/CA policies established to ensure worker
and public safety and compliant management of regulated
waste. These policies clearly define waste acceptance and
disposal criteria, limit the number of workers who handle
wastes, provide appropriate waste-specific training, and
centralize waste handling areas.
Hazardous Waste
Hazardous wastes managed at the Hazardous Waste Storage Facility include wastes regulated under Resource Conservation and Recovery Act (RCRA) (42 U.S.C. §6901) and
wastes regulated under the Toxic Substances Control Act
(TSCA) (15 U.S.C. §2601); wastes regulated by the state
of California that are not RCRA wastes, and biohazardous
wastes. The hazardous waste generated at SNL/CA is
2-8
predominantly from experiments, testing, other R&D
activities, and infrastructure fabrication and maintenance. Decontamination and Decommissioning (D&D)
activities also generate hazardous waste. Hazardous waste
generated at each facility is usually coordinated by the
facility user’s department, with the exception of waste
from large projects focused on asbestos abatement, which
is managed separately through subcontracts.
Radioactive Waste
Radioactive wastes managed at the Radioactive Waste
Storage Facility include low-level waste (LLW) and lowlevel mixed waste (LLMW). No transuranic (TRU) waste
or mixed transuranic waste is managed or generated at
SNL/CA. No high level waste is managed or generated
at SNL/CA. In general, LLW and LLMW are generated
during laboratory experiments and component tests. As
noted in the Sandia National Laboratories/New Mexico
Site-Wide Environmental Impact Statement (SNL/NM
SWEIS) (DOE 1999b), LLMW generated at SNL/CA has
been shipped to SNL/NM for management in accordance
with a New Mexico Environment Department (NMED)
compliance order issued under the Federal Facility Compliance Act (FFCA) (42 U.S.C. §6961).
2.3.3.8
Pollution Prevention
and Waste Minimization
SNL/CA has implemented a Pollution Prevention
Program to comply with State of California and DOE
requirements. SNL/CA’s Pollution Prevention Program
applies to all pollutants generated by routine and nonroutine operations. It consists of activities that encourage
pollution prevention or waste source reduction, recycling,
resource and energy conservation, and procurement of
EPA-designated recycled products.
2.3.3.9
Recycling
SNL/CA recycles plain paper, cardboard, used oil, scrap
metal, batteries, fluorescent light bulbs, solvents, mercury,
Low-hazard Nonnuclear
The term “low-hazard nonnuclear” is applied to
facilities or project activities that have the potential for
minor onsite impacts (within the boundaries of SNL/CA
controlled areas) and negligible offsite impacts (outside
the boundaries of SNL/CA-controlled areas) to people or
the environment. SNL/CA uses primary hazards screening to identify hazards, hazard classifications, training
requirements, and required safety documents. A “lowhazard nonnuclear” facility does not require additional
safety documentation. All facilities at SNL/CA meet this
definition.
Final SNL/CA SWEA DOE/EA-1422—January 2003
Chapter 2, Operations Overview of Sandia National Laboratories, California
landscaping waste, aluminum cans, tires, and used toner
cartridges (SNL/CA 2002b).
2.3.4
2.3.3.10 Fire Hazard Management and Control
Following Chapter 2 are a series of facility descriptions
that provide additional detail for all of the facilities
that are named in Section 2.3.2. They consist of a brief
description of the location, hazard class (low-hazard
nonnuclear), primary purpose, and the major types of
activities performed at the facility. Also identified are
the basic processes performed at the facility, the programs
and activities currently being supported, and the hazards
and hazard controls associated with the facility. For 10 of
the facilities/areas described here, the FSID contains more
SNL/CA has implemented a fire hazard management
program to reduce wildfires and accidental brush fires.
Vegetation control includes mowing in grassland areas
and application of herbicides along fence lines and roads.
2.3.3.11 Other Common Activities
Table 2-1 provides brief descriptions of other common
activities.
SANDIA NATIONAL LABORATORIES,
CALIFORNIA FACILITIES
Table 2-1. Other Common Activities
Project/Activity Title
Safety and Health
Enhancements at Existing
Facilities Modifications
Project/Activity Description (partial listing).
Replacement, installation, and modification of lighting, heating, ventilation,
and air conditioning
Replacement and installation of air and water filters and filtering systems
Replacement, installation, and modifications of radiation monitoring devices
and shielding
Building surveys
Asbestos Management
Sampling and analysis of potential asbestos containing materials
Asbestos abatement (for example, encapsulation, removal, and repair of friable
and nonfriable material)
Maintenance Activities and
Custodial Services
Landscaping, interior and exterior painting of surfaces, and equipment
maintenance
Minor seismic reinforcement, building maintenance, and custodial actions
Site maintenance and routine decontamination of surfaces
Characterization,
Decontamination, and
Demolition of Buildings and
Structures that are less than
20,000 gross square feet
Modifications of Research
Facilities and Relocation of
Laboratory Operations
Siting, Construction, Modification, Operation, Relocation
and Consolidation of Support
Structures, Infrastructure,
and Equipment
Building surveys (information audit, site inspection, sampling)
Safe removal of utilities, foundations, walkways, and landscaping
Decontamination, demolition, and disposal
Removal, renovation and upgrade of utility, security, and fire safety systems
Trenching in support of utility system modifications
Removal, replacement, and installation of exhaust systems and fume hoods
Installation, construction, modification, relocation, replacement,
and operation of security-related equipment
Remodeling and renovation of existing structures and site infrastructure
Construction and operation of new support structures
Sampling and analysis of environmental media (such as ground water)
Environmental Monitoring
Installation, modification, and replacement of environmental monitoringrelated equipment
Environmental surveys (information gathering, site surveys, sampling)
Sources: DOE 2000a, b, c; 2001c, d, e
NEPA: National Environmental Policy Act
Final SNL/CA SWEA DOE/EA-1422—January 2003
2-9
Chapter 2, Operations Overview of Sandia National Laboratories, California
detail including estimated quantities specific radioactive
and hazardous chemicals used and emissions or waste
generated by a facility’s operations. Additional information is available in the document Comparison of Parameters to be Used to Analyze SNL/CA Facilities under the No
Action, Planned Operations, and Maximum Operations
(TtNUS 2002a). For the three new facilities, additional
sources contain more details (DOE 1998b, 1999c, 2001f).
All of these sources were considered in completing the
consequence analysis in Chapter 5.
2-10
2.3.4.1
Major Facility Changes
Three major facility changes have occurred at SNL/CA
since the 1992 LLNL SWEIS. The Defense Engineering
Laboratory changed to the Integrated Manufacturing
Technology Laboratory and recently changed again, to
become the MANTL; the Tritium Research Laboratory is
now the Chemical and Radiation Detection Laboratory
(CRDL); and Building 913 was demolished and the work
was consolidated and relocated to various other buildings
on site. Additional information is available in the FSID.
Final SNL/CA SWEA DOE/EA-1422—January 2003
Chapter 3, Alternatives for Continuing Operations at Sandia National Laboratories, California
CHAPTER 3
Alternatives for Continuing Operations
at Sandia National Laboratories, California
This chapter describes the three alternatives the National Nuclear Security Administration (NNSA) has analyzed in detail
regarding continuing operations at Sandia National Laboratories, California (SNL/CA). It describes the activities and the
level of activities, which will vary depending on the alternative analyzed, at SNL/CA’s facilities.
3.1
INTRODUCTION
Council on Environmental Quality (CEQ) regulations
(40 Code of Federal Regulations [CFR] Parts 1500-1508)
require that the Department of Energy (DOE) and other
Federal agencies use the review process established by the
National Environmental Policy Act (NEPA) of 1969, as
amended (42 United States Code [U.S.C.] §4321 et seq.)
and the DOE regulations implementing NEPA (10 CFR
Part 1021) to evaluate not only the proposed action, but
also to identify and review reasonable alternatives to the
proposed action, as well as a “no action” alternative. This
comprehensive review ensures that environmental information is available to public officials and citizens before
decisions are made and before actions are taken.
The proposed action is to continue to operate SNL/CA
as a DOE national laboratory. The NNSA developed
three alternatives to accomplish this action and to assess
environmental impacts of activities at SNL/CA. This
chapter examines and compares the three alternatives.
For clarity and brevity, the descriptions of the alternatives in the text (Sections 3.2, 3.3, and 3.4) and in the
tables (Section 3.6) focus on significant distinguishing
features that characterize the variation of activities
across alternatives. SNL/CA activity descriptions, by
facility, are provided in Chapter 2. All of the activities
discussed in Chapter 2 were used in evaluating the
impacts of each alternative. The alternatives are defined
below:
❍
No Action Alternative (Section 3.2),
❍
Planned Utilization and Operations Alternative
(Section 3.3), and
❍
Maximum Operations Alternative (Section 3.4).
These three alternatives represent the range of levels of
operation necessary to carry out the DOE mission lines,
from the minimum levels of activity that maintain core
capabilities (No Action Alternative) to the highest
reasonable activity levels that could be supported by
current facilities, and the potential expansion and construction of new facilities for specifically identified
future actions (Maximum Operations Alternative).
Under the No Action Alternative, ongoing NNSA and
interagency programs and activities at SNL/CA would
Final SNL/CA SWEA DOE/EA-1422—January 2003
continue operating at planned levels as reflected in
current DOE management plans. In some cases, these
planned levels include increases over today’s operating
levels. The No Action Alternative includes any recent
activities that have already been approved by the NNSA
and have existing NEPA documentation.
The Notice of Intent (NOI) (67 Federal Register [FR]
5089) proposed that the No Action and Expanded
Operations Alternatives be considered in the Site-Wide
Environmental Assessment (SWEA) (see Chapter 14 of
the SWEA); however, the Expanded Operations Alternative was dropped and two other alternatives, the Planned
Utilization and Operations Alternative and Maximum
Operations Alternative, were added to show a broader
range of alternatives and respond to internal comments
received during the scoping process (Section 1.6.1).
Under the Maximum Operations Alternative, NNSA
and interagency programs and activities at SNL/CA
would increase to the highest reasonable activity levels,
as set forth in this SWEA, that could be supported by
current facilities and their potential expansion and construction of new facilities for future actions specifically
identified in the SWEA.
The SWEA analyzes the environmental impacts of
activities at SNL/CA associated with these three alternatives, as well as activities common to all alternatives including maintenance support and material management.
The DOE’s work assignments to SNL/CA are based
on using existing personnel and facility capabilities, as
described in Chapters 1 and 2. The DOE has examined
the various activity levels typical of past SNL/CA operations (generally within the past few years), and assumes
that future work descriptions would resemble current
and recent activities.
The three alternatives represent the range of operating
levels that could be reasonably implemented in the 10year time frame of the SWEA analysis (2002 to 2012).
Many of SNL/CA’s ongoing and planned activities do not
vary by alternative. The No Action Alternative reflects
currently planned activities or projects, some of which
may already have NEPA documentation and analysis.
Table 3-1 provides a brief summary of the facilities
activity levels evaluated in this SWEA. Table 3-4 (see
3-1
3-2
Research and Development
Prototypes and Assemblies
Research and Development
Program Support
Research and Development
Research and Development
Weapons research and
development
Machine shop and test
assembly operations
Advanced materials
research and development
Material control and
hardware assembly and
testing
Development of Advanced
Micro and Nano
Technologies
Detection system research,
development, and fabrication
Research, development,
and testing
Packaging and
storage of explosives
Waste Management
Research, development,
and prototyping
Building 910
Building 914
Building 916
Building 927
Micro and Nano
Technologies
Laboratory (MANTL)
Chemical and Radiation
Detection Laboratory
(CRDL)
Area 8 Facilities
Explosive
Storage Area
Hazardous and Radioactive
Waste Storage Facilities
LIGA Technologies
Facility (LTF)
90,488
Total Hazardous
Waste (kg/yr)
1,300
451
LLMW (kg/yr)
Wafers/yr
5,308
LLW (kg/yr)
Collection, packaging,
handling, and short-term
storage of hazardous,
radioactive, and mixed
wastes
LIGA and LIGA-like
devices and systems
234.2
25
8
97
4
46
22
75
250
NO ACTION
ALTERNATIVE
Kg Capacity
Workforce/yr
Workforce/yr
Workforce/yr
Workforce/yr
Workforce/yr
Workforce/yr
Workforce/yr
Workforce/yr
LEVEL OF
ACTIVITY
Storage
Materials evaluation,
synthesis, and processing
Research and Development
ACTIVITY TYPE
OR MATERIAL
Bench-Scale chemistry,
physics, and engineering
experiments
PRIMARY FUNCTION
Combustion Research
Facility (CRF)
FACILITY
1,300
98,833
510
5,998
234.2
8
42
118
6
70
22
94
300
PLANNED
OPERATIONS
ALTERNATIVE
Table 3-1. Comparison of Activity Levels at 13 Specific Facilities under the No Action,
Planned Utilization and Operations, and Maximum Operations Alternatives
2,600
133,820
690
8,121
234.2
40
46
194
8
91
44
150
500
MAXIMUM
OPERATIONS
ALTERNATIVE
Chapter 3, Alternatives for Continuing Operations at Sandia National Laboratories, California
Final SNL/CA SWEA DOE/EA-1422—January 2003
Chapter 3, Alternatives for Continuing Operations at Sandia National Laboratories, California
16,800-sand
14,000crushed
recycled glass
16,800-sand
14,000crushed
recycled glass
16,800-sand
14,000-crushed
recycled glass
In order to provide comprehensive baseline data from
which operational levels could be projected, the NNSA
gathered the best-available data representing the facilities’
normal levels of operation. In most cases, the base year for
data was 2000.
The NNSA is not revisiting any programmatic decisions
previously made in other NEPA documents, such as those
addressing weapons complex consolidation and reconfiguration, materials disposition, or waste management. The
SWEA includes these programmatic activities in order to
provide the NNSA and the public with an overall understanding of the activities at SNL/CA.
Many of the SNL/CA facilities are engaged primarily in
activities supporting the DOE’s National Security mission. Other facilities are engaged in energy resources and
research and development (R&D) efforts, such as materials research, radiochemistry, and health research. The
NNSA examined specific activities performed at SNL/CA
facilities that relate to issues of known public interest, the
DOE mission lines, and the potential for environmental
impacts.
Pilot scale glass
melting tank furnace
Glass manufacturing
research and development
Glass Furnace and
Melting Laboratory
(part of the CRF)
Feed Materials
(lbs, weekly)
180
180
130
3.2
Sources: SNL/CA 2002a; TtNUS 2002a
kg: kilogram
lbs: pounds
LIGA: X-ray lithography, electroforming, and molding
LLMW: low-level mixed waste
LLW: low-level waste
yr: year
Workforce/yr
Research and Development
Distributed information
systems development
and implementation
Distributed Information
Systems Laboratory (DISL)
LEVEL OF
ACTIVITY
ACTIVITY TYPE
OR MATERIAL
PRIMARY FUNCTION
FACILITY
Table 3-1. Comparison of Activity Levels at 13 Specific Facilities under the No Action,
Planned Utilization and Operations, and Maximum Operations Alternatives
MAXIMUM
OPERATIONS
ALTERNATIVE
PLANNED
OPERATIONS
ALTERNATIVE
NO ACTION
ALTERNATIVE
Section 3.6) provides an expanded look at the materials
used and wastes generated at each facility.
Final SNL/CA SWEA DOE/EA-1422—January 2003
NO ACTION ALTERNATIVE
Under the No Action Alternative, ongoing NNSA and
interagency programs and activities at SNL/CA would
continue operating at planned levels as reflected in current DOE/NNSA management plans for 2002 through
2012. In some cases, these planned levels include increases over today’s operating levels. This would also include
any recent activities that have already been approved by
DOE/NNSA and have existing NEPA documentation.
If these planned operations are implemented in the future,
they could result in increased activity above present levels.
Thus, the No Action Alternative forecasts, over 10 years,
the level of activity for facility operations that would
implement current management plans for assigned
programs.
The CEQ’s NEPA implementing regulations (40 CFR
Parts 1500-1508) require analyzing the No Action
Alternative to provide a benchmark against which the
impacts of the activities presented in the other alternatives can be compared. The No Action Alternative analysis includes any approved and interim actions and facility
expansion, construction or management plans, where
detailed design and associated NEPA documentation
were completed by the end of March 2002. The analysis
also includes facilities, including new construction
(LIGA Technologies Facility [LTF], Distributed Information Systems Laboratory [DISL], and Glass Furnace and
Melting Laboratory), several upgrades, and removal of
several small structures totaling approximately 15,000
3-3
Chapter 3, Alternatives for Continuing Operations at Sandia National Laboratories, California
square feet (sq ft) for which NEPA documents have been
prepared, decisions made, and funds allocated in the fiscal
year 2002 planning year budget (submitted in 2000).
The DOE management plans include continued support
of major DOE programs, such as Defense Programs (DP),
Nuclear Energy, Fissile Material Disposition, Environmental Management, and Science. They also include
projects to maintain existing facilities, capabilities, and
projects for which a NEPA determination has been made.
Other plans used to prepare the description of the No
Action Alternative include the site development plans
for SNL/CA, Programmatic Environmental Impact Statements (PEISs), Presidential Decision Directives (PDDs),
and the DOE work for others (WFO) proposals and guidance. Some documents have future projects included for
planning purposes; others have been deleted due to lack
of funding or other reasons. The activities reflected in this
alternative include planned increases in some SNL/CA
operations and activities over previous years’ levels.
The Facilities and Safety Information Document (FSID)
(SNL/CA 2002a) and the Comparison of Parameters to be
Used to Analyze SNL/CA Facilities Under the No Action,
Planned Operations, and Maximum Operations document
(TtNUS 2002a) provide in-depth information concerning
the activities, operations, and hazards of specific SNL/CA
facilities. These documents have been used extensively to
describe the facility activities in this chapter. The facilities
discussed below are also described in detail in the Facility
Descriptions following Chapter 2. For most facilities, the
base year considered is 2000.
The following sections summarize the activities that
would be performed at each of the SNL/CA facilities.
Balance of operations (SNL/CA operations not associated
with the 13 facilities are described in detail) were included
for this alternative and discussed in Section 3.5. Activities
common to all alternatives are discussed in Section 2.3.3.
3.2.1
COMBUSTION RESEARCH FACILITY
Under the No Action Alternative, the Combustion
Research Facility (CRF) would continue to be used for
broad-based research in combustion science and technology. Support activities would include a wide variety of
research and development in areas of combustion engines
and chambers, combustion chemistry, combustion reactions, industrial and combustion processes and diagnostics and remote sensing. Staffing levels would remain at
approximately 250.
3.2.2
BUILDING 910
Building 910 would continue to be used to conduct
weapons R&D activities. The facility would conduct
science-based engineering and technology in a wide variety of sciences including advanced electronics prototype
3-4
and development, surface physics, neutron detector
research, and telemetry systems. Generally, the activities
would focus on electronics and microelectronics prototypes. Materials studied would include ceramics, semiconductors, organic polymers, and metals. Staffing
levels would remain at approximately 75.
3.2.3
BUILDING 914
Building 914 would continue to be used to conduct
weapons test assembly and machine shop activities.
The facility would continue to support SNL/CA’s primary
mission of ensuring that the United States (U.S.) nuclear
weapons stockpile is safe, secure, and reliable. Activities
would include prototype machining and hardware
generation, mechanical inspection, calibration, and
electrical laboratory operations. Staffing levels would
remain at approximately 22.
3.2.4
BUILDING 916
Under the No Action Alternative, Building 916 would
continue to be used to conduct R&D. Generally the activities would focus on materials studies including chemical
and physical properties and characteristics (phases).
Materials studied would include ceramics, semiconductors,
organic polymers, and metals. Areas of research would
include thin film interface science, mechanics, ion implantation, gases in metals, hydrogen storage, plasma, annealing,
detectors, science-based modeling, extreme ultraviolet
lithography, microsystems, and fluidics. Staffing levels
would remain at approximately 46.
3.2.5
BUILDING 927
Building 927 would continue to be used to store nuclear
and classified materials, assemble subsystems, conduct
system verification, and store equipment. The Explosive
Destruction System (EDS) subsystems would continue to
be assembled in the facility. No testing with explosives or
other hazardous materials would be completed at this
location. Staffing levels would remain at approximately 4.
3.2.6
MICRO AND NANO
TECHNOLOGIES LABORATORIES
Under the No Action Alternative, the Micro and Nano
Technologies Laboratories (MANTL) activities would
include a wide variety of operations such as micro
machining, miniature component fabrication, fuel cell
research and development, sensors and signal processing,
and extreme ultraviolet lithography. Areas of materials
research and development would include characterization, chemistry, composite and lightweight components,
engineered materials (welding, brazing, and joining),
science-based modeling, and radiography. Specific
operations would include materials evaluation, materials
synthesis and processing, microsystems processing, and
Final SNL/CA SWEA DOE/EA-1422—January 2003
Chapter 3, Alternatives for Continuing Operations at Sandia National Laboratories, California
nanolithography equipment development. Staffing levels
would remain at approximately 97.
3.2.7
CHEMICAL AND RADIATION
DETECTION LABORATORY
The Chemical and Radiation Detection Laboratory
(CRDL) would continue to be used as a multi-purpose
R&D facility. Generally, the facility would support
research, development, and fabrication of chemical and
radiation detection systems. Activities would involve
development of biological/chemical species sensors that
detect trace amounts of toxins, viruses, and biological
species and protein research. Areas of research and
development would include microstructures, radiation
detectors, laser-based detectors, and sensor research
(nerve agents, drugs, and explosives). Rooms within the
CRDL would continue to operate as Centers for Disease
Control (CDC) and Prevention registered Biosafety Level
2 laboratories and provide standard chemical, biological,
and analytical laboratory capabilities for conducting
research in areas of advanced micro-separation technologies, laser-based detection, microelectronic biosensors,
biological chemistry, and toxins handling. Staffing levels
would remain at approximately 8.
3.2.8
AREA 8 FACILITIES
The Area 8 Facilities would continue to be used to
support SNL/CA work. Testing activities would involve
material response to high-pressure hydrogen, mechanical
stresses, high explosives, vibration, climate variations,
temperature variations, and high acceleration stress.
Experiments and research in areas of welding, hydrogen
fueled engines, and special materials would continue.
Data collection activities would support the above testing
work. Staffing levels would remain at approximately 25.
3.2.9
EXPLOSIVE STORAGE AREA
The Explosive Storage Area would continue to support the
R&D work performed at SNL/CA on a variety of energetic
compounds. The Explosive Storage Area would receive,
handle, package, transport on-site, and store explosives.
3.2.10 HAZARDOUS AND RADIOACTIVE
WASTE STORAGE FACILITIES
The Hazardous Waste Storage Facility would receive,
handle, package, store (short-term), and ship hazardous,
toxic, and nonhazardous chemical wastes. The facility is
a Resource Conservation and Recovery Act (RCRA), Part Bpermitted facility that would support waste generators
throughout SNL/CA. Activities would include preparing
wastes for offsite transportation for recycling, treatment,
or disposal at licensed facilities. The facility would operate one shift. Modifications to the existing facility to improve flexibility and operational efficiencies would be
Final SNL/CA SWEA DOE/EA-1422—January 2003
completed. Quantities of RCRA hazardous waste managed (see Section 3.6, Table 3-4) would be 23,395 kilograms (kg) per year. Total hazardous wastes managed are
presented in Section 3.6, Table 3-4.
The Radioactive Waste Storage Facility, also a Part Bpermitted facility, would continue to serve as a centralized facility for receipt, characterization, compaction,
treatment, repackaging, certification, and storage of lowlevel waste (LLW) and low-level mixed waste (LLMW).
SNL/CA does not manage or generate transuranic (TRU)
waste. SNL/CA does not manage or generate high-level
waste. Annual quantities of radioactive waste managed
(see Section 3.6, Table 3-4) would be 5,308 kg for LLW
and 451 kg LLMW. The facility would operate one shift.
Total wastes by waste type are presented in Section 3.6,
Table 3-4.
3.2.11 LIGA TECHNOLOGIES FACILITY
The LTF would operate microfabrication processes
involving x-ray lithography, electrodeposition, and
replication. Activities would focus on research and
development, and prototyping of LIGA and LIGA-like
micro devices necessary to meet defense program objectives. The facility would provide process and processsupport clean room, functional areas, and laboratory
environments essential to LIGA and LIGA-like part
and device microfabrication, assembly, aging, and testing.
The LTF would be equipped with specialized tools and
equipment used exclusively for LIGA and LIGA-like
processing. The LTF would produce approximately
1,300 wafers per year. The current staffing located
throughout SNL/CA would increase by 20 employees.
3.2.12 DISTRIBUTED INFORMATION
SYSTEMS LABORATORY
DISL operations would focus on a wide variety of technologies including secure networking, high-performance
LIGA–What is it?
LIGA is an acronym derived from Lithographie, Galvanoformung, and Abformung, which mean electroforming
and molding, respectively. This technology allows for
defining high aspect ratio structures in nickel. The process consists of exposing a sheet of film bonded to a
wafer using X-ray lithography. The film is then developed
and the exposed material is removed. Nickel is then
electroplated up in the open areas of the film. The nickel
over-plate is removed by polishing, leaving high aspect
ratio nickel parts. The film is removed, and the nickel
parts may remain anchored to the substrate or be released. The actual X-ray lithography is done at the Stanford linear accelerator or Lawrence Berkeley National
Laboratory.
3-5
Chapter 3, Alternatives for Continuing Operations at Sandia National Laboratories, California
distributed computing, visualization and collaboration
technologies, and design and manufacturing of productivity environments. Laboratory activities would consist of
connecting off-the-shelf hardware components into multistructural, multimedia, multi-purpose networks, models,
and information systems. The DISL would be staffed
with 130 employees.
3.2.13 GLASS FURNACE AND MELTING LABORATORY
The Glass Furnace and Melting Laboratory would conduct studies in glass manufacturing processes. Research
and development would focus on increasing production
efficiency, improving product quality, and maintaining
industry competitiveness. The facility would use a pilotscale glass melting tank furnace. Research would include
a wide variety of activities including measurement of
process parameters using laser-based techniques, imaging
of the combustion process using laser sheets, studying of
the physical and chemical changes of sand and molten
glass, testing of furnace performance under different
operating conditions, testing of product quality under
different operating conditions, and monitoring furnace
wear. The furnace would handle 14,000 pounds (lbs) of
glass weekly. The Glass Furnace and Melting Laboratory
would be staffed with 12 employees. To support proposed
operations, an additional natural gas line would be
installed.
3.3
PLANNED UTILIZATION AND
OPERATIONS ALTERNATIVE
The Planned Utilization and Operations Alternative
includes all operations and activities identified in the
No Action Alternative. In general, over 10 years, land
uses would change and planned facility operations for
many facilities would increase in support of SNL/CA’s
assigned missions. Land use changes would include
improving Arroyo Seco (see Table 3-2), creating a 30-acre
wildlife reserve, designating 93 acres for future construction (including approximately 25 acres for soil management), identifying 122 acres as undesignated, and establishing an easement agreement with land owners along
SNL/CA’s western boundary (single-family residences)
and some new construction. Onsite soil management of
clean dirt/fill from Arroyo Seco improvement, storm
water projects, and construction projects would begin.
Infrastructure improvements and construction activities
would include General Plant Projects such as upgrades to
the water distribution system, upgrades to the storm water
runoff areas, and renovating Building 916 (SNL 2001c).
New construction would include a 5,000- sq ft badge
office in the northwest corner of the SNL/CA site
(8 acre location within the 93 acres designated as
future construction).
3-6
This alternative addresses the same facilities described
in Section 3.2 for the No Action Alternative. This
alternative differs from the No Action Alternative in
that operations could increase 13 percent site-wide over
the next 10 years. Balance of operations would increase
proportionally as discussed in Section 3.5. Activities
common to all alternatives are discussed in Section 2.3.3.
The following sections describe the activities that would
occur at specific facilities because of implementing
assignments under the Planned Utilization and
Operations Alternative.
3.3.1
COMBUSTION RESEARCH FACILITY
Under the Planned Utilization and Operations
Alternative, the CRF activity level would increase by
an estimated 20 percent in areas of broad-based research
in combustion science and technology. The increases
would include a wide variety of R&D in combustion
engines and chambers, combustion chemistry, combustion reactions, industrial and combustion processes and
diagnostics, and remote sensing. The staff would increase from 250 to 300 persons over the next 5 years.
3.3.2
BUILDING 910
Building 910 would continue to be used to conduct
weapons R&D activities. The facility would increase
activities in weapon system instrumentation, fusion
energy, surety design engineering, electronics prototyping,
and microsystems engineering. Generally, the types of
materials studied (ceramics, semiconductors, organic
polymers, and metals) would remain the same. However,
the level of activity would increase by an estimated
25 percent. The staff would increase from 75 to 94
persons over the next 5 years.
3.3.3
BUILDING 914
Building 914 would continue to be used to conduct
weapons test assembly and machine shop activities. The
activities would be the same as those discussed in the No
Action Alternative. The staff would remain at 22 persons
over the next 5 years.
3.3.4
BUILDING 916
Under the Planned Utilization and Operations Alternative, Building 916 would continue to be used to conduct
materials chemistry R&D. An estimated 53 percent
increase in activities would occur in materials studies
including ceramics, semiconductors, organic polymers,
and metals. Other areas of increased research would include thin film interface science, ion implantation, gases
in metals, hydrogen storage, plasma, detectors, sciencebased modeling, extreme ultraviolet lithography, microsystems, and fluidics. The staff would increase from 46 to
70 persons over the next 5 years.
Final SNL/CA SWEA DOE/EA-1422—January 2003
Chapter 3, Alternatives for Continuing Operations at Sandia National Laboratories, California
Table 3-2. Summary of Improvements to Arroyo Seco by Priority
Improvement
Task
Activity
1
The project would install a new 8” gravity sewer line along East Avenue crossing the arroyo between the box
culvert and road and terminate at the manhole just upstream of the flow monitoring station on Sandia property.
A pump station would be installed immediately downstream of the flow monitoring station and 6” force main
crossing East Avenue to West Perimeter Drive and terminate at the existing LLNL manhole approximately 20
feet north of the LLNL arroyo crossing. The existing sewer line crossing structures would be demolished and
the channel would be restored.
2
A wing wall on west side of the East Avenue box culvert would be installed. The protruding rebar would be
removed. Under the toe of an existing asphalt storm drain outfall apron located on the east bank large boulders
would be placed.
3
Concrete debris that was placed in the arroyo as erosion control effort would be removed. The streambed
would be graded to fill any holes and eliminate any rough transitions in the channel.
4
The concrete apron associated with the sewer line crossing would be removed and a grouted rock apron
extending down the channel bank and along the channel bottom would be installed. The apron would function
as a splash curtain for a storm drain outlet at this location.
5
The stream bank would be stabilized by removing a pine tree on the north bank and the bank would
be graded.
6
The eroded area downstream of security grate would be filled with riprap. The riprap would extend
approximately 30 feet downstream.
7
The eroded area at pedestrian bridge wing wall would be repaired by grading the up-slope areas to direct
runoff to a field located southeast of the bridge. The wing wall would be cut back approximately 6 feet to
remove the exposed footing. The channel slope around the wing wall would be regraded.
8
The storm drain outlet between C Street and pedestrian bridge would be repaired by grading the existing
slope back to create a small inset bench with a slight depression. The existing erosion gully would be filled
with riprap and compacted fill. The culvert would be trimmed back to the bank. Riparian trees would be
planted on the inset bench.
9
At the C Street Bridge, erosion and scour holes caused by hydraulic jump and high velocity flows would be
repaired. Bioengineering solutions would not be feasible at this location because of high velocities. Other tasks
would include installing an engineered drop structure, removing the security grate, and abandoning the sewer
line and concrete blocks in streambed.
10
The concrete debris from streambed between C Street and A Street would be removed. Rock would be used to
provide grade control.
11
The storm drain outlet between C Street and A Street would be repaired by creating a small inset bench and
planting with riparian trees.
12
The erosion and scour holes at the A Street Bridge crossing would be repaired by installing an engineered
drop structure.
13
The storm drain outlet upstream of A Street would be repaired by creating small inset bench and planting with
riparian trees.
14
The storm drain outlet downstream of land bridge would be repaired by creating small inset bench and
planting with riparian trees.
15
The land bridge and two 4-ft culverts would be removed. A small inset floodplain would be created using
compacted fill, coir wrap, and rock.
16
An engineered drop structure at the Thunderbird Lane Bridge would be constructed to prevent future erosion
and resulting structural problems.
17
The abandoned concrete structure and steel posts within streambed in wetland area located upstream of
Thunderbird Lane Bridge would be removed.
18
The surface drainage problems (site-wide) would be corrected by installing curbs, catch basins, and storm
water detention facilities.
19
An inset floodplain between A Street and Thunderbird Lane would be graded to reduce the velocity of flow
during storm events.
20
An inset floodplain adjacent to wetland area upstream of Thunderbird Lane would be graded to reduce the
velocity of flow during storm events.
Source: GMA 2002a
Final SNL/CA SWEA DOE/EA-1422—January 2003
3-7
Chapter 3, Alternatives for Continuing Operations at Sandia National Laboratories, California
3.3.5
BUILDING 927
Under the Planned Utilization and Operations Alternative, Building 927 activities would increase by 50 percent.
All areas identified in the No Action Alternative would
increase. EDS subsystems would be assembled in the
facility. No testing with explosives or other hazardous
materials would occur at this location. The staff would
increase from 4 to 6 persons over the next 5 years.
3.3.6
MICRO AND NANO
TECHNOLOGIES LABORATORY
Under the Planned Utilization and Operations
Alternative, the MANTL activities would increase in
micro machining, miniature component fabrication, fuel
cell research and development, sensors and signal processing, and extreme ultraviolet lithography. An estimated
22 percent increase in materials R&D would include
characterization, chemistry, composite and lightweight
components, engineered materials (welding, brazing, and
joining), and science-based modeling. The staff would
increase from 97 to 118 persons over the next 5 years.
3.3.7
CHEMICAL AND RADIATION
DETECTION LABORATORY
The CRDL would continue to be used as a multipurpose R&D facility. Generally, the facility would support research, development, and fabrication of chemical
and radiation detection systems. Small increases in microstructures (LIGA) and radiation detector testing would
be expected. A large increase within the CRDL CDCregistered Biosafety Level 2 laboratories that provide
standard chemical, biological, and analytical laboratory
capabilities for conducting research in areas of advanced
micro-separation technologies, laser-based detection,
microelectronic biosensors, biological chemistry, and
toxins handling would be expected. The staff would
increase from 8 to 42 persons over the next 5 years.
3.3.8
AREA 8 FACILITIES
The Area 8 Facilities would continue to support
SNL/CA work. Testing activities would involve highpressure hydrogen, mechanical, high explosives, vibration,
climate, temperature, high acceleration, and EDS. Experiments and research in areas of welding, hydrogen fueled
engines, and special materials would continue. Data collection activities would support the above testing work.
A decrease in staffing associated with the EDS work
would occur.
3.3.9
EXPLOSIVE STORAGE AREA
The Explosive Storage Area activities would remain
the same as under the No Action Alternative. Under the
Planned Utilization and Operations Alternative, the
3-8
Explosive Storage Area explosive storage capacity would
remain the same.
3.3.10 HAZARDOUS AND RADIOACTIVE
WASTE STORAGE FACILITIES
Activities at the facilities would remain the same as under
the No Action Alternative. The facilities would operate
one shift. Annual quantities of (total) hazardous waste
managed (see Section 3.6, Table 3-4) would be 98,833 kg.
Annual quantities of radioactive waste managed (see
Section 3.6, Table 3-4) would be 5,998 kg for LLW and
510 kg LLMW managed. Other wastes by waste types are
presented in Section 3.6, Table 3-4.
3.3.11 LIGA TECHNOLOGIES FACILITY
The LTF would support R&D, and prototyping of LIGA
and LIGA-like micro devices. Activities at the LTF would
be similar to those under the No Action Alternative. No
increase would be anticipated. The LTF would produce
1,300 wafers per year.
3.3.12 DISTRIBUTED INFORMATION
SYSTEMS LABORATORY
The DISL would support the DOE’s Science-Based
Stockpile Stewardship and Management Program through
development and implementation of distributed information systems. Activities at the DISL would be similar to
those under the No Action Alternative. The staff would
increase by 50 persons.
3.3.13 GLASS FURNACE AND MELTING LABORATORY
Activities at the Glass Furnace and Melting Laboratory
would be similar to those under the No Action Alternative. No increase would be anticipated.
3.4
MAXIMUM OPERATIONS ALTERNATIVE
The Maximum Operations Alternative includes all
operations and activities identified in the Planned Utilization and Operations Alternative. In general, implementation of assignments would result in the highest reasonable
foreseeable activity levels that could be supported by
current facilities (with two shifts) and the potential
expansion and construction of new facilities.
Land use changes, infrastructure improvements, and
construction activities (including upgrades) would be
the same as the Planned Utilization and Operations
Alternative (see Section 3.3).
New construction would include the projects identified
in the Planned Utilization and Operations Alternative
plus two additional projects. Building 916 (42,000 sq ft)
would be replaced with a building twice the size (84,000
sq ft). A new 16,000-sq-ft facility similar to the existing
Final SNL/CA SWEA DOE/EA-1422—January 2003
Chapter 3, Alternatives for Continuing Operations at Sandia National Laboratories, California
CRDL would be constructed for R&D. Up to 100,000 sq
ft of structures determined to be beyond useful life would
be removed over the next 10 years.
This alternative addresses the same facilities described
in Section 3.2 for the No Action Alternative. This alternative differs from the Planned Utilization and Operations
Alternative in that operations would increase to the highest reasonably foreseeable levels over the next 10 years.
Balance of operations would increase proportionately
as discussed in Section 3.5. Activities common to all
alternatives are discussed in Section 2.3.3. The following
sections describe the activities that would occur at
specific facilities because of implementing assignments
under the Maximum Operations Alternative.
3.4.1
COMBUSTION RESEARCH FACILITY
The CRF would continue to be used for broad based
research in combustion science and technology. Two
shifts would support a wide variety of R&D in combustion engines and chambers, combustion chemistry,
combustion reactions, industrial and combustion
processes and diagnostics and remote sensing. Activity
levels would increase as staffing doubled from 250 to
500 persons.
3.4.2
BUILDING 910
Building 910 activities would increase in areas of
weapons R&D. The facility would increase science-based
engineering and technology activities in a wide variety
of sciences including advanced electronics prototype and
development, surface physics, neutron detector research,
and telemetry systems. Additional activities that focus
on electronics and microelectronics prototypes would
increase. Materials studies involving ceramics, semiconductors, organic polymers, and metals would increase.
Staffing would increase from 75 to 150 persons.
3.4.3
BUILDING 914
Building 914 would increase weapons test assembly
and machine shop activities. The facility would support
SNL/CA’s primary mission of ensuring that the U.S.
nuclear weapons stockpile is safe, secure, and reliable.
Increased activities would include prototype machining
and hardware generation, mechanical inspection, calibration, and electrical laboratory operations. A second shift
would increase staffing from 22 to 44.
3.4.4
BUILDING 916
Under the Maximum Operations Alternative, Building
916 would continue to be used to conduct R&D.
Generally, the activities focused on materials studies
including chemical and physical properties and characteristics (phases) would expand. The number of materials
Final SNL/CA SWEA DOE/EA-1422—January 2003
studies would increase in areas of ceramics, semiconductors, organic polymers, and metals. Research would
increase including thin film interface science, mechanics,
ion implantation, gases in metals, hydrogen storage,
plasma, annealing, detectors, science-based modeling,
extreme ultraviolet lithography, microsystems, and
fluidics. A second shift would increase staffing from 46
to 91. A larger building replacing Building 916 would be
necessary.
3.4.5
BUILDING 927
Building 927 would continue to be used to store nuclear
and classified materials, assemble subsystems, conduct
system verification, and store equipment. No testing with
explosives or other hazardous materials would be completed at this location. Staffing levels would increase
from 4 to 8 persons.
3.4.6
MICRO AND NANO
TECHNOLOGIES LABORATORY
MANTL activities would increase in a wide variety of
operations including micro machining, miniature component fabrication, fuel cell research and development, sensors and signal processing, and extreme ultraviolet lithography. Materials R&D would increase and include
characterization, chemistry, composite and lightweight
components, engineered materials (welding, brazing,
and joining), science-based modeling, and radiography.
Specific operations would increase including materials
evaluation, materials synthesis and processing, microsystems processing, and nanolithography equipment development. A second shift would increase staffing from 97
to 194.
3.4.7
CHEMICAL AND RADIATION
DETECTION LABORATORY
The CRDL operations would increase slightly above the
Planned Utilization and Operations Alternative and continue to be used as a multi-purpose R&D facility. Generally, the facility would support research, development, and
fabrication of chemical and radiation detection systems.
Increases in activities would involve development of biological/chemical species sensors that detect trace amounts
of toxins, viruses, and biological species and protein
research. Areas of research and development would
expand and include microstructures, radiation detectors,
laser-based detectors, and sensor research (nerve agents,
drugs, and explosives). Rooms within the CRDL would
continue to operate as CDC registered Biosafety Level 2
laboratories and provide standard chemical, biological,
and analytical laboratory capabilities for conducting
research in areas of advanced micro-separation technologies, laser-based detection, microelectronic biosensors,
biological chemistry, and toxins handling. CRDL staffing
would increase to 46 persons.
3-9
Chapter 3, Alternatives for Continuing Operations at Sandia National Laboratories, California
3.4.8
AREA 8 FACILITIES
The Area 8 Facilities activities would continue to
support SNL/CA work, but would increase testing
activities involving high-pressure hydrogen, mechanical,
high explosives, vibration, climate, temperature, and high
acceleration. Experiments and research in areas of welding, hydrogen fueled engines, and special materials would
continue. Data collection activities would support the
above testing work. Area 8 staffing would increase to
40 persons.
3.4.9
EXPLOSIVE STORAGE AREA
The Explosive Storage Area activities would remain the
same as under the No Action Alternative. Under the
Maximum Operations Alternative, the Explosive Storage
Area explosive storage capacity would remain the same
(234.2 kg).
3.4.10 HAZARDOUS AND RADIOACTIVE
WASTE STORAGE FACILITIES
Activities would remain the same as under the No Action
Alternative. The facility would operate two shifts. Annual
quantities of (total) hazardous waste managed would be
118,465 kg. Annual quantities of radioactive waste managed (see Section 3.6, Table 3-4) would be 8,121 kg for
LLW and 690 kg LLMW. Other wastes by waste types are
presented in Section 3.6, Table 3-4.
3.4.11 LIGA TECHNOLOGIES FACILITY
The LTF would support R&D, and prototyping of LIGA
and LIGA-like micro devices. Activities at the LTF would
be similar to those under the No Action Alternative; the
facility would operate two shifts and produce 2,600
wafers per year.
3.4.12 DISTRIBUTED INFORMATION
SYSTEMS LABORATORY
The DISL would support DOE’s Science-Based Stockpile
Stewardship and Management Program through development and implementation of distributed information
systems. Activities at the DISL would be similar to those
under the No Action Alternative. No increase would be
anticipated.
3.4.13 GLASS FURNACE AND MELTING LABORATORY
Activities at the Glass Furnace and Melting Laboratory
would be similar to those under the No Action Alternative. No increase would be anticipated.
3-10
3.5
BALANCE OF OPERATIONS
For completeness of analysis, the NNSA also gathered
information on the balance of operations at SNL/CA.
Information regarding other facilities, site support services, site-wide water and utility use, site-wide waste generation, hazardous chemicals purchased, process wastewater,
and radioactive dose data were incorporated into the
analysis. Balance of operations activities include many
R&D activities and routine operations; infrastructure,
administrative, and central services for SNL/CA; traffic
flow adjustments to existing onsite roads in predisturbed
areas, including road realignment and widening; facility
maintenance and refurbishment activities; and environmental, ecological, and natural resource management
activities. Some routine refurbishment, renovation, and
small-scale removal of specific surplus facilities and closures will continue at SNL/CA regardless of alternative.
The SWEA considers balance of operations and their
effects on environmental conditions under the three
alternatives. Balance of operations activities involve little
or no toxic materials, are of low hazard, and are usually
categories of actions excluded from analysis by DOE’s
NEPA regulations (10 CFR Part 1021). Because of this,
potential environmental impacts from the balance of
operations are not described in detail but evaluated
collectively.
In general, balance of operations equals site-wide totals
minus selected facilities contributions. The No Action
Alternative consists of conditions at SNL/CA in 2000
(baseline) while the Planned Utilization and Operations
Alternative and the Maximum Operations Alternative
were increased by 13 percent and 53 percent above the
No Action Alternative, respectively. These increases are
related to projected staffing increases.
The Environmental Information Document (EID)
(SNL/CA 2002b), FSID (SNL/CA 2002a), and Comparison of Parameters to be Used to Analyze SNL/CA Facilities
under the No Action, Planned Operations, and Maximum
Operations (TtNUS 2002a) provide information concerning site-wide and facility specific information. These
documents have been extensively used in the defining
of balance of operations data and are not cited repeatedly.
3.6
DATA USED TO
ANALYZE ALTERNATIVES
Table 3-3 summarizes operational data for specific
facilities. Table 3-4 presents data used in performing
impact analyses in Chapter 5 by resource area (see the
FSID for data regarding typical chemical and radioactive
material inventories).
Final SNL/CA SWEA DOE/EA-1422—January 2003
CATEGORY
Final SNL/CA SWEA DOE/EA-1422—January 2003
Operational
Parameters
Explosive Storage Area
Operational
Parameters
Area 8 Facilities
Operational
Parameters
LLW
employee
dollar
megawatt-hour
thousand cubic foot
Facility Staffing
Expenditures
Electrical Use
Natural Gas Use
kg
Total Hazardous
gallon
kg
LLMW
Wastewater
Waste
kg
LLW
thousand cubic foot
Natural Gas Use
kg
megawatt-hour
Electrical Use
Storage Capacity
dollar
Expenditures
Explosive Material
employee
Facility Staffing
kg
Total Hazardous
gallon
kg
LLMW
Wastewater
Waste
kg
thousand cubic foot
Natural Gas Use
0
Minimal
10.8 M
No staffing
Not measured
0
0
0
234.2
0
720
10.8 M
25
Not measured
814
0
168
8,941
2,259
1.7 M
dollar
megawatt-hour
Expenditures
Electrical Use
8
employee
77,100
1,169
Facility Staffing
kg
Total Hazardous
0
13
a
a
NO ACTION
ALTERNATIVE
gallon
kg
LLMW
kg
UNITS
(per year)
Wastewater
Waste
LLW
ACTIVITY TYPE
OR MATERIAL
Chemical and Radiation Detection Laboratory (CRDL)
FACILITY NAME
0
Minimal
2.4 M
No staffing
Not measured
0
0
0
234.2
0
288
2.4 M
8
Not measured
326
0
67
8,941
11,857
10.5 M
42
404,775
6,135
0
68
a
a
PLANNED
OPERATIONS
ALTERNATIVE
Table 3-3. Comparison of Data Used to Analyze Specific Facilities under the
No Action, Planned Utilization and Operations, and Maximum Operations Alternatives
0
Minimal
21.6 M
No staffing
Not measured
0
0
0
234.2
0
1,440
21.6 M
40
Not measured
1,628
0
336
8,941
12,986
13.4 M
46
443,325
6,719
0
75
a
a
MAXIMUM
OPERATIONS
ALTERNATIVE
Chapter 3, Alternatives for Continuing Operations at Sandia National Laboratories, California
3-11
3-12
thousand cubic foot
Natural Gas Use
megawatt-hour
Electrical Use
Operational
Parameters
employee
dollar
megawatt-hour
thousand cubic foot
Facility Staffing
Expenditures
Electrical Use
Natural Gas Use
kg
Total Hazardous
gallon
kg
kg
LLMW
Wastewater
Waste
LLW
dollar
Expenditures
thousand cubic foot
employee
Facility Staffing
Natural Gas Use
gallon
kg
Total Hazardous
Wastewater
kg
LLMW
kg
megawatt-hour
Electrical Use
LLW
dollar
Expenditures
Waste
employee
Facility Staffing
kg
gallon
kg
LLMW
kg
UNITS
(per year)
Total Hazardous
LLW
ACTIVITY TYPE
OR MATERIAL
Wastewater
Waste
CATEGORY
Micro and Nano Technologies Laboratory (MANTL)
Other
Parameters
Building 927
Operational
Parameters
Building 916
FACILITY NAME
25,754
5,440
30.1 M
97
120,337
7,109
0
0
1,907
145
1.2 M
4
Not measured
4,182
0
0
5,535
3,464
12.3 M
46
31,000
596
0
1.5
a
NO ACTION
ALTERNATIVE
25,754
6,637
35.4 M
118
146,811
8,673
0
0
1,907
218
1.9 M
6
Not measured
6,273
0
0
5,535
5,291
18.1 M
70
47,430
912
0
2.3
a
PLANNED
OPERATIONS
ALTERNATIVE
Table 3-3. Comparison of Data Used to Analyze Specific Facilities under the
No Action, Planned Utilization and Operations, and Maximum Operations Alternatives
25,754
10,880
60.2 M
194
240,674
14,218
0
0
1,907
290
2.4 M
8
Not measured
8,364
0
0
5,535
6,928
24.6 M
91
62,000
1,192
0
3
a
MAXIMUM
OPERATIONS
ALTERNATIVE
Chapter 3, Alternatives for Continuing Operations at Sandia National Laboratories, California
Final SNL/CA SWEA DOE/EA-1422—January 2003
CATEGORY
Final SNL/CA SWEA DOE/EA-1422—January 2003
Operational
Parameters
Explosive Storage Area
Operational
Parameters
Area 8 Facilities
Operational
Parameters
thousand cubic foot
Natural Gas Use
employee
dollar
megawatt-hour
thousand cubic foot
Facility Staffing
Expenditures
Electrical Use
Natural Gas Use
kg
gallon
kg
LLMW
Total Hazardous
Wastewater
Waste
kg
LLW
thousand cubic foot
Natural Gas Use
kg
megawatt-hour
Electrical Use
Storage Capacity
dollar
Expenditures
Explosive Material
employee
Facility Staffing
kg
Total Hazardous
gallon
kg
LLMW
Wastewater
Waste
megawatt-hour
Electrical Use
kg
dollar
Expenditures
LLW
gallon
employee
kg
Total Hazardous
Wastewater
kg
LLMW
kg
UNITS
(per year)
Facility Staffing
Waste
LLW
ACTIVITY TYPE
OR MATERIAL
Chemical and Radiation Detection Laboratory (CRDL)
FACILITY NAME
0
Minimal
10.8 M
No staffing
Not measured
0
0
0
234.2
0
720
10.8 M
25
Not measured
814
0
168
8,941
2,259
1.7 M
8
77,100
1,169
0
13
a
a
NO ACTION
ALTERNATIVE
0
Minimal
2.4 M
No staffing
Not measured
0
0
0
234.2
0
288
2.4 M
8
Not measured
326
0
67
8,941
11,857
10.5 M
42
404,775
6,135
0
68
a
a
PLANNED
OPERATIONS
ALTERNATIVE
Table 3-3. Comparison of Data Used to Analyze Specific Facilities under the
No Action, Planned Utilization and Operations, and Maximum Operations Alternatives
0
Minimal
21.6 M
No staffing
Not measured
0
0
0
234.2
0
1,440
21.6 M
40
Not measured
1,628
0
336
8,941
12,986
13.4 M
46
443,325
6,719
0
75
a
a
MAXIMUM
OPERATIONS
ALTERNATIVE
Chapter 3, Alternatives for Continuing Operations at Sandia National Laboratories, California
3-13
3-14
CATEGORY
ACTIVITY TYPE
OR MATERIAL
megawatt-hour
thousand cubic foot
Electrical Use
Natural Gas Use
megawatt-hour
Electrical Use
Operational
Parameters
employee
dollar
megawatt-hour
thousand cubic foot
Facility Staffing
Expenditures
Electrical Use
Natural Gas Use
kg
Total Hazardous
gallon
kg
kg
LLMW
Wastewater
Waste
LLW
dollar
Expenditures
thousand cubic foot
employee
Facility Staffing
Natural Gas Use
gallon
kg
Total Hazardous
Wastewater
kg
LLMW
Distributed Information Systems Laboratory (DISL)
Operational
Parameters
Waste
kg
dollar
Expenditures
LLW
employee
Facility Staffing
kg
gallon
kg
LLMW
kg
Total Hazardous
LLW
UNITS
(per year)
Wastewater
LIGA Technologies Facility (LTF)
Operational
Parameters
Waste
Hazardous and Radioactive Waste Storage Management Facilities
FACILITY NAME
0
2,500
20M
130
0
0
0
0
5,000
10,000
2.5 M
20
30,000
2,836-2,964
0
0
0
62 M
Not Reported
10-12
Not measured
Minimal
Minimal
Minimal
a
NO ACTION
ALTERNATIVE
0
2,500
20M
180
0
0
0
0
5,000
10,000
2.5 M
20
30,000
2,836-2,964
0
0
0
70 M
Not Reported
11-14
Not measured
Minimal
Minimal
Minimal
a
PLANNED
OPERATIONS
ALTERNATIVE
Table 3-3. Comparison of Data Used to Analyze Specific Facilities under the
No Action, Planned Utilization and Operations, and Maximum Operations Alternatives
0
2,500
20M
180
0
0
0
0
5,000
10,000
5M
40
60,000
5,672-5,928
0
0
0
124 M
Not Reported
20-24
Not measured
Minimal
Minimal
Minimal
a
MAXIMUM
OPERATIONS
ALTERNATIVE
Chapter 3, Alternatives for Continuing Operations at Sandia National Laboratories, California
Final SNL/CA SWEA DOE/EA-1422—January 2003
CATEGORY
Final SNL/CA SWEA DOE/EA-1422—January 2003
lbs/hour peak
lbs/hour peak
NOX
SO2
gallon
employee
dollar
megawatt-hour
thousand cubic foot
Facility Staffing
Expenditures
Electrical Use
Natural Gas Use
ppmv
VOCs
Wastewater
ppmv
CO
lbs/hour peak
kg
Total Hazardous
PM10
kg
kg
UNITS
(per year)
LLMW
LLW
ACTIVITY TYPE
OR MATERIAL
30,000
2,000
2.1M
12
5,200
<1
0.3
0.7
1
1
50
0
0
NO ACTION
ALTERNATIVE
30,000
2,000
2.1M
12
5,200
<1
0.3
0.7
1
1
50
0
0
PLANNED
OPERATIONS
ALTERNATIVE
Source: SNL/CA 2002a, TtNUS 2002a
a
Although the wastewater flows are not measured at certain facilities, the quantities are captured in the site-wide quantities in Table 3-4.
<: less than
kg/year: kilograms per year
lb/hour peak: pounds per hour peak
LLMW: low-level mixed waste
LLW: low-level waste
M: million
NA: not applicable/not available
NOX: nitrogen oxides
PM10: particulate matter smaller than 10 microns in diameter
ppmv: parts per million by volume
SO2: sulfur dioxide
Total Hazardous: includes Resource Conservation and Recovery Act (RCRA) hazardous, California toxic, Toxic Substance and Control Act waste, and biohazardous.
VOCs: volatile organic compounds
Operational
Parameters
Glass Furnace
emissions
Waste
Glass Furnace and Melting Laboratory
FACILITY NAME
Table 3-3. Comparison of Data Used to Analyze Specific Facilities under the
No Action, Planned Utilization and Operations, and Maximum Operations Alternatives
30,000
2,000
2.1M
12
5,200
<1
0.3
0.7
1
1
50
0
0
MAXIMUM
OPERATIONS
ALTERNATIVE
Chapter 3, Alternatives for Continuing Operations at Sandia National Laboratories, California
3-15
3-16
acre
acre
acre
acre
cy/yr
acre
DISL Construction
LTF Construction
Hazardous Waste Storage
Facility Modifications
Biological Area Set Aside (Reserve)
Soil Management
New Badge Office Complex
acre
acre
acre
acre
Identifying Areas as “Undesignated”
Identifying Areas as “Future
Construction” (including Soil
Management)
New Building Similar to CRDL
New Building as Replacement
for Building 916
Balance of Operations
Electrical Use
NA
MWh/yr
ft /yr
3
gal/yr
Sanitary Sewer Discharge
Natural Gas Use
gal/yr
Water Use (Potable)
Utilities (Annual Basis)
INFRASTRUCTURE
ft
Removal of Structures
2
acre
UNITS
Total Acreage
LAND USE
RESOURCE AREA
Same as FY 2000
Supports
1,100
Workforce
94 M
12 to 19M
50 to 60 M
No Action Plus 13 Percent
39,850
94 M
13.6 to 21.5 M
56.5 to 67.8 M
Not Part of This Alternative
Not Part of This Alternative
Not Part of This
Alternative
Not Part of This
Alternative
93 (approximately 25 acres for soil
management)
Not Part of This
Alternative
122
Not Part of This
Alternative
8
Not Part of This
Alternative
Same as No Action
4,000 to 5,000
Not Part of This
Alternative
20,000
30
Same as No Action
Same as No Action
Same as No Action
Same as No Action
PLANNED OPERATIONS
ALTERNATIVE
No changes
Within Existing
Footprint
2
4
410
NO ACTION
ALTERNATIVE
36,934
a
22,434
59 M
15 M
53 M
NA
NA
NA
NA
NA
NA
NA
NA
NA
NA
NA
410
FY 2000
No Action Plus 53 Percent
48,800
94 M
18.4 to 29.1 M
76.5 to 91.8
4
2
Same as Planned
Same as Planned
No Action Plus 100,000
Same as Planned
Same as Planned
Same as Planned
Same as No Action
Same as No Action
Same as No Action
Same as No Action
MAXIMUM OPERATIONS
ALTERNATIVE
Table 3-4. Comparison of Parameters Used to Analyze Sandia National Laboratories, California
under the No Action, Planned Utilization and Operations, and Maximum Operations Alternative
Chapter 3, Alternatives for Continuing Operations at Sandia National Laboratories, California
Final SNL/CA SWEA DOE/EA-1422—January 2003
b
Final SNL/CA SWEA DOE/EA-1422—January 2003
b
gal/yr
acre
Irrigation Water Use
Impervious Surface
kg/yr
kg/yr
Particulate Matter
Sulfur Dioxide
Nitrogen Oxides
lbs/hr
kg/yr
Carbon Monoxide (CO)
Nonradioactive Emissions Rates
(Glass Furnace design parameters)
kg/yr
number
Nitrogen Oxides
Nonradioactive Emissions Rates
(excluding the Glass Furnace)
Permitted Emission Sources
AIR QUALITY
Cultural Resources Located in
all Areas of Potential Effect
acre
acre
Disturbance of California redlegged frog critical habitat
CULTURAL RESOURCES
NA
Improvement
BIOLOGICAL AND ECOLOGICAL RESOURCES
gal/yr
cy/yr
cy/yr
cy/yr
Number
UNITS
Water Use
WATER RESOURCES AND HYDROLOGY
Onsite Soil Managed
New Material, Backfill, Stone, etc.
Soil Removed
Solid Waste Management Units
GEOLOGY AND SOILS
RESOURCE AREA
a
0
NA
NA
300 to 400
4,000
18
NA
NA
NA
49.2
16-17 M
53 M
NA
NA
NA
23 (20-NFA)
3–Long Term
Monitoring
FY 2000
3,000 to 6,000
3,000 to 4,000
Not Part of This
Alternative
Not Part of This
Alternative
0.3 to 1.5
NA
NA
300 to 400
4,000
28
No changes
No changes
No changes
49.2
16 to 17 M
0.3 to 1.5
NA
NA
339 to 452
4,520
30 to 32
No Changes
37
20 Improvement Tasks
76.9
16 to 17 M
56.5 to 67.8 M
4,000 to 5,000
Not Part of This
Alternative
50 to 60 M
Same as FY 2000
PLANNED OPERATIONS
ALTERNATIVE
Same as FY 2000
NO ACTION
ALTERNATIVE
0.3 to 1.5
NA
NA
459 to 612
6,120
57
No Changes
Same as Planned
Same as Planned
76.9
16 to 17 M
76.5 to 91.8 M
Same as Planned
Same as Planned
Same as Planned
Same as FY 2000
MAXIMUM OPERATIONS
ALTERNATIVE
Table 3-4. Comparison of Parameters Used to Analyze Sandia National Laboratories, California
under the No Action, Planned Utilization and Operations, and Maximum Operations Alternative
Chapter 3, Alternatives for Continuing Operations at Sandia National Laboratories, California
3-17
3-18
lbs/hr
Sulfur Dioxide
tons/yr
tons/yr
tons/yr
New Badge Office
Building 916 Replacement and New
Building Similar to CRDL
Soil Hauling, Inbound Material Haulings
b,e
and Related Improvement Tasks
outbound
shipment
inbound
shipment
shipment
SNL/CA Weekly Hazardous
Materials Transports (Excluding Waste)
Supplier Weekly
Hazardous Material Transports
a,c
mi
acre
Paved and Unpaved Roads
Pedestrian Malls
Incoming Material (Rock, Soil,
a
Concrete)
shipment
vehicle
Site-Related Traffic - Total Daily traffic
Soil Transports
shipment
shipment
Waste (Includes Hazardous
and Radioactive)
Sanitary Waste
trip
(one way)
Material (Annual Shipments Radioactive,
Chemical, and Explosives)
TRANSPORTATION (Normal Operations)
tons/yr
DISL, LTF, Hazardous
d
Waste Storage Facility
a
4
6.2
NR
NR
1 to 3
(Total of 100)
1 to 3
(Total of 33)
700 to 1,000
52
76
33
NA
NA
NA
NA
c
None
0
0
0
0
FY 2000
CONSTRUCTION-RELATED CARBON MONOXIDE EMISSIONS
Radioactive Emissions
ppmv
lbs/hr
Particulate Matter
Volatile Organic Compounds
ppmv
UNITS
Carbon Monoxide
AIR QUALITY
RESOURCE AREA
1,500 to 3,000 over 10 Years
Not Part of This
Alternative
4
6.24
9.7
2,000 to 2,500 over 10 Years
Not Part of This
Alternative
6.2
1 to 3
(Total of 113)
1 to 3
(Total of 37)
791 to 1,130
59
86
1 to 3
(Total of 100)
1 to 3
(Total of 33)
700 to 1,000
52
76
37
2.25
Not Part of This
Alternative
33
Not Part of This Alternative
2.3
Not Part of This
Alternative
Not Part of This
Alternative
Same as No Action
None
<1
0.35
0.25 to 0.5
<10
PLANNED OPERATIONS
ALTERNATIVE
2.3
None
<1
0.35
0.25 to 0.5
<10
NO ACTION
ALTERNATIVE
6.24
9.7
Same as Planned
Same as Planned
1 to 3
(Total of 150)
1 to 3
(Total of 50)
1,071 to 1,530
80
116
50
Same as Planned
4.6
Same as Planned
Same as No Action
None
<1
0.35
0.25 to 0.5
<10
MAXIMUM OPERATIONS
ALTERNATIVE
Table 3-4. Comparison of Parameters Used to Analyze Sandia National Laboratories, California
under the No Action, Planned Utilization and Operations, and Maximum Operations Alternative
Chapter 3, Alternatives for Continuing Operations at Sandia National Laboratories, California
Final SNL/CA SWEA DOE/EA-1422—January 2003
acre
Paved Parking Areas
12.7
5.5
kg/yr
LLMW
Final SNL/CA SWEA DOE/EA-1422—January 2003
kg/yr
kg/yr
metric
tons
California Toxic Waste
Total Hazardous
Municipal Solid Waste
dollar
Source: TtNUS 2002a
a
FY 2000 data were used as a baseline unless otherwise
stated in Chapter 5.
b
The Arroyo Seco and Habitat improvement projects were
assumed to be spread over the next 10 years since regulatory agency approvals may require a phased approach.
Since estimates included deliveries of trees, plants, pipes,
and other materials (mulch, hay, seed, top soil, etc.) new
material quantities were doubled.
c
Assumed to be one-year projects excluding soil hauling,
which was assumed to continued for 10 years.
d
Assumes Hazardous Waste Storage Facility-related
emissions are very small.
e
To bound the analysis, soil hauling assumes total offsite
management although current planning includes onsite
soil management.
Operating Budget
Employment
SOCIOECONOMICS
SNL/CA Estimated Noise
Workforce
247.5
kg/yr
Biohazardous
NOISE
87,464
kg/yr
TSCA (PCBs and Asbestos)
39,706
90,488
f
131 M
131 M
1,043 – 1,317
CNEL Ld
7-am to 7 pm
170 M
262 M
1,657 – 1931
CNEL Ld
7-am to 10 pm
378.7
118,465
39,648
843
43,372
34,602
690
8,121
19.8
8.6
MAXIMUM OPERATIONS
ALTERNATIVE
LLW: low-level waste
LTF: LIGA Technologies Facility
M: million
mi: mile
MWh/yr: megawatt-hours per year
NA: not applicable/not available
NFA: No Further Action
NR: Not Reported
PCBs: polychlorinated biphenyls
ppmv: parts per million per volume
RCRA: Resource Conservation and Recovery Act
SNL/CA: Sandia National Laboratories, California
TBD: to be determined
TSCA: Toxic Substances Control Act
yr: year
1,222 – 1,496
CNEL Ld
7-am to 7 pm
279.7
98,833
29,282
623
43,372
25,556
510
5,998
19.8
8.6
PLANNED OPERATIONS
ALTERNATIVE
Large quantities in FY 2000 include removal of Building 913.
<: less than
CNEL Ld: community noise equivalent-level-day
CO: carbon monoxide
CRDL: Chemical and Radiation Detection Laboratory
cy: cubic yards
DISL: Distributed Information Systems Laboratory
ft2: square feet
ft3/yr: cubic feet per year
FTEs: full-time equivalent
FY: fiscal year
gal: gallon
gal/yr: gallons per year
kg/yr: kilograms per year
lbs/hr: pounds per hour
LLMW: low-level mixed waste
f
1,100
CNEL Ld
7-am to 7 pm
247.5
26,807
f
580
23,395
451
5,308
12.7
5.5
NO ACTION
ALTERNATIVE
f
a
f
25,914
551
f
38,383
kg/yr
22,616
451
f
5,288
RCRA Hazardous Waste
Chemical Waste
kg/yr
LLW
Radioactive Waste
f
FY 2000
WASTE GENERATION (Site-Wide includes Balance of Operations)
acre
UNITS
Paved Service Areas
TRANSPORTATION (Normal Operations)
RESOURCE AREA
Table 3-4. Comparison of Parameters Used to Analyze Sandia National Laboratories, California
under the No Action, Planned Utilization and Operations, and Maximum Operations Alternative
Chapter 3, Alternatives for Continuing Operations at Sandia National Laboratories, California
3-19
This page intentionally left blank.
Chapter 4, Affected Environment–Section 4.1, Introduction
CHAPTER 4
Affected Environment
4.1
INTRODUCTION
Understanding the affected environment is necessary
for understanding potential impacts from operations at
Sandia National Laboratories, California (SNL/CA). This
chapter describes the existing conditions that comprise
the physical and natural environment within SNL/CA,
the Region of Influence (ROI), and the relationship of
people with that environment. Descriptions of the affected environment provide a framework for understanding
the direct, indirect, and cumulative effects of each of
the three alternatives. The discussion is categorized by
resource area to ensure that all relevant issues are included. This chapter is divided into the following thirteen
resource areas that support the impact assessment
discussed in Chapter 5:
Regions of Influence
Each ROI—the area that SNL/CA operations may
reasonably affect—is delineated by its resource. ROIs
are determined based on characteristics of SNL/CA
and the surrounding area. The ROI limits may be
natural features or political boundaries. Other ROIs
are delineated using industry-accepted norms for
the resources.
❍
Land Use and Visual Resources
❍
Geology and Soils
❍
Water Resources and Hydrology
❍
Biological Resources
❍
Cultural Resources
❍
Air Quality
❍
Infrastructure
Materials released from SNL/CA can reach the
environment and people in a number of ways. The
routes that materials follow from SNL/CA to reach the
environment and subsequently people are called transport and exposure pathways. SNL/CA conducts environmental monitoring to determine whether radioactive
and nonradioactive materials were potentially released
into the environment. Environmental monitoring also
assesses the potential for people to encounter these
materials by any route of exposure. Sampled media
include ground-water, storm water runoff, and wastewater discharge. SNL/CA publishes an annual site
environmental report that contains details on these
sampling programs (SNL 1996a, 1997a, 1998a,
1999a, 2000a).
❍
Transportation
4.2
❍
Waste Generation
❍
Noise
❍
Human Health and Worker Safety
❍
Socioeconomics
❍
Environmental Justice
The information in this chapter comes primarily from
the SNL/CA Environmental Information Document (EID)
(SNL/CA 2002a) and from the comprehensive environmental monitoring and surveillance programs that the
United States (U.S.) Department of Energy (DOE) maintains at SNL/CA. Data for 2000 are presented where
available; data for 1996, 1997, 1998, and 1999 are also
included where necessary to present trends. Other relevant information is summarized and incorporated
by reference.
Each resource and topic area includes a discussion of
the ROI—the area that may be affected by SNL/CA
operations. The ROI establishes the scope of analysis
and focuses the discussion on relevant information.
Because resources and topic areas are often interrelated,
one section may refer to another.
Final SNL/CA SWEA DOE/EA-1422—January 2003
GENERAL LOCATION
SNL/CA is located about 40 miles (mi) east of San
Francisco at the southeast end of the Livermore Valley
in eastern Alameda County. The City of Livermore’s
central business district is located about 3 mi to the west.
SNL/CA occupies a 410-acre site adjacent to and south
of Lawrence Livermore National Laboratory (LLNL).
4.3
4.3.1
4.3.1.1
LAND USE AND VISUAL RESOURCES
LAND USE
Definition of Resource
Land use describes the condition of a particular area
and the activities that take place in that area. It is a
critical element in site operations decision-making,
especially when determining the feasibility of siting
new programs and facilities at SNL/CA, and identifying
conflicts between existing or projected operations and
the potential for new operations. DOE Policy 430.1,
DOE Land Use and Facility Policy (DOE P 430.1),
governs DOE’s management of its land and facilities,
based on the principles of ecosystem management
and sustainable development.
4-1
Chapter 4, Affected Environment–Section 4.3, Land Use and Visual Resources
4.3.1.2
Region of Influence
The ROI includes the entire SNL/CA site and the nearby
surrounding areas. This includes the main campus of the
site, all open spaces, the buffer zone located between the
inner and outer boundary fences, the area between the
boundary fence and the four surrounding main streets
(Vasco, Tesla, Greenville, and East), and the areas adjacent to these roads.
4.3.1.3
Affected Environment
Sandia National Laboratories,
California Location and Setting
SNL/CA is located approximately 40 mi (65 kilometers
[km]) east of San Francisco, adjacent to Livermore,
California. The site comprises 410 acres owned by DOE,
and is bounded by the City of Livermore to the west,
LLNL to the north, and privately-owned rural and
agricultural land to the south and east. The far western
edge of SNL/CA is bounded by Vasco Road (formerly
known as Las Positas Avenue), the far eastern edge by
Greenville Road and the South Bay Aqueduct, and the
northern edge by East Avenue, which separates SNL/CA
from LLNL on the north side of the road. South of the
southern end of the site is Tesla Road.
The general project area is situated at the southeast
corner of the Livermore Valley in Alameda County,
California. The valley, an east-west trending topographic
and structural depression cuts the Diablo Range of central
California. The majority of the 410-acre site is situated
on relatively flat terrain, although the southern portion
is hilly with gentle to steep slopes as it extends into the
Altamont Hills, which are located to the south and east
of the site. The elevation of the site ranges from 615 feet
(ft) above mean seal level (MSL) in the northwest to
approximately 850 ft MSL at the highest point in the
south. One watercourse is present on the site. Arroyo
Seco (formerly Muddy Creek) traverses the site from
southeast to northwest. The area is characterized by
perennial grasses and scattered oak woodland. Riparian
vegetation is present along Arroyo Seco, a seasonal
stream (Busby et al. 1990).
Historical Land Use at Sandia
National Laboratories, California
SNL/CA is situated within the Chochenyo territory of
the Ohlone/Costanoan Indians. Linguistic data suggest
that these people moved to the Bay Area approximately
A.D. 500. Historical accounts of the Ohlone/Costanoan
from the 1770s to 1790s describe a people conducting
seasonal rounds of hunting and gathering activities in the
area. During the Hispanic Period, the Livermore area was
part of Mission San Jose, established in 1797.
This area was likely used for livestock grazing, as raising
cattle for tallow and hides was a major economic pursuit
4-2
at that time. The far northwest corner of SNL/CA was
included in the land grant Rancho Las Positas. This land
grant was confirmed to Robert Livermore in the second
half of the 19th century and was used for vineyards, orchards, and raising cattle. William Mendenhall established
a city next to a railroad in 1869 and named it after Robert
Livermore (Busby et al. 1990, SNL/CA 2002b).
The agrarian use of the site continued through World
War II. LLNL was established on the site of the abandoned Livermore Naval Air Station in 1949. In March
1956, SNL/CA was established on 75 acres, formerly
the Naval Air Station’s barracks and gunnery range,
and farmland, to support the nuclear weapons research
being conducted at LLNL. An additional 86 acres of land
were acquired in 1970, 24 acres in 1979, and 228 acres
in 1986 to 1987, bringing the total to 413 acres. In 1998,
the DOE exchanged land with a neighboring property
owner to straighten out the west property boundary—
the neighbor received approximately three more acres
than did DOE, bringing the total to 410 acres (Busby
et al. 1990, SNL/CA 2002b, SNL 2001d).
Current Land Use at Sandia
National Laboratories, California
Primary land use at SNL/CA fits into the category of
industrial/research park uses, although not all facilities
are industrial in nature (for example, administrative
offices). Land use at the site includes buildings and
structures, infrastructure systems (water, sewer, gas, and
electrical), a firing range, roadways, parking areas, and
landscaping. Spaces between buildings are landscaped or
used as paved service areas, roads, or sidewalks. Parking
areas are positioned along the perimeter of the developed
area and cluster along East Avenue. Open space within
the developed area is set aside for future construction use,
with the exception of Arroyo Seco. A security buffer surrounding the western, southern, and eastern edges of the
developed area ranges in width from 600 to 1,200 ft and
represents 175 acres. This zone is located between the
security fence and the outer boundary fence. The buffer
zone has a dual purpose, ensuring that an adequate safety
zone exists for the physical protection of the public and
providing facility security. East Avenue lies at the north
end of SNL/CA, separating SNL/CA from the LLNL site.
East Avenue is a paved two-way street, with four lanes at
the west end and two lanes at the east end and walking/
bike lanes the entire length. Three roads are located on
the site but outside the developed area. These are Sandia
Drive on the west, Thunderbird Lane on the east, and
South Portal Drive to the south, which provides emergency access to and egress from the site (SNL/CA 2002b)
(Figure 4-1).
SNL/CA has 72 buildings used for administrative offices,
laboratories, shops, storage, or technical support. These
buildings provide approximately 740,000 adjusted gross
Final SNL/CA SWEA DOE/EA-1422—January 2003
Chapter 4, Affected Environment–Section 4.3, Land Use and Visual Resources
Source: Original
Figure 4-1. The Sandia National Laboratories, California Site,
Occupying 410 Acres, is owned by the U.S. Department of Energy
Lawrence Livermore National Laboratory is located adjacent and north of East Avenue.
square feet (gsf) (SNL/CA 2002b). Section 4.9 provides
discussion of site infrastructure.
Land Use Surrounding Sandia
National Laboratories, California
There are three private utility easements on SNL/CA,
all of which cross the site at the southern end. ChevronTexaco Corporation has an easement for an underground
oil pipeline. Pacific Gas and Electric Company (PG&E)
has easements for an overhead high-voltage electric power
transmission line and an underground high-pressure gas
pipeline (SNL/CA 2002b).
Land use in the region surrounding SNL/CA is a result
of city and county planning and zoning regulations.
The City of Livermore and the County of Alameda do
not have planning jurisdiction over SNL/CA. SNL/CA is
situated within the sphere of influence of the City of Livermore, but not within the incorporated area of the city.
The area to the west of the site, including Vasco Road, is
within the City of Livermore (SNL/CA 2002b).
Final SNL/CA SWEA DOE/EA-1422—January 2003
4-3
Chapter 4, Affected Environment–Section 4.3, Land Use and Visual Resources
To the north across East Avenue is LLNL, which encompasses approximately 821 acres and has land uses similar
to those at SNL/CA (Figure 4-2). To the east and south is
agricultural. East of SNL/CA are Greenville Road and a
hilly area used for cattle grazing. The South Bay Aqueduct
is located between the SNL/CA boundary and Greenville
Road. A private residence is located near the southeastern
corner of the site, between the aqueduct and the site
boundary fence. The area south of the site is primarily
vineyards with residences or buildings that are used for
activities such as wine tastings, parties, and dining. West
of SNL/CA is the City of Livermore and Vasco Road.
Various private landowners own the property on this side
of the site. In the area between Vasco Road and the west
boundary of SNL/CA is a mix of rural residential and
agricultural use, including an elementary school, Steivers
Academy. This area is currently zoned as single-family
residential with construction to start in 2002. With this
new residential development, the area will no longer be
rural residential. The National Nuclear Security Administration (NNSA) is currently negotiating with the property
owner a “Grant of Easement and Agreement” to establish
conditions, limitations, and provide disclosures. To the
west of Vasco Road, the present and proposed uses are
residential and light industrial (SNL/CA 2002b).
Source: Original
Figure 4-2. Land Use in the Areas Adjacent to Sandia National Laboratories, California
Sandia National Laboratories, California occupies 410 acres and is adjacent to East Avenue.
4-4
Final SNL/CA SWEA DOE/EA-1422—January 2003
Chapter 4, Affected Environment–Section 4.3, Land Use and Visual Resources
Sandia National Laboratories,
California Land-Use Trends
SNL/CA land use will not change significantly in the
near future. In accordance with the Sandia National
Laboratories Sites Comprehensive Plan (SNL 2001c), land
use at SNL/CA will remain consistent with industrial/
research park uses (SNL/CA 2002b).
Surrounding Land-Use Trends
The area surrounding SNL/CA is transitioning from
agricultural/open space to residential/light industrial/
commercial uses. Residences are encroaching on SNL/
CA’s western border, promoted by the city’s and county’s
designation of this area for such uses. The areas south
and east of SNL/CA are zoned agricultural and it is
expected that these areas will remain agricultural.
LLNL, located north of SNL/CA, is in stable, longterm use as a DOE facility.
4.3.2
4.3.2.1
VISUAL RESOURCES
Definition of Resource
Visual resources are those aspects of an area that pertain to
its appearance and to the manner in which people view it.
This resource area provides a means to review the aesthetic
qualities of landscapes and their modifications, associated
perceptions and concerns of people, and the physical or
visual relationships that influence the visibility of any proposed landscape modifications.
Scenic values are identified as views (typically from
publicly accessible areas) where there are natural landforms, man-made structures or elements (such as landscaping), and/or a panorama or distinctive composition
of the location or area (SNL/CA 2002b). Individuals may
hold these views as distinctive because of the visual character present. Expansive bodies of natural objects and
colors, such as hills, grassland, and open space, tend to
have a peaceful and calming effect on the viewer. Repetitive patterns also tend to have a calming effect. Buildings,
urban elements, and other man-made structures often
appear as abrupt and thus can provide an unwelcome
visual diversity in the view field. However, buildings and
structures that exhibit high artistic value, such as historic
buildings, can also provide an aesthetically pleasing view.
4.3.2.2
Region of Influence
The ROI is similar to that for land use. It consists of the
area in and adjacent to SNL/CA, where SNL/CA operations may influence the landscape and associated visual
characteristics.
4.3.2.3
Affected Environment
One of the goals for SNL/CA is to create a campus-like
atmosphere at the site. To achieve this goal, SNL/CA
Final SNL/CA SWEA DOE/EA-1422—January 2003
developed the Sandia National Laboratories California
Site Visual Quality Guidelines & Landscape Master Plan
(Royston et al. 1993). Important aspects of the plan that
pertain to development of the site are to maintain view
corridors, to cluster buildings to create sheltered spaces,
to close connections between buildings, and to situate
service access in unobtrusive areas.
Views from Within Sandia
National Laboratories, California
The views from within SNL/CA tend to fall into two
categories: views of buildings and associated landscaping
and paved surfaces (parking and service areas, sidewalks,
and roads), and views of open spaces that are either landscaped or natural. The latter views include spaces within
the built-up area of the campus, open areas along the
arroyo or in the buffer zones of the site, and more distant
open spaces such as the hills that are visible to the south
and east (near distant) and to the north and west (far
distant). Visibility of these open spaces is facilitated by
the low building density of the site and the moderate
height of the buildings. The site has 72 buildings used
for offices, laboratories, facilities, and storage. Views of
SNL/CA from within these buildings consist primarily of
landscaping, other buildings, and paved surfaces, though
some distant views of open spaces are visible from taller
buildings. Views seen while walking, biking, or driving on
SNL/CA are the same. From some areas of the site, views
are of the built areas located adjacent to SNL/CA, namely
LLNL to the north and the City of Livermore at Vasco
Road to the west. While many parts of SNL/CA could
provide an aesthetic value of relaxation and attractiveness
due to the campus-like atmosphere and the presence of
mature landscaping, the site as a whole would not likely
be considered of high scenic value due to the buildings
and paved surfaces (SNL/CA 2002b).
Views of Sandia National Laboratories,
California from Surrounding Areas
SNL/CA is situated on mostly flat terrain that provides
little or no public views of the site from locations a mile or
more away. Views of the site are limited to immediately
adjacent areas.
The view of SNL/CA from East Avenue consists of the
built portion of SNL/CA in the middle and the buffer
zones at the west and east ends. The view of the built
portion of the site is screened in many places by mature
trees and other landscaping. At the west end of the road,
views of distant open spaces to the south are available,
though views to the distance in the east, north, and west
are blocked by SNL/CA, LLNL, and the City of Livermore
respectively. At the east end of the road, distant views to
the east, south, and north are present, though views to the
west are blocked by SNL/CA, LLNL, and the City of Livermore. From all portions of the road, LLNL’s built area is
4-5
Chapter 4, Affected Environment–Section 4.4, Geology and Soils
in view and the City of Livermore is adjacent to the west
end of the road.
The view of SNL/CA from Vasco Road includes the northwest portion of the buffer zone and at one point, a view of
the Micro and Nano Technologies Laboratory’s (MANTL’s) building shape, roof, and exhaust stacks. Along most
of the road, the view east includes rural residential areas
and the distant open spaces beyond. To the west and adjacent to the road is the City of Livermore, which encompasses the entire view. To the north is LLNL, which dominates
the view, though at the south end of the road distant hills to
the north can be seen beyond LLNL. The view to the south
is of distant hills.
The view of SNL/CA from Tesla Road includes South
Portal Road and the gated entrance, and the water towers
on the hills at the south end of the site. These hills effectively block any other view of the site from this road.
On either side of the gated entrance are pastureland and
vineyards, which encompass the view from the road to
the north. Because Tesla Road is somewhat higher in
elevation, the distant open spaces to the north can still be
seen. To the south and east are views of agricultural areas
and distant hills. At the west end of the road, the area is
still agricultural, but the view west includes the City of
Livermore and distant open spaces.
Greenville Road is on terrain higher than SNL/CA, but
there are hills between the road and the site. Thus, views
of the site are available from the road only between these
hills. The view of the site from the northern end of the
road includes the buffer zone and the eastern edge of the
built area of the site, and the buffer zone and water tanks
at the southern end. Also included in the western view
are LLNL, the City of Livermore, and distant open spaces
to the west, south, and north. Views south and east from
the road are of agricultural open space and distant hills.
The view north includes LLNL and agricultural open
space, with hills in the distance.
The City of Livermore and the County of Alameda have
identified certain scenic routes where an effort is being
made to maintain the scenic view corridors (SNL/CA
2002b). While the city and county have no jurisdiction to
enforce any requirements on SNL/CA, it is useful to note
that of the eight roads identified as scenic routes, Greenville, Tesla, and Vasco are the only ones from which SNL/
CA is visible. As explained above, the views of SNL/CA
from these three roads are very limited.
4.4
4.4.1
GEOLOGY AND SOILS
DEFINITION OF RESOURCE
The discussion of geology and soils includes general geology, geological resources, geological hazards (seismology),
and soils. General geology refers to topography, structural
geology, and stratigraphy. Geological resources include
4-6
aggregate deposits, fossil occurrences, and oil production.
Geological hazards include seismology (which refers to the
geology below the soil layer that is relevant to the occurrence, frequency, and magnitude of earthquakes) and slope
stability. The discussion of soils briefly describes soils present at the site and contaminated soils.
4.4.2
REGION OF INFLUENCE
The main concern of seismic activity is the effect on
onsite facilities, specifically, whether damage from earthquakes could result in a contaminant release. Therefore,
the ROI would be the extent of environmental or human
health effects from such a release. Soil contamination
could potentially result at or near the point of release.
Thus, the ROI is limited to SNL/CA. Potential migration
of soil contaminants into groundwater or surface water
is addressed in Sections 4.5.1.3 and 4.5.2.3.
4.4.3
4.4.3.1
AFFECTED ENVIRONMENT
General Geology
Topography and Geomorphology
SNL/CA is located in the California Coast Ranges geologic province (DOE 1992a, SNL/CA 2002b) characterized by low rugged mountains and relatively narrow
intervening valleys. Figure 1-1 shows the location of
SNL/CA relative to the surrounding area. Specifically,
SNL/CA is located in the southeastern portion of the
Livermore Valley. The valley forms an irregularly shaped
lowland area about 16 miles-long east-to-west and 7 milesto 10 miles-wide north-to-south. The floor of the valley
slopes to the west at about 20 ft per mile.
In general, the site consists of relatively flat foothills
that have low relief and slope gently northwest and north.
Slopes at SNL/CA vary from 1 to 3 degrees. The southern
area of SNL/CA is situated on the north side of a ridge
(the Altamont Hills) approximately 150 ft above the
surrounding land. The SNL/CA property ranges in
elevation from 849 ft above MSL at the south end of
the SNL/CA ridge top to 615 ft MSL at the northwest
corner of the site.
San Francisco Bay Area Structural Geology
A generalized map of the regional structural geology
and physiography of the San Francisco Bay Area is presented in Figure 4-3. The Diablo Range, which includes
the Altamont Hills, is part of the northwest-trending
Coast Ranges, and parallels three major faults in the area
(DOE 1992a, SNL/CA 2002b). These include the San
Andreas Fault system, the Sur-Nacimiento fault, and the
Coast Range thrust fault system (the Sur-Nacimiento
fault and the Coast Range thrust are not exposed in the
area shown in Figure 4-3). These faults can generally be
considered to define three different lithologic blocks. The
Final SNL/CA SWEA DOE/EA-1422—January 2003
Chapter 4, Affected Environment–Section 4.4, Geology and Soils
Source: DOE 1992a
Figure 4-3. Generalized Geologic Map of the San Francisco Bay
Area Illustrating the location of Sandia National Laboratories, California
Final SNL/CA SWEA DOE/EA-1422—January 2003
4-7
Chapter 4, Affected Environment–Section 4.4, Geology and Soils
westernmost block is the Salinian Block, which lies
west of the San Andreas Fault shown in Figure 4-3.
This block consists primarily of metamorphic and granitic rock. To the east of the Salinian Block is the Franciscan
Assemblage, lying between the San Andreas and the
Coast Range thrust fault zones. It is composed of marine
sedimentary and volcanic rocks. The next block positioned above the Coast Range thrust fault zone consists
of late Mesozoic through late Tertiary marine sedimentary rocks overlying complex ancient oceanic and continental crust rocks. This block lies primarily along the eastern
margin of the Coast Range Province. Structural relationships along the Coast Range thrust are complex due to
later reactivation of the thrust by high-angle normal and
strike slip faults.
SNL/CA Site Fault Zones
The two regional northwest-southeast trending fault
zones located closest to SNL/CA are the Greenville fault
zone and the Tesla-Ortigalita fault zones, both shown in
Figure 4-3. To the west, the San Ramon Valley fault is
located approximately 10 mi. Figure 4-4 shows the South
Branch Las Positas fault, which traverses the southern
most section of SNL/CA. The North Branch Las Positas
fault cuts through the center of the SNL/CA site.
A geologic map showing general geologic structures
including faults mapped near SNL/CA is presented in
Figure 4-4.
Stratigraphy
Stratigraphic units exposed in the Livermore Valley and
adjacent areas may be discussed in terms of three general
groupings: Jurassic and Cretaceous igneous and metamorphic rocks; a sequence of primarily marine sedimentary
rocks; and primarily continental rocks and alluvial deposits (see Figures 4-3 and 4-4). A generalized schematic
stratigraphic column for the Livermore Valley is presented in Figure 4-5.
4.4.3.2
Geologic Resources
The geologic resources found near SNL/CA include
aggregate deposits, fossil occurrences, and petroleum.
These resources are described below.
Aggregate Deposits and Other Mineral Resources
The potential stone and aggregate resources of the eastern
Livermore Valley and western San Joaquin County were
assessed in 1987 and 1988. Mineral Resource Zones (SNL/
CA is a Mineral Resource Zone 1) have been established
that identify sand, gravel, and stone source areas. Within
the eastern Livermore Valley, several deposits have been
identified as recoverable and marketable resources (DOE
1992a). According to a report developed by the California
Department of Conservation, Division of Mines and Geo-
4-8
What Does Mineral
Resource Zone 1 Mean?
Mineral Resource Zone 1 is defined as an area where
adequate information indicates that no significant
mineral deposits are present or where it is judged that
there is little likelihood of their presence.
logy, an estimated 3.8 billion tons of aggregate reserves are
available within the southern San Francisco Bay region,
and the total aggregate reserves available within the Livermore Valley area amount to 676 million (M) tons; however,
much of the area is currently developed for other land uses
(SNL/CA 2002b).
Several occurrences of other potentially economically
valuable mineral deposits are within a 10-mi radius of
SNL/CA. These include deposits of manganese, chromium, clay, gemstones, pyrite, dimension stone, sand and
gravel, and natural gas.
Fossil Occurrences
Fossils in the eastern Livermore Valley and the hills to the
east are principally found in unconsolidated and poorly
consolidated Cenozoic deposits. The primary fossil-bearing units are the Miocene Neroly and Cierbo formations,
and some younger units of Pleistocene age (DOE 1992a).
In the mid 1990s, excavation for the National Ignition
Facility located on LLNL unearthed mammoth and horse
fossils. Those fossils that would be affected by construction were excavated and curated at the University of California Museum of Paleontology at Berkeley (DOE 1999a,
SNL/CA 2002b).
Other vertebrate fossil deposits near SNL/CA are in the
Quaternary deposits of the surrounding low hills of the
east Livermore Valley, but the fossils are few in number
and quite scattered. They have been tentatively identified
as Rancho La Brean and Blancan in age (Pleistocene) and
consist of bone fragments of the mammoth and giant
sloth (SNL/CA 2002b). Invertebrate shells and leaf and
stem fossils have also been found. These appear to be
randomly dispersed, mainly within the Neroly Formation.
No invertebrate or botanical fossil deposits of significance
are believed to be present in the eastern Livermore Valley
(DOE 1992a, SNL/CA 2002b).
Petroleum and Natural Gas Production
The Livermore oil field just east of SNL/CA was discovered in 1967 and to date is the only oil field in the Livermore-San Ramon Valley area. The Livermore oil field
was originally operated by the Hershey Corporation and
consisted of ten producing wells. These wells are located
northeast of SNL/CA. Production is primarily from
Final SNL/CA SWEA DOE/EA-1422—January 2003
Chapter 4, Affected Environment–Section 4.4, Geology and Soils
Source: DOE 1992a
Figure 4-4. Generalized Geologic Structures Including Faults
Mapped in the Vicinity of Sandia National Laboratories, California
Final SNL/CA SWEA DOE/EA-1422—January 2003
4-9
Chapter 4, Affected Environment–Section 4.4, Geology and Soils
Source: DOE 1992a
Figure 4-5. Generalized Schematic Stratigraphic Column for the Livermore Valley
4-10
Final SNL/CA SWEA DOE/EA-1422—January 2003
Chapter 4, Affected Environment–Section 4.5, Water Resources and Hydrology
Miocene Cierbo Formation sandstones at depths of 900
to 2,000 ft. In 1992, the Livermore oil field was operated
by the American Exploration Corporation. Of the original
ten wells, five were producing an average of seven barrels
of oil per day; one well was plugged and abandoned; three
wells have been shut in; and one well was used for saltwater injection. Reserves were thought to be approximately 132,000 barrels and production was declining (DOE
1992a). In 2002, the XL Operating Company operated the
Livermore oil field. In February 2002, only three wells
were producing. No oil or gas exploration is currently
being conducted or proposed for the Livermore Valley or
in the hills to the east (CADC 2002a).
While Alameda County has no active natural gas wells,
the closes field is located southwest of the City of Livermore approximately 7 mi. Contra Costa and San Joaquin
counties have 26 and 63 producing gas wells, respectively.
The closest gas field is located east of SNL/CA approximately 15 mi near the City of Tracy (CADC 2002a).
4.4.3.3
Geological Hazards
Seismology
SNL/CA is located near the boundary between the
North American and Pacific tectonic plates, and the area
is characterized by the San Andreas Fault system, which
trends southeast northwest. Three principal components
of the San Andreas Fault system, the San Andreas, Hayward, and Calaveras faults, have produced the majority
of significant historical earthquakes in the Bay Area.
These three faults also accommodate the majority of slip
along the Pacific and North American plate boundary
and they would likely continue to generate moderate to
large earthquakes more frequently than other faults in
the region. The potential for local, damaging earthquakes
was highlighted by the January 1980 Livermore earthquake sequence on the Greenville fault, which produced
two earthquakes of magnitudes 5.5 and 5.6 on the Richter
Scale. The earthquake caused structural and nonstructural damage to the SNL/CA facilities.
In most cases, Calaveras fault earthquakes in the Livermore Valley region have occurred on strike-slip faults,
generally indicating north-south-oriented compression.
The fault segment nearest SNL/CA may be capable of
generating a magnitude 6 to 6.5 earthquake (DOE 1992a).
Slope Stability
SNL/CA consists of two different types of terrain separated by the north branch of the Las Positas fault. The
area north of the fault (north of Arroyo Seco) consists of
a relatively smooth land surface that gently slopes downward to the northwest. Because of the very low relief, the
potential for slope instability on the northern portion of
SNL/CA is remote. The terrain south of the Las Positas
fault, however, contains greater relief and steeper slopes
Final SNL/CA SWEA DOE/EA-1422—January 2003
that increase the potential for slope instability. The
potential for slope instability in the southern portion
of SNL/CA is considered moderate.
4.4.3.4
Soils
Topically, surface soils and arroyo sediments cover
the site. The soils beneath the site are formed primarily
upon sediments deposited by local streams (Figure 4-5).
Most of the deposits in the eastern part of the valley are
relatively young, and thus soils are only moderately
developed. These soils (generally loam) have minimal
horizon, or development of layers, and can be several
meters thick locally. Three soils cover most of SNL/CA:
Rincon clay loam, Positas gravelly loam, and Livermore
gravelly loam (SNL/CA 2002b).
Environmental Restoration Program
The Environmental Restoration Program activities
began in 1984. By 1991, 23 solid waste management
units were identified at SNL/CA. Of these locations,
nine were identified for further investigation. The largest site, the Navy Landfill, is 2 acres in size. Investigation
of these sites is regulated under the Resource Conservation and Recovery Act (RCRA). As of February 2002,
ER activities at SNL/CA have progressed through a series of remedial and closure actions to the point where
most sites have attained closure and active environmental monitoring is continuing on three sites: Fuel Oil Spill,
Navy Landfill, and the Trudell Auto Repair Shop site.
SNL/CA is working with the State on full closure
requests and monitoring requirements.
4.5
4.5.1
4.5.1.1
WATER RESOURCES AND HYDROLOGY
GROUNDWATER
Definition of Resource
Groundwater in the SNL/CA area occurs within saturated unconsolidated geologic material. The Livermore
Valley has been divided into 12 groundwater subbasins
based on the location of faults, topography, and other
hydrogeological barriers that affect groundwater occurrence, movement, and quality. Figure 4-6 shows four
drainage basins and numerous watershed boundaries.
4.5.1.2
Region of Influence
SNL/CA is situated primarily within the Spring and
Mocho I subbasins. The water-bearing sediments in the
Livermore Valley include late-Pleistocene to Holocene-age
alluvial sediments, generally less than 200 ft thick, which
overlie Plio-Pleistocene alluvial and lacustrine Livermore
Formation sediments up to 4,000 ft thick. The Livermore
Formation consists of beds of gravel, sand, silt, and clay
of varying permeabilities. Sandy-gravelly layers alternate
with fine-grained, relatively impermeable layers, and
4-11
Chapter 4, Affected Environment–Section 4.5, Water Resources and Hydrology
Source: DOE 1992a
Figure 4-6. Four Drainage Basins and Watershed Boundaries in the Livermore Valley
4-12
Final SNL/CA SWEA DOE/EA-1422—January 2003
Chapter 4, Affected Environment–Section 4.5, Water Resources and Hydrology
groundwater can be both confined and semiconfined
(DOE 1992a).
4.5.1.3
Affected Environment
Water-bearing units beneath SNL/CA are composed of
shallow heterogeneous, unconsolidated alluvium and
deep fluvial and lacustrine sediments. The permeable
sediments are separated by low-permeability silt and clay
layers, generally 15 to 60 ft thick. These silt and clay layers may constitute a regional confining layer. The confining layer slopes westward and varies in depth from about
60 ft to 400 ft. Shallow groundwater is located in a layer
of sand, silt, and gravel at a depth of about 98 to 112 ft
beneath the fuel oil spill site in the central developed portion of SNL/CA (SNL/CA 2002b). Shallow groundwater
is continuous throughout the site and has a saturated
thickness of about 6 to 8 ft. Beneath this layer of sand,
silt, and gravel is about 12 to 18 ft of stiff clay that acts as
an aquiclude (a formation that contains water but cannot
transmit it rapidly enough to furnish a significant supply).
Below this aquifer are two other water-bearing units that
are probably local and not part of the underlying aquifer.
The general direction of groundwater flow in the shallow
aquifer is from the southeast to the northwest, with a
hydraulic gradient of about 0.005 ft per foot, a hydraulic
conductivity of 0.4 to 14.9 ft per day and a porosity of
about 0.30. Given the maximum recorded groundwater
flow velocity, 340 ft per year, it would take 12 years for
groundwater to naturally flow from the SNL/CA fuel oil
spill site to the nearest downgradient domestic groundwater well 3,400 ft away (SNL/CA 2002b).
Since 1996, SNL/CA has monitored as many as 30 wells.
In June 1998, six wells were closed because the wells no
longer were needed for their original purpose. In August
1999, 11 additional wells were closed. For 12 wells, the
average depth to water ranged from 77.03 ft (monitoring
well [MW]-406) to 107.79 ft (MW-11) from 1996 to 2000.
The remaining well’s (AS-4) average depth to water was
16.34 ft from 1996 to 2000 (SNL/CA 2002b). This large
variation in groundwater measurements (as much as
120 feet) indicate that groundwater levels drop precipitously on the valley side of a fault zone that runs along
the base of the hills east of the SNL/CA site. Figures 4-7
and 4-8 show the locations of the groundwater monitoring wells. Current depth of groundwater at SNL/CA
varies from approximately 12 ft below ground surface
at well AS-4 (located on the south side of the North
Branch Los Positas fault [see Figure 4-4]) to 126 ft at
well MW-11 on the northeast side of the site (north side
of the fault zone).
Groundwater Quality
Groundwater near SNL/CA is generally suitable for use
as a domestic, municipal, agricultural, and industrial
Final SNL/CA SWEA DOE/EA-1422—January 2003
supply; however, industrial and agricultural uses of some
shallower groundwater may be limited by marginal quality. Furthermore, groundwater less than about 300 ft deep
is usually unsuitable for domestic use without treatment.
Groundwater monitoring wells were sampled at SNL/CA
for background water quality. Typical parameters used to
judge ground water quality are total dissolved solids, hardness, and naturally occurring organics. Water quality data
for the past five years (1996-2000) for wells screened in
the upper aquifer system under SNL/CA are presented in
the EID. Water quality data are managed in the Environmental Operations Database.
SNL/CA compares groundwater constituents to maximum contaminant levels (MCLs) for informational purposes in annual reports. The MCLs apply only to drinking
water sources. None of the aquifers sampled are used as a
source of drinking water.
Recent reports (constituents of concern) include detection of carbon tetrachloride in well NLF-6, fuel and fuel
constituents in wells at the former fuel tank location,
and tetrachlorethlene and several metals in MW-406.
SNL/CA continues to monitor according to DOE and
State of California requirements.
Locations of Potential or
Known Groundwater Contamination
SNL/CA has been conducting quarterly groundwater
monitoring since 1986 in response to several environmental remediation projects onsite. These projects—
Navy landfill closure, the Trudell Auto Repair Shop
closure, and the fuel oil spill site closure—are described
in further detail in Chapter 13 of the EID.
Groundwater monitoring wells were sampled at SNL/CA
for background water quality. Typical parameters used to
judge groundwater quality are total dissolved solids, hardness, and naturally occurring organics. Water quality data
for the past five years (1996-2000) for wells screened in
the upper aquifer system under SNL/CA are presented in
the EID. Water quality data are managed in the Environmental Operations Database.
Groundwater levels range from about 555 to 650 ft MSL
near Arroyo Seco to about 661 to 696 ft MSL at the Navy
landfill site. Groundwater elevation data are available in
the SNL/CA Groundwater Investigation Quarterly Reports
(1996-2000). Groundwater beneath the eastern Livermore Valley has generally been rising because there has
been a decrease in the volume being pumped for agricultural uses. As a result of abnormally low rainfall from
1987 through 1991, groundwater levels stopped rising
and declined in many monitoring wells at SNL/CA. In
response to normal rainfall in recent years, water levels
are once again rising.
4-13
Chapter 4, Affected Environment–Section 4.5, Water Resources and Hydrology
Source: Original, SNL/CA 2002b
Figure 4-7. Existing and Former Groundwater Monitoring Well Locations excluding Fuel Oil Spill Wells
A network of monitoring wells is used to collect samples for environmental monitoring.
Total petroleum hydrocarbons (TPH)-Diesel continues
to be a parameter of concern for SNL/CA because of the
fuel oil spill site remediation. However, this site has been
remediated, and the TPH-Diesel concentrations there
continue to decrease.
4-14
Groundwater Quantity
The Livermore Valley groundwater basin is recharged
from natural stream percolation; artificial stream percolation; aquifer storage; and recovery well, rainfall, applied
water and subsurface groundwater inflow from adjacent
Final SNL/CA SWEA DOE/EA-1422—January 2003
Chapter 4, Affected Environment–Section 4.5, Water Resources and Hydrology
Source: Original
Figure 4-8. Fuel Oil Spill Groundwater Monitoring Well Locations
The former fuel tank is located south of Arroyo Seco. The Trudell Auto Repair
Shop and Navy Landfill sites are located to the northeast and south, respectively.
groundwater basins. Stream recharge (natural and artificial) may contribute up to 65 percent by volume of recharge to the basin. At SNL/CA, Arroyo Seco provides
recharge to the groundwater basin. The majority of the
basin recharge would occur in the undeveloped uplands
east and southeast of SNL/CA.
In general, most groundwater in the basin flows toward
the west central portions of the valley. Groundwater generally moves east to west within the Livermore Valley;
groundwater near the center of the valley moves toward
the Amador subbasin and terminates in a large groundwater depression near gravel mining areas west of the
Final SNL/CA SWEA DOE/EA-1422—January 2003
city of Livermore. This depression is created by extraction
of groundwater for drinking water use and dewatering
for gravel mining. Pumping groundwater for agricultural
uses has historically accounted for the major withdrawal
of groundwater from the Livermore Valley basin. As the
valley has become increasingly urbanized, the amount
of pumping for municipal use and gravel quarrying
has exceeded agricultural withdrawals. Municipal use
accounts for approximately 52 percent. Numerous in-use
domestic supply wells and public water supply wells are
located near SNL/CA. The total volume of agricultural
water use has decreased from 1,420 acre-ft in 1990 to
203 acre-ft in 1999 (SNL/CA 2002b).
4-15
Chapter 4, Affected Environment–Section 4.5, Water Resources and Hydrology
4.5.2
4.5.2.1
SURFACE WATER
Definition of Resource
The surface water system on SNL/CA is a reflection
of the dry climate of the area. There are no perennial
streams or other natural surface water bodies at SNL/CA.
The Arroyo Seco, an ephemeral and intermittent stream,
diagonally traverses the site, entering along the southeast
border and leaving the site along the northwest corner.
The arroyo flows only in very wet years and for short
periods of time after significant storm events. Along the
eastern part of the Arroyo, however, an area designated
as a wetland is wet well into June and sometimes July.
This wetland may supply a small contribution to groundwater recharge, as do other streams in the general area.
4.5.2.2
Region of Influence
The ROI for surface water is Arroyo Seco and the watershed downstream from SNL/CA. Surface water flowing in
Arroyo Seco and subject to SNL/CA influences can affect
LLNL and the City of Livermore.
Surface Drainages
The major surface drainage of SNL/CA is Arroyo Seco
(Figure 4-8). The arroyo flows only in very wet years and
for short periods of time after significant storm events.
Along the eastern part of the Arroyo, however, an area
designated as a wetland is wet well into June and sometimes July. Several locations in the Arroyo are wet yearround because of irrigation runoff from landscaped areas.
Storm drains from the developed portions of the site discharge roof and parking lot runoff into the creek channel
at various locations. For the most part these flows are of
short duration—creating some in-channel flow that fills
pools and may run down the channel for some distance—
and are generally rapidly absorbed by the alluvial material
(GMA 2001a).
The peak discharge of the Arroyo Seco for a 2-year flood
is estimated to be 100 cubic ft per second (cfs). The peak
discharge of a 100-year flood is estimated to be 2000 cfs.
A more detailed hydraulic analysis of the Arroyo can be
found in the Arroyo Seco Improvement Project Progress
Report (GMA 2001b). The SNL/CA storm water conveyance system transports surface runoff to the Arroyo Seco
or to a ditch along East Avenue (Figure 4-9). The channel
along East Avenue is predominantly dirt, and runoff eventually infiltrates into the ground or evaporates. During
heavy storms, the water in the channel flows west and
eventually discharges to the Arroyo Seco via an underground-corrugated pipe.
The arroyo and the East Avenue channel are monitored
during the wet season as part of the SNL/CA storm water
program. Monitoring includes determining the arroyo
4-16
water quality as it enters the site, at various points within
the site, and as it leaves the site.
No regulatory limits have been set for pollutants in storm
water runoff. No pollutants were detected at levels that
would be a cause for concern during previous fire years.
Storm water quality data for the past five years (19962000) are presented in the EID.
Floodplains and Wetlands
All of SNL/CA drains to the Arroyo Seco. During the
rainy season, from October to April, the arroyo is a potential source of flooding onsite. It has a drainage length of
approximately 12 mi and a watershed area of approximately 8,960 acres upstream of SNL/CA. The channel is
narrow and shallow as it enters the site from the east and
reaches a depth of 20 ft further downstream as it leaves
the site to the northwest. Storm water from the site is
collected and channeled to the arroyo through gutters,
culverts, and open ditches. Open ditches and storm drains
at the site are designed for a 10-year storm and may
experience local flooding during the rainy season.
Upstream, in the upper two-thirds of the wetland,
there is a functional floodplain. In the lower one-third,
the effects of channel incision become apparent as both
banks are elevated 6 to 10 ft above the channel and there
is no functional floodplain. Floodplain maps indicate that
along most of the channel on SNL/CA property, the entire
100-year discharge is contained within the existing channel. Between A Street and Thunderbird Lane, however,
FEMA mapping indicates that flood flows would spill out
of the channel; this likelihood appears to be associated
primarily with the culverts at a manmade land bridge,
What is a Floodplain?
A floodplain is defined as the valley floor adjacent to
a streambed or arroyo channel that may be inundated
during high water. Flood insurance studies were performed for the Federal Emergency Management Agency (FEMA) to determine flood hazards in the Alameda
County area and to identify the approximate limits of
the 100-year floodplain.
What is a Wetland?
The Clean Water Act defines wetlands as areas that
are inundated or saturated by surface or groundwater
at a frequency and duration sufficient to support,
and that under normal circumstances do support a
prevalence of vegetation typically adapted for life in
saturated soil conditions. Wetlands generally include
swamps, marshes, and bogs.
Final SNL/CA SWEA DOE/EA-1422—January 2003
Chapter 4, Affected Environment–Section 4.5, Water Resources and Hydrology
Source: SNL/CA 2002b
Figure 4-9. Storm Water Outfall Locations
Storm water flow through Arroyo Seco is to the northwest.
Final SNL/CA SWEA DOE/EA-1422—January 2003
4-17
Chapter 4, Affected Environment–Section 4.5, Water Resources and Hydrology
which was in place when the FEMA study was conducted. In 1998, during a period of heavy flow, the discharge
did spill out of the channel at this location (GMA 2001a).
The wetland area of SNL/CA is approximately 1,370 ft
of the Arroyo Seco channel starting several hundred ft
east of Thunderbird Lane and extending east to the
property boundary. The wetland is approximately 8 ft
wide except near the property boundary where it averages
20 to 30 ft wide; it occupies 0.44 acres (SAIC 1998a).
The wetland area is a seasonal marsh. Vegetation is
discussed in Section 4.6.3.3.
In 1998, SNL/CA proposed a project to restore a
portion of the arroyo embankment and streambed at
the east buffer zone fence crossing and at the east buffer
zone trash rack and to remove the manmade land bridge
within the main SNL/CA site area. All three project sites
are designated flood zones, and the fence crossing and
trash rack are within the wetland. The Floodplain/Wetlands Assessment for Proposed Embankment and Streambed
Restoration Project in the Arroyo Seco (SNL/CA 1999a)
assessed project impacts. Based on the assessment and
to mitigate disturbance to the wetland area caused by
maintenance activities performed there, the wetland
area was replanted in December 1999. Plugs of native
wetland plants were collected from the Arroyo Seco and
replanted in the disturbed areas. Additionally, the bank of
the arroyo was reseeded with a mixture of native grasses.
The growth of the plantings was monitored, successful,
and reported to the California Department of Fish and
Game (CDFG). SNL/CA is required by CDFG to monitor
the replanted wetland for three years.
Surface Water Quality—Storm Water Runoff
SNL/CA has a Storm Water Pollution Prevention
Plan (SWPPP), as required by the State Water Quality
Control Board’s General Industrial Activities Storm Water
Permit (General Permit). The SWPPP discusses the site’s
storm water drainage system, the rationale for choosing
discharge observation locations, and the rationale for
choosing storm water sampling locations; it identifies
best management practices to reduce pollutant contact
with storm water.
Pollutants may be picked up by storm water runoff. If a
storm event lasts long enough there may be sufficient runoff to transport the pollutant to the Arroyo Seco before the
runoff evaporates or infiltrates into the ground. The
amount of runoff is a function of the permeability of the
ground surface or cover material. Approximately 12 percent of the site’s 410-acre drainage to the Arroyo is impervious (buildings, roads, parking lots, etc.) (SNL/CA 2002b).
The current SNL/CA storm water runoff-monitoring
program includes visually inspecting 22 locations and
sampling nine locations, shown in Figure 4-10. No
pollutants were detected at levels that would be a cause
4-18
of concern during 1995 to 1999 (SNL 1996a, 1997a,
1998a, 1999a, 2000a).
Authorized Nonstorm Water Discharges
The General Permit allows specific nonstorm water discharge that does not exceed quantities of pollutants. Best
management practices have been developed to prevent or
reduce the contact of nonstorm water discharges with
materials of concern or equipment and to minimize the
flow volume of the nonstorm water discharges. Authorized nonstorm water discharges onsite include air conditioning condensate, fire auxiliary building system and
hydrant testing, safety wash testing, landscape irrigation,
and emergency deionized water release. These discharges
are not sampled but are inspected quarterly as part of the
quarterly nonstorm water discharge visual observations
of the site.
Sanitary Sewer Discharges
The DOE Sandia Site Office (SSO) and SNL/CA maintain a wastewater discharge permit issued by the City of
Livermore. This permit regulates SNL/CA sanitary and
industrial effluent, which is discharged to the city’s sewer
system, and enforces the requirements of the Federal
Clean Water Act (CWA). The permit is renewed annually.
It contains discharge limits for the site sanitary sewer
outfall and for processes subject to U.S. Environmental
Protection Agency (EPA) pretreatment standards. The
permit also contains liquid effluent monitoring and reporting requirements.
The sanitary sewer effluent from SNL/CA must comply
with the site outfall discharge limits for regulated physical
parameters, radionuclides, and EPA priority organic pollutants. Two SNL/CA operations are subject to the EPA’s
pretreatment standards for point sources: one metal finishing and one semiconductor manufacturing operation.
Another metal finishing operation is a closed loop process
and does not discharge to the sanitary sewer; no sampling
of this process is required.
Sanitary fixtures, serving office and work space for over
1,000 employees (including contractors), generate most of
the wastewater discharged from SNL/CA. Laboratory and
research processes produce only small and intermittent
flows. These nonsanitary flows are generated by many
independent sources, such as small-scale research and
development (R&D) laboratories, throughout the site.
SNL/CA’s Wastewater Management Program tracks and
documents potential sources of pollutants for both regulated and unregulated constituents.
SNL/CA policy prohibits the discharge of regulated chemical wastes to the sanitary drains. This policy is backed up
by the Waste Management Program onsite and by ongoing
site-wide education. The Wastewater Management Program participates in laboratory planning activities so that
Final SNL/CA SWEA DOE/EA-1422—January 2003
Chapter 4, Affected Environment–Section 4.5, Water Resources and Hydrology
Source: Original
Figure 4-10. Storm Water Sampling Locations
Surface water flows are primarily during winter storms.
proper wastewater disposal practices are implemented
when the processes go online.
The site operates a wastewater management control system whereby potentially contaminated laboratory wastewater is routed to retention tanks for analysis and proper
Final SNL/CA SWEA DOE/EA-1422—January 2003
disposal. The Liquid Effluent Control System (LECS)
provides a fail-safe mechanism for preventing any release
of regulated materials from reaching a site outfall. Six
LECS units currently serve the site’s most active laboratories and research processes. Each LECS unit consists of
one or more 2,000- to 5,000-gallon (gal) tanks. The con4-19
Chapter 4, Affected Environment–Section 4.5, Water Resources and Hydrology
tents of the tanks are sampled and analyzed for metals
and relative acidity (pH) before being discharged to the
site’s sanitary sewer system. Figure 4-11 shows the LECS
and the site sanitary sewer system.
SNL/CA maintains a wastewater monitoring station in
the site’s northwestern security buffer area. The sewer
discharges to the LLNL sewer system across East Avenue.
SNL/CA maintains a flow meter, a pH meter, and two
Source: Original
Figure 4-11. Site Sanitary Sewer System and the Liquid Effluent Control System Locations
Sandia National Laboratories, California manages six Liquid Effluent Control Systems.
4-20
Final SNL/CA SWEA DOE/EA-1422—January 2003
Chapter 4, Affected Environment–Section 4.6, Biological Resources
automatic samplers to comply with monitoring requirements. The liquid effluent from the SNL/CA sanitary
sewer outfall is monitored for regulated physical parameters, metals, and EPA priority organic pollutants. The
wastewater must comply with the site outfall discharge
limits. Some slight exceedances have occurred, but these
have had no impact on the receiving wastewater treatment plant (SNL 1996a, 1997a, 1998a, 1999a, 2000a).
Potable Water Use
SNL/CA purchases potable water from the adjacent LLNL.
LLNL is supplied by the San Francisco Water District
through the Hetch Hetchy Aqueduct. When needed, water
is also supplied by the Alameda County Flood Control and
Water Conservation District, Zone 7. The San Francisco
Water District and Zone 7 are responsible for monitoring
the quality of the incoming water. SNL/CA neither treats
nor samples the drinking water. LLNL maintains the
drinking water distribution system for both sites. Maintenance includes water quality screening analyses. In 2000,
SNL/CA used approximately 53 million gallons (M gal).
4.6
4.6.1
BIOLOGICAL RESOURCES
DEFINITION OF RESOURCE
Biological resources at SNL/CA considered in this section
are terrestrial resources, aquatic resources, wetlands, and
protected and sensitive species.
4.6.2
REGION OF INFLUENCE
For biological resources, the affected environment consists of the plant and animal species within the boundaries of SNL/CA. Where appropriate, mention may be
made of the proximity of protected or sensitive species
that are not present at the site, but have been reported in
the surrounding area.
4.6.3
AFFECTED ENVIRONMENT
4.6.3.1
Terrestrial Resources
Vegetation
SNL/CA is located on 410 acres, with approximately
130 acres currently developed for use as research facilities, offices, support facilities, roadways, and parking
areas (SNL/CA 2002c). Undeveloped areas on the east,
south, and west sides of the facility provide a security
buffer zone and areas for future development. The following three terrestrial habitat areas have been identified in
the undeveloped areas: grassland, coyote brush scrub, and
riparian woodland (SNL/CA 2002b). The location of
these habitats is presented in Figure 4-12.
Grasslands
Grasslands comprise 226 acres at SNL/CA and represent
the predominant habitat in the open, undeveloped areas.
Final SNL/CA SWEA DOE/EA-1422—January 2003
Although both native and nonnative species are present,
nonnative species are dominant. Common nonnative
grasses include ripgut brome (Bromus diandrus), soft
chess (B. hordeaceus), wild oats (Avena sp.), and Mediterranean barley (Hordeum marinum). Common nonnative
herbs include red maids (Calandrinia ciliata), bur clover
(Medicago polymorpha), and cheeseweed (Malva sp.).
Scattered patches or individual native wildflowers can
be observed in the grassland habitat including Brodianea
(Brodinea sp.), California poppy (Escholzia californica),
blue dicks (Dishelostemma capitatum), and farewell to
spring (Clarkia purpurea) (SNL/CA 2002b, SAIC 2001a).
Recent botanical surveys have confirmed the presence
of mature valley oaks (Quercus lobata) in the grassland
habitat, with many valley oak saplings identified on the
east side of the site (SAIC 2001a). The locations of these
sites are indicated in Figure 4-12 (SNL/CA 2002b). The
presence of valley oak saplings at SNL/CA was considered
noteworthy by the survey team. Several saplings that may
be northern California black walnut (Juglans californica
hindsii) were observed, but positive identification may
not be possible for another several years (SAIC 2001a,
SNL/CA 2002b).
Eleven invasive exotic plant species have been identified
at SNL/CA: bindweed (Convolvulus arvensis), bull thistle
(Cirsium vulgare), Italian thistle (Carduus pycnocephala),
mayweed (Anthemis cotula), Mediterranean mustard
(Hirschfeldia incana), medusa head (Taeniatherum caputmedusae), milk thistle (Silybum marianum), pampas grass
(Cortaderia sp.), pepperweed (Lepidium latifolium), purple
star thistle (Centaurea clacitrapa), and yellow star thistle
(Centaurea solstitialis) (SNL/CA 2002b, SAIC 2001a).
Coyote Brush Scrub
Two small areas of coyote brush scrub occur onsite. One
is in the southwest corner of SNL/CA and the second is
near the Arroyo Seco on the eastern property boundary.
The total coyote brush scrub habitat is approximately
1.5 acres in size. It is located in steep and generally
inaccessible areas where disturbance from site activities
would be unlikely (SNL/CA 2002b).
Riparian Woodland
At SNL/CA, willow riparian woodland of approximately
2.4 acres is present along the eastern portion of the Arroyo
Seco. This habitat has increased from just a few isolated
patches in 1975 to a more dense and uniform cover along
the arroyo (SNL/CA 2002b). A recent survey determined
that dominant species include Goodding’s black willow
(Salix gooddingii), arroyo willow (Salix lasiolepis), red
willow (Salix laevigata), and narrow-leaved willow (Salix
exigua). Other common plant species include Fremont
cottonwood (Populus fremontii), western sycamore (Plantanus racemosa), and valley oak. A few immature trees
were tentatively identified as northern California black
4-21
Chapter 4, Affected Environment–Section 4.6, Biological Resources
Source: SNL/CA 2002b
Figure 4-12. Wildlife and Habitat at Sandia National Laboratories, California, as of May 2001
4-22
Final SNL/CA SWEA DOE/EA-1422—January 2003
Chapter 4, Affected Environment–Section 4.6, Biological Resources
walnut, although positive identification will not be possible
for several years (SNL/CA 2002b, SAIC 2001a).
Wildlife
Wildlife species that have been recorded at SNL/CA
include three amphibians, two reptiles, 58 birds, and
14 mammals. These animals have not been grouped by
habitat, due to the relatively small size of the installation
(0.64 square miles [sq mi] [1.66 square kilometers]) and
mobile nature of most of the observed wildlife species
(SNL/CA 2002b).
Two amphibians and two reptiles without Endangered
Species Act (ESA) protection have been observed at SNL/
CA. These include the western toad (Bufo boreas), Pacific
chorus frog (Pseudacris regilla), western fence lizard (Scleroporus occidentalis), and gopher snake (Pituophis melanoleucus). An additional species not protected under the ESA,
the California tiger salamander (Ambystoma californiense),
has been observed at SNL/CA. Information on the California tiger salamander (Ambystoma californiense), a Federal
candidate species, is provided in Section 4.6.3.4.
Birds are the most abundant group of vertebrates present
at SNL/CA. Some of the bird species observed include the
mallard (Anas platyrhynchos), American coot (Fulica
americana), turkey vulture (Cathartes aura), American
kestrel (Falco sparverius), mourning dove (Zenaida macroura), northern flicker (Colaptes auratus), American
crow (Corvus brachyrhynchos), American robin (Turdus
migratorius), red-winged blackbird (Agelaius phoeniceus),
brown-headed cowbird (Molothrus ater), Brewer’s blackbird (Euphagus cyanocephalus), white-crowned sparrow
(Zonotrichia lecophyrs), song sparrow (Melospiza melodia), house finch (Carpodacus mexicanus), lesser goldfinch (Carduelis psaltria), and European starling (Sturnus
vulgaris). None of the observed species have protection
under the ESA, although several are protected under the
MBTA (see Section 4.6.3.4).
Common mammals that are not protected by the ESA
include the fox squirrel (Sciurus niger), California ground
squirrel (Spermophilus beecheyii), and feral cat (Felis catus). Additional mammals observed include the desert
cottontail rabbit (Sylvilagus audubonii), black-tailed jack
rabbit (Lepus californicus), coyote (Canis latrans), red
fox (Vulpes vulpes), gray fox (Urocyon cinereoargenteus),
striped skunk (Mephitis mephitis), and opossum (Didephis virgiana). A complete list of wildlife species sighted
at SNL/CA since 1994 is provided in the SNL/CA EID
(SNL/CA 2002b).
4.6.3.2
Aquatic Resources
Aquatic habitat of about 2.7 acres is present at the LLNL
recharge basin on SNL/CA land in the west buffer. The
recharge basin consists of two cells (or percolation ponds)
to which water can be discharged into one or both cells
Final SNL/CA SWEA DOE/EA-1422—January 2003
simultaneously. Cattail (Typha sp.) and rush (Juncus sp.)
are among the most common plant species in the recharge
basin. Much of the vegetation is removed during annual
summer maintenance by LLNL when the cells are drained,
with plant growth generally returning the following spring
(SNL/CA 2002b). A survey in 2001 did not detect any
California red-legged frogs (Rana aurora draytonii) or
California tiger salamanders (Ambystoma californiense),
but confirmed that the ponds are suitable habitat for both
species (see Section 4.6.3.4 for additional information on
these two species).
4.6.3.3
Wetlands
Within the riparian woodland habitat are 0.44 acre of
seasonal wetlands associated with Arroyo Seco, almost
entirely in the east buffer zone. These delineated wetlands
are present along 1,370 ft of the arroyo running from the
eastern boundary to 200 ft east of the fence surrounding
the developed part of the installation (SAIC 1998b).
Along this portion of arroyo are a number of obligate
(limited to certain conditions) wetland species including
Goodding’s black willow, willow dock (Rumex salicifolius), southern cattail (Typha domingensis), and water
cress (Rorippa nasturtium-aquaticum). Facultative (capable of living under varying conditions) wetland species
include arroyo willow, red willow, mugwort (Artemesia
douglasiana), rush, rabbit’s foot grass (Polypogon monspeliensis), stinging nettle, and nutsedge (Cyperus eragrostis).
Pepperweed (Lepidium latifolium), an invasive exotic
species, is also present (SNL/CA 2002b; SAIC 1998a,
2001a).
For a discussion on surface water (floodplains and
wetlands), see Section 4.5.2.
4.6.3.4
Protected and Sensitive Species
Table 4-1 lists Federal and California species with
protected or sensitive status that have been reported at
or near SNL/CA.
The California red-legged frog (Rana aurora draytonii)
is the only Federally threatened or endangered species
that has been found in close proximity to SNL/CA. The
California red-legged frog is known to occur at LLNL and
in the farm stock pond on adjacent property on the east
side of SNL/CA (SAIC 2001a). It was not sighted during a
2001 survey of the Arroyo Seco drainage and the recharge
basin on the west side of the site. This survey concluded
that although the recharge basin provides suitable habitat
for part of the year, the irregular drainage during the breeding season of the California red-legged frog minimizes the
use of this habitat on a year-round basis (SAIC 2001a).
The U.S. Fish and Wildlife Service (USFWS) has designated critical habitat for the California red-legged frog as
shown in Figure 4-13 (66 FR 14626, SNL/CA 2002b).
4-23
Chapter 4, Affected Environment–Section 4.6, Biological Resources
Table 4-1. Federal and California Species With Protected or Sensitive Status
Reported At or In the Vicinity of Sandia National Laboratories, California
Common & Scientific Names
Found
a
Onsite
b
b
Federal Status
State Status
Amphibians and Reptiles
California Tiger Salamander
(Ambystoma californiense)
Yes
California Red-legged Frog
(Rana aurora draytonil)
No
Alameda Whipsnake
(Masticophis lateralis euryxanthus)
No
c
Candidate for listing
d, e
Threatened
d
Threatened
Species of special concern
Threatened
Birds
Western Burrowing Owl
(Athene cunicularia)
Yes
f
MBTA
Species of special concern
Loggerhead Shrike
(Lanius ludovicianus)
Yes
MBTA
Species of special concern
White-tailed Kite
(Elanus leucurus)
Yes
f
MBTA
Fully protected
Golden Eagle
(Aquila chrysaetos)
Yes
MBTA
Species of special concern
Northern Harrier
(Circus cyaneus)
Yes
MBTA
Species of special concern
Cooper’s Hawk
(Accipiter cooperii)
Yes
MBTA
Species of special concern
Ferruginous Hawk
(Buteo regalis)
Yes
MBTA
Species of special concern
Red-tailed hawk
(Buteo jamaicensis)
Yes
MBTA
Species of special concern
San Joaquin Kit Fox
(Vulpes macrotis mutica)
No
Endangered
Mountain Lion
(Felis concolor californica)
Yes
None
Mammals
Threatened
Special protected mammal
Source: SNL 2001e
MBTA: Migratory Bird Treaty Act
a
Onsite observation records in the table were made between 1994 and 2001.
b
Some species are protected by more than one regulation. Only the most commonly used are listed.
c
This species has previously been observed at SNL/CA, but was not detected during a 2001 protocol survey.
d
This species has not been seen at SNL/CA but is present in the vicinity.
e
Portions of SNL/CA have been designated as critical habitat for the California red-legged frog.
f
This species has previously been observed at SNL/CA, but has not been sighted since 1997.
This habitat consists of the undeveloped portion of the
east and south buffer zone (SNL/CA 2002a). A protocol
survey in 2001 concluded that the Arroyo drainage is
marginal habitat for year-round use by the California redlegged frog, but may serve as a travel corridor during the
wet season (SAIC 2001a).
In 2001, a CDFG protocol survey was conducted for the
San Joaquin Kit Fox (Vulpes macrotis mutica), a species
with Federal endangered and California threatened status.
The survey confirmed that this species is not present at
SNL/CA (SAIC 2001a).
4-24
In August 2000, a habitat assessment was conducted at
SNL/CA for the Alameda whipsnake (Masticophis lateralis euryxanthus), another species with Federally threatened status (Swaim 2000a). The investigation concluded
that there is no suitable habitat present at SNL/CA for
this species (Swaim 2000a, SNL/CA 2002b). The closest
documented record of an Alameda whipsnake to SNL/CA
appears to be approximately eight miles northwest of the
site on Morgan Territory Road (Swaim 2000a). Although
no critical habitat has been designated for the Alameda
whipsnake at SNL/CA, critical habitat exists just to the
south of the site (SNL/CA 2002b).
Final SNL/CA SWEA DOE/EA-1422—January 2003
Chapter 4, Affected Environment–Section 4.6, Biological Resources
Source: SNL 2001d
Figure 4-13. Critical Habitat for California Red-legged Frog at Sandia National Laboratories, California
Species that are Federally proposed or candidates for
listing as threatened or endangered do not receive legal
protection under the ESA (42 U.S.C. §1531). Candidate
species include those plants and animals for which the
USFWS has on file sufficient information on biological
Final SNL/CA SWEA DOE/EA-1422—January 2003
vulnerability and threat to support issuance of a proposed
rule for listing as threatened or endangered. However, the
USFWS encourages the consideration of impacts to these
species in project planning since their status can be
changed to threatened or endangered in the near future.
4-25
Chapter 4, Affected Environment–Section 4.7, Cultural Resources
The California tiger salamander (Ambystoma californiense)
is a Federal candidate species that does not receive protection under the ESA. However, the DOE implementing
regulations require the consideration of candidate species
during its NEPA process. In December 2001, the California
Fish and Game Commission rejected a petition to list the
California tiger salamander as an endangered species
under the California Endangered Species Act (SNL/CA
2002b). The California tiger salamander has not been seen
at SNL/CA in the last two years, although SNL/CA records
indicate previous sightings at the recharge basin cells, at
water towers, and at Post 15. The recharge basin cells and a
farm pond on adjacent property just east of the site provide
the most suitable habitat for the California tiger salamander as shown in Figure 4-11 (SNL/CA 2002b, c).
A recent radio telemetry monitoring study indicated
that California tiger salamanders do not travel more
than about 560 ft from surface bodies of water and use
mammal burrows such as those of the California ground
squirrel (Spermophilus beechii) when away from breeding ponds (Trenham 2001, SNL/CA 2002b).
The USFWS species of concern category includes former
Category 2 species (such as species possibly appropriate
for listing). Species of concern is a term that describes
many plants and animals whose conservation status may
be of concern to the USFWS, but do not have official
status. Two Federal species of concern have been observed at SNL/CA. Several pair of loggerhead shrikes
(Lanius ludovicianus) were observed at SNL/CA in 2001,
with nest locations shown in Figure 4-12 (SAIC 2001a).
This bird has also been designated by California as a species of special concern (SNL 2001e). No evidence of the
western burrowing owl (Athene cunicularia) was detected
during a biological survey in 2001. This owl is also a California species of special concern. Two pairs of burrowing
owls were observed at SNL/CA in 1995 near the percolation ponds and again in 1996 and 1997 (SAIC 2001a).
For the consultation procedures of the ESA and section
7(c) of the 1978 amendments, the DOE has compiled
information on the California red-legged frog, designated
critical habitat for the California red-legged frog, and the
California tiger salamander to assess possible effects that
the proposed action would have on these species and
critical habitat. A biological assessment has been prepared
and submitted to the USFWS.
A number of species in Table 4-1 receive protection
under the Migratory Bird Treaty Act (16 United States Code
[U.S.C.] § 703). The golden eagle, for example, which has
been sighted as a transient over the site, is also afforded
protection under the Bald and Golden Eagle Protection Act
(16 U.S.C. § 668). The loggerhead shrike is the only bird
species listed in Table 4-1 that is currently nesting at SNL/
CA. The ferruginous hawk (Buteo regalis) and northern
harrier (Circus cyaneus) have been occasionally observed at
4-26
SNL/CA since 1994 and may use the area for foraging
(SAIC 2001a, SNL/CA 2002b).
4.7
CULTURAL RESOURCES
4.7.1
DEFINITION OF RESOURCE
Cultural resources are prehistoric or historic archaeological sites, buildings, structures, districts, objects, or places
considered important to a culture or community. Cultural
resources are those that have been recommended as or
determined to be eligible or potentially eligible for inclusion in the National Register of Historic Places (NRHP),
or are religious or sacred sites important to Native
Americans.
In order to be included in the NRHP, a resource should
retain most, if not all, of seven aspects of integrity: location, design, setting, workmanship, material, feeling, and
association. Based on the standards of the National Park
Service (NPS), the resource must meet a cutoff date of
50 years in age to be eligible, thereby allowing the historical perspective necessary to evaluate significance. Finally,
a resource must meet one or more of the following criteria
of importance (36 Code of Federal Regulations [CFR]
Part 60):
Criterion A—Associated with events that have made
a significant contribution to the broad patterns of our
history.
Criterion B—Associated with the lives of persons
significant in our past.
Criterion C—Embodies the distinctive characteristics of a type, period, or method of construction.
Criterion D—Yielded or may be likely to yield
information important in prehistory or history.
4.7.2
REGION OF INFLUENCE
The ROI includes the entire SNL/CA site. The resources
include those already identified, as well as those that have
not yet been discovered, such as buried archaeological
sites and unknown Native American resources. The site
currently includes both built areas and undisturbed areas,
and the area surrounding the site is a mix. Any changes in
land use, such as construction of new buildings, would
not change the visual characteristics of the area. Thus,
there is no concern for visual impacts to nearby cultural
resources and the ROI does not extend off the site.
4.7.3
4.7.3.1
AFFECTED ENVIRONMENT
Overview of Cultural
Resource Studies and Results
SNL/CA has conducted two comprehensive studies of
cultural resources on the site. In 1990, an assessment of
Final SNL/CA SWEA DOE/EA-1422—January 2003
Chapter 4, Affected Environment–Section 4.8, Air Quality
cultural resources was completed and included a review
of literature and official documents, field inventories, and
consultation with the California Native American Heritage Commission (Busby et al. 1990). The goal of the
assessment was to identify any potentially important
cultural resources located on SNL/CA, including prehistoric, historic, and Native American resources. The field
inventories included all areas outside of the central building compound. Within the compound, the field inventories included all open or otherwise undeveloped areas. An
assessment of the existing buildings was also conducted.
Finally, the Native American Heritage Commission, and a
person knowledgeable of resources important to the tribe
that inhabited the area historically, was consulted to identify any religious resources and sacred sites important to
Native Americans. The only resources identified on the
site were the buildings and structures associated with
SNL/CA—no prehistoric resources, Native American
resources, or historic archaeological sites were identified.
Busby et al. (1990) recommended that none of the buildings or structures identified were eligible or potentially
eligible for the NRHP.
In October 2001, SNL/CA conducted an in-depth
SNL/CA historic building survey (SNL 2001d). The
survey provided an historic context within which the
buildings would be evaluated for significance under the
criteria listed above (SNL 2001f). At the time, there were
70 buildings on the site, of which 45 were included in the
survey. These buildings included permanent and semipermanent facilities; temporary and mobile structures were
not included. The survey found that none of the buildings
were historically significant or eligible for the NRHP.
The results of this historic building survey will be sent
to the State Historic Preservation Officer (SHPO) for
consultation.
4.7.3.2
Unidentified Sites
Despite the apparent lack of important resources on
SNL/CA, there remains the possibility for currently unidentified resources to be located there. These unidentified
resources would most likely consist of buried archaeological sites. Soils underlying SNL/CA, which were deposited
because of alluvial transport, are Holocene in age (deposited in the past 10,000 years) and thus there is the potential for buried sites. No buried archaeological sites have
yet been discovered on SNL/CA. These types of resources
would only be discovered during construction or other
ground-disturbing activities.
4.7.4
CULTURAL RESOURCE PROTECTION AT
SANDIA NATIONAL LABORATORIES, CALIFORNIA
Because activities at SNL/CA are conducted by a federal
agency or by its contractors, there is a body of legislation
applicable to all Federal agencies that protect cultural
resources at SNL/CA (see Chapter 7). The DOE has
Final SNL/CA SWEA DOE/EA-1422—January 2003
implementing regulations and policies that follow this
legislation. In addition, there are personnel assigned
within DOE and SNL with responsibility for overseeing
compliance with these regulations and policies. Proposed
undertakings at the site undergo review by the DOE to
determine if the proposed activity will affect important
cultural resources. These determinations are then reviewed by the California SHPO. If there is a potential for
impacts to occur, the DOE and the SHPO consult on
measures to be implemented to avoid, reduce, or mitigate
any potential adverse impacts.
4.8
4.8.1
AIR QUALITY
DEFINITION OF RESOURCE
Measuring or modeling ambient pollutant concentrations
and comparing the concentrations to the corresponding
standards determine ambient air quality. The EPA has set
the National Ambient Air Quality Standards (NAAQS) as
directed by the Clean Air Act (CAA) of 1970 (42 U.S.C.
§§7401-7671q) for several criteria pollutants to protect
human health and welfare (40 CFR Part 50). The primary
NAAQS are established at levels necessary to protect
human health with an adequate margin of safety while
the secondary NAAQS specify the levels of air pollution
determined appropriate to protect the public welfare from
any known or anticipated adverse effects associated with
air contaminants. These pollutants include particulate
matter less than 10 microns (µm) in diameter (PM10),
sulfur dioxide (SO2), carbon monoxide (CO), nitrogen
dioxide (NO2), lead (Pb) and ozone (O3).
In addition, two additional criteria pollutant standards
promulgated by EPA, the 8-hour ozone standard and the
standard for particulate matter up to 2.5 µm in diameter
(PM2.5), have recently been upheld by the courts with
implementation of the standards expected around 2005.
The EPA will then determine the attainment or nonattainment status of an area with respect to the new
standards and require the states to submit an implementation plan to address any noncompliance.
Enforcement authority of the CAA regulations for nonradiological air emissions has been delegated to the local
air quality management districts. SNL/CA is within the
Bay Area Air Quality Management District (BAAQMD)
that regulates emission sources under the CAA and State
Ambient Air Quality Standards (SAAQS).
4.8.2
REGION OF INFLUENCE
Regional air quality is influenced by the quantity of air
pollutants emitted to the atmosphere within the region,
by the quantity of air pollutants transported into the region, and by local geography, meteorology, and climate.
The ROI for SNL/CA air quality is the Livermore Valley
basin. SNL/CA is located in the southeastern portion of
4-27
Chapter 4, Affected Environment–Section 4.8, Air Quality
the Livermore Valley and is surrounded by hills ranging
from 900 to 1800 ft above the valley floor. The topography surrounding SNL/CA helps to channel air pollutants
through the valley. A predominant southwesterly wind
enters the Dublin gap transporting air pollutants into the
basin and then exits the Livermore Valley through the
Altamont Pass transporting air pollutants from the valley.
A northeast wind component recirculates a portion of air
pollutants back into the valley.
4.8.3
4.8.3.1
AFFECTED ENVIRONMENT
Regional Climatology
The climate in the San Francisco region is Mediterranean,
characterized by cool, wet winters and hot, dry summers.
The microclimates within the region are influenced by the
Pacific Ocean. Generally, the coast often experiences fog
and moderate temperatures, whereas the inland valleys
experience more sunshine and extreme temperatures. In
the summertime, it is not uncommon for the Livermore
Valley to experience temperatures higher than coastal
areas (such as San Francisco). In winter, temperatures in
the valley are usually cooler than at the coast.
During the dry season (June through September), days are
typically sunny and warm. The regional airflow is dominated by a sea breeze as cooler marine air from the coast
passes through the valley to replace the rising warm air in
the San Joaquin valley. The marine air enters the valley
through the Dublin gap to the west and exits the valley to
the east through the Altamont Pass, resulting in strong
west-to-southwest winds. Summer thunderstorms are
infrequent, and tornadoes and hail are rare. The high
temperatures and clear skies are favorable to ozone formation, and the surrounding hills can trap pollutants, leading to high air pollution episodes.
During the wet season (October through May), the climate
is dominated by the passage of winter storms. Most of the
annual rainfall occurs during this period. The sea breeze
is not as prevalent in winter because the differential heating between the coast and San Joaquin valley is minimal.
Although the wind direction is predominately from the
southwest, there is also a strong northeast wind. Winds are
generally lighter during this period: however, very strong
winds often occur during winter storm events. Although
temperatures can drop below freezing, measurable snowfall
is extremely rare. Winter weather conditions combined
with the valley topography can create strong surface based
inversions, which can trap pollutants at the surface, leading
to high air pollution episodes.
The average daily maximum, minimum, and monthly
temperatures for Livermore for the period of record 1930
through 2000 are as follows:
4-28
❍
The average daily maximum temperatures range
from 56.3 degrees Fahrenheit (F) in January to
89.4 degrees F in July.
❍
The average daily minimum temperatures range from
36.1 degrees F in January to 54.0 degrees F in July.
❍
The average daily temperature is 59.2 degrees F.
The Livermore average monthly maximum and minimum
rainfall for the period of record from 1930 through 2000
are as follows:
❍
January is the wettest month with 3.0 inches.
❍
July is the driest with 0.02 inches.
❍
The average annual rainfall is 14.5 inches.
4.8.3.2
Sandia National Laboratories,
California Meteorology
The Livermore meteorology for 1996 to 2000 has been
summarized using data obtained from a meteorological
tower located in LLNL and is presented as follows:
❍
The highest daily maximum of 107.6 degrees F
occurred in August 1998.
❍
The lowest daily minimum of 24.8 degrees F occurred
in January 1999 and December 1998.
❍
The average daily temperature is 59 degrees F.
The monthly average rainfall exceeds 0.98 inches from
November through March. The rest of the year is relatively dry with monthly average rainfall totals less than
0.98 inches.
❍
The maximum annual rainfall during the past five
years was 20.6 inches occurring 1998.
❍
The minimum annual rainfall during the past five
years was 9.64 inches occurring 1999.
❍
The average rainfall during the past five years was
12.9 inches.
Figure 4-14 presents a wind rose for 1996 through 2000
depicting wind speed and wind direction frequency. The
predominant wind direction frequency is from the southwest and the maximum wind speeds occur from this
direction. The windiest months occur in the spring and
summer and are dominated by the westerly sea breezes.
The winds during the fall and winter are typically lighter
and more varied in direction.
❍
The maximum 1-hour average wind speed was
41.0 feet per second (ft/sec) during February 1997.
❍
The monthly average wind speed was 8.2 ft/sec.
Atmospheric stability is a measure of the atmosphere’s
ability to disperse pollutants. Pollutants tend to disperse
more rapidly in unstable atmospheres. The atmospheric
Final SNL/CA SWEA DOE/EA-1422—January 2003
Chapter 4, Affected Environment–Section 4.8, Air Quality
Source: SNL/CA 2002b
Figure 4-14. Wind Rose 1996 through 2000
Typically, the wind is from the southwest.
Final SNL/CA SWEA DOE/EA-1422—January 2003
4-29
Chapter 4, Affected Environment–Section 4.8, Air Quality
Attainment–What is it?
The EPA designates all areas of the U.S. as having air quality either better than the NAAQS (“attainment”), worse
than the NAAQS (“nonattainment”), or “unclassified” (when there is a lack of data for EPA to form a basis of
attainment status).
stability is generally neutral due to the persistent winds.
Moderately stable or very unstable atmospheres occur
throughout the year.
4.8.3.3
Sandia National Laboratories,
California Air Quality
The EPA designates all areas of the United States as
having air quality better than the NAAQS (“attainment”),
worse than the NAAQS (“nonattainment”), or “unclassified.” Pollutants in an area are often designated as unclassified when there is a lack of data for the EPA to form a
basis of attainment status. In addition, the severity or
magnitude of the exceedance for the criteria pollutants is
determined by the amount that ambient air quality measurements are above the NAAQS. Based on the 1990
Clean Air Act Amendments, ozone nonattainment areas
are classified as marginal, moderate, serious, severe, or
extreme. Similarly, carbon monoxide (CO) and respirable
particulate matter (PM10) nonattainment areas are classified as moderate or serious (SNL/CA 2002b).
EPA has denoted the ozone classification of the nonattainment status for the criteria pollutant ozone in the San
Francisco Bay Area as “Other.” On July 10, 1998, EPA
published a final rule (63 FR 37258) redesignating the
San Francisco Bay area to ozone nonattainment with the
federal 1-hour ozone NAAQS. This redesignation was
authorized under the general nonattainment provisions of
Subpart 1 of the Clear Air Act. The Bay Area, therefore,
does not have a Subpart 2 classification. When comparing
to the traditional Subpart 2 classification, the Bay Area’s
value is equivalent to that of
a moderate area. In simple terms, “Other” is the equivalent of a “Moderate” nonattainment classification for
ozone. The San Francisco-Oakland-San Jose area is classified by EPA as a carbon monoxide maintenance area.
California has adopted SAAQS that are more stringent for
criteria pollutants than the NAAQS. In addition to the
federal attainment designation, each air district has a state
attainment designation. The California Air Resources
Board (CARB) has designated the San Francisco Bay Area
as nonattainment for ozone and PM10 and as in attainment of all other criteria pollutants.
4-30
Pollutant monitoring results near SNL/CA indicate that
the air quality in the Livermore area has generally been
good. Table 4-2 presents a comparison of the NAAQS
and SAAQS with criteria pollutant monitoring results
for 1996 through 2000 from the closest monitoring stations to SNL/CA. The monitoring data indicate that the
24-hour PM10 state standard was exceeded by the highest
maximum concentration during 1997 through 2000 and
by the second highest maximum concentration during
1998 through 2000. The 1-hour ozone state standard
was exceed by the highest and second highest maximum
concentration for the period 1996 through 2000 while
the NAAQS was exceeded by the highest and second
highest maximum concentration during 1996, 1998,
1999, and 2000. Concentrations of the remaining
criteria pollutants are below the NAAQS and SAAQS.
Figure 4-15 shows the location of the monitoring stations
from which data presented in Table 4-2 were complied.
During the past five years, the number of permitted air
emission sources at SNL/CA has decreased. However, air
emissions from permitted sources have increased. The
total pollutants emitted are not considered significant and
have a minimal impact on the region’s air quality.
The number of permitted sources onsite has decreased
from 29 to 20 (in 2002 the number decreased to 17)
during the past five years. Table 4-3 presents each of
17 permitted emission source at SNL/CA and the types
of significant emissions reported with the July 1, 2000
to June 2001 Permit to Operate.
Table 4-4 lists the criteria pollutant emissions from permitted sources during the past five years, the estimated
emissions for the whole Bay Area, and the percent of
SNL/CA emissions relative to district-wide emissions.
Criteria pollutant emissions from SNL/CA are much
less than one percent of those of the entire Bay Area.
Table 4-5 presents the toxic pollutant emissions from
permitted sources during the past five years, the estimated
toxic emissions for the whole Bay Area, and the percent
of SNL/CA toxic emissions relative to district wide emissions. Toxic pollutant emissions from SNL/CA are minor
compared to those of the Bay Area.
Final SNL/CA SWEA DOE/EA-1422—January 2003
Chapter 4, Affected Environment–Section 4.8, Air Quality
Table 4-2. Comparison of 1996 to 2000 Criteria Pollutant Monitoring Results
with Applicable National and California Ambient Air Quality Standards
Pollutant
Units
Averaging
Period
State
Standards
e
Measurements
NAAQS
1996
1997
1998
1999
2000
4.9
4.6
4.3
5.2
4.5
4.7
4.4
4.1
4.5
4.4
2.5
2.5
2.4
2.9
2.7
2.4
2.3
2.3
2.5
2.5
0.086
0.082
0.071
0.094
0.073
2
Max
0.079
0.074
0.069
0.088
0.07
--
0.019
0.018
0.019
0.02
0.017
47
55
56
119
70
2
Max
44
48
52
94
55
st
1-hour
(a)
CO
20
35
ppm
1
Max
nd
2
Max
st
8-hour
9.0
9
1
Max
nd
2
Max
st
1-hour
(b)
NO2
0.25
--
ppm
Annual
Arithmetic
Mean
--
0.053
1
Max
nd
st
24-hour
(a)
3
PM10
µg/m
50
150
1
Max
nd
Annual
Arithmetic
Mean
--
50
--
19.8
20.5
17.8
22.7
21.7
Annual
Geometric
Mean
30
--
--
--
--
--
--
--
0.138
0.114
0.146
0.146
0.137
0.137
0.111
0.139
0.144
0.126
st
(b)
Ozone
ppm
1-hour
0.09
Final SNL/CA SWEA DOE/EA-1422—January 2003
0.12
1
Max
nd
2
Max
4-31
Chapter 4, Affected Environment–Section 4.8, Air Quality
Table 4-2. Comparison of 1996 to 2000 Criteria Pollutant Monitoring Results
with Applicable National and California Ambient Air Quality Standards
Pollutant
Units
Averaging
Period
State
Standards
e
Measurements
NAAQS
1996
1997
1998
1999
2000
0.019
0.038
0.049
0.048
0.02
0.019
0.02
0.037
0.037
0.016
0.013
0.018
0.029
0.03
0.014
0.013
0.016
0.026
0.025
0.011
0.005
0.007
0.009
0.012
0.004
2
Max
0.005
0.006
0.008
0.011
0.004
st
1-hour
0.25
--
1
Max
nd
2
Max
st
3-hour
(c)
SO2
--
0.5
ppm
1
Max
nd
2
Max
st
24-hour
Lead
(d)
0.04
0.14
nd
Annual
Arithmetic
Mean
--
0.03
--
0.001
0.001
0.001
0.001
0.001
30 Days
1.5
--
--
--
--
--
--
--
1 Qtr
0.004
0.003
0.01
0.01
NA
2 Qtr
0.003
0.003
0.003
0.003
NA
3 Qtr
0.01
0.01
0.02
0.0
NA
4 Qtr
0.01
0.004
0.01
0.0
NA
3
µg/m
1
Max
Quarter
--
1.5
Source: SNL/CA 2002b
a
2614 Old 1st St., Livermore station (1996–1999) and 793 Rincon Ave., Livermore station (2000)
b
2614 Old 1st St., Livermore station
c
Concord station
d
Fremont station
e
Measurements are from the four offsite locations listed above.
CO: Carbon Monoxide
µg/m3: micrograms per cubic meter
NA: not available/not applicable
NAAQS: National Ambient Air Quality Standards
NO2: Nitrous Dioxide
PM: Particulate Matter
ppm: parts per million
Qtr: Quarter
SO2: Sulfur Dioxide
4-32
Final SNL/CA SWEA DOE/EA-1422—January 2003
Chapter 4, Affected Environment–Section 4.8, Air Quality
Source: SNL/CA 2002b
Figure 4-15. Locations of Bay Area Air Quality Management District
Ambient Air Monitoring Stations near Sandia National Laboratories, California
Final SNL/CA SWEA DOE/EA-1422—January 2003
4-33
Chapter 4, Affected Environment–Section 4.8, Air Quality
Table 4-3. Sandia National Laboratories, California
Permitted Sources and Types of Pollutants Reported
Source Number
Source Description
Source Location
Types of Pollutants
(a, b)
Reported
6
Boiler (5 MM BTU/hr)
Bldg 907
NOx, Toxics
7
Boiler (5 MM BTU/hr)
Bldg 907
NOx, Toxics
22
Boiler (1200 K BTU/hr)
Bldg 916
NOx, Toxics
25
Boiler (3200 K BTU/hr)
Bldg 912 SW
NOx, Toxics
26
Boiler (3000 K BTU/hr)
Bldg 968
NOx, Toxics
27
Boiler (3000 K BTU/hr)
Bldg 968
NOx, Toxics
28
Boiler (3500 K BTU/hr)
Bldg 910
NOx, Toxics
29
Boiler (3500 K BTU/hr)
Bldg 910
NOx, Toxics
33
Degreaser
Bldg 910
Toxics
34
Degreaser
Bldg 34
Toxics
55
Misc. Chemical
(Decontamination Sink)
Bldg 961
NR
56
Misc. Chemical (Waste
Compactor)
Bldg 961
Toxics
60
Misc. Chemical (Drum
Crusher)
Bldg 961
Toxics
77
Electroplating
Bldg 943
NR
81
Boiler (7350 K BTU/hr)
Bldg 943
NOx, CO, Toxics
82
Boiler (7350 K BTU/hr)
Bldg 943
NOx, CO, Toxics
95
Solvent Use (Wipe Cleaning)
Site-wide
VOC, Toxics
Source: SNL/CA, 2002b
Note: Fugitive toxic emissions (site-wide) are also covered as a permitted source.
a
Exempt sources not included
b
Report period is July to June
BTU: British Thermal Unit
CO: carbon monoxide
K: kilo
MM: million
NOx: Oxides of Nitrogen
NR: None reported for 2000-2001
VOC: volatile organic compound
Table 4-4. Criteria Pollutant Emission Rates (kilograms per year)
(b)
SNL/CA
Bay Area
96/97
97/98
98/99
99/00
00/01
2000
Percent
Contribution
from
SNL/CA
Particulates
NA
NA
NA
NA
NA
57,900,000
NA
Volatile Organic
Compounds
497
NA
497
662
1656
179,000,000
<1
Sulfur Dioxide
NA
NA
NA
NA
NA
29,100,000
NA
Nitrogen Dioxide
3,146
3,973
3,311
3,642
3,311
214,000,000
<1
Carbon Monoxide
165
165
NA
NA
331
995,000,000
<1
(a, b)
Emission Year
Pollutant
Sources: SNL/CA 2002b
a
Bay Area Air Quality Management District (BAAQMD) inventory is reported annually for period July to June.
b
All Bay Area wide emissions except particulates are based on an average summer day multiplied by 365 days. Bay Area particulate emissions are
based on an average winter day multiplied by 365 days.
<: less than
NA: Not Available
SNL/CA: Sandia National Laboratories, California
4-34
Final SNL/CA SWEA DOE/EA-1422—January 2003
Chapter 4, Affected Environment–Section 4.9, Infrastructure
Table 4-5. Toxic Air Pollutant Emission Rates (kilograms per year)
SNL/CA
Bay Area
(a)
Pollutant
Emission Year
Percent
Contribution
from SNL/CA
96/97
97/98
98/99
99/00
00/01
1999
1,1,1-trichloroethane
91.226
39.01
144.24
235.1
96.15
58,968
<1
1,4-dioxane
4.189
0.00
2.81
5.5
0.54
771
<1
Ammonia
238.412
205.93
99.79
33.4
1.31
1,406,160
<1
Benzene
0.31
0.32
0.32
0.32
0.30
28,577
<1
Carbon tetrachloride
0.006
0.36
0.00
0.00
0.00
1,406
NA
Formaldehyde
3.133
3.4
3.22
3.26
3.12
81,648
<1
Methyl alcohol
1.821
1.86
0.00
167.22
681.77
276,696
<1
Methylene chloride
11.027
16.78
49.9
50.2
75.55
49,896
<1
Perchloroethylene
13.013
24.49
74.84
42.7
73.55
371,952
<1
0.07
0.09
0.09
3.3
43.04
335,664
<1
Trichloroethylene
66.391
NA
NA
0.00
2.93
21,773
<1
Xylene
0.015
0.01
0.01
0.002
14.77
276,696
<1
Toluene
Sources: SNL/CA 2002b
a
Bay Area Air Quality Management District (BAAQMD) inventory is reported annually for period July to June.
<: less than
NA: Not Available
SNL/CA: Sandia National Laboratories, California
4.9
4.9.1
INFRASTRUCTURE
Definition of Resource
Infrastructure consists of buildings, services, maintenance,
utilities, material storage, and transportation systems and
corridors that support the operations of a facility. Specifically, SNL/CA’s infrastructure consists of water, sanitary
sewer systems, storm drains, electrical transmission and
distribution, communication systems, roads, and parking
lots that support operations at the site. For a discussion of
land use, see Section 4.3.
4.9.2
REGION OF INFLUENCE
into twelve divisions including the California laboratory
(SNL/CA). Extensive descriptions of key programs and
services are provided in the SNL Institutional Plan Fiscal
Year 2002-2007 (SNL 2001a). SNL/CA has a maintenance program supported by appropriate NEPA review.
Routine maintenance and upgrades include the following:
❍
cleaning, painting, repairing, renovating, and
servicing buildings, equipment, vehicles, and
utility infrastructure;
❍
maintaining and extending onsite roads, parking
areas, and access control structures;
❍
replacing, upgrading, and maintaining equipment,
tools, and components, such as computers, valves,
pumps, filters, monitors, and equipment controls
to preserve, improve, and extend the life of the
infrastructure; and
❍
maintaining, replacing, and upgrading environment,
safety, and health equipment, controls, and monitoring capabilities.
The ROI for infrastructure is within the site boundary.
Table 4-6 presents information on the type of utilities
and amounts used by SNL/CA, and identifies utility
capacities.
4.9.3
4.9.3.1
AFFECTED ENVIRONMENT
Sandia National Laboratories,
California Buildings
Buildings within SNL/CA are listed by type and square
footage in Table 4-7. Physical attributes such as construction type, gsf, and usage distinguish primary buildings.
4.9.3.2
Sandia National Laboratories,
California Services and Maintenance
SNL/CA’s management and operations (M&O) contractor is Lockheed Martin Corporation. SNL is organized
Final SNL/CA SWEA DOE/EA-1422—January 2003
4.9.3.1
Roadways and Transportation Access
The general road network in SNL/CA area is shown in
Figure 4-16. Interstate 580 is the east-west access to the
regional Interstate system and is approximately 2 miles
north of the SNL/CA boundary. Access to SNL/CA consists of an urban road network maintained by the City of
Livermore, and SNL/CA maintained gates and roadways.
Traffic enters SNL/CA through two principal gates off
East Avenue. Commercial traffic enters through the East
4-35
Chapter 4, Affected Environment–Section 4.9, Infrastructure
Table 4-6. Utility Capacities and Quantities
Used by Sandia National Laboratories, California
Usage
Utility
SNL/CA (2000)
Percent of Capacity
Water
54 M gallons
6
Wastewater
15 M gallons
19
Electricity
22,434 MWh
9
Natural Gas
59 M ft
a
b
3
c
14
d
Sources: SNL/CA 2002b, Royer 2002
a
Estimate Based on 14” water main with 8,000 gallons per minute, 8 hours per day, 5 days per week, 48 weeks per year (922 M gallons). A 16”
water main is also available.
b
Estimate based on 10” wastewater with 700 gallons per minute, 8 hours per day, 5 days per week, 48 weeks per year (81 M gallons).
c
Estimate based on 27.2 Megawatt feeder, 8760 hours per year, (239,000 Megawatt hours). Another 27.2 Megawatt feeder is also available.
d
Estimate based on 49,140 cubic feet per hour, 8760 hours per year (430 M cubic feet).
M: million
MWh: megawatt
M ft3: million cubic feet
SNL/CA: Sandia National Laboratories, California
Table 4-7. Building Types at Sandia National Laboratories, California
SNL/CA
Building Types
Number of
Buildings
GSF
Percent
of GSF
Primary
Buildings
33
690,000
91
Buildings > 3,000 gsf permanent, semi-permanent, or
wood/steel construction; not leased space
Nonprimary
21
30,000
4
Nonprimary buildings < 3,000 gsf
Temporary
18
40,000
5
Mobile Offices
Total
72
760,000
100
Parameters
Sources: SNL 2001b
>: greater than
<: less than
gsf: gross square feet
SNL/CA: Sandia National Laboratories, California
gate because it provides direct access to the SNL/CA
shipping and receiving facilities. SNL/CA maintains
approximately 6.2 mi of paved and unpaved roads,
approximately 4 acres of pedestrian malls, approximately
5.5 acres of paved service areas, and approximately
12.7 acres of paved parking areas (TtNUS 2002a). The
roads near SNL/CA experience heavy traffic in the early
morning and late afternoon. The principal contributors
are SNL/CA staff and LLNL personnel commuting to
and from the laboratories.
Survey estimates of employee-related traffic entering
SNL/CA are between 700 to 1,000 SNL/CA commuters
per day (SNL/CA 2002b). SNL/CA commuters represent
approximately 11 percent of commuter traffic near SNL/
CA based on an estimated 9,000 LLNL commuters. For a
discussion of transportation-related issues such as traffic,
see Section 4.10.
Rail facilities are not available on SNL/CA. Primary air
service is provided for the entire region by both the Oakland International Airport and the San Francisco Airport,
located approximately 33 mi and 50 mi west, respectively.
4-36
4.9.3.2
Water
The water supply system consists of 6.4 mi of piping
that, in 2000, provided 54 M gal of water for fire protection, industrial support of SNL/CA’s research programs,
and sanitary use (Table 4-6). The highest volume user is
the Combustion Research Facility (CRF), which generates approximately 160,000 gal of wastewater per year
(SNL/CA 2002a). SNL/CA purchases potable water from
the adjacent LLNL. LLNL is supplied by the San Francisco Water District through the Hetch Hetchy Aqueduct.
When needed, water is also supplied by the Alameda
County Flood Control and Water Conservation District.
LLNL maintains the drinking water distribution system
at SNL/CA. Neither the existing water service from LLNL
to SNL/CA, nor water to most major SNL/CA facilities,
are metered. For a discussion of water resources, see
Section 4.5.
4.9.3.3
Sanitary Sewer
In 2000, the sewer system consisted of a 4.4-mi underground pipe network that discharged approximately
15 M gal per year of industrial and domestic wastewater
Final SNL/CA SWEA DOE/EA-1422—January 2003
Chapter 4, Affected Environment–Section 4.9, Infrastructure
Source: Original
Figure 4-16. Road Network in the Sandia National Laboratories, California Area
(Table 4-6). The site operates a wastewater management
control system whereby potentially contaminated laboratory wastewater is routed to retention tanks for analysis
and proper disposal. The Liquid Effluent Control System
(LECS) provides a fail-safe mechanism for preventing any
release of regulated materials from reaching offsite. Six
LECS units currently serve SNL/CA (SNL 2001b).
4.9.3.4
Storm Drain
As part of its storm drain system, SNL/CA maintains
approximately 4.3 mi of pipe and 1.6 mi of channel. Existing drainage channels require continuous maintenance to
correct erosion problems and remove weeds, sediment,
and debris that inhibit proper flow (SNL 2001b).
Final SNL/CA SWEA DOE/EA-1422—January 2003
4.9.3.5
Electrical Transmission and Distribution
SNL/CA maintains approximately 11.9 mi of electrical
transmission/distribution lines (SNL 2001b). In 2000,
33 primary facilities/areas used 22,434 megawatt hours
(MWh) (Table 4-7) (SNL/CA 2002b).
4.9.3.6
Natural Gas
SNL/CA maintains 1.8 mi of gas line. Natural gas is
the primary heating fuel used at the site. Laboratories
also use natural gas in many of the buildings for experiments. In 2000, 33 primary facilities/areas used approximately 59 million cubic feet (M ft3) (SNL 2001b;
SNL/CA 2002b).
4-37
Chapter 4, Affected Environment–Section 4.10, Transportation
4.9.3.7
Communications
SNL/CA maintains 19.7 mi of communication lines.
Surveys indicate that the system may be nearing capacity,
however, system upgrades are meeting the current
demand for data links (SNL 1997b, 2001b).
4.10
TRANSPORTATION
4.10.1 DEFINITION OF RESOURCE
This section describes current regional and local transportation activities, including descriptions of any highway,
rail, air, or marine transportation infrastructure that the
DOE uses to support hazardous material and waste movements at SNL/CA. Transportation activities at SNL/CA
involve the receipt, shipment, and transfer of hazardous
and nonhazardous materials and waste. Receipt refers to
material received from an offsite location; shipment refers
to material sent to an offsite location; and transfer refers
to material moved from one onsite location to another.
Actual waste quantities are discussed in Section 4.11.
4.10.2 REGION OF INFLUENCE
The transportation ROI consists of three areas onsite,
the major transportation corridors in Livermore, and
the routes to DOE facilities and waste disposal sites.
4.10.3 AFFECTED ENVIRONMENT
SNL/CA’s transportation system consists of paved and
unpaved roads, pedestrian malls, paved service areas, and
paved parking areas. The site has 6.2 mi of paved and
unpaved roads, 4 acres of pedestrian malls, 5.5 acres of
paved service areas, and 12.7 acres of paved parking areas.
Onsite (excluding parking areas) vehicular traffic is
comprised of General Services Administration vehicles,
such as cars, light trucks, gasoline and electric carts, medium duty trucks, forklifts, cranes, and other equipment.
Delivery trucks are generally routed only to shipping
and receiving facilities. Vehicles owned by organizations
performing work (such as construction) for SNL/CA
are permitted around the site when necessary for the
performance of the work.
A taxi service is provided for workers needing transport
on site. LLNL provides a taxi service that will pick up
Sandia workers and transport them to LLNL. Sandia also
provides bicycles for personnel to use for onsite transportation.
All entrances to SNL/CA are situated along East Avenue.
The primary routes to East Avenue are Vasco Road and
Greenville Road. All regional traffic to and from SNL/CA
is via I-580, exiting onto Vasco Road or Greenville Road.
An emergency access road connects the site to Telsa Road
to the south.
4-38
The regional transportation network includes the San
Francisco Bay Area. Traffic congestion is a growing concern in the Bay Area. The major transportation arteries
near SNL/CA are I-580 and I-680. Major road projects are
underway including an upgrade to the Interstate (I)-580/
I-680 interchange in Pleasanton and the addition of highoccupancy-vehicle lanes to I-680 south of Pleasanton
(SNL/CA 2002b).
The closest airport to SNL/CA is the Livermore Municipal Airport. This airport is not used for commercial
passenger traffic, but DOE/SSO personnel fly into
this airport using a small government jet. DOE/SSO
typically use the Livermore airport for less than five
trips per year (SNL/CA 2002b).
The SNL/CA site is served by three international airports
for commercial passenger and airfreight services. These
airports are San Francisco (approximately 50 road mi
west), Oakland (approximately 33 road mi west), and San
Jose (approximately 32 road mi south) (SNL/CA 2002b).
SNL/CA does not receive any direct traffic by rail
although some SNL/CA employees do commute by
train that stops on Vasco Road approximately 1.5 mi
north of the site. SNL/CA receives no direct traffic by
ship (SNL/CA 2002b).
4.10.3.1 Responsible Organizations for
the Transport of Hazardous
and Nonhazardous Material
The organizations responsible for the receipt, shipment,
and onsite transfer of hazardous material and nonhazardous material are identified in Table 4-8. Table 4-9 shows
all hazardous and radioactive waste shipments from SNL/
CA site during calendar year 2000. Other
shipments would go to LLNL and Sandia sites including
SNL/NM. Approximately 1 to 3 shipments per week
come in from offsite suppliers.
Explosives Receipt, Transfer, and Shipment
All incoming explosive material placarded or labeled
DOT Division 1.1, 1.2, 1.3, 1.5, or 1.6 is diverted by
security directly to the Explosives Storage Area. Division
1.4 materials may be received at either Shipping and
Receiving Building or the Explosives Storage Area.
Incoming explosives are entered into the Explosives
Inventory and Information System (SNL/CA 2002b).
Explosives are delivered only to persons authorized on the
destination building’s Safe Operating Procedure. Explosives are delivered only to approved facilities. The explosives handler completes a Storage Action Request for
Explosives form. Before movement is allowed, a signature
must be obtained from the Explosives Safety Engineer.
An Explosives Handler, using an approved container and
Vehicle transports explosives (SNL/CA 2002b).
Final SNL/CA SWEA DOE/EA-1422—January 2003
Chapter 4, Affected Environment–Section 4.10, Transportation
Table 4-8. Sandia National Laboratories, California Organizations
Responsible for the Transportation of Hazardous and Nonhazardous Material
Organization
Responsibility
Health and Safety Department
Handling, transportation, and use of explosive material and components. Receipt of and
preparation for shipment of all explosives.
Environmental Operations
Department
Transportation of hazardous and radioactive wastes from generator areas to waste
management facilities. Preparation of radioactive, mixed, and hazardous wastes for
shipment to approved disposal or treatment facilities.
Logistics and Procurement
Department
Ensuring that low-level radioactive waste shipments meet U.S. Department of
Transportation (DOT) requirements. Ensuring that all onsite and offsite movements of
hazardous material meet DOT requirements.
Material Management Support Team
Movement and delivery of all hazardous material onsite, with the exception of explosives.
Source: SNL/CA 2002b
Explosive Materials
Explosives are any substance or article, including a
device, which is designed to function by explosion or
which, by chemical reaction within itself is able to
function in a similar manner even if not designed to
function by explosion (unless the article is otherwise
classed under a provision of 49 CFR).
Division 1.1 Explosives: Consists of explosives that
have a mass explosion hazard. A mass explosion is
one that affects almost the entire load instantaneously.
Division 1.2 Explosives: Consists of explosives that
have a projection hazard but not a mass explosion
hazard.
Table 4-9. Waste Shipments during Calendar Year 2000
Disposal Site
Outbound
Waste
Shipments
Ensco, Inc., El Dorado, Arizona
4
Chemical Waste Management,
Kettleman City, California
11
BFI Stericycle, Inc., San Leandro, California
49
Ensco West, Inc., Wilmington, California
6
Nevada Test Site, Mercury, Nevada
1
U.S. Filter, Inc., Vernon, California
2
Permafix, Inc., Gainesville, Florida
1
SET Environmental, Houston, Texas
1
Treatment One, Chicago, Illinois
1
Source: SNL/CA 2002b
Division 1.3 Explosives: Consists of explosives that
have a fire hazard and either a minor blast hazard
or a minor projection hazard or both, but not a mass
explosion hazard.
Division 1.4 Explosives: Consists of explosives
that present a minor explosion hazard. The explosive
effects are largely confined to the package and no
projection of fragments of appreciable size or range
is to be expected. An external fire must not cause
virtually instantaneous explosion of almost the entire
contents of the package.
Division 1.5 Blasting Agents: Consists of very insensitive explosives. This division is comprised of substances
that have a mass explosion hazard but are so insensitive
that there is very little probability of initiation or of
transition from burning to detonation under normal
conditions of transport.
Division 1.6 Explosives: Consists of extremely insensitive articles that do not have a mass explosive hazard.
This division is comprised of articles which contain
only extremely insensitive detonating substances and
which demonstrate a negligible probability of accidental initiation or propagation.
Final SNL/CA SWEA DOE/EA-1422—January 2003
The Logistics and Procurement Department handles
documentation of shipments of explosives offsite. The
Explosives Handler in Building 981 prepares the explosives for shipment. The Logistics and Procurement
Department also performs inspections of vehicles and
provides route maps to the drivers. Two shipments of
explosives were sent from SNL/CA during calendar
year 2000 (SNL/CA 2002b).
Receipt, Transfer, and Shipping of Nuclear and
Radioactive Material and Hazardous Chemicals
All nuclear and radioactive materials and hazardous chemicals are received at Shipping and Receiving Building. The
package integrity is verified, and the material is prepared
for onsite transport, if required (SNL/CA 2002b).
All onsite transfers of nuclear and radioactive materials
and hazardous chemicals are performed by the Material
Management Support Team. All personnel performing
onsite transfers are trained in accordance with DOT
requirements (SNL/CA 2002b).
Documentation for shipments of nuclear and radioactive
materials and hazardous chemicals is prepared by the
4-39
Chapter 4, Affected Environment–Section 4.11, Waste Generation
Logistics and Procurement Department. The Logistics
and Procurement Department also inspects vehicles and
provides route maps to the drivers. Hazardous waste shipments are the responsibility of the Hazardous Waste Program within the Environmental Operations Department.
During calendar year 2000, 109 shipments (including
76 waste shipments) containing hazardous material left
SNL/CA (SNL/CA 2002b).
Transportation of Nonhazardous Materials and Waste
Other transportation on site includes the movement of
nonhazardous materials (office furniture, computers,
mail, etc.). These materials are received and transported
to their final destination by the Logistics and Procurement Department (SNL/CA 2002b).
Nonhazardous solid waste is trucked to a local landfill.
Waste pickup is performed once per week (SNL/CA
2002b).
4.11
WASTE GENERATION
4.11.1 DEFINITION OF RESOURCE
Waste management activities consist of managing,
storing, and preparing for offsite disposal of all wastes
in accordance with applicable Federal and state regulations, permits obtained under these regulations, and
DOE orders. The waste categories generated onsite
under normal operations include radioactive waste
(including LLW and LLMW); hazardous waste, which
includes RCRA hazardous (chemical and explosives)
waste, California Toxic waste, TSCA waste (primarily
asbestos and polychlorinated biphenyls [PCBs]) and
biohazardous (medical) waste; and nonhazardous solid
waste and process wastewater.
4.11.2 REGION OF INFLUENCE
The ROI for waste generation involves SNL/CA and its
facilities. The ROI does not include offsite waste disposal
facilities because they involve the private sector or other
Federal facilities. The transportation of waste to disposal
sites is discussed in Section 4.10.
4.11.3 AFFECTED ENVIRONMENT
The generation of the many different waste streams at
SNL/CA creates a continuous need for proper packaging,
labeling, manifesting, transporting, storing, and disposing
solutions.
4.11.3.1 Normal Operations
The affected environment considered under this analysis is limited to those facilities that generate waste under
normal operations at SNL/CA. Normal operations encompass all current operations that are required to maintain
research and development at SNL/CA facilities.
4-40
Waste Categories
Low-Level Waste (LLW)—Waste that contains radioactivity and is not classified as high-level waste, transuranic waste, or spent nuclear fuel or by-product tailings
containing uranium or thorium from processed ore (as
defined in Section 11[e][2] of the Atomic Energy Act
[42 U.S.C. §2011]). Test specimens of fissionable material, irradiated for research and development only and
not for the production of power or plutonium, may be
classified as LLW, if the concentration of transuranic is
less than 100 nanocuries per gram (nCi/g).
Low-Level Mixed Waste (LLMW)—Waste that contains both hazardous waste regulated under the RCRA
and low-level waste.
RCRA Hazardous Waste—Any solid waste (definition
includes semisolid, liquid, or gaseous material) listed
in Subpart D of 40 CFR Part 261, or having the characteristics of ignitability, corrosivity, toxicity, or reactivity, defined by the RCRA.
SNL/CA Hazardous Waste—Waste includes RCRA
hazardous waste, California Toxic waste, TSCA waste,
and Biohazardous wastes.
Municipal Solid Waste—Waste includes office and
laboratory trash.
4.11.3.2 New Operations
Several new operations are currently in the planning
stages at SNL/CA. However, they are considered outside
of the scope of the current affected environment description for this analysis because they have not yet reached
operational status. New operations are defined as programmatically planned projects with defined implementation schedules that will take place in the future. SNL/CA
has identified operations at three facilities that fall under
this category: LIGA Technology Facility (LTF), Distributed Information Systems Laboratory (DISL), and Glass
Furnace and Melting Laboratory.
4.11.3.3 Special Projects
Special projects are limited-duration projects, such as
construction, that are considered separately from facility
operations. These projects can make a large contribution
to the overall waste generation activities at SNL/CA.
However, special projects and new programs routinely
undergo program-specific assessments to consider any
impacts that may result from their inception and are,
therefore, not considered in-depth in the SWEA.
Facility maintenance and infrastructure support operations would continue (as outlined in Section 2.3.3) with
Final SNL/CA SWEA DOE/EA-1422—January 2003
Chapter 4, Affected Environment–Section 4.11, Waste Generation
refurbishment, renovation, and removal of outdated
facilities. SNL Sites Comprehensive Plan identifies the
specific structures under consideration over the next
ten years (SNL 2001c). This program will potentially
generate large volumes of TSCA waste, primarily asbestos,
and building debris that will increase SNL/CA’s disposal
needs. Four buildings, accounting for 15,000 gsf (an estimated 100 tons of construction debris), are scheduled for
removal within fiscal year (FY) 2002. Future space reduction at SNL/CA will focus on temporary buildings that
are beyond their useful lives. These buildings will become
vacant after new buildings are built. Eighteen buildings,
accounting for 40,000 gsf, are categorized as temporary
(SNL 2001c).
Building debris estimates associated with decontamination and decommissioning (D&D) projects are included
in the assessments of the waste generated from existing
operations (potentially 266 tons of debris). Separate
NEPA review may be required in the future depending
on the scale and extent of the work involved.
4.11.3.4 Radioactive Waste
Radioactive waste generated at SNL/CA includes LLW
and LLMW. SNL/CA does not manage or generate transuranic waste (TRU) or mixed transuranic waste. SNL/CA
does not manage or generate high-level waste. LLW and
LLMW are produced primarily in laboratory experiments
and component tests.
As part of the effort to minimize the total quantity of
radioactive waste that is generated at SNL/CA, facilities
that generate this type of waste are designated as Radioactive Materials Management Areas (RMMA). An RMMA
is an area where the reasonable potential exists for contamination due to the presence of unconfined or unencapsulated radioactive material or an area that is exposed to sources
of radioactive particles (such as neutrons and protons)
capable of causing activation. Managers of facilities must
document the location of all RMMAs. Procedures to
minimize the generation of radioactive wastes are then
developed.
SNL/CA does not maintain the capability to treat or
dispose mixed wastes onsite. SNL/CA treats and disposes
LLMW offsite under the Federal Facility Compliance
Order issued jointly to Sandia Corporation and the DOE
(SNL/CA 2002b).
4.11.3.5 Historic and Current
Radioactive Waste Generation
Radioactive waste has historically been generated from
R&D activities that used radioactive materials. Table 4-10
summarizes historic and current radioactive waste quantities generated onsite from 1996 through 2000.
Final SNL/CA SWEA DOE/EA-1422—January 2003
Table 4-10. Radioactive Waste Generated
from 1996 through 2000 (in kilograms)
Radioactive Waste
Generated
LLW
LLMW
1996
2,268
0
1997
2,007
0
1998
1,429
7
1999
7,981
80
12,755
2,167
5,288
451
2000
a
5 yr Average
Source: SNL/CA 2002b
a
Large increase in waste in year 2000 can be attributed to the demolition
of Building 913
LLW: low-level waste
LLMW: low-level mixed waste
4.11.3.6 Hazardous Waste
Hazardous waste refers specifically to nonradioactive
waste, including RCRA chemical and explosives waste,
California toxic hazardous waste, biohazardous (medical)
waste, and TSCA waste (primarily asbestos and PCBs).
4.11.3.7 Historic and Current
Hazardous Waste Generation
The hazardous waste generated at SNL/CA is predominantly chemical laboratory trash generated from
experiments, testing, other R&D activities, and infrastructure fabrication and maintenance. Table 4-11
contains a summary of hazardous waste generated for
all operations from 1996 through 2000. Biohazardous
(medical) waste and D&D wastes were included in the
totals for all hazardous waste categories.
4.11.3.8 Municipal Solid Waste
Solid waste consists predominantly of office and
laboratory nonhazardous trash. Nonhazardous building
debris generated from D&D activities may also be considered solid waste. All solid waste is currently disposed
of at the Vasco Road Landfill in Livermore, California
(SNL/CA 2002b). In calendar year (CY) 2000, SNL/CA
generated 247.54 metric tons.
4.11.3.9 Pollution Prevention
and Waste Minimization
DOE 5400.1 and Executive Order (EO) 13148 implement
a pollution prevention program to comply with DOE requirements (65 FR 24595). The SNL/CA Pollution Prevention Program applies to all pollutants generated by routine
and nonroutine operations. The scope of the Pollution
Prevention Program includes activities that encourage
pollution or waste source reduction and recycling, resource
and energy conservation, and affirmative procurement of
EPA-designated recycled products.
4-41
Chapter 4, Affected Environment–Section 4.11, Waste Generation
Table 4-11. Hazardous Waste Generated from 1996 through 2000 (in kilograms)
Hazardous Waste
Generated
RCRA
California Toxic
1996
15,003
1997
1998
1999
2000
b
5-year Average
TSCA
Biohazardous
Total All
Hazardous Waste
10,792
15,451
219
41,465
23,294
26,088
55,730
1,773
106,885
23,468
39,841
13,782
296
77,387
22,962
20,084
27,473
248
70,767
28,354
32,765
79,477
220
140,816
22,616
25,914
38,383
551
87,464
a
Source: SNL/CA 2002b
a
A non-RCRA waste identified in Title 22 CCR
b
Except for biohazardous, large increases in waste in year 2000 can be attributed to the demolition of Building 913.
MWMA: Medical Waste Management Control Act
RCRA: Resource Conservation and Recovery Act
TSCA: Toxic Substance Control Act
4.11.3.10 Trends and Requirements
❍
Reduce routine LLMW by 1.24 m3.
In 2000, SNL set goals to reduce routine waste generation
by 40 to 50 percent.
❍
Reduce routine solid waste by 1,422 metric tons.
❍
Increase procurement of EPA-designated recycled
products to 100 percent in 2005, except where they
are not commercially available competitively at a
reasonable price or do not meet performance
standards.
❍
Reduce annual energy use per square foot in regular
buildings by 30 percent from FY 1985 to FY 2005.
Reduce annual energy use per square foot in regular
buildings by 40 percent by FY 2010.
❍
Reduce annual energy use per square foot in energyintensive buildings by 20 percent from FY 1990 to
FY 2005. Reduce annual energy use per square foot in
energy-intensive buildings by 25 percent by FY 2010
(SNL/CA 2002b, SNL 2001g).
4.11.3.11 Waste Minimization
Waste minimization activities are not included in the
previous descriptions to bound maximum waste projections for any given year. The following wastes are tracked
to determine SNL/CA’s effectiveness in reducing wastes:
LLW and LLMW, RCRA, state-regulated, TSCA, and
sanitary waste. In addition, reductions of resource and
energy use are tracked.
Following are the goals to be completed:
❍
Reduce routine RCRA waste by 14.59 metric tons.
❍
Reduce routine non-RCRA waste by 10.63 metric tons.
❍
Reduce routine TSCA waste by 0.37 metric tons.
4.11.3.1 Recycling
❍
Reduce routine LLW by 17.28 cubic meters (m3).
Table 4-12 presents CY 2000 recycling information for
SNL/CA by material type.
Table 4-12. Material Recycled in Calendar Year 2000 (in kilograms)
Material
Coolants
Elemental mercury
Amount
Material
Amount
690
Aluminum cans
470
9
Construction debris
6,805,170
5,030
Oil filters
240
0
Paper/cardboard
42,010
2,270
Scrap metals
86,790
Transparencies
20
Tires
760
Toner cartridges
750
Used oil
3,340
45,390
Metal drums
210
Fluorescent light bulbs
Glass
Batteries
Yard waste
Source: SNL/CA 2002b
4-42
Final SNL/CA SWEA DOE/EA-1422—January 2003
Chapter 4, Affected Environment–Section 4.12, Noise
4.12
NOISE
4.12.1 DEFINITION OF RESOURCE
Noise is sound that is undesirable because it interferes with
speech, communication, or hearing; is intense enough to
damage hearing; or is otherwise annoying. Impulse noise
from detonation of explosives is generally considered an
annoyance because of “startle” effects. Intense noise requires hearing protection for personnel to protect against
loss of hearing.
4.12.2 REGION OF INFLUENCE
The ROI associated with noise generated at SNL/CA
may be estimated by measuring the maximum onsite
noise, then determining the distance over which the noise
attenuates to levels within background. Sound diminishes
at the rate of approximately 6 decibel, A-weighted sound
levels (dBA) for each doubling of the distance from the
source. The maximum measured impulse noise of 96 dBA
was measured near the live firing range. The distance at
which this sound can be heard depends on the intensity
of the initial source, the meteorological conditions, terrain, and background noise levels. At the site boundary
located approximately 850 ft southwest of the SNL/CA
live firing range, impulse noise ranged from 73 to 82 dBA.
At a distance of 6,800 ft the impulse noise level is estimated to range between 55 and 64 dBA, which is within the
background levels associated with residential areas. The
region of influence for noise generated from SNL/CA
extends beyond the site boundary for a distance of about
a mile for maximum impulse noise generated onsite.
4.12.3 AFFECTED ENVIRONMENT
The noise generated at SNL/CA is typical of a research
and development facility. Ambient noise sources include
onsite vehicular traffic and stationary noise sources such
as generators, cooling systems, transformers, engines,
pumps, and fans, etc. Construction activities also contrib-
Quantifying the Effects of Sound
The process of quantifying the effects of sound begins
with establishing a unit of measure that accurately
compares sound levels. The physical unit most commonly used is the decibel (dB). The decibel represents
a relative measure or ratio to a reference pressure.
The reference pressure is a sound approximating the
weakest sound that a person with very good hearing
can hear in an extremely quiet room. The reference
pressure is 20 micropascals, which is equal to 0 (zero)
dB. A-weighted sound levels (dBA) are typically used to
account for the response of the human ear. A-weighted
sound levels represent adjusted sound levels that are
made according to the frequency content of the sound.
Final SNL/CA SWEA DOE/EA-1422—January 2003
ute to ambient background noise levels, as does the live
firing range.
EPA guidelines for environmental noise protection
recommend an average day-night average sound level
of 55 dBA as sufficient to protect the public from the
effects of broadband environmental noise in typically
quiet outdoor and residential areas (EPA 1974). Landuse compatibility guidelines adopted by the Federal Aviation Administration (FAA) and the Federal Interagency
Committee on Urban Noise indicate that yearly day-night
average sound levels less than 65 dBA are compatible
with residential land uses and levels up to 75 dBA are
compatible with residential uses if suitable noise reduction features are incorporated into structures
(14 CFR Part 150).
SNL/CA is not subject to environmental noise regulation by state or local agencies. The County of Alameda
does have noise standards for the unincorporated areas
of the county, which are applicable to areas northeast,
east, south, and southwest of SNL/CA. The standards
correlate types of land use with minutes of exposure to
various dBA levels by time of day. Noise sources associated with construction are exempted from the noise standards, provided the construction activities do not take
place before 7 a.m. or after 7 p.m. Monday through Friday, or before 8 a.m. or after 5 p.m. on Saturday or Sunday. Table 4-13 presents the Alameda County noise level
standards.
Livermore follows the Noise Element of the Livermore
General Plan. These guidelines are applicable to areas
within the city that are west and northwest of SNL/CA
(SNL/CA 2002b).
SNL/CA is subject to occupational noise exposure standards established in a Hearing Conservation Program that
incorporates the requirements identified in DOE Order
440.1A, Worker Protection Management for DOE Federal
and Contractor Employees, and 29 CFR 1910.95, Occupational Noise Exposure. The program also incorporates the
threshold limit values established by the American Conference of Governmental Industrial Hygienists. Under
the Hearing Conservation Program, hearing protection is
provided to workers to attenuate exposure to an 8-hour
time-weighted average of no more than 85 dB.
SNL/CA performed onsite community sound level measurements on April 17, 23, and 25, 2001. The noise survey was conducted at the locations shown on Figure 4-17.
Table 4-14 presents the results of the noise survey with
an explanation of the sound levels presented. Based
upon the survey data, SNL/CA background noise levels
at locations 1 and 2 as shown on Figure 4-17 are within
the approximate range of 55 to 65 dBA, which is typical
commercial areas.
4-43
Chapter 4, Affected Environment–Section 4.12, Noise
Table 4-13. Alameda County Noise Level Standards
Noise Level Standard (dBA)
Cumulative Number of Minutes
in any 1-Hour Time Period
7 a.m. to 10 p.m.
Noise Sensitive
a
10 p.m. to 7 a.m.
Commercial
Noise Sensitive
a
Commercial
30
50
65
45
60
15
55
70
50
65
5
60
75
55
70
1
65
80
60
75
0
70
85
65
80
Source: SNL/CA 2002b.
a
Noise-sensitive land uses include residences, schools, hospitals, churches, and public libraries.
dBA: decibel, A-weighted sound levels
Table 4-14. Twenty-Four Hour Onsite Ambient Noise Monitoring
Monitoring
Date
Location
CNEL
(dBA)
Ldn
(dBA)
24-Hour
Leq
(dBA)
CNEL Ld
7 am-7 pm
(dBA)
Ldn Ld
7 am-10 pm
(dBA)
Le
7 pm-10 pm
(dBA)
Ln
10 pm-7 am
(dBA)
4/17/01
1
58.9
68.3
59.3
60.2
59.3
0
48.4
4/17/01
2
61.3
67.3
60.8
63.7
62.7
0
46.7
4/23/01
1
54.1
54.2
61.5
57.1
56.2
0
0
4/23/01
2
57.7
59.7
55.5
58.2
57.2
0
38.2
4/25/01
1
60.2
61.3
60.7
63.2
62.2
0
35.6
4/25/01
2
53.5
60.0
63.3
55.8
54.8
0
39.5
Source: SNL/CA 2002b.
dBA: decibel, A-weighted sound levels
Notes: CNEL is community noise equivalent level. Noise levels for assessing impact on the community are measured over a 24-hour period. Noise
is time-weighted to reflect the fact that individuals in the community are more sensitive to loud noises during evening and nighttime hours. The
average evening and nighttime noise levels are weighted from 5 to 10 dBA when computing community noise levels. CNEL is an adjusted 24-hour
sound level measurement that weights evening noise levels (Le), occurring between the hours of 7:00 p.m. and 10:00 p.m., and gives maximum
weighting to nighttime noise levels (Ln), occurring between 10:00 p.m. and 7:00 a.m.
Ldn or day-night average level is identical to CNEL except that the weighted evening term (Le) is deleted and the daytime period (Ld) is extended to
10 p.m. In other words, Ld is the daytime period that extends from 7 a.m. to 10 p.m. A 10-decibel adjustment weights sound levels occurring
during the nighttime hours (10 p.m. to 7 a.m.).
Leq or equivalent sound level is used to describe noise in which loudness varies with time over a wide range of frequencies. This descriptor
considers these variations and converts the average sound level to a decibel unit.
4-44
Final SNL/CA SWEA DOE/EA-1422—January 2003
Chapter 4, Affected Environment–Section 4.13, Human Health and Worker Safety
Source: Original; SNL/CA 2002b
Figure 4-17. Sandia National Laboratories, California Site Noise Measurement Map 2001
Human sensitivity to nighttime noise events is considered in the noise analysis.
4.13
HUMAN HEALTH
AND WORKER SAFETY
4.13.1 DEFINITION OF THE RESOURCE
This section on human health and worker safety describes
how existing physical and environmental conditions affect
public health and worker health and safety. It includes all
individuals who could be affected by radioactive and nonradioactive hazardous materials released from SNL/CA
operations. This section compares SNL/CA worker health
and safety performance records from 1998 to 2000 to
equivalent national, regional, or local health statistics. The
current relationship of people to the SNL/CA environment
Final SNL/CA SWEA DOE/EA-1422—January 2003
is assessed by resource area. These assessments constitute
the framework for understanding the impacts from the
alternatives presented in Chapter 5.
4.13.2 REGION OF INFLUENCE
The ROI for impacts to public health from outbound
air emissions are the population living and working near
SNL/CA. For worker health, the ROI includes onsite
safety related impacts.
4.13.3 AFFECTED ENVIRONMENT
The environment within the ROI includes environmental
resources such as air, groundwater, and soil, which, if
4-45
Chapter 4, Affected Environment–Section 4.13, Human Health and Worker Safety
affected, could subsequently affect public health and worker health and safety. See the specific resource sections for
descriptions of existing conditions of these resources. Any
environmental releases due to activities described in the
SWEA have the potential to affect the health of people who
live around and work at SNL/CA.
4.13.3.1 Public Health and Safety
Prior to 1994, SNL/CA had only one radiological emission source requiring monitoring under the requirements
of the National Emission Standards for Hazardous Air
Pollutants (NESHAP) (40 CFR 61, Subpart H), the Tritium Research Laboratory. Tritium operations ceased at
SNL/CA in 1994. Under an agreement with the EPA,
Region IX, SNL/CA continued stack monitoring and
ambient air monitoring for tritium for one year after
cessation of tritium operations. This monitoring showed
no remaining airborne tritium and was discontinued in
1995 with EPA approval. Therefore, there are no SNL/CA
sources of radioactive air emissions and thus no exposure
to the offsite population from SNL/CA operations.
Table 4-5 presents the toxic pollutant emissions from
permitted SNL/CA sources during the past five years. As
discussed in Section 4.8, toxic pollutant emissions from
SNL/CA and subsequent exposure to members of the
public are considered minor.
4.13.3.2 Worker Health and Safety
SNL/CA employs an Integrated Safety Management
System (ISMS) to control hazards associated with site
operations, including hazards related to the management
and use of hazardous materials. The ISMS process includes project planning, hazard assessment, identification
and feedback, and continuous improvement planning.
SNL/CA also follows specific management processes to
ensure adequate security and accountability requirements
are met for radioactive and high-hazard materials. Inventory controls are implemented to ensure that material
quantities are maintained at mission-essential levels
(SNL/CA 2002b).
Hazardous materials used at SNL/CA include radioactive
material, chemicals, and explosive materials. Hazardous
materials are managed at SNL/CA in a way that ensures
cradle-to-grave accountability. The inventory systems for
radioactive, chemical, and explosive materials provide the
tracking mechanisms for inventory and waste control.
Materials remain in appropriate storage areas until they
are identified as waste and transferred to the waste management organization for disposal.
Radioactive Material
SNL/CA maintains an inventory of radioactive material
used in laboratory research and radiation monitoring
activities. All radioactive material used by SNL/CA is
4-46
obtained from offsite vendors. Individual sources at
SNL/CA generally have small quantities of radioactive
material and most are sealed. Management of radioactive
material at SNL/CA incorporates the principle of as low
as reasonably achievable (ALARA). Specific activities
at SNL/CA associated with radioactive materials are
conducted in accordance with the Sandia Radiological
Protection Procedures Manual (RPPM) (SNL 2001h)
and incorporates the requirements of 10 CFR 835, Occupational Radiation Protection and addresses all activities
associated with radioactive materials management,
including personnel training, inventory control and
monitoring, safety assessments, and handling.
One of the major goals of the RPPM is to keep worker
exposures at or below ALARA. To meet this goal, SNL/
CA must evaluate both external and internal exposures,
and work to minimize the total effective dose equivalent.
An effective program also must balance minimizing individual worker doses with minimizing the collective dose
of workers in a group. For example, using many workers
to perform small portions of a task would reduce the
individual worker dose to low levels. However, frequent
worker changes would make the work inefficient, resulting in a significantly higher collective dose to all the
workers than if fewer had received slightly higher
individual doses.
SNL/CA worker doses have typically been well below
DOE worker exposure limits. DOE set administrative
exposure guidelines at a fraction of the exposure limits to
help enforce doses that ALARA. Table 4-15 presents
average individual doses and SNL (labs-wide) collective
doses from 1998 through 2000.
Chemicals
Because of the wide variety of research activities
performed at SNL/CA, the amounts and concentrations
of chemical maintained at SNL/CA vary at any given
time and from facility to facility. In general, the following
chemical types are used and stored at SNL/CA (SNL/CA
2002b):
❍
Corrosives (acids and bases)
❍
Toxics (poisonous chemicals)
❍
Flammables and combustibles (solids, liquids,
and gases)
❍
Reactives (materials that are inherently readily
capable of detonation or becoming flammable at
normal temperatures and pressures)
❍
Asphyxiants (physical asphyxiants are materials
capable of physically displacing the volume of air
in a given space; chemical asphyxiants are materials
that are poisonous when breathed)
❍
Carcinogens (materials capable of inducing cancer)
Final SNL/CA SWEA DOE/EA-1422—January 2003
Chapter 4, Affected Environment–Section 4.13, Human Health and Worker Safety
Table 4-15. Sandia National Laboratories (Labs-Wide) Radiation Exposure Data (1998 through 2000)
Year
Collective Dose (TEDE)
(person-rem)
Number with
Measurable Dose
Average Measurable Dose
(TEDE) (rem)
1998
9.5
181
0.053
1999
6.4
120
0.053
2000
7.6
105
0.072
Average
7.8
135
0.059
Sources: SNL 1999d, 2000d, 2001g
Note: Data for individual divisions within SNL (for example SNL/CA Division 8000) are not reported. Organization numbers for Sandia personnel
sometimes change due to work changes or corporate reorganizations. During any three-month period, monitored personnel may change
organizations one or more times. However, actual doses to SNL/CA workforce would be expected to be much lower than presented in this table,
because SNL/CA does not operate a reactor.
rem: roentgen equivalent, man
SNL/CA: Sandia National Laboratories, California
TEDE: Total Effective Dose Equivalent
More than 8,000 chemicals may be in use or stored at
SNL/CA at any given time. Table 4-16 summarizes the
major programs and facilities that use hazardous chemicals at SNL/CA. The primary management strategy for
the control and management of hazardous chemicals at
SNL/CA is to prevent overexposures to hazardous substances in accordance with the requirements of 29 CFR
1910, Subpart Z. Procedures for chemical management at
SNL/CA include personnel training, inventory control
and monitoring, safety assessments, and handling. Additionally, standard operating procedures, operating procedures, and operating instructions are prepared for specific
activities to establish safe procedures, barriers, controls,
and safe work practices with regard to hazardous operations, including chemical use and storage.
As part of the chemical management strategy, SNL/CA
maintains a centralized Chemical Inventory System (CIS)
for tracking hazardous and nonhazardous chemicals. The
CIS requires bar coding of chemical containers as they
enter SNL/CA to allow container tracking and access to
online chemical inventory data. The bar-coded chemical
containers are tracked to provide location and usage information from arrival at SNL/CA through disposal of the
container by the waste management program. The CIS
links the bar-coded chemical containers to a location and
a location owner, the appropriate hazard and regulatory
information, and the material safety data sheets.
The CIS serves as the chemical inventory source used
for Federal Emergency Planning and Community Rightto-Know Act (EPCRA) reporting and the California
Community Right-to-Know regulations. The EPCRA
inventory consists of the location and quantity of any
onsite hazardous chemicals at SNL/CA in amounts at or
above 10,000 pounds (lb), and of all Extremely Hazardous
Substances in amounts at or above 500 lb or the chemicalspecific Threshold Planning Quantity, whichever is less.
The California Community Right-to-Know regulations are
far more stringent than EPCRA. The California Right-toKnow inventory consists of the location and quantity of
any onsite hazardous chemicals at SNL/CA in amounts
at or above 500 lbs, 55 gal, or 200 cubic feet (ft3).
Explosive Materials
SNL/CA uses explosives in various research, development,
and test applications. Explosive quantities used per activity
range from milligrams to several kilograms. Overall, the
quantities of explosive material maintained onsite are
restricted by the approved explosive capacity of various
storage areas.
The Explosives Storage Area is the primary onsite
location for explosives storage. This area is located in the
southern portion of the developed area and is designated
as a “limited area” accessible to approved personnel only.
The Explosives Storage Area contains eight earth-covered
Table 4-16. Facilities Containing More than 500 Hazardous Chemicals
Facility
Estimated Number
of Chemicals
Building 941
2,100
Chemical/materials science/ metallurgy research and development
Building 968
1,600
Chemical/biochemical and radiation sensor research and development
Building 942
1,540
Extreme ultraviolet lithograph, plastics research and development
Building 916
1,440
Chemical, physics, and materials science research and development
Building 906
1,340
Combustion research
Process/Activity
Source: SNL/CA 2002b
Final SNL/CA SWEA DOE/EA-1422—January 2003
4-47
Chapter 4, Affected Environment–Section 4.14, Socioeconomics
explosive storage magazines, four magazettes, a packaging/receiving building exclusive for explosives, a building
for storing nonexplosive packaging incidentals, and two
transportainer storage units (SNL/CA 2002b).
A Corporate Explosives Safety Program is used to manage
explosives at SNL/CA. It provides guidance for evaluating
and safely conducting explosives operations. The Sandia
Explosives Safety Committee provides continual review,
interpretation, and necessary revision to the Corporate
Explosives Safety Program. As part of the explosive
material management strategy, SNL/CA uses an Explosives Inventory System to track and manage explosive
inventories. The Explosives Inventory System database
maintains information on material composition, characteristics, and shipping requirements; life cycle cost information; plan of use; security and hazard classifications;
and compatibility codes. When an explosive material is
entered into the Explosives Inventory System database
upon delivery or receipt, the system performs a safety
check to ensure that the intended storage location can
accept the type and quantity of material received. The
Explosives Inventory System database will flag any storage capacity overages and incompatible explosive items.
4.13.3.1 Occupational Health and Safety
A worker protection program is in place at SNL/CA to
protect the health of all workers. To prevent occupational
illnesses and injuries and to preserve the health of all
workers involved in site-related activities (construction
and operations), DOE-approved health and safety programs have been implemented. Table 4-17 presents SNL
(lab-wide) injury rates over a 3-year period from 1999
through 2001 (SNL 2001i, 2002a), in terms of total
reportable cases (TRC) rate, lost work day cases (LWC)
rate, and lost work days (LWD) rate. The TRC value includes work-related death, illness, or injury that resulted
in loss of consciousness, restriction from work or motion,
transfer to another job, or required medical treatment
beyond first aid. The data for LWDs represent the number
of workdays beyond the day of injury or onset of illness
that the employee was away from work or limited to
restricted work activity because of an occupational
injury or illness.
As shown in Table 4-17, these health and safety programs have resulted in lower incidences of injury and
illness than those that occur in the general industry,
construction, and manufacturing workforces.
Table 4-17. Sandia National Laboratories, California Injury and Illness
a
Data (1999 through 2001) Based on 200,000 Work Hours (100 workers)
Calendar Year
Total Reportable Cases Rate
Lost Work Day Cases Rate
a
0.8 (1.9)a
1999
5.1 (6.3)
2000
4.2 (6.5)a
0.6 (3.3)a
0.3 (2.0)a
2.9
1.1
0.1
b
2001
3-Year Average
4.1 (6.5)
1.2 (3.1)
Lost Work Days Rate
a
c
1.0 (3.2)
c
0.4 (2.0)c
Source: SNL 2001b, 2002a
State of California Injury and Illness data is for all industries including State and local government.
b
State of California Injury and Illness data is for 2001 were not available at the time of the Draft SWEA.
c
Three year average for State of California data covers 1998-2000 timeframe.
a
4.14
SOCIOECONOMICS
4.14.1 DEFINITION OF RESOURCE
This section describes the demographic and economic
variables associated with community growth and development that have the potential to be directly or indirectly
affected by changes in operations at SNL/CA. SNL/CA
and the communities that support it can be described as a
dynamic socioeconomic system. The communities provide the people, goods, and services required by SNL/CA
operations. SNL/CA operations, in turn, create the demand and pay for the people, goods, and services in the
form of wages, salaries, and benefits for jobs and dollar
expenditures for goods and services. The measure of the
communities’ abilities to support the demands of SNL/CA
depends on their ability to respond to changing environmental, social, economic, and demographic conditions.
4-48
For a discussion of the DOE operations at SNL/CA,
see Section 2.1.
4.14.2 REGION OF INFLUENCE
The socioeconomics ROI is defined by the areas where
SNL/CA employees and their families reside, spend their
income, and use their benefits, thereby affecting the
economic conditions of the region. The ROI consists
of a three-county area (Alameda [which includes the
city of Livermore], San Joaquin, and Contra Costa
counties), where approximately 89 percent of SNL/CA
employees reside (not including 274 contract employees)
(Figure 4-18). The ROI was chosen for the following
reasons (SNL/CA 2002b):
❍
The majority of SNL/CA employees live within
Alameda, Contra Costa, and San Joaquin Counties.
The combined population of these three counties
Final SNL/CA SWEA DOE/EA-1422—January 2003
Chapter 4, Affected Environment–Section 4.14, Socioeconomics
Source: Original
Figure 4-18. Most Sandia National Laboratories, California
Employees Live in a Three-County Area near the Site
totals nearly three million. The SNL/CA population
of just over 1,000 is a very small fraction of this total.
❍
The combined value of SNL/CA’s payroll and purchases was $131 M during the year 2000. In comparison, the payroll for all persons employed in Alameda
County, alone, was over $29 billion. Also, had the
50-mi ROI been chosen, instead, it would have
included (all or portions of) Contra Costa, Santa
Clara, San Francisco, San Mateo, Yolo, San Joaquin,
Solano, Sacramento, Merced, and Marin Counties.
4.14.3 AFFECTED ENVIRONMENT
4.14.3.1 Demographic Characteristics
The estimated population in the three-county ROI in
2000 was 2,956,155 people, of whom approximately
49 percent (1,443,741) resided in Alameda County.
According to the U.S. Census Bureau, the ROI population
grew from 2,563,542 in 1990 to 2,956,155 in 2000, which
is an increase of 392,613 people or 15.3 percent over the
Final SNL/CA SWEA DOE/EA-1422—January 2003
1990 count (SNL/CA 2002b, Census 2000a) (Table 4-18).
Table 4-19 shows population projections to 2010. Alameda County has attracted the highest population growth.
However, San Joaquin and Contra Costa Counties have
increased at faster rates than Alameda County (Table
4-18). According to population projections calculated by
the California State Department of Finance, San Joaquin
County is expected to grow the fastest, 2.9 percent, between 2000 and 2010. Alameda County is expected to
grow 1.6 percent and Contra Costa is expected to increase
at the rate of 1.3 percent (CADF 2001a). The area, including the town of Danville, the cities of Dublin, Livermore,
Pleasanton, and San Ramon, and the surrounding parts of
Alameda and Contra Costa counties, is one of the fastest
growing subregions of the San Francisco Bay Area. It has
evolved from a primarily agricultural area in the 1950s, to
an area of single-family residential suburbs in the 1960s
and 1970s, to a major employment center in the 1980s.
The area is expected to grow by another 77 percent in
housing units and 83 percent in the number of jobs
between 1990 and 2010 (ABAG 1998a).
4-49
Chapter 4, Affected Environment–Section 4.14, Socioeconomics
Table 4-18. Demographic Profile of the Population in the Three-County Region of Influence
Alameda
San Joaquin
Contra Costa
ROI
State of
California
1990 Population
1,279,182
480,628
803,732
2,563,542
29,760,021
2000 Population
1,443,741
563,598
948,816
2,956,155
33,871,648
164,559
82,970
145,084
392,613
4,111,627
1.3
1.7
1.8
1.5
1.4
Population Parameters
Population Change
from 1990 to 2000
Average Annual Percent Change
(1990-2000)
Source: SNL/CA 2002b; Census 2002a.
ROI: region of influence
Table 4-19. Population Estimates and Projections to 2010
Population
Parameters
Alameda
San Joaquin
Contra Costa
ROI
State of California
1990 Population
1,279,182
480,628
803,732
2,563,542
29,760,021
2000 Population
1,443,741
563,598
948,816
2,956,155
33,871,648
2005 Population
1,580,200
645,600
1,021,400
3,247,200
37,473,500
2010 Population
1,671,200
727,800
1,071,400
3,470,400
40,262,400
Sources: SNL/CA 2002b; CADF 2001a.
ROI: region of influence
4.14.3.2 Economic Base
The San Francisco-Oakland-San Jose, California Consolidated Metropolitan Statistical Area (CMSA), which
includes, among others, Alameda and Contra Costa Counties, is the fifth largest metropolitan area in the U.S. The
area contains six Primary Metropolitan Statistical Areas
(PMSA), as defined by the U.S. Census Bureau. Three of
the six are the San Francisco PMSA, the San Jose/Silicon
Valley PMSA, and the Oakland PMSA (Census 2000a).
The Oakland PMSA comprises Alameda and Contra
Costa Counties. The CMSA is the corporate home for
24 of the nation’s Fortune 500 companies. The area is
renowned as the worldwide center of high technology,
and has been acclaimed as the incubator of biotechnology.
It is also a major multimedia and telecommunications
center. SNL/CA is not considered a major employer in the
CMSA or in Alameda County (CAMIS 2000a).
Table 4-17 lists employment and income in the ROI.
The total number of employed civilian workers in the
ROI in 2001 was 1,455,700 (CAMIS 2002a). In 2001,
San Joaquin County had the highest unemployment rate
(8.7 percent), followed by Alameda and Contra Costa
Counties with unemployment rates of 4.5 and 3.3 percent, respectively. The ROI, as a whole, had an unemployment rate of 4.8 percent (Table 4-20) (CAMIS
2002a). Because SNL/CA socioeconomic variables are
very small when compared with the surrounding region,
employment changes at SNL/CA would not have a
Table 4-20. Employment and Income Profile in the Three-County Region of Influence.
Labor Parameters
Alameda
San Joaquin
Contra Costa
ROI
Number of Workers
754,900
264,700
509,800
1,529,400
Employed
721,000
241,600
493,100
1,455,700
4.5
8.7
3.3
4.8
2001 Annual Average Labor Force Data
Percent Unemployed
Sandia National Laboratories, California Workforce (April 2002)
Number of Workers
637
183
108
928
Percent of 2000 Population
.04
.03
.01
.03
$55,972,377
$13,208,972
$39,194,448
$108,375,797
$38,624
$23,242
$41,110
$36,479
Personal Income (2000)
Total Personal Income ($1000)
Per Capita ($)
Sources: CAMIS 2002a; BEA 2000b
ROI: region of influence
4-50
Final SNL/CA SWEA DOE/EA-1422—January 2003
Chapter 4, Affected Environment–Section 4.14, Socioeconomics
marked socioeconomic effect on county population
or the civilian labor force.
The patterns of employment and income are different
among the counties. During 2000 and 2001, employment and per capita income were highest in Contra
Costa County, followed by Alameda and San Joaquin
Counties (Table 4-20). In 2000, service industries comprised the largest employment sector in Alameda County
(312,288 employees or 34.6 percent of total employment).
Retail trade accounted for another 14.2 percent, followed
by government (13.8 percent) and manufacturing
(11.4 percent) (BEA 2000a). Services was the largest
employment sector in San Joaquin County in 2000,
with 26.2 percent (67,745 employees), followed by the
retail trade and government sectors accounting for
16.1 percent and 13.9 percent, respectively (BEA 2000a).
The services sector provided the most employment in
Contra Costa County (173,520 employees or 36.6 percent), followed by retail trade (16.4 percent), and the
finance/ insurance/ real estate sector (12.3 percent)
(BEA 2000a).
The total operating and capital budget for SNL/CA for
FY 2000 was approximately $131.3 M ($57 M for goods
and services and $74.3 M for wages) (SNL/CA 2002b).
By comparison, local purchases and payroll expenditures
at SNL/CA were $64 M and $74.6 M, respectively in
1999 and $79 M and $63.4 M, respectively in 1998
(SNL/CA 2002b).
SNL/CA jobs generate indirect and induced jobs in the
region. The U.S. Department of Commerce Economics
and Statistics Division Bureau of Economic Analysis
(BEA) provides multipliers for industrial jobs, income,
and earnings (BEA 2002a, b). The BEA uses the RIMS II
economic model, which incorporates buying and selling
linkages among regional industries to measure the impact
of SNL/CA’s expenditure of money in the ROI. The model
produces three multipliers, two of which are particularly
useful. The first multiplier is used to calculate worker
earnings, and the second calculates employment. These
multipliers provide information needed to estimate SNL/
CA’s economic impact. Earnings and employment multipliers make possible the identification of not only the
direct impacts of an activity on regional income and jobs
but also the indirect (business) and induced (household)
effects. SNL/CA operations in the ROI have an influence
on the economy. The total funding for SNL was approximately $131.3 M in FY 2000. SNL/CA site workers living
in the ROI received approximately $74.3 M in total wages
and salaries in FY 2000. The regional earnings multiplier
of 1.64 yields an economic impact of an additional
$121.9 M. For every job at SNL/CA, an estimated additional 0.96 jobs were created in the ROI, which means
that the 1,317 average employment level in FY 2002
resulted in an additional 1,264 jobs. In effect, nearly one
Final SNL/CA SWEA DOE/EA-1422—January 2003
Measuring Sandia National Laboratories,
California’s Economic Impact on the
Region of Influence
A multiplier is a factor used to calculate the incremental effect of changes, in dollars spent or jobs
created or lost, at SNL/CA. For example, the earnings
multiplier is used to calculate the total income generated in the ROI for each $1 of income paid to workers
at SNL/CA. The employment multiplier is used to
calculate the total number of generated jobs in the
ROI for each job created at SNL/CA. This SWEA
identified the following multipliers:
Earnings Multiplier—$1 income from SNL/CA for
workers generates another ($0.64), for a total impact
on income of ($1.64) in the ROI.
Employment Multiplier—100 jobs created at SNL/CA
generates another 96 jobs, for a total impact of
196 jobs in the ROI.
Source: BEA 2002a, b
out of every 564 jobs (or 2,581 out of 1,455,700) in the
ROI was created or supported by SNL/CA.
4.14.1.3 Housing and Community Services
Housing
Table 4-18 lists the total number of occupied housing
units and vacancy rates in the ROI. In 2000, the ROI
contained 1,083,920 housing units, of which 1,049,124
were occupied. The vacancy rate was lowest in Contra
Costa County (2.9 percent) and highest in San Joaquin
County (4.0 percent). Vacant units in the ROI numbered
34,796, creating an overall vacancy rate of 3.2 percent.
Public Education
In 2001-2002, student enrollment totaled 506,687 in the
ROI (Table 4-21) (CADE 2002a). The local school district
is the Livermore Valley Joint Unified School District and
includes schools from kindergarten through high school.
The local school district serves over 10,000 students from a
240-sq mi area that includes the City of Livermore. There
is no available information on the number of children of
SNL/CA employees that attend district schools. However,
the number is estimated to be less than 2 percent (under
200 students) of the total district’s total enrollment
(SNL/CA 2002b).
Health Care
SNL/CA has an onsite medical facility designed to handle
most onsite emergencies and routine physical examinations for safety considerations (such as exams for users
4-51
Chapter 4, Affected Environment–Section 4.15, Environmental Justice
Table 4-21. Housing and Education in the Region of Influence
Parameters
Alameda
San Joaquin
Contra Costa
ROI
Total Units
540,183
189,160
354,577
1,083,920
Occupied Housing Units
523,366
181,629
344,129
1,049,124
Vacant Units
16,817
7,531
10,448
34,796
Vacancy Rate
3.1
4.0
2.9
3.2
217,591
127,354
161,742
506,687
Housing (2000)
Public Education (2002)
Total School Enrollment
Source: Census 2000b; CAMIS 2002a
ROI: region of influence
of respirators). In the case of life-threatening injuries,
SNL/CA has an arrangement with Valley Memorial
Hospital in Pleasanton for emergency services (SNL/CA
2002b).
Fire Protection Services
SNL/CA does not maintain an onsite fire department.
Through a memorandum of understanding, the LLNL Fire
Station No. 1 will provide the primary emergency response
to SNL/CA. The LLNL fire department responds to all
alarms at SNL/CA and will respond to calls from SNL/CA’s
Central Alarm Station (which is manned 24 hours a day,
365 days a year). SNL/CA’s fire protection personnel estimate that the LLNL fire department responds to calls at
SNL/CA an average of 50 times per year (SNL/CA 2002b).
Police and Security Services
SNL/CA has a security force that is responsible for onsite
security. Actions within the purview of the security force
include badging and visitor clearances, securing the site
and adjacent areas, responding to security threats, supporting building emergency team activities, and assisting
in site evacuation. The security force’s Security Supervisor is the primary liaison between the LLNL security
force, the Alameda County Sheriff’s Department, and the
Livermore Police Department. The need for police services from the City of Livermore is infrequent, about once
per year (SNL/CA 2002b).
4.15
ENVIRONMENTAL JUSTICE
4.15.1 DEFINITION OF THE RESOURCE
Environmental justice has been defined as the “fair
treatment and meaningful involvement of all people
regardless of race, color, national origin, or income with
respect to the development, implementation, and enforcement of environmental laws, regulations, and policies”
(EPA 2002). Concern that minority and/or low-income
populations might be bearing a disproportionate share of
adverse health and environmental impacts led President
4-52
Clinton to issue an Executive Order (EO) in 1994 to
address these issues. EO 12898, Federal Actions to Address
Environmental Justice in Minority Populations and LowIncome Populations, directs Federal agencies to make environmental justice part of their mission by identifying and
addressing, as appropriate, disproportionately high and
adverse human health or environmental effects of their
programs, policies, and activities on minority populations
and low-income populations. When conducting NEPA
evaluations, the DOE incorporates environmental justice
considerations into both its technical analyses and its
public involvement program in accordance with the EPA
and CEQ (CEQ 1997).
4.15.2 REGION OF INFLUENCE
The DOE selected the area within a 15-mi radius of
the SNL/CA site as the ROI, an area that encompasses
the City of Livermore and portions of three counties
(Alameda, Contra Costa, and San Joaquin). The City
of Tracy, which lies mostly outside of the 15-mi radius,
was also included because a substantial number of SNL/
CA employees live there. This ROI was selected because
a majority of SNL/CA employees live within the threecounty area; past analyses of potential impacts of releases
of toxic gases and radionuclides showed that concentrations would be “negligible” at or beyond the site boundary; and assessments of the consequences of the worst
credible accident at the SNL/CA site suggest that a 15-mi
ROI is the appropriate area of analysis for environmental
justice impact analysis (SNL/CA 2002b).
4.15.3 IDENTIFYING MINORITY AND
LOW-INCOME POPULATIONS
Demographic information from the U.S. Census Bureau
website was used to identify minority and low-income
populations in the ROI. Information on locations and
numbers of minority populations was obtained from the
2000 U.S. Census, while information on low-income
populations was developed from the 1997 Economic
Census (SNL/CA 2002b).
Final SNL/CA SWEA DOE/EA-1422—January 2003
Chapter 4, Affected Environment–Section 4.15, Environmental Justice
4.15.4 MINORITY POPULATIONS
Fifty census tracts with a total population of 287,611
lie wholly or partially within the ROI (SNL/CA 2002b).
Of these, five census tracts (four of which are in Alameda
County) have a higher percentage of minorities than the
state of California as a whole (40.5 percent). The ROI
has a higher percentage of whites (75.9 percent) than
the state of California (59.5 percent). The City of Livermore, which lies in the approximate center of the ROI
(the 15-mi radius), has an even higher percentage of
whites (81.9 percent), and the City of Tracy, which lies
mostly outside of the 15-mi radius has a lower percentage
of whites (65.2 percent) than Livermore, but still higher
than the state. Conversely, the ROI has a lower percentage
of minorities than the state as a whole. The black population of the region of influence is 3.5 percent, versus
6.7 percent for the state of California. The ROI has a
much smaller percentage of Hispanics (11.3 percent)
than the State of California (32.4 percent). All indica-
Final SNL/CA SWEA DOE/EA-1422—January 2003
tions are that the ROI is less racially diverse than the
State of California as a whole, with a higher proportion
of whites and a lower proportion of minorities.
4.15.5 LOW-INCOME POPULATIONS
Based on 1997 data, the percentage of the population
below the poverty level was 11.8, 8.7, and 18.8 in Alameda, Contra Costa, and San Joaquin Counties, respectively
(SNL/CA 2002b). In the State of California, approximately 16.0 percent of the population was below the poverty
level. The ROI has a much lower percentage (2.5 percent)
of people living below the poverty level than the State of
California. These low poverty rates and other socioeconomic data (such as unemployment rates, median family
incomes, per capita incomes, and levels of education) are
indicative of a prosperous area with a thriving economy
and highly-educated workforce, particularly in Alameda
and Contra Costa Counties (Census 2000b; SNL/CA
2002b).
4-53
This page intentionally left blank.
Chapter 5, Environmental Consequences–Section 5.1, Introduction
CHAPTER 5
Environmental Consequences
Chapter 5 provides information on the methods of analysis applied in the SWEA and the results of analyses for SNL/CA.
The chapter begins with an introduction and a summary of the impact assessment methodologies that have been applied.
It continues with descriptions of the impacts of the No Action, the Planned Utilization and Operations, and the Maximum
Operations Alternatives. For each alternative, impacts are presented by resource area (for example, infrastructure, land use,
geology and soils) or topic area (for example, waste generation, transportation, environmental justice).
5.1
INTRODUCTION
Chapter 5 provides an analytical comparison of the
environmental impacts associated with the alternatives.
Section 5.2 contains a summary discussion of the methodologies used to assess potential impacts. Section 5.3, No
Action Alternative; Section 5.4, Planned Utilization and
Operations Alternative; and Section 5.5, Maximum Operations Alternative are formatted so that, within each
alternative, the discussion is divided into the following
resource and topic areas:
❍
Land Use and Visual Resources
❍
Geology and Soils
❍
Water Resources and Hydrology
❍
Biological Resources
❍
Cultural Resources
❍
Air Quality
❍
Infrastructure
❍
Transportation
❍
Waste Generation
❍
Noise
❍
Human Health and Worker Safety
(including impacts from accidents)
❍
Socioeconomics
❍
Environmental Justice
A comparison of impacts among alternatives is presented in Section 5.7. A discussion of cumulative
impacts is presented in Chapter 6.
5.2
5.2.1
METHODOLOGY
LAND USE AND VISUAL RESOURCES
A comparative methodology was used to determine
impacts to SNL/CA land use. Facility operations and any
construction or other modification activities associated
with each alternative were compared to the existing conditions. Impacts were identified related to changes in land
use classifications, extent of use, alternative or conflicting
uses, and accessibility concerns.
The analysis of visual impacts was also comparative and
consisted of a qualitative examination of potential changes in visual resources, scenic values (attractiveness), and
view corridors (visibility). Aspects of visual modification
examined included site development or modification
activities that could alter the visibility of SNL/CA structures or obscure views of the surrounding landscape, and
changes in land cover that could make structures more
visible.
5.2.2
GEOLOGY AND SOILS
Geology and soils analyses encompassed three distinct
areas: seismic, slope stability, and soil contamination.
The consequences of seismic activity at SNL/CA are
addressed within the accident analysis section (5.6).
Section 5.6, Accidents, discusses impacts of accidents
for all three alternatives. For comparison, environmental
emissions and other potential environmental effects are
presented with regulatory standards or guidelines, as
appropriate. However, for National Environmental Policy
Act 1969 (NEPA) purposes, compliance with regulatory
standards is not necessarily an indication of the significance or severity of the environmental impact.
The slope stability analysis used a map to locate SNL/CA
facilities near areas with potentially unstable slopes (at
least 10 percent). The 10 percent value was selected as a
conservative screening criterion based on the dry site soil
conditions and no previous slope stability problems at
SNL/CA. For each SNL/CA facility identified, field observations were conducted to support a qualitative evaluation of the effects of SNL/CA activities on these slopes.
Several resource-specific evaluations have been performed
that address the consequences and risks associated with
the National Nuclear Security Administration (NNSA)
operations at SNL/CA. Each evaluation has a unique
scope and purpose. Figure 5-1 illustrates how the facilitybased assessments and specific evaluations and consultations flow into the SNL/CA SWEA.
The soil contamination analysis considered the potential for human contact of near-surface (the top 6 inches
to 1 foot [ft]) contaminated soils and limitations on future
land use of these areas. The analysis examined the characteristics of sites where soil contamination could be present (environmental restoration sites). Soil contaminant
Final SNL/CA SWEA DOE/EA-1422—January 2003
5-1
Chapter 5, Environmental Consequences–Section 5.2, Methodology
Source: Original
Figure 5-1. Data and Analytical Contributions to the Sandia National
Laboratories, California Site-Wide Environmental Assessment
The Site-Wide Environmental Assessment is related to many other Department
of Energy and National Nuclear Security Administration resource-specific studies.
5-2
Final SNL/CA SWEA DOE/EA-1422—January 2003
Chapter 5, Environmental Consequences–Section 5.2, Methodology
concentrations were projected under each alternative and
compared with criteria for future designated land use.
5.2.3
WATER RESOURCES AND HYDROLOGY
Water resources and hydrology analyses focused on four
distinct areas: groundwater quality, groundwater quantity,
surface water quality, and surface water quantity.
The groundwater quality analysis determined to what
extent contamination from SNL/CA sites in the unsaturated and saturated zones would limit the potential use of
groundwater, particularly as drinking water. Unsaturated
zone and groundwater contamination sites that have not
been removed, are planned for removal, are final, or are
proposed for no further action were characterized in
terms of their contaminants, concentrations, and extent.
Groundwater quantity analysis examined future SNL/CA
water use projections, evaluating potential impacts of
groundwater withdrawal.
The surface water quality analysis examined the potential
for future storm water runoff contamination in Arroyo
Seco. Arroyo Seco water quality at the point where the
arroyo enters the SNL/CA boundary was examined. The
analysis examined changes in potential SNL/CA surface
water contamination under the three alternatives and the
likelihood of these changes affecting regulatory compliance at the downstream exit point of Arroyo Seco.
Effects of SNL/CA facilities on surface water quantity
were analyzed based on the incremental contribution of
SNL/CA to Arroyo Seco flows from storm water runoff.
The current SNL/CA storm water runoff-monitoring program includes visually monitoring 22 discharge locations
onsite during storm events and sampling nine locations.
The amount of runoff is a function of the permeability of
the ground surface or cover material. The percentage of the
site’s 410-acre drainage to the Arroyo that is impervious
(buildings, roads, parking lots, etc.) was estimated for each
of the three alternatives.
5.2.4
BIOLOGICAL RESOURCES
Potential impacts are assessed based on the degree to
which various habitats or species could be affected by
SNL/CA operations. Where possible, impacts are evaluated with respect to Federal and California protection
regulations and standards.
Impacts to wildlife and habitat are evaluated in terms of
disturbance, displacement, or loss of wildlife. Results of
SNL/CA radionuclide monitoring in Livermore Valley
released in September 2001 indicated that the average onsite radiation dose was essentially the same as offsite background during calendar year (CY) 2000 (SNL 2001e). The
proximity of wetlands to SNL/CA operations was examined. Lists of protected species potentially present at SNL/
FinalSNL/CA SWEA DOE/EA-1422—January 2003
Ozone
Ozone (O3) is a gas composed of three oxygen
atoms. It is not usually emitted directly into the air,
but at ground level, ozone is created by a chemical
reaction between oxides of nitrogen (NOx) and volatile organic compounds (VOCs) in the presence of
heat and sunlight.
VOC + NOx + Heat + Sunlight = Ozone
Motor vehicle exhaust and industrial emissions,
gasoline vapors, and chemical solvents are some of
the major sources of NOx and VOC that help to form
ozone. Sunlight and hot weather cause ground-level
ozone to form in harmful concentrations in the air.
As a result, it is known as a summertime air pollutant.
Many urban areas tend to have high levels of groundlevel ozone, but even rural areas are subject to increased ozone levels because the wind carries ozone
and pollutants that form it hundreds of miles away
from their original sources.
CA were obtained from the U.S. Fish and Wildlife Service
(USFWS) and California Department of Fish and Game
(CDFG). These species lists were used to assess whether
SNL/CA operations would affect any plant or animal
protected by the Endangered Species Act or the California
Endangered Species Act. In accordance with Section 7 of
the Endangered Species Act, a biological assessment has
been prepared to evaluate the effects of continued operation of SNL/CA on federally listed and candidate species.
The biological assessment was submitted to the USFWS on
July 19, 2002, and is currently under review by this agency.
5.2.5
CULTURAL RESOURCES
Potential impacts to cultural resources were assessed
under the three alternatives. Cultural resources included
prehistoric, historic, and Native American resources.
Information for impact assessment included previous
cultural resource assessments (Busby et al., 1990) and
surveys (SNL 2001c, 2001f), and a consultation with the
California State Historic Preservation Officer (SHPO).
Data on potential SNL/CA activities under the three alternatives were used to estimate impacts to resources (SNL/
CA 2002b). Because there are no known resources on the
SNL/CA site that are eligible or potentially eligible to the
National Register of Historic Places (NRHP), the activities evaluated included only those with the potential to
impact undiscovered (buried) archaeological resources.
5.2.6
AIR QUALITY
The methodology used to determine environmental impacts of the proposed alternatives on air quality involves a
three-step screening analysis as illustrated in Figure 5-2.
5-3
Chapter 5, Environmental Consequences–Section 5.2, Methodology
Source: Original
Figure 5-2. Methodology for Air Quality Environmental Consequences
Sandia National Laboratories, California facilities were analyzed for potential impacts.
5-4
Final SNL/CA SWEA DOE/EA-1422—January 2003
Chapter 5, Environmental Consequences–Section 5.2, Methodology
Step 1 performs an initial screening analysis of
new or modified projects or proposals, changed
circumstances, and new regulations, as described
in Chapter 3. The initial screening analysis determines the specific impact areas that may exceed
the bounds of the affected environment as
described in Section 4.8 Air Quality.
Step 2 analyzed those impact areas that are
likely to exceed the air quality ambient background
conditions.
Step 3 assessed the air quality to determine the
environmental consequences of the increase to
the affected area.
The U.S. Environmental Protection Agency (EPA)
has established criteria and procedures for demonstrating
and assuring conformity of Federal actions to the State
Implementation Plans (SIPs) for areas that are designated
as nonattainment or maintenance for national ambient
air quality standards (NAAQS) for criteria pollutants
(40 CFR Parts 6, 51, and 93).
Section 176 (c)(1) of the Clean Air Act (CAA) requires
Federal agencies to assure that their actions conform with
applicable implementation plans (in most cases the State
Implementation Plan) for achieving and maintaining the
National Ambient Air Quality Standards for the criteria
pollutants, ozone, sulfur dioxide, nitrogen dioxide, carbon
monoxide, lead, and PM10 (particulate matter with an
aerodynamic diameter less than or equal to 10 microns).
In 1993, the EPA issued general conformity regulations
(40 CFR 51, Subpart W, and 40 CFR 93, Subpart B) that
included procedures and criteria for determining whether
a proposed Federal
action would conform with State implementation plans.
In the first phase a conformity review is undertaken to
establish whether conformity regulations would apply to
a proposed action and alternatives. If such a review determines the proposed actions are in an attainment area, the
proposed actions are exempt from conformity requirements, or if in an attainment/maintenance area and the
estimated emissions levels for criteria pollutants are less
than applicable rates, the proposed actions are also
exempt from conformity requirements. The host site
for the proposed action at Livermore in the San Francisco
Bay Area, is classified as nonattainment (as “Other—
equivalent to a moderate nonattainment classification”),
as a carbon monoxide maintenance area, and as an attainment area for all criteria pollutants. Hence further review
of the proposed actions is required for ozone and carbon
monoxide emission estimates from the proposed action
from the perspective of the CAA general conformity
requirements. Such a review is found in the subsequent
subsections 5.3.6, 5.4,6, and 5.5.6 for each of the three
alternatives.
FinalSNL/CA SWEA DOE/EA-1422—January 2003
The Bay Area Air Quality Management District
(BAAQMD), in which SNL/CA is located, is currently in
nonattainment for the 1-hour national ozone standard.
As required by the Clean Air Act (CAA) an Ozone
Attainment Plan was submitted to EPA in 1999 to
identify a means for the region to attain the national
1-hour ozone standard. This plan was partially disapproved by EPA, requiring revisions that were incorporated into the 2001 Ozone Attainment Plan. When approved
by EPA, it will become part of California’s State Implementation Plan (SIP). The 2001 Plan will incorporate
into the SIP significant ozone precursor emission reductions designed to enable the region to attain the national
1-hour ozone standard as expeditiously as practicable.
In addition to the existing 1-hour standard, in 1997,
EPA published a new national ozone standard-0.08 ppmaveraged over 8 hours (62 FR 38855). In July 2000,
based on air monitoring data from 1997 through 1999,
the CARB (California Air Resources Board) recommended to EPA a nonattainment designation for the Bay Area
for the new 8-hour standard. A plan to attain the 8-hour
standard would have been due in 2003. However, a number of issues were litigated in a challenge brought by the
American Trucking Association. Certain issues were
resolved on appeal to the U.S. Supreme Court, which
will probably allow EPA to move forward with setting
plan requirements for the 8-hour standard. The schedule
for submitting plans for the 8-hour standard has not
been set.
In reviewing stationary source measures for possible
adoption in the Bay Area, the District employed a de minimis standard to ensure the inclusion of measures with
potential emission reductions that might help attain the
standard while not so minor as to impose administrative
burdens that would hinder the effectiveness of the overall
effort to adopt measures. The de minimis standard is set
at 0.1 ton per day. The de minimis standard is a level below which the BAAQMD has not proceeded with rule
development except to ensure statewide uniformity of
local air district rules or for policy reasons unrelated to
the efficiency of a measure in reducing ozone. Criteria
pollutant emissions from SNL/CA are below the de minimis standard and therefore ozone precursor emission
reductions are not mandated for SNL/CA (BAAQMD
2001).
The San Francisco Bay Area’s Air Toxics Program
integrates Federal and state air toxics mandates with
local goals that have been established by the BAAQMD’s
Board of Directors. Compounds considered toxic air
contaminants that are emitted in excess of minimum
trigger levels become subject to the District’s Air Toxics
Program. The program consists of several elements that
are designed to identify and reduce public exposure to
5-5
Chapter 5, Environmental Consequences–Section 5.2, Methodology
toxic air contaminants. The three primary control
programs are:
❍
Preconstruction review of new and modified sources
❍
The Air Toxics “Hot Spots” program
❍
Air Pollution control measures
The “Hot Spots” program requires facilities to report
their air toxics emissions, ascertain health risks, and
notify nearby residents of significant risks. Amendments
to the “Hot Spots” program further require facilities that
pose a significant health risk to the community to reduce
their risk through a risk management plan.
5.2.7
INFRASTRUCTURE
Incremental changes to SNL/CA facilities and infrastructure were assessed by comparing the support requirements
of the alternatives to current site infrastructure (roads and
services) and utility demands (water and electricity) based
on projected requirements and available capacities. Impacts
were considered to infrastructure, facilities, services, and
utilities used by SNL/CA, including infrastructure support
provided by Lawrence Livermore National Laboratory
(LLNL).
5.2.8
TRANSPORTATION
Transportation impacts were addressed by examining
projected onsite and offsite transportation activities
involving hazardous materials and wastes (includes radioactive materials and wastes). Regional traffic impacts
related to the alternatives also were addressed.
5.2.9
WASTE GENERATION
The waste generation analysis examined impacts associated with potential waste generation activities of SNL/CA,
including those for low-level waste (LLW), low-level mixed
waste (LLMW), hazardous waste, and process wastewater.
Specific facilities or activities that generate waste were
evaluated for changes to the five-year (1996-2000) average
quantities as a result of the proposed alternatives. SNL/CA
waste management facilities capabilities were evaluated for
potential impacts to their ability to manage projected waste
quantities before transportation to offsite treatment and
disposal. The analysis of potential impacts considered
physical safety, regulatory requirements, and security
measures associated with storage capacity.
Waste quantity projections were a function of individual facilities and projected increases in staffing. The
No Action Alternative equaled the five-year average plus
the new facilities. The Planned Utilization and Operations Alternative and the Maximum Operations Alternative total (site-wide) waste projections were increased by
13 percent and 53 percent, respectively. Balance of opera-
5-6
tion projections were calculated by subtracting facility
specific projections from site-wide projections.
5.2.10 NOISE
The methodology used to determine environmental
impacts of the proposed alternatives with respect to noise
involves a three-step screening analysis as illustrated in
Figure 5-3.
Step 1 performed an initial screening analysis of
new or modified projects or proposals, changed
circumstances, and new regulations, as described
in Chapter 3. The initial screening analysis determined the specific impact areas that may exceed the
bounds of the affected environment as described in
Section 4.12 Noise.
Step 2 analyzed those impact areas that are likely
to exceed noise levels defining ambient background
conditions.
Step 3 assessed the incremental noise levels to determine the environmental consequences of the increase
to the affected area.
The determination as to whether a potential impact is
significant with respect to noise is a qualitative assessment of the increase or decrease in noise level experienced by receptors near the source. A subjective response
to changes in sound levels based upon judgments of sound
present within a short time span indicate that a change of
±5 decibel, A-weighted sound level (dBA) may be quite
noticeable, although changes that take place over a long
period of time of this magnitude or greater may be “barely
perceptible.” Changes in sound levels of ±10 dBA within
a short time span may be perceived as “dramatic” and
changes in sound levels of ±20 dBA within a short time
span may be perceived as “striking.” Dramatic or striking
changes in sound level could be considered significant
impacts.
5.2.11 HUMAN HEALTH AND WORKER SAFETY
An analysis of environmental conditions related to
SNL/CA routine operations under each alternative and
the potential radiological and nonradiological health
effects to SNL/CA workers and the surrounding public
were completed based on a collective dose and workrelated illness and injury rates. There are no SNL/CA
sources of radioactive air emissions and thus no radiation
exposure to the offsite population from SNL/CA operations. The calculations of radiological health effects focus
on the collective dose to site workers involved in implementing each alternative. Occupational health impacts are
presented as estimated work-related illness and injury
rates associated with each of the alternatives.
Final SNL/CA SWEA DOE/EA-1422—January 2003
Chapter 5, Environmental Consequences–Section 5.2, Methodology
Source: Original
Figure 5-3. Methodology for Noise Environmental Consequences
Typically, heating, ventilation, and air conditioning systems contribute to a
majority of Sandia National Laboratories, California background noise.
FinalSNL/CA SWEA DOE/EA-1422—January 2003
5-7
Chapter 5, Environmental Consequences–Section 5.2, Methodology
Radiological doses to the radiation worker population
were evaluated using the (average values) historic dosimetry data available for 1998 through 2000. The same
approach was used to estimate radiation workers’ annual
workforce collective dose. The estimated annual workforce collective dose was based on the projected changes
in the number of radiation workers under each alternative multiplied by the “average” annual workforce collective dose. Annual workforce collective dose was converted
to total number of fatal cancers in the radiation worker
population from one year’s dose.
mental Justice Concerns in EPA’s NEPA Compliance
Analyses (EPA 1998a) provide guidance for identifying
minority and low-income populations and determining
whether the human health and environmental effects
on these populations are disproportionately high and
adverse.
Sandia National Laboratories (SNL) nonradiological
health impacts to workers were evaluated using occupational illness and injury data, occurrence reports, and
industrial hygiene investigation reports available for 1999
through 2001. The SNL/CA illness/injury rate per year
under each alternative is expected to remain consistent
with the average illness/injury rate calculated for 1997
through 2001. The estimated number of illnesses and
injuries per year was based on projected changes in the
total number of workers under each alternative multiplied by the “average” illness/injury rate.
5.2.14 ACCIDENT ANALYSIS
5.2.12 SOCIOECONOMICS
The socioeconomic analysis estimated the incremental
effects from changes in income and employment associated with the three alternatives at SNL/CA. The socioeconomic ROI, as described in Chapter 4, is the three-county
region around SNL/CA, including the city of Livermore,
where 89 percent of SNL/CA employees and their families live, spend their wages and salaries, and use their
benefits.
Earnings and employment multipliers were used to
calculate the incremental effect of changes in socioeconomic conditions at SNL/CA. These multipliers
were developed by the U.S. Department of Commerce
Economics and Statistics Division of Bureau of Economic
Analysis (BEA). The selected socioeconomic impact
areas examined:
❍
Demographics
❍
Economic base
❍
Housing and community services
5.2.13 ENVIRONMENTAL JUSTICE
The potential for disproportionately high and adverse
human health or environmental impacts from the proposed alternatives on minority and low-income populations was examined in accordance with Executive Order
(EO) 12898, Federal Action to Address Environmental
Justice in Minority Populations and Low-Income Populations (59 FR 7629). Both the Environmental Justice
Guidance Under the National Environmental Policy Act
(CEQ 1997a) and the Guidance for Incorporating Environ5-8
The environmental justice analysis presents selected
demographics and identifies the locations of minority
and low-income populations living in the ROI of a
15-mi radius around SNL/CA (see Section 4.15.2).
DOE guidance for accident analysis allows a graded
approach that analyzes accidents at a level of detail that
is consistent with the magnitude of the potential impacts
(DOE 1993b). The DOE requires that potential hazards
be considered if they can lead to accidents that are reasonably foreseeable; that is, there is a mechanism for their
occurrence and their probability of occurrence is generally greater than one chance in a million per year. Accidents
that are less frequent also may be considered if they could
result in high consequences and provide information
important to decision-making. Although the impacts of all
potential accidents are not required, the accident analysis
is required to evaluate a sample of reasonably foreseeable
accidents, to demonstrate the range of potential impacts.
These accidents would include low frequency, high-consequence and high-frequency, and low-consequence events.
Three general areas of accident analysis were considered
in this SWEA: natural phenomenon, material accidents,
and operational accidents. The accident impacts described
in this section were developed from:
❍
meetings with facility managers; environment, safety,
and health coordinators; and/or safety personnel to
identify major potential hazards and identify safety
documentation applicable to the SWEA;
❍
facility visits and tours to identify potential hazardous
situations, gain an understanding of the mechanisms
that could cause an accident, and obtain information
for the development of accident scenarios; and reviews
of facility safety documentation, including the SNL/
CA Facility and Safety Information Document (SNL/
CA 2002a), preliminary hazard screenings (PHSs),
NEPA checklists, hazardous material databases, and
other source documents prepared by SNL/CA.
The information and data obtained during these activities
were used extensively for assessing hazards at SNL/CA
facilities, developing accident scenarios, and estimating
accident impacts.
Ideally, a complete risk assessment would express the
total human health risk as a sum of all potential accident
scenarios. Since it is impractical to rigorously quantify
Final SNL/CA SWEA DOE/EA-1422—January 2003
Chapter 5, Environmental Consequences–Section 5.2, Methodology
all of the terms in the ideal summation, the purpose of
the SWEA accident analysis is to identify a subset of
representative accidents and describe the related impacts.
Preliminary screenings of SNL/CA activities and operations were conducted to select facilities and operations
to be evaluated. The criteria for screening included types
and quantities of hazardous material (includes radioactive
and explosives) potential for public concern, and accidents analyzed in other NNSA NEPA documents. This
initial screening process resulted in the following list of
facilities:
❍
For the purpose of the chemical hazards assessment, a spectrum of events up to and including the
“severe” events that would, from a facility design
standpoint, be beyond credible (failure of a U.S.
Department of Transportation [DOT]-approved
steel cylinder) were considered
❍
For the purpose of the explosion hazard assessment,
six events were considered:
•
Explosion initiated by unspecified event during
hydrogen tanker filling operations
•
Explosion initiated by unspecified rupture of
hydrogen storage tank
•
Explosion due to operational accidents at the
Explosive Destruction System (EDS)
•
Explosion due to operational accidents at the
Explosive Storage Area (ESA)
❍
Combustion Research Facility (CRF) (including the
Glass Furnace and Melting Laboratory)
❍
Building 910
❍
Building 914
❍
Building 916
❍
Building 927
•
❍
Integrated Manufacturing Technology Laboratory
(IMTL)
Explosion due to operational accidents at
magazette explosive storage
•
Oxygen enhanced event due to operational
accidents associated with Glass Furnace and
Melting Laboratory
❍
Chemical and Radiation Detection Laboratory
(CRDL)
❍
Area 8 Facilities
❍
Explosive Storage Area (ESA)
❍
Hazardous and Radioactive Storage Facilities
❍
LIGA Technologies Facility (LTF)
❍
Distributed Information Systems Laboratory (DISL)
All of these facilities are categorized as low-hazard,
nonnuclear facilities and generally contain standard
industrial hazards. Further screening was performed to
eliminate low-hazard activities and operations that would
result in small consequences to workers or the public. This
further screening eliminated the Distributed Information
Systems Laboratory from further consideration, as it would
contain no radioactive, chemical, or explosive materials.
Several specific accident scenarios were identified
and considered for further analysis. The following
were considered natural phenomena accident initiators:
❍
Earthquake initiated accident
❍
Lighting initiated accident
❍
Arroyo Seco flooding
❍
Grass fire
The following were considered material accident
initiators:
❍
No radiological scenarios are postulated because no
sources of potential airborne hazards were identified.
FinalSNL/CA SWEA DOE/EA-1422—January 2003
The following were considered operational accident
initiators:
❍
Fork lift operation
❍
Overhead crane operation
❍
Welding
❍
Chemical exposures
❍
Other standard industrial hazards
Two accident scenarios (site-wide earthquake and hydrogen tanker truck explosion) are discussed in detail. The
impacts of these accidents are meant to characterize the
worse case scenario.
Chemical, oil, or hazardous material spills or releases are
possible given the variety of materials handled at SNL/
CA. Although substantial quantities of hazardous materials (above threshold levels listed in DOE Order 151.1,
“Comprehensive Emergency Management System”) are
not present on SNL/CA, some buildings use a variety of
chemicals, including cylinders of ammonia, hydrogen
cyanide, nitrous oxide, hydrogen sulfide, and carbon monoxide. The Hazardous and Radioactive Storage Facilities
stores and handles hazardous and radioactive wastes
being prepared for shipment offsite for disposal. These
facilities are the onsite receiving point for all chemical
wastes and thus have the potential for hazardous spills,
releases, or fires. Additionally, most of the onsite research
laboratories use small amounts of chemicals for research
projects.
5-9
Chapter 5, Environmental Consequences–Section 5.3, No Action Alternative
No chemical inventories are stored onsite in quantities
sufficient to result in hazardous conditions outside the
facility boundary or offsite (SNL/CA 2001a).
Illness and injury rates from operations are discussed in
the Human Health and Worker Safety section of each
alterative.
Site Visual Quality Guidelines and Landscape Master Plan
(Royston et al., 1993) would be followed. The guidance
covers building massing, facades, colors, building orientation and entries, traffic circulation corridors, standardized
signage, and landscaping. Modifications to the Hazardous
and Radioactive Storage Facilities would also follow the
guidance, thereby having no impact to visual resources.
5.3
5.3.2
5.3.1
NO ACTION ALTERNATIVE
LAND USE AND VISUAL RESOURCES
Implementing the No Action Alternative would not affect
the existing land use patterns or visual resources at SNL/
CA facilities. Sections 5.3.1.1 and 5.3.1.2 discuss the impact of the No Action Alternative to these resource areas.
5.3.1.1
Land Use
No changes to land use would occur at SNL/CA under the
No Action Alternative. The extent of DOE land available
for use by SNL/CA, 410 acres, would remain the same.
SNL/CA operations would remain consistent with industrial research park uses and would have no foreseeable
effects on established land use patterns or requirements.
The only changes in the use of specific locations on the
site would be using current open spaces to construct new
facilities. Construction of the DISL, LTF (Figure 5-4), and
Glass Furnace and Melting Laboratory facilities would be
consistent with established land use and utilization patterns. Because these facilities would be built within the
main campus of the site, filling in empty locations between existing facilities, they would not change the extent
of use of the site and accessibility would not be a concern
(Figure 5-4). Open areas with paved or landscaped surfaces would remain between these new facilities and existing
ones, remaining consistent with the design of the rest of
SNL/CA. In addition, the functions of these buildings
would be consistent with those surrounding them, thus
construction and use of these new facilities would not
negate consideration of possible alternative uses of areas
adjacent to them.
Under this alternative, the Hazardous and Radioactive
Storage Facilities at the site would be modified to increase
their efficiency and operability. As these changes would
occur to an existing building, there would be no changes
or impacts to land use.
5.3.1.2
Visual Resources
The No Action Alternative would not adversely change
the overall appearance of the existing landscape, obscure
views, increase the visibility of SNL/CA structures, or
otherwise detract from the scenic views from SNL/CA
or from areas adjacent to the site. New facilities would
be placed among existing facilities in areas with common
scenic quality. Efforts to incorporate consistent campusstyle design would continue and guidance provided by the
5-10
GEOLOGY AND SOILS
No impacts to general geology and geologic resources are
anticipated. Impacts from geological hazards (seismicity,
slope failure) are evaluated below. Risks from contaminated soils are also discussed.
5.3.2.1
Seismology
Strong earthquake ground motion is responsible for
producing almost all damaging effects of earthquakes,
except for surface-fault rupture. Ground shaking generally
causes the most widespread effects, not only because it
occurs at considerable distances from the earthquake
source, but also because it may trigger secondary effects
from ground failure and water inundation. Potential
sources for future ground motion at the SNL/CA site
include the major regional faults (for example, San Andreas), as well as the local faults including the Greenville,
and Las Positas faults (DOE 1992a).
Seismic hazard analyses have been performed for the
SNL/CA site. All new buildings and facilities would be
built according to established seismic design criteria.
Existing facilities continue to be upgraded or replaced to
the extent possible (SNL 2001d). Larger earthquakes on
more distant faults such as the San Andreas do not significantly affect the hazard estimation for SNL/CA.
5.3.2.2
Slope Stability
At SNL/CA, there is generally little potential for slope
instability because the site is situated on gently sloping
to nearly flat topography. The exception to this is the extreme southern end of SNL/CA. The hillsides surrounding
this area consist of moderately to weakly consolidated
sand and gravel, and colluvial and alluvial terrace deposits.
The Navy Landfill Site hill has extensive evidence of mass
movement (DOE 1992a). There is an increased chance of
slope failure during wet years at the dry wash surrounding
the Navy Landfill Site. Slope failure at this location would
have no effect on SNL/CA facilities.
5.3.2.3
Soils
There could be very minor impacts to the soils due to
erosion during construction. Approximately 6 acres of
soil would be disturbed because of construction activities
associated with building the LTF and DISL facilities. Soil
erosion controls (for example, silt fences) would be used
to minimize soil erosion.
Draft SNL/CA SWEA DOE/EA-1422—October 2002
Chapter 5, Environmental Consequences–Section 5.3, No Action Alternative
Source: Original
Figure 5-4. Sandia National Laboratories, California Facilities
Sandia National Laboratories, California footprint would remain consistent with the current design.
Soil contamination at SNL/CA occurred as the result of
past operations. The cleanup of these soils is performed
to a level that meets the health risk-based standards corresponding to the intended future uses of the site. Analyses
indicate no significant risk to the general public
(SNL/CA 2002b).
As of August 2002, SNL/CA had identified 23 sites
with soil contamination from past operations. Because
contamination levels pose no threat to human health or
the environment, the DOE has proposed no further
action for all 23 sites. Twenty of the No Further Action
Draft SNL/CA SWEA DOE/EA-1422—October 2002
proposals have been approved by state regulatory
authorities. The remaining three sites are part of a
long-term monitoring program. The State, NNSA, and
SNL/CA would continue to discuss monitoring and
potential cleanup activities, as necessary.
Chemical, oil, or hazardous material spills or releases
are possible in the future given the variety of materials
handled at SNL/CA; however, industry accepted controls
are in place to minimize the potential for soil contamination from any SNL/CA operations.
5-11
Chapter 5, Environmental Consequences–Section 5.3, No Action Alternative
5.3.3
5.3.3.1
WATER RESOURCES AND HYDROLOGY
Groundwater Quality
Under this alternative, SNL/CA would continue to
monitor groundwater quality at several sites: the Fuel
Oil Spill (FOS), the Navy Landfill, and the Trudell Auto
Repair Shop. Past measurements indicate that some
contaminants at these sites have periodically exceeded
the maximum contaminant levels (MCLs) in Federal
drinking water standards (40 CFR Part 141). However,
concentrations at these sites continue to decrease over
time (SNL/CA 2002b).
5.3.3.2
Groundwater Quantity
SNL/CA does not use groundwater for any portion of
its water supply; therefore, no effects to groundwater
quantity would be anticipated under the No Action
Alternative.
5.3.3.3
Surface Water Quality
During storm events at SNL/CA runoff is carried by sheet
flow, storm drains, or open ditches to the Arroyo Seco or
the ditch along East Avenue. The ditch along East Avenue
eventually flows into the Arroyo Seco.
Pollutants may be picked up by storm water runoff. If
rainfall is sufficient, there may be enough runoff to carry
the pollutant to the Arroyo Seco before the runoff evaporates or infiltrates into the ground. The amount of runoff
is a function of the permeability of the ground surface or
material. Under this alternative, the percentage of the
site’s 410-acre drainage to the Arroyo that is impervious
(buildings, roads, parking lots, etc.) (12 percent) would
remain the same (SNL/CA 2002b).
The current SNL/CA storm water runoff-monitoring
program includes visually monitoring 22 discharge locations onsite during storm events and sampling nine locations. The discharge locations and sampling stations are
shown in Figure 4-9. These samples are the best available
indicators of what contaminant(s) could reasonably be
transported offsite. No regulatory limits have been set for
pollutants in storm water runoff. During the most recent
sampling, no pollutants were detected at levels that would
be a cause for concern. No effects to storm water compliance would be anticipated under this alternative.
Cleanup actions planned, underway, or completed at the
ER sites at SNL/CA are intended to remove any potential
source of surface water contamination, and the cleanup
activities themselves are not expected to negatively affect
surface water quality. No overall impact to surface water
quality from ER Program activities would be anticipated
under the No Action Alternative.
5-12
5.3.3.4
Surface Water Quantity
The developed (impervious) area of SNL/CA is estimated
to be 49.2 acres. Under the No Action Alternative, only
minor net changes in building and parking lot areas
would be anticipated. Annual variation in SNL/CA
surface runoff would occur with variations in rainfall
quantity and intensity and declining capability are a
potential concern. However, no overall impact to surface
water quantity from activities under the No Action
Alternative would be anticipated.
5.3.4
BIOLOGICAL RESOURCES
Impacts to biological resources at SNL/CA as a result
of the No Action Alternative would be minimal. Because
current operations would continue, the impacts to terrestrial, aquatic, and wetland species, and species would
remain negligible. Inventory and management (including
compliance with regulations) of the biological resources
by SNL/CA would continue to protect the animals, plants,
habitats, and protected and sensitive species on SNL/CA.
5.3.5
CULTURAL RESOURCES
The No Action Alternative would have no impacts to
cultural resources due to: the apparent lack of prehistoric
and Native American resources and historic archaeological sites, the nature of the buildings and structures present, and compliance with applicable regulations and
established procedures for the protection and conservation of cultural resources located on lands administered
by the DOE.
Buried archaeological sites could be impacted during
construction or other ground-disturbing activities.
Under the No Action Alternative, these activities would
include construction of the LTF and DISL facilities. However, compliance with regulations and procedures would
address impacts to any cultural resources discovered during the construction of these facilities, either avoiding,
reducing, or mitigating the potential impacts. Some maintenance activities that require ground disturbance could
also result in the discovery of buried archaeological sites,
but again, compliance with regulations and procedures
would address any impacts.
5.3.6
AIR QUALITY
Under the No Action Alternative, ongoing DOE and
interagency programs and activities at SNL/CA would
continue and several new facilities would contribute to
projected emission increases.
During July 2000 to June 2001, sources of criteria pollutant emissions from SNL/CA included 10 permitted natural gas-fueled boilers in six buildings within the facility.
Table 5-1 presents natural gas usage during CY 2000
from each of the buildings with permitted boilers.
Draft SNL/CA SWEA DOE/EA-1422—October 2002
Chapter 5, Environmental Consequences–Section 5.3, No Action Alternative
Table 5-1. Natural Gas Fuel Usage
at Sandia National Laboratories,
California during Calendar Year 2000
toxic emissions with Bay Area air toxic emissions are less
than one percent of those for the Bay Area.
Building
Natural Gas Usage
(thousand cubic feet)
907
13,345
910
7,254
912
4,952
916
5,535
927
1,907
940, 941, 942, 943
25,754
968
8,941
Source: SNL/CA 2002a
The No Action Alternative would include 28 nonexempt
emission sources:
❍
10 boilers
❍
1 degreaser
❍
1 spray booth
❍
8 backup generators
❍
1 electroplating operation
❍
1 mixer (Glass Furnace and Melting Laboratory)
❍
6 miscellaneous sources
Table 5-2 presents emissions attributed mainly to these
sources, and other minor sources located throughout
SNL/CA as well. SNL/CA criteria pollutant emissions
are less than one percent of the Bay Area emissions.
The SNL/CA toxic air contaminant inventory for the
period July 2000 to June 2001 included 12 significant
pollutants from 18 permitted sources. Methyl alcohol
was the maximum reported toxic pollutant based upon
a 5-year average emission rate (Table 5-3). SNL/CA air
Construction activities at SNL/CA could have short-term
adverse impacts due to emissions of criteria air pollutants
from construction worker traffic and construction equipment and from fugitive dust from earth-moving activities.
Fugitive dust during construction could exceed particulate matter less than 10 microns in diameter (PM10) concentration standards if no dust control measures were
implemented. However, engineered controls, such as the
application of water or chemical dust suppressants and
seeding of soil piles and exposed soils, would minimize
fugitive dust. It is expected that PM10 concentrations will
be within all applicable standards.
Table 5-4 estimates construction-related carbon monoxide
(CO) emissions for one typical project. It is expected that
CO emissions will be within all applicable standards.
The estimated number of daily commuter vehicles to
SNL/CA during fiscal year (FY) 2001 was 700 to 1000.
This number represents the No Action Alternative level
of commuter traffic. Future emissions are expected to
decrease because new vehicles will have lower emission
rates and more stringent inspection and maintenance
programs. In addition, the BAAQMD vehicle buy-back
program designed to remove 1981 and earlier model
vehicles from the road will contribute to the overall
reduction in commuter vehicle emissions.
Total carbon monoxide emissions for the No Action
Alternative are shown in Table 5-5. Total carbon
monoxide emissions for the No Action Alternative are
30 tons per year less than the 2000 baseline, well below
the 100-tons per year incremental increase above baseline
that would require a conformity determination. In addition, the total carbon monoxide emissions for the No
Action Alternative were found to be less than 1 percent
of the maintenance area’s emissions of carbon monoxide.
Table 5-2. Criteria Pollutant Emission Rates for the No Action Alternative (kilograms per year)
a
No Action Alternative
Pollutant
Emission Year
Bay Area
Percent Contribution from
SNL/CA
b
2000/2001
2000
NA
57,900,000
NA
1,656
179,000,000
<1
NA
29,100,000
NA
Nitrogen Dioxide
3,311
214,000,000
<1
Carbon Monoxide
300 to 400
995,000,000
<1
Particulates
Volatile Organic Compounds
Sulfur Dioxide
Sources: SNL/CA 2002b
a
Bay Area Air Quality Management District (BAAQMD) inventory is reported annually for period July to June
b
All Bay Area wide emissions except particulates are based on an average summer day multiplied by 365 days. Bay Area particulate
emissions are based on an average winter day multiplied by 365 days
NA: not available/not applicable
SNL/CA: Sandia National Laboratories, California
Draft SNL/CA SWEA DOE/EA-1422—October 2002
5-13
Chapter 5, Environmental Consequences–Section 5.3, No Action Alternative
Table 5-3. Air Toxic Emission Rates for the
No Action Alternative (kilograms per year)
Bay Areaa
No Action Alternative
Percent Contribution from
SNL/CA
b
Pollutant
Emission Year
1996 to 2001(b)
1999
121.15
58,968
<1
1,4-dioxane
2.61
771
<1
Ammonia
115.8
1,406,160
<1
Benzene
0.31
28,577
<1
Carbon tetrachloride
0.15
1,406
<1
Formaldehyde
3.22
81,648
<1
Methyl alcohol
170.5
276,696
<1
Methylene chloride
40.67
49,896
<1
Perchloroethylene
45.72
371,952
<1
Toluene
9.32
335,664
<1
Trichloroethylene
13.86
21,773
<1
Xylene
2.96
276,696
<1
1,1,1-trichloroethane
Sources: TTNUS 2002a; SNL/CA 2002b
a
Bay Area Air Quality Management District (BAAQMD) inventory is reported annually for period July to June
b
Based on 5-year average emission rate (1996 through 2001)
SNL/CA: Sandia National Laboratories, California
Table 5-4. Estimated Carbon Monoxide Emissions Associated
with LIGA Technologies Facility Construction Activities
1-Year construction
Activity (assumes
21-work day months
or 252 days)
Total Annual
Hours of Operation
Equipment
a
Emission Factors
Estimated Total
Annual Carbon
Monoxide Emissions
(total pounds per year)
Estimated Total
Annual Carbon
Monoxide Emissions
(total tons per year)
Assumptions for Diesel Vehicles Emissions
7 Diesel Units
(trucks for
transportation of
materials to site
throughout life of
construction phase)
3,528
(or 2 hours per day
each for 252 days)
0.11
388
0.194
8 Diesel Units (dozers,
backhoes, graders,
dump trucks to grade
and lay foundation)
800
(or 5 hours per day
each for 20 days)
0.11
88
0.044
10,584
(or 7 hours per day
each for 252 days)
0.11
1,164
0.582
14,912
N/A
1,640
0.82
6 Diesel Units (forklifts,
crane, front end loader,
other equipment for
construction of
buildings)
Total Diesel units (21)
5-14
Draft SNL/CA SWEA DOE/EA-1422—October 2002
Chapter 5, Environmental Consequences–Section 5.3, No Action Alternative
Table 5-4. Estimated Carbon Monoxide Emissions Associated
with LIGA Technologies Facility Construction Activities
1-Year construction
Activity (assumes
21-work day months
or 252 days)
Total Annual
Hours of Operation
Equipment
a
Emission Factors
Estimated Total
Annual Carbon
Monoxide Emissions
(total pounds per year)
Estimated Total
Annual Carbon
Monoxide Emissions
(total tons per year)
Assumptions for Gasoline Vehicles Emissions
24 Light Gasoline units
(worker personal
vehicles, snack
wagons, light
commercial vans)
6,048
(or 1 hour per day
each for 252 days)
0.48
2,903
1.451
2 Hand tampers
160
(or 4 hours per day
each for 20 days)
0.48
77
0.38
Total Gas units
6,208
N/A
2,980
1.49
4,620 pounds
2.31 tons
Total Estimated Carbon Monoxide Emissions
during LIGA Technologies Facility Construction Phase
Source: DOE 2001f
Note: Distributed Information Systems Laboratory construction would produce similar emissions
a
Carbon Monoxide (CO) emission factors are based on the Environmental Protection Agency (EPA) National Vehicle and Fuel Emission Laboratory
(Ann Arbor, Michigan) average emission rates for idling vehicles. CO emissions for light-duty trucks are estimated at 219 grams per hour, for
heavy-duty gas vehicles at 245 grams per hour, and for heavy-duty diesel vehicles at 50 grams per hour. Calculations are based on a conversion
factor of 0.035 ounce per gram (grams x 0.035) divided by 16 (ounces per pounds.) times hour’s operation divided by 2,000 (pounds per ton) to
obtain tons per year.
Table 5-5. Carbon Monoxide Emissions from Sandia National Laboratories,
California under the No Action Alternative (Tons per Year) and Calendar Year 2000 (Baseline)
Stationary Sources
Mobile Sources
Construction Activities
Total
0.4
184
6.9
a
191.3
0.4
214
6.9
a
221.3
No Action Alternative
Baseline
Source: EPA 1995
Notes: Mobile Source Emission Factors assumptions include the baseline (calendar year [CY] 2000) 24.77 grams per mile, the No Action
Alternative (CY 2005) 21.29 grams per mile, 1,000 vehicles, 30 mile trip, average speed 35 miles per hour.
a
Assumed three typical construction projects each year (2.31 tons per project).
As a result, the NNSA has concluded that no conformity
determination is required for the No Action Alternative.
5.3.7
INFRASTRUCTURE
Descriptions of important infrastructure services
(such as maintenance), utilities (such as electricity),
and facilities are provided in the SNL Sites Comprehensive
Plan FY 2001-2010 (SNL 2001d). Potential incremental
changes to SNL/CA services, utilities, and facilities
were reviewed for each alternative. The analysis focused
on incremental changes to site-wide utility demands.
Most SNL/CA facilities do not meter utility use. However, annual site-wide utility demands are known and
were used, in part, to make projections (TtNUS 2002a).
Draft SNL/CA SWEA DOE/EA-1422—October 2002
Table 5-6 projects the utility usage for the No Action
Alternative. Water use would range from 50 to 60 million
gallons per year (MGY). SNL/CA would generate 12 to
19 M gal of wastewater per year. Projected utility consumption rates likely would fluctuate annually due to weather.
With the addition of the LTF, the DISL and the Glass
Furnace and Melting Laboratory electricity and natural
gas usage at SNL/CA would increase by 14,000 MWh
and 35 M ft3 per year, respectively (FY 2000, Table 4-6).
Under the No Action Alternative, current infrastructure is capable of accommodating facility requirements
and no major additional infrastructure facilities are
proposed. Buildings, services, communications, maintenance programs (including upgrades, repairs, and limited
renovations), roads, material storage, and waste storage
5-15
Chapter 5, Environmental Consequences–Section 5.3, No Action Alternative
Table 5-6. Annual Sandia National Laboratories, California
Utility Usage and Capacities under the No Action Alternative
Utility
No Action Alternative
System Capacity
Usage as
Percent of Capacity
50 to 60 M gal
922 M gal
5 to 6
12 to 19 M
81 M gal
15 to 23
36,934 MWh
239,000 MWh
15
Water Use
Wastewater Discharge
Electrical Use
Natural Gas Use
94 M ft
3
430 M ft
3
22
Source: TtNUS 2002a
ft3: cubic feet
gal: gallon
M: million
MWh: megawatt hour
activities would remain compatible with system requirements. SNL/CA maintains an active decontamination
and decommissioning (D&D) program that identifies
and removes from active service outdated or substandard
facilities. An overall reduction in the number of active
facilities would reduce the overall impacts to SNL/CA
infrastructure. Specific details on these systems and
programs are presented in the SNL Sites Comprehensive
Plan FY 2001-2010 (SNL 2001d).
5.3.8
TRANSPORTATION
No additional impacts to transportation would occur
under the No Action Alternative. SNL/CA commuter
traffic would remain at 700 to 1,000 vehicles per day.
Approximately one to three hazardous material shipments (outbound) per week would be expected. Waste
shipments would remain at 76 per year. Table 5-7
shows the No Action Alternative transportation-related
activities would remain the same as FY 2000.
5.3.9
WASTE GENERATION
The No Action Alternative would not cause major
changes in the types of waste streams generated onsite.
Waste generation levels at SNL/CA would remain constant
or slightly increase. However, existing waste minimization
and pollution prevention measures would control the
extent of the waste generation increase. Waste projections
would not exceed existing waste management capacities.
Wastes from existing operations are considered to be
derived from mission-related work. New operations are
discussed separately in order to show the maximum likely
existing operational increases. Nonoperations wastes are
generated from special programs and facility support.
Table 5-7. Annual Sandia National Laboratories, California
Transportation Activities under the No Action Alternative
Activity
FY 2000
No Action Alternative
Paved and unpaved road
6.2 miles
6.2 miles
4 acres
4 acres
Pedestrian mall
Paved service areas
5.5 acres
5.5 acres
Paved service parking
12.7 acres
12.7 acres
33 trips
33 trips
Waste (includes hazardous
and radioactive)
76 shipments
76 shipments
Sanitary Waste
52 shipments
52 shipments
700 to 1,000 vehicles
700 to 1,000 vehicles
Sandia National Laboratories,
California Weekly Hazardous
Materials Transports (excluding waste)
1 to 3 outbound shipments per week
(Total of 33)
1 to 3 outbound shipments per week
(Total of 33)
Supplier Weekly Hazardous
Material Transports
1 to 3 inbound shipments per week
(Total of 100)
1 to 3 inbound shipments per week
(Total of 100)
Material (Annual Shipments
Radioactive, Chemical, and Explosives)
Site-Related Traffic Total Daily traffic
Source: TtNUS 2002a
5-16
Draft SNL/CA SWEA DOE/EA-1422—October 2002
Chapter 5, Environmental Consequences–Section 5.3, No Action Alternative
Waste generation levels for special program waste, such as
for new construction, are derived separately.
5.3.9.1
Radioactive Wastes
Existing Operations
Under the No Action Alternative, SNL/CA potentially
would generate LLW and LLMW. However, SNL/CA
would not generate any TRU waste or high-level waste.
Site-wide average annual radioactive waste projections are
presented in Table 5-8. Projections for radioactive waste
generation at specific facilities from new and existing
operations are shown in Table 5-9.
Under the No Action Alternative, SNL/CA anticipates
no increase in generation of LLW from existing operations
over the next 10 years. LLMW generation would remain
constant for all operations through 2012. New operations
would not generate LLW and LLMW. There would be
sufficient management capacity to accommodate anticipated radioactive wastes. LLW and LLMW would be
shipped offsite for final disposal.
New Operations
SNL/CA anticipates no LLW and LLMW would be generated from new operations annually over the next 10 years.
Balance of Operations (Includes Maintenance and
Decommissioning and Decontaminating)
SNL/CA anticipates 5,110 kg per year of LLW and 451 kg
per year of LLMW would be generated from balance of
operations annually over the next 10 years. There would
be sufficient management capacity to accommodate projected radioactive wastes. Maintenance and D&D wastes
are not expected to impact SNL/CA waste management
operations.
Current Capacity
The total radioactive waste generated per year requiring
offsite disposal at licensed/approved facilities would not
exceed the existing storage and handling capacities at the
Radioactive Waste Storage Facility. Projections indicate
that radioactive waste throughput would remain constant.
SNL/CA routinely ships radioactive waste to various
Table 5-8. Average Annual Radioactive Waste
Generation under the No Action Alternative (in Kilograms)
Unit
5-Year Average
(1996 through 2000)
No Action Alternative
Existing Operations
kg
NR
198
New Operations
kg
NR
0
Balance of Operations
kg
NR
5,110
SNL/CA Total LLW
kg
5,308
5,308
0%
0%
All Waste
LLW
Percent Change
LLMW
Existing Operations
kg
NR
0
New Operations
kg
NR
0
Balance of Operations
kg
NR
451
SNL/CA Total LLMW
kg
451
451
0%
0%
Percent Change
Total All Radioactive Waste
Existing Operations
kg
NR
198
New Operations
kg
NR
0
Balance of Operations
kg
NR
5,561
SNL/CA Total
All Radioactive Waste
kg
5,759
5,759
0%
0%
Percent Change
Sources: SNL/CA 2002b; TtNUS 2002a
CY: calendar year
kg: kilograms
LLW: low-level waste
LLMW: low-level mixed waste
NR: not reported
Draft SNL/CA SWEA DOE/EA-1422—October 2002
5-17
Chapter 5, Environmental Consequences–Section 5.3, No Action Alternative
Table 5-9. Average Annual Generation by Specific Sandia National
Laboratories, California Facilities under the No Action Alternative (in Kilograms)
Facility
Calendar Year 2000
No Action Alternative
a
a
LLW
LLMW
Hazardous
LLW
LLMW
Hazardous
Combustion Research Facility (CRF)
0
0
2,444
0
0
2,444
Building 910
15
0
15,432
15
0
15,432
Building 914
0
0
1,741
0
0
1,741
Building 916
1.5
0
596
1.5
0
596
Building 927
0
0
4,182
0
0
4,182
Micro and Nano Technologies
Laboratory (MANTL)
0
0
7,109
0
0
7,109
Chemical and Radioactive
Detection Laboratory (CRDL)
13
0
1,169
13
0
1,169
Area 8 Facilities
168
0
814
168
0
814
Explosive Storage Area (ESA)
0
0
0
0
0
0
Hazardous and Radioactive
Waste Storage Facility
0
0
0
0
0
0
Subtotals Existing Facilities
198
0
33,487
198
0
33,487
LIGA Technologies Facility (LTF)
0
0
0
0
0
2,964
Distributed Information Systems
Laboratory (DISL)
0
0
0
0
0
0
Glass Furnace and Melting Laboratory
(part of the CRF)
0
0
0
0
0
50
Subtotals New Facilities
0
0
0
0
0
3,014
198
0
33,487
0
0
36,501
Existing Facilities
New Facilities
Totals All Facilities
Sources: SNL/CA 2002b; TtNUS 2002a
a
Includes RCRA Hazardous, California Toxic, TSCA, and biohazardous (MWMA)
LLW: low-level waste
LLMW: low-level mixed waste
RCRA: Resource Conservation and Recovery Act
TSCA: Toxic Substance Control Act
MWMA: Medical Waste Management Control Act
offsite governmental and commercial treatment and
disposal facilities. All waste is shipped to meet regulatory
requirements. Based on these projections and continued
operations at specific facilities under the No Action
Alternative, the radioactive waste generation impacts
would continue to be minimal.
5.3.9.2
Hazardous Waste
Existing Operations
The No Action Alternative total hazardous waste generation would remain constant for existing facilities, with
no changes for wastes generated annually. Under the No
Action Alternative, SNL/CA anticipates 36,501 kg per
year of hazardous waste generated by existing operations
through 2012 (Table 5-9). There would be sufficient management capacity to accommodate anticipated existing
5-18
operations total hazardous wastes. Projections for all
operations by waste type are presented in Table 5-10.
New Operations
SNL/CA anticipates annual generation of 3,014 kg
of hazardous waste by new operations over the next
10 years. The majority of the additional waste would
be due to the full implementation of LIGA wafer production operations (Table 5-9, 2,964 kg). New SNL/CA
operations would increase the annual total hazardous
waste at the site by 3.5 percent (Table 5-10).
Balance of Operations
During maintenance and D&D (as outlined in Section
2.3.3), SNL/CA would produce hazardous waste each
year. SNL/CA would continue to generate TSCA waste,
primarily PCBs and asbestos that are removed from transDraft SNL/CA SWEA DOE/EA-1422—October 2002
Chapter 5, Environmental Consequences–Section 5.3, No Action Alternative
Table 5-10. Average Annual Hazardous Waste Generated
under the No Action Alternative by Waste Type (in kilograms)
Unit
5-Year Average
(1996 through 2000)
No Action Alternative
kg
NR
8,659
kg
NR
779
Balance of Operations
kg
NR
13,957
SNL/CA Total RCRA
Hazardous
kg
22,616
23,395
0%
+3.4%
kg
NR
9,922
kg
NR
893
Balance of Operations
kg
NR
15,992
SNL/CA Total
California Toxic
kg
25,914
26,807
0%
+3.4%
kg
NR
14,695
kg
NR
1,323
Balance of Operations
kg
NR
22,365
SNL/CA Total TSCA
kg
38,383
39,706
0%
3.3%
kg
NR
211
kg
NR
19
Balance of Operations
kg
NR
340
SNL/CA Total Biohazardous
kg
551
580
0%
+3.3%
kg
NR
33,487
kg
NR
3,014
Balance of Operations
kg
NR
52,654
SNL/CA Total All Hazardous
waste
kg
87,464
90,488
0%
3.5%
All Waste
RCRA Hazardous Waste
Existing Operations
New Operations
a
Percent Change
California Toxic Waste
Existing Operations
New Operations
a
Percent Change
TSCA
Existing Operations
New Operations
a
Percent Change
Biohazardous Waste (includes MWMA)
Existing Operations
New Operations
a
Percent Change
Total All Hazardous Waste
Existing Operations
New Operations
a
Percent Change
Sources: SNL/CA 2002b; TtNUS 2002a
a
New operations include LTF, DISL, and Glass Furnace and Melting Laboratory
CY: calendar year
kg: kilograms
RCRA: Resource Conservation and Recovery Act
TSCA: Toxic Substances Control Act
MWMA: Medical Waste Management Act
NR: not reported
Draft SNL/CA SWEA DOE/EA-1422—October 2002
5-19
Chapter 5, Environmental Consequences–Section 5.3, No Action Alternative
formers and buildings. Projected hazardous waste
quantities for these activities are included in Table 5-10
as balance of operations. This work would directly affect
the quantity of TSCA waste requiring disposal.
occur because existing waste handling capabilities
are already in place.
Wastewater
Under the No Action Alternative, the balance of
operations would generate 52,654 kg out of a total of
90,488 kg annually of all hazardous waste.
Wastewater would range from approximately 12 to
19 M gal) annually compared to 15 million gallons in
CY2000. Sufficient disposal capacity would be available
(see Table 5-6).
Under the No Action Alternative, four buildings, totaling approximately 15,000 gsf (an estimated 100 tons or
100,000 kg of construction debris) would be demolished.
5.3.10 NOISE
Current Capacity
The total hazardous waste generated per year requiring
offsite disposal at licensed/approved facilities would not
exceed the existing storage and handling capacities at the
Hazardous Waste Storage Facility. Projections indicate
that an increase of 3.5 percent of hazardous waste generation would occur. SNL/CA routinely ships hazardous
waste to various offsite commercial disposal facilities. All
waste is shipped in less than one year to meet regulatory
requirements. Based on these projections and continued
operations at specific facilities under the No Action Alternative, the hazardous waste generation impacts would
be minimal.
5.3.9.3
All Other Wastes
SNL/CA operations also involve four additional waste
management activities discussed below.
Biohazardous (includes Medical
Waste Management Act) Waste
Under the No Action Alternative, biohazardous waste
generation would increase to 580 kg per year (see Table
5-10). The existing waste handling capabilities would be
adequate to accommodate this waste. Additional offsite
impacts would be minimal, because offsite disposal
capacity would continue to be sufficient.
Construction Waste
The construction of the LTF, DISL, and the Glass
Furnace and Melting Laboratory would generate 60 tons,
140 tons, and 8 tons of construction debris, respectively.
Since a typical roll off container handles 20 tons of debris,
the expected construction waste would be minimal. No
additional offsite impacts would occur, because offsite
disposal capacity would be sufficient.
Municipal Solid Waste
Site-wide solid waste generation trends at SNL/CA
would generally remain a function of total building area
and the number of employees. Under the No Action
Alternative, an estimated 247.5 metric tons is anticipated.
No appreciable onsite impacts to disposal facilities would
5-20
The No Action Alternative consists of the background
noise levels presented for the affected environment in
Section 4.12 Noise and operational contributions from
the following activities:
❍
LIGA Technologies Facility (LTF)
❍
Distributed Information Systems Laboratory (DISL)
❍
Glass Furnace and Melting Laboratory in the CRF
❍
D&D projects
The acoustical environment in and around SNL/CA
may be impacted during construction of these proposed
facilities.
Construction activities would generate noise produced
by heavy construction equipment, trucks, and power and
percussion tools. In addition, construction-related traffic
would increase along regional transportation routes. The
noise levels would be representative of levels at industrial
park sites.
Relatively high and continuous levels of noise in the
range 93 to 108 dBA would be produced by heavy
equipment operations during the site preparation phase
of construction. However, after this time, heavy equipment noise would become more sporadic and shorter
in duration. The noise from trucks, power tools, and
percussion would be sustained through most of the building construction and equipment installation activities.
Construction noise levels would gradually decrease to the
ambient background noise levels as construction neared
completion, after which ambient background noise levels
would return to preconstruction levels (55 to 65 dBA).
Table 5-11 presents peak attenuated noise levels expected during construction. At a distance of approximately
1,700 ft from the source, peak attenuated noise levels
from most construction equipment are within the background range of typically quiet outdoors and residential
areas.
Construction activities could affect the occupational
health of workers, but measures are in effect to ensure
that hearing damage to workers does not occur. These
measures include regulations contained within the
Draft SNL/CA SWEA DOE/EA-1422—October 2002
Chapter 5, Environmental Consequences–Section 5.3, No Action Alternative
Table 5-11. Peak Attenuated Noise Levels (dBA)
Expected from Operation of Construction Equipment
Source
Heavy Trucks
Distance from Source
Peak
Noise
Level
15 m
(50 ft)
30 m
(100 ft)
61 m
(200 ft)
100 m
(400 ft)
305 m
(1000 ft)
518 m
(1,700 ft)
762 m
(2,500 ft)
95
84 to 89
78 to 83
72 to 77
66 to 71
58 to 63
54 to 59
50 to 55
Dump trucks
108
88
82
76
70
62
58
54
Concrete mixer
108
85
79
73
67
59
55
51
Jackhammer
108
88
82
76
70
62
58
54
Scraper
93
80 to 89
74 to 82
68 to 77
60 to 71
54 to 63
50 to 59
46 to 55
Bulldozer
107
87 to 102
81 to 96
75 to 90
69 to 84
61 to 76
57 to 72
53 to 68
Generator
96
76
70
64
58
50
46
42
Crane
104
75 to 88
69 to 82
63 to 76
55 to 70
49 to 62
45 to 48
41 to 54
Loader
104
73 to 86
67 to 80
61 to 74
55 to 68
47 to 60
43 to 56
39 to 52
Grader
108
88 to 91
82 to 85
76 to 79
70 to 73
62 to 65
58 to 61
54 to 57
Dragline
105
85
79
73
67
59
55
51
Pile driver
105
95
89
83
77
69
65
61
Forklift
100
95
89
83
77
69
65
61
Source: DOE 2000e.
ft: foot/feet
Contractor Industrial Hygiene Program (DOE Order
5480.10) and Occupational Noise Exposure (29 CFR
Part 1910.95).
Worker protection against effects of noise exposure is
provided when the sound levels exceed those shown in
Table 5-12 when measured on the A scale of a standard
sound level meter at slow response. When workers are
subjected to sound exceeding those listed in Table 5-11,
administrative or engineered controls are used. If such
controls fail to reduce sound levels adequately, personal
protective equipment (for example, ear plugs) is provided
and used to reduce sound levels to within the levels
presented in Table 5-11.
5.3.11 HUMAN HEALTH AND WORKER SAFETY
Implementation of the No Action Alternative would
result in the human health and worker safety impacts
described in the following sections for normal operations
and accident conditions.
5.3.11.1 Radiological Health Effects
Radiation can cause a variety of health effects in people.
The major effects that environmental and occupational
radiation exposures could cause are delayed cancer fatalities, which are called latent cancer fatalities (LCFs)
because the cancer can take many years to develop
and cause death.
To relate a dose to its effect, DOE has adopted a dose-torisk conversion factor of 0.0004 latent cancer fatality per
Draft SNL/CA SWEA DOE/EA-1422—October 2002
Table 5-12. Permissible Noise Exposure
Duration Per Day, Hours
Sound Level dBA
Slow Response
8
90
6
92
4
95
3
97
2
100
1.5
102
1
105
½
110
0.25 or less
115
Source: 29 CFR Part 1910
Note: When the daily noise exposure is composed of two or more periods
of noise exposure of different levels, their combined effect should be considered rather than the individual effect of each. Exposure to impulsive or
impact noise should not exceed 140 decibel (dB) peak sound pressure level.
dBA: decibel, A-weighted sound levels
person-Roentgen equivalent, man (rem) for workers
and 0.0005 latent cancer fatality per person-rem for the
general population (NCRP 1993). The factor for the population is slightly higher, due to the presence of infants
and children who are believed to be more sensitive to
radiation than the adult worker population.
DOE uses these conversion factors to estimate the
effects of exposing a population to radiation. For example,
in a population of 100,000 people exposed only to background radiation (0.3 rem per year), DOE would calculate
15 LCFs per year caused by radiation (100,000 persons ×
5-21
Chapter 5, Environmental Consequences–Section 5.3, No Action Alternative
0.3 rem per year × 0.0005 latent cancer fatality per
person-rem).
Calculations of the number of LCFs associated with
radiation exposure might not yield whole numbers and,
especially in environmental applications, might yield
values less than 1. For example, if a population of 100,000
were exposed to a dose of 0.001 rem per person, the collective dose would be 100 person-rem, and the corresponding
number of LCFs would be 0.05 (100,000 persons × 0.001
rem × 0.0005 LCF per person-rem).
Vital statistics on mortality rates for 1997 (CDC 1998)
indicate that the overall lifetime fatality rate in the United
States (U.S.) from all forms of cancer is about 23.4 percent (23,400 fatal cancers per 100,000 deaths).
In addition to LCFs, other health effects could result
from environmental and occupational exposures to
radiation; these include nonfatal cancers among the exposed population and genetic effects in subsequent generations. Previous studies have concluded that these effects
are less probable than fatal cancers as consequences of
radiation exposure (NCRP 1993). Dose-to-risk conversion factors for nonfatal cancers and hereditary genetic
effects (0.0001 per person-rem and 0.00013 per personrem, respectively) are substantially lower than those for
fatal cancers. This SWEA presents estimated effects of
radiation only in terms of LCFs because that is the major
potential health effect from exposure to radiation. Estimates of nonfatal cancers and hereditary genetic effects
can be estimated by multiplying the radiation doses by
the appropriate dose-to-risk conversion factors for these
effects.
DOE expects minimal worker radiological health
impacts from the SNL/CA activities under the No Action
Alternative. The values for the No Action Alternative
were calculated assuming the number of radiation workers and their average annual radiation dose would be the
same as the average values for the past 3 years (Table
5-13). Table 5-13 presents estimated radiation doses for
the collective population of workers who would be directly involved in implementing the alternatives as well as
LCFs likely attributable to these doses.
The estimated number of LCFs listed in Table 5-13 for
the No Action Alternative can be compared to the projected number of fatal cancers from all causes. Population
statistics indicate that cancer caused 23 percent of the
deaths in the U.S. in 1997 (CDC 1998). If this percentage
of deaths from cancer continues, 23 percent of the U.S.
population would contract a fatal cancer from all causes.
Thus, in the population of 1,000 workers, 230 persons
would be likely to contract fatal cancers from all causes.
Under the No Action Alternative, the incremental impacts from SNL/CA operations would be small.
5-22
Table 5-13. Estimated Radiological Dose
and Health Impacts to Sandia National
Laboratories, California Workers for the
No Action Alternative (Based on 3-Year Average)
Health Impact
Collective involved worker
dose (person-rem)
Estimated increase in number
of latent cancer fatalities
No Action Alternative
0.85
a
-4
3.4 x 10
Sources: DOE 1999d, 2000d, 2001g, TtNUS 2002a
a
SNL/CA involved worker dose estimated at 11 percent of SNL lab-wide
totals in Table 4-15. Any increase in estimated radiation doses would be a
result of the increase in the number of radiation workers and not the result
of different exposure mechanisms or levels.
rem: Roentgen equivalent, man
5.3.11.2 Occupational Health and Safety
Table 5-14 provides estimates of the number of total
reportable cases (TRCs) and lost workday cases (LWCs)
that could occur under the No Action Alternative. The
projected injury rates are based on average historic SNL/
CA injury rates over a 3-year period from 1999 through
2001 (SNL 2001l, 2002a). These rates were then multiplied by the projected employment levels for each alternative to calculate the number of TRCs and LWCs under
each of the alternatives.
The TRC value includes work-related death, illness, or
injury that resulted in loss of consciousness, restriction
from work or motion, transfer to another job, or required
medical treatment beyond first aid. The data for LWCs
represent the number of workdays beyond the day of
injury or onset of illness that the employee was away
from work or limited to restricted work activity
because of an occupational injury or illness.
5.3.12 SOCIOECONOMICS
The implementation of the No Action Alternative would
result in no changes to the demographic characteristics,
economy, and community services in the ROI, as discussed below.
Table 5-14. Estimated Occupational Safety
Impacts to Sandia National Laboratories,
California Workers for the No Action Alternative
Worker Safety Parameters
Workforce
No Action Alternative
1,043 – 1,317
Total recordable cases of
accident or injury
43 – 54
Lost workday cases
10 – 13
Sources: SNL 2001i, 2002a
Draft SNL/CA SWEA DOE/EA-1422—October 2002
Chapter 5, Environmental Consequences–Section 5.4, Planned Utilization and Operations Alternative
5.3.12.1 Demographic Characteristics
The No Action Alternative would not likely result in any
noticeable change in existing demographic characteristics
within the ROI (Section 4.14.3). Overall expenditures
and employment at SNL/CA should remain relatively
constant over the next 10 years, which, in turn, would
tend to maintain demographic characteristics within
the ROI.
5.3.12.2 Economic Base
5.4
5.4.1
PLANNED UTILIZATION AND
OPERATIONS ALTERNATIVE
LAND USE AND VISUAL RESOURCES
The Planned Utilization and Operations Alternative
would include the No Action Alternative plus several
additional actions and would not affect existing land use
patterns or visual resources at SNL/CA. Sections 5.4.1.1
and 5.4.1.2 discuss impacts to these resource areas from
the Planned Utilization and Operations Alternative.
The No Action Alternative would not likely result in any
noticeable change in the existing economic base within
the ROI (Section 4.14.3) because employment levels and
research and development (R&D) activities are assumed
to remain the same as current levels. Additionally, the No
Action Alternative would have no effect on the amount
of expenditures for goods and services in the local and
regional economy. Overall expenditures and employment
should remain relatively constant.
5.4.1.1
5.3.12.3 Housing and Community Services
This alternative differs from the No Action Alternative
in that improvements would be made to Arroyo Seco.
These improvements would meet a number of needs,
mainly correcting the effects of past erosion, protecting
the SNL/CA site from future erosion and flooding, and
improving channel stability and the wildlife habitat.
These improvements would occur directly along the
arroyo channel and would not change current land use
plans. As part of the improvements to Arroyo Seco, storm
water drainage infrastructure throughout the site would
be improved, but this also would not change any land use
at the site. Thirty acres along the arroyo in the east buffer
zone would be managed as a wildlife reserve.
The No Action Alternative would not likely result in any
noticeable change in existing housing and community
services within the ROI (Section 4.14.3). Overall expenditures and employment at SNL/CA should remain relatively constant, which, in turn, would tend to maintain
housing availability, value, and levels of service. Contributory effects from other industrial and economic sectors
within the ROI should reduce or mask SNL/CA’s current
proportional impact.
5.3.13 ENVIRONMENTAL JUSTICE
The No Action Alternative would have no discernible
adverse impacts to land use and visual resources, water
resources, biological resources, cultural resources, air
quality, infrastructure, transportation, waste generation,
noise, or socioeconomics. Thus, no disproportionately
high and adverse impacts to minority or low-income
communities would be anticipated.
As presented in Section 5.3.11, SNL/CA operations
would have minimal potential to adversely affect human
health for offsite residents or onsite workers. Thus, no
disproportionately high and adverse impacts to minority
or low-income communities would be anticipated for this
resource area.
Based on the analyses of all the resource and topic areas,
impacts that would result during the course of normal
operations would not pose disproportionately high and
adverse health or environmental impacts on minority and
low-income populations. Table 5-15 provides a brief summary of potential impacts to each resource or topic area.
Final SNL/CA SWEA DOE/EA-1422—January 2003
Land Use
No impacts would occur to land use patterns at SNL/CA
under this alternative. The extent of DOE land available
for use by SNL/CA, 410 acres, would remain the same as
for the No Action Alternative. SNL/CA operations would
remain consistent with industrial research park uses and
would have no foreseeable effects on established land use
patterns or requirements.
Under the Planned Utilization and Operations Alternative, a Grant of Easement and Agreement would be made
with the landowner concerning the land along the SNL/
CA western boundary. Activities by the landowner would
be subject to the agreement, limitations, and disclosures.
Under this alternative, 93 acres of open space adjacent
to East Avenue and existing facility areas would be reserved for future construction of offices, facilities, support
buildings, associated infrastructure, paved areas (parking
areas, services areas, and sidewalks), roads, and for onsite
soil management (see Figure 5-5). Onsite soil management would involve placing dirt/fill from the Arroyo
Seco improvement, storm water projects, and construction projects in 25 of the 93 acres of open space. Locating
future construction projects near existing facilities would
minimize effects to land use. Construction in these areas
would be consistent with established land use patterns
at SNL/CA.
Under this alternative, 122 acres of open space would
be identified as undesignated. Construction of the new
5-23
Chapter 5, Environmental Consequences–Section 5.4, Planned Utilization and Operations Alternative
Table 5-15. Summary of Potential Environmental
Justice Impacts under the No Action Alternative
Resource or
Topic Area
Summarized Effect
Effect on
Resource or
Topic Area
(region of
influence)
Proportional Effect on:
Low-Income
Minority
Neighborhoods
Land Use and
Visual Resources
No changes in land use; minor changes in
developed areas of SNL/CA
Not adverse
Not adverse
Not adverse
Geology and Soils
SNL/CA activities are not anticipated to destabilize
slopes. Minimal deposition of contaminants to soils
and continued monitoring of existing contaminates.
Not adverse
Not adverse
Not adverse
Water Resources
and Hydrology
No significant adverse impacts are projected.
Not adverse
Not adverse
Not adverse
Biological
Resources
No significant adverse impacts are projected.
Not adverse
Not adverse
Not adverse
Cultural Resources
Lack of existing cultural resources.
Not adverse
Not adverse
Not adverse
Air Quality
Emissions would be below the most stringent
standards, which define the pollutant concentrations
below which there are no adverse impacts.
Not adverse
Not adverse
Not adverse
Infrastructure
All projected activities within capacities of
existing road and utility systems.
Not adverse
Not adverse
Not adverse
Not adverse
Not adverse
Not adverse
Material (Annual Shipments Radioactive,
Chemical, and Explosives): 33 trips
Waste (includes hazardous & radioactive):
76 shipments
Sanitary Waste: 52 shipments
Transportation
Commuter vehicles: 700 to 1,000 vehicles
SNL/CA Weekly Hazardous Materials Transports
(excluding waste): 1 to 3 outbound shipments per
week (Total of 33)
Supplier Weekly Hazardous Material Transports:
1 to 3 inbound shipments per week Total of 100
Waste Generation
All waste projections within capacities of existing
waste management operations.
Not adverse
Not adverse
Not adverse
Noise and
Vibration
Background noise levels would continue at
current levels from generators, air conditioners,
and ventilation systems. Temporary increases
during construction range from 50 to 70 dB)
Not adverse
Not adverse
Not adverse
Not adverse
Not adverse
Not adverse
Not adverse
Not adverse
Not adverse
Human Health
and Worker Safety
Socioeconomics
Total recordable cases of accident or injury:
43 – 54
Lost Workday Cases: 10 – 13
SNL/CA workforce: 1,043 – 1,317
SNL/CA total economic activity: 180 M
Sources: Original
dB: decibel
M: million
SNL/CA: Sandia National Laboratories, California
5-24
Final SNL/CA SWEA DOE/EA-1422—January 2003
Chapter 5, Environmental Consequences–Section 5.4, Planned Utilization and Operations Alternative
Sources: Original
Figure 5-5. Construction and Wildlife Areas
Sandia National Laboratories, California plans to change land use of open spaces
including setting aside 93 acres for future construction and 30 acres for wildlife
badge office on the western portion of SNL/CA would
be consistent with established land use and utilization
patterns, as explained under the No Action Alternative
(Section 5.3.1). Modifications to Building 916 would have
no impact on land use. With these changes, SNL/CA land
use and operations would remain consistent with industrial park uses and would have no foreseeable effects on
established land use patterns or requirements.
5.4.1.2
Visual Resources
The Planned Utilization and Operations Alternative
would not adversely change the overall appearance of
Final SNL/CA SWEA DOE/EA-1422—January 2003
the existing landscape, obscure views, or otherwise
detract from the scenic views from SNL/CA or from
areas adjacent to the site.
The 93 acres set aside for future construction and soil
management would be located near areas with a high
density of buildings and structures, thus any construction would blend with the existing built environment.
All construction would be consistent with campus-style
design and the guidelines presented in the Master Plan
(Royston et al. 1993). Increasing the size of the main
campus would have little effect on the scenic qualities
of the SNL/CA site. Improvements to Arroyo Seco and
5-25
Chapter 5, Environmental Consequences–Section 5.4, Planned Utilization and Operations Alternative
the designation of a wildlife reserve would improve the
scenic qualities of these areas.
5.4.2
GEOLOGY AND SOILS
As with the No Action Alternative, no impacts to general
geology and geologic resources are anticipated. Additionally, there would be no increase in the likelihood of impacts
from seismic activity.
The Arroyo Seco Improvement Plan would remove
4,000 to 5,000 cubic yards (yd3) of soil (clean dirt/fill)
per year to a 25-acre soil management area in the area
designated for future construction. Assuming even distribution over 25 acres, this would represent less than
a 1.5-inch elevation increase. The arroyo improvement
activities would require 30,000 to 60,000 yd3 of new fill,
rock, stone, and concrete (other materials would include
mulch, hay, topsoil, seed, plants, etc.). However, these
measures would improve the overall conditions of the
streambank, improve slope stability, and reduce soil
erosion.
Under the Planned Utilization and Operations Alternative, soil disturbed by construction would increase
above the No Action Alternative. A new building totaling
5,000 sq ft would be constructed. New parking and other
traffic controls (such as a bus turnaround) would require
8 acres. Upgrades to storm water runoff areas would be
beneficial in controlling erosion.
Activities at SNL/CA would increase by 13 percent above
the No Action Alternative, increasing the likelihood of a
spill or release to the environment; however, controls are
in place to minimize the potential for soil contamination
from any SNL/CA operations.
5.4.3
5.4.3.1
WATER RESOURCES AND HYDROLOGY
Water Resources and Hydrology
Impacts to water resources of the Planned Utilization and
Operations Alternative would not differ substantively
from impacts described in Section 5.3.3 for the No Action
Alternative. Impacts to groundwater quality and quantity
and surface water quality and quantity are described in
Sections 5.4.3.1, 5.4.3.2, 5.4.3.3, and 5.4.3.4 respectively.
5.4.3.2
Groundwater Quality
Section 5.3.3 identifies sources of groundwater contamination at SNL/CA. All groundwater quality impacts
described in Section 5.3.3.1 are alternative-independent.
The Planned Utilization and Operations Alternative
would not change the nature or extent of groundwater
contamination. No changes from current rate and scope
of the Environmental Restoration (ER) Program remediation activities (long-term monitoring) are projected for
the Planned Utilization and Operations Alternative.
5-26
5.4.3.3
Groundwater Quantity
Under the Planned Utilization and Operations Alternative, SNL/CA would not use groundwater for any portion
of its supply. Therefore, no effects to groundwater quantity would be expected.
5.4.3.4
Surface Water Quality
SNL/CA impacts to surface water quality are discussed
in Section 5.3.3.3. Under the Planned Utilization and
Operations Alternative, an additional 27.7 acres of impervious surface (an additional 56 percent) would be created.
This increase could to add to the quantity of pollutant
runoff. However, based on current monitoring data, pollutant concentrations in runoff have not been a concern.
The projected increase in impervious surface is unlikely
to increase pollutant concentrations to levels approaching
water quality standard limits. No effects to storm water
compliance would be anticipated.
5.4.3.5 Surface Water Quantity
Storm Water Runoff
SNL/CA impacts to surface water quality are discussed
in Section 5.3.3.4. Under the Planned Utilization and
Operations Alternative, an additional 27.7 acres of
impervious surface (an additional 56 percent) would
occur. This projected increase in impervious surface
would increase the quantity of storm water runoff
transported directly or indirectly into the Arroyo Seco.
Upgrades to the storm water runoff areas are planned
to correct existing erosion problems. The overall impact
to surface water quantity would be minimal.
Discharge to Sanitary Sewer
The estimated annual volume of water discharged to
the sanitary sewer under the Planned Utilization and
Operations Alternative would be 13.6 to 21.5 M gal
(based on a 13 percent increase in staff site-wide), an
8.8 percent increase from the No Action Alternative
(also the baseline). The current system capacity is
adequate to handle the increase (see Section 5.4.7).
SNL/CA policy prohibits the discharge of regulated
chemical wastes to the sanitary drain. The Wastewater
Management Program participates in laboratory planning activities and staff training so that proper wastewater disposal practices are implemented as soon as
the processes are online.
SNL/CA maintains a wastewater monitoring station in
the northwestern portion of the site. The sewer discharges
to the LLNL sewer system across East Avenue. Monitoring results are reported to the Livermore Wastewater
Reclamation Plant (LWRP) monthly in monthly wastewater discharge reports. This anticipated increase in discharge would have no detrimental effects to receptors
downstream of the site outfall.
Final SNL/CA SWEA DOE/EA-1422—January 2003
Chapter 5, Environmental Consequences–Section 5.4, Planned Utilization and Operations Alternative
5.4.4
BIOLOGICAL RESOURCES
Under this alternative, planned activities have the
potential to affect plant and animal species within the
boundaries of SNL/CA. Impacts would be minimal.
Facility construction would result in the loss of some
vegetation with a commensurate loss of wildlife habitat.
Any direct or indirect losses of animals would be very
small and some displaced animals may be able to occupy
adjacent, unoccupied habitat. A newly created 30-acre
wildlife reserve would include part of the Arroyo Seco
improvements (Figure 5-5). This wildlife reserve would
contribute to the preservation of plant and animal species
at SNL/CA and provide a valuable refuge for both plant
and animal species in the area.
Positive impacts to wetland areas and protected species
may occur. These impacts are discussed for the Arroyo
Seco Improvement Program, construction projects covered by the SWEA over the next 10 years, and installation maintenance operations.
5.4.4.1
Arroyo Seco Improvement Program
The Arroyo Seco is an ephemeral stream that runs
through the developed portion of the SNL/CA site. Most
of the channel is steep-sided, highly incised, with a trapezoidal to almost V-shaped cross section. Since establishment of SNL/CA in 1956, several bridges, security grates,
and utility pipe crossings have been placed in and across
Arroyo Seco. In the 1980s, additional arroyo modifications shortened and straightened the arroyo downstream
of C Street, resulting in an increase in the channel slope
and the amount of energy available for erosion of the
streambed and banks. The Arroyo Seco Management
Plan documented the resulting headcutting, or upstream
migration of streambed instability, that has contributed
to scouring in the bed and undercutting at structure
crossings and where the channel is lined (GMA 2002a).
During the past five years, several informal consultations between DOE Sandia Site Office (SSO) and USFWS
have discussed erosion control and streambed stability
projects on Arroyo Seco. As a consequence of these consultations, SNL/CA and DOE have implemented an integrated approach to address erosion and other streambed
instability issues for Arroyo Seco. The Arroyo Seco Management Plan identifies concepts
for active channel improvements and stream zone management that would reduce current flood and erosion
risk while providing additional and improved habitat
and migration conditions for protected species that may
use Arroyo Seco on SNL/CA property (GMA 2002a).
The management plan proposes 18 improvement tasks
that would provide riparian habitat enhancement.
Approximately 10 acres in and along the arroyo channel
would be affected by the tasks proposed in the Arroyo Seco
Final SNL/CA SWEA DOE/EA-1422—January 2003
Management Plan. About two acres identified for
improvement are located within designated critical
habitat for the California red-legged frog (GMA 2002a).
Disturbances would be of a short-term nature associated
with construction. Annual surveys for California
red-legged frogs conducted on SNL/CA property since
1996 detected no individuals of this species. However,
California red-legged frogs may use the Arroyo Seco as
a travel corridor during or after rain events in the winter
and spring (66 FR 14626). To avoid impacts to migrating
California red-legged frogs, activities proposed in the
Arroyo Seco Management Plan would be conducted during the dry season (that is, June 1 through September 30).
Annual surveys for California red-legged frogs would
continue at SNL/CA along the length of Arroyo Seco,
specifically targeting those locations where work would
be done during a particular year.
Erosion damage at 11 locations within the channel would
be repaired. Repair activities along the Arroyo Seco would
generally be beneficial to native vegetation, reducing soil
disturbance that is conducive to invasion by weed species,
and reducing episodic destruction of established vegetation during high flow events, thereby improving the site
for native riparian species (SAIC 2001a). Approximately
1,800 linear ft of floodplains would be constructed to
reduce flow velocities within the channel. Native riparian
vegetation would be planted at four locations along the
Arroyo Seco resulting in an additional 0.2 acres of riparian habitat (SNL/CA 2002c). Any improvements that
would result in increased water depth and plant cover
would increase the likelihood of California red-legged
frogs using the drainage as summer habitat or as a travel
corridor (SAIC 2001a). Five structures/ utility lines that
are obstructions for species migration would be removed
from the streambed. Debris that is an obstruction to species migration would also be removed from three locations
in the arroyo. Activities that remove obstructions and
debris from the arroyo drainage would increase its habitat
value for California red-legged frog and other ripariandependent species (SNL/CA 2002c).
In previous years, the California tiger salamander has
been found at SNL/CA in upland areas, at the LLNL
recharge basin located on the western side of the site, and
in a farm pond east of the site. However, no individuals
were found during a recent targeted survey (SAIC 2001a).
In a study of terrestrial habitat use by the tiger salamander, individual tiger salamanders showed no indication of movement along creeks or riparian vegetation
(Trenham 2001a). Additionally, this study showed that
95 percent of adult California tiger salamanders probably
stay within 568 ft of their breeding ponds. The closest
Arroyo Seco Management Plan activities would occur
approximately 820 ft from the recharge basin and approximately 980 ft from the farm pond (both of which are
outside the disturbance area of arroyo restoration activi5-27
Chapter 5, Environmental Consequences–Section 5.4, Planned Utilization and Operations Alternative
ties). Therefore, there should be no effect on the
California tiger salamander (SNL/CA 2002c).
5.4.4.2
Construction Projects
SNL/CA and DOE/SSO have identified approximately 93
acres of open grassland for future building construction,
construction-related activities, and infrastructure improvements (Figure 5-6). Construction-related ground
disturbance would occur in the area (SNL/CA 2002c).
Facility construction would result in the loss of some
vegetation with a commensurate loss of wildlife habitat.
Any direct or indirect losses of animals would be very
small and some displaced animals may be able to occupy
adjacent unoccupied habitat. Facility construction would
avoid loggerhead shrike nests (a Federal species of concern and California species of special concern) whose
locations have been monitored as shown in Figure 4-12.
Further, the western burrowing owl (a Federal species of
concern and California species of special concern) has
not been sighted since 1997 in proposed construction
or other areas of SNL/CA (SAIC 2001a).
At SNL/CA, 0.44 acres of the Arroyo Seco have been
determined to be jurisdictional wetlands (SAIC 1998a).
The use of standard soil erosion and sedimentation
control measures during the land disturbance phase of
new projects would ensure the protection of the wetland.
Depending on the amount of soil disturbed at a particular
time, the erosion control measures may require preparation of a storm water pollution prevention plan.
Of the 93 acres identified for construction and soil
management, 35 acres on the east side of the SNL/CA
site are located within designated critical habitat for the
California red-legged frog. The critical habitat area is
grassland with no surface water sources. The area does
not provide any permanent habitat for red-legged frogs
and is approximately 200 ft from the Arroyo Seco at its
closest location. The grassland area would be used by the
California red-legged frog as a dispersal habitat at night,
during the wet season (that is, October 1 through May
31). Facilities in the area would be low-density development and low-use roadways that should not create a
barrier to dispersal. Any new roads in the area would
be used primarily during daylight hours, with intermittent use by SNL/CA security (less than 30 cars per hour)
during the night. Low-density development and low-use
roadways are not considered barriers to dispersal for the
California red-legged frog (SNL/CA 2002c; 66 FR 14626).
Excess soil from construction and construction-related
activities potentially would be stockpiled on the eastern
side of the site, within designated critical habitat for the
California red-legged frog. These clean soils would include
native materials and may include some compacted fill and
topsoil.
5-28
Construction activities would be conducted during
the day, when California red-legged frogs are typically
not dispersing. Although construction activities would
be conducted within designated critical habitat for the
California red-legged frog, construction should not form
a barrier to dispersal and no permanent habitat sources
are present in the area.
Areas proposed for construction on the west side of
SNL/CA are outside designated critical habitat for the
California red-legged frog. However, approximately 24
acres are within 568 ft of the LLNL recharge basin,
where California tiger salamanders have been found in
the past. The area also contains numerous ground squirrel
burrows that may provide aestivation habitat for the tiger
salamander. Before ground disturbance within the 568-ft
zone noted above, each burrow would be surveyed for
tiger salamanders using an infrared optical probe. A
qualified field biologist would conduct the surveys and
provide oversight during excavation activities. Any tiger
salamanders found during the surveys would be relocated
to the closest area outside of the construction zone. With
implementation of this survey process, California tiger
salamanders are not expected to be adversely affected.
A Biological Assessment has been prepared. The biological assessment was submitted to the USFWS on July 19,
2002, and is currently under review by this agency.
5.4.4.3
Maintenance Operations
Maintenance activities within the undeveloped areas
of the site include mowing and herbicide use for fire
management. Grasslands at SNL/CA, including areas
within designated critical habitat for the California
red-legged frog and potential habitat for the California
tiger salamander, are mowed two or three times per year
to reduce the fuel load. Mowing occurs in the spring and
early summer and is done during daylight hours. For
areas that are inaccessible to a mower (near fence lines
and roadways), a water-soluble mixture of 2 percent
Round-Up herbicide is used to control vegetation.
Maintenance activities are conducted during daylight
hours when California red-legged frogs and California
tiger salamanders are typically not dispersing. Additionally, maintenance activities do not create barriers to dispersal within the critical habitat area (SNL/CA 2002c).
In the final rule listing the California red-legged frog
as threatened, the USFWS identified activities that
could potentially affect the species. Those activities
include mowing of wetland or riparian vegetation and
pesticide applications in violation of label restrictions
(61 FR 25813). DOE has placed a moratorium on disking
and rototilling for weed abatement in undeveloped areas
and the buffer zone to minimize impact to protected and
sensitive species (SNL/CA 2000a). Under current site
maintenance operations, no wetland or riparian vegetaFinal SNL/CA SWEA DOE/EA-1422—January 2003
Chapter 5, Environmental Consequences–Section 5.4, Planned Utilization and Operations Alternative
Source: SNL/CA 2002d
Figure 5-6. Future Construction and Maintenance
Activities at Sandia National Laboratories, California
Final SNL/CA SWEA DOE/EA-1422—January 2003
5-29
Chapter 5, Environmental Consequences–Section 5.4, Planned Utilization and Operations Alternative
tion is mowed. Round-Up is used in accordance with the
manufacturer’s guidelines in a dilute mixture. Individual
animals would not be sprayed, nor would areas within
the arroyo channel. For these reasons, it is concluded
that maintenance activities would not affect the California red-legged frog and the California tiger salamander.
5.4.5
5.4.6
The Planned Utilization and Operations Alternative
would have at 30 to 32 nonexempt emission sources
including:
❍
12 boilers (includes boiler for the
new badging facility)
❍
1 degreasers
❍
1 spray booth
❍
9 backup generators (may include 1 additional
backup generators for the new badging facility)
❍
1 mixer
❍
6 miscellaneous sources
CULTURAL RESOURCES
Planned Utilization and Operations Alternative would
have no impacts to cultural resources due to the lack of
prehistoric and Native American resources and historic
archaeological sites, the nature of the buildings and structures present, and compliance with applicable regulations
and established procedures for the protection and conservation of cultural resources located on lands administered
by the DOE.
The likelihood of potential impacts to buried archaeological sites would be greater under this alternative
than the No Action Alternative. This is due to increased
ground-disturbing activities under this alternative. In
addition to the LTF and DISL facilities identified in the
No Action Alternative, the Planned Utilization and Operations Alternative would include one new facility (the
new 5,000 sq ft badge office), the upgrade of storm water
runoff areas, and road construction and paved service and
parking areas. In addition, improvements to Arroyo Seco,
the development of the 30-acre wildlife reserve, and associated infrastructure would occur under this alternative,
although most of the ground-disturbing activities would
occur in areas that have been previously disturbed. Maintenance activities that require ground disturbance could
also result in the discovery of buried archaeological sites,
but again, compliance with regulations and procedures
would address any impacts. In all cases, compliance with
regulations and procedures would ensure any impacts
to cultural resources would be minimal by avoiding,
reducing, or mitigating the potential impacts.
AIR QUALITY
Based on a projected site-wide staff increase of 13 percent,
traffic emissions are estimated to increase 13 percent above
the No Action Alternative. Table 5-16 presents the criteria
pollutant emissions estimated for the Planned Utilization
and Operations Alternative.
Table 5-17 estimates the Planned Utilization and
Operations Alternative air toxics emissions, based
upon the maximum emission rate during the period
1996 through 2001. Comparison of the Planned Utilization and Operations Alternative air toxic emissions with
Bay Area air toxic emissions show that SNL/CA projects
toxic emissions are less than one percent of those for the
Bay Area.
Construction activities at SNL/CA could have short-term
adverse impacts due to emissions of criteria air pollutants
from construction worker traffic, construction equipment, and fugitive dust from earth-moving activities.
Under the Planned Utilization and Operation Alternative,
construction activities would include projects under the
Table 5-16. Criteria Pollutant Emission Rates for the Planned
Utilization and Operations Alternative (kilograms per year)
Planned Utilization and
a
Operations Alternative
Bay Area Emission
Year 2000
Percent Contribution
from SNL/CA
NA
57,900,000
NA
1,871
179,000,000
<1
NA
29,100,000
NA
Nitrogen Dioxide
3,741
214,000,000
<1
Carbon Monoxide
339 to 452
995,000,000
<1
Pollutant
Particulates
Volatile Organic Compounds
Sulfur Dioxide
Source: SNL/CA 2002b
Notes: Based on a 13% increase in Sandia National Laboratories, California staff
All Bay Area wide emissions except particulates are based on an average summer day multiplied by 365 days. Bay Area particulate
emissions are based on an average winter day multiplied by 365 days
a
Bay Area Air Quality Management District (BAAQMD) inventory is reported annually for period July to June
<: less than
NA = not available/not applicable
SNL/CA: Sandia National Laboratories, California
5-30
Final SNL/CA SWEA DOE/EA-1422—January 2003
Chapter 5, Environmental Consequences–Section 5.4, Planned Utilization and Operations Alternative
Table 5-17. Air Toxic Emission Rates for the Planned
Utilization and Operations Alternative (kilograms per year)
Planned Utilization and
Operations Alternativea
Bay Area Emission
Year 1999b
Percent Contribution
from SNL/CA
235.1
58,968
<1
5.5
771
<1
Ammonia
238.412
1,406,160
<1
Benzene
0.32
28,577
<1
Carbon tetrachloride
0.36
1,406
<1
Formaldehyde
3.4
81,648
<1
Methyl alcohol
681.77
276,696
<1
Methylene chloride
75.55
49,896
<1
Perchloroethylene
74.84
371,952
<1
Toluene
43.04
335,664
<1
Trichloroethylene
66.391
21,773
<1
Xylene
14.77
276,696
<1
Pollutant
1,1,1-trichloroethane
1,4-dioxane
Sources: TTNUS 2002a, SNL/CA 2002b
a
Based on maximum emission rate from 1996 through 2001
b
Bay Area Air Quality Management District (BAAQMD) inventory is reported annually for period July to June
<: less than
NA: not available/not applicable
SNL/CA: Sandia National Laboratories, California
No Action Alternative plus one new project. The fugitive
dust from construction could exceed PM10 concentration
standards if no dust control measures were implemented.
However, engineered controls, such as the application of
water or chemical dust suppressants and seeding of soil
piles and exposed soils, would minimize fugitive dust. It
is expected that PM10 concentrations would be within
all applicable standards.
Table 5-18 estimates construction-related CO emissions
for one typical project. It is expected that constructionrelated CO emissions would be within all applicable standards. Table 5-19 estimates the Arroyo Seco Improvement
CO emissions for a typical year of activities. This project
is anticipated to last 10 years.
The estimated number of daily commuter vehicles to
SNL/CA during FY 2001 was 700 to 1000. Under the
Planned Utilization and Operations Alternative, a 13-percent increase in daily commuter traffic would occur, resulting in 791 to 1130 vehicles. Increases of carbon monoxide
and nitrogen oxides, an ozone precursor, would occur with
the increase in commuter traffic. However, the EPA model
considers future vehicles will have lower emission rates
and more stringent inspection and maintenance programs,
actual emissions would be less than the baseline. In addition, the BAAQMD vehicle buy back program designed to
remove older vehicles from the road will continue and
contribute to the reduction in commuter vehicle emissions
(SNL/CA 2002b, TtNUS 2002a, BAAQMD 2001).
Final SNL/CA SWEA DOE/EA-1422—January 2003
Total carbon monoxide emissions are shown in
Table 5-20. Total carbon monoxide emissions for the
Planned Utilization and Operations Alternative would be
slightly below the 2000 baseline, well below the 100 tons
per year incremental increase above baseline that would
require a conformity determination. In addition, the total
carbon monoxide emissions for the Planned Utilization
and Operations Alternative were found to be less than
1 percent of the maintenance area’s emissions of carbon
monoxide. As a result, the NNSA has concluded that no
conformity determination is required for the Planned
Utilization and Operations Alternative.
5.4.7
INFRASTRUCTURE
The Planned Utilization and Operations Alternative
would increase demands on infrastructure over the
next 10 years (Table 5-21). Annual consumption of
water, electricity, and natural gas would be consistent
with recent historic levels (DOE 1992a; TtNUS 2002a).
Fluctuations in utility consumption rates would occur
due to annual changes in weather. Under the Planned
Utilization and Operations Alternative, the current
infrastructure would be capable of accommodating
SNL/CA facility requirements and no major additional
infrastructure facilities would be required.
5.4.8
TRANSPORTATION
Based on the current transportation data, the Planned
Utilization and Operations Alternative would increase the
5-31
Chapter 5, Environmental Consequences–Section 5.4, Planned Utilization and Operations Alternative
Table 5-18. Estimated Carbon Monoxide Emissions
Associated with Representative Construction Activities
Estimated Total
Annual Carbon
Monoxide
Emissions
(total tons
per year)
Total Annual
Hours of
Operation
Equipment
Emission
a
Factors
Estimated Total
Annual Carbon
Monoxide
Emissions (total
pounds per year)
7 Diesel Units
(trucks for transportation of materials
to site throughout life of construction
phase)
3528
(or 2 hours per day
each for 252 days)
0.11
388
0.194
8 Diesel Units (dozers, backhoes,
graders, dump trucks to grade and lay
foundation)
800
(or 5 hours per day
each for 20 days)
0.11
88
0.044
6 Diesel Units (forklifts, crane, front
end loader, other equipment for
construction of buildings)
10,584
(or 7 hours per day
each for 252 days)
0.11
1,164
0.582
14,912
N/A
1,640
0.82
24 Light Gasoline units (worker
personal vehicles, snack wagons,
light commercial vans)
6,048
(or 1 hour per day
each for 252 days)
0.48
2,903
1.451
2 Hand tampers
160
(or 4 hours per day
each for 20 days)
0.48
77
0.38
Total Gas units
6,208
N/A
2,980
1.49
1-Year Construction Activity
(assumes 21-work day
months or 252 days
Assumptions for Diesel Vehicles Emissions
Total Diesel units (21)
Assumptions for Gasoline Vehicles Emissions
Total Estimated CO Emissions
during Typical Construction Phase
4,620 pounds
2.31 tons
Source: DOE 2001f
a
Carbon Monoxide (CO) emission factors are based on the Environmental Protection Agency (EPA) National Vehicle and Fuel Emission
Laboratory (Ann Arbor, Michigan) average emission rates for idling vehicles. CO emissions for light-duty trucks are estimated at 219 grams per
hour, for heavy-duty gas vehicles at 245 grams per hour, and for heavy-duty diesel vehicles at 50 grams per hour. Calculations are based on
a conversion factor of 0.035 ounce per gram (grams x 0.035) divided by 16 (ounces per pounds) times hour’s operation divided by 2,000
(pounds per ton) to obtain tons/yr.
Table 5-19. Estimated Carbon Monoxide Emissions Associated
with Soil and Fill Material during Arroyo Seco Improvementa
Total
Annual
Operation
Equipment
Emission
b
Factors
Estimated Total
Annual Carbon
Monoxide
Emissions (total
pounds per year)
Estimated Total
Annual Carbon
Monoxide
Emissions (total
tons per year)
200 Diesel Units
trips (trucks for transportation of soil materials
from Arroyo Seco and associated locations
throughout SNL/CA to offsite location 20 miles
from site over next 10 years)
400 hours per year
(or 2 hours per trip
200 trips per year)
0.11
44
0.022
300 Diesel Units trips (trucks for transportation
of incoming material including rock, concrete,
and other fill soil materials for Arroyo Seco
and associated locations throughout SNL/CA
from offsite location 20 miles from site over
next 10 years)
600 hours per year
(or 2 hours per trip
300 trips per year)
0.11
66
0.033
Typical Year
(assumes 21-work day
months or 252 days
Assumptions for Diesel Vehicles Emissions
5-32
Final SNL/CA SWEA DOE/EA-1422—January 2003
Chapter 5, Environmental Consequences–Section 5.4, Planned Utilization and Operations Alternative
Table 5-19. Estimated Carbon Monoxide Emissions Associated
with Soil and Fill Material during Arroyo Seco Improvementa
Total
Annual
Operation
Equipment
Emission
b
Factors
Estimated Total
Annual Carbon
Monoxide
Emissions (total
pounds per year)
Estimated Total
Annual Carbon
Monoxide
Emissions (total
tons per year)
8 Diesel Units (dozers, backhoes, graders,
dump trucks to grade and lay foundation)
800
(or 5 hours per day
each for 20 days)
0.11
88
0.044
6 Diesel Units (forklifts, crane, front end
loader, other equipment for construction)
10,584
(or 7 hours per day
each for 252 days)
0.11
1,164
0.582
N/A
N/A
1,362
0.681
24 Light Gasoline units (worker personal
vehicles, snack wagons, light commercial vans)
6,048
(or 1 hour per day
each for 252 days)
0.48
2,903
1.451
2 Hand tampers
480
(or 4 hours per day
each for 60 days)
0.48
230
0.12
Total Gas units
6,208
N/A
3,133
1.57
Typical Year
(assumes 21-work day
months or 252 days
Assumptions for Diesel Vehicles Emissions
Total Diesel units (21)
Assumptions for Gasoline Vehicles Emissions
Total Estimated CO Emissions
during Improvement Phase
4,495 pounds
2.25 tons
Sources: SNL/CA 2001I, TtNUS 2002a
a
Assumed project would last for 10 years.
Carbon Monoxide (CO) emission factors are based on the Environmental Protection Agency (EPA) National Vehicle and Fuel Emission
Laboratory (Ann Arbor, Michigan) average emission rates for idling vehicles. CO emissions for light-duty trucks are estimated at 219 grams
per hour, for heavy-duty gas vehicles at 245 grams per hour, and for heavy-duty diesel vehicles at 50 grams per hour. Calculations are based
on a conversion factor of 0.035 ounce per gram (grams x 0.035) divided by 16 (ounces per pounds) times hours operation divided by
2,000 (pounds per ton) to obtain tons per year.
c
To bound the analysis, trucks transporting soil were assumed to ship to offsite locations. SNL/CA may manage some or all soil onsite.
SNL/CA: Sandia National Laboratories, California
b
Table 5-20. Carbon Monoxide Emissions from Sandia National Laboratories, California under the
Planned Utilization and Operations Alternative (tons per Year) and Calendar Year 2000 (baseline)
Stationary Sources
Mobile Sources
Construction Activities
Total
Planned Utilization and Operations Alternative
0.45
208
6.9
a
219.0
0.4
214
6.9
a
221.3
Baseline
Source: EPA 1995
Notes: Mobile Source Emission Factors assumptions Baseline (2000) 24.77 grams per mile, the No Action Alternative (2005) 21.29 grams per
mile, 1,000 to 1,130 vehicles, 30-mile trip, average speed 35 miles per hour.
a
Assumed two typical construction projects each year (2.31 tons per project) plus the Arroyo Seco project (2.25 tons per year).
amount of highway and pedestrian infrastructure within
SNL/CA by approximately 56 percent (Table 5-22).
The number of truck shipments from SNL/CA would
increase by 538 vehicles per year (11 per week) from the
No Action Alternative. Of these 200 would be hauling
soil. The number of commuter vehicles would increase by
approximately 91 to 130. The increased number of shipFinal SNL/CA SWEA DOE/EA-1422—January 2003
ments and the increase in employee vehicles would not
represent substantial increases in the number of vehicles
on the road by virtue of the area’s projected population
growth and would have no significant impact on the region. Based on the relatively small number of additional
vehicles, the potential for accidents should be no different
from current conditions.
5-33
Chapter 5, Environmental Consequences–Section 5.4, Planned Utilization and Operations Alternative
Table 5-21. Annual Sandia National Laboratories, California Utility Usage
and Capacities under the Planned Utilization and Operations Alternative
Planned Utilization and
Operations Alternative
System Capacity
Usage as Percent
of Capacity
Water Use
56.5 to 67.8 M gal
922 M gal
6 to 7
Wastewater Discharge
13.6 to 21.5 M gal
81 M gal
17 to 27
39,850 MWh
239,000 MWh
17
Utility
Electrical Use
Natural Gas Use
94 M ft
3
430 M ft
3
22
Source: TtNUS 2002a, Royer 2002
3
ft : cubic feet
M gal: millions of gallons
MWh: megawatt hour
Table 5-22. Transportation Activities under the Planned Utilization and Operations Alternative
Activity
Paved and unpaved road
Pedestrian mall
No Action
Alternative
Planned Utilization and
Operations Alternative
Change from
No Action Alternative
6.2 miles
9.7 miles
+3.5 miles
4 acres
6.24 acres
+2.24 acres
Paved service areas
5.5 acres
8.6 acres
3.1 acres
Paved service parking
12.7 acres
19.8 acres
+7.1 acres
33 trips
37 trips
+4 trips
Waste (includes hazardous &
radioactive)
76 shipments
86 shipments
+10 shipments
Sanitary Waste
52 shipments
59 shipments
+7 shipments
SNL/CA Weekly Hazardous
Materials Transports
(excluding waste)
1 to 3 outbound
shipments per week
(Total of 33)
1 to 3 shipments
(Total of 37)
+4 shipments
Supplier Weekly Hazardous
Material Transports
1 to 3 inbound
shipments per week
(Total of 100)
1 to 3 shipments
(Total of 113)
+13 shipments
Soil Transports
NR
1,600 to 2,000 shipments
over 10 Years
+200 shipments
Incoming Material
(Rock, Soil, Concrete)
NR
1,500 to 3,000 shipments
over 10 Years
+300 shipments
700 to 1,000 vehicles
791 to 1,130 vehicles
+91 to 130 vehicles
Material (Annual Shipments
Radioactive, Chemical, and
Explosives)
Site-Related Traffic Total Daily traffic
Source: TtNUS 2002a
NR: not reported
5.4.9
WASTE GENERATION
The Planned Utilization and Operations Alternative
would not cause any major changes in the types of
waste streams generated onsite. Waste generation levels
at SNL/CA would increase, consistent with 13 percent
increases in laboratory operations. However, existing
waste minimization and pollution prevention measures
would control the extent of the waste generation increase.
Under the Planned Utilization and Operations Alternative, waste projections used for analysis would not exceed
existing waste management capacities.
5-34
Waste generation would be expected to increase by
13 percent above the 5-year average under the Planned
Utilization and Operations Alternative. For specific
facilities, the CY 2000 waste generation data were considered and increased or decreased based on the individual facility staffing projections. Existing operations wastes
are considered to be derived from mission-related work.
New operations are discussed separately in order to show
the maximum likely existing operational increases. The
projected totals would be below recent highs experienced
within the last five years (see Tables 4-10 and 4-11).
Final SNL/CA SWEA DOE/EA-1422—January 2003
Chapter 5, Environmental Consequences–Section 5.4, Planned Utilization and Operations Alternative
5.4.9.1
Radioactive Wastes
Balance of Operations (Maintenance and
Decontamination and Decommissioning)
Existing Operations
The Planned Utilization and Operations Alternative would
generate LLW and LLMW but not TRU waste or high-level
waste. Projections for radioactive waste generation for all
operations are shown in Table 5-23. Projections for radioactive waste generation at specific facilities from new and
existing operations are shown in Table 5-24.
SNL/CA anticipates a 13 percent increase in the generation of LLW from all operations over the next 10 years.
LLMW generation would increase by 13 percent for all
operations through 2012. There would be sufficient management capacity to accommodate anticipated radioactive
wastes. LLW and LLMW are shipped offsite for final
disposal.
New Operations
New Operations would not generate LLW and LLMW
(Tables 5-23 and 5-24).
SNL/CA anticipates 5,998 kg per year of LLW and 510 kg
per year of LLMW would be generated from balance of
operations over the next 10 years (Table 5-23). There
would be sufficient management capacity to accommodate projected radioactive wastes. Maintenance and D&D
wastes are not expected to impact SNL/CA waste management operations.
Current Capacity
The total radioactive waste generated per year requiring offsite disposal at licensed/approved facilities would
not exceed the existing storage and handling capacities
at the Radioactive Waste Storage Facility. Projections
indicate that radioactive waste throughput would increase
by 13 percent. SNL/CA routinely ships radioactive waste
to various offsite governmental and commercial treatment
and disposal facilities. All waste is shipped to meet regulatory requirements. Based on these projections and contin-
Table 5-23. Average Annual Radioactive Waste Generation under the
Planned Utilization and Operations Alternative (in kilograms)
Unit
5-Year Average
a
(1996 to 2000)
Planned Utilization and
Operations Alternative
Existing Operations
kg
198
156
New Operations
kg
0
0
Balance of Operations
kg
5,110
5,842
SNL/CA Total LLW
kg
5,308
5,998
0%
+13.0%
0
0
All Waste
LLW
Percent Change
LLMW
Existing Operations
kg
New Operations
kg
0
0
Balance of Operations
kg
451
510
SNL/CA Total LLMW
kg
451
510
0%
+13.1%
Percent Change
Total All Radioactive Waste
Existing Operations
kg
198
156
New Operations
kg
0
0
Balance of Operations
kg
5,561
6,352
SNL/CA Total All Radioactive
Waste
kg
5,759
6,508
0%
+13.0%
Percent Change
Sources: SNL/CA 2002b; TtNUS 2002a
a
5-year average represents the No Action Alternative excluding new facilities
%: percent
LLW: low-level waste
LLMW: low-level mixed waste
SNL/CA: Sandia National Laboratories, California
Final SNL/CA SWEA DOE/EA-1422—January 2003
5-35
Chapter 5, Environmental Consequences–Section 5.4, Planned Utilization and Operations Alternative
Table 5-24. Average Annual Generation by Specific Sandia National Laboratories,
California Facilities under the Planned Utilization and Operations Alternative (in kilograms)
Planned Utilization and
Operations Alternative
Calendar Year 2000
Facility
LLW
LLMW
Hazardousa
LLW
LLMW
Hazardousa
Combustion Research
Facility (CRF)
0
0
2,444
0
0
2,933
Building 910
15
0
15,432
19
0
19,289
Building 914
0
0
1,741
0
0
1,741
Building 916
1.5
0
596
2.3
0
912
Building 927
0
0
4,182
0
0
6,273
Micro and Nano
Technologies Laboratory
(MANTL)
0
0
7,109
0
0
8,673
Chemical and Radioactive
Detection Laboratory
(CRDL)
13
0
1,169
68
0
6,135
Area 8 Facilities
168
0
814
67
0
326
Explosives Storage
Area (ESA)
0
0
0
0
0
0
Hazardous and Radioactive
Waste Storage Facilities
0
0
0
0
0
0
Subtotals Existing Facilities
198
0
33,487
156.3
0
46,282
LIGA Technologies
Facility (LTF)
0
0
0
0
0
2,964
Distributed Information
Systems Laboratory (DISL)
0
0
0
0
0
0
Glass Furnace and Melting
Laboratory (part of the CRF)
0
0
0
0
0
50
Subtotals New Facilities
0
0
0
0
0
3,014
198
0
33,487
156.3
0
49,296
Existing Facilities
New Facilities
Total All Facilities
Sources: SNL/CA 2002b; TtNUS 2002a
a
Includes RCRA Hazardous, California Toxic, TSCA, and biohazardous (MWMA)
LLW: low-level waste
LLMW: low-level mixed waste
RCRA: Resource Conservation and Recovery Act
TSCA: Toxic Substances Control Act
MWMA: Medical Waste Management Control Act
ued operations at specific facilities under this alternative,
the radioactive waste generation impacts would continue
to be minimal.
capacity to accommodate anticipated operations total
hazardous wastes. Projections for specific facilities for
existing operations are presented in Table 5-24.
5.4.9.2
New Operations
Hazardous Waste
Existing Operations
The Planned Utilization and Operations Alternative total
hazardous waste generation would increase for existing
facilities. Under the Planned Utilization and Operations
Alternative, SNL/CA anticipates 98,833 kg per year of
hazardous waste through 2012. There would be sufficient
5-36
SNL/CA anticipates annual generation of 3,014 kg
of hazardous waste by new operations over the next
10 years. The majority of the additional waste would be
due to the full implementation of LIGA wafer production
operations (Table 5-24, 2,964 kg/yr). New SNL/CA
operations would account for three percent of the total
hazardous waste at the site (Table 5-25).
Final SNL/CA SWEA DOE/EA-1422—January 2003
Chapter 5, Environmental Consequences–Section 5.4, Planned Utilization and Operations Alternative
Table 5-25. Average Annual Hazardous Waste Generation under the
Planned Utilization and Operations Alternative (in kilograms)
Unit
5-Year Average
(1996 through 2000)a
Planned Utilization and
Operations Alternative
Existing Operations
kg
8,659
11,967
New Operations
kg
0
779
Balance of Operations
kg
13,178
12,809
SNL/CA Total
RCRA Hazardous
kg
22,616
25,556
0%
+13.0%
All Waste
RCRA Hazardous Waste
Percent Change
California Toxic Waste
Existing Operations
kg
9,922
13,713
New Operations
kg
0
893
Balance of Operations
kg
15,099
14,677
SNL/CA Total
California Toxic
kg
25,914
29,283
0%
+13.0%
Percent Change
TSCA
Existing Operations
kg
14,695
20,310
New Operations
kg
0
1,323
Balance of Operations
kg
22,365
21,739
SNL/CA Total TSCA
kg
38,383
43,372
0%
+13.0%
Percent Change
Biohazardous (includes MWMA waste)
Existing Operations
kg
211
292
New Operations
kg
0
19
Balance of Operations
kg
321
312
SNL/CA Total Biohazardous
kg
551
623
0%
+13.0%
Percent Change
Total All Hazardous Waste
Existing Operations
kg
33,487
46,282
New Operations
kg
0
3,014
Balance of Operations
kg
50,963
49,538
SNL/CA Total All Hazardous
waste
kg
87,464
98,834
0%
+13.0%
Percent Change
Sources: SNL/CA 2002b; TtNUS 2002a
a
5-year average represents the No Action Alternative excluding new facilities
kg: kilograms
MWMA: Medical Waste Management Control Act
RCRA: Resource Conservation and Recovery Act
SNL/CA: Sandia National Laboratories, California
TSCA: Toxic Substances Control Act
Balance of Operations (Maintenance and
Decontamination and Decommissioning)
During maintenance and D&D, SNL/CA would produce
hazardous waste (includes construction debris) each year.
Final SNL/CA SWEA DOE/EA-1422—January 2003
Projected hazardous waste quantities for these activities
are included in Table 5-25 as balance of operations. This
work would directly impact the quantity of TSCA waste
requiring disposal. SNL/CA would generate TSCA waste,
5-37
Chapter 5, Environmental Consequences–Section 5.4, Planned Utilization and Operations Alternative
primarily PCBs and asbestos that are removed from transformers and buildings. Assuming that up to 20,000 gsf
would be removed, D&D activities would generate
133 tons of debris.
Current Capacity
The total hazardous waste generated per year requiring
offsite disposal at licensed/approved facilities would not
exceed the existing storage and handling capacities at the
Hazardous Waste Storage Facility. Projections indicate
that an increase of 13 percent of total hazardous waste
generation would occur. SNL/CA routinely ships hazardous waste to various offsite commercial disposal facilities.
All waste is shipped in less than one year to meet regulatory requirements. Based on these projections and continued operations at specific facilities under the Planned
Utilization and Operations Alternative, the hazardous
waste generation impacts would be minimal.
5.4.9.3
All Other Wastes
SNL/CA operations also involve four additional waste
management activities discussed below.
Biohazardous (Medical Waste Management Act) Waste
Under the Planned Utilization and Operations Alternative, biohazardous waste generation would increase from
551 kg/yr to 623 kg/yr (see Table 5-25). The existing waste
handling capabilities would be adequate to accommodate
this waste. No additional offsite impacts would occur,
because offsite disposal capacity would be sufficient.
Construction Waste
Under the Planned Utilization and Operations Alternative, construction debris would include the construction
of facilities identified in the No Action Alternative (LTF,
60 tons; DISL, 140 tons; and Glass Furnace and Melting
Lab, 8 tons) plus the new badge office (10 tons). Since a
typical roll off container handles 20 tons of debris, the
expected construction waste would be minimal. No
additional offsite impacts would occur, because offsite
disposal capacity would be sufficient.
Municipal Solid Waste
Under the Planned Utilization and Operations Alternative, an estimated 279.7 metric tons would be generated
annually. No appreciable impacts to disposal facilities
would occur because existing waste handling capabilities
are already in place.
Wastewater
SNL/CA would generate approximately 13.6 to 21.5 M gal
of wastewater annually compared to 15 million gallons in
CY2000. Sufficient disposal capacity would be available
(see Table 5-21).
5-38
5.4.10 NOISE
Under the Planned Utilization and Operations Alternative, activities at SNL/CA would increase beyond
current land uses and planned facility operations for
all facilities in support of SNL/CA’s assigned missions.
The increase would include ongoing and planned Arroyo
Seco improvements, land use changes, and new facility
construction and upgrades, where detailed design and
associated NEPA documentation are not expected to
be complete before the Final SWEA is approved.
Noise levels under the Planned Utilization and Operations Alternative are similar to those described under
the No Action Alternative. During the site preparation
phase of construction of new facilities, relatively high
and continuous levels of noise in the range 93 to
108 dBA would be produced by heavy equipment
operations. Upon completion of construction activities,
noise levels would return to preconstruction levels
(55 to 65 dBA).
5.4.11 HUMAN HEALTH AND WORKER SAFETY
The Planned Utilization and Operations Alternative
would result in the human health and worker safety
impacts described in the following sections for radiological health and occupational health and safety.
5.4.11.1 Radiological Health Effects
Under the Planned Utilization and Operations Alternative, NNSA expects minimal worker radiological health
impacts from the SNL/CA activities. The values for
this alternative were calculated assuming the number
of radiation workers and their average annual radiation
dose would be the same as for the past 3 years. In addition, NNSA assumed that the ratio of radiation workers
to total employees and the average radiation dose to these
workers would remain constant. Table 5-26 presents
estimated radiation doses for the collective population of
workers who would be directly involved in implementing
the alternative as well as LCFs likely attributable to these
doses.
The estimated number of LCFs listed in Table 5-26
for the Planned Utilization and Operations Alternative
can be compared to the projected number of fatal cancers from all causes. Population statistics indicate that
cancer caused 23 percent of the deaths in the U.S. in
1997 (CDC 1998). If this percentage of deaths from
cancer continues, 23 percent of the U.S. population
would contract a fatal cancer from all causes. Thus,
in the population of 1,222 workers, 284 persons would
be likely to contract fatal cancers from all causes. In
all cases, the incremental impacts from SNL/CA
operations would be small.
Final SNL/CA SWEA DOE/EA-1422—January 2003
Chapter 5, Environmental Consequences–Section 5.4, Planned Utilization and Operations Alternative
Table 5-26. Estimated Radiological Dose and Health Impacts
to Sandia National Laboratories, California Workers by Alternative
Health Impact
No Action Alternative
Collective involved worker dose
(person-rem)
0.85
Estimated increase in number of latent
cancer fatalities
Planned Utilization
and Operations Alternative
a
1.0
-4
3.4 x 10
-4
4.0 x 10
Sources: DOE 1999d, 2000d, 2001g, TtNUS 2002a
a
SNL/CA involved worker dose estimated at 11 percent of SNL lab-wide totals in Table 4-15. Any increase in estimated radiation doses
would be a result of the increase in radiation workers and not the result of different exposure mechanisms or levels.
rem: Roentgen equivalent, man
5.4.11.2 Occupational Health and Safety
in from areas outside of the ROI, the population increase
not realized by the ROI would represent an extremely
small percentage (far less than one percent) of the
2000 ROI population as a whole.
Table 5-27 estimates the number of TRCs and LWCs
that could occur under the Planned Utilization and
Operations Alternative. The projected injury rates are
based on an average historic SNL/CA injury rates over
a 3-year period from 1999 through 2001 (DOE 2002b).
These rates were then multiplied by the anticipated
workforce levels for this alternative to calculate the
number of TRCs and LWCs.
5.4.12.2 Economic Base
The TRC value includes work-related death, illness, or
injury that resulted in loss of consciousness, restriction
from work or motion, transfer to another job, or required
medical treatment beyond first aid. The data for LWCs
represent the number of workdays beyond the day of
injury or onset of illness that the employee was away
from work or limited to restricted work activity
because of an occupational injury or illness.
5.4.12 SOCIOECONOMICS
The Planned Utilization and Operations Alternative
would result in no appreciable impacts to demographic
characteristics, economy, and community services in
the ROI, as discussed below.
5.4.12.1 Demographic Characteristics
The Planned Utilization and Operations Alternative
would not be likely to have any noticeable change in
existing demographic characteristics within the ROI
(Section 4.14.3). Under this Alternative, employment
is expected to increase by 179 workers. Assuming, for a
conservative analysis, that all employees would migrate
The Planned Utilization and Operations Alternative
would not be likely to have a noticeable change in the
existing economic base in the ROI (Section 4.14.3).
Table 5-28 presents the direct and indirect impacts
SNL/CA operations currently (FY 2000) have on the
economy of the ROI. Table 5-29 presents the direct and
indirect impacts SNL/CA’s Planned Utilization and
Operations Alternative operations would have on the
2000 economy. (In order to provide a more conservative
estimate of the impact of this alternative, a comparison
is being made between Planned Utilization and Operations Alternative expenditures and FY 2000 economic
indicators.) As the data indicate, SNL/CA’s 2000 payroll
expenditures represent only 0.1 percent of the total personal income for the ROI. Additionally, SNL/CA’s
2000 employment represents only 0.2 percent of the
1,455,700 individuals currently employed in the ROI.
SNL/CA estimates that the Planned Utilization and
Operations Alternative will require 1,497 (including
contract employees) employees and $170.3 million in
total operating expenditures. From 1998-2000, SNL/CA
payroll expenditures represented an average of 51 percent
of the total operating budgets. Therefore, SNL/CA estimates payroll expenditures under the Planned Utilization
and Operations Alternative at $86.9 million. This represents a $13 million increase in payroll expenditures (over
Table 5-27. Estimated Occupational Safety Impacts to Sandia National Laboratories, California Workers
Worker Safety Parameters
Workforce
No Action Alternative
Planned Utilization and
Operations Alternative
1,043 – 1,317
1,222 – 1496
Total recordable cases of accident or
injury
43 – 54
Lost workday cases
10 – 13
50 – 61
12 – 15
Sources: SNL 2001i, 2002a
Final SNL/CA SWEA DOE/EA-1422—January 2003
5-39
Chapter 5, Environmental Consequences–Section 5.4, Planned Utilization and Operations Alternative
Table 5-28. Sandia National Laboratories, California’s Current Impact on the Regional Economy
FY 2000
Economic Measure
SNL/CA
Total ROI
Percent of ROI
$108,376.8
0.1
1,455,700
0.2
Earnings (Income) ($Millions)
Wages and Salaries
74.3
Indirect and Induced
47.6
121.9
TOTAL EARNINGS
Earnings Multiplier:
1.64 (2002)
Employment (Number of Workers)
SNL/CA Workforce
1,317
Indirect and Induced
1,264
2,581
TOTAL EMPLOYMENT
Employment Multiplier: 1.96 (2002)
Sources: BEA 2000b, BEA 2002a
FY: fiscal year
ROI: region of influence
SNL/CA: Sandia National Laboratories, California
Table 5-29. Sandia National Laboratories, California’s Estimate of Planned
Utilization and Operations Alternative Impacts on the Regional Economy
Planned Utilization and Operations Alternative
Economic Measure
SNL/CA
Total ROI
Percent of ROI
$108,376.8
0.1
1,455,700
0.2
Estimated Earnings (Income) ($Millions)
Wages and Salaries
86.9
Indirect and Induced
55.6
142.5
TOTAL EARNINGS
Earnings Multiplier:
1.64 (2002)
Employment (Number of Workers)
SNL/CA Workforcea
1,496
Indirect and Induced
1,436
TOTAL WORKFORCE
2,932
Employment Multiplier: 1.96 (2002)
Source: BEA 2000b, BEA 2002a
a
Employment would range from 1,222 to 1,496 workers.
ROI: region of influence
SNL/CA: Sandia National Laboratories, California
the No Action Alternative). The Planned Utilization and
Operations Alternative expenditures combined with indirect and induced expenditures would total $142.5 million
and would continue to represent 0.1 percent of the personal income in the ROI for the year 2000. Additionally,
a total workforce of 2,932 persons (direct, indirect, and
induced) would represent 0.2 percent of the 2000 employment level in the ROI.
and community services within the ROI (Section 4.14.3).
Assuming one housing unit per additional employee,
179 housing units would be required. This numbers
represents 0.5 percent of the housing stock available in
the ROI. Therefore, ROI capacity would far exceed demand. Additionally, contributory effects from other
industrial and economic sectors within the ROI would
greatly reduce or mask the SNL/CA proportional impact.
5.4.12.3 Housing and Community Services
5.4.13 ENVIRONMENTAL JUSTICE
The Planned Utilization and Operations Alternative
would not create a noticeable change in existing housing
The impacts of this alternative on environmental justice
resources would be substantially the same as those associ-
5-40
Final SNL/CA SWEA DOE/EA-1422—January 2003
Chapter 5, Environmental Consequences–Section 5.5, Maximum Operations Alternative
ated with the No Action Alternative. For a summary of
potential environmental justice impacts under the No
Action Alternative, see Table 5-15.
5.5
5.5.1
MAXIMUM OPERATIONS ALTERNATIVE
LAND USE AND VISUAL RESOURCES
Implementing the Maximum Operations Alternative
would not affect existing land use patterns or visual
resources at SNL/CA. Sections 5.5.1.1 and 5.5.1.2
discuss these resource areas in relation to the Maximum
Operations Alternative.
5.5.1.1
Land Use
No changes would occur to land use patterns at SNL/CA
under this alternative. The extent of DOE land available
for use by SNL/CA, 410 acres, would remain the same.
SNL/CA operations would remain consistent with industrial research park uses and would not change established
land use patterns or requirements.
Under this alternative, Building 916 would be replaced
with a new building twice as big, and a new R&D building would be constructed. Both would be constructed
within the 93 acres designated for new construction,
thus there would be no impact to overall site land use,
as explained in Section 5.4.1. Completion of these facilities would be consistent with the existing environment.
In addition, the functions of these buildings would be
consistent with those surrounding them. Structures no
longer determined to be economically useful potentially
would be vacated and removed (up to 100,000 sq ft).
These existing structures are located throughout the
SNL/CA and their removal would not impact land use.
5.5.1.2
Visual Resources
The Maximum Operations Alternative would not
adversely change the overall appearance of the existing
landscape, obscure views, or otherwise detract from the
scenic views of SNL/CA or from areas adjacent to the site.
A new Building 916 and a new R&D building would be
constructed within the 93-acre construction area, and
would be expected to have no impacts to visual resources.
All construction would be consistent with campus-style
design and the guidelines presented in the Master Plan
(Royston et al. 1993). Although construction in this area
increases the size of the main campus, it would have little
or no effect on the scenic qualities of the SNL/CA site.
Removal of facilities and structures would tend to
improve the visual characteristics of the site.
5.5.2
GEOLOGY AND SOILS
As with the No Action Alternative, no impacts to general
geology and geologic resources are anticipated. Additionally,
Final SNL/CA SWEA DOE/EA-1422—January 2003
there would be no increase in the likelihood of impacts from
seismic activity.
For a discussion regarding the Arroyo Seco Improvement
Plan and the placement of the soil on a 25-acre part of the
93-acre future construction areas, see Section 5.4.2.
Construction activities would result in the construction
of two new buildings totaling 100,000 sq ft. D&D activities would potentially remove 100,000 sq ft of facilities
determined to be no longer economically useful. While
these activities would disturb soil, these areas are part
of the existing industrial park and the land would be
used again for future construction; no impacts would
be expected. Additionally, upgrades to storm water
runoff areas would be beneficial.
In general, activities at SNL/CA would increase by
53 percent (derived from the increase in workforce)
above the No Action Alternative. There would be a proportional increase in the likelihood of a spill or release to
the environment; however, industry accepted controls are
in place to minimize the potential for soil contamination
from any SNL/CA operations.
5.5.3
WATER RESOURCES AND HYDROLOGY
The impacts of this alternative on water resources
and hydrology would be essentially the same as those
associated with the Planned Utilization and Operations
Alternative. Due to the increased staffing levels (53 percent increase in staff site-wide) under this alternative,
increases in discharge to the sanitary sewer system
would occur. The capacity of the current system is
adequate to handle this increase (see Section 5.5.7).
5.5.4
BIOLOGICAL RESOURCES
Under the Maximum Operations Alternative, impacts
to biological resources would be substantially the same
as those associated with the Planned Utilization and
Operations Alternative. The main difference between
the alternatives would be the use of two work shifts to
increase R&D (versus the one work shift used in the
No Action and Planned Utilization and Operations
Alternatives). Due to the proposed disturbance of
critical habitat for the California red-legged frog on
the east side of SNL/CA, DOE would coordinate with
the USFWS under the provisions of Section 7 of the
Endangered Species Act.
Under this alternative, two new structures are proposed, including a new building similar to the CRDL
and a replacement for Building 916. These proposed
structures would have a negligible effect on biological
and ecological resources. They would be constructed
on previously disturbed land in either the existing
footprint or within 93 acres designated for future
development (see Section 5.4.4.2).
5-41
Chapter 5, Environmental Consequences–Section 5.5, Maximum Operations Alternative
5.5.5
CULTURAL RESOURCES
Implementation of the Maximum Operations Alternative
would likely have no impacts on cultural resources due
to the apparent lack of prehistoric and Native American
resources and historic archaeological sites, the nature of
the buildings and structures present, and compliance with
applicable regulations and established procedures for the
protection and conservation of cultural resources located
on lands administered by the DOE.
The potential to impact buried archaeological sites would
be the same under this alternative as under the Planned
Utilization and Operations Alternative. Additional construction projects that would occur under this alternative
would take place within the 93-acres set aside for construction projects. Again, some maintenance activities
that require ground disturbance could result in the discovery of buried archaeological sites, but compliance with
regulations and procedures would ensure that any impacts would be minimal. Approximately 100,000 sq ft
of buildings potentially would be removed from the site
under this alternative. These existing buildings are recent
in origin and not historically significant, thus removing
them would not adversely affect cultural resources.
5.5.6
AIR QUALITY
Under the Maximum Operations Alternative, DOE and
interagency programs and activities at SNL/CA would
increase. The Maximum Operations Alternative would
increase the number of nonexempt emission sources to
57, including:
❍
12 boilers
❍
14 degreasers and solvent use
❍
10 backup generators
❍
2 spray booths
❍
1 service station
❍
1 mixer
❍
1 electroplating operation
❍
16 miscellaneous sources
Criteria pollutant emissions are estimated to increase
53 percent based on projections of site-wide staff increases of 53 percent (see Section 5.2.6). Table 5-30 presents
the criteria pollutant emissions under the Maximum
Operations Alternative, reflecting the increase in emissions above the No Action and Planned Utilization and
Operations Alternatives. Criteria pollutant emissions
from SNL/CA under the Maximum Operations Alternative remain below one percent of the respective
pollutant emissions from the Bay Area.
Table 5-31 presents the Maximum Operations Alternative
air toxics emissions from SNL/CA, which are estimated to
be twice the air toxic emission rates for the Planned Utilization and Operations Alternative, based on the addition
of a second shift to the operations at SNL/CA. The Maximum Operations Alternative air toxic emissions are less
than one and one-half percent of those for the Bay Area.
Construction activities at SNL/CA could have short-term
adverse impacts due to emissions of criteria air pollutants
from construction equipment, traffic from construction
worker vehicles, and fugitive dust from earth-moving
activities. Under the Maximum Operations Alternative,
construction activities would include projects under the
Planned Utilization and Operations Alternative plus two
new projects. The fugitive dust could exceed PM10 concentration standards if no dust control measures were implemented. However, engineered controls, such as the application of water or chemical dust suppressants and seeding
of soil piles and exposed soils, would be implemented
to minimize fugitive dust. It is expected that PM10 concentrations would be within all applicable standards.
Table 5-32 estimates construction-related emissions
CO emissions for one typical project. Construction of a
Table 5-30. Criteria Pollutant Emission Rates for the Maximum Operations Alternative (kilograms per year)
Maximum Operations
a
Alternative
Bay Area
b,c
Emission Year 2000
Percent Contribution
from SNL/CA
NA
57,900,000
NA
2,534
179,000,000
<1
NA
29,100,000
NA
Nitrogen Dioxide
5,066
214,000,000
<1
Carbon Monoxide
459 to 612
995,000,000
<1
Pollutant
Particulates
Volatile Organic Compounds
Sulfur Dioxide
Sources: SNL/CA 2002b
a
Based on a 53 percent increase in Sandia National Laboratories, California (SNL/CA) staff
b
Bay Area Air Quality Management District (BAAQMD) inventory is reported annually for period July to June
c
All Bay Area-wide emissions except particulates are based on an average summer day multiplied by 365 days. Bay Area particulate emissions
are based on an average winter day multiplied by 365 days
<: less than
NA: not available/not applicable
SNL/CA: Sandia National Laboratories, California
5-42
Final SNL/CA SWEA DOE/EA-1422—January 2003
Chapter 5, Environmental Consequences–Section 5.5, Maximum Operations Alternative
Table 5-31. Air Toxic Emission Rates for the Maximum Operations Alternative (kilograms per year)
Maximum Operations
Alternativea
Bay Area Emission
Year 1999b
Percent Contribution
from SNL/CA
1,1,1-trichloroethane
470
58,968
<1
1,4-dioxane
11
771
< 1.5
Ammonia
477
1,406,160
<1
Benzene
0.64
28,577
<1
Carbon tetrachloride
0.72
1,406
<1
Pollutant
Formaldehyde
6.8
81,648
<1
Methyl alcohol
1,364
276,696
<1
Methylene chloride
151
49,896
<1
Perchloroethylene
150
371,952
<1
Toluene
86
335,664
<1
Trichloroethylene
133
21,773
<1
Xylene
30
276,696
<1
Sources: TTNUS, 2002a; SNL/CA 2002b
a
Based on twice the maximum emission rate from the Planned Utilization and Operations Alternative
b
Bay Area Air Quality Management District (BAAQMD) inventory is reported annually for period July to June
<: less than
NA: not available/not applicable
SNL/CA: Sandia National Laboratories, California
Table 5-32. Estimated Carbon Monoxide Emissions
Associated with Representative Project Construction Activities
1-Year Construction
Activity (assumes
21-work day months
or 252 days
Total Annual Hours
of Operation
Equipment
a
Emission Factors
Estimated Total
Annual Carbon
Monoxide Emissions
(total pounds per year)
Estimated Total
Annual Carbon
Monoxide Emissions
(total tons per year)
Assumptions for Diesel Vehicles Emissions
7 Diesel Units
(trucks for
transportation of
materials to site
throughout life of
construction phase)
3,528
(or 2 hours per day
each for 252 days)
0.11
388
0.194
8 Diesel Units (dozers,
backhoes, graders,
dump trucks to grade
and lay foundation)
800
(or 5 hours per day
each for 20 days)
0.11
88
0.044
6 Diesel Units (forklifts,
crane, front end loader,
other equipment for
construction of
buildings)
10,584
(or 7 hours per day
each for 252 days)
0.11
1,164
0.582
14,912
N/A
1,640
0.82
Total Diesel units (21)
Final SNL/CA SWEA DOE/EA-1422—January 2003
5-43
Chapter 5, Environmental Consequences–Section 5.5, Maximum Operations Alternative
Table 5-32. Estimated Carbon Monoxide Emissions
Associated with Representative Project Construction Activities
1-Year Construction
Activity (assumes
21-work day months
or 252 days
Total Annual Hours
of Operation
Equipment
a
Emission Factors
Estimated Total
Annual Carbon
Monoxide Emissions
(total pounds per year)
Estimated Total
Annual Carbon
Monoxide Emissions
(total tons per year)
Assumptions for Gasoline Vehicles Emissions
24 Light Gasoline units
(worker personal
vehicles, snack
wagons, light
commercial vans)
6,048
(or 1 hour per day
each for 252 days)
0.48
2,903
1.451
2 Hand tampers
160
(or 4 hours per day
each for 20 days)
0.48
77
0.38
Total Gas units
6,208
N/A
2,980
1.49
4,620 pounds
2.31 tons
Total Estimated Carbon Monoxide Emissions
during Typical Construction Phase
Source: SNL/CA 2001i
a
Carbon Monoxide (CO) emission factors are based on the Environmental Protection Agency (EPA) National Vehicle and Fuel Emission Laboratory
(Ann Arbor, Michigan) average emission rates for idling vehicles. CO emissions for light-duty trucks are estimated at 219 grams per hour, for
heavy-duty gas vehicles at 245 grams per hour, and for heavy-duty diesel vehicles at 50 grams per hour. Calculations are based on a conversion
factor of 0.035 ounce per gram (grams x 0.035) divided by 16 (ounces per pounds) times hour’s operation divided by 2,000 (pounds per ton) to
obtain tons per yr.
replacement building for Building 916 and a new building
similar to the CRDL would produce similar levels of CO
emissions shown in Table 5-32. It is expected that CO emissions will be within all applicable standards. The Arroyo
Seco improvement activities are covered in Table 5-19.
The estimated number of daily commuters to SNL/CA
during FY 2001 is 700 to 1,000 vehicles. Under the
Maximum Operations Alternative, it is estimated that
a 53 percent increase in daily commuter traffic will occur
resulting in 1,071 to 1,530 vehicles. Increases of carbon
monoxide and nitrogen oxides, an ozone precursor, will
occur with the increase in commuter traffic. Actual future
emissions are not expected to be equivalent to the increase in commuter vehicles because future vehicles will
have lower emission rates and more stringent inspection
and maintenance programs. In addition, the BAAQMD
vehicle buy back program designed to remove 1981 and
earlier model vehicles from the road will contribute to
the reduction in commuter vehicle emissions.
Total carbon monoxide emissions estimates are shown
in Table 5-33. Total carbon monoxide emissions for the
Maximum Operations Alternative are 70 tons per year
above the 2000 baseline and below the 100 tons per year
incremental increase above baseline that would require a
conformity determination. In addition, the total carbon
monoxide emissions for the Maximum Operations Alternative were found to be less than 1 percent of the maintenance area’s emissions of carbon monoxide. As a result,
the NNSA has concluded that no conformity determination is required for the Maximum Operations Alternative.
Table 5-33. Carbon Monoxide Emissions from Sandia National Laboratories, California
under the Maximum Operations Alternative (tons per year) and Calendar Year 2000 (baseline)
Stationary Sources
Mobile Sources
Construction Activities
Total
0.61
282
9.2
291.8
0.4
214
6.9
221.3
Maximum Operations Alternative
Baseline
Source: EPA 1995
Notes: Mobile Source Emission Factors assumptions Baseline (2000) 24.77 grams per mile, the No Action Alternative (2005) 21.29 grams per
mile, 1,000 to 1,530 vehicles, 30-mile trip, average speed 35 miles per hour. Assumed three typical construction projects each year (2.31 tons per
project) plus the Arroyo Seco project (2.25 tons per year).
5-44
Final SNL/CA SWEA DOE/EA-1422—January 2003
Chapter 5, Environmental Consequences–Section 5.5, Maximum Operations Alternative
5.5.7
INFRASTRUCTURE
5.5.8
As discussed in Section 5.3.7, the infrastructure analysis
evaluated potential incremental changes to SNL/CA services, utilities, and facilities by alternative.
The Maximum Operations Alternative would increase
demands on infrastructure over the next 10 years (Table
5-34). Annual consumption of water, electricity, and
natural gas would exceed recent historic levels (DOE
1992a; TtNUS 2002a). Under the Maximum Operations
Alternative, the current infrastructure would be capable
of accommodating SNL/CA facility requirements and no
major additional infrastructure facilities are proposed.
TRANSPORTATION
Based on current transportation operation data, the
Maximum Operations Alternative would increase the
amount of highway and pedestrian infrastructure within
SNL/CA by approximately 53 percent (Table 5-35). The
number of truck shipments from SNL/CA would increase
by approximately 600 vehicles per year from the current/
No Action numbers. Of these, 57 would be hazardous
shipments. The number of commuter vehicles would
increase by approximately 371 to 530. The increased
number of shipments and the increase in employee
vehicles would not represent substantial increase in
the number of vehicles on the road by virtue of the area’s
Table 5-34. Annual Sandia National Laboratories, California
Utility Usage and Capacities under the Maximum Operations Alternative
Maximum
Operations Alternative
System Capacity
Usage as Percent
of Capacity
Water Use
76.5 to 91.8 M gal
922 M gal
8 to 10
Wastewater Discharge
18.4 to 29.1 M gal
81 M gal
23 to 36
48,800 MWh
239,000 MWh
20
Utility
Electrical Use
Natural Gas Use
94 M ft
3
430 M ft
3
22
Source: TtNUS 2002a; Royer 2002a
3
ft : cubic feet
M gal: millions of gallons
MWh: megawatt hours
Table 5-35. Transportation Activities under the Maximum Operations Alternative
No Action Alternative
Maximum Operations
Alternative
Change from No Action
6.2 miles
9.7 miles
+3.5 miles
4 acres
6.24 acres
+2.24 acres
Paved service areas
5.5 acres
8.6 acres
+3.1 acres
Paved service parking
12.7 acres
19.8 acres
+7.1 acres
Waste (includes hazardous &
radioactive)
76 shipments
116 shipments
+40 shipments
Sanitary Waste
52 shipments
80 shipments
+28 shipments
SNL/CA
Weekly Hazardous
Materials Transports
(excluding waste)
1 to 3 outbound shipments per
week (Total of 33)
1 to 3 shipments
(Total of 50)
+17 shipments
Supplier Weekly Hazardous
Material Transports
1 to 3 inbound shipments per
week (Total of 100)
1 to 3 shipments
(Total of 150)
+50 shipments
Soil Transports
NR
1,600 to 2,000 shipments
over 10 Years
+200 shipments
Incoming Material (Rock, Soil,
Concrete)
NR
1,500 to 3,000 shipments
over 10 Years
+300 shipments
700 to 1,000 vehicles
1,071 to 1,530 vehicles
+371 to 530 vehicles
Activity
Paved and
unpaved road
Pedestrian mall
Commuter traffic
Source: TtNUS 2002a
NR: not reported
SNL/CA: Sandia National Laboratories, California
Final SNL/CA SWEA DOE/EA-1422—January 2003
5-45
Chapter 5, Environmental Consequences–Section 5.5, Maximum Operations Alternative
projected population growth and would have no significant impact on the region. Based on the number of additional vehicles, impacts from accidents should be the
same as under current conditions.
discussed separately in order to show the maximum
likely operational increases. The projected totals would
be below recent highs experienced within the last five
years (See Tables 4-10 and 4-11).
5.5.9
5.5.9.1
WASTE GENERATION
The Maximum Operations Alternative would not cause
any major changes in the types of waste streams generated onsite. Waste generation at SNL/CA would increase,
consistent with a 53 percent increase in laboratory operations. However, existing waste minimization and pollution prevention programs would control the extent of the
waste generation increase. Under the Maximum Operations Alternative, waste projections used for analysis
would not exceed existing waste management capacities.
Site-wide waste generation would increase by 53 percent
above the 5-year average under the Maximum Operations
Alternative. For specific facilities, the CY 2000 waste
generation data were doubled to correspond with two
shifts. Existing operations wastes are considered to be
derived from mission-related work. New operations are
Radioactive Wastes
Existing Operations
Under the Maximum Operations Alternative, SNL/CA
would generate LLW and LLMW (Table 5-36). However,
SNL/CA would not generate any TRU waste or high-level
waste. Projections for radioactive waste generation at
specific facilities from new and existing operations are
shown in Table 5-37.
Under the Maximum Operations Alternative, SNL/CA
anticipates a 53 percent increase in the generation of
LLW and LLMW from all operations over the next 10
years. There would be sufficient management capacity
to accommodate anticipated radioactive wastes. LLW
and LLMW are shipped offsite for final disposal.
Table 5-36. Average Annual Radioactive Waste Generation
under the Maximum Operations Alternative (in kilograms)
Unit
5-Year Average
a
(1996 through 2000)
Maximum
Operations Alternative
Existing Operations
Kg
198
444
New Operations
Kg
0
0
Balance of Operations
Kg
5,110
7,677
SNL/CA Total LLW
Kg
5,308
8,121
0%
+53%
All Waste
LLW
Percent Change
LLMW
Existing Operations
Kg
0
0
New Operations
Kg
0
0
Balance of Operations
Kg
451
690
SNL/CA Total LLMW
Kg
451
690
0%
+53%
Percent Change
Total Radioactive Waste
Existing Operations
Kg
198
444
New Operations
Kg
0
0
Balance of Operations
Kg
5,561
8,367
SNL/CA Total Radioactive
Waste
Kg
5,759
8,811
0%
+53%
Percent Change
Sources: SNL/CA 2002b; TtNUS 2002a
a
5-year average represents the No Action Alternative excluding new facilities
%: percent
LLW: low-level waste
LLMW: low-level mixed waste
SNL/CA: Sandia National Laboratories, California
5-46
Final SNL/CA SWEA DOE/EA-1422—January 2003
Chapter 5, Environmental Consequences–Section 5.5, Maximum Operations Alternative
Table 5-37. Average Annual Waste Generation by Specific Sandia National
Laboratories, California Facilities under the Maximum Operations Alternative (in kilograms)
Facility
Calendar Year 2000
Maximum Operations Alternative
a
a
LLW
LLMW
Hazardous
LLW
LLMW
Hazardous
Combustion
Research
Facility (CRF)
0
0
2,444
0
0
4,888
Building 910
15
0
15,432
30
0
30,864
Building 914
0
0
1,741
0
0
3,482
Building 916
1.5
0
596
3
0
1,192
Building 927
0
0
4,182
0
0
8,364
Micro and Nano
Technologies
Laboratory (MANTL)
0
0
7,109
0
0
14,218
Chemical and
Radioactive
Detection Laboratory
(CRDL)
13
0
1,169
75
0
6,719
Area 8 Facilities
168
0
814
336
0
1,628
Explosives
Storage Area (ESA)
0
0
0
0
0
0
Hazardous and
Radioactive Waste
Storage Facilities
0
0
0
0
0
0
Subtotals Existing
Facilities
198
0
33,487
444
0
71,355
LIGA Technologies
Facility (LTF)
0
0
0
0
0
5,928
Distributed
Information Systems
Laboratory (DISL)
0
0
0
0
0
0
Glass Furnace and
Melting Laboratory
(part of the CRF)
0
0
0
0
0
50
Subtotals New
Facilities
0
0
0
0
0
5,978
198
0
33,487
444
0
77,333
Existing Facilities
New Facilities
Totals All Facilities
Sources: SNL/CA 2002b; TtNUS 2002a
a
Includes RCRA Hazardous, California Toxic, TSCA, and biohazardous (MWMA)
LLW: low-level waste
LLMW: low-level mixed waste
RCRA: Resource Conservation and Recovery Act
TSCA: Toxic Substances Control Act
MWMA: Medical Waste Management Control Act
New Operations
SNL/CA anticipates 444 kg per year of LLW would be
generated from new operations annually over the next
10 years. There would be sufficient capacity to accommodate anticipated new operations radioactive wastes.
Final SNL/CA SWEA DOE/EA-1422—January 2003
Balance of Operations (Includes Maintenance
and Decontamination and Decommissioning)
SNL/CA anticipates 7,677 kg per year of LLW and
690 kg per year of LLMW would be generated from balance of operations over the next 10 years. There would be
sufficient capacity to accommodate projected radioactive
5-47
Chapter 5, Environmental Consequences–Section 5.5, Maximum Operations Alternative
wastes. Maintenance and D&D wastes are not expected
to impact overall SNL/CA waste management operations.
Current Capacity
The total radioactive waste generated per year requiring
offsite disposal at licensed/approved facilities would not
exceed the existing storage and handling capacities at the
Radioactive Waste Storage Facility. Projections indicate
that radioactive waste throughput would increase by 53
percent. SNL/CA routinely ships radioactive waste to
various offsite governmental and commercial treatment
and disposal facilities. All waste is shipped to meet regulatory requirements. Based on these projections and continued operations at specific facilities under this alternative,
the radioactive waste generation impacts would continue
to be minimal.
5.5.9.2 Hazardous Waste
Existing Operations
The Maximum Operations Alternative total hazardous
waste generation would increase for existing facilities.
Under the Maximum Operations Alternative, SNL/CA
anticipates 133,820 kg per year of hazardous waste
through 2012 (Table 5-38). There would be sufficient
capacity to accommodate anticipated operations total
hazardous wastes. Projections for specific facilities for
existing and new operations are presented in Table 5-37.
New Operations
SNL/CA anticipates generation of 5,978 kg per year
of hazardous waste by new operations over the next
10 years. The majority of the increase would primarily
be due to the full implementation of LIGA wafer production operations (Table 5-37, 5,928 kg/yr). New SNL/CA
operations would account for less than five percent of
the total hazardous waste at the site (Table 5-38).
Balance of Operations (Includes Maintenance
and Decontamination and Decommissioning)
Maintenance and D&D, SNL/CA would produce hazardous waste (includes construction debris) each year.
Projected hazardous waste quantities for these activities are
included in Table 5-38 as balance of operations. This work
would directly impact the quantity of TSCA hazardous
waste requiring disposal. SNL/CA would continue to generate TSCA hazardous waste, primarily PCBs and asbestos
that are removed from transformers and buildings. Under
the Maximum Operations Alternative, 100,000 gsf (an
estimated 600 tons or 600,000 kg of construction debris)
would be removed.
5-48
Current Capacity
The total hazardous waste generated per year requiring
offsite disposal at licensed/approved facilities would
not exceed the existing storage and handling capacities
at the Hazardous Waste Storage Facility. Projections indicate that an increase of 53 percent of hazardous waste
generation would occur. SNL/CA routinely ships hazardous waste to various offsite commercial disposal facilities.
All waste is shipped in less than one year to meet regulatory requirements. Based on these projections and continued operations at specific facilities under the Maximum
Operations Alternative, the hazardous waste generation
impacts would be minimal.
5.5.9.3
All Other Wastes
SNL/CA operations also involve the four additional
waste management activities discussed below.
Biohazardous (includes Medical
Waste Management Act) Waste
Under the Maximum Operations Alternative, biohazardous waste generation would increase from 551 kg/yr
to 843 kg/yr (see Table 5-37). The existing waste handling capabilities would be adequate to accommodate this
waste. No additional offsite impacts would occur, because
offsite disposal capacity would continue to be sufficient.
Construction Waste
Under the Maximum and Operations Alternative,
construction debris would include the construction of
facilities identified in the No Action Alternative (a total
of 208 tons), Planned Utilization Operations Alternative
(an additional 10 tons), plus construction of a new
84,000 sq ft building and a new 16,000 sq ft building
would generate 168 tons and 32 tons of construction
debris, respectively. Since a typical roll off container
handles 20 tons of debris, the expected construction
waste would be minimal. No additional offsite impacts
would occur, because offsite disposal capacity would
be sufficient.
Municipal Solid Waste
Under the Maximum Operations Alternative, an estimated
378.7 metric tons per year would be generated annually.
No appreciable impacts to disposal facilities would occur
because existing waste handling capabilities are already in
place.
Wastewater
SNL/CA would generate approximately 18.4-29.1 M
gallons annually compared to 15 million gallons in CY
2000. Sufficient disposal capacity would be available
(see Table 5-34).
Final SNL/CA SWEA DOE/EA-1422—January 2003
Chapter 5, Environmental Consequences–Section 5.5, Maximum Operations Alternative
Table 5-38. Average Annual Hazardous Waste Generation
under the Maximum Operations Alternative (in kilograms)
Unit
5-Year Average
a
(1996 through 2000)
Maximum
Operations Alternative
Existing Operations
kg
8,659
18,451
New Operations
kg
779
1,546
Balance of Operations
kg
13,178
14,606
SNL/CA Total
RCRA Hazardous
kg
22,616
34,603
0%
53.0%
All Waste
RCRA Hazardous Waste
Percent Change
California Toxic Waste
Existing Operations
kg
9,922
21,141
New Operations
kg
893
1,771
Balance of Operations
kg
15,099
16,736
SNL/CA Total
California Toxic
kg
25,914
39,648
0%
53.0%
Percent Change
TSCA
Existing Operations
kg
14,695
31,313
New Operations
kg
1,323
2,633
Balance of Operations
kg
22,365
24,789
SNL/CA Total TSCA
kg
38,383
58,725
0%
+53.0%
Percent Change
Biohazardous (includes MWMA waste)
Existing Operations
kg
211
450
New Operations
kg
19
38
Balance of Operations
kg
321
356
SNL/CA Total
Biohazardous waste
kg
551
843
0%
+53.0%
Percent Change
Total Hazardous Waste
Existing Operations
kg
33,487
71,355
New Operations
kg
3,014
5,978
Balance of Operations
kg
50,963
56,487
SNL/CA Total
Hazardous waste
kg
87,464
133,820
0%
+53.0%
Percent Change
Sources: SNL/CA 2002b; TtNUS 2002a
a
5-year average represents the No Action Alternative excluding new facilities
%: percent
RCRA: Resource Conservation and Recovery Act
SNL/CA: Sandia National Laboratories, California
TSCA: Toxic Substances Control Act
MWMA: Medical Waste Management Control Act
Final SNL/CA SWEA DOE/EA-1422—January 2003
5-49
Chapter 5, Environmental Consequences–Section 5.5, Maximum Operations Alternative
5.5.10 NOISE
ers to total employees would remain constant and that
the average radiation dose to these workers would be the
same as under the No Action Alternative (also the baseline). Table 5-39 presents estimated radiation doses for
the collective population of workers who would be directly involved in implementing the alternatives as well as
LCFs likely attributable to these doses.
Under the Maximum Operations Alternative, activities
at SNL/CA would increase to two-shifts.
The Maximum Operations Alternative consists of the
background noise levels presented for the affected environment in Section 4.12, Table 4-14, with the following
changes:
A two-shift operation at SNL/CA would increase onsite
noise levels during the evening hours. Little or no increase
in ambient background noise levels is expected in the
adjacent community.
The estimated number of LCFs listed in Table 5-39 for
the Maximum Operations Alternative can be compared
to the projected number of fatal cancers from all causes.
Population statistics indicate that cancer caused 23 percent of the deaths in the U.S. in 1997 (CDC 1998). If this
percentage of deaths from cancer continues, 23 percent of
the U.S. population would contract a fatal cancer from all
causes. Thus, in the population of 1,657 – 1,931 workers,
381 – 444 persons would be likely to contract fatal cancers from all causes. Under this alternative, the incremental impacts from SNL/CA operations would be small.
5.5.11 HUMAN HEALTH AND WORKER SAFETY
5.5.11.2 Occupational Health and Safety
Implementation of the Maximum Operations Alternative would result in the human health and worker
safety impacts described in the following sections for
radiological health and occupational health and safety.
Table 5-40 provides estimates of the number of TRCs and
LWCs that could occur under this alternative. The projected injury rates are based on an average historic SNL/CA
injury rates over a 3-year period from 1999 through 2001
(SNL 2001i, 2002a). These rates were then multiplied by
the employment levels for this alternative to calculate the
number of TRCs and LWCs.
❍
Community Noise Equivalent Level (day) (CNEL Ld)
changes from 7 am-7 pm to 7 am-10 pm
❍
Ldn (day/night) is deleted
❍
Ln (night) remains the same
5.5.11.1 Radiological Health Effects
Under the Maximum Operations Alternative, NNSA
expects minimal worker radiological health impacts
from the SNL/CA activities. The values for the alternative were calculated assuming the number of radiation
workers and their average annual radiation dose would
be the same as the average values for the past 3 years. In
addition, NNSA assumed that the ratio of radiation work-
The TRC value includes work-related death, illness, or
injury that resulted in loss of consciousness, restriction
from work or motion, transfer to another job, or required
medical treatment beyond first aid. The data for LWCs
represent the number of workdays beyond the day of
injury or onset of illness that the employee was away
Table 5-39. Estimated Radiological Dose and Health Impacts to
Sandia National Laboratories, California Workers by Alternative
No Action Alternative
(baseline)
Health Impact
Collective involved worker dose (person-rem)
0.85
Estimated increase in number of latent cancer fatalities
Maximum Operations Alternative
a
3.4 x 10
1.35
-4
-4
5.4 x 10
Sources: DOE 1999d, 2000d, 2001g
a
SNL/CA involved worker dose estimated at 11 percent SNL lab-wide totals in Table 4-15. Any increase in estimated radiation doses would be
a result of the increase in the number of radiation workers and not the result of different exposure mechanisms or levels.
rem: Roentgen equivalent, man
Table 5-40. Estimated Occupational Safety Impacts to
Sandia National Laboratories, California Workers by Alternative
Worker Safety Parameters
No Action Alternative
Maximum Operations Alternative
1,043 – 1,317
1,657 – 1,931
Total recordable cases
of accident or injury
43 – 54
68 – 79
Lost workday cases
10 – 13
17 – 19
Workforce
Source: SNL 2001i, 2002a
5-50
Final SNL/CA SWEA DOE/EA-1422—January 2003
Chapter 5, Environmental Consequences–Section 5.5, Maximum Operations Alternative
from work or limited to restricted work activity because
of an occupational injury or illness.
5.5.12 SOCIOECONOMICS
Implementation of the Maximum Operations Alternative
would result in no appreciable impacts to demographic
characteristics, economy, or community services in the
ROI, as discussed below.
5.5.12.1 Demographic Characteristics
The Maximum Operations Alternative would not exert
any noticeable change in existing demographic characteristics within the socioeconomic ROI (Section 4.14.3).
Under this Alternative, employment is expected to increase by 614 employees to 1,931 workers. Assuming, for
a conservative analysis, that all employees would migrate
in from areas outside of the ROI, the population increase
would represent an extremely small percentage (far less
than one percent) of the 2000 ROI population, as a whole.
5.5.12.2 Economic Base
represent only 0.1 percent of total personal income for
the ROI. Additionally, SNL/CA’s 2000 employment represents only 0.2 percent of the 1,455,700 individuals
currently employed in the ROI.
SNL/CA estimates that the Maximum Operations Alternative will require 1,931 personnel and $262 million in total
operating expenditures. From 1998-2000, SNL/CA payroll
expenditures have represented an average of 51 percent of
the total operating budgets. Therefore, SNL/CA estimates
that payroll expenditures under the Maximum Operations
Alternative would be approximately $133.6 million. This
represents a $59.3 million increase in payroll expenditures
(over the No Action alternative). The Maximum Operations Alternative payroll expenditures combined with
indirect and induced expenditures would total $219.1
million and would represent 0.2 percent of the personal
income levels found in the ROI for the year 2000. Additionally, a total of 3,784 workers (direct, indirect, and induced)
would represent only 0.3 percent of the 2000 employment
level in the ROI.
5.5.12.3 Housing and Community Services
The Maximum Operations Alternative would not have
a noticeable change in the existing economic base in the
ROI (Section 4.14.3). Table 5-41 presents the direct and
indirect impacts SNL/CA operations currently (2000)
have on the economy of the ROI. Table 5-42 presents the
direct and indirect impacts SNL/CA’s Maximum Operations Alternative operations would have on the 2000
economy. (In order to provide a more conservative estimate of the impact of this alternative, a comparison is
being made between Maximum Operations Alternative
expenditures and year 2000 economic indicators.) As
the data indicate, SNL/CA’s 2000 payroll expenditures
The Maximum Operations Alternative would not create
a noticeable change in existing housing and community
services within the ROI (Section 4.14.3). Assuming one
housing unit per additional worker, 614 housing units
would be required. This numbers represents 1.8 percent
of the housing stock available in the ROI. Therefore, ROI
capacity would far exceed demand. Additionally, contributory effects from other industrial and economic sectors
within the ROI would greatly reduce or mask the SNL/
CA proportional impact.
Table 5-41. Sandia National Laboratories, California’s Current Impact on the Regional Economy
Economic Measure
FY 2000
SNL/CA
Total ROI
Percent of ROI
$108,376.8
0.1
1,455,700
0.2
Earnings (Income) ($Millions)
Wages and Salaries
74.3
Indirect and Induced
47.6
121.9
TOTAL EARNINGS
Earnings Multiplier:
1.64 (2002)
Employment (Number of Workers)
SNL/CA Workforce
1,317
Indirect and Induced
1,264
TOTAL EMPLOYMENT
2,581
Employment Multiplier: 1.96 (2002)
Sources: BEA 2000b, BEA 2002a
FY: fiscal year
ROI: region of influence
SNL/CA: Sandia National Laboratories, California
Final SNL/CA SWEA DOE/EA-1422—January 2003
5-51
Chapter 5, Environmental Consequences–Section 5.6, Accidents
Table 5-42. Sandia National Laboratories, California’s Estimate
of Maximum Operations Alternative Impacts on the Regional Economy
Economic Measure
Maximum Operations Alternative
SNL/CA
Total ROI
Percent of ROI
$108,376.8
0.2
1,455,700
0.3
Estimated Earnings (Income) ($Millions)
Wages and Salaries
133.6
Indirect and Induced
85.5
219.1
TOTAL EARNINGS
Earnings Multiplier:
1.64 (2002)
Employment (Number of Workers)
a
SNL/CA Workforce
1,931
Indirect and Induced
1,853
TOTAL WORKFORCE
3,784
Employment Multiplier: 1.96 (2002)
Sources: BEA 2000b, BEA 2002a
a
Employment would range from 1,657 to 1,931 workers
ROI: region of influence
SNL/CA: Sandia National Laboratories, California
5.5.13 ENVIRONMENTAL JUSTICE
The impacts of this alternative on environmental justice
resources would be the same as those associated with the
No Action Alternative. No disproportionately high and
adverse impacts to minority or low-income communities
are anticipated for these resource areas. For summary of
potential environmental justice impacts under the No
Action Alternative see Table 5-15.
5.6
ACCIDENTS
This section describes the potential impacts to workers
and the public of potential accidents involving SNL/CA
facilities and the release of radioactive and/or chemical
materials, explosions, and other hazards for all alternatives. As discussed in Section 5.2.12, two accident
scenarios were considered for additional analysis: a
postulated event initiated by natural phenomena and
a postulated material event initiated by unspecified
accident.
5.6.1
POSTULATED EVENT INITIATED
BY NATURAL PHENOMENA
An earthquake is the most likely natural phenomena to
initiate an emergency situation onsite. Two possible faults
could affect SNL/CA: Greenville and Las Positas. The
Tesla and Greenville faults trend northwest-southeast and
are the most strongly documented faults near SNL/CA.
The location of a possible earthquake on the Greenville
fault is based primarily on geologic evidence.
5-52
The Greenville fault is the largest fault with the nearest
location to SNL/CA, and evidence of its recent activity
is more conclusive than in the case of the other faults.
The Las Positas fault branches (see Figure 4-4) through
the SNL/CA site and pass very close to SNL/CA facilities,
and has a total length of about 10 mi. If the Las Positas
fault were to be substantiated by future studies as a structure capable of generating moderate earthquakes,
the maximum credible earthquake based on this length
and the resulting ground motion at the site would be less
than is estimated for the Greenville fault. Section 4.4.3.1
provides further details on the seismic characteristics of
the area around SNL/CA. Section 5.3.2 discusses impacts
associated with geology and soils.
In January 1980, the Livermore Valley experienced two
moderate sized earthquakes estimated to be 5.8 and 5.6
on the Richter scale. Over 100 aftershocks followed, with
magnitudes up to 4.6. The epicenters were located on the
Greenville fault within 11.2 mi of the SNL/CA site.
Substantial earthquake-resistant structural modifications have been made to onsite facilities where hazardous
materials are handled and future construction will meet
future standards. Therefore, the more likely result of an
earthquake would be damage to unsecured equipment
that might impact hazardous chemical containers or a
fire resulting from damage to electrical equipment or
the rupture of onsite gas lines.
Following a major earthquake, typical emergency response
actions would be taken, including inspection and damage
assessment of facilities, gas lines, water lines, fire alarms,
and building areas. Impacts would be the same for all three
alternatives.
Final SNL/CA SWEA DOE/EA-1422—January 2003
Chapter 5, Environmental Consequences–Section 5.7, Comparison of
Data Analyzed and Environmental Consequences Among Alternatives
5.6.2
POSTULATED MATERIAL EVENT
INITIATED BY UNSPECIFIED ACCIDENT
As a result of review of available documentation, the
accident assessment team considered a case of a hydrogen tanker explosion. The potential effects of hydrogen
explosions are estimated using trinitrotoluene (TNT)
equivalence model. The case examined is an explosion
of a refueling tanker truck carrying 40,000 cubic feet (ft3).
These impacts would be limited to the immediate vicinity
of the explosive device and would not impact the offsite
public. The potential effects are estimated in Table 5-43.
Impacts would be the same for all three alternatives.
5.7
COMPARISON OF DATA
ANALYZED AND ENVIRONMENTAL CONSEQUENCES
AMONG ALTERNATIVES
The SWEA combines the results of several studies to
address consequences to the environment and risks
associated with the NNSA’s operations at SNL/CA. The
environmental consequences presented in the SWEA
includes the following 13 resource areas (excludes accidents): land use and visual resources, geology and soils,
water resources and hydrology, biological and ecological
resources, cultural resources, air quality, infrastructure,
human health and worker safety, transportation, waste
generation, noise, socioeconomics, and environmental
justice.
The following section presents the comparison of the
consequences by resource area under each alternative
in tabular form (Table 5-44).
Table 5-43. Physical Effects as a Function of Distance for the Postulated Flammable Gas Explosions
Distance in Feet
Physical Effects
40,000 cubic feet
(209-pound) TNT
10,000 cubic feet
(52-pound) TNT
Peak Pressure
19
12
50 percent survival rate for pressures in excess of 50 psi
46
29
50 percent rate of eardrum rupture and total
destruction of buildings for pressures in excess of 10 psi
96
60
Pressures in excess of 2 to 3 psi will cause concrete or
cinder blocks to shatter.
282
177
Pressures in excess of 1 psi will cause a house to be demolished.
501
315
Source: Original
psi: pounds per square inch
TNT: trinitrotoluene
Final SNL/CA SWEA DOE/EA-1422—January 2003
5-53
5-54
Water Resources
Geology and Soils
Land Use
Resource Area
Not Part of This Alternative
49.2 acres
50 to 60 MGY
12 to 19 MGY
16 to 17 MGY
Onsite Soil
Management
Area
(25 acre site)
Impervious
Surface
Water Use
Wastewater
Discharge
Irrigation
Not Part of This Alternative
Soil Removed
from Arroyo Seco
Not Part of This Alternative
23 ( 20 No Further Action)
3 to Long Term Monitoring
Solid Waste
Management
Units
New Material,
Backfill, Stone,
etc.
SNL/CA activities are not anticipated
to impact geology and soils.
Overall
Includes current land use plus LTF
(2-acre construction site), DISL
(4-acre construction site [estimate]),
and Hazardous Waste Storage Facility
modifications.
No Action Alternative
Same as No Action Alternative
13.6 to 21.5 MGY
56.5 to 67.8 MGY
76.9 acres
3
30,000 to 40,000 yd over 10 years
3
30,000 to 60,000 yd over 10 years
3
4,000 to 5,000 yd /yr
Same as No Action Alternative
Same as No Action Alternative
New facilities are the same as the
No Action Alternative plus one new
facility. Other activities would include
upgrades to Arroyo Seco (as described
in the Arroyo Management Plan and
the Biological Assessment), setting
aside 30 acres for a wildlife reserve,
upgrading storm water runoff areas,
designating 93 acres as future construction sites, leaving 122 acres
as undesignated, and establishing a
25-acre soil management area. An
easement would be established with
landowners along western boundary.
Planned Utilization and
Operations Alternative
Same as No Action Alternative
18.4 to 29.1 MGY
76.5 to 91.8 MGY
Same as Planned Utilization and
Operations Alternative
Same as Planned
Same as Planned
Same as Planned
Same as No Action Alternative
Same as No Action Alternative
Same as Planned Utilization
and Operations Alternative. Other
activities would include replacement
of Building 916 (42,000 sq ft) with a
building twice the size (84,000 sq ft)
and the addition of a new 16,000-sq ft
facility similar to the existing CRDL for
research and development. Removal
of no longer economically useful
structures (100,000 sq ft).
Maximum Operations Alternative
Table 5-44. Comparison of Potential Consequences of Continued Operations at Sandia National Laboratories, California
Chapter 5, Environmental Consequences–Section 5.7, Comparison of
Data Analyzed and Environmental Consequences Among Alternatives
Final SNL/CA SWEA DOE/EA-1422—January 2003
Final SNL/CA SWEA DOE/EA-1422—January 2003
Human Health and
Worker Safety
Infrastructure
43 – 54
10 – 13
Total recordable
cases of accident
or injury
Lost workday cases
12 – 15
50 – 61
-4
4.0 x 10
All projected activities are within
capacities of existing road, waste
management, and utility systems.
The Glass Furnace and Melting
Laboratory requires a new natural
gas line.
Chemical
Pollutants
-4
Same as No Action Alternative
Concentrations are below regulatory
standards and human health
guidelines.
Criteria
Pollutants
3.4 x 10
Same as No Action Alternative
Concentrations would be below the
most stringent standards, which define
the pollutant concentrations below
which there are no adverse impacts to
human health and the environment.
Estimated
increase in
number of
latent cancer
fatalities
Same as No Action Alternative
No impacts.
Cultural Resources
Air Quality
Same as No Action Alternative
Impacts projected for biological
resources are minimal.
Planned Utilization and
Operations Alternative
Biological Resources
No Action Alternative
Same as the No Action Alternative
plus several additional actions.
Other activities would include
upgrades to Arroyo Seco (20
improvement projects), setting
aside 30 acres for a wildlife reserve,
upgrading storm water runoff areas,
designating 93 acres as future construction sites, and leaving 122 acres
as undesignated.
Resource Area
17 – 19
68 – 78
-4
5.4 x 10
Same as No Action Alternative
Same as No Action Alternative
Same as No Action Alternative
Same as No Action Alternative
Same as Planned Utilization and
Operations Alternative.
Maximum Operations Alternative
Table 5-44. Comparison of Potential Consequences of Continued Operations at Sandia National Laboratories, California
Chapter 5, Environmental Consequences–Section 5.7, Comparison of
Data Analyzed and Environmental Consequences Among Alternatives
5-55
5-56
Transportation
Resource Area
5.5 acres
12.7 acres
33 trips per year
76 shipments per year
52 shipments per year
Paved
service areas
Paved service
parking
Material
(Annual
Shipments
Radioactive,
Chemical, and
Explosives)
Waste (includes
hazardous and
radioactive)
Sanitary Waste
1 to 3 inbound shipments per week
(Total of 100)
Not Part of This Alternative
Supplier Weekly
Hazardous
Material
Transports
Soil Transports
1 to 3 outbound shipments per week
(Total of 33)
4 acres
Pedestrian mall
SNL/CA
Weekly
Hazardous
Materials
Transports
(excluding
waste)
6.2 miles
Paved and
unpaved road
No Action Alternative
1 to 3 shipments
(Total of 150)
1,600 to 2,000 shipments over 10
years
1,600 to 2,000 shipments over 10
years
1 to 3 shipments
(Total of 50)
80 shipments per year
116 shipments per year
50 trips per year
19.8 acres
8.6 acres
6.24 acres
9.7 miles
Maximum Operations Alternative
1 to 3 shipments
(Total of 113)
1 to 3 shipments
(Total of 37)
59 shipments per year
86 shipments per year
37 trips per year
19.8 acres
8.6 acres
6.24 acres
9.7 miles
Planned Utilization and
Operations Alternative
Table 5-44. Comparison of Potential Consequences of Continued Operations at Sandia National Laboratories, California
Chapter 5, Environmental Consequences–Section 5.7, Comparison of
Data Analyzed and Environmental Consequences Among Alternatives
Final SNL/CA SWEA DOE/EA-1422—January 2003
Final SNL/CA SWEA DOE/EA-1422—January 2003
SNL/CA Budget
$170 M
Same as No Action Alternative
$131 M
No disproportionately high and
adverse impacts to minority or lowincome communities are anticipated
98,833 kg/yr
Same as No Action Alternative
No impacts
510 kg/yr
5,998 kg/yr
Same as No Action Alternative
791 to 1,130 vehicles
1,500 to 3,000 shipments over 10
years
Planned Utilization and
Operations Alternative
90,488 kg/yr
451 kg/yr
LLMW
Total Hazardous
5,308 kg/yr
All projected activities are within
capacities of existing facilities and
systems
700 to 1,000 vehicles
Not Part of This Alternative
LLW
Management
Capability
Site-Related
Traffic, Total
Daily Traffic
Incoming
Material (Rock,
Soil, Concrete)
No Action Alternative
Source: Original
a
To bound the analysis, soil transports were assumed to be delivered to an offsite location. SNL/CA plans include managing soil onsite.
b
Total hazardous including RCRA, California Toxic, TSCA, and biohazardous
CRDL: Chemical and Radiation Detection Laboratory
DISL: Distributed Information Systems Laboratory
kg: kilograms per year
LLW: low-level waste
LLMW: low-level mixed waste
LTF: LIGA Technologies Facility
M gal: millions of gallons
MGY: million gallons per year
SNL/CA: Sandia National Laboratories, California
sq ft: square foot/feet
Environmental Justice
Socioeconomics
Noise
Waste Generation
Transportation
Resource Area
Same as No Action Alternative
$262 M
Same as No Action Alternative
118,465 kg/yr
690 kg/yr
8,121 kg/yr
Same as No Action Alternative
1,071 to 1,530 vehicles
1,500 to 3,000 shipments over 10
years
Maximum Operations Alternative
Table 5-44. Comparison of Potential Consequences of Continued Operations at Sandia National Laboratories, California
Chapter 5, Environmental Consequences–Section 5.7, Comparison of
Data Analyzed and Environmental Consequences Among Alternatives
5-57
This page intentionally left blank.
Chapter 6, Cumulative Effects Analysis
CHAPTER 6
Cumulative Effects Analysis
The Council on Environmental Quality (CEQ) regulations implementing the National Environmental Policy Act
(NEPA) define cumulative effects as “the impact on the environment which results from the action when added to other
past, present, and reasonably foreseeable future actions regardless of what agency (Federal or non-Federal) or person
undertakes such other actions” (40 CFR 1508.7). The regulations further explain “cumulative effects can result from
individually minor but collectively significant actions taking place over a period of time.” The cumulative effect analysis
presented in this Site-Wide Environmental Assessment (SWEA) is based on the incremental actions at Sandia National
Laboratories, California (SNL/CA) and in the region.
Based upon examination of the potential environmental effects of direct and indirect actions, coupled with other agencies
and the United States (U.S.) Department of Energy (DOE) and the National Nuclear Security Administration (NNSA)
actions in the region and private actions, NNSA has determined the following resource areas would be likely to experience
cumulative effects and needed to be analyzed in detail: biological and ecological resources, air quality, and transportation.
This chapter provides a description of the impacts of SNL/CA as they relate to impacts from other activities in the region
of influence (ROI) including Lawrence Livermore National Laboratory (LLNL). The methods of analysis are identified
in Section 6.1. Section 6.2 summarizes the impacts associated with potentially affected resources. Section 6.3 discusses
resource areas with potential cumulative impacts.
6.1
METHODS OF ANALYSIS
Methodology for the analysis of cumulative effects for
this SWEA was developed from the guidelines and methodology in the CEQ’s Considering Cumulative Effects Under the National Environmental Policy Act (CEQ 1997b).
The major components of the CEQ methodology include:
❍
Scoping, including identifying the significant potential cumulative effects issues associated with the proposed action, identifying the ROI and time frame for
the analysis, and identifying other actions affecting
the resources,
❍
Describing the affected environment (see Chapter 4),
and
❍
Determining the environmental consequences,
including the impacts from the proposed action
and other activities in the ROI, and the magnitude
and significance of the cumulative effects.
NNSA assessed the cumulative effects by combining
the potential effects of the Maximum Operations Alternative with the effects of other past, present and reasonably foreseeable activities in the ROI. The ROIs vary by
resource area, and are generally the same as those presented in Chapter 4. The Maximum Operations Alternative
was selected to assess a bounding scenario of potential
cumulative effects. This approach results in a conservative analysis of the maximum cumulative effects.
An internet search, literature review of environmental
documents for the ROI, and personal contacts with local
government planning departments were undertaken to
obtain information on the potential cumulative effects
for each resource area analyzed in Chapter 5. In most
Final SNL/CA SWEA DOE/EA-1422—January 2003
resource areas, the analysis in Chapter 5 includes the
cumulative regional impacts. For example, for air resources
impacts, the analysis accounts for projected impacts to the
region regulated by the Bay Area Air Quality Management
District (BAAQMD).
6.2
POTENTIALLY AFFECTED RESOURCES
The well-defined ROIs presented in Chapter 4 associated
with the continued operation of SNL/CA results in a baseline for assessing cumulative impacts. In some cases the
ROI for cumulative impacts may be larger than that presented in Chapter 4. For example, although potential
impacts from a proposed action may impact only local
biological resources, if loss of habitat is a problem throughout the region, then the ROI for cumulative effects may
extend to a larger area.
Potential impacts to land use and visual resources,
geology and soils, water resources, cultural resources,
infrastructure, human health, waste generation, noise,
socioeconomics, and environmental justice pose no
incremental or relatively minor roles in this assessment.
As such, these areas are not discussed in the same level
of detail as the other subject areas addressed in this SiteWide Environmental Assessment (SWEA). This helps
focus the assessment on factors most relevant to the
nature of the proposed actions and avoids duplication
of analyses. The following discussion summarizes the
baseline condition (Maximum Operations Alternative)
of each of the areas not discussed in detail. Potential accidents at SNL/CA are not cumulative with other impacts
in the ROI, so they are not discussed here, but are included in Chapter 5. Cumulative impacts are summarized in
Table 6-1.
6-1
Chapter 6, Cumulative Effects Analysis
Table 6-1. Comparison of Potential Cumulative Impact Data by Resource Area
Discipline Area
Land Use and
Visual Resources
Summary of Cumulative Impacts
ROI—Encroaching development and loss of agricultural land and open spaces is a major concern and
cumulative impact from all activities in Alameda County. Agricultural land uses and undeveloped land
are increasingly being converted into residential, commercial, and light industrial land uses. Growth of
the surrounding community is placing suburban and industrial development closer to site boundaries.
SNL/CA—Use of SNL/CA as a federal research and development facility is consistent with existing
land use plans. No new land use impacts are expected.
Geology and Soils
Water Resources
and Hydrology
ROI—At LLNL, existing soil contamination is being cleaned up under the remediation program, and
routine analyses of surface soil, sediment, and vadose zone soil samples in 2000 indicate that the
impact of LLNL has not changed from previous years and remains insignificant.
SNL/CA—Soil contamination at SNL/CA occurred as the result of past operations. Analyses indicate
no significant risk to the general public. No other geological or soil impacts were found to have a
cumulative effect.
ROI—Flooding from Arroyo Seco has occurred downstream from SNL/CA. LLNL drains to Arroyo Las
Positas, which is also subject to flooding. Radioactivities detected in storm water samples at LLNL were
small percentages of the MCL for drinking water. Nitrates and chromium have been detected above their
MCLs in wells on LLNL. LLNL is working to contain and cleanup groundwater contamination. In the
Livermore Valley, no monitored radioactive or inorganic nonradioactive constituent was found to
exceed primary drinking water MCLs in any well off LLNL.
SNL/CA—The Arroyo Seco Management Plan would reduce current flood and erosion potential
offsetting the 27 percent increase in impervious areas for the Maximum Operations Alternative.
Groundwater monitoring would be part of a long-term monitoring program. No groundwater use
is expected.
Biological
Resources
ROI—Throughout the area, vegetation in developed areas has been altered by human activity. The
wildlife present are species that have adapted to human presence. In 2000, Federally threatened
California red-legged frogs were found in the area including LLNL.
SNL/CA—The Arroyo Seco Management Plan identifies concepts for providing additional and improved
habitat and migration conditions for protected species that may use Arroyo Seco on SNL/CA property.
The initial impacts may disrupt critical habitats and sensitive species, however, the long-term impact of
improved habitat would be beneficial both on a local and regional basis.
ROI—For cultural resources, the ROI is SNL/CA.
Cultural Resources
SNL/CA—Neither the SNL/CA site nor the adjoining properties contain any known archeological,
historical, or cultural features, therefore no cumulative impacts to cultural resources are anticipated.
ROI—Total emission of criteria pollutants from the Bay Area was approximately 1.5 million tons in 2000.
Total emission of criteria pollutants from LLNL was approximately 34 tons in 2000.
Air Quality
Infrastructure
SNL/CA—For criteria (8 tons/yr) and toxic air (3 tons/yr) pollutants (with the exception of 1,4-dioxane),
emissions are well below 1 percent of Bay Area emissions for the same pollutants. SNL/CA 1,4-dioxane
emissions are less than 1.5 percent of Bay Area 1,4-dioxane emissions. The air pollutant contribution
from a maximum of 1,530 vehicles at SNL/CA would be small.
ROI—The city of Livermore handles 1.8 billion gallons of wastewater per year. For a city the size
of Livermore, 8 billion gallons of water would be used per year. LLNL water use expected in 2002
has been estimated at 261 MGY. Total power consumption for 2002 at LLNL has been estimated at
474 million kWh.
SNL/CA—Maximum SNL/CA utility projections are water use of 91.8 M gal, wastewater discharges of
29.1 M gal, electrical use 48,800 MWh, and natural gas use of 94 M ft3.
Transportation
ROI—Average Annual Daily Traffic, Greenville Road–117,000 Average Annual Daily Traffic,
Vasco Road–145,000 Estimated LLNL commuters–8,000 (16,000 trips/day)
SNL/CA—Estimated SNL/CA commuters–1,500 (3,000 trips/day)
3
Waste Generation
3
ROI—Radioactive waste total, DOE Annual–40,000 m Radioactive waste total, LLNL Annual–70 m
Hazardous waste total, State of California Annual–427,302 tons Hazardous waste total, LLNL Annual–
200 tons.
SNL/CA— Radioactive waste total, Annual–10 m3 Hazardous waste total, Annual–118 tons.
6-2
Final SNL/CA SWEA DOE/EA-1422—January 2003
Chapter 6, Cumulative Effects Analysis
Table 6-1. Comparison of Potential Cumulative Impact Data by Resource Area
Discipline Area
Summary of Cumulative Impacts
ROI—Traffic is the primary source of noise within the ROI. At LLNL, no noise standards are
being exceeded.
Noise
SNL/CA—Cumulative effects of noise from SNL/CA operations occur during new facility construction
would be expected to increase background noise levels.
Human Health and
Worker Safety
Socioeconomics
ROI—The calculated total potential dose to the maximally exposed individual from all LLNL operations
was 0.038 mrem in 2000.
SNL/CA—There are no SNL/CA sources of radioactive air emissions.
ROI—The population density in the three-county ROI was 2,956,155 people in 2000. Employment
at LLNL decreased from a peak of about 11,200 workers in 1989 to approximately 8,000 in 2001.
SNL/CA—Under the Maximum Operations Alternative,1,530 workers would be employed.
Environmental
Justice
ROI—Minority and low-income populations are found in the local area; however, no impacts to
these populations were noted in the available documentation.
SNL/CA—No incremental impacts would be expected.
Sources: DOE 1992a, 1999a, 2001a, GMA 2002a, LLNL 2001a
EIS: Environmental Impact Study
EPA: The U.S. Environmental Protection Agency
3
ft : cubic feet
kg/yr: kilograms per year
kWh: kilowatt hour
LLNL: Lawrence Livermore National Laboratory
MCL: maximum contaminant level
M gal: millions of gallons
MGY: million gallons per year
mrem: millirem
MWh: megawatt hour
rem: Roentgen equivalent, man
ROI: region of influence
SNL/CA: Sandia National Laboratories, California
6.2.1
LAND USE AND VISUAL RESOURCES
SNL/CA land use and visual resources are those which
are associated with an industrial park. In general, land
use and visual resources would remain the same. No incremental cumulative impact would be expected. NNSA
recognizes that adjacent public land use (encroachment
of single-family homes) would continue, and those agricultural and undeveloped lands in the ROI (Livermore
and Alameda County) are increasingly being converted
into residential, commercial and light industrial land uses.
6.2.2
GEOLOGY AND SOILS
Within the ROI (LLNL and SNL/CA) existing soil
contamination has occurred from operations. However,
present and planned activities are designed to minimize
contamination at both LLNL and SNL/CA. The cleanup
of these soils is performed to a level that meets State of
California approved health risk-based standards (which
vary depending on the chemicals of concern) corresponding to the intended future uses of the site. Analyses indicate no significant risk to the general public (see Section
5.3.2.3). Existing contamination at LLNL is being cleaned
up under the remediation program (LLNL 2001). Sampling and analysis of the vadose zone showed no evidence
of contamination that would significantly affect groundFinal SNL/CA SWEA DOE/EA-1422—January 2003
water (DOE 2001a). As a result, the cumulative effect of
soil contamination is not considered appreciable. No
other geological or soil impacts were found to have an
incremental cumulative effect.
6.2.3
WATER RESOURCES
For water resources, the ROI includes the Spring and
Mocho I subbasins of the Livermore Valley for groundwater, and Arroyo Seco for surface water. Impacts
analyzed include groundwater and surface water
(including storm water) quality and quantity.
Because groundwater would not be used, the cumulative impact of the Maximum Operations Alternative
on groundwater quantities would not be expected to
result in discernible cumulative impacts. Groundwater
contamination has occurred from DOE-related operations
at LLNL and cleanup measures are underway. Any
cleanup measures undertaken as a result of groundwater
cleanup at either LLNL or SNL/CA would result in an
improvement in groundwater quality. No substantial
long-term cumulative impacts would be expected.
For surface water, an increase of 27.7 acres of impervious
area, representing an increase of 56 percent, is projected
for the Maximum Operations and Planned Utilization
6-3
Chapter 6, Cumulative Effects Analysis
and Operations Alternatives. This would add to the quantity of storm water runoff being transported directly or
indirectly into the Arroyo Seco. Floodplain maps indicate
that along most of the channel on SNL/CA property, the
entire 100-year discharge is contained within the existing
channel. However, the area between A Street and Thunderbird Lane is subject to flooding (GMA 2001b). The
Arroyo Seco Management Plan (GMA 2002a) includes
active channel improvements and stream zone management activities that would reduce current flood and
erosion risk. Because the increase in impervious area
at SNL/CA would be offset by floodplain and channel
improvements, the effects of the Maximum Operations
or Planned Utilization and Operations Alternative would
not result in significant cumulative impacts.
Impacts to water quality from storm water runoff would
be minimal. Cleanup actions planned, underway, or completed at the Environmental Restoration (ER) sites at
SNL/CA and within the ROI are intended to remove any
potential source of surface water contamination, and the
cleanup activities themselves are not expected to negatively affect surface water quality.
6.2.4
CULTURAL RESOURCES
Neither the SNL/CA site nor the adjoining properties
contain any known archeological, historical, or cultural
features; therefore, no cumulative impacts to cultural
resources would be anticipated.
6.2.5
INFRASTRUCTURE
The SWEA found the infrastructure system, including
utilities, at SNL/CA has more than adequate capacity.
Any increases within the ROI, including the city of
Livermore and LLNL, would be relatively minor (see
Table 6-1).
6.2.6
HUMAN HEALTH AND WORKER SAFETY
For radiological doses within the ROI, including the
city of Livermore and Alameda County, only one facility
(LLNL) has potential for radiological air emissions with
associated impacts of a public dose. The calculated total
potential dose to the maximally exposed individual from
all LLNL operations using tritium was 0.038 millirem
(mrem) in 2000, or about 0.4 percent of the U.S. Environmental Protection Agency (EPA) regulatory standards,
and about 1/8000 of the dose received by individuals
from natural background radiation (LLNL 2001). There
are no SNL/CA sources of radioactive air emissions and
thus no radiation exposure or cumulative impacts to the
offsite population from SNL/CA operations. Collective
doses to involved workers and worker injuries are not
cumulative because they impact only individuals.
6.2.7
WASTE GENERATION
The SWEA found the waste generation impact of the
Maximum Operations Alternative would be less than
impacts of fiscal year (FY) 2000 operations, generally
small, and masked by ROI waste generation. For radioactive waste, SNL/CA would generate only 14 percent
of DOE operations locally and 0.025 percent of DOE
operations nationally. For hazardous waste, SNL/CA
would generate only 0.028 percent within California.
For municipal solid waste, the EPA determined that
California has over 10 years of remaining landfill capacity. NNSA recognizes landfill space can have a cumulative impact, however, land disposal is not expected to
result in critical shortages.
6.2.8
NOISE
Activities under the Maximum Operations Alternative would result in incremental levels of noise due to
increased vehicle traffic, normal SNL/CA operations
(including the firing range), and construction. Vehicle
traffic and normal operations would likely result in a
greater frequency of noise at current levels of intensity,
similar to those presently experienced, whereas construction would be expected to increase peak noise levels.
Nearby housing construction, East Avenue construction,
and LLNL operations would also contribute to ambient
background noise levels.
Noise would remain within current decibel ranges,
but increase in duration or frequency. The small incremental effect resulting from SNL/CA activities would
not contribute appreciable cumulative impacts.
6.2.9
SOCIOECONOMICS
The population density of the area within the ROI is high.
The SWEA found the socioeconomic impact is beneficial,
and small (0.2 percent) (see Table 6-1).
6.2.10 ENVIRONMENTAL JUSTICE
Based on the SWEA analyses of all the resource areas
and topic areas, impacts that would result during the
course of normal operations would not pose disproportionately high and adverse health or environmental
Maximally Exposed Individual
A hypothetical person at a location where he or she could potentially receive the maximum dose of radiation.
6-4
Final SNL/CA SWEA DOE/EA-1422—January 2003
Chapter 6, Cumulative Effects Analysis
impacts on minority and low-income populations within
the ROI (15-mile radius from SNL/CA). No incremental
impacts would be expected.
6.3
RESOURCES WITH POTENTIAL
CUMULATIVE IMPACTS
Potential impacts to biological resources, air quality,
and transportation pose incremental changes in this
assessment. The following discussion summarizes the
baseline condition (Maximum Operations Alternative)
of each of the areas discussed in detail.
6.3.1
BIOLOGICAL RESOURCES
SNL/CA serves as a refugium for wildlife in the general area, providing open space, habitat, and protection.
Implementation of the three major features of the Maximum Operations Alternative that could affect biological
resources, the Arroyo Seco Improvement Program, construction in undeveloped areas, and fire management in
grasslands areas, would likely serve to improve wildlife
habitat to a small extent. While there would be some
small loss of terrestrial habitat due to construction,
implementation of the Arroyo Seco Improvement Program would enhance the diversity and utilization of this
corridor and the biological value of the site as a whole.
Continued operation under the Maximum Operations
Alternative would perpetuate the provision of habitat and
its protection. When taken in context with the continuing
area-wide conversion of wildlife habitat for agricultural,
residential, and commercial and industrial use, the incremental effect of the proposed action would likely be very
positive, particularly in the long term.
6.3.2
AIR QUALITY
Data reported in 1999 indicated that the City of Livermore has the worst air quality in the San Francisco Bay
Area in terms of ozone and particulate matter (Livermore
Final SNL/CA SWEA DOE/EA-1422—January 2003
2001). Current growth rates in the ROI (Livermore Valley
Basin) would negatively impact air quality. Much of the air
quality problem is from traffic emissions. The estimated
number of daily commuters to SNL/CA during FY2001 is
700 to 1,000 vehicles. Under the Maximum Operations
Alternative, it is estimated that a 53 percent increase in
daily commuter traffic would occur, resulting in 1,071 to
1,530 vehicles. SNL/CA traffic-related emissions would
represent less than 2 percent of emissions from DOErelated traffic. Correspondingly, the SNL/CA incremental
contribution to the ROI would be less than one percent.
In general criteria and toxic air pollutants emissions are
well below 1 percent of Bay Area emissions (see Section
5.5.6). SNL/CA would account for approximately 7 to
20 percent of DOE-related criteria pollutant emissions
in the Livermore area. For toxic air pollutants, because of
the difference in operations between LLNL and SNL/CA
the emissions are not directly comparable. Cumulative
impacts to air quality are minimal with respect to criteria
and toxic air pollutants from SNL/CA operations.
6.3.3 TRANSPORTATION
Data reported in 2001 indicated that Vasco Road
and Greenville Road Average Annual Daily Traffic
was 145,000 and 117,000 vehicles, respectively (see
Table 6-1). SNL/CA commuters would represent less
than 1.1 percent under the Maximum Operations
Alternative. Current growth rates for the ROI are
much higher than the resulting increase in SNL/CA
commuter traffic.
6.4
CONCLUSION
The effects of the Maximum Operations Alternative,
when combined with those effects of other actions
defined in the scope of this chapter, do not result in
cumulatively significant impacts.
6-5
This page intentionally left blank.
Chapter 7, Applicable Laws, Regulations, and Other Requirements
CHAPTER 7
Applicable Laws, Regulations, and Other Requirements
Environmental compliance requirements, including statutes, regulations, and orders, which are applicable to the
alternatives, will be presented in this chapter.
7.1
INTRODUCTION
As part of the National Environmental Policy Act (NEPA)
process, the Sandia National Laboratories/California
(SNL/CA) Site-Wide Environmental Assessment (SWEA)
should consider, in determining the impacts, if actions
described under the SWEA alternatives threaten to violate
any Federal, state, or local law or requirement and must list
all required Federal permits, licenses, or other entitlements
(40 Code of Federal Regulations [CFR] §1508.27(b)(10) and
§1502.25, respectively). This chapter summarizes assessment of the major existing environmental requirements,
agreements, and permits that relate to continuing operations at SNL/CA.
In addition to this introduction, Chapter 7 is divided
into two sections. Section 7.2 describes general environmental laws, regulations, and other requirements under
which the United States (U.S.) Department of Energy
(DOE) must proceed in preparing the SWEA. Section 7.3
describes specific environmental requirements for each
resource area.
7.2
7.2.1
GENERAL ENVIRONMENT, HEALTH,
SAFETY LAWS, REGULATIONS, AND
OTHER REQUIREMENTS
ATOMIC ENERGY ACT OF 1954
(42 U.S.C. §2011)
The Atomic Energy Act (AEA) of 1954 makes the
Federal government responsible for regulatory control
of the production, possession, and use of three types of
radioactive material: source, special nuclear, and by-product. Regulations promulgated by the U.S. Nuclear Regulatory Commission (NRC) under the AEA establish standards for the management of these radioactive materials,
licensing of nuclear facilities, and protection of the public
and property against radiation. The AEA authorizes the
DOE to set radiation protection standards for itself and
its contractors for DOE nuclear facilities and provides
exclusions from NRC licensing for defense production
facilities. The NRC regulates private and commercial
nuclear activities, but currently has no regulating authority at most DOE facilities. In December 1996, the
DOE announced that it would begin a process of transferring oversight of nuclear safety to the NRC for all DOE
nuclear facilities. The transfer, which requires legislative
action, is to be phased-in over a 10-year period.
The AEA authorizes the DOE to establish standards
that protect health and minimize danger to life or property from activities under the DOE’s jurisdiction. The
mechanisms through which DOE manages its facilities
are the promulgation of regulations and the issuance
of DOE orders and associated standards and guidance.
Requirements for the protection of environment, safety,
and health are implemented at DOE sites primarily
through contractual mechanisms, which establish the
applicable DOE requirements for management and
operating contractors.
7.2.2
NATIONAL ENVIRONMENTAL POLICY ACT OF
1969, AS AMENDED (42 U.S.C. §4321)
NEPA requires Federal agencies to evaluate the environmental impacts of proposed actions on the quality of the
human environment and to document this evaluation
with a succinct statement. The Act also created the Council on Environmental Quality (CEQ), which oversees the
NEPA process. NEPA requires an agency to consider the
environmental impacts of an action, prior to taking action
that would preclude any reasonable alternative actions. It
also provides for public input into the decision-making
process.
7.2.3
REGULATIONS FOR IMPLEMENTING
THE PROCEDURAL PROVISIONS OF
THE NATIONAL ENVIRONMENTAL POLICY
ACT (40 CFR PARTS 1500-1508)
The implementing regulations for NEPA were developed by the CEQ. These regulations seek to integrate the
NEPA process into the early planning phase of a project
to insure appropriate consideration of NEPA policies
and to eliminate delay; emphasize cooperative consultation among agencies before the environmental document
is prepared; identify at an early stage the significant environmental issues deserving of study and de-emphasize
insignificant issues, thus, narrowing the scope of the
environmental document; provide a mechanism for
putting appropriate time limits on the environmental
documentation process; and provide for public participation in the NEPA process.
7.2.4
NATIONAL ENVIRONMENTAL POLICY
ACT IMPLEMENTING PROCEDURES
(10 CFR PART 1021)
The DOE established its NEPA implementing procedures
to meet the requirements of Section 102(2) of NEPA,
Final SNL/CA SWEA DOE/EA-1422—January 2003
7-1
Chapter 7, Applicable Laws, Regulations, and Other Requirements
CEQ implementing regulations, and Executive Order
(EO) 11514, Protection and Enhancement of Environmental Quality (35 Federal Register [FR] 4247). The procedures formalize DOE’s policy to follow the letter and
spirit of NEPA, comply fully with the CEQ regulations,
and apply the NEPA review process early in the planning
stages for DOE proposals. The Site-Wide Environmental
Assessment is being prepared under 10 CFR §1021.330,
programmatic (including site-wide) NEPA documents,
requiring preparation of site-wide environmental documentation for certain of its large, multiple-facility sites.
7.2.5
PROTECTION AND ENHANCEMENT OF
ENVIRONMENTAL QUALITY (EO 11514)
Under EO 11514, Federal agencies are required to monitor and control their activities continually to protect and
enhance the quality of the environment (35 FR 4247).
It directs agencies to develop programs and measures to
protect and enhance environmental quality and further
directs heads of agencies to consult with appropriate
Federal, state, and local agencies in carrying out their
activities as they affect the quality of the environment.
EO 11514 contains requirements to ensure that Federal
agencies include the public in the decision-making process. This order was in part responsible for the development of the DOE implementing procedures for NEPA
and DOE Order 451.1A, National Environmental Policy
Act Compliance Program.
7.2.6
FEDERAL COMPLIANCE WITH POLLUTION
CONTROL STANDARDS (EO 12088)
Under EO 12088, the head of each executive agency is
responsible for ensuring that all necessary actions are
taken for the prevention, control, and abatement of environmental pollution with respect to Federal facilities and
activities under their control (43 FR 47707). Specifically,
they must ensure compliance with applicable pollution
control standards, including those established by, but not
limited to, the Clean Air Act (CAA), Noise Control Act
(NCA), Clean Water Act (CWA), Safe Drinking Water
Act (SDWA), TSCA, and RCRA.
7.2.7
DOE O 451.1A, NATIONAL ENVIRONMENTAL
POLICY ACT COMPLIANCE PROGRAM
This order establishes DOE internal program requirements and responsibilities for implementing NEPA, CEQ
implementing regulations, and DOE NEPA implementing
procedures.
7.2.8
DOE O 5400.1, GENERAL
ENVIRONMENTAL PROTECTION PROGRAM
This order establishes the environmental protection program requirements, authorities, and responsibilities for
DOE operations for ensuring compliance with applicable
7-2
Federal, state, and local environmental protection
laws and regulations, EOs, and internal DOE policies.
This order also provides for environmental protection
standards, notification, and reporting requirements for
discharges and unplanned releases, environmental protection and program plans, and environmental monitoring
and surveillance requirements. It establishes formal recognition that DOE’s environmental management activities
are extensively, but not entirely, regulated by the U.S.
Environmental Protection Agency (EPA), state, and local
environmental agencies, and it provides requirements for
satisfying these externally imposed regulations. In addition, it establishes requirements for those environmental
protection programs that are not externally regulated.
7.3
ENVIRONMENT, HEALTH, AND
SAFETY LAWS, REGULATIONS,
AND OTHER REQUIREMENTS
FOR EACH RESOURCE AREA
Because SNL/CA was constructed and began operations
in the 1950s, before the advent of current environmental
requirements, operational nuclear safety and national
security were the dominant factors in the early design
and operation of facilities. With the enactment of environmental laws and regulations from the 1960s to the
present, resources and philosophies have changed to place
greater emphasis on achieving compliance with all applicable environmental requirements. Due to its long history,
SNL/CA has had difficulty in achieving compliance with
some regulatory requirements and has a legacy from past
management practices of environmental cleanup requirements for waste, spills, and releases. All environmental
protection, legacy environmental cleanup, and operational
compliance activities at SNL/CA are covered by laws,
regulations, permits, and DOE orders. Several agreements
are also in effect with regulatory agencies to bring SNL/
CA into full compliance with some regulatory requirements. In general, the DOE and SNL/CA must now
comply with applicable Federal and state requirements
to the same extent as any other entity. Noncompliance
with these requirements can lead to enforcement actions.
Applicable environmental laws, regulations, and other
requirements have been identified for each of the resources evaluated in this SWEA. These are discussed below by
resource.
7.3.1
7.3.1.1
LAND USE AND VISUAL RESOURCES
DOE P 430.1, DOE Land
Use and Facility Policy
This policy governs DOE’s management of its land
and facilities as valuable national resources, based on
the principles of ecosystem management and sustainable
development.
Final SNL/CA SWEA DOE/EA-1422—January 2003
Chapter 7, Applicable Laws, Regulations, and Other Requirements
7.3.2
7.3.2.1
INFRASTRUCTURE
Hazardous Materials
(29 CFR Part 1910, Subpart H)
This regulation provides the health and safety requirements for work with and around hazardous materials.
Subpart H covers work involving compressed gas cylinders, hazardous compounds and elements (such as acetylene, explosive agents, and hydrogen), and mechanical
processes involving dip tanks and spray finish units. It
includes Subpart 1910.120, Hazardous Waste Operations,
which is the main health and safety regulation for work
in hazardous waste operations.
7.3.2.2
Hazardous Waste Operations and
Emergency Response (29 CFR §1910.120)
This regulation specifies requirements for conducting
waste operations and response activities. These requirements include both activity and training requirements
for personnel.
7.3.2.3
Materials Handling and Storage
(29 CFR Part 1910, Subpart N)
This regulation specifies requirements for material
handling equipment such as cranes, derricks, helicopters,
slings, and powered industrial trucks. This subpart covers
the minimum distance a worker must be from a single
rim and multi-piece rim wheel while servicing the tire and
the maintenance and use of forklifts, cranes, and derricks.
7.3.2.4
Toxic and Hazardous Substances
(29 CFR Part 1910, Subpart Z)
This regulation provides requirements for performing
air monitoring and medical monitoring for a variety
of hazardous chemicals and materials such as asbestos,
methyl chloromethyl ether, vinyl chloride, benzene, blood
borne pathogens, and cotton dust. It also establishes
acceptable levels for toxic and hazardous substances in
the blood of workers, as well as proper collection and
measuring techniques.
7.3.2.5
California Electric Utility Industry
Restructuring Act (Assembly Bill 1890)
The California Electric Utility Industry Restructuring Act
provides requirements for establishing the restructure of
the electric utility industry, including customer choice in
the supply of electricity, and establishment of the Independent System Operator to control electric transmission.
7.3.2.6
DOE O 251.4, Environmental, Safety,
and Health Program for Department
of Energy Operations
This order applies to ES&H programs at all governmentowned, contractor-operated facilities including the occuFinal SNL/CA SWEA DOE/EA-1422—January 2003
pational safety and health programs for DOE contractor
employees at facilities where the contracts include the
occupational safety and health contract clause specified
in 48 CFR, Federal Acquisition Regulations. This order
also applies to environmental protection programs and
programs for protection against accidental loss or damage
to property as provided by law or contract and as implemented by the appropriate contracting officer.
7.3.2.7
DOE 5480.4, Environmental Protection,
Safety and Health Protection Standards
This order specifies the requirements for the application
of mandatory ES&H standards applicable to all DOE and
DOE contractor operations, provides a listing of reference
ES&H standards, identifies the sources of the mandatory
and reference ES&H standards, and specifies several mandatory and reference standards applicable to nuclear criticality protection for all DOE nuclear facilities. It also
mandates that hazardous waste regulations set forth in
40 CFR Parts 260-265 be followed as a matter of policy.
7.3.3
GEOLOGY AND SOILS
Regulatory environmental protection statutes governing
geology and soils are addressed under other resource
areas in this chapter. They include the RCRA (42 U.S.C.
§6901), the Comprehensive Environmental Response Compensation and Liability Act (CERCLA) (42 U.S.C. §6902),
and the 1986 amendment to the CERCLA, the Superfund
Amendments and Reauthorization Act (SARA) (42 U.S.C.
§6902, as amended).
7.3.4
7.3.4.1
WATER RESOURCES AND HYDROLOGY
Clean Water Act of 1948,
as Amended (33 U.S.C. §1251)
The goals of the CWA are to restore and maintain waters
of the U.S. in order to protect human health and safety
and to provide for the protection and propagation of fish,
shellfish, and wildlife. The Act authorizes regulations that
establish limitations and permitting requirements for
hazardous substances being discharged from point sources, dredge or fill operations at wetlands and other waters
of the U.S., storm water discharges from industrial runoff, and oil discharges. Key elements of the Act include
nationally applicable, technology-based effluent limitations set by the EPA for specific industry categories, and
water quality standards set by states.
The U.S. Army Corps of Engineers administers the
dredge or fill material permit program (Section 404)
of the Act.
The CWA contains provisions for the National Pollutant
Discharge Elimination System (NPDES), a permitting
program for the discharge of pollutants from any point
source into waters of the U.S. Individual NPDES permits
7-3
Chapter 7, Applicable Laws, Regulations, and Other Requirements
set parameters and maximum contaminant levels for
specified pollutants at specific outfall sites.
7.3.4.4
To comply with the CWA, the City of Livermore issues
wastewater permits under the City of Livermore Sewer Use
and Wastewater Control Ordinance. Under this ordinance,
SNL/CA is subject to limitations on volumes and constituent concentrations for wastewater discharged to the
sanitary sewer.
SNL/CA has a spill control and countermeasures plan,
as required by 40 CFR Part 112. The 1990 Oil Pollution
Act rewrote sections of the CWA. This plan requires that
secondary containment be provided for all aboveground
storage tanks. The plan also provides for spill control at
oil storage sites at SNL/CA. This plan meets requirements
of both EPA and California for control of spills to surface
areas and below the ground surface.
7.3.4.2
Safe Drinking Water Act of 1944,
as Amended (42 U.S.C. §300f)
The SDWA sets national standards for contaminant
levels in public drinking water systems, regulates the use
of underground injection wells, and prescribes standards
for groundwater aquifers that are a sole source of drinking water. Primary enforcement responsibility for the Act
is by the states. The Act authorizes regulations that establish national drinking water standards for contaminants
in public drinking water systems. The EPA maintains
oversight responsibilities over the states, sets new contaminant standards as appropriate, and maintains separate
enforcement responsibility for the Underground Injection
Control Program.
7.3.4.5
Spill Control and Countermeasures
Plan (40 CFR Part 112)
DOE 5400.1, General
Environmental Protection Program
(modified by DOE O 231.1)
This order requires SNL/CA to prepare a groundwater
protection management program plan (GWPMPP) and to
implement the program outlined by that plan. GWPMPP
also fulfills the requirements of Chapter IV, Section 9, of
the order, which requires development of a groundwatermonitoring plan. The groundwater-monitoring plan identifies all DOE requirements and regulations applicable to
groundwater protection and includes strategies for sampling, analysis, and data management.
The SDWA applies to Federal facilities that own or
operate a public water system. A public water system is
defined as a system for the provision of piped water for
human consumption that has at least 15 service connections or regularly serves at least 25 individuals. Lawrence
Livermore National Laboratory (LLNL) provides drinking
water to SNL/CA. LLNL is required to monitor drinking
water quality for organic and inorganic compounds,
radionuclides, metals, turbidity, and total coliforms.
Chapter IV, Section 9c, of DOE 5400.1 requires that
groundwater monitoring be determined by site-specific
characteristics and, where appropriate, that groundwater
monitoring programs be designed and implemented in
accordance with RCRA regulations 40 CFR Part 264,
Subpart F, or 40 CFR Part 265, Subpart F. These regulations also require that monitoring for radionuclides be
in accordance with DOE 5400.5, Radiation Protection
of the Public and the Environment.
7.3.4.3
7.3.4.6
National Drinking Water Regulations
(40 CFR Parts 141-143)
These regulations establish primary (40 CFR Part 141)
and secondary (40 CFR Part 143) drinking water standards; 40 CFR Part 141 also establishes regulations applicable to public water systems. Although the primary
standards are Federally enforceable (40 CFR Part 142),
the secondary standards are intended as guidelines for
the states. The primary and secondary standards have
been adopted by California. Along with inorganic and
organic constituents, the primary standards also establish
limits for radioactivity and some radioactive constituents
in drinking water. The annual dose to the general public
from beta and photon emitters is limited to 4 millirem
(1/1000 of a rem) and there are maximum contaminant
levels for alpha, radium, and uranium. The DOE also
establishes this same level in DOE 5400.5, Radiation
Protection of the Public and the Environment. The secondary standards relate to contaminants in drinking water
that primarily affect aesthetic qualities related to public
acceptance of drinking water.
7-4
Porter-Cologne Water Quality
Control Act (California Water
Code §13000, et seq.)
In the state of California, both surface water and groundwater resources are protected under the Porter-Cologne
Water Quality Control Act, which created the State Water
Resources Control Board and nine Regional Water Quality Control Boards (RWQCBs). Each RWQCB is responsible for preparing and updating a water quality control
plan (basin plan) every three years; the basin plan for a
specific region identifies water quality protection policies
and procedures for that region.
7.3.4.7
Section 1601/1603 of
the Fish and Game Code
The California Department of Fish and Game (CDFG)
typically specifies water quality protection measures
when they issue streambed alteration agreements pursuant to Section 1601/1603 of the Fish and Game Code.
However, as an agency of the Federal government, DOE is
exempt from these requirements.
Final SNL/CA SWEA DOE/EA-1422—January 2003
Chapter 7, Applicable Laws, Regulations, and Other Requirements
7.3.5
7.3.5.1
BIOLOGICAL RESOURCES
Endangered Species Act of 1973,
as Amended (16 U.S.C. §1531)
The Endangered Species Act requires that a Federal
agency ensure that any actions authorized, funded, or
carried out by the agency are not likely to jeopardize the
continued existence of any threatened or endangered
species or destroy or adversely modify critical habitat.
The Act is jointly administered by the U.S. Department
of Commerce, National Marine Fisheries Service
(NMFS), the U.S. Department of the Interior (DOI),
and the U.S. Fish and Wildlife Service (USFWS). Under
the Act, agencies undergo a process of informal and formal consultation, which may include preparation of a
biological assessment, to determine if a threatened or
endangered species would be affected by planned
agency activities.
The DOE has consulted with the USFWS and the
CDFG regarding concerns each agency may have about
the impact of SNL/CA activities on protected animal
and plant species.
7.3.5.2
Migratory Bird Treaty Act of 1918,
as Amended (16 U.S.C. §703)
This Act protects migratory birds by making it unlawful
to pursue, take, attempt to take, capture, possess, or kill
any migratory bird, or any part, nest, or egg of any such
bird, unless and except as permitted by regulation. The
Act is intended to protect birds that have common migratory patterns within the U.S., Canada, Mexico, Japan, and
Russia.
7.3.5.3
Bald and Golden Eagle Protection
Act of 1940 (16 U.S.C. §668)
This Act makes it unlawful to capture, kill, destroy,
molest, or disturb bald (American) and golden eagles,
their nests, or their eggs anywhere in the U.S. A permit
must be obtained from the DOI to relocate a nest that
interferes with resource development or recovery
operations.
7.3.5.4
Fish and Wildlife Coordination Act
of 1934 (16 U.S.C. §661, et seq.)
This Act requires Federal agencies involved in actions that
result in structural modification or control of any natural
stream or body of water for any purpose to take action to
protect the fish and wildlife resources that may be affected by the action.
7.3.5.5
Section 404 of the Clean Water Act
of 1948 (33 U.S.C. §1344)
Section 404 of the CWA requires permits to authorize the
discharge of dredged or fill material into navigable waters
Final SNL/CA SWEA DOE/EA-1422—January 2003
or wetlands and to authorize certain structures or work in
or affecting navigable waters. Authority to issue permits
resides with the USACE.
Individual permits issued by the USACE under Section
404 are reviewed at the Federal level by EPA.
7.3.5.6
Protection of Wetlands (EO 11990)
and Floodplain Management (EO 11988)
EO 11990 requires government agencies to avoid shortand long-term adverse impacts to wetlands whenever a
practicable alternative exists (42 FR 26961). EO 11988
directs Federal agencies to establish procedures to ensure
that the potential effects of flood hazards and floodplain
management are considered for any action undertaken
(42 FR 26951). Impacts to floodplains are to be avoided
to the extent practicable. The DOE issued regulations
(10 CFR Part 1022) that establish procedures for
compliance with these EOs.
7.3.5.7
California Endangered Species Act
(Fish & Game Code §§2050, et seq.)
The California Endangered Species Act (CESA) generally
parallels the main provisions of the Federal Endangered
Species Act and is administered by the CDFG. Under
CESA, the term “endangered species” is defined as a
species of plant, fish, or wildlife that is “in serious danger
of becoming extinct throughout all, or a significant portion of its range” and is limited to species or subspecies
native to California. CESA establishes a petitioning process for the listing of threatened or endangered species.
The California Fish and Game Commission is required to
adopt regulations for this process and establish criteria
for determining whether a species is endangered or
threatened. The California Code of Regulations, Title 14,
§670.1(a), sets forth the required contents for such a
petition. CESA prohibits the “taking” of listed species
except as otherwise provided in state law. Unlike its
Federal counterpart, CESA applies the take prohibitions
to species petitioned for listing (state candidates).
7.3.5.8
California Wildlife Conservation
Law of 1947 (Fish & Game Code
§§ 1300, et seq.)
This law establishes requirements for protecting wildlife,
primarily related to taking for sport purposes, and permits
for collecting and use. The law also protects endangered
and threatened animals listed by the state of California.
7.3.5.9
Natural Community Conservation
Planning Act (Fish & Game
Code §§2800, et seq.)
The Natural Community Conservation Planning (NCCP)
program of the Department of Fish and Game is an effort
by the State of California, and numerous private and
7-5
Chapter 7, Applicable Laws, Regulations, and Other Requirements
public partners that takes a broad-based ecosystem
approach to planning for the protection and perpetuation of biological diversity. The goal of a NCCP programs
identifies and provides for the regional or area-wide
protection of plants, animals, and their habitats, while
allowing compatible and appropriate economic activity.
The NCCP program is a cooperative effort to protect
habitats and species. The program, which began in 1991
under the State’s Natural Community Conservation Planning Act, is broader in its orientation and objectives than
the California and Federal Endangered Species Acts. The
primary objective of the NCCP program is to conserve
natural communities at the ecosystem scale while accommodating compatible land use. The program seeks to
anticipate and prevent the controversies and gridlock
caused by species’ listings by focusing on the long-term
stability of wildlife and plant communities and including
key interests in the process.
The NCCP program applies statewide, although there is
currently no NCCP region near SNL/CA.
7.3.6
7.3.6.1
CULTURAL RESOURCES
National Historic Preservation Act
of 1966, as Amended (16 U.S.C. §470)
This Act directs that sites with significant historic
value be placed on the National Register of Historic
Places (NRHP). Government agencies must locate and
inventory historic properties and cultural resources under
their jurisdiction before taking an action that might harm
them, with the intent of minimizing such harm through
appropriate mitigation actions. As required by Section
106 of the Act, proposed SNL/CA activities are evaluated
in consultation with the State Historic Preservation
Officer (SHPO) for possible effects on historic properties.
7.3.6.2
The American Indian Religious
Freedom Act of 1978 (42 U.S.C. §1996)
This Act establishes that it is the policy of the United
States to protect and preserve for Native Americans their
inherent right of freedom to believe, express, and exercise
their traditional religions. This includes access to sites,
use and possession of sacred objects, and the freedom to
worship through ceremonies and traditional rites.
7.3.6.3
Archeological Resources Protection Act
of 1979, as amended (16 U.S.C. §470aa)
This Act requires the preservation and management of
archaeological resources greater than 100 years old on
lands administered by Federal agencies.
7-6
7.3.6.4
The Native American Graves
Protection and Repatriation Act
of 1990 (25 U.S.C. §3001)
This Act states that tribal descendants shall own Native
American human remains and cultural items discovered
on Federal lands after November 16, 1990. When items
are discovered during an activity on Federal lands, the
activity is to cease and the appropriate tribal government
is to be notified. Work on the activity can resume 30 days
after the receipt of certification that notice has been
received by the tribal government. A consultation process
is used to determine which tribe(s) is affiliated with the
remains or items, and disposition and treatment is
accomplished in accordance with the wishes of the
affiliated tribe.
7.3.6.5
Protection of Historic and Cultural
Properties (36 CFR Part 800)
This regulation defines the process used by Federal
agencies to meet their responsibilities under Section 106
of the National Historic Preservation Act. Section 106 of
the Act requires Federal agencies to take into account the
effects of the agency’s activities on properties included
in or eligible for the NRHP and, prior to approval of an
undertaking, to afford the State Historic Preservation
Officer and the Advisory Council on Historic Preservation a reasonable opportunity to comment on the activity.
The overall goal is to accommodate historic preservation
concerns during Federal undertakings.
7.3.6.6
National Historic
Preservation (EO 11593)
This EO requires Federal agencies, including the DOE,
to locate, inventory, and nominate properties under their
jurisdiction or control to the NRHP if those properties
qualify (36 FR 8921). The DOE is required to provide the
Advisory Council on Historic Preservation the opportunity to comment on possible impacts of a proposed activity
on any potentially eligible or listed resources.
7.3.6.7
Indian Sacred Sites (EO 13007)
This EO requires that each executive branch agency with
statutory or administrative responsibility for the management of Federal lands shall, to the extent practicable, permitted by law, and not clearly inconsistent with essential
agency functions, accommodate access to and ceremonial
use of sacred sites by Native American religious practitioners, and avoid adversely affecting the physical integrity
of such sacred sites (61 FR 26771).
Final SNL/CA SWEA DOE/EA-1422—January 2003
Chapter 7, Applicable Laws, Regulations, and Other Requirements
7.3.6.8
Consultation and Coordination with
Indian Tribal Governments (EO 13175)
This EO establishes regular and meaningful consultation and collaboration with tribal officials in developing
Federal policies. It also requires each Federal agency to
have an answerable process to ensure meaningful and
timely input by tribal officials in developing Federal
policies and other activities that have tribal implications
(65 FR 67249).
7.3.6.9
American Indian Tribal Government
Policy (DOE Order 1230.2)
This order provides guidance for consulting and coordinating with Indian tribal governments in compliance
with Federal statutes and regulations. The policy directs
all DOE officials, staff, and contractors regarding fulfilling
trust obligations and responsibilities arising from Departmental actions that may potentially affect American
Indians’ and Alaska Natives’ traditional, cultural, and
religious values and practices; natural resources; and
treaties and other Federally recognized and reserved
rights.
control of acid rain, regulation of air toxins, mobile
sources, and protection of the ozone layer. Section 118
of the Act and EO 12088, Federal Compliance With Pollution Control Standards (43 FR 47707), require that each
Federal agency, such as the DOE, with jurisdiction over
any property or facility that might result in the discharge
of air pollutants, comply with “all Federal, state, interstate, and local requirements” with regard to the control
and abatement of air pollution to the same extent as any
nongovernmental entity.
The EPA is the regulating authority for the CAA. However, the EPA has granted authority to the state of California for regulating air quality under an approved state
implementation plan (SIP). The EPA has delegated to
the state the authority for implementing the regulations
promulgated for stratospheric ozone protection and the
accidental release provisions of the Act.
The EPA continues to regulate the radionuclide
National Emissions Standards for Hazardous Air
Pollutants (NESHAP) and radon emissions.
7.3.7.2
7.3.6.10 Department of Energy Management of
Cultural Resources (DOE Policy 141.1)
This policy ensures that DOE and NNSA programs
integrate cultural resource management into their
missions and activities, and raises the awareness of the
importance of the Department’s cultural resource-related
legal and trust responsibilities. The policy directs that
all DOE programs and missions will be implemented in
a manner consistent with Federal statutes, regulations,
orders, DOE Orders, and implementation guidance
protecting cultural resources.
7.3.7
7.3.7.1
This regulation limits the radiation dose to the public
from airborne radionuclide emissions from DOE facilities
to 10 mrem per year effective dose equivalent (EDE)
(40 CFR §61.92). The standards also prescribe emission
monitoring and test procedures for determining compliance with the 10 mrem per year standard and reporting
and permit provisions.
7.3.7.3
AIR QUALITY
Clean Air Act of 1955,
as Amended (42 U.S.C. §7401)
The CAA establishes air quality standards to protect
public health and the environment from the harmful
effects of air pollution. The Act requires establishment
of national standards of performance for new stationary
sources of atmospheric pollutants, emissions limitations
for any new or modified structure that emits or may emit
an air pollutant, and standards for emission of hazardous
air pollutants. In addition, the CAA requires that specific
emission increases be evaluated to prevent a significant
deterioration in air quality.
The Clean Air Act Amendments of 1990, signed into law
on November 15, 1990, enhanced and expanded existing
authorities and created new programs in the areas of
permitting, enforcement, and operations in nonattainment areas (areas not meeting air quality standards),
Final SNL/CA SWEA DOE/EA-1422—January 2003
Protection of Environment: National
Emission Standards for Hazardous Air
Pollutants (40 CFR Part 61)
Accidental Release Prevention
Requirements: Risk Management
Programs (40 CFR Part 68)
The intent of this regulation is to prevent accidental
releases to the air and mitigate the consequences of such
releases by focusing prevention measures on chemicals
that pose the greatest risk to the public and the environment. This regulation requires the preparation of risk
management plans for listed regulated chemicals and
within 3 years after listing any new regulated chemical.
7.3.7.4
Protection of Stratospheric
Ozone (40 CFR Part 82)
The primary purposes of this regulation are to eliminate
the production of certain ozone-depleting substances and
require users of the substances to reduce emissions to the
atmosphere through recycling and mandatory use of certified maintenance technicians. These requirements are
applicable to SNL/CA and are implemented accordingly.
7-7
Chapter 7, Applicable Laws, Regulations, and Other Requirements
7.3.7.5
California Clean Air Act and
Amendments (California Health and
Safety Code, §§40910 et seq.)
Nonradioactive air emissions from SNL/CA facilities
are subject to the regulatory requirements established
under this Act. The California Air Resources Board
(CARB), as provided by the Act, regulates air quality
through a series of air quality control regulations. These
regulations include ambient air quality standards (AAQS)
and emission standards for emission sources and processes such as backup generators, boilers, and asphalt plants.
At SNL/CA, these regulations are administered by the Bay
Area Air Quality Management District (BAAQMD).
7.3.7.6
Bay Area Air Quality Management
District, Regulation 2, Permitting
On July 21,1992, the EPA promulgated 40 CFR Part 70,
Operating Permit Program, which implements Title V of
the CAA. The purposes of this program are to identify all
the air quality regulations and emission limitations applicable to an air pollution source and establish monitoring,
record-keeping, and reporting requirements necessary to
demonstrate continued compliance with these requirements. This regulation required each state to develop an
operating permit program meeting the minimum requirements set forth in 40 CFR Part 70.
Local authority rests with the BAAQMD. SNL/CA has
several operating permits. A list of BAAQMD regulations
is available in the SNL/CA Environmental Information
Document.
7.3.7.7
California Construction Permits
Provisions of this regulation require construction
permits for any new or modified source of any regulated
air contaminant if the source is expected to exceed threshold emission rates. More than 500 toxic air pollutants are
regulated, and each chemical’s threshold hourly rate is
based on its toxicity. Each new or modified air emission
source is reviewed and conservative estimates are made
of maximum hourly chemical use and emissions.
7.3.7.8
Conformity of General Federal Actions
to the State Implementation Plan
The purpose of this regulation is to implement Section
176(c) of the CAA and regulations under 40 CFR Part 51,
Subpart W, Determining Conformity of General Federal
Actions to State or Federal Implementation Plans, with
respect to the conformity of general Federal actions to
the SIP. Under those authorities, no department, agency,
or instrumentality of the Federal government shall engage
in, support in any way or provide financial assistance for,
license or permit, or approve any activity that does not
conform to a SIP. This regulation sets forth policy,
7-8
criteria, and procedures for demonstrating and assuring
conformity of such actions to the SIP.
7.3.8
7.3.8.1
HUMAN HEALTH AND WORKER
SAFETY (INCLUDING ACCIDENTS)
Occupational Radiation
Protection (10 CFR Part 835)
This regulation derives regulatory requirements from the
AEA and not from the Occupational Safety and Health
Act of 1970 (OSHA). 10 CFR Part 835 establishes worker
radiation protection standards limiting exposures from
ionizing radiation. For the occupational worker, the standard is 5 Roentgen equivalent, man (rem) (5,000 mrem)
in any one year; and for members of the public entering
a controlled area, the standard is 100 mrem per year.
The standards for both internal and external exposure
are described in Subpart C. The as low as reasonably
achievable (ALARA) goal is set forth as the approach
to be implemented by the DOE for radiation protection
of workers and the general public. The management
and control of radiation exposure will involve ALARA
when considering individual and collective exposures.
7.3.8.2
Occupational Safety and Health Act
of 1970 (29 U.S.C. §651)
OSHA, administered and enforced by the U.S. Department of Labor (DOL), establishes a national policy to
provide safe and healthful working conditions. States
are encouraged to assume responsibility for administration of their own safety and health standards. Only public
employers, (that is, Federal, state, and municipal governments) and mining employers are excluded. Mining
employers are covered by other safety and health acts.
Federal agencies such as the DOE must have in place
equivalent safety standards, as a minimum.
OSHA standards are designed to reduce on-the-job
injuries and to develop health standards to limit workers
risk of developing occupational disease. OSHA standards
are universal and cover hazards that exist in a wide variety of industries. These are compiled as general industry
standards. 29 CFR Part 1910 covers general industry
standards, including walking and working surfaces, platforms and their use, health and environmental controls,
hazardous materials, personal protective equipment,
medical and first aid, fire protection, compressed gas and
air equipment, materials handling and storage, machinery
and machine guarding, hand and portable tools, welding,
cutting and brazing, electrical, commercial diving, and
toxic and hazardous substances. OSHA has promulgated
industry-specific standards for construction, agriculture,
and maritime sectors.
The provisions of Section 19 of the OSHA; EO 12196
(45 FR 12769); and Part 1925 (Safety and Health StanFinal SNL/CA SWEA DOE/EA-1422—January 2003
Chapter 7, Applicable Laws, Regulations, and Other Requirements
dards for Federal Service Contracts) and Part 1960 (Basic
Program Elements for Federal Employees OSHA) of Title
29 identify OSHA’s applicability to DOE operations.
These provisions are summarized as follow:
❍
Furnish employees with places and conditions of
employment that are free from recognized hazards
that are causing or are likely to cause death or serious
physical harm.
❍
Set up procedures for responding to employee reports
of unsafe and unhealthful working conditions.
❍
Acquire, maintain, and require the use of approved
personal protective equipment and safety equipment.
❍
Inspect all workplaces at least annually with
participation by representatives of employees.
❍
Establish procedures to ensure that no employee is
subject to restraint, interference, coercion, discrimination or reprisal for exercising his/her right under
the agency’s safety and health program.
❍
Post notices of unsafe or unhealthful working
conditions found during inspections.
❍
Ensure prompt abatement of hazardous conditions.
Employees exposed to the conditions must be so informed and Imminent-danger corrections must be
made immediately.
❍
Set up management information systems to keep
records of occupational accidents, injuries, illnesses,
and their causes, and post annual summaries of
injuries and illnesses for a minimum of 30 days
at each establishment.
❍
Conduct occupational safety and health training
programs for top management, supervisors, safety
and health personnel, employees, and employee
representatives.
7.3.8.3
Occupational Safety and Health
Standards (29 CFR Part 1910)
29 CFR Part 1910 provides standards for safe operations
of facilities. Part 1910 includes 19 subparts, all of which
are applied to SNL/CA operations. These subparts cover
items such as toxic and hazardous substances, personal
protective equipment, material handling and storage,
permissible exposure limits, general environmental controls, and reporting of occupational accidents, injuries,
and illnesses.
7.3.8.4
Federal Employee Occupational
Safety and Health Programs and
Related Matters (29 CFR Part 1960)
requirements and procedures for Federal agencies to
provide occupational safety and health programs for
their employees (45 FR 12769). Federal agencies such as
the DOE must have in place equivalent safety standards,
as a minimum.
The head of each Federal agency is charged with the
responsibility to “establish and maintain an effective and
comprehensive occupational safety and health program
which is consistent with the standards” set by OSHA for
private sector employees. That broad mandate is further
defined by EO 12196, which identifies the responsibilities
of the agencies and the role of the Secretary of Labor in
developing, implementing, and evaluating such programs.
DOE safety standards are specified in DOE Orders.
Although OSHA does not directly apply to DOE employees, SNL/CA’s prime contract with the DOE requires
adherence to DOE O 440.1, which states that contractors
and contractor employees shall adhere to DOE-prescribed
OSHA standards and requirements (29 CFR) for worker
safety. Sandia Corporation, as a private company, is
required to abide by OSHA regulations as well as any
DOE contractual obligations or requirements in its operation of SNL/CA. These two sets of agency requirements
(DOE and OSHA) may overlap in numerous health and
safety areas.
7.3.8.5
Recording and Reporting Occupational
Injuries and Illnesses (29 CFR Part 1904)
29 CFR Part 1904 specifies The Record-Keeping Guidelines
For Occupational Injuries and Illnesses, 1986, which contains the description of the system requirements that
businesses must follow in keeping records of work-related
occupational deaths, injuries, or illnesses. It includes
requirements for recording and reporting to the U.S.
Bureau of Labor Statistics, all occupational injuries and
illnesses requiring more than a first-aid response and
reporting all occupational fatalities. These occupational
injury and illness records have multiple purposes. Mainly,
they are to provide information for employers and employees, raising their awareness of the frequency and
kinds of injuries and illnesses occurring in the workplace
and their related hazards. They also serve as a “management tool” for the administration of company safety and
health programs. The information is also used by OSHA
compliance staff to focus their inspections on the safety
and health hazards revealed by the injury and illness
records. Lastly, the records may be used to produce
statistical data on the incidence of workplace injuries
and illnesses, thereby measuring the magnitude of the
injury and illness problem across the country.
29 CFR Part 1960 provides regulations and guidelines for
implementation of EO 12196, Occupational Safety and
Health Programs for Federal Employees, which establishes
Final SNL/CA SWEA DOE/EA-1422—January 2003
7-9
Chapter 7, Applicable Laws, Regulations, and Other Requirements
7.3.8.6
DOE O 232.1A Occurrence Reporting
and Processing of Operations Information
DOE O 232.1 establishes a system for occurrence
reporting and defines a number of situations that must
be formally reported, all of which are important to the
overall safety, health, and security of workers in the
workplace. These requirements include the categorization
of occurrences that have potential safety, environmental,
health, or operational significance; DOE notification of
these occurrences; and the development and submission
of documented follow-up reports. Occurrence reports
must be done in a timely manner and contain sufficient
information describing the occurrence, significance,
causal factors, and corrective actions. Occurrence reporting increases sensitivity to potentially unsafe conditions,
requires analysis to determine causes of events, is a
vehicle for formal corrective actions, and fosters lessonslearned programs. The documentation and distribution
requirements for the occurrence reports are satisfied with
a centralized, unclassified operational database called the
Occurrence Reporting and Processing System (ORPS).
7.3.8.7
DOE O 231.1, Environment,
Safety, and Health Reporting
The objective of this order is to ensure the collection and
reporting of information on ES&H that is required by law
or regulation or that is essential for evaluation of DOE
operations and for identifying opportunities for improvement needed for planning purposes within the DOE.
Elements contained in this order link to requirements
specified in parts of cancelled DOE 5483.1A, Occupational Safety and Health Program for DOE Contractor Employees at Government-Owned Contractor-Operated Facilities,
and parts of cancelled DOE 5484.1, Environmental Protection, Safety, and Health Protection Information Reporting
Requirements. Requirements for an annual site environmental report, containing summary environmental data,
are set forth in DOE O 231.1. It also specifies the need for
the annual reporting of occupational safety and health
information to the Secretary of Energy in order to allow
the Secretary to comply with 29 CFR Part 1960.
7.3.8.8
DOE 5400.5, Radiation Protection
of the Public and Environment
This order establishes standards and requirements for
operations of the DOE and its contractors with respect to
protection of members of the public and the environment
against undue risk from radiation. This order provides for
general standards; requirements for radiation protection
of the public and the environment; derived concentration
guides for air and water; and guidelines, limits, and controls for residual radioactive materials. The order also
establishes the DOE’s objective to operate its facilities
and conduct its activities so that radiation exposures to
7-10
members of the public are maintained within the limits
established by this order, and to control radioactive contamination through the management of the DOE’s real
and personal property. This order limits the annual effective dose equivalent (EDE) to any member of the public
from all sources to 100 mrem per year. The requirements
of this order are being incorporated into a nuclear safety
regulation.
7.3.8.9
DOE O 440.1A, Worker Protection
Management for Department of Energy
Federal and Contractor Employees
The purpose of DOE O 440.1A is to establish the framework for an effective worker protection program that
will reduce or prevent injuries, illnesses, and accidental
losses by providing Federal and contractor employees
with a safe work environment. This order replaces elements contained in cancelled DOE 5480.4. It contains
requirements for mandatory environmental, safety, and
health standards for areas such as fire protection, threshold limit value (TLVs) for chemical substances and physical agents in the workplace and other industrial hygiene
requirements; construction safety, general safety, explosives safety, firearms safety, and motor vehicle safety. It
also establishes radiological protection program requirements that, combined with 10 CFR Part 835 and associated implementation guidance, form the basis of a
comprehensive radiological protection program.
7.3.8.10 DOE 5480.1B, Environment, Safety,
and Health Program for Department
of Energy Operations
The purpose of DOE 5480.1B is to establish the environment, safety, and health program for the DOE. It establishes standards and requirements for the DOE and DOE
contractor operations regarding protection of the public
and the environment from undue radiological risk. It
contains the DOE’s policy of adopting and implementing
radiation protection standards consistent with those of
the U.S. Nuclear Regulatory Commission (NRC). These
standards are applied to DOE facilities and activities not
subject to NRC licensing.
7.3.8.11 DOE O 225.1A, Accident Investigations
The objective of this DOE Order is to prescribe requirements for conducting investigations of certain accidents
occurring at DOE sites. The prevention of reoccurrence
of such accidents is also prescribed. The order aims to
contribute to the improved environmental protection and
safety of DOE employees, contractors, and the public.
Requirements set forth in this order include the categorization of accidents, the notification of other agencies, the
conduct of investigations of the accidents, and the closeout of the investigations.
Final SNL/CA SWEA DOE/EA-1422—January 2003
Chapter 7, Applicable Laws, Regulations, and Other Requirements
7.3.8.12 Accidents
Risk Management Program Rule (40 CFR Part 68, Subpart
G) This rule establishes the contents of Risk Management
Plans (RMP) that the owner or operator of a facility handling regulated substances must submit to the EPA. An
RMP includes information on the accidental release prevention and emergency response policies in effect, regulated substances handled, worst-case release scenario(s), the
general accidental release prevention program and chemical-specific prevention steps, a 5-year accident history, the
emergency response program, and planned changes to
improve safety. In addition, the owner or operator must
complete a single registration form that covers all regulated substances handled.
7.3.8.13 California Safe Drinking Water and
Toxic Enforcement Act of 1986, known
as Proposition 65 (California Code of
Regulations, Title 22, §12000, et seq.)
Proposition 65 requires the Governor to publish a list
of chemicals that are known to the State of California
to cause cancer, birth defects or other reproductive
harm. This list must be updated at least once a year.
Over 550 chemicals have been listed as of May 31, 2002.
Proposition 65 imposes certain controls that apply to
chemicals that appear on this list. These controls are
designed to protect California’s drinking water sources
from contamination by these chemicals, to allow California consumers to make informed choices about the products they purchase, and to enable residents or workers to
take whatever action they deem appropriate to protect
themselves from exposures to these harmful chemicals.
7.3.9
7.3.9.1
TRANSPORTATION
Hazardous Materials Transportation
Act of 1994 (49 U.S.C. §5101, et seq.)
Under this Act, the Secretary of Transportation may
establish regulations for the safe transport of hazardous
materials. Such regulations may be applicable to manufacturers as well as transporters. Covered activities include
packing, handling, labeling, marking, and routing of
hazardous materials, as well as manufacturing, marking,
maintaining, repairing, and testing of packages or containers used in the transportation of such materials.
7.3.9.2
DOE O 460.2, Departmental Materials
Transportation and Traffic Management
This order establishes DOE policies and procedures for
the management of materials transportation activities,
including traffic management, for other than intrabuilding and intrasite transfers. The provisions of this order
apply to all elements of the DOE involved in transportation activities and responsible for the payment or reim-
Final SNL/CA SWEA DOE/EA-1422—January 2003
bursement of charges for transportation services. It is
DOE policy to ensure that traffic and transportation management shall be accomplished in a manner commensurate with operational requirements for transportation
services, established practices and procedures for transportation safety, economy, efficiency, and cargo security,
national transportation policy as established in 49 U.S.C.
§1801 et seq., Transportation, and implemented by the
Federal agencies, and applicable Federal, state, local, and
international transportation regulations.
7.3.9.3
International Atomic Energy Agency,
Regulations for the Safe Transport of
Radioactive Materials (1996 Edition)
The International Atomic Energy Agency, a specialized
agency of the United Nations, is the primary international
organization that enforces a system of safeguards to
ensure that nonnuclear weapons states do not divert shipments of sensitive nuclear-related equipment from peaceful applications to the production of nuclear weapons.
The agency’s regulations for transporting radioactive
materials have gained worldwide adoption, helping to
control the radiation hazards associated with all modes
of transport. They cover general provisions, activity limits
and material restrictions, requirements and controls for
transport, test procedures, and administrative requirements. Schedules are also included detailing transport
requirements for specific radioactive material consignments.
7.3.9.4
California Code of Regulations, Title 22
Under these regulations, the State of California established requirements for the safe transport of hazardous
wastes. Covered activities include packing, handling,
labeling, marking, and transporting hazardous waste.
7.3.10 WASTE GENERATION
7.3.10.1 Solid Waste Disposal Act of 1976
(42 U.S.C. §6902)
This Act regulates the management of solid waste.
Solid waste is broadly defined to include any garbage,
refuse, sludge, or other discarded material including solid,
liquid, semisolid, or contained gaseous materials resulting from requirements and controls for transport, test
procedures, and administrative requirements. Schedules
include industrial, commercial, mining, or agricultural
activities. Specifically excluded as solid waste is sourcespecial nuclear or by product material as defined by
the AEA.
7.3.10.2 Resource Conservation and Recovery
Act of 1976 (42 U.S.C. §6901)
This Act amends the Solid Waste Disposal Act and establishes requirements and procedures for the management
7-11
Chapter 7, Applicable Laws, Regulations, and Other Requirements
of hazardous wastes. As amended by the Hazardous and
Solid Waste Amendments of 1984 (HSWA), RCRA defines
hazardous wastes that are subject to regulation and sets
standards for generation, treatment, storage, and disposal
facilities. The HSWA emphasize reducing the volume and
toxicity of hazardous waste. They also establish permitting and corrective action requirements for RCRA-regulated facilities. RCRA was also amended by the Federal
Facilities Compliance Act (FFCA) in 1992. It requires the
EPA, or a state with delegated authority, to issue an order
for compliance. A federal facilities compliance order was
issued by the New Mexico Environment Department
(NMED), requiring the DOE, SNL/NM, and SNL/CA
to comply with FFCA. Compliance with the order is
achieved through site treatment plans prepared by DOE.
Original jurisdiction for implementing RCRA was
with EPA; however, RCRA authorizes EPA to turn this
responsibility over to individual states as they develop
satisfactory implementation programs. EPA granted base
RCRA authorization to California, transferring regulatory control of hazardous wastes under RCRA to
California EPA.
Both EPA and the State of California established regulations for the safe management of hazardous waste from
the point of generation to disposal. Covered requirements
include seismic considerations under 40 CFR 264 Part 18,
Location Standards.
7.3.10.3 Underground Storage Tanks
(42 U.S.C. §6901, Subtitle I)
Underground storage tanks (UST) are regulated as a
separate program under RCRA, which establishes regulatory requirements for underground storage tanks containing hazardous or petroleum materials. California EPA
has been delegated authority for regulating SNL/CA.
7.3.10.4 Federal Facility Compliance
Act of 1992 (42 U.S.C. §6961)
This 1992 Act waives sovereign immunity from fines
and penalties for RCRA violations at Federal facilities.
However, it postponed the waiver for three years for
storage prohibition violations with regard to land disposal
restrictions for the DOE’s mixed wastes. It required DOE
to prepare plans for developing the required treatment
capacity for each site at which it stores or generates mixed
waste. The state or EPA must approve each plan (referred
to as a Site Treatment Plan) after consultation with other
affected states, consideration of public comments, and
issuance of an order by the regulatory agency requiring
compliance with the plan. The Act further provides that
DOE will not be subject to fines and penalties for storage
prohibition violations for mixed waste as long as it complies with an existing agreement, order, or permit.
7-12
The FFCA requires that site treatment plans contain
schedules for developing treatment capacity for mixed
waste for which identified technologies exist. The DOE
must provide schedules for identifying and developing
technologies for mixed waste without an identified
existing treatment technology.
A Federal Facility Compliance Order was signed on
October 4, 1995, to address storage and treatment of
mixed waste.
7.3.10.5 Comprehensive Environmental Response,
Compensation, and Liability Act of 1980,
as Amended (42 U.S.C. §9601, et seq.)
This Act, commonly referred to as the CERCLA, or
Superfund, establishes liability standards and governmental response authorization to address the release of
a hazardous substance or contaminant into the environment. The EPA is the regulating authority for the Act.
CERCLA was amended by the Superfund Amendments
and Restoration Act (SARA) in 1986. SARA Title III
establishes additional requirements for emergency planning and reporting of hazardous substance releases. These
requirements are also known as the Emergency Planning
and Community Right-to-Know Act (EPCRA), which, due
to its unique requirements is discussed separately below.
SARA also created liability for damages to or loss of natural resources resulting from releases into the environment
and required the designation of Federal and state officials
to act as public trustees for natural resources. SNL/CA is
subject to, and required to report releases to the environment under the notification requirements in, 40 CFR Part
302 (Designation, Reportable Quantities, and Notification)
and EPCRA, as applicable.
7.3.10.6 Emergency Planning and
Community Right-to-Know
Act of 1986 (42 U.S.C. §11001)
EPCRA is also known as SARA Title III. Section 313 of
the Act requires facilities meeting certain standard industrial classification code criteria to submit an annual toxic
chemical release inventory report (Toxic Chemical Release
Reporting: Community-Right-to-Know [40 CFR Part 372]).
For covered facilities, a report describing the use of, and
emissions from, Section 313 chemicals stored or used
onsite and meeting threshold-planning quantities, must
be submitted to the EPA and California every July for the
preceding calendar year (CY). Other provisions of the
Act require planning notifications (Sections 302 and
303), extremely hazardous substance release notifications
(Section 304), and annual chemical inventory/material
safety data sheet reporting (Sections 311 and 312).
EPCRA required all Federal facilities, regardless of
standard industrial classification code, to meet the
requirements of the Act.
Final SNL/CA SWEA DOE/EA-1422—January 2003
Chapter 7, Applicable Laws, Regulations, and Other Requirements
SNL/CA does not meet standard industrial classification
code criteria for Section 313 reporting, but has voluntarily
submitted annual toxic chemical release inventory reports
since 1987. All research operations are exempt under provisions of the regulation, and only pilot plants, production,
or manufacturing operations at SNL/CA are reported.
7.3.10.7 Pollution Prevention Act of
1990 (42 U.S.C. §13101)
This Act sets the national policy for waste management
and pollution control that focuses first on source reduction, followed sequentially by environmentally safe
recycling, treatment, and disposal. In response, the DOE
committed to voluntary participation in EPA’s 33/50
Pollution Prevention Program, as set forth in Section 313
of SARA.
7.3.10.8 Toxic Substances Control Act of
1977 (15 U.S.C. §2601)
The TSCA, unlike other statutes that regulate chemicals
and their risk after they have been introduced into the
environment, was intended to require testing and risk
assessment before a chemical is introduced into commerce. It also establishes record-keeping and reporting
requirements for new information regarding adverse
health and environmental effects of chemicals. The Act
governs the manufacture, use, storage, handling, and
disposal of polychlorinated biphenyls (PCBs); sets standards for cleaning up PCB spills, and establishes standards and requirements for asbestos identification and
abatement in schools. It is administered by the EPA.
Because SNL/CA’s research and development activities
are not related to the manufacture of new chemicals,
PCBs are SNL/CAs main concern under the Act. Activities at SNL/CA that involve PCBs include, but are not
limited to, management and use of authorized PCBcontaining equipment, such as transformers and capacitors, management and disposal of substances containing
PCBs (dielectric fluids, contaminated solvents, oils, waste
oils, heat transfer fluids, hydraulic fluids, paints, slurries,
dredge spoils, and soils), and management and disposal
of materials or equipment contaminated with PCBs as
a result of spills.
The TSCA regulates PCB items and materials having
concentrations exceeding 50 parts per million (ppm).
Implementing regulations (40 CFR 761) contain an antidilution clause that requires waste to be managed based on
the PCB concentration of the source (transformer, capacitor, PCB equipment, etc.), regardless of the actual concentration in the waste. If the concentration at the source is
unknown, the waste must be managed as though it were
a spill of mineral oil with an assumed PCB concentration
of 50 to 500 ppm. At SNL/CA, PCB-contaminated wastes
are transported offsite for treatment and disposal unless
Final SNL/CA SWEA DOE/EA-1422—January 2003
they also have a radioactive component. Solid wastes
containing PCBs are disposed of at an offsite facility that
has been approved by the EPA for such disposal (provided
that strict requirements are met with respect to notification, reporting, record-keeping, operating conditions,
environmental monitoring, packaging, and types of
wastes disposed).
SNL/CA currently has no treatment or disposal facilities for liquid wastes that contain PCBs. Such wastes
have been collected from site generators, stored at the
Hazardous Waste Storage Facility for offsite shipment.
The asbestos abatement implementing regulations of
the Act (40 CFR Part 763) relate primarily to the identification and abatement of asbestos-containing materials in
schools. SNL/CA conducts asbestos abatement projects
in accordance with OSHA requirements (29 CFR Part
1926), applicable requirements of the CAA and the
California Solid Waste Management Regulations.
7.3.10.9 Radioactive Waste
Management Regulations
Low-level radioactive waste is a waste that contains
radioactivity and is not classified as high-level radioactive
waste, transuranic (TRU) waste, or spent nuclear fuel.
Solid low-level radioactive waste usually consists of
clothing, tools, and glassware. Low-level radioactive
liquid waste consists primarily of experiment debris.
Radioactive waste management at SNL/CA is regulated
under the AEA, through applicable DOE orders (primarily DOE Order 5820.2A, Radioactive Waste Management,
and DOE 435.1, Radiation Protection of the Public and the
Environment).
7.3.10.10 Right-to-Know Laws and Pollution
Prevention Requirements (EO 12856)
This EO directs all Federal agencies to reduce and report
toxic chemicals entering any waste stream; improve emergency planning, response, and accident notification; and
encourage clean technologies and testing of innovative
prevention technologies (58 FR 41981). The DOE and
SNL/CA meet applicable reporting requirements under
the provisions of EPCRA and California EPCRA, in
accordance with the EO.
7.3.10.11 DOE O 435.1, Radioactive
Waste Management
This order establishes the policies, guidelines, and
minimum requirements by which the DOE and its contractors manage radioactive waste, mixed waste, and
contaminated facilities. This order establishes DOE policy
that radioactive and mixed wastes be managed in a manner that ensures protection of the health and safety of the
public, the DOE, contractor employees, and the environ-
7-13
Chapter 7, Applicable Laws, Regulations, and Other Requirements
ment. In addition, the generation, treatment, storage,
transportation, and disposal of radioactive wastes, and
the other pollutants or hazardous substances they contain, must be accomplished in a manner that minimizes
the generation of such wastes across program office functions and complies with all applicable Federal, state, and
local environmental, safety, and health laws and regulations and DOE requirements.
7.3.11 NOISE
7.3.11.1 Noise Control Act of 1972
(42 U.S.C. §4901)
By this Act, Congress directed all Federal agencies to carry
out the programs under their control to promote an environment free from noise that jeopardizes public health or
welfare. Furthermore, it requires any Federal agency engaged in any activity resulting, or which may result, in the
emission of noise, to comply with Federal, state, interstate,
and local requirements regarding control and abatement
of environmental noise to the same extent that any person is subject to such requirements. Beyond the general
obligation in the Act and implementing regulations, there
are no specific Federal or state requirements regulating
environmental noise.
7.3.11.2 Occupational Noise Exposure
(29 CFR §1910.95)
This regulation provides protection to workers from
excessive levels of noise. It establishes sound levels that
7-14
are not to be exceeded for specific periods of time without
protective measures being taken. When employees are
subjected to sound exceeding the specified levels, feasible
administrative or engineering controls are to be instituted.
If such controls fail to reduce sound levels to the prescribed levels, personal protective equipment must be
provided and used to reduce sound levels.
7.3.11.3 Environmental Justice—Federal
Actions to Address Environmental
Justice in Minority Populations and
Low-Income Populations (EO 12898)
This EO directs each Federal agency to identify and
address disproportionately high adverse human health
or environmental impacts on minority and low-income
populations resulting from an agency’s programs, policies,
or activities (59 FR 7629). The order further directs each
Federal agency to collect, maintain, analyze, and make
information publicly available on the race, national origin,
and income level of populations in areas surrounding
facilities or sites expected to have a substantial environmental, human health, or economic effect on these populations. This requirement applies when such facilities or
sites become the subject of a substantial Federal environmental administrative or judicial action. Environmental
justice impacts are being identified and addressed through
the SWEA, and the policies and data analysis requirements of this EO remain applicable to future actions at
SNL/CA.
Final SNL/CA SWEA DOE/EA-1422—January 2003
Chapter 8, References
CHAPTER 8
References
8.1
GENERAL REFERENCES
ABAG 1998 .................. Association of Bay Area Governments, 1998, Tri-Valley Subregional Planning Strategy,
Internet Website: http://www.abag.ca.gov. May 23, 2002.
BAAQDM 2001 ............ Bay Area Air Quality Management District, 2001, Revised San Francisco Bay Area
Ozone Attainment Plan for the 1-Hour National Ozone Standard, Planning and Research
Division, Bay Area Air Quality Management District, San Francisco, CA. October 24, 2001.
BEA 2000a ................... Bureau of Economic Analysis, 2000, Regional Accounts Data, Local Area Personal
Income, CA 25 Total Full-Time and Part-Time Employment by Industry. Available online
at http://www.bea.doc.gov. Accessed 5/20/02.
BEA 2000b ................... Bureau of Economic Analysis, 2000, Regional Accounts Data. Local Area Personal
Income CA 05 Personal Income by Major Source and Earnings by Industry. Available
online at http://www.bea.doc.gov. Accessed 5/20/02.
BEA 2002a ................... Bureau of Economic Analysis, 2002, “Total Multipliers for Output, Earnings, and
Employment by Detailed Industry. Alameda-San Joaquin-Contra Costa Counties, CA,”
U.S. Bureau of Economic Analysis, Regional Input-Output Modeling System (RIMS II).
June 14, 2002.
BLS 2002 ...................... Bureau of Labor Statistics, 2002, Data for 1998-2000, Incidence rates of nonfatal
occupational injuries and illnesses by industry and selected case types, California,
Available online at http://www.bls.gov/iif/oshstate.htm#CA.
Busby et al. 1990 .......... Busby, Colin I., Donna M. Garaventa, and Robert M. Harmon. A Cultural Resources
Assessment of Sandia National Laboratories Livermore Facility, Alameda County, California.
San Leandro, CA: Basin Research Associates, Inc. July 1990.
CADC 2002a ................ California Department of Conservation, 2002, Division Oil , Gas, and Geothermal
Annual Report, Internet website: http://www.consrv.ca.gov/DOG/index.htm.
CADE 2002a ................ California Department of Education. 2002. Enrollment in California Public Schools by
County by District by Grade, 2001-2002. Educational Demographics Unit. Available online
at: http://www.cde.ca.gov. Accessed 5/21/02.
CADF 2001a ................. California Department of Finance Demographic Research Unit, 2001, Interim County
Population Projections. Estimated July 1, 2000 and Projections for 2005, 2010, 2015, and 2020.
Department of Finance Demographic Research Unit, Sacramento, California. Available
online at http://www.dof.ca.gov. Accessed 5/20/02.
CAMIS 2000a ............... California Market Information System, 2000, Labor Market Information. Major Employers
in Alameda County. Employment Development Department, California. Available online
at http://www.calmis.cahwnet.gov. Accessed 5/23/02.
CAMIS 2002b ............... California Market Information System, 2002, Labor Market Information. Labor Force and
Unemployment Data. Employment Development Department, California. Available online
at http://www.calmis.cahwnet.gov. Accessed 5/20/02.
CDC 1998 ..................... Center for Disease Control, 1998, Vital statistics on mortality rates, U.S. Department of
Health and Human Services, Public Health Services, Center for Disease Control,
National Institute for Occupational Safety and Health, Washington, D.C., June.
CDT 2002 ..................... California Division of Tourism, 2002, California Tourism, http://gocalif.ca.gov/tourism/
pdfs/SanFrancisco_Map.pdf
Census 2000a ............... U.S. Bureau of the Census, 2000, Metropolitan Area Rankings by Population Size and
Percent Change for July 1, 1999 and April 1, 1990 to July 1, 1999, U.S. Bureau of the Census,
Washington, D.C., 2000.
Final SNL/CA SWEA DOE/EA-1422—January 2003
8-1
Chapter 8, References
Census 2000b ............... U.S. Bureau of the Census, 2000, Race, Summary File 1 (SF 1) 100-Percent Data. U.S. Census
Bureau, Washington, D.C., October 2002. Internet website: http://factfinder.census.gov/servlet/DTTable?_ts=28812730841
“Table DP-2, Profile of Selected Social Characteristics: 2000” for Alameda, Contra Costa, and
San Joaquin Counties. Available online at: http://censtats.census.gov/data/CA/05006001.pdf.
“Table DP-3, Profile of Selected Economic Characteristics: 2000” for Alameda, Contra Costa,
and San Joaquin Counties. Available at online at: http://censtats.census.gov/data/CA/
05006001.pdf.
CEQ 1997 ..................... Council on Environmental Quality, 1997, Environmental Justice, Guidance Under the
National Environmental Policy Act, Council on Environmental Quality, Executive Office
of the President, Washington, D.C., December 10.
CEQ 1997b ................... Council on Environmental Quality, 1997, Considering Cumulative Effects Under the
National Environmental Policy Act, Council on environmental Quality, Executive Office
of the President, Washington, D.C., January.
DOE 151.1 .................... U.S. Department of Energy, 2000, “Comprehensive Management System”, U.S. Department
of Energy, Washington, D.C.,; revised November 2000.
DOE 1992a ................... U.S. Department of Energy and University of California, 1992, Final Environmental Impact
Statement and Environmental Impact Report for Continued Operations of Lawrence Livermore
National Laboratory and Sandia National Laboratories, Livermore, DOE/EIS-0157, U.S.
Department of Energy, Oakland, CA. August.
DOE 1993a ................... U.S. Department of Energy, 1993, Finding of No Significant Impacts for the Nonnuclear
Consolidation Environmental Assessment, DOE/EA-0792, Vol. I, U.S. Department of Energy,
Office of Defense Programs, Washington, D.C., June.
DOE 1993b ................... DOE (U.S. Department of Energy), 1993, NEPA Guidance Document, Recommendations
for the Preparation of Environmental Assessments and Environmental Impact Statements,
Office of NEPA Oversight. May.
DOE 1996a ................... U.S. Department of Energy, 1996, “Record of Decision for the Final Programmatic
Environmental Impact Statement for Stockpile Stewardship and Management, DOE/EIS-0236,
Vol. I, U.S. Department of Energy, Washington, D.C.
DOE 1998a ................... U.S. Department of Energy, 1998, “Record of Decision for the Department of Energy’s
Waste Management Program: Treatment of Non-Wastewater Hazardous Waste,” Federal
Register, Number 150, Volume 63, Washington, D.C., August 5.
DOE 1998b ................... DOE 1998 U.S. Department of Energy, 1998, National Environmental Policy Act
Environmental Checklist from B.L. Larsen to S. Lacy, Re: Construction and Operation of
the Distributed Information Systems Laboratory, SNL-98-032, U.S. Department of Energy,
Kirtland Area Office, Albuquerque, NM, January 23.
DOE 1998c ................... U.S. Department of Energy, 1998, Glossary of Terms Used in DOE NEPA Documents,
U.S. Department of Energy, Environment, Safety and Health Office of NEPA Policy and
Assistance, Washington, D.C., September.
DOE 1998d .................. U.S. Department of Energy, 1998, Environment, Safety and Health Thesaurus/Dictionary,
DOE/EH-0186, U.S. Department of Energy, Office of Scientific and Technical Information,
Washington, D.C., October.
DOE 1999a ................... U.S. Department of Energy, 1999, Supplement Analysis for Continued Operation of Lawrence
Livermore National Laboratory and Sandia National Laboratories, Livermore Volume I: Main
Report, DOE/EIS-0157-SA-01, Vol. I, U.S. Department of Energy, Oakland Operations Office,
Oakland CA. March.
DOE 1999b ................... U.S. Department of Energy, 1999, Sandia National Laboratories/New Mexico Site Wide
Environmental Impact Statement, DOE/EIS-0281, U.S. Department of Energy, Albuquerque
Operations Office, Albuquerque NM. October.
8-2
Final SNL/CA SWEA DOE/EA-1422—January 2003
Chapter 8, References
DOE 1999c ................... U.S. Department of Energy, 1999, National Environmental Policy Act Environmental
Checklist from B.L. Larsen to S. Lacy, Re: Set-up and Operation of Glass Furnace
Combustion and Melting Lab, B906, SNL-99-049, U.S. Department of Energy,
Kirtland Area Office, Albuquerque, NM. May 5.
DOE 1999d .................. U.S. Department of Energy, 1999, Radiation Exposure Monitoring System Database,
U.S. Department of Energy.
DOE 2000a ................... U.S. Department of Energy, 2000, National Environmental Policy Act Environmental
Checklist from B.L. Larsen to S. Lacy, Re: Safety and Health Enhancements at Existing
Facilities, FY 2001 through FY 2002, SNL-00-068, U.S. Department of Energy, Kirtland
Area Office, Albuquerque, NM. July 11.
DOE 2000b ................... U.S. Department of Energy, 2000, National Environmental Policy Act Environmental
Checklist from B.L. Larsen to S. Lacy, Re: Asbestos Management, FY2001 through FY 2002,
SNL-00-077, U.S. Department of Energy, Kirtland Area Office, Albuquerque, NM. July 20.
DOE 2000c ................... U.S. Department of Energy, 2000, National Environmental Policy Act Environmental
Checklist from B.L. Larsen to S. Lacy, Re: Maintenance Activities and Custodial Services,
SNL-00-078, U.S. Department of Energy, Kirtland Area Office, Albuquerque, NM. July 20.
DOE 2000d .................. U.S. Department of Energy, 2000, Radiation Exposure Monitoring System Database,
U.S. Department of Energy.
DOE 2000e ................... U.S. Department of Energy, 2000, Draft Site-Wide Environmental Impact Statement for
the Oak Ridge Y-12 Plant, DOE/EIS-0309, Oak Ridge Operations Office. December.
DOE 2001a ................... U.S. Department of Energy, 2001, National Environmental Policy Act Environmental Checklist from B.L. Larsen to S. Lacy, Re: Chemical and Radiation Detection Program, FY2002,
SNL-01-089, U.S. Department of Energy, Kirtland Area Office, Albuquerque, NM. June 13.
DOE 2001b ................... U.S. Department of Energy, 2001, National Environmental Policy Act Environmental
Checklist from B.L. Larsen to S. Lacy, Re: Construction and operation of the LIGA Facility,
SNL-TBD, U.S. Department of Energy, Kirtland Area Office, Albuquerque, NM. June 13.
DOE 2001c ................... U.S. Department of Energy, 2001, National Environmental Policy Act Environmental
Checklist from B.L. Larsen to S. Lacy, Re: Characterization, Decontamination, and
Demolition of Buildings and Structures at SNL/CA, SNL-01-090, U.S. Department of
Energy, Kirtland Area Office, Albuquerque, NM. June 19.
DOE 2001d ................... U.S. Department of Energy, 2001, National Environmental Policy Act Environmental
Checklist from B.L. Larsen to S. Lacy, Re: Modifications of Research Facilities and
Relocation of Laboratory Operations, FY 2002, SNL-01-091, U.S. Department of Energy,
Kirtland Area Office, Albuquerque, NM. June 18.
DOE 2001e ................... U.S. Department of Energy, 2001, National Environmental Policy Act Environmental
Checklist from B.L. Larsen to S. Lacy, Re: Siting, Construction, Modification, Operation,
and Relocation of Support Structures, Infrastructure, and Equipment for FY 2002 and
FY 2003, SNL-01-093, U.S. Department of Energy, Kirtland Area Office,
Albuquerque, NM. July 11.
DOE 2001f ................... U.S. Department of Energy, 2001, National Environmental Policy Act Environmental
Checklist from B.L. Larsen to S. Lacy, Re: Construction and Operation of a LIGA
Technologies Facility at SNL/CA, SNL-01-101, U.S. Department of Energy, Kirtland
Area Office, Albuquerque, NM. July 31
DOE 2001g ................... U.S. Department of Energy, 2001, Radiation Exposure Monitoring System Database,
U.S. Department of Energy.
DOE 2002a ................... U.S. Department of Energy, 2002, DOE Mission Statement, U.S. Department of Energy.
Available Online: http://www.energy.gov/aboutus/history/mission.html.
DOE 2002c ................... U.S. Department of Energy, 2002, ORPS (Occurrence Reporting and Processing System)
Database Search Results, 1990-Present, for Chemical Exposures, U.S. Department of Energy,
Washington, D.C., April 29.
Final SNL/CA SWEA DOE/EA-1422—January 2003
8-3
Chapter 8, References
EPA 1974...................... U.S. Environmental Protection Agency, Information on Levels of Environmental Noise
Requisite to Protect Public Health and Welfare with an Adequate Margin of Safety, EPA/
550/9-74-004, Office of Noise Abatement and Control, Washington, D.C., March 1974.
EPA 1995...................... U.S. Environmental Protection Agency, 1995, Compilation of Air Pollutant Emission
Factors, Fifth Edition, AP-42, Vol. I: Stationary Point and Area Sources, U.S. Environmental
Protection Agency, Office of Air Quality Planning and Standards. January.
EPA 1998...................... U.S. Environmental Protection Agency, 1998, Guidance for Incorporating Environmental
Justice Concerns in EPA’s NEPA Compliance Analysis, U.S. Environmental Protection
Agency, Environmental and Assessment Office, Washington, D.C., April.
EPA 2002...................... U.S. Environmental Protection Agency, 2002. “Environmental Justice.” Available on-line
at http://es.epa.gov/oeca/main/ej/. Last updated 1-24-02.
GMA 2001a .................. Graham Matthews & Associates, 2001, Reconnaissance Evaluation of Channel Erosion and
Potential for Stream Restoration, Graham Matthews & Associates, Weaverville, CA, Sandia
National Laboratories, Livermore, CA. March.
GMA 2001b .................. Graham Matthews & Associates, 2001, Arroyo Seco Improvement Project Design Report,
Graham Matthews & Associates, Weaverville, CA, Sandia National Laboratories, Livermore,
CA. September.
GMA 2002a .................. GMA 2002 Graham Matthews & Associates, 2002, Management Plan for Arroyo Seco at
Sandia National Labs Livermore, CA, Graham Matthews & Associates, Weaverville, CA,
Sandia National Laboratories, Livermore, CA. February.
Larsen 2002 .................. Larsen, B., 2002, Personal communication between Barbara Larsen (SNL/CA) and George
Pratt (Tetra Tech) concerning disapproval to drain the two cells of the LLNL recharge basin.
Livermore 2001 ............ City of Livermore, California, 2001, unnamed document, Internet website:
http://www.ci.livermore.ca.us/., visited August 2002.
LLNL 2001 ................... Lawrence Livermore National Laboratory, 2001, Site Environmental Report for 2000,
Lawrence Livermore National Laboratory, Livermore, CA. September.
NCRP 1993 .................. National Council on Radiation Protection and Measurements, 1993, Ionizing Radiation
Exposure of the Population of the United States, Vol. 93, Pergamon Press, Elmsford, NY.
September 1.
NNSA 2002a ................ National Nuclear Security Administration, 2002, NNSA Mission Statement,
U.S. Department of Energy. Available Online: http://www.nnsa.doe.gov/.
Royer 2002a ................. Royer, H., 2002, Personal communication between Howard Royer, Barbara Larsen (SNL/CA)
and Jim Bartosch (Tetra Tech, NUS) concerning utility system capacities at SNL/CA.
Royston et al. 1993 ....... Royston Hanamoto Alley& Abey, 1993, Landscape Architects & Planners. Sandia National
Laboratories, California Site Visual Quality Guidelines and Landscape Master Plan. 1993.
SAIC 1998a .................. Science Applications International Corporation 1998. Wetland Survey Report, prepared
for Sandia National Laboratories, Livermore, CA. August.
SAIC 2001a .................. Science Applications International Corporation, 2001, Final Biological Survey Report,
prepared for Sandia National Laboratories, Livermore, CA. July.
SNL 1996a .................... Sandia National Laboratories, 1996, Site Environmental Report for 1995, SAND96-8007
UC-402, Sandia National Laboratories, Albuquerque, NM and Livermore, CA. July.
SNL 1997a .................... Sandia National Laboratories, 1997, Site Environmental Report for 1996, SAND97-8015
UC-402, Sandia National Laboratories, Albuquerque, NM and Livermore, CA, August. Sandia
National Laboratories, 1997, 1998 Sites Comprehensive Plan, SAND97-2327, Sandia National
Laboratories, Albuquerque, NM. September 25.
SNL 1997b .................... Sandia National Laboratories, 1997, 1998 Sites Comprehensive Plan, SAND97-2327,
Sandia National Laboratories, Albuquerque, NM. September 25.
SNL 1998a .................... Sandia National Laboratories, 1998, Site Environmental Report for 1997, SAND98-8001
UC-402, Sandia National Laboratories, Albuquerque, NM and Livermore, CA. June.
8-4
Final SNL/CA SWEA DOE/EA-1422—January 2003
Chapter 8, References
SNL 1999a .................... Sandia National Laboratories, 1999, Site Environmental Report for 1998, SAND99-8004
UC-402, Sandia National Laboratories, Albuquerque, NM and Livermore, CA. June.
SNL 2000a .................... Sandia National Laboratories, 2000, Site Environmental Report for 1999 Sandia National
Laboratories, California, SAND2000-8254, Sandia National Laboratories, Albuquerque, NM
and Livermore, CA. September.
SNL 2001a .................... Sandia National Laboratories, 2001, Institutional Plan FY 2002-2007, SAND2001-3141,
Sandia National Laboratories, Albuquerque, NM and Livermore, CA. December.
SNL 2001b .................... Sandia National Laboratories, 2001, 2000 Laboratory Directed Research and Development
Annual Report, SAND2001-TBD UC-700, Sandia National Laboratories, Albuquerque, NM.
SNL 2001c .................... Sandia National Laboratories, 2001, Sites Comprehensive Plan FY2001 to FY 2010,
SAND2001-0034P, Sandia National Laboratories, Albuquerque, NM and Livermore, CA.
SNL 2001d .................... Sandia National Laboratories, 2001, Draft Historic Building Survey, Sandia National
Laboratories, California. Prepared by Rebecca Ullrich, Sandia History Program.
October 30, 2001.
SNL 2001e .................... Sandia National Laboratories, 2001, Site Environmental Report for 2000 Sandia National
Laboratories, California, SAND2001-8254, Sandia National Laboratories, Albuquerque, NM
and Livermore, CA. September.
SNL 2001f .................... Sandia National Laboratories, 2001, Draft Cold War Context Statement, Sandia National
Laboratories, California Site. Prepared by Rebecca Ullrich, Sandia History Program.
SNL 2001g .................... Sandia National Laboratories, 2001, Sandia National Laboratories Implementation Plan For
Meeting DOE’s Pollution Prevention, Energy Efficiency, And Transportation Goals As Required
by Executive Order 13148, Sandia National Laboratories, Albuquerque, NM and Livermore,
CA. February.
SNL 2001h ................... Sandia National Laboratories, 2001, Radiological Protection Procedures Manual, Sandia
National Laboratories.
SNL 2001i ..................... Sandia National Laboratories, 2001, Corporate ES & H Report For Fourth Quarter CY2000
and CY2000, Sandia National Laboratories, Albuquerque, NM and Livermore, CA. February.
SNL 2002a .................... Sandia National Laboratories, 2002, Corporate ES & H Report For Fourth Quarter CY2001,
Sandia National Laboratories, Albuquerque, NM and Livermore, CA. February.
SNL/CA 1999a ............. Sandia National Laboratories/California, 1999, Floodplain/Wetlands Assessment for
Proposed Embankment and Streambed Restoration Project in the Arroyo Seco, Sandia
National Laboratories, Livermore, CA. March 29.
SNL/CA 2000a ............. Sandia National Laboratories/California, 2000, Weed Abatement, Sandia National
Laboratories, Livermore, CA. March.
SNL/CA 2001a ............. Sandia National Laboratories/California, 2001, Sandia National Laboratories/CA Facilities
Safety and Information Document, SANDXXXX-XXXX, with select Preliminary Hazard
Screening documents (various dates), Sandia National Laboratories, Livermore, CA. May.
SNL/CA 2002a ............. Sandia National Laboratories/California, 2002, Sandia National Laboratories/CA Facilities
Safety and Information Document, SAND2002-8118, Sandia National Laboratories,
Livermore, CA. May.
SNL/CA 2002b ............. Sandia National Laboratories/California, 2002, Environmental Information Document,
Final Draft, SANDXX-XXX, Sandia National Laboratories, Livermore, CA. January.
SNL/CA 2002c ............. Sandia National Laboratories/California, 2002, Draft Biological Assessment for the
Continued Operation of Sandia National Laboratories, California, (April 29 2002 version).
SNL/CA 2002d ............. Sandia National Laboratories/California, 2001, Critical Habitat Map, Sandia National
Laboratories, Livermore, CA.
Swaim 2000a ................ Swaim Biological Consulting (Swaim), 2000, Habitat Assessment for the Alameda
Whipsnake (Masticophis lateralis euryxanthus), Sandia National Laboratories,
Livermore, CA. August 16, 2000.
Final SNL/CA SWEA DOE/EA-1422—January 2003
8-5
Chapter 8, References
Trenham 2001 .............. Trenham, Peter C., 2001, Terrestrial Habitat Use by Adult California Tiger Salamanders,
Journal of Herpetology, Vol. 35.
TtNUS 2002a .............. Tetra Tech NUS, Inc., 2002, Comparison of Parameters to be Used to Analyze SNL/CA
Facilities Under the No Action, Planned Operations, and Maximum Operations, Tetra
Tech NUS, Inc., Albuquerque, NM. May
USFWS 2001 ............... U.S. Fish and Wildlife Service (USFWS). Letter to Mr. George Laskar (DOE), December
13, 2001. Species List for Biological Assessment for Continued Operations at Sandia
National Laboratories, Livermore, Alameda County, CA, Response 1-1-02-SP-448, 15 pp.
8.2
CODE OF FEDERAL REGULATIONS
10 CFR Part 835 .......... “Occupational Radiation Protection;” Title 10, Energy; Chapter III, Department of
Energy; Code of Federal Regulations; National Archives and Records Administration,
Washington, D.C.; January 1, 1998.
10 CFR Part 1021 ......... “National Environmental Policy Act (NEPA): Implementing Procedures”; Title 10, Energy;
Chapter X, Department of Energy (General Provisions); Code of Federal Regulations;
National Archives and Records Administration, Washington, D.C.; January 1, 1998.
10 CFR Part 1021.330 .. “National Environmental Policy Act: Implementing Procedures”; Title 10, Part 1021.330,
Energy; Programmatic NEPA Documents; Code of Federal Regulations; National Archives
and Records Administration, Washington, D.C.
14 CFR 150 .................. Department of Transportation, “Aeronautics and Space: Airport Noise Compatibility
Planning,” Code of Federal Regulations, Office of the Federal Register, National Archives
and Records Administration, U.S. Government Printing Office, Washington, D.C.; Revised
January 1, 1999.
29 CFR Part 1910 ......... “Occupational Safety and Health Standards”; Title 29, Labor; Chapter XVII, Occupational
Safety and Health Administration, Department of Labor; Code of Federal Regulations;
National Archives and Records Administration, Washington, D.C.; July 1, 1998.
29 CFR Part 1910.95 .... “Occupational Noise Exposure”; Title 29, Occupational Safety and Health Administration,
Department of Labor, Code of Federal Regulations, National Archives and Records Administration, Washington, D.C., Washington, D.C.; Revised as of July 1, 2001.
36 CFR 60 .................... “National Register of Historic Places”; Title 36, Parks, Forests, and Public Property;
Chapter I, National Park Service, Department of the Interior; Code of Federal Regulations;
National Archives and Records Administration, Washington, D.C.; July 1, 1998.
40 CFR Part 6 ............... “Procedures for Implementing the Requirements of the Council on Environmental
Quality on the National Environmental Policy Act;” Title 40, Protection of the Environment;
Chapter I, Environmental Protection Agency; Code of Federal Regulations; National Archives
and Records Administration, Washington, D.C.; July 1, 1998.
40 CFR Part 50 ............. “National Ambient Air Quality Standards, National Primary and Secondary Ambient Air
Quality Standards;” Title 40, Protection of Environment; Chapter I, Environmental Protection Agency; Code of Federal Regulations; National Archives and Records Administration,
Washington, D.C.; July 1, 1998.
40 CFR Part 51 ............. “Requirements for Preparation, Adoption, and Submittal of Implementation Plans,” Title 40,
Protection of Environment; Chapter I, Environmental Protection Agency; Code of Federal
Regulations; National Archives and Records Administration, Washington, D.C.; July 1, 1998.
40 CFR Part 61 ............. “National Emission Standards for Hazardous Air Pollutants;” Title 40, Protection of Environment; Chapter I, Environmental Protection Agency; Code of Federal Regulations; National
Archives and Records Administration, Washington, D.C.; July 1, 1998.
40 CFR 93 .................... “Determining Conformity of Federal Actions to State or Federal Implementation Plans”;
Title 40, Protection of Environment; Chapter I, Environmental Protection Agency; Code
of Federal Regulations; National Archives and Records Administration, Washington, D.C.;
July 1, 1998.
8-6
Final SNL/CA SWEA DOE/EA-1422—January 2003
Chapter 8, References
40 CFR Part 761 ........... “Polychlorinated Biphenyls Manufacturing, Processing, Distribution in Commerce, and
Use Prohibitions”; Title 40, Protection of Environment; Chapter I, Environmental Protection
Agency; Code of Federal Regulations; National Archives and Records Administration,
Washington, D.C.; July 1, 1998.
40 CFR Parts 1500-1508 . “NEPA Implementing Regulations”; Council on Environmental Quality, U.S.
Department of Energy; Title 40, Code of Federal Regulations; Washington, D.C.; October 2002.
40 CFR Part 1501.7 ...... “NEPA and Agency Planning”; Title 40, Protection of Environment; Chapter V, Title 40,
Code of Federal Regulations; Washington, D.C.; October 2002.
49 CFR Part 172.101 .... “Hazardous Materials Table, Special Provisions, Hazardous Materials Communications,
Emergency Response Information, and Training Requirements”; Title 49, Transportation;
Vol. 2; Chapter I, Research and Special Programs Administration, Department of Transportation; Code of Federal Regulations; National Archives and Records Administration,
Washington, D.C.; October 1, 1997.
8.3
FEDERAL REGISTER
42 FR 26951 ................. Executive Order 11988, “Floodplain Management”; Federal Register, Vol. 42, pp. 26951;
Washington, D.C.; May 25, 1977.
42 FR 26961 ................. Executive Order 11990, “Protection of Wetlands”; Federal Register, Vol. 42, pp. 26961;
59 FR 7629 ................... Executive Order 12898, “Federal Actions to Address Environmental Justice in
Minority Populations and Low-Income Populations”; Federal Register, Vol. 59, pp. 7629;
Washington, D.C.; February 11, 1994.
61 FR 25813 ................. Federal Register, Vol. 61, No. 101, Endangered and Threatened Wildlife and Plants, Final
Determination of Threatened Status for the California Red-legged Frog, pp. 25813-25833,
May 23, 1996.
62 FR 38855 ................. EPA, National Ambient Air Quality Standards for Ozone; Final Rule, Federal Register, Vol. 62,
Pg 38855, Office of the Federal Register, National Archives and Records Administration, U.S.
Government Printing Office, Washington, D.C.; July 18, 1997.
65 FR 24595 ................. Executive Order 13148, “Greening the Government Through Leadership in Environmental
Management:; Federal Register, Vol. 65, pp. 24595; Washington, D.C.; April 21, 2000.
66 FR 14626 ................. FR, Vol. 65, No. 49, Endangered and Threatened Wildlife and Plants, Final Determination of
Critical Habitat for California Red-Legged Frog, Final Rule, Federal Register pp. 14626-14661.
66 FR 51812 ................. Executive Order 13228, 2001, Establishing the Office of Homeland Security and the Homeland Security Council Federal Register, Vol. 66, pp. 51812; Washington, D.C.; October 10, 2001.
Available Online: http://www.nara.gov/fedreg/eo2001b.html
67 FR 5089 ................... “National Nuclear Security Administration Notice of Intent To Prepare A Site-Wide
Environmental Assessment, Sandia National Laboratories/California, Notice of Intent;”
Federal Register, Vol. 67, Issue 23, pp. 5089-5091; National Nuclear Security Administration,
Albuquerque New Mexico; February 4, 2002.
8.4
PUBLIC LAW
PL 107-107 .................... “National Defense Authorization Act for Fiscal Year 2002”; Vol. 107; Part 2, pp. 15471966; United States Statues at Large; United States Government Printing Office,
Washington, D.C.; 1994.
8.5
UNITED STATES CODE
15 U.S.C. §2601 ............ Toxic Substances Control Act; “Findings, policy, and intent”; Title 15, Commerce and
Trade; Chapter 53, Toxic Substances Control; Subchapter I, Control of Toxic Substances;
United States Code; Washington, D.C.; January 1, 1977.
Final SNL/CA SWEA DOE/EA-1422—January 2003
8-7
Chapter 8, References
16 U.S.C. § 470 ............. National Historic Preservation Act; “Short title; Congressional finding and declaration
of policy;” Title 16, Conservation; Chapter 1A, Historic Sites, Buildings, Objects, and
Antiquities; Subchapter II, National Historic Preservation; United States Code, Washington,
D.C.; October 15, 1966, as amended.
16 U.S.C. §668 .............. “Bald and Golden Eagles;” Title 16, Conservation; Chapter 5A, Protection and Conservation of Wildlife; Subchapter II, Protection of Bald and Golden Eagles; United States Code,
Washington, D.C.; June 8, 1940, as amended.
16 U.S.C. §703 .............. “Taking, killing, or possessing migratory birds unlawful;” Title 16, Conservation; Chapter 7,
Protection of Migratory Game and Insectivorous Birds; Subchapter II, Migratory Bird Treaty;
United States Code, Washington, D.C.; July 3, 1918, as amended.
16 U.S.C. §§1531-1544 Chapter 35, “Endangered Species Act;” Title 16 Conservation; United States Code, Washington,
D.C.; December 28, 1973, as amended.
42 U.S.C. §2011 ............ “Atomic Energy Act; Congressional declaration of policy”; Title 42, Public Health and
Welfare; Chapter 23, Development and Control of Atomic Energy; Division A, Atomic
Energy; Subchapter I, General Provisions; United States Code, Washington, D.C.; August 1,
1946, as amended.
42 U.S.C. §4321 et seq. .. “Congressional declaration of purpose;” Title 42, Public Health and Welfare; Chapter 55,
National Environmental Policy Act (NEPA); United States Code, Washington, D.C.; January 1,
1970, as amended.
42 U.S.C. §4901 ............ “Congressional findings and statement of policy;” Title 42, Public health and Welfare;
Chapter 65, Noise Control Act; United States Code, Washington, D.C.; October 27, 1972,
as amended.
42 U.S.C. §6901 ............ “Resource Conservation and Recovery Act; Congressional findings;” Title 42, Public Health
and Welfare; Chapter 82, Solid Waste Disposal; Subchapter I, General Provisions; United States
Code, Washington, D.C.; November 8, 1978, as amended.
42 U.S.C. §6961 ............ “Application of Federal, state, and local law to Federal facilities;” Title 42, Public Health
and Welfare; Chapter 82, Solid Waste Disposal; Subchapter IV, Federal Responsibilities;
United States Code, Washington, D.C.; October 21, 1976, as amended.
42 U.S.C. §7401 ............ “Clean Air Act; Congressional findings and declaration of purpose”; Title 42, Public Health
and Welfare; Chapter 85, Air Pollution Prevention and Control; Subchapter I, Programs
and Activities; Part A, Air Quality and Emission Limitations; United States Code,
Washington, D.C.; July 14, 1955, as amended.
42 U.S.C. §9601 ............ “Definitions;” Title 42, The Public Health and Welfare; Chapter 103, Comprehensive Environmental Response, Compensation, and Liability; Subchapter I, Hazardous Substances Releases
Liability, Compensation; United States Code, Washington, D.C.; December 22, 1980, as amended.
42 U.S.C. §11001 .......... “Establishment of State commissions, planning districts, and local committees;” Title 42,
Public Health and Welfare; Chapter 116, Emergency Planning and Community Right-ToKnow; Subchapter I, Emergency Planning and Notification; United States Code, Washington,
D.C.; October 17, 1986.
8.6
U.S. DEPARTMENT OF ENERGY
DOE 440.1A ................. “Worker Protection Management for DOE Federal and Contractor Employees,”
U.S. Department of Energy, Washington, D.C.; December 21, 1994.
DOE 5400.1 .................. “General Environmental Protection Program,” U.S. Department of Energy,
Washington, D.C.; November 9, 1988.
DOE P 430.1 ................ “Land and Facility Use Policy,” U.S. Department of Energy, Washington, D.C.;
March 27, 1998.
8-8
Final SNL/CA SWEA DOE/EA-1422—January 2003
Chapter 9, Conflict of Interest Statement
Final SNL/CA SWEA DOE/EA-1422—January 2003
9-1
Chapter 9, Conflict of Interest Statement
This page intentionally left blank.
9-2
Final SNL/CA SWEA DOE/EA-1422—January 2003
Chapter 10, List of Preparers
CHAPTER 10
List of Preparers
❍
Annett, John
Tetra Tech NUS
Air Quality and Noise
B.A., Mathematics
30 years experience
❍
Hill, Nicole
Tetra Tech NUS
Regional Socioeconomist, MBA
B.A., Social Science/Psychology
4 years experience
❍
Bartosch, James
Tetra Tech NUS
Project Manager, Waste Generation,
Infrastructure, Lead Author
B.S., Chemical Engineering
15 years experience
❍
Irwin, Jeffrey P.E.
DOE/NNSA/OKSO
SNL/CA Site Operations Manager
B.S., Electrical Engineering
WSO, Certified Government Safety Officer
27 years experience
❍
Connor, Steven J.
Tetra Tech NUS
Transportation
M.S. Physics
29 years experience
❍
❍
Dimmick, Ross A.
Tetra Tech NUS
Geology, Water Resources
M.S., Geological Sciences
B.S., Geological Sciences
15 years experience
Lacy, Susan
DOE/NNSA/OKSO
Document Manager
NEPA Compliance Officer
B.S., Chemical Engineering
15 years experience
❍
Moford, Lane
Tetra Tech NUS
Document Production, Graphics
B.A. Philosophy
8 years experience
❍
Moore, Tami
DOE/NNSA/OKSO
Public Affairs Specialist
M.A., Communications
B.A., Journalism
11 years experience
❍
Oliver, James
Tetra Tech NUS
Deputy Project Manager, Technical Reviewer
B.S. Biology (Fisheries)
30 years experience
❍
Enyeart, Sasndra
Tetra Tech NUS
Cumulative Impacts
BCE Civil Engineering (Environmental)
25 years experience
❍
Gaylor, Robert
Tetra Tech NUS
Geology, Floodplains and Wetlands
M.S., Geology
A.B., Geology
15 years experience
❍
Gould, John
DOE/OKSO
Environmental Restoration/Waste Management
B.S. Geology
A.A.S. Environmental Science
25 years experience
❍
Patterson, Karen
Tetra Tech NUS
Editor, MLIS Information Science
M.A. Biology
B.A. Biology
25 year experience
❍
Gunter, Gary
Tetra Tech NUS
Transportation
B.S., Geology
14 years experience
❍
Pratt, George
Tetra Tech EMI
Biological Resources
Ph.D., Entomology
M.S., Entomology
B.S., Biology
28 years experience
Final SNL/CA SWEA DOE/EA-1422—January 2003
10-1
Chapter 10, List of Preparers
❍
Reed, Karol-Lynn
Tetra Tech NUS
Document Production Lead, Editor, Graphics
B.A. candidate, Business/Computer
18 years experience
❍
Sifuentes, Mark
DOE/NNSA/OKSO
Biological Resources
M.S., Microbiology, B.S., Biology
31 years experience
❍
Robbins, Jeff
U.S. Department of Energy
NEPA Compliance Officer
Albuquerque Office Liaison
B.S., Biology
28 years experience
❍
Taber, William
Tetra Tech NUS
LLNL Liaison, Reviewer
B.A., Biology
25 years experience
❍
❍
Roxlau, Katherine
Tetra Tech NUS
Cultural Resources, Land Use, Reviewer
M.A., Anthropology
B.A., Anthropology
14 years experience
Philip Young, CHP
Tetra Tech NUS
Human Health and Safety
M.S., Health Physics
B.S., Radiation Health (Health Physics)
14 years experience
10-2
Final SNL/CA SWEA DOE/EA-1422—January 2003
Chapter 11, List of Agencies, Organizations, and Individuals to Whom Copies of this Site-Wide Environmental Assessment were Sent
CHAPTER 11
List of Agencies, Organizations, and Individuals to Whom
Copies of this Site-Wide Environmental Assessment were Sent
Name
Affiliation
City
State
Sacramento
CA
Federal Agencies
Buford, Dan
U.S. Fish and Wildlife Service
Dermer, M.
U.S. Environmental Protection Agency
San Francisco
CA
Gutierrez, Robert
Office of Congressman Richard Pombo
Stockton
CA
Hoffman, Julie
For Congresswoman Ellen Tauscher
Walnut Creek
CA
Kevin, Dan
Lawrence Berkeley National Laboratory
Berkeley
CA
Tauscher, Ellen, Congresswoman
House Office Building
Washington
DC
Tauscher, Ellen, Congresswoman
U.S. District 10
Walnut Creek
CA
Zahn, Ken
Lawrence Livermore National Laboratory
Livermore
CA
California Environmental Protection Agency
Sacramento
CA
Bailey, E.
California Department of Health Services
Sacramento
CA
Ciriello, Sal
California Environmental Protection Agency
Berkeley
CA
Gan, Janice
California Department of Fish and Game
Yountville
CA
Klobas, Ryan
Office of Assembly Woman Lynne Leach
Walnut Creek
CA
Leach, Lynne, Assemblywoman
State District 15
Livermore
CA
Meillier, Laurent
California Regional Water
Quality Control Board
Oakland
CA
Mellon, Dr. Knox
California Office of Historic Preservation
Sacramento
CA
Meyers, Larry
California Native American
Heritage Commission
Sacramento
CA
Murphey, Daniel
Department of Toxic Substances Control
Berkeley
CA
Omania, Gloria
Office of State Senator Tom Torlakson
Concord
CA
Wong, J.
California Department of Health Services
Berkeley
CA
Oakland
CA
San Leandro
CA
Alameda County, Planning Department
Hayward
CA
Association of Bay Area Governments
Oakland
CA
San Francisco
CA
Oakland
CA
State Agencies
County/Regional Agencies
Alameda County Health Department,
Hazardous Materials Division
Alameda County Waste
Management Authority
Guthrie, James
Bay Area Air Quality Management
District, Enforcement Services
Haggerty, Scott
Alameda County Board
of Supervisors, District One
Final SNL/CA SWEA DOE/EA-1422—January 2003
11-1
Chapter 11, List of Agencies, Organizations, and Individuals to Whom Copies of this Site-Wide Environmental Assessment were Sent
Name
Affiliation
City
State
Weston, Robert
Alameda County Health Care
Services Agency, Department of
Environmental Health Services
Alameda
CA
City of Livermore, Planning Division
Livermore
CA
Barton, Linda, City Manager
City of Livermore
Livermore
CA
Bilbrey, Dan, Mayor
City of Tracy
Tracy
CA
Garcy, Lorraine, Superintendent
Livermore Valley Unified School District
Livermore
CA
Gary, Stewart, Fire Chief
Livermore-Pleasanton Fire Department
Livermore
CA
Gittings, S.
Livermore Water Reclamation Plant
Livermore
CA
Kamena, Dr. Marshall, Mayor
City of Livermore
Livermore
CA
Lockhart, Janet, Mayor
City of Dublin
Dublin
CA
Miller, Mike,
Public Services Director
City of Livermore
Livermore
CA
Peeler, Jerry, City Manager
City of Livermore
Livermore
CA
Pico, Tom, Mayor
City of Pleasanton
Pleasanton
CA
Police Chief
Livermore Police Department
Livermore
CA
Tatarka, Nancy, Mayor
City of San Ramon
San Ramon
CA
Albuquerque
NM
Livermore
CA
Livermore
CA
Pleasanton
CA
Dublin
CA
City of San Ramon Library
San Ramon
CA
Aries, Jennifer
Chabot-Las Positas
Community College District
Pleasanton
CA
Director
City of Livermore, Civic Center Library
Livermore
CA
Editor
Tri-Valley Herald
Pleasanton
CA
Editor
Valley Times
Walnut Creek
CA
Halliday, Karen, President
Las Positas College
Livermore
CA
Johnston, Susan, Librarian
City of Tracy Branch Library
Tracy
CA
Pleasanton
CA
Dublin
CA
City
Individuals
Harris, Joan
Mertes, Dr. David, Board Chair
ValleyCare Hospital
Mueller, Mike & Ann
Libraries/Newspapers
City of Pleasanton, Public Library
City of Dublin, Branch Library
Businesses
Bouchard, Dave, President
Pleasanton Chamber of Commerce
Fagundes, George, Chairman
Dublin Chamber of Commerce
Haftel, Joy
Congressional Information Services
Bethesda
MD
Horner, Nadine, President
Livermore Chamber of Commerce
Livermore
CA
11-2
Final SNL/CA SWEA DOE/EA-1422—January 2003
Chapter 11, List of Agencies, Organizations, and Individuals to Whom Copies of this Site-Wide Environmental Assessment were Sent
Name
Affiliation
City
State
Hughes, Karen, Chairwoman
Livermore Chamber of Commerce,
Purple Orchid
Livermore
CA
O'Malley, Tom
Tri-Valley Business Council
Livermore
CA
Rapaport, Gary, President
Tracy Chamber of Commerce
Tracy
CA
Weiss, Paul
Congressional Information Services
Bethesda
MD
Winter, Christina, Chair
San Ramon Chamber of Commerce
San Ramon
CA
Sierra Club, San Francisco Bay Chapter
Berkeley
CA
Cabasso, Jacqueline
Western States Legal Foundation
Oakland
CA
Erickson, Stan, Chair
Sierra Club, Tri-Valley Group
Fienstein, Arthur
Golden Gate Audubon Society
Berkeley
CA
Kelley, Marylia
Tri-Valley CAREs
Livermore
CA
Mertes, Dr. Barbara, Chair
Valley Study Group
Livermore
CA
Riley, A. L.
California Natural Resource Foundation
Berkeley
CA
Organizations
Final SNL/CA SWEA DOE/EA-1422—January 2003
11-3
This page intentionally left blank.
Chapter 12, List of Agencies and People Contacted
CHAPTER 12
List of Agencies and People Contacted
Organization
Sandia National
Laboratories/
Livermore,
California
Last Name
First Name
Title
Location
State
Blevins
Linda
Livermore
CA
Allendorf
Mark
Livermore
CA
Keiffer
Patrick
Livermore
CA
Hachman
John
Livermore
CA
Henderson
Craig
Livermore
CA
Didlake
John
Livermore
CA
Armijo
Herman
Livermore
CA
Barr
Vern
Livermore
CA
Brynildson
Mark
Livermore
CA
Garrett
Bob
Livermore
CA
Brekke
David
Livermore
CA
Larsen
Barbara
Livermore
CA
Final SNL/CA SWEA DOE/EA-1422—January 2003
12-1
Chapter 12, List of Agencies and People Contacted
This page intentionally left blank.
12-2
Final SNL/CA SWEA DOE/EA-1422—January 2003
Chapter 13, Glossary
CHAPTER 13
Glossary
This glossary lists terms that may not be familiar to some readers of this document. Several sources for definitions are
available including Glossary of Terms used in the Department of Energy and National Environmental Policy Act
Documents (DOE 1998c) and Environment, Safety and Health Thesaurus/Dictionary (DOE 1998d). The last citation
is available through the Internet (http://tis.eh.doe.gov/docs/dict/).
–A–
Abatement: Reducing the degree or intensity of, or
eliminating, pollution.
Accident: An unplanned event or sequence of events
that result in undesirable consequences.
Advanced materials: A material that has been improved
such that it is considered state-of-the-art.
Air pollutant: Generally, an airborne substance that
could, in high enough concentrations, harm living things
or cause damage to materials. From a regulatory perspective, an air pollutant is a substance for which emissions or
atmospheric concentrations are regulated or for which
maximum guideline levels have been established due to
potential harmful effects on human health and welfare.
Air Quality District: Geographic area established to
regulate pollution on a local level.
Air quality standards: The level of pollutants
prescribed by regulations that may not be exceeded
during a specified time in a defined area.
Alluvial: Pertaining to deposition of sediments by
rivers and streams.
Ambient air: Any unconfined portion of the atmosphere: open air, surrounding air. That portion of the
atmosphere, external to buildings, to which the general
public has access.
Aquifer: A body of rock or sediment under the earth’s
surface that is capable of transmitting groundwater and
yielding usable amounts of groundwater to supply wells
and springs. A saturated geologic unit through which
significant quantities of water can migrate under natural
hydraulic gradients.
Archaeological sites (resources): Any material
remains of past human life or activities that are of
archaeological interest.
Arroyo: The channel of an ephemeral or intermittent
stream.
Artifact: An object produced or shaped by human workmanship that is of archaeological or historical interest.
Final SNL/CA SWEA DOE/EA-1422—January 2003
As low as reasonably achievable (ALARA): An
approach to radiation protection to manage and control
exposures (both individual and collective) and releases of
radioactive material to the environment to as far below
applicable limits as social, technical, economic, practical,
and public policy considerations permit. ALARA is not a
limit, but a process for minimizing doses to as far below
limits as is practicable.
Attainment area: An area that the United States (U.S.)
Environmental Protection Agency (EPA) has designated
as being in compliance with one or more of the National
Ambient Air Quality Standards (NAAQS) for sulfur
dioxide, nitrogen dioxide, carbon monoxide, ozone, lead,
and particulate matter. An area may be in attainment for
some pollutants but not for others.
–B–
Background radiation: Radiation from 1) cosmic
sources; 2) decay of naturally occurring radioactive materials, including radon (except as a decay product of source
or special nuclear material); and 3) global fallout from
nuclear weapons as it exists in the environment (such
as from the testing of nuclear explosive devices).
Balance of Operations: Operations and activities not
specifically defined that usually provide support to large
facilities and projects and incrementally impact side-wide
utilities, emissions, discharges, and waste generation.
Baseline: The existing environmental conditions against
which impacts of the alternatives can be compared. For
this Site-Wide Environmental Assessment (SWEA), the
environmental baseline is the environmental condition
of the site, as it existed in 2000, unless otherwise stated.
Bioagent: Biochemical substance.
Biohazardous waste: Any waste that is capable of
transmitting an infectious agent to a living organism.
This includes discarded materials such as live and weakened vaccines, blood, excretions or secretions, animal
carcasses and animal waste products, hypodermic needles, syringes, and broken glass items such as blood vials.
Biological resource: Plants, animals, and other living
organisms.
13-1
Chapter 13, Glossary
–C–
Cancer: A group of diseases characterized by uncontrolled cellular growth with invasive characteristics, such
that the disease can transfer from one organ to another.
Candidate species: Plants and animals that the U.S. Fish
and Wildlife Service (USFWS) or the National Marine
Fisheries Service (NMFS) has sufficient information on
biological vulnerability and threats to justify proposing to
add them to the threatened and endangered species list,
but cannot do so immediately because of the relative listing priority of candidates.
Carbon dioxide (CO2): A colorless, odorless, nonpoisonous gas that is a normal component of the ambient air; it
is a product of normal plant and animal respiration and
of the decay of organic matter, and of fuel combustion.
Carbon monoxide (CO): A colorless, odorless gas that
is toxic if breathed in high concentration over a period of
time. It is formed as the product of the incomplete combustion of hydrocarbons (fuels).
Carcinogen: A substance that can cause or contribute to
the production of cancer.
Chemical Information System: Chemical inventory
system used by Sandia National Laboratories/Livermore,
California (SNL/CA).
Clean room: An area that is maintained virtually free
of contaminants (such as dust or bacteria); used in laboratory work and in the production of precision parts for
electronic equipment.
Climatology: The science that deals with climates and
investigates their phenomena and causes.
Collective dose: The sum of doses.
Committed dose equivalent: The dose equivalent to
organs or tissues that will be received by an individual
during the 50-year period following the intake of radioactive material. It does not include contributions from
radiation sources external to the body.
Committed effective dose equivalent: The dose value
obtained by multiplying the committed dose equivalent
for the organ or tissues that are irradiated and the weighting factors applicable to those organs or tissues, and summing all the resulting products.
Comprehensive Test Ban Treaty: A proposed treaty
prohibiting nuclear tests of all magnitudes.
Confining layer: A layer of sediment or rock overlying
an aquifer that inhibits the vertical movement of water
into or out of the aquifer.
13-2
Contaminant: Physical, chemical, biological, or radiological substances or matter that may have an adverse effect
on air, water, or soil.
Criteria pollutants: An air pollutant that is regulated by
NAAQS. The EPA must describe the characteristics and
potential health and welfare effects that form the basis for
setting or revising the standard for each regulated pollutant. Criteria pollutants include sulfur dioxide, nitrogen
dioxide, carbon monoxide, ozone, lead, and particulate
matter.
Cultural resources: Prehistoric or historic sites,
buildings, structures, districts, or other places or objects
(including biota of importance) considered important to
a culture, subculture, or community for scientific, traditional, or religious purposes or for any other reason. This
includes archaeological sites, traditional use areas, and
sacred or religious locations.
Cumulative impacts: The impacts on the environment
that result when the impact of a proposed action is added
to the impacts from other past, present, and reasonably
foreseeable future actions, regardless of what agency or
person undertakes the other actions. Cumulative impacts
can result from individually minor, but collectively more
significant, actions taking place over a period of time.
–D–
Decommission: The process of withdrawing a building,
equipment, or a facility from active service.
Decontamination: The actions taken to reduce or
remove substances that pose a substantial present or
potential future hazard to human health or the environment. Examples are removal of radioactive or chemical
contamination from facilities, equipment, or soils by
washing, heating, chemical or electrochemical action,
mechanical cleaning, or other techniques.
Deflagration: Burning or causing to burn with intense
heat and light.
Depleted uranium: Uranium whose content of the
fissile uranium-235 isotope is less than the 0.7 percent
(by weight) found in natural uranium, so that it contains
more uranium-238 than natural uranium.
Dose (chemical): The amount of a substance administered to, taken up by, or assimilated by an organism. It is
often expressed in terms of the amount of substance per
unit mass of the organism, tissue, or organ of concern.
Dose (radiological): A generic term meaning absorbed
dose, dose equivalent, effective dose equivalent, and committed equivalent dose.
Final SNL/CA SWEA DOE/EA-1422—January 2003
Chapter 13, Glossary
Dosimetry: The theory and application of the principles
and techniques involved in measuring and recording
radiation doses.
Drinking water standards: The prescribed level of
constituents or characteristics in a drinking water supply
that cannot be exceeded legally.
–E–
Ecosystem: A community of organisms and their
physical environment interacting as an ecological unit.
Effluent: Treated or untreated air emissions or liquid
discharges.
Eligible cultural resource: A cultural resource that has
been evaluated and reviewed by an agency and the State
Historic Preservation Officer (SHPO) and determined
eligible for inclusion in the National Register of Historic
Places (NRHP), based on the criteria of significance and
eligibility.
Emission standards: Requirements established by a
state, local government, or the EPA Administrator that
limits the quantity, rate, or concentration of emissions of
air pollutants on a continuous basis.
Emissions: Pollution discharged into the atmosphere
from smoke stacks, other vents, and surface areas of commercial or industrial facilities, residential chimneys, and
vehicle exhausts.
Endangered species: Plants or animals that are in danger of extinction throughout all or a significant portion of
their ranges and that have been listed as endangered by
the USFWS or the NMFS following the procedures outlined in the Endangered Species Act and its implementing
regulations.
Environmental assessment (EA): A public document
that a Federal agency prepares under NEPA to provide
sufficient evidence and analysis to determine whether a
proposed agency action would require preparation of an
environmental impact statement (EIS) or finding of no
significant impact (FONSI).
Environmental impact statement (EIS): The detailed
written statement that is required by section 102(2) of
NEPA for a proposed major Federal action significantly
affecting the quality of the human environment. A DOE
EIS is prepared in accordance with applicable requirements of the Council on Environmental Quality (CEQ)
NEPA regulations in 40 CFR Parts 1500-1508, and DOE
NEPA regulations in 10 CFR Part 1021.
Final SNL/CA SWEA DOE/EA-1422—January 2003
Environmental justice: The fair treatment and meaningful involvement of all people regardless of race, color,
national origin, or income with respect to the development, implementation, and enforcement of environmental laws, regulations, and policies. Fair treatment means
no group of people, including racial, ethnic, or socioeconomic groups, should bear a disproportionate share of
the negative environmental consequences resulting from
industrial, municipal, and commercial operations or the
execution of Federal, state, local, and tribal programs and
policies.
Ephemeral: Lasting for a brief period of time, as in a
temporary stream.
Erosion: The wearing away of land surfaces by the action
of wind or water.
Exotic species: Species of plants and animals that are
not native to a region. They often displace native species
and may become pests.
Explosion (conventional): A chemical reaction or
change of state that occurs in an exceedingly short time
with the generation of high temperatures and large
quantities of gaseous reaction products.
Exposure pathway: The course a chemical or physical
agent takes from the source to the exposed organism. An
exposure pathway describes a mechanism by which an
individual or population is exposed to chemicals or
physical agents at or originating from the site.
–F–
Facility: All contiguous land, and structures, other
operational areas, and improvements used for SNL/CA
activities. A facility may consist of several buildings,
structures, and operational equipment (e.g., one or more
buildings, storage containers, or combinations of them).
Fault: A fracture or a zone of fractures within a rock
formation along which vertical, horizontal, or transverse
slippage has occurred.
Finding of No Significant Impact (FONSI): A document prepared by a Federal agency, briefly presenting the
reasons that a proposed action will not have a significant
effect on the human environment; and, therefore, will
not require an environmental impact statement.
Fissile material: Any material fissionable by low-energy
neutrons consisting of or containing one or more of the
fissile (capable of being split or divided) radionuclides:
plutonium-239 and -241 and uranium-233 and -235.
Neither natural nor depleted uranium is a fissile material.
13-3
Chapter 13, Glossary
Fissile materials are classified according to the controls
needed to provide nuclear criticality safety during storage
and transportation.
Fissionable: A synonym for fissile material; the meaning
of this term has been extended to include material that
can be fissioned by fast neutrons such as uranium-238.
Floodplain: The lowlands and relatively flat areas
adjoining inland and coastal waters and the flood-prone
areas of offshore islands including, at a minimum, that
area inundated by a 1-percent or greater chance flood
in any given year. The base floodplain is defined as the
100-year (1-percent) floodplain. The critical action floodplain is defined as the 500-year (0.2-percent) floodplain.
Fume hood: An enclosed ventilation system used to
protect workers from inhaling fumes or vapors.
Fusion: A nuclear reaction during which light nuclei
are fused together to form a heavier nucleus, accompanied
by the release of immense amounts of energy and fast
neutrons.
–G–
Geology: The science of the earth: the materials, processes, environments, and history of the planet, including the
rocks and their formation and structure.
Groundwater: Subsurface water supply in the saturated
zone below the level of the water table.
–H–
Habitat: The place or area where populations of plants,
animals, and other organisms normally live.
Hazardous air pollutants: Air pollutants that are
not covered by ambient air quality standards, but that
may present a threat of adverse human health effects or
adverse environmental effects.
Hazardous chemical: Under 29 CFR Part 1910.1200(c),
a hazardous chemical is defined as “any chemical, which
is a physical hazard or a health hazard.” Physical hazards
include combustible liquids, compressed gases, explosives,
flammables, organic peroxides, oxidizers, pyrophorics,
and reactives. A health hazard is any chemical for which
there is good evidence that acute or chronic health effects
occur in exposed employees. Hazardous chemicals include
carcinogens, toxic or highly toxic agents, reproductive
toxins, irritants, corrosives, sensitizers, hepatotoxins,
nephrotoxins, agents that act on the hematopoietic system, and agents that damage the lungs, skin, eyes, or mucous membranes.
13-4
Hazardous material: A material, including a hazardous
substance, as defined by 49 CFR Part 171.8, which poses
an unreasonable risk to health, safety, and property when
transported or handled.
Hazardous/toxic waste: Any solid waste (can also be
semisolid or liquid or contain gaseous material) having
one or more characteristics of ignitability, corrosivity,
toxicity, or reactivity, or any other waste specifically
regulated as a hazardous waste defined by the Resource
Conservation and Recovery Act (RCRA) or by the Toxic
Substances Control Act (TSCA).
High explosives: A type of explosive that detonates
under the influence of a high-pressure shock or by the
explosion of a suitable primary explosive (for example,
trinitrotoluene [TNT] and nitroglycerin).
Hydrology: The science dealing with the properties,
distribution, and circulation of natural water systems.
–I–
Infrastructure: The basic facilities, services, and installations needed for the functioning of a city, plant, or other
facility (such as transportation and communication
systems).
Ion: An atom or molecule with a positive or negative
electrical charge.
Irradiate: Exposing a substance to radiation.
Isotope: Any of two or more variations of an element
in which the nuclei have the same number of protons but
a different number of neutrons so that their atomic
masses differ.
–J–
Joining: A process that combines materials, such as
bonding.
–L–
Lacustrine: The term “lacustrine” is related to the
word “lake” - thus a lacustrine wetland is, by definition
lake-associated. This category may include freshwater
marshes, aquatic beds as well as lakeshores.
Latent cancer fatality (LCF): Death from cancer
resulting from, and occurring some time after, exposure
to ionizing radiation or other carcinogens.
Low-level waste (LLW): Radioactive waste that is not
high-level waste, transuranic waste, spent nuclear fuel, or
by-product tailings from the processing of uranium or
thorium.
Final SNL/CA SWEA DOE/EA-1422—January 2003
Chapter 13, Glossary
–M–
Maximum contaminant level (MCL): The maximum
permissible level of a contaminant in water delivered to
any user of a public water system.
Meteorology: The science dealing with the dynamics of
the atmosphere and its phenomena, especially relating to
weather.
Microelectronics: Integrated circuits and electronic
devices constructed of individual circuit elements with
dimensions of micrometers (10-6 meters [m]) on a carrier
with dimensions of a centimeter (10-2 m).
Mission: An objective. The DOE has four missions
(or business lines): national security, energy resources,
environmental quality, and science and technology.
Mitigation: Mitigation includes: 1) avoiding an
impact altogether by not taking a certain action or parts
of an action; 2) minimizing impacts by limiting the
degree or magnitude of an action and its implementation; 3) rectifying an impact by repairing, rehabilitating,
or restoring the affected environment; 4) reducing or
eliminating the impact over time by preservation and
maintenance operations during the life of an action; or
5) compensating for an impact by replacing or providing
substitute resources or environment.
Mixed waste: Waste that contains both “hazardous
waste” and “radioactive waste” as defined in this glossary.
–N–
National Ambient Air Quality Standards (NAAQS):
Standards defining the highest allowable levels of certain
pollutants in the ambient air. Because the EPA must
establish the criteria for setting these standards, the
regulated pollutants are called criteria pollutants.
National Emission Standards for Hazardous Air
Pollutants (NESHAP): Emissions standards set by the
EPA for air pollutants that are not covered by the NAAQS
and that at sufficiently high levels, may cause increased
fatalities, irreversible health effects, or incapacitating
illness.
National Pollutant Discharge Elimination System
(NPDES): A provision of the Clean Water Act that prohibits discharge of pollutants into waters of the United
States unless a special permit is issued by the EPA; a state;
or, where delegated, a tribal government on an Indian
reservation. The NPDES permit lists either permissible
discharge, the level of cleanup technology required for
wastewater, or both.
Final SNL/CA SWEA DOE/EA-1422—January 2003
National Register of Historic Places (NRHP): The
official list of the Nation’s cultural resources that are
considered worthy of preservation. The National Park
Service (NPS) maintains the list under direction of the
Secretary of the Interior. Buildings, structures, objects,
sites, and districts are included in the National Register
(NR) for their importance in American history, architecture, archeology, culture, or engineering. Properties included on the NR range from large-scale, monumentally
proportioned buildings to smaller scale, regionally
distinctive buildings.
Neutron: An uncharged elementary particle with a
mass slightly greater than that of the proton, found in
the nucleus of every atom heavier than hydrogen-1.
Nonattainment area: An area that the EPA has designated as not meeting (that is, not being in attainment of)
one or more of the NAAQS for criteria pollutants. An
area may be in attainment for some pollutants, but not
others.
Nonhazardous chemical waste: Chemical waste not
defined as a RCRA hazardous waste.
Nonnuclear component: Any one of thousands of parts,
not containing radioactive or fissile material (plutonium239, uranium-233, or uranium-235), that are required in
a nuclear weapon.
Nonproliferation: Preventing the spread of nuclear
weapons, nuclear weapon materials, and nuclear weapon
technology.
Notice of Intent (NOI): A notice published in the
Federal Register (FR) that a NEPA document would be
prepared and considered. An NOI describes the proposed
action and alternatives and the Federal agency’s scoping
process, and states the name and address of the person
within the agency who can answer questions about the
proposed action and EA.
Nuclear material: A composite term applied to
1) special nuclear material; 2) source material such as
uranium or thorium or ores containing uranium or
thorium; and 3) by-product material, which is any radioactive material that is made radioactive by exposure to
the radiation incident to the process of producing or
using special nuclear material.
Nuclear Nonproliferation Treaty: A treaty with the
aim of controlling the spread of nuclear weapons technologies, limiting the number of nuclear weapons states, and
pursuing, in good faith, effective measures relating to the
cessation of the nuclear arms race. The treaty does not
invoke stockpile reductions by nuclear states, and it does
not address actions of nuclear states in maintaining their
stockpiles.
13-5
Chapter 13, Glossary
Nuclear weapon: Any weapon in which the explosion
results from the energy released by reactions involving
atomic nuclei (fission, fusion, or both).
–O–
Occupational Safety and Health Administration
(OSHA): The Federal agency that oversees and regulates
workplace health and safety, created by Occupational
Safety and Health Act of 1970.
Organic chemicals: Chemicals that are based on bonds
with the carbon atom. Organics can have certain properties, such as volatility, that are not typically associated
with inorganics.
Organic polymer: Nonmetallic compounds that are
basic molecular building blocks.
Ozone (O3): The triatomic form of oxygen. In the stratosphere, ozone protects the earth from the sun’s ultraviolet
rays; but in lower levels of the atmosphere, ozone is considered an air pollutant.
– P-Q –
Particulate matter: Any finely divided solid or liquid
material, other than uncombined water.
Perched aquifer: Groundwater separated from an
underlying body of groundwater by unsaturated rock.
Person-rem: A unit of collective radiation dose applied
to populations or groups of individuals; that is, a unit for
expressing the dose when summed across all persons in a
specified population or group.
Plasma: a gas containing free ions and electrons, and
therefore capable of conducting electric currents.
Plating: A process in which chemicals are used to coat
a surface (typically metallic) with another material. The
purpose is typically to improve the material properties
such as rust protection.
Plutonium: A heavy, radioactive, metallic element
with the atomic number 94. It is produced artificially
by neutron bombardment of uranium. Plutonium has
15 isotopes with atomic masses ranging from 232 to 246
and half-lives from 20 minutes to 76 million years. Its
most important isotope is fissile plutonium-239.
Prehistoric resource: For the SWEA, cultural resources
produced before the arrival of the Spanish.
Programmatic Environmental Impact Statement
(PEIS): A broad-scope environmental impact statement
that identifies and assesses the environmental impacts of
a DOE program.
13-6
Proliferation: The spread of nuclear weapons and the
materials and technologies used to produce them.
Proposed species: Any species of fish, wildlife, or plant
that is proposed in the FR to be listed under Section 4 of
the Endangered Species Act.
–R–
Radiation absorbed dose (rad): A unit of radiation
absorbed dose. One rad is equal to an absorbed dose of
0.01 joules per kilogram (kg).
Radiation: The particles (alpha, beta, neutrons, and
other subatomic particles) or photons (such as gamma
rays and X-rays) emitted from the nucleus of unstable
atoms as a result of radioactive decay.
Radioactive waste: In general, waste that is managed
because of its radioactive content. Waste material that
contains special nuclear or by-product material is subject
to regulation as radioactive waste under the Atomic
Energy Act (AEA).
Radioactivity: The spontaneous decay or disintegration
of unstable atomic nuclei, accompanied by the emission
of radiation.
Radiograph: An image produced by X-rays passing
through an object.
Radionuclide or Radioisotope: An unstable isotope
that undergoes spontaneous transformations, emitting
radiation.
Recharge: The processes by which water is absorbed
and added to an aquifer.
Record of Decision (ROD): A public document that
records a Federal agency’s decision on a proposed action
for which the agency has prepared an environmental
impact statement. A ROD identifies the alternatives
considered in reaching the decision, the environmentally
preferable alternative(s), factors balanced by the DOE
in making the decision, whether all practicable means
to avoid or minimize environmental harm have been
adopted, and if not, why they were not.
Region of influence (ROI): A geographic area within
which project activities may affect a particular resource.
Rem: See “Roentgen equivalent, man.”
Remediation: The process, or a phase in the process, of
rendering areas contaminated by radioactive, hazardous,
or mixed waste environmentally safe, whether through
processing, entombment, or other methods.
Final SNL/CA SWEA DOE/EA-1422—January 2003
Chapter 13, Glossary
Resource area: Analyses in the SWEA are grouped into
two categories: resource areas (for example, infrastructure, geology and soils, and water resources) and topic
areas (for example, transportation, waste generation, and
accidents).
Resource Conservation and Recovery Act (RCRA)
hazardous waste: A hazardous waste, as defined by
RCRA, is a solid waste, or combination of solid wastes,
which, because of its quantity, concentration, physical,
chemical, or infectious characteristics may 1) cause or
significantly contribute to an increasing mortality or
increase in serious irreversible, or incapacitating irreversible, illness; or 2) pose a substantial present or potential
hazard to human health or the environment when
improperly treated, stored, transported, disposed of,
or otherwise managed.
Seismic: Pertaining to any earth vibration, especially
related to an earthquake.
Semiconductors: Any of various solid crystalline
substances having electrical conductivity greater than
insulators but less than good conductors.
Site-Wide Environmental Impact Statement
(SWEIS): A type of PEIS that analyzes the environmental impacts of all or selected functions at a DOE site.
As part of its regulations for implementation of NEPA,
the DOE prepares site-wide EISs for certain large, multiple-program DOE sites; it may prepare EISs or EAs for
the other sites to assess the impacts of all or selected
functions at those sites (10 CFR Part 1021.330 [c]).
Socioeconomics: The science or study of social and
economic effects.
Riparian: Areas adjacent to rivers and streams that have
a high density, diversity, and productivity of plant and
animal species relative to nearby uplands.
Species of Concern: Species for which further biological
research and field studies are needed to resolve their conservation status.
Risk: The probability of a detrimental effect from exposure to a hazard. Risk is often expressed quantitatively as
the probability of an adverse event occurring multiplied
by the consequence of the event. However, separate presentation of probability and consequences is often more
informative.
START I and II: Terms that refer to negotiations
between the U.S. and Russia (the former Soviet Union
during START I negotiations) aimed at limiting and
reducing nuclear arms. START I discussions began in
1982 and eventually led to a ratified treaty in 1988. The
START II protocol, which has not been fully ratified,
will attempt to further reduce the acceptable levels of
nuclear weapons ratified in START I.
Roentgen: A unit of exposure to ionizing X- or gamma
radiation equal to or producing 1 electrostatic unit of
charge per cubic centimeter of air. It is approximately
equal to 1 rad (a standard unit of absorbed dose of
radiation).
Roentgen equivalent, man (rem): A unit of dose
equivalent. The dose equivalent in rems equals the
absorbed dose in rads in tissue multiplied by the appropriate quality factor and possibly other modifying factors.
Runoff: The portion of rainfall, melted snow, or
irrigation water that flows across the ground surface
and eventually enters streams.
–S–
Scoping: An early and open process for determining
the scope of issues to be addressed in an environmental
impact statement and for identifying the significant issues
related to a proposed action.
Section 106 process: A National Historic Preservation
Act (16 U.S.C. §470 et seq.) review process used to identify, evaluate, and protect cultural resources eligible for
nomination to the National Register of Historic Places
that may be affected by Federal actions or undertakings.
Final SNL/CA SWEA DOE/EA-1422—January 2003
State Historic Preservation Officer (SHPO): A
position in each U.S. state that coordinates state participation in the National Historic Preservation Act (16 U.S.C.
§470 et seq.). The SHPO is a key participant in the Section
106 process, assisting in identifying eligible resources,
evaluating effects of undertakings, and developing mitigation measures or management plans to reduce any
adverse effects to eligible cultural resources.
Stockpile stewardship: Stockpile stewardship comprises the activities associated with research, design,
development, and testing of nuclear weapons, and the
assessment and certification of their safety and reliability.
Stratigraphy: Pertaining to the formation, composition,
and sequence of stratified rocks.
Surface water: Water on the earth’s surface, as distinguished from water in the ground (groundwater).
–T–
Threatened species: Any plants or animals that are
likely to become an endangered species within the foreseeable future throughout all or a significant portion of
their ranges and that have been listed as threatened by
the USFWS or the NMFS.
13-7
Chapter 13, Glossary
Threshold limit values: The recommended concentration of contaminants workers may be exposed to according to the American Council of Governmental Industrial
Hygienists (ACGIH).
Throughput: The number of items undergoing a process,
or the amount of material consumed by a process.
Total effective dose equivalent: The sum of the
effective dose equivalent (for external exposures) and
the committed effective dose equivalent (for internal
exposures).
Transuranic (TRU): An atom with an atomic number
greater than uranium (92). Examples include plutonium
and californium.
TRU waste: Without regard to source or form, waste
contaminated with alpha-emitting TRU radionuclides
with half-lives greater than 20 years and concentrations
greater than 100 nanocuries per gram at the time of assay.
Tritium: A radioactive isotope of hydrogen whose
nucleus contains one proton and two neutrons.
Toxic Substances Control Act (TSCA) hazardous
waste: TSCA hazardous waste is waste generated from
TSCA materials exceeding identified limits in the Act
and supporting regulations. SNL/CA manages two TSCAregulated materials: PCBs and asbestos. The bulk of TSCA
wastes generated at SNL/CA come from decontamination
and decommissioning activities.
–U–
Unsaturated zone: A subsurface porous region of the
earth in which the pore space is not filled with water.
–V–
Volatile organic compounds (VOCs): A broad range
of organic compounds, often halogenated, which vaporize
at typical background or relatively low temperatures, such
as benzene, chloroform, and methyl alcohol, and other
solvents.
–W–
Wafer: Another word for a computer chip.
Wetland: An area that is inundated by surface or groundwater with a frequency sufficient to support and, under
normal circumstances, does or would support a prevalence of vegetation or aquatic life that requires saturated
or seasonally saturated soil conditions for growth and
reproduction.
Travel corridor: Passageways used by animals to move
between various parts of their home range or, during
migration, to move from summer (breeding) to winter
ranges.
– X-Y-Z
X-ray: A high-energy photon.
Turbidity: A cloudy condition in water due to
suspended silt or organic matter.
13-8
Final SNL/CA SWEA DOE/EA-1422—January 2003
Chapter 14, Notice of Intent
Final SNL/CA SWEA DOE/EA-1422—January 2003
14-1
Chapter 14, Notice of Intent
14-2
Final SNL/CA SWEA DOE/EA-1422—January 2003
Chapter 14, Notice of Intent
Final SNL/CA SWEA DOE/EA-1422—January 2003
14-3
This page intentionally left blank.
Facility Description
FACILITY DESCRIPTIONS
Table of Contents
Facility Descriptions
Combustion Research Facility (CRF) ............................................................................... FD-3
Building 910 ................................................................................................................... FD-5
Building 914 ................................................................................................................... FD-7
Building 916 ................................................................................................................... FD-9
Building 927 .................................................................................................................. FD-11
Micro and NanoTechnologies Laboratory (MANTL) ...................................................... FD-13
Chemical and Radiation Detection Laboratory (CRDL) ................................................ FD-15
LIGA Technologies Facility (LTF) ................................................................................... FD-17
Distributed Information Systems Laboratory (DISL) ..................................................... FD-19
Area 8 Facilities ............................................................................................................ FD-21
Explosive Storage Area .................................................................................................. FD-22
Hazardous and Radioactive Waste Storage Facilities .................................................... FD-22
Glass Furnace and Melting Laboratory.......................................................................... FD-23
Final SNL/CA SWEA DOE/EA-1422—January
2003DOE/EA-1422—October 2002
Draft SNL/CA SWEA
FD-1
This page intentionally left blank.
Facility Description
Combustion Research Facility (CRF)
Function and Description:
The CRF (Buildings 905, 906, and 907) is used for broad-based research in combustion science and technology.
❍
38,000 square feet (sq ft) building with lobby, conference rooms, and approximately 117 offices,
❍
44,000 sq ft building with 50 primary research and development light labs,
❍
Loading dock (provides gas bottle storage area), and
❍
Large liquid nitrogen tank.
Combustion Research Facility (CRF)
The CRF is a low-hazard nonnuclear complex that consists of an administrative building a separate laboratory
building, and a mechanical building. The administrative and laboratory buildings are multistory, steel frame
masonry structures totaling approximately 70,500 gross square feet (gsf). The mechanical building is a singlestory structure with approximately 4,500 gsf. The following structures are located in the complex:
Specific Processes, Activities, and Capabilities:
Support activities include a wide variety of bench-scale research and development in areas of combustion
engines and chambers, combustion chemistry, combustion reactions, industrial and combustion processes,
and diagnostics and remote sensing.
Typical hazards include standard industrial and laboratory hazards including power supplies, custom electrical
equipment, lasers, fuels, compressed gases, and combustible materials. Other hazards include the handling of
chemical, reactive, toxic, thermal, and energetic materials. Chemical emissions are small and related to the
small-scale chemical use at the facility.
Safety features within the building include barriers and shields, safety shower and/or eyewash stations, and
ventilation hoods. Hazard control at the Complex is maintained by using the following engineered features:
insulated conductors, pressure relief valves, interlocks, ventilation hoods, secondary containment, access
prevention barriers, warning devices, Liquid Effluent Control System (LECS), and shielding.
Final SNL/CA SWEA DOE/EA-1422—January
2003DOE/EA-1422—October 2002
Draft SNL/CA SWEA
FD-3
Facility Description
Chapter 1, Introduction and Purpose and Need for Agency Action
Combustion Research Facility (CRF)
Source: Pelletier 2002
Figure FD-1. Combustion Research Facility (CRF)
Various combustible materials are tested at the CRF.
FD-4
Final SNL/CA SWEA DOE/EA-1422—January 2003
Facility Description
Building 910
Function and Description:
Building 910 is used to conduct weapons research and development (R&D) activities. The facility conducts
science-based engineering and technology R&D in a wide variety of sciences including advanced electronics
prototype and development, surface physics, neutron detector research, and telemetry systems.
❍
Lobby,
❍
128 offices,
❍
Loading dock (provides gas bottle storage area),
❍
Large liquid nitrogen tank, and
❍
35 primary research and development light laboratories.
Building 910
Building 910 is a low-hazard non-nuclear facility that consists of offices and space for weapons test assembly
work. It is a multistory steel frame masonry structure of approximately 89,000 gsf, of which 48,000 sq ft is
laboratory and office space. The following spaces are located in the facility:
Specific Processes, Activities, and Capabilities:
Generally, the activities are focused on electronics and microelectronics prototypes. Materials that are studied
include ceramics, semiconductors, organic polymers, and metals. A wide variety of capabilities is employed in
areas of weapon system instrumentation, remote sensing, surface analysis, energy sciences, electronics, and
microsystems engineering.
Specific activities include
❍
Advanced electronics prototype and development,
❍
Surface physics,
❍
Neutron detector research, and
❍
Telemetry systems research and development.
Typical hazards include standard industrial and laboratory hazards including power supplies, custom electrical
equipment, stored electrical energy, compressed gases, cryogenic materials, and energetic materials. Other
hazards include the handling of radioactive, toxic, thermal and energetic materials. Chemical emissions are
small and related to the small-scale chemical use at the facility.
Examples of safety features within the building include machining barriers and shields, safety shower and/or
eyewash stations, and ventilation hoods. Hazard control at Building 910 is maintained by using the following
engineered features: insulated conductors, pressure relief valves, interlocks, ventilation hoods, access prevention barriers, secondary containment, LECS, warning devices, and shielding.
Final SNL/CA SWEA DOE/EA-1422—January
2003DOE/EA-1422—October 2002
Draft SNL/CA SWEA
FD-5
Facility Description
Chapter 1, Introduction and Purpose and Need for Agency Action
Building 910
Source: Pelletier 2002
Figure FD-2. Building 910
Activities at Building 910 include development of advanced electronic prototypes.
FD-6
Final SNL/CA SWEA DOE/EA-1422—January 2003
Facility Description
Building 914
Function and Description:
Building 914 is used to conduct weapons test assembly and machine shop activities. The facility supports
Sandia National Laboratories/California’s (SNL/CA’s) primary mission of ensuring that the United States (U.S.)
nuclear weapons stockpile is safe, secure, and reliable.
❍
17 offices,
❍
4 electronic laboratories,
❍
1 large machine shop,
❍
1 high-bay test assembly, and
❍
Several small utility, vault, and storage rooms.
Building 914
Building 914 is a low-hazard non-nuclear facility that consists of offices and laboratory space for weapons
test assembly work. It is a single-story, steel frame masonry structure of approximately 25,000 gsf, of which
19,000 sq ft is laboratory and office space. The following spaces are located in the facility:
Specific Processes, Activities, and Capabilities:
The operations conducted at Building 914 generally are focused on two distinct capabilities that support the
mission of U.S. nuclear weapons stockpile maintenance: machine shop activities and test assembly operations.
Specific activities include:
❍
Prototype machining and hardware generation,
❍
Mechanical inspection,
❍
Calibration,
❍
Assembly, testing, and modification of hardware for weapons subassemblies, and
❍
Electrical laboratory operations.
Typical hazards include those associated with machining and mechanical operations, such as the use of
lathes, mills, forklifts, overhead cranes, and hoists, and use of flammable/combustible lubricants, solvents,
and oils. Other hazards include the handling of radioactive, toxic, compressed, cryogenic, thermal and
energetic materials from a variety of components associated with weapon subsystems. Chemical emissions
are small and related to the small-scale work in the building.
Examples of safety features within the building include machining barriers and shields, safety shower and/
or eyewash stations, and ventilation hoods. Hazard control at Building 914 is maintained by using the
following engineered features: insulated conductors, pressure relief valves, ventilation hoods, interlocks,
access prevention barriers, secondary containment, magazette containment, grounding system, warning
devices, and shielding.
Final SNL/CA SWEA DOE/EA-1422—January
2003DOE/EA-1422—October 2002
Draft SNL/CA SWEA
FD-7
Facility Description
Chapter 1, Introduction and Purpose and Need for Agency Action
Building 914
Source: Pelletier 2002
Figure FD-3. Building 914
Operations conducted at Building 914 are generally focused on nuclear weapons
stockpile maintenance. Here, these workers are performing test assembly activities.
FD-8
Final SNL/CA SWEA DOE/EA-1422—January 2003
Facility Description
Building 916
Function and Description:
Building 916 is used to conduct materials chemistry R&D activities. Areas of research include thin film
interface science, mechanics, ion implantation, gases in metals, hydrogen storage, plasma, annealing,
detectors, science-based modeling, extreme ultraviolet lithography, microsystems, and fluidics.
❍
Lobby,
❍
Conference room,
❍
53 offices,
❍
Loading dock (provides gas bottle storage area),
❍
Large liquid nitrogen tank, and
❍
22 primary research and development light laboratories.
Building 916
Building 916 is a low-hazard non-nuclear facility that consists of offices and laboratory space for primary
research and development light labs. It is a single story building of approximately 42,000 gsf, of which
32,000 sq ft is laboratory and office space. The following spaces are located in the facility:
Specific Processes, Activities, and Capabilities:
Generally, the activities are focused on materials studies including chemical and physical properties and
characteristics (phases). Materials that are studied include ceramics, semiconductors, organic polymers,
and metals. A wide variety of capabilities are employed in areas of material science, lithography, surface
analysis, electronics, and microsystems engineering.
Research activities involve:
❍
Advanced metallic alloys,
❍
Chemical and radiation detection materials,
❍
Semiconductors,
❍
High-temperature superconductors,
❍
Ceramics
❍
Laser, optical, and dielectric materials, and
❍
Cryogenic vapor and liquid streams.
Routine hazards are associated with lasers, chemicals, microwave radiation, flames and furnaces, vacuum
chambers, compressed gases, cryogenic materials, extreme ultraviolet radiation, ionizing radiation from
accelerators, and organic, inorganic, and energetic materials. Other hazards include cutting, grinding, and
etching, as well as the use of high voltages, power and hand tools, electronic test equipment, and power
supplies. Chemical emissions are small and related to the small-scale work in the building.
Examples of safety features within the building include machining barriers and shields, safety shower and/or
eyewash stations, and ventilation hoods. Hazard control at Building 916 is maintained by using the following
engineered features: insulated conductors, pressure relief valves, interlocks, access prevention barriers, ventilation hoods, LECS, magazette containment, warning devices, and shielding.
Final SNL/CA SWEA DOE/EA-1422—January
2003DOE/EA-1422—October 2002
Draft SNL/CA SWEA
FD-9
Facility Description
Chapter 1, Introduction and Purpose and Need for Agency Action
Building 916
Source: Pelletier 2002
Figure FD-4. Building 916
Activities at Building 916 laboratories include research and development of advanced materials.
FD-10
Final SNL/CA SWEA DOE/EA-1422—January 2003
Facility Description
Building 927
Function and Description:
Building 927 is used to store nuclear and classified materials, assemble subsystems, conduct system
verification, and store equipment. The Explosive Destruction System (EDS) subsystems are assembled in
the facility. No testing with explosives or other hazardous materials is completed at this location.
Building 927
Building 927 is a low-hazard non-nuclear facility. It consists of a single story warehouse of approximately
22,000 gsf. The building provides a safeguard storage facility for special materials.
Specific Processes, Activities, and Capabilities:
Building 927 has four operations:
❍
Nuclear and Classified Material Control,
❍
Assembly test facility,
❍
Storage, and
❍
EDS assembly support.
The major hazards include radioactive materials, electrical sources, mechanical hazards, thermal hazards,
high-pressure operations, miscellaneous hazards, and small amounts of hazardous waste.
A variety of hazards in this building include:
❍
Hoists,
❍
Cranes,
❍
Machine shop equipment,
❍
Welding,
❍
Parts fabrication tools, and
❍
Hydraulic equipment.
Hazard control at Building 927 is maintained by using the following engineered features: pressure relief
valves and access prevention barriers.
Final SNL/CA SWEA DOE/EA-1422—January
2003DOE/EA-1422—October 2002
Draft SNL/CA SWEA
FD-11
Chapter 1, Introduction and Purpose and Need for Agency Action
Facility Description
Building 927
Source: Pelletier 2002
Figure FD-5. Building 927 assembles the Explosive Destruction System (EDS)
The EDS is designated to destroy recovered World War I vintage chemical explosives.
FD-12
Final SNL/CA SWEA DOE/EA-1422—January 2003
Facility Description
Micro and NanoTechnologies Laboratory (MANTL)
Micro and NanoTechnologies Laboratory (MANTL)
Function and Description:
The mission of the MANTL (Buildings 940, 941, 942, and 943) is to develop and integrate manufacturing
technology to produce micro- and nano-products.
MANTL is a low-hazard non-nuclear facility complex that consists of an administrative building and three
separate laboratory buildings. All of the buildings are of steel-framed masonry construction, and total
approximately 100,000 gsf. The following facilities are located in the complex:
❍
22,778 sq ft administrative building including lobby, offices, and a small auditorium,
❍
30,218 sq ft building with primary research and development light laboratories,
❍
25,740 sq ft building with primary research and development light laboratories,
❍
7,182 sq ft building with primary research and development light laboratories, and
❍
10,000-gallon (gal) LECS.
Specific Processes, Activities, and Capabilities:
MANTL activities include a wide variety of operations micro-machining, miniature component fabrication,
fuel cell research and development, sensors and signal processing, and extreme ultraviolet lithography.
Areas of materials research and development include characterization, chemistry, composite and lightweight
components, engineered materials (welding, brazing, and joining), science-based modeling, and radiography.
Specific operations include materials evaluation laboratories, materials synthesis and processing laboratories,
microsystems processing laboratories, and nanolithography equipment development.
MANTL has 11 areas of capabilities:
❍
Integrated Manufacturing,
❍
LIGA Microsystems,
❍
Fuel Cell Prototyping,
❍
Materials Characterization,
❍
Materials Chemistry,
❍
Lightweight Components,
❍
Engineered Materials,
❍
Science-Based Modeling,
❍
Sensors,
❍
Radiography, and
❍
Extreme Ultraviolet Lithography.
Routine hazards are associated with lasers, chemicals, microwave radiation, flames and furnaces, vacuum
hambers, compressed gases, extreme ultraviolet radiation, ionizing radiation, and organic, inorganic, and
toxic materials. Other hazards include high voltages, power and hand tools, and electronic test equipment.
Examples of safety features within the building include machining barriers and shields, safety shower and/
or eyewash stations, and ventilation hoods. Hazard control at the Complex is maintained by using the
following engineered features: insulated conductors, pressure relief valves, interlocks, access prevention
barriers, ventilation hoods, LECS, magazette containment, warning devices, and shielding.
Final SNL/CA SWEA DOE/EA-1422—January
2003DOE/EA-1422—October 2002
Draft SNL/CA SWEA
FD-13
Facility Description
Chapter 1, Introduction and Purpose and Need for Agency Action
Micro and Nano Technologies Laboratory (MANTL)
Source: Pelletier 2002
Figure FD-6. Micro and Nano Technologies Laboratory (MANTL)
At the MANTL, materials research and development involves very small components and highly specialized equipment.
FD-14
Final SNL/CA SWEA DOE/EA-1422—January 2003
Facility Description
Chemical and Radiation Detection Laboratory (CRDL)
Chemical and Radiation Detection Laboratory (CRDL)
Function and Description:
The CRDL is used as a multi-purpose research and development facility. Generally, the facility supports
research, development, and fabrication of chemical and radiation detection systems. Rooms within the
CRDL operate as a Centers for Disease Control (CDC) registered Biosafety Level 2 laboratory.
CRDL is a low-hazard non-nuclear facility. The single story building totals approximately 16,000 gsf
with 9,500 sq ft of laboratory and office space. The following spaces are located in the building:
❍
Lobby,
❍
Conference room,
❍
A clean room (Microstructures Laboratory)
❍
Approximately 22 research and development light laboratories, and
❍
Loading dock.
Specific Processes, Activities, and Capabilities:
CRDL activities involve development of biological/chemical species sensors that detect trace amounts of
toxins, viruses, and biological species, and protein research. Areas of research and development would
include microstructures (fabrication of semiconductors), radiation detectors, laser-based detectors, and
sensor research (nerve agents, drugs, and explosives).
The Biosafety Level 2 laboratories provide standard chemical, biological, and analytical laboratory capabilities for conducting research in areas of advanced micro-separation technologies, laser-based detection,
microelectronic biosensors, biological chemistry, and toxins handling. Work is limited to non-aerosol species.
CRDL has a wide variety of capabilities including:
❍
Development of chemical and bio-analytical methods for chemical analysis;
❍
Development, fabrication and testing of biochemical, chemical and radiation detectors;
❍
Culture of viral, microbial and mammalian cells to produce proteins for basic research;
❍
Development of membrane protein systems for environmental remediation and energy production;
❍
Refrigerators/freezers for storage of biological species; and
❍
Autoclaves are available for the destruction of biological species.
Routine hazards are associated with lasers, chemicals, microwave radiation, flames and furnaces, vacuum
chambers, cryogenic materials, compressed gases, and organic, inorganic, and toxic materials (includes
toxins, toxin fragments, and biohazardous materials). Other hazards include high voltages, hot and cold
surfaces, and test equipment.
Examples of safety features within the building include machining barriers and shields, safety shower
and/or eyewash stations, and ventilation hoods. Hazard control at the building is maintained by using the
following engineered features: autoclaves, access control, ventilation hoods, interlocks, LECS, warning
devices, and shielding.
Final SNL/CA SWEA DOE/EA-1422—January
2003DOE/EA-1422—October 2002
Draft SNL/CA SWEA
FD-15
Facility Description
Chapter 1, Introduction and Purpose and Need for Agency Action
Chemical and Radiation Detection Laboratory (CRDL)
Source: Pelletier 2002
Figure FD-7. Chemical and Radiation Detection Laboratory (CRDL)
Activities at the CRDL involve advanced detection technologies including lasers and microsystems.
FD-16
Final SNL/CA SWEA DOE/EA-1422—January 2003
Facility Description
LIGA Technologies Facility (LTF)
Function and Description:
The new facility would be a state-of-the-art, multi-story structure containing approximately 30,000 gsf; it would
house offices, primary and secondary laboratories, and clean room areas. Laboratory space would be used for
LIGA device test equipment, packaging, scanning, and device inspection.
Specific Processes, Activities, and Capabilities:
A variety of processes are used to produce microelectronic and micromechanical devices that may vary according to the needs of a particular project. The LTF is to provide process-and process-support cleanrooms, functional areas, and laboratory environments to fabricate these devices. The high tolerance and high quality process
requirements of the appropriate size and technical performance characteristics essential to LIGA and LIGA-like
part and device microfabrication, assembly, aging, and testing would be provided in this facility
These processes can be grouped within the following four broad categories:
❍
Film molding—processes that chemically treat polymethyl methacrylate to create a mold;
❍
Plating—processes that electroplate metal or alloy in the mold to create a metal micropart;
❍
Microfabrication—processes that carve (lapped and polished) out the image created on the films; and
❍
Part finishing—processes dissolve the film and expose the finished product.
Hazards would involve standard laboratory hazards, acids and caustics, hazardous materials, and flammable
gases. Engineering and administrative controls and personal protective equipment would be employed. Engineered controls will include interlocks, insulation, barriers, hoods, and alarms.
Final SNL/CA SWEA DOE/EA-1422—January
2003DOE/EA-1422—October 2002
Draft SNL/CA SWEA
FD-17
LIGA Technologies Facility (LTF)
The LTF (Building 944) would provide R&D, and prototyping of LIGA and LIGA-like microdevices necessary to
meet current and future Defense Program objectives.
Facility Description
Chapter 1, Introduction and Purpose and Need for Agency Action
LIGA Technologies Facility (LTF)
Source: Pelletier 2002
Figure FD-11. LIGA Technologies Facility (LTF)
The LTF is a proposed microdevices facility.
FD-18
Final SNL/CA SWEA DOE/EA-1422—January 2003
Facility Description
Distributed Information Systems Laboratory (DISL)
Distributed Information Systems Laboratory (DISL)
Function and Description:
The DISL (Building 915), which is currently under construction, would provide research and development in
areas of distributed information systems.
The new facility would be a state-of-the-art, two-story structure containing approximately 70,400 gsf;
it would house offices, computer laboratory space, research and development space, and collaborative
group areas. The space would be divided into the following:
❍
12,000 sq ft of computer laboratory space,
❍
17,650 sq ft of research and development space,
❍
4,730 sq ft for collaborative group areas,
❍
8,220 sq ft for support areas,
❍
Ancillary laboratories, and
❍
Secure vault-type rooms.
Specific Processes, Activities, and Capabilities:
DISL operations would focus on the following technologies:
❍
Secure networking,
❍
High performance distributed computing,
❍
Visualization and collaboration technologies, and
❍
Design and manufacturing of productivity environments.
Laboratory activities would consist primarily of connecting off-the-shelf hardware components into multimedia and network systems, computer model development, testing and validation, and distributed computing.
Hazards would be minimal. No radioactive or chemical inventory is anticipated.
Final SNL/CA SWEA DOE/EA-1422—January
2003DOE/EA-1422—October 2002
Draft SNL/CA SWEA
FD-19
Facility Description
Chapter 1, Introduction and Purpose and Need for Agency Action
Distributed Information Systems Laboratory (DISL)
Source: Pelletier 2002
Figure FD-12. Distributed Information System Laboratory (DISL)
A new state-of-the-art research and development facility.
FD-20
Final SNL/CA SWEA DOE/EA-1422—January 2003
Facility Description
Area 8 Facilities
Function and Description:
The Area 8 facilities (Buildings 955, 956, 965, 966, 970, 974, 976, 977, 978, 979, and 983) are used as a
multi-purpose R&D support facilities. Generally, the facilities support research, development, and testing
throughout SNL/CA.
❍
1,091 sq ft welding lab,
❍
7,168 sq ft high pressure test facility,
❍
2,011 sq ft welding lab,
❍
682 sq ft storage facility,
❍
2,451 sq ft hydrogen test facility,
❍
2,882 sq ft test assembly facility,
❍
4,380 sq ft radiation machining, engine lab, and
❍
1,318 sq ft test assembly facility.
Area 8 Facilities
All the facilities in Area 8 are low-hazard non-nuclear facilities. The nine buildings, all steel and masonry,
total approximately 23,000 gsf of laboratory and testing space. The following facilities are located in Area 8:
Specific Processes, Activities, and Capabilities:
Testing activities involve high-pressure hydrogen, mechanical, high explosives, vibration, climate, temperature,
and high acceleration. Experiments and research are completed in areas of welding, hydrogen fueled engines,
and special materials. Data collection activities support the above testing work.
Area 8 has a wide variety of capabilities including:
❍
High pressure hydrogen testing,
❍
Mechanical testing,
❍
High explosives component testing,
❍
EDS testing,
❍
Machining of special materials,
❍
Vibration testing, and
❍
High “g” testing.
Routine hazards are associated with lasers, chemicals, large centrifuge, weapon test units, overhead cranes,
vibration tables, compressed gases, cryogenic materials, and organic, inorganic, and toxic materials. Other
hazards include vacuum vessels, pressure vessels, and test equipment.
Examples of safety features within the Area 8 facilities include machining barriers and shields, safety shower
and/or eyewash stations, and ventilation hoods. Hazard control at Area 8 is maintained by using the following
engineered features: insulated conductors, pressure relief valves, interlocks, access prevention barriers,
ventilation hoods, grounding system, warning devices, and shielding.
Final SNL/CA SWEA DOE/EA-1422—January
2003DOE/EA-1422—October 2002
Draft SNL/CA SWEA
FD-21
Facility Description
Chapter 1, Introduction and Purpose and Need for Agency Action
Explosive Storage Area/Hazardous and Radioactive Waste Storage Facilities
Explosive Storage Area
Function and Description:
The Explosive Storage Area performs safe handling, packaging, short-term storing, and shipping of all
Department of Transportation (DOT)-regulated explosives. Total capacity is 234.2 kilograms (kg) of
explosives.
The ESA is a low-hazard non-nuclear facility that consists of one permanent building, eight storage bunkers,
and four magazettes.
Specific Processes, Activities, and Capabilities:
Personnel routinely handle energetic materials of various explosive classes. Personnel typically handle
explosives on a day-to-day basis. Activities at the ESA include unpacking, sorting, repackaging, sampling,
storing, staging, and preparing explosives for onsite shipment to approved users.
Hazard control at the ESA is maintained by using the following engineered features, as needed: material
containers, lightning protection, structure design, static control, warning systems, access control, and
seismic storage. Other controls include segregation of incompatible explosives, intrusion alarms, and
signage.
Hazardous and Radioactive Waste Storage Facilities
Function and Description:
The Hazardous and Radioactive Waste Storage Facilities perform safe handling, packaging, short-term storing,
and shipping (for recycling, treatment, or disposal) of all Resource Conservation and Recovery Act (RCRA)regulated and other hazardous and toxic waste categories, including radioactive wastes. Total capacity of the
waste facilities is 63 cubic meters (2,200 cubic feet).
The facilities are a low-hazard non-nuclear facilities. The following structures are located at the facility:
❍
The Hazardous Waste Storage Facility, a 625 sq ft steel-framed metal building for hazardous waste,
❍
The Radioactive Waste Storage Facility, a 3,778 sq ft, steel framed masonry building,
Specific Processes, Activities, and Capabilities:
Hazardous (RCRA, California toxic, and other hazardous) and radioactive waste (including low-level waste
and low-level mixed waste), which are generated by SNL/CA operations described in the RCRA Part B Permit,
are collected and transported to the facilities for packaging and short-term (less than 1 year) storage prior to
offsite transportation for recycling, treatment, or disposal at a licensed facility. In the normal conduct of
business, personnel use a variety of power equipment such as hydraulic drum handlers and empty drum
compactors, forklifts, lift trucks, flatbed trucks, and hauling trucks.
Hazard control at the facilities are is maintained by using the following engineered features, as needed:
waste containers, secondary containment, glove boxes, fume hood, air supply and exhaust systems, high
efficiency particulate air filters, air monitoring systems, radiation area monitor system, breathing air supply,
fire detection and notification system, fire suppression system, and backup electrical power generator.
FD-22
Final SNL/CA SWEA DOE/EA-1422—January 2003
Facility Description
Glass Furnace and Melting Laboratory
Glass Furnace and Melting Laboratory would operate as a user facility for the study of glass manufacturing processes. Activities at the lab would assist in identifying methods to increase production efficiency, improve product quality, and maintain glass industry competitiveness.
The new laboratory and furnace would be built in the existing CRF. The laboratory would use a pilot scale glass
melting tank furnace with a water tank (quench tank) to cool the molten glass. The furnace would be fired by a
combination of natural gas combustion, with air or oxygen, and electrical power. The oxygen would be supplied through a 10,000 gal liquid oxygen tank. To maintain a comfortable work environment, the ventilation
system would be upgraded.
The lab would be equipped with an exhaust system, control room, optical benches, a glass cooling tank, and
glass storage area.
Specific Processes, Activities, and Capabilities:
The activities conducted in the lab would be typical laboratory and pilot-scale manufacturing operations involving raw materials (sand, limestone, sodium carbonate, sodium sulfate) and crushed recycled glass. The equipment used is commercial with custom-built laboratory and pilot-scale instrumentation. To prevent damage to
equipment, the furnace would be kept hot at all times.
Research activities would include:
❍
Operation parameter measurements using laser-based techniques,
❍
Imaging of flames and gaseous species using lasers,
❍
Chemical and physical properties of molten glass,
❍
Testing of instrumentation and process controls,
❍
Testing burner performance, and
❍
Monitoring and measurement of refractory wear.
Equipment would include melting tank furnace, raw material mixer, raw material feeder, crane, gas analyzers,
lasers, and an air preheater. The gas analyzers would be used to monitor oxygen, carbon dioxide, carbon monoxide, unburned hydrocarbons, sulfur dioxide, and nitrogen oxides. In addition, Class IV, argon ion, and dye
lasers would be used.
Hazards would involve high temperature (2900 degrees Fahrenheit [F]) hazards, caustic raw materials, flammable gases, and high-energy sources. Engineering and administrative controls and personal protective equipment
would be employed. Engineered controls will include interlocks, insulation, barriers, vents, and a moat around
the furnace.
Weekly raw material use would be 16,800 pounds (lbs) of sand, 14,000 lbs crushed recycled glass,
and 4,400 lbs of limestone. Approximately 600,000 lbs of glass would be produced annually. It is
expected that all of the glass would be recycled as raw material onsite or recycled through an offsite
facility.
Final SNL/CA SWEA DOE/EA-1422—January
2003DOE/EA-1422—October 2002
Draft SNL/CA SWEA
FD-23
Glass Furnace and Melting Laboratory
Function and Description:
This page intentionally left blank.


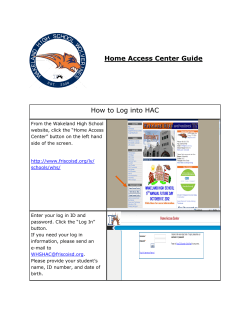


© Copyright 2026