
COVER SHEET
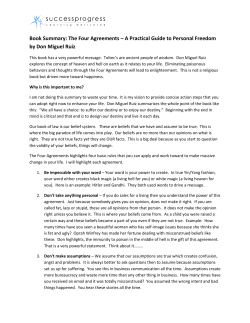
COVER SHEET
This is the author-version of article published as:
Wiklund, Johan and Davidsson, Per and Delmar, Federic (2003) What do they think
and feel about growth? An Expectancy-value approach to small business managers'
attitudes towards growth . Entrepreneurship Theory & Practice 27(3):pp. 247-269.
Accessed from http://eprints.qut.edu.au
Copyright 2003 Blackwell Publishing
What Do They Think and Feel about Growth? An Expectancy-Value Approach to Small
Business Managers’ Attitudes toward Growth1
JOHAN WIKLUND
PER DAVIDSSON
FRÉDÉRIC DELMAR
1
This research was made possible through generous grants by Knut and Alice Wallenberg’s Foundation,
Jan Wallander’s Foundation, Ruben Rausing’s Foundation and The Swedish Foundation for International Cooperation in Research and Higher Education. An earlier version of the article received the Best Paper Award at the
1997 Babson College/Kauffman Foundation Entrepreneurship Research Conference and appears in Frontiers in
Entrepreneurship Research, 1997.
INTRODUCTION
In this article we investigate how small business managers’ beliefs concerning the consequences of growth influence their overall growth attitude. We find this to be an important
question. Although previous research has shown that small firm growth is the most important
source of new jobs (Davidsson, Lindmark, & Olofsson, 1994; 1996; Kirchhoff, 1994; Reynolds & White, 1997), there are also clear indications that many small business managers deliberately refrain from exploiting opportunities to expand their firms. We test the influence of
the eight most important perceived consequences of growth on the overall growth attitude in
three separate, large-scale surveys of small business managers.
Previous research suggests that there is reason to more carefully assess the role of growth
motivation when examining firm growth. Many small business managers are not willing to
pursue growth (Davidsson, 1989a; 1989b; Delmar, 1996; Gundry & Welsch, 2001; Storey,
1994). An important implication of this is that many small firms do not realize their full
growth potential (Scott & Rosa, 1996), which may constitute a source of great underutilization of resources. Our knowledge of why small business managers vary so greatly in
their growth motivation is still limited. It constitutes an area worthy of further investigation,
as research that examines the effect of growth motivation on subsequent business growth
finds support for a positive relationship (Bellu & Sherman, 1995; Kolvereid & Bullvåg, 1996;
Miner, Smith, & Bracker, 1994; Mok & van den Tillaart, 1990)2.
In this article we explicitly assess reasons for differences in levels of growth motivation.
More specifically, we focus on the beliefs and attitudes toward expanding a business. Building on the expectancy-value theory of attitudes (Ajzen, 1988; 1991; Ajzen & Fishbein, 1977;
1980; Fishbein, 1967; Fishbein & Ajzen, 1975), we are interested in how the overall attitude
toward growth is influenced by specific cognitive beliefs about the consequences of growth.
1
By doing so we are able to tease out the relative importance of different motives underlying
small business managers’ attitudes to growth. This research is important for two principal reasons. First, in mainstream economic literature the supremacy of the economic motive is taken
for granted - people act in ways to maximize their profits. In the small business context, a
more diverse view may be relevant. We know that people start and operate their own firms for
a variety of reasons other than maximizing economic returns (Davidsson, 1989a; Delmar,
1996; Gundry & Welsch, 2001; Kolvereid, 1992; Storey, 1994). This does not mean that their
motives are totally irrational. However, it is important to assess the relative importance of
economic and non-economic motives in order to understand why small business managers
exhibit the growth-related attitudes and behaviors that they do.
Second, we believe that this research can have practical implications. People’s beliefs are
influenced by the persuasive argumentation of others (Ajzen, 1991; Chaiken & Stangor,
1987). Hence, it should be possible to affect small business managers’ beliefs about growth
through providing them with the relevant information and knowledge. That is, if certain beliefs have stronger influence on overall attitude, society may be able to take specific actions
related to these areas that, in turn, will affect the small business managers’ attitudes toward
expanding their firms.
The article proceeds as follows. The next section introduces the expectancy-value theory
of attitudes and shows how previous empirical research regarding the motivation of small
business managers can be placed in this conceptual framework in order to explain individual
differences in growth motivation. Eight hypotheses concerning how specific expected consequences of growth affect growth motivation conclude the section. Next, the replication design
is presented along with the analyses carried out to test the hypotheses, the samples and the
variables. The hypotheses are then tested by means of regression analysis in the following
2
A meta analysis of the studies finds a weighted average correlation of .39 between motivation and growth.
2
section. A discussion of the results and their implications for future research as well as small
business managers concludes the article.
THEORY AND HYPOTHESES
Attitudes and Beliefs
Motivation theories are aimed at explaining why individuals choose to act in a certain direction. One of the major concepts in motivation theories is attitude. An attitude is a valuation
of an object or a concept, i.e. to which extent an object or concept is judged as good or bad.
While personality variables such as Need for Achievement or Locus of Control have been extensively researched in psychological studies of entrepreneurial behavior (cf. Stimpson, Robinson, Waranusuntikule, & Zheng, 1990), attitudes have received relatively little attention
(Robinson, Stimpson, Huefer, & Hunt, 1991).
In psychological language, personality variables are distal, i.e. weak determinants of specific behaviors. Personality theories are intended to measure general individual tendencies
that are stable across a spectrum of different situations (Epstein, 1984). Therefore, general
personality variables are likely to have limited predictive power when applied to any specific
context (Ajzen, 1991) such as firm growth. Attitudes on the other hand are proximal, i.e. more
specific and because of their specificity, they are considered to be important determinants of
behavior. On the other hand, attitudes are less stable over time and across situations, changing
through interactions with the environment (Eagly & Chaiken, 1993).
There has been much controversy over the importance of attitudes in predicting behavior.
However, research has shown that attitudes can predict behavior if certain conditions are met
(Bagozzi & Warshaw, 1992; Kim & Hunter, 1993). Attitudes have been found to be moderately strong predictors of goal directed behavior (r = 0.79 between attitude and behavior when
3
methodological artifacts were removed, cf. Kim & Hunter, 1993). Thus, it would appear that
the concept of attitudes is relevant in the present context.
Since long, there has been an unresolved discussion as to whether attitude is a unidimensional construct consisting of the “amount of affect for or against a psychological object”
(Fishbein, 1967 p. 478 citing Thurstone, 1931), or a three-dimensional construct containing
an affective, a cognitive and a behavioral/intentional component (see Chaiken & Stangor,
1987, for a discussion of these different views).
According to the tripartite view, attitudes can be broken down into three different classes
of evaluative responses (Eagly & Chaiken, 1993): (1) cognitive responses, also known as beliefs, are thoughts that people have about the attitude object (e.g. I believe expanding the business will enhance the possibilities of the business to survive a crises); (2) affective responses
consist of feelings, moods or emotions that people have in relation to the attitude object. (e.g.
I feel happy /anxious about expanding my business), (3) behavioral responses are the overt
actions or intentions exhibited by people in relation to the attitude object (e.g. I turned down
the order, because it would have meant expanding the business).
In this article, we instead adhere to the view heralded by Ajzen and Fishbein (Ajzen,
1988; 1991; Ajzen & Fishbein, 1977; 1980; Fishbein, 1967; Fishbein & Ajzen, 1975) suggesting that the cognitive, affective and behavioral dimensions represent three separate but causally linked constructs termed belief, attitude and intention. The reason why we choose this
approach is that it has been successfully applied to a range of different situations. These concepts are central elements of the Theory of Reasoned Action and the Theory of Planned Behavior, which are validated theories (Locke, 1991) that constitute “the dominant theoretical
framework in the attitude-behavior literature” (Olson & Zana, 1993, p. 131) and “continue to
generate the most research” (Petty, Wegener, & Fabrigar, 1997, p. 640).
4
Embodied in these theories lies the expectancy-value model of attitude (Ajzen, 1991).
This model explicitly deals with the relationship between beliefs and attitudes. It has been
fruitfully applied in several different areas such as decisions concerning restaurants, blood
donation, detergents and automobiles and can be considered a paradigm in itself (Bagozzi,
1984). According to this theory, an attitude reflects the degree to which a person likes or dislikes an object, where the term object can refer to any aspect of the individual’s world. Importantly, the theory is developed to predict specific attitudes in specific contexts (Ajzen &
Fishbein, 1980). In our case we are interested in the specific behavior of expanding a firm.
We therefore focus solely on the attitude toward this specific behavior. The individual’s attitude toward a behavior can be predicted by the salient beliefs that he or she holds about performing the behavior. It should be noted that the beliefs must correspond to the specific behavior concerning action, target, context and time in order to permit understanding and prediction of the attitude (Ajzen & Fishbein, 1980). That is, in order to predict the attitudes of
expanding the business a certain magnitude (e.g. doubling the size) we should explicitly assess the beliefs of the consequences of performing that particular behavior (i.e. the expected
consequences of doubling the size).
Beliefs associate an object with certain attributes. In the case of behavioral beliefs, the
object is the behavior of interest and the associated attributes are the expected consequences
of that behavior. Consequences can be good or bad and of varying magnitude. For instance,
an individual may believe that expanding the business 100% may lead to a minor increase of
profitability but a major decrease in job satisfaction. The strength of an individual’s belief is
captured by his or her subjective probability that performing a behavior will lead to a certain
outcome. Returning to the example above, the individual may be very certain that growth will
lead to improved performance (although to a small extent) but less certain that job satisfaction
will decrease (although if it does, the decrease will be substantial). According to the original
5
formulation of the expectancy-value model, a person’s attitude toward a particular behavior
can be predicted by multiplying his or her evaluation of each behavior’s expected consequences by the strength of the belief that performing the behavior will lead to that consequence and then summing the product across all beliefs (Ajzen & Fishbein, 1980).
However, empirical tests of this model has revealed that the interaction of evaluation of
expected consequences on the one hand and the strength of the belief on the other fails to give
significant results (Bagozzi, 1984), leading to a questioning the multiplicative combination of
beliefs and evaluations (Valiquette, Valios, Desharnais, & Godin, 1988). More specifically,
the strength of the belief dimension has failed to contribute to the prediction of attitude (Pieters, 1988). Tentative analyses of our data supported these findings (Anonymous, 1987).
Therefore, we focus solely on expected consequences in our analyses.
Moreover, in the original formulation of the expectancy-value model, salient beliefs are
not weighted for their relative importance in determining the attitude (e.g. Ajzen & Fishbein,
1980). This approach looses the idiosyncratic dimensionality and uniqueness of the micro beliefs that comprise the attitude (Bagozzi, 1984). Bagozzi (1985) argues that there are in fact
several alternative ways of modeling the relationship between beliefs and attitude, some of
which estimate the relative importance of individual beliefs. Two of these do not assume a
multiplicative combination of beliefs and evaluations. If multicollinearity is severe, latent
variable modeling with higher- and lower-order latent variables is necessary. If not, as an alternative the attitude can be regressed over the individual’s evaluation of expected consequences as assessed along a positive – negative dimension. We have chosen the latter alternative, because an empirical test shows that multicollinearity is not a problem (cf. footnote 4).
6
Identifying Relevant Beliefs and Hypotheses
As suggested by the expectancy-value theory of attitudes, we regard expected consequences of growth as evaluations of the behavior’s consequences, or beliefs. Based on this
logic, we argue that a plausible reason why some small business managers refrain from growing their firms is that they expect some consequences of growth to be negative. If a small
business manager believes, for instance, that increased size may jeopardize the firm’s ability
to maintain the quality of its products or services, such anticipated negative consequences of
growth should lead to a negative attitude toward expanding the business. On the other hand, if
the small business manager sees expansion as a means to attain personal goals, e.g. the possibility of earning more money, such expectations of positive consequences of growth should
positively influence his or her growth attitude. In other words, positive expectations of growth
are likely to enhance the motivation of a small business manager to expand his or her firm
whereas negative expectations of growth are likely to reduce the growth motivation.
In order to establish more precisely small business managers’ salient beliefs about
growth, a literature review of comprehensive classical works on small business management
and motivation was conducted (Bolton, 1971; Boswell, 1972; Deeks, 1976; Smith, 1967;
Stanworth & Curran, 1973). This literature review identified eight key areas that are important for small business managers and at the same time likely to be affected (positively or
negatively) by growth. These key areas and their sources in the literature are exhibited in Table 1. We now detail the arguments concerning each of these areas and formulate the associated hypotheses.
------------------------------------Insert Table 1 about here
-------------------------------------7
As regards workload, the reasoning is that some managers who are – and intend to stay –
involved in all aspects of their business expect growth to increase their workload. Other managers foresee hiring and delegating and hence reduce their personal load. Thus:
Hypothesis 1: The expectation that increased size would lead to a reduction (increase) of
the owner-manager’s workload is associated with a more positive (negative) attitude toward growth
Likewise, regarding work tasks some owner-managers define themselves primarily as
craftsmen and resist the transition to full-time management that expansion may (be perceived
to) necessitate. Other managers may be looking forward to letting go of some hands-on work
they cannot yet afford to delegate. Thus:
Hypothesis 2: The expectation that increased size would allow the owner-manager to
spend more (less) time on favored work tasks is associated with a more positive (negative) attitude toward growth
Concerning employee well-being it has been observed that some managers fear that
growth would force formalization and destroy the family-like atmosphere of the small organization, where every member is indispensable. At the same time it has been noted that nongrowing small organizations offer very limited career opportunities for their employees.
Again, then, growth may be associated with positive as well as negative expectations. Thus,
Hypothesis 3: The expectation that increased size would make employees enjoy work
more (less) is associated with a more positive (negative) attitude toward growth.
It may seem self-evident at first glance that growth should improve the owner-managers
personal income. However, the literature suggests that this is not universally believed to be
the case. For example, the manager may hold that the environment leaves little room for profitable growth. Thus,
8
Hypothesis 4: The expectation that increased size would increase (decrease) the ownermanager’s income and other disposable economic benefits is associated with a more
positive (negative) attitude toward growth
Owner-managers’ need for autonomy is heavily stressed in the literature. The relationship
between autonomy and growth appears to be complex and possibly involves more than one
dimension, which is why we include independence and control as separate dimensions. On
the one hand, a small firm is weak in relation to its environment, not leaving much real independence for the owner-manager. On the other hand, taking additional loans, sharing equity
or accepting the dictates of a large, dominating customer may be precisely what is required in
order to achieve growth – at the expense of some independence. Similarly, some managers
may perceive that increased size would force them away from contact with the day-to-day realities of the firm, reducing their ability to be on top of everything that happens or could happen to it. Other managers may think that the more managerial role in an enlarged firm would
reduce myopia and give more time for strategic issues, and thereby increase their control of
the firm’s long term destiny. Thus,
Hypothesis 5: The expectation that increased size would enhance (reduce) the ownermanager’s ability to survey and control operations is associated with a more positive
(negative) attitude toward growth.
Hypothesis 6: The expectation that increased size would increase (decrease) the firm’s
independence in relation to customers, suppliers and lenders is associated with a more
positive (negative) attitude toward growth.
Also for the last two dimensions positive as well as negative beliefs can be found in the
literature. Some managers may associate increased size with a reduction in flexibility, which
would reduce the firm’s crisis survival ability. Others may associate size with the financial
muscles that could cushion a situation of that kind. Thus,
9
Hypothesis 7: The expectation that increased size would make it easier (more difficult)
for the firm to survive a severe crisis is associated with a more positive (negative) attitude toward growth.
As regard quality some may fear that their own detachment from direct control is a risk,
whereas others would see the possibility to introduce formal and systematic quality control of
a kind that the very small firm cannot afford. Thus,
Hypothesis 8: The expectation that increased size would make it easier (more difficult)
for the firm to maintain the quality of products and services is associated with a more
positive (negative) attitude toward growth.
Although we have presented an extensive list of expected consequences of growth, the
question arises as to whether this list is exhaustive or if small business managers in fact expect additional consequences that affect their growth attitude. Previous expectancy-value research suggests that the domain of salient beliefs could be generated through en open-ended
elicitation procedure (Ajzen & Fishbein, 1980; Bagozzi, 1984). In order to identify the beliefs
that are salient in a population, a representative sample should be selected for the procedure
(Ajzen & Fishbein, 1980; Bagozzi, 1984). Therefore, previous to the first survey, unstructured
interviews were conducted with eleven small business managers by one of the authors. The
sample was selected to represent as broad a spectrum as possible concerning types of small
firms and small firm owner-managers. The interviews first covered general aspects of the
business and then issues pertaining to growth. Direct questions about expected consequences
of growth were only asked at the very end of the interview and only if they had not previously
been spontaneously mentioned by the respondent. These interviews confirmed that the eight
dimensions identified in the literature in fact reflected important expected negative and/or
positive consequences of growth. Further, the managers did not report any other important
consequences of growth neither spontaneously nor when prompted.
10
It should be noted that these expected consequences of growth may or may not be wellfounded. For example, a belief that growth reduces crisis survival ability can be questioned on
the basis that research tends to show positive relationships between growth or size on the one
hand, and survival on the other (Kirchhoff, 1994). In other words, it is possible that small
business managers expect consequences that in fact will not materialize, should their business
expand. However, in order to further validate that we have identified relevant expected consequences of growth, we turned to the literature that explicitly deals with the actual consequences of growth. Flamholtz (1986) recognizes ten growing pains, i.e. possible negative consequences of growth. While his growing pains are conceptualized in a way that is not directly
transferable to our context, it is clear that he identifies similar consequences. Flamholtz identifies possible changes to workload, work tasks, employee well-being, control and quality. In
their study, Hambrick & Crozier (1985) found similar potential negative consequences of
growth, but also noted that the very survival of the firm may be threatened. All in all, these
studies support that six of the eight consequences we have identified may in fact materialize
as a company expands. A reason why these authors do not address changes to personal income and independence in relation to lenders, customers and suppliers may be that they
mainly focus on the negative consequences of growth whereas they may find positive effects
of growth on personal income and independence.
Finally, Ajzen & Fishbein (1980) hold that individuals can only attend to a limited number of beliefs about behavioral outcomes at any given moment and suggest that five to nine
would be an appropriate number. Taken together, the above makes us confident that we have
identified the relevant range of generally important beliefs about the consequences of growth.
This gives us the research model depicted in Figure 1.
------------------------------------Insert Figure 1 about here
11
--------------------------------------
METHOD
Basic Research Design
This study uses a replication design. As noted by others, small business growth studies
are largely incompatible because similar phenomena are studied in isolated research projects
using different concepts, models, measures and methods (Davidsson & Wiklund, 2000; Delmar, 1997; Storey, 1994). As a consequence, our knowledge about small firm growth is still
quite incomplete and incoherent. This lack of replication is shared with the broader domain of
business studies (Hubbard, Vetter, & Little, 1998). We agree with these authors that “The
goal of science is empirical generalizations or knowledge development. Systematically conducted replications with extensions facilitate this goal.” (Hubbard et al., 1998, Abstract, see
also Lindsay & Ehrenberg, 1993). The present study attempts to contribute to cumulative
knowledge by means of replication with extension. Three separate studies addressing the
same issues with the same measurement instrument in similar samples were carried out during
a ten-year period. These three studies are jointly analyzed in this article.
According to Hubbard et al. (1998), replication is a substantial duplication of previous
empirical research in order to increase the internal validity of the research design. The aim of
replication is typically to determine if the findings from the original study are reproducible. A
replication with extension goes somewhat further and aims at increasing generalizability of
research findings by modifying the initial study in some way. If the results reproduce in the
modified studies, this would indicate a higher generality of the findings, i.e. they extend beyond the specific context of any single study. In the present case, data were collected from
three different samples during a ten-year period utilizing the same measurement instrument.
12
The data collections coincided with different phases of the business cycle, and each study
used somewhat different sample frames. In this sense, the present research could be regarded
replication with extension. This serves the much sought for purpose of generalizing findings
beyond what is possible from a solitary study.
However, the fact that the data from all three studies are analyzed simultaneously allows
us to perform additional analyses. Thanks to the large number of cases provided by the three
samples combined, it is possible to split the sample into different sub-samples and conduct
separate analyses within each of these. It is also possible to analyze all cases in one analysis.
Such additional analyses facilitate additional validation of the findings (Campbell & Fiske,
1959).
Taken together, the multiple analyses on different samples and sub-samples conducted
here reduce the risk of Type I errors (erroneous rejections of the null hypothesis). This risk
may be substantial in conventional singular analyses, solely relying on the p < 0.05 criterion
(Cohen, 1994; Hubbard et al., 1998). The separate analyses of multiple samples also reduce
the risk of Type II errors, i.e., failure to reject the null hypothesis when it is false (Cohen &
Cohen, 1983).
Sample Characteristics
Over a ten-year period, three independent telephone interview studies were conducted.
The two initial studies in 1986 and 1994 were stratified over the Swedish equivalent of ISIC
codes. Independent firms from specific manufacturing, service and retail industries were selected. The samples were also stratified over the standard Swedish size brackets 1-4, 5-9, 1019, and 20-49 employees. In addition to this, the 1996 sample was stratified over the firms’
previous growth-rate so that high-growth firms were over-represented in the sample for all
size brackets and industries. The samples had 440, 400, and 630 respondents respectively, totaling 1,470 respondents, with corresponding response rates of 83%, 55%, and 75%. The data
13
were collected from the managing director, who in most cases is also the majority owner. The
managing director was explicitly asked for at the beginning of the interview.
At the time of the interviews, 40 firms had outgrown the largest size bracket and were
omitted. The smallest size bracket was left out of the analyses since only one of the studies
included firms of this size. This reduced the number of cases to a total of 1,248. The actual
number of cases used in the analyses is somewhat lower due to internal non-responses. There
are some statistically significant differences between the three samples (see Table 2). The
1986 study reports somewhat younger respondents, smaller firms, and a smaller share of
manufacturing firms compared to the two latter studies. The firms of the 1994 sample are on
average the youngest. However, for the purpose of this article, the differences are unproblematic. Analyses are mainly performed on different sub-samples where these differences are
controlled; or else these variables are added as control variables.
------------------------------------Insert Table 2 about here
-------------------------------------Variables and Measures
The dependent variable. To measure attitude toward growth, respondents were asked
whether a 100% increase in the number of employees in five years time would be mainly
negative or mainly positive. Respondents who gave an answer in either direction were then
asked to specify whether they perceived such an outcome as “somewhat”, “rather strongly” or
“very strongly” positive/negative. A seven-point scale ranging from very negative to very
positive was thus used to measure this variable. This type of single item bipolar 7-point
good/bad scale has been the most often advocated and used variable to measure attitude toward behavior (Ajzen & Fishbein, 1980; Fishbein & Ajzen, 1975). It is suggested to be the
most stringent and valid variable, at least in situations where the distinction pleas14
ant/unpleasant is inappropriate, as in our case (Bagozzi, 1984). The explication of a specific
amount of growth over a specific time span in the question is important, as the individual’s
attitude toward growth may vary depending on both amount and time. Individuals may exhibit
more positive or negative attitudes toward larger or smaller amounts of growth as well as
faster or slower growth rate.
Three other possible measures of the dependent variable were also available: a) whether a
25% increase in the number of employees in five years time would be mainly negative or
mainly positive, b) the intended ideal size five years ahead regarding sales as well as c) regarding number of employees. While it would have been possible to utilize either of these alternative measures of the dependent variable or to compute a global growth motivation index,
we prefer to rely on the question concerned with a 100% increase in the number of employees. The reason is that this makes the dependent variable and the independent variables symmetric. That is, they are all anchored in the doubling of the number of employees. This sort of
symmetry in independent and dependent variables is deemed important by the expectancyvalue theory (e.g. Ajzen & Fishbein, 1980)3.
The independent variables. The eight belief variables derived from the literature review
are displayed in Table 3. In order to establish validity and reliability, the format of the questions was modeled after the examples given by Ajzen & Fishbein (1980 p. 66). More specifically, respondents were asked how a doubling of the number of employees, regardless of
whether this is deemed desirable or possible, would be likely to affect each of the eight areas.
3
For the purpose of testing the properties of our measure, an index was created. The “intended ideal size
five years ahead” responses and present size figures were used to calculate intended growth rates of both sales
and employees and converted to two seven-point scales. The two items from the 25% and the 100% scales were
summed with these two items to form a global growth intention index. The Cronbach’s Alpha value of the index
was 0.72 and corrected item-total correlations ranged from 0.47 to 0.55 indicating that the index has acceptable
reliability (Nunnally, 1967) and that all items share sufficient variance with the index (Nunnally & Bernstein,
1994). This index was also successfully used in predicting actual growth outcomes in another study (Wiklund &
Shepherd, 2003). This suggests that our measure is (1) sufficiently reliable and (2) predictively valid (Nunnally
15
A five-point scale, ranging from “much more negative” to “much more positive”, was used
for measurement (the specific words describing the positive/negative dimension varied across
questions, cf. Table 3).
The explicit statement “doubling of the number of employees” was chosen in order to ensure that the beliefs referred to the same behavior as the attitude across variables and respondents. In other words, the context of the belief variables reflected the context of the attitude
variable as closely as possible, as recommended in the literature (cf. above and Ajzen & Fishbein, 1980, p. 64).
------------------------------------Insert Table 3 about here
-------------------------------------Control variables. Five variables were used as contingency variables to subdivide the
three samples into sub-samples and as independent variables in multiple regression analysis.
Firm size, firm age and industry have been shown to affect growth in previous research (Aldrich & Auster, 1990; Audretsch, 1995; Barkham, 1994; Carroll & Hannan, 2000; Davis &
Henreksson, 1999; Dunne & Hughes, 1996; Kirchoff, 1994). The sex and age of the small
business manager have also been associated with differences in growth (Brush, 1992; Davidsson, 1989a; Deaux & Lafrance, 1998; Delmar, 2000). These variables may influence growth
directly as assumed in most research, but it is also possible that they have an indirect influence via the attitude toward growth of the entrepreneur. Thus, it is valuable to investigate
their influence on attitude toward growth.
& Bernstein, 1994). We therefore feel confident in relying on this single item measure for our dependent variable.
16
Firm size was measured as number of full time equivalents. To determine the industry, respondents were asked if the firm’s main line of business was manufacturing, service or retail.
Analyses suggest that the Swedish equivalents of ISIC codes are not always updated or relevant. Therefore, we instead relied on the respondents’ self-report of main activity as a better
indictor of their main industry. Respondents were asked if they knew what year the firm was
founded, which was used to calculate the age of the firm. Finally, the respondents’ birth year
was used for calculating their age whereas sex on most instances was evident from the interview.
All control variables were recoded into dummy variables. Firms were classified into the
standard size brackets 5-9, 10-19, and 20-49 employees. Ten years was the cut-off for being a
‘young’ or ‘old’ firm, whereas the mean of 47 years of age was used to discriminate between
young and old entrepreneurs.
To make comparison across the three studies more valid, the wording and relative positioning of the questions were the same in all three studies.
Analyses
Multiple linear regression was carried out in to test the hypotheses. Two different
analysis designs were applied for the control variables. In the first step, the control variables
were entered as independent variables to the regression equation, alongside the expectancy
variables.
In the second step, they were used to divide the sample, since it is possible that the
pattern of relationships differ between industries, size brackets, sex and age groups.
In line with the replication approach, the hypotheses are tested by examining the extent to
which results are replicated across the different analyses, rather than relying solely on conventional tests of significance (p < 0.05). If substantial and statistically significant effects recur across the analyses, this is taken as evidence that the data support the hypothesis. Con17
versely, repeatedly small and non-significant effects led to the rejection of the hypothesis.
When results are mixed, judgement is used to determine if the hypotheses are supported or
not. In other words, judgement rather than objective criteria is used to support or reject hypotheses. This is consistent with the research design and not problematic “First, do not look
for a magic alternative to NHST [null hypothesis significance testing], some other objective
mechanical ritual to replace it. It doesn’t exist. … we must finally rely, as have the older sciences, on replication” (Cohen, 1994, pp. 1001-1002).
The skewness and kurtosis statistics of the dependent variable fall well within the
boundaries for normality (Robinson & Hofer, 1997; Shapiro & Wilk, 1965). Thus, parametric
tests of significance are applicable. Since positive expectations are hypothesized to increase
growth motivation and vice versa, directional, single-tailed tests of significance are applied.
Forced entry of independent variables and list-wise deletion of missing data are used.
RESULTS
Table 4 shows the correlation matrix and summary statistics for the variables used in our
analyses (with the exclusion of the nominal variables sex and industry). All expectancy variables have moderately positive correlations, ranging from .14 to .41. The model we have chosen, i.e., regressing attitude across expected consequences, could be associated with multicollinearity (Bagozzi, 1985). The moderate correlations suggest that this is not the case. However, to ensure that multicollinearity was not an issue, multicollinearity diagnoses were applied to all regression analyses4. The strongest correlation with attitude toward growth can be
noted for employee well-being (r = .41). The correlation between firm age and expected
workload is moderately negative (r = -.17). The other correlations are weaker.
-------------------------------------
18
Insert Table 4 about here
-------------------------------------The hypotheses were tested by first analyzing the three samples combined, which is
displayed in Table 5. The second column of the table shows the results excluding the control
variables. The adjusted explained variance of .24 indicates that expected consequences have
an influence on attitude toward growth and that the proposed model is relevant. Statistically
significant effects in the hypothesized direction are obtained for all expected consequences
but work tasks. According to the conventional criterion (p < .05), this supports H1 and H3 to
H8. However, the magnitude of the coefficients for variables other than employee well-being
are small in magnitude. The large number of cases makes small effects statistically significant. When the control variables are added to the equation, shown in column three, they alter
the equation only to a small extent. Albeit statistically significant on three instances, their
standardized regression coefficients are generally low and the explained variance is not increased. Comparing the two analyses, it appears that explanatory variables are not dramatically different in different industries, size brackets, age groups, or between men and women.
Hence, the results appear to have a high degree of generality.
------------------------------------Insert Table 5 about here
-------------------------------------As mentioned earlier, data were collected from three different samples during a ten-year
period. There are reasons to analyze the samples separately and compare the results. First, although statistically significant, effect sizes were generally small in the full sample. A comparison of results across samples makes it possible to check the stability of the results. If the
4
. Due to space limitations, individual figures are not reported. An examination of the variance inflation
factor (VIF) suggests that there was no incidence of multicollinearity. Individual figures range from 1.08 to
19
results are the same for all three samples, conclusions will be more valid. Second, data were
collected during different stages of the business cycle, which may affect the beliefs and attitudes of the respondents and their effects. Different explanatory variables may be important
during different phases of the business cycle. A pure trend effect over time is also conceivable.
The results of the analyses of the three different samples are displayed in Table 6. Employee well-being is by far the most important explanatory variable in all samples, whereas
the magnitude and rank order of all other explanatory variables vary. The joint probability
measures illustrate that obtaining positive coefficients this large for any variable in all three
samples is highly unlikely if there were no effects in the population. In all, the relationships
are relatively stable over-all, but not in detail. No clear cyclical or trend pattern emerges over
this time period.
------------------------------------Insert Table 6 about here
-------------------------------------To further validate the findings, we assessed the extent to which results were stable across
different contexts. Therefore, the samples from the three studies were combined and the control variables were used to subdivide the sample. This gives us a total of twelve regression
analyses in this stage. The results from these regressions are displayed in Table 7. The adjusted explained variance ranges from .16 to .28, indicating that expected consequences have
an influence on attitude toward growth in all regressions. The results reveal that noneconomic concerns are very important determinants of attitude toward growth. Personal income is not the most important variable in any regression, suggesting that money is not the
most important motivator. A remarkably consistent result across the regressions is that em-
1.45, which is well below critical values (cf. Hair, Anderson, Tatham, & Black, 1998).
20
ployee well-being is the most important explanatory variable. This holds for 11 out of the 12
regressions, reinforcing the findings from the previous analyses. The exception is found
among female entrepreneurs where independence comes out the strongest. The regression for
the female sub-sample, however, is somewhat problematic, since it only contains 61 cases and
should be interpreted more restrictively. Due to the small sample size, very large effects are
needed in order to achieve statistically significant results even at the .05-level. As a comparison, while a regression coefficient of .06 is statistically significant among males, a .19 regression coefficient is not among females.
Workload is relatively unimportant in all sub-samples as is work-tasks, with the exception
of young entrepreneurs and the smallest size bracket. The pattern concerning independence is
the opposite, it has a statistically significant effect in all regressions except in the smallest size
bracket.
Statistically significant standardized regression coefficients for the remaining explanatory
variables have the same signs across all 12 analyses, which indicates that the regressions are
stable. However, their rank order and magnitude vary depending on how the sample is divided. Interpretation of these coefficients should be restrictive. Considering the moderate explained variance and the magnitude of the employee well-being coefficient in all regressions,
relatively little is explained by other variables in the regressions.
------------------------------------Insert Table 7 about here
-------------------------------------No less than 17 regression analyses have been performed to test the hypotheses. A summary of the outcomes of these tests is presented in Table 8. This table illustrates that the variables employee well-being, independence, personal income, control and survival of crises
generally receive the largest, and always positive standardized regression coefficients. These
21
variables are also statistically significant on most instances. Thus, it is relatively safe to conclude that the hypotheses concerning the influence of employee well-being (H3), independence (H6), personal income (H4), control (H5) and survival of crises (H7) on attitude toward
growth are supported by the data. Regarding the three remaining hypotheses, results are more
mixed and they do not get equally consistent support by the data. Therefore, even if the bulk
of the evidence is in favor of the hypotheses, it must be concluded that for most of the respondents expected consequences of growth concerning workload (H1), work tasks (H2) and
quality (H8) do not have an important influence on attitude toward growth.
------------------------------------Insert Table 8 about here
--------------------------------------
DISCUSSION
Explaining Growth Attitude
In this article, we set out to examine how small business managers’ overall attitude toward growth was influenced by the consequences they expected from growth. In doing that,
we used data from three separate survey studies employing the same measuring instruments.
This allowed us to come up with many useful comparisons. Some results recur very consistently across sub-analyses and can therefore be accepted even if the associated probability of
the coefficient is not very low in every analysis. Other results, while ‘statistically significant’
in one analysis, may be disregarded because the result appears in isolation. The general approach--to repeat the same measurement in several separate surveys--is something we would
highly recommend to other researchers. Results from multiple samples are a much better basis
for determining one’s degree of confidence, than is significance testing alone.
22
On average, our regression models could explain close to 25% of the variation in attitude
toward growth in our different sub-groups. This shows that there are substantial, general relationships between expected consequences of growth and attitude toward growth. In other
words, small business managers’ feelings about whether the growth of their business is good
or bad can to a reasonable extent be explained on the basis of the consequences that they expect from growth.
Nonetheless, over three quarters of the variance is left unexplained by our models, and
the reasons for this deserve some discussion. A first possibility is, of course, that important
explanatory variables were omitted. Perhaps other expected consequences of growth are important and therefore should have been included. Our selection of explanatory variables was
based on a thorough literature review as well as elicited in an open-ended procedure. Consequently, we regard it highly unlikely that any additional more important variables of this kind
are to be found. The control variables we have used are also the most important ones in previous research on small firm growth. Therefore, the ‘add variables’ route is unlikely to raise explained variance by more than a few percentage points. Further, our results are similar to what
have been reported in previous studies (explained variance of 10% to 36% would be typical
according to Ajzen, 1991).
The most important reason for the modest explanatory power is instead, arguably, the fact
that regression coefficients represent average effects. According to expectancy-value theory,
there is reason to believe that the true effect for each individual differs from this average
(Ajzen & Fishbein, 1980; Bagozzi, 1985). For some managers quality is a great concern,
whereas for others their own workload is the top-of-the-mind issue. This fact, i.e., that the coefficients represent average effects is a general problem in this type of research and probably
the major reason why explanatory power rarely reaches much higher values than ours even
when seemingly all relevant variables have been included. The second major reason is that
23
measurement error is substantial, because the questions do not have exactly the same meaning
to each respondent and because people differ in their response styles. Thus, very strong relationships between the independent and dependent variables should perhaps not be expected.
We regard our modest explanatory power as a result of these general problems, rather than the
omission of important explanatory variables.
Relative Importance of Different Beliefs
Turning to a more detailed assessment of our results, a central finding is that expectation
of financial gain is not the outstanding determinant of attitude toward growth. This is clearly
contrary to economic theory, but also to normative management theories where the motivation to grow is taken for granted, based on financial outcome being the primary concern of the
manager. Our findings suggest that other expected outcomes of growth that are largely noneconomic in nature also influence attitude toward growth. This includes, e.g. beliefs concerning the effect of growth on the managers’ ability to keep full control over the operations of the
firm, the firm’s degree of independence in relation to external stakeholders, and its ability to
survive crises. The effects are generally not very strong. However, while not always statistically significant according to conventional criteria, they appear very consistently with the
same sign across samples, industries, size classes and age groups. What this means is probably that the effects are real, but they are small because each type of expected outcome has a
substantial effect on attitude toward growth only for some managers, whereas it is relatively
uninfluential for others. Hence the modest average effect represented by the regression coefficients. This illustrates the strength of our combining data from three studies using the same
instruments. In a single and perhaps smaller study, each and every one of these effects may
have been disregarded as ‘not statistically significant, therefore non-existent’—a very common practice among social scientists. The same would probably have happened had three different studies used different instruments to assess the same theoretical relationships. With our
24
‘same instrument, multiple samples’ approach, we can conclude with confidence that these
expectations do have effects on attitude toward growth.
Our most important finding is that expectations concerning the effect of growth on employee well-being is the single most important determinant of over-all attitude toward growth.
This result stands out with impressive consistency across samples, industries, size classes and
age groups. The important question is, of course, exactly what this means. The very translation of the Swedish original is tricky. While no fully satisfactory translation to English presents itself, the reader might find it informative that the Swedish wording is likely to evoke
associations to camaraderie, comfort, atmosphere, and job satisfaction.
Several interpretations are possible. A critical mind would perhaps like to dismiss the result as not really showing that small business managers’ great concern for their employees
affects their attitude toward growth. Rather, one might argue, is this variable picked as their
scapegoat for less socially desirable reasons to refrain from growing their firms larger. However, additional analyses performed suggest that the variable works both ways. That is, some
managers believe that growth will improve employee well-being, and this enhances their attitude toward growth. Another reason for not dismissing the result in this way is that there are
other expected outcomes, most notably product/service quality, that would be an equally logical candidate for a social desirability effect.
However, we would agree that it is not unlikely that the managers also have their own
well-being in mind when answering the question. A sound interpretation is probably that the
result reflects a real concern for the ”soft” qualities associated with small scale, and that this
concern is justifiable. There is research to suggest that on issues like comradeship, involvement and job satisfaction, employees and people in general think highly of small firms (Curran, Kitching, Abbott, & Mills, 1993; Davidsson, 1993). Even more impressive evidence for
the ”soft” advantages of small scale is presented in the classical study by Barker & Gump
25
(1964; cf. also their extensive references to other studies). Therefore, the small business manager may have a very real reason to be concerned about the atmosphere of the small firm
when faced with expansion opportunities. The generality of our finding in the sub-analyses
suggests that this concern is a source of a recurrent goal conflict for many small business
managers.
Limitations and Future Research
The issue of work atmosphere and employee well-being is worthy of further research efforts. One aspect of this would be to assess whether the concern for employee well-being and
its effect on attitude toward growth is a cultural peculiarity of Sweden (or perhaps the Scandinavian countries) or if it is more universal. While both outcomes of such an assessment are
conceivable, the review of classical works as well as more recent research suggests that a very
high concern for employees is not unheard of in other cultures (cf. Kazumi, Sato, Nishikiori,
Kurose, & Sato, 1996). Future research should also try to capture in more detail what the
”concern for employee well-being” really encompasses; whether it affects real growth and not
only attitude toward growth; if managers who have successfully led their companies through a
growth phase also felt such concerns before the expansion: whether their expectations were
accurate; and what they might have done to counteract the possible negative effects of growth
on employee well-being.
Our study has been about attitude toward growth, not actual growth. Whether attitude toward growth – as measured here – has an influence on actual growth or not is an empirical
question that remains to be answered. In accordance with previous studies (cf. above), we
would hypothesize that such is the case. In order to find out, longitudinal research is needed
where attitude toward growth is measured at one point of time and actual growth outcomes
are measured later.
26
A potential limitation to the results presented here regards common method variance.
While common method variance problems in survey research seem to have been overstated
(Crampton & Wagner, 1994), they can not be neglected (Lindell & Whitney, 2001). The favoring of telephone interviews over mail questionnaires probably reduces common variance,
but does not eliminate the risk that reported relationships may be somewhat inflated.
CONCLUSIONS AND IMPLICATIONS
Beliefs play an important role in understanding why people act the way they do. According to expectancy-value theory, behavior is a function of beliefs relevant to the behavior. Salient beliefs are considered to be the determinants of a person’s intentions and actions (Ajzen,
1991). In our research, small business managers’ beliefs about the consequences of growth
have provided insights into the reasons why they think that expanding their business is a good
or a bad thing. One interesting finding is that non-economic concerns are more important than
the possibility of personal economic gain or loss. Of particular importance is the well-being of
the employees, which probably encompasses concerns for the work atmosphere of the small
firm in general. Managers who believe that the work atmosphere will improve due to growth
tend to have a positive attitude toward growth. Conversely, those who expect that growth will
deteriorate the work atmosphere tend to have a negative attitude toward growth.
To some extent, these expectations are probably well-founded. The work atmosphere will
probably be affected by growth. On the other hand, it is possible for the small business manager to influence the work atmosphere in order to avoid possible negative consequences. Active measures for introducing newcomers and building a sound company culture can be taken
to this effect (cf. Hambrick & Crozier, 1985). If managed correctly, growth can be associated
with new challenges and development opportunities for staff rather than loss of direction or
alienation.
27
Just as other beliefs, beliefs about consequences of growth can be influenced by the persuasive argumentation of others (Chaiken & Stangor, 1987). If relevant information about the
positive consequences of growth – and methods to circumvent negative effects - were made
available to small business managers, this could lead to a more positive attitude toward
growth. Information about the positive effects on work atmosphere and ways of mitigating
potential negative consequences may affect growth motivation more than would prospects of
increased personal income.
REFERENCES
Ajzen, I. (1988). Attitudes, Personality, and Behavior. Chicago, IL: Dorsey Press.
Ajzen, I. (1991). The theory of planned behavior. Organizational Behavior and Human Decision Processes, 50, 179-211.
Ajzen, I., & Fishbein, M. (1977). Attitude-behavior relations: A theoretical analysis and review of empirical research. Psychological Bulletin, 84, 888-918.
Ajzen, I., & Fishbein, M. (1980). Understanding Attitudes and Predicting Behavior. Englewood Cliffs, NJ: Prentice-Hall.
Aldrich, H., & Auster, E. R. (1990). Even dwarfs started small: Liabilities of age and size and
their strategic implications. In B. M. Staw & L. L. Cummings (Eds.), The Evolution and
Adaptation of Organizations (pp. 33-66). Greenwich, Connecticut: Jai Press Inc.
Audretsch, D. B. (1995). Innovation, growth and survival. International Journal of Industrial
Organization, 13, 441-457.
Bagozzi, R. P. (1984). Expectancy-value attitude models: An analysis of critical measurement
issues. International Journal of Research in Marketing, 1, 295-310.
Bagozzi, R. P. (1985). Expectancy-value attitude models: An analysis of critical theoretical
issues. International Journal of Research in Marketing, 2, 43-60.
28
Bagozzi, R. P., & Warshaw, P. R. (1992). An examination of the etiology of the attitudebehavior relation for goal-directed behaviors. Multivariate Behavioral Research, 27(4),
601-634.
Barker, R. G., & Gump, P. V. (1964). Big School, Small School. (1 ed.). Stanford, CA: Stanford University Press.
Barkham, R. J. (1994). Entrepreneurial characteristics and the size of the new firm: A model
and an econometric test. Small Business Economics, 6, 117-125.
Bolton, J. E. (1971). Small Firms. Report of the Committee of Inquiry on Small Firms. London: Her Majesty's Stationary Office.
Brush, C. G. (1992). Research on women business owners: Past trends, a new perspective and
future directions. Entrepreneurship Theory & Practice, 16(4), 5-30.
Campbell, D. T., & Fiske, W. (1959). Convergent and discriminant validation by the multitrait - multimethod matrix. Psychological Bulletin, 56, 81-105.
Carroll, G., & Hannan, M. T. (2000). The Demography of Corporations and Industries.
Princeton: Princeton University Press.
Chaiken, S., & Stangor, C. (1987). Attitudes and attitude change. Annual Review of Psychology, 38, 575-630.
Cohen, J. (1994). The earth is round (p<.05). American Psychologist, 47(12), 997-1003.
Cohen, J., & Cohen, P. (1983). Applied Multiple Regression/Correlation Analysis for the Behavioral Sciences. (2 ed.). Hillsdale, NJ: Lawrence Erlbaum Associates.
Crampton, S. M. & Wagner, J.A., III. (1994) Percept-percept inflation in microorganizational
research: An investigation of prevalence and effect. Journal of Applied Psychology, 79(1)
67-76.
29
Curran, J., Kitching, J., Abbott, B., & Mills, V. (1993). Employment and employment relations in the small service sector enterprise - a report . Kingston: ESRC Centre for Research on Small Service Sector Enterprises, Kingston Business School.
Davidsson, P. (1989a). Continued Entrepreneurship and Small Firm Growth. (Doctoral Dissertation) Stockholm: Stockholm School of Economics.
Davidsson, P. (1989b). Entrepreneurship -- and after? A study of growth willingness in small
firms. Journal of Business Venturing, 4, 211-226.
Davidsson, P. (1993). Folket om företagandet (People on enterprise) (FE-publikationer 143).
Umeå: Handelshögskolan i Umeå.
Davidsson, P., Lindmark, L., & Olofsson, C. (1994). Dynamiken i svenskt näringsliv
(Business Dynamics in Sweden). Lund, Sweden: Studentlitteratur.
Davidsson, P., Lindmark, L., & Olofsson, C. (1996). Näringslivsdynamik under 90-talet
(Business Dynamics in the 90s). Stockholm: Nutek.
Davidsson, P., & Wiklund, J. (2000). Conceptual and empirical challenges in the study of
firm growth. In D. Sexton & H. Landström (Eds.), The Blackwell Handbook of Entrepreneurship (pp. 26-44). Oxford, MA: Blackwell (Chapter 3 in the current volume).
Davis, S. J., & Henreksson, M. (1999). Explaining national differences in the size and industry distribution of employment. Small Business Economics, 12, 59-83.
Deaux, K., & Lafrance, M. (1998). Gender. In D. T. Gilbert & S. T. Fiske & G. Lindzey
(Eds.), The Handbook of Social Psychology (Vol. 1, pp. 788-827). Boston: McGraw Hill.
Deeks, J. (1976). The Small Firm Owner-Manager: Entrepreneurial Behavior and Management Practice. New York: Praeger.
Delmar, F. (1996). Entrepreneurial Behavior and Business Performance. (Doctoral Dissertation) Stockholm: Stockholm School of Economics.
30
Delmar, F. (1997). Measuring growth: Methodological considerations and empirical results.
In R. Donckels & A. Miettinen (Eds.), Entrepreneurship and SME Research: On its Way
to the Next Millenium (pp. 190-216). Aldershot, VA: Avebury (Chapter 4 in the current
volume).
Delmar, F. (2000). The psychology of the entrepreneur. In S. Carter & D. Jones-Evans (Eds.),
Enterprise and Small Business: Principles, Practice and Policies (pp. 132-154). Harlow,
England: Pearson Education.
Dunne, P., & Hughes, A. (1996). Age, size, growth and survival: UK companies in the 1980s.
Journal of Industrial Economics, XLII(2), 115-140.Boswell, J. (1972). The rise and decline
of small firms. London: Allen and Unwin.
Eagly, A. H., & Chaiken, S. (1993). The Psychology of Attitudes. Orlando, FLA: Harcourt
Brace Jovanovich.
Epstein, S. (1984). A procedural note on the measurement of broad dispositions. Journal of
Personality, 52, 318-325.
Fishbein, M. (1967). Attitude and the prediction of behavior. In M. Fishbein (Ed.), Readings
in Attitude Theory and Measurement .
Fishbein, M., & Ajzen, I. (1975). Belief, Attitude, Intention, and Behavior: An Introduction to
Theory and Research. Reading, MA: Addison-Wesley.
Flamholtz, E. G. (1986). Managing the Transition from an Entrepreneurship to a Professionally Managed Firm. San Francisco: Jossey-Bass.
Gundry, L. K., & Welsch, H. P. (2001). The ambitious entrepreneur: High growth strategies of
women-owner enterprises. Journal of Business Venturing, 16, 453-470.
Hair, J. F., Anderson, R. E., Tatham, R. L., & Black, W. C. (1998). Multivariate Data Analysis. (5 ed.). Upper Saddle River, NJ: Prentice Hall.
31
Hambrick, D. C., & Crozier, L. M. (1985). Stumblers and stars in the management of rapid
growth. Journal of Business Venturing, 1(1), 31-45.
Hubbard, R., Vetter, D. E., & Little, E. L. (1998). Replication in strategic management: Scientific testing for validity, generalizability, and usefulness. Strategic Management Journal,
19, 243-254.
Kazumi, T., Sato, Y., Nishikiori, A., Kurose, N., & Sato, Y. (1996). The entrepreneurial spirit
in Japan: A recent assessment, Frontiers of Entrepreneurship Research 1996 . Wellesley,
MA: Babson College.
Kim, M.-S., & Hunter, J. E. (1993). Attitude-behavior relations: A meta-analysis of attitutinal
relevance and topic. Journal of Communication, 43(1), 101-142.
Kirchhoff, B. A. (1994). Entrepreneurship and Dynamic Capitalism: The
Economics of Business Firm Formation and Growth. Westport: CT: Praeger.
Lindell, M. K., & Whitney, D. J. (2001) Accounting for common method variance in crosssectional research designs. Journal of Applied Psychology, 86(1), 114-121.
Lindsay, R. M., & Ehrenberg, A. S. C. (1993). The design of replicated studies. The American
Statistician, 47(August), 217-228.
Locke, E. A. (1991). Introduction to special issue. Organizational Behavior and Human Decision Making, 50, 151-153.
Olson, J. M., & Zana, M. P. (1993). Attitudes and attitude change. Annual Review of Psychology, 44, 117-154.
Petty, R. E., Wegener, D. T., & Fabrigar, L. R. (1997). Attitudes and attitude change. Annual
Review of Psychology, 48, 609-647.
Pieters, R. G. M. (1988). Attitude-behavior relationships. In W. F. van Raaij, G. M. van Veldhoven, & K.-E. Wärneryd (Eds.), Handbook of Economic Psychology (pp. 108-142). Dordrecht, the Netherlands: Kluwer.
32
Reynolds, P. D., & White, S. B. (1997). The Entrepreneurial Process: Economic Growth,
Men, Women, and Minorities. Westport: CT: Quorum Books.
Robinson, K. C., & Hofer, C. W. (1997). A methodological investigation of the validity and
usefulness of parametric and nonparametric statistical data analysis techniques for new
venture research. Frontiers of Entrepreneurship Research (pp. 692-705). Wellesley, MA:
Babson College.692-705
Robinson, P. B., Stimpson, D. V., Huefer, J. C., & Hunt, H. K. (1991). An attitude approach
to the prediction of entrepreneurship. Entrepreneurship: Theory & Practice, 9(4), 13-31.
Shapiro, S. S., & Wilk, M. B. (1965). An analysis of variance test for normality (for complete
samples). Biometrica, 52, 591-611.
Smith, N. R. (1967). The Entrepreneur and His Firm: The Relationship between Type of Man
and Type of Company. East Lansing, MI: Michigan State University.
Stanworth, M. J., & Curran, J. (1973). Management motivation in the smaller business. Epping, Essex: Gower Press.
Stimpson, D. V., Robinson, P. B., Waranusuntikule, S., & Zheng, R. (1990). Attitudinal characteristics of entrepreneurs and non-entrepreneurs in United States, Korea, Thailand, and
the People's Republic of China. Entrepreneurship & Regional Development, 2, 49-55.
Storey, D. J. (1994b). Understanding the Small Business Sector. London: Routledge.
Storey, D. J. (1996). The Ten Percenters. London: Deloitte & Touche.
Valiquette, C. A., Valios, P., Desharnais, R., & Godin, G. (1988). An item-analytic investigation of the Fishbein and Ajzen multiplicative scale: The problem of a simultaneous negative evaluation of belief and outcome. Psychological Reports, 63, 723-728.
Wiklund, J. (1998). Small Firm Growth and Performance: Entrepreneurship and Beyond.
(Doctoral Dissertation) Jönköping: Jönköping International Business School.
33
Wiklund, J., & Shepherd, D. (2003). Aspiring for, and achieving growth: the moderating role
of resources and opportunities. Journal of Management Studies, 40(8), 1911-1941.
34
TABLE 1.
Sources for Selection of Expected Consequences of Growth that May Influence Growth
Motivation
Area affected by growth
Author(s)
Owner-manager’s workload
Boswell (1972) pp. 80-81
Owner-manager’s work tasks
Deeks (1976) pp. 198-205; Smith (1967) pp. 27-28; Stanworth & Curran
(1973) pp. 150-151
Employee well-being, ”atmosphere”
Deeks (1976) pp. 198-205; Smith (1967) pp. 27-28; Stanworth & Curran
(1973) pp. 157, 161
Financial outcome
Deeks (1976) pp. 198-205; Smith (1967) pp. 27-28; Stanworth & Curran
(1973) p. 98
Control (surveillance)
Bolton (1971) p. 24; Boswell (1972) pp. 80-81; Deeks (1976) pp. 198205; Smith (1967) pp. 22, 27-28, 45; Stanworth & Curran (1973) pp. 6263, 152
Independence
Bolton (1971) p. 23-24; Deeks (1976) pp. 198-205; Smith (1967) pp. 17,
27, 45; Stanworth & Curran (1973) pp. 58, 153
Crisis survival ability
Deeks (1976) pp. 198-205; Stanworth & Curran (1973) p. 58
Quality of products & services
Bolton (1971) p. 23; Deeks (1976) pp. 198-205; Stanworth & Curran
(1973) p. 98
35
TABLE 2.
Basic Characteristics of the Three Samples
Full sample
1986 Sample
1994 Sample
1996 Sample
n=1248
n=298
n=354
n=596
Mean age of respondent
47
46
48a
48a
% males
95
95
95
94
% manufacturing
49
40
51a
53a
% service
30
32
31
27
% retail
21
28b
18
20
Mean size (FTE)
17
10
14a
21b
Mean firm age
33
24a
12
30b
Note: One-way ANOVA with Bonferroni test is used in the analysis, except for the sex and industry variables, where chi-2 test is used. a= p< .05 for difference to lowest group. b= p< .05 for difference to lowest and
middle group.
36
TABLE 3.
Independent Variables, How a Doubling of the Number of Employees is Likely to Affect
Each Area.
Workload
Would the small business manager have to work more or less hours?
Work tasks
Would he or she be able to spend more or less time on favored work tasks?
Employee well-being
Would employees enjoy work more or less? (the original Swedish word for
well-being connotes work atmosphere as well)
Personal income
Would the small business manager’s income and other disposable economic
benefits increase or decrease?
Control
Would his or her ability to survey and control operations increase or decrease?
Independence
Would the firm’s independence in relation to customers, suppliers and lenders increase or decrease?
Survival of crises
Would it be easier or harder for the firm to survive a severe crisis?
Product/service quality
Would it be easier or harder for the firm to maintain the quality of products
and services?
37
TABLE 4.
Descriptive Statistics and Correlations
Mean
s.d.
1
2
3
4
5
6
7
8
9
10
Growth motivation
4.58
2.05
Workload
2.77
.98
.22
Work tasks
3.01
1.26
.25
.34
Employee well-
2.61
.96
.41
.24
.35
Personal income
3.74
.75
.22
.14
.17
.20
Control
2.56
.90
.28
.25
.27
.32
.16
Independence
3.14
.94
.30
.24
.31
.35
.17
.28
Survival of crises
2.41
1.22
.29
.20
.19
.35
.20
.27
.32
Product/service
2.90
.99
.27
.24
.25
.41
.17
.27
.28
.31
.07
.11
.00
.00
.07
-.05
.04
.12
.06
-.19
.00
.03
-.01
-.01
.02
.00
.01
.00
-.09
-.04
-.05
-.05
-.04
-.08
-.08
-.06
.04
11
being
quality
Firm size (FTE)
16.55 9.95
Firm age
22.56 23.85 .00
Age of entrepreneur 47.31 9.27
-.11
.03
Note: With the large size of the combined sample, correlations greater than +.05 are generally significant at the p
< .05 level
38
TABLE 5.
Linear Regression Results for the Effect of Expected Consequences of Growth on Growth
Motivation for the Full Sample.
Full sample
Full sample with control variables
n=1158
n=1140
Workload
.06*
.05*
Work tasks
.04
.05
Employee well-being
.24***
.24***
Personal income
.10***
.09***
Control
.09**
.09***
Independence
.11***
.10***
Survival of crises
.09**
.08*
Product/service quality
.06*
.05*
Manufacturing
-.05
Service
.00
5-9 employees
-.05
10-19 employees
-.06*
Old Firm
-.07**
Female
-.08***
Old entrepreneur
Adj. R2
.00
.24
.24
Note: Forced entry of independent variables is used. Standardized regression coefficients are displayed in the Table. *= p< .05; **= p< .01; ***= p< .001. Single-tailed test of significance is applied.
39
TABLE 6.
Linear Regression Results for the Effect of Expected Consequences of Growth on Growth
Motivation for the Three Different Samples.
1986
Rank
1994
Rank
1996
Rank
Sample
order
Sample
order
Sample
order
n=533
n=338
n=287
Joint probability
Workload
.11*
2
.04
7
.02
7
.0015
Work tasks
.04
7
.15**
2
.00
8
.0003
Employee well-being
.27***
1
.19***
1
.25***
1
.0
Personal income
.07
4
.08
5
.12**
4
.000007
Control
.10*
3
.00
8
.13**
2
.00003
Independence
.07
4
.11*
3
.13**
2
.000004
Survival of crises
.07
4
.11*
3
.06
5
.0002
Product/service quality
.04
7
.08
5
.03
6
.04
Adj. R2
.23
.20
.23
Note: Forced entry of independent variables is used. Standardized regression coefficients are displayed in the Table. *= p< .05; **= p< .01; ***= p< .001. Single-tailed test of significance is applied.
40
TABLE 7.
Linear Regression Results for the Effect of Expected Consequences of Growth on Growth
Motivation Dividing the Sample Based on the Contingencies Industry, Size, Firm Age, Sex,
and Age.
Manuf. Service
Retail
5-9
10-19
20-49
Old
Young
Male
Fe-
Old ent
Young
n=571
n=246
emp
emp
emp
firms
firms
n=
male
n=569
ent
n=326
n=479
n=353
n=771
n=372
1096
n=61
n=340
n=587
Workload
.07*
.08
.00
.07
.08*
-.01
.07*
.07
.06*
-.10
.05
.06
Work tasks
.04
.06
.02
.13**
.05
-.05
.01
.10*
.06*
-.16
-.04
.12**
Employee well-
.23***
.27***
.23***
.30***
.17***
.29***
.28***
.22**
.25***
.13
.24***
.25***
Personal income
.10**
.10*
.10*
.11*
.06
.13**
.12***
.05
.10***
.19
.11**
.09**
Control
.08*
.10*
.08
.07
.12**
.08
.10**
.04
.09**
.19
.12**
.06
Independence
.11**
.09*
.14*
.02
.15***
.13**
.10**
.13**
.09***
.30*
.14***
.08*
Survival of crises
.09*
.10*
.04
.07
.07
.13**
.09**
.06
.09**
.06
.05
.12**
Product/service
.06
.04
.09
.06
.09*
.00
.03
.11*
.05
.06
.06
.04
.22
.28
.16
.26
.24
.21
.25
.20
.24
.16
.21
.26
being
quality
Adj. R2
Note: Forced entry of independent variables is used. Standardized regression coefficients are displayed in the
Table. *= p< .05; **= p< .01; ***= p< .001. Single-tailed test of significance is applied.
41
TABLE 8.
Summary of the Results of the Hypothesis Tests from a Total of Seventeen Regression
Equations
Range of the stan- Total number of regressions Total number of statistically
dardized regres-
with positive regression
significant occurrences
sion coefficient
coefficient (out of 17)
(out of 17)
Workload
-.01 to .11
15
7
Work tasks
-.16 to .13
14
5
Employee well-being
.13 to .29
17
16
Personal income
.05 to .19
17
12
Control
.00 to .19
17
10
Independence
.02 to .15
17
15
Survival of crises
.04 to .13
17
9
Product/service quality
.00 to .11
17
4
42
Figure 1
Research Model
Expected consequences
of growth in terms of:
Workload
Work tasks
Employee well-being
Attitude
toward
growth
Personal income
Control
Independence
Survival of crises
Product/service quality
43


© Copyright 2026