
Document 254817
COVER SHEET
9 1 7 0
SEC Registration Number
U N I V E R S A L
R O B I N A
C O R P O R A T I O N
A N D
S U B S I D I A R I E S
(Company’s Full Name)
1 1 0
E .
a n ,
Q u e z o n
R o d r i g u e z
A v e n u e ,
B a g u m b a y
C i t y
(Business Address: No. Street City/Town/Province)
Mr. Gerry N. Florencio
671-2935; 635-0751; 671-3954
(Contact Person)
(Company Telephone Number)
0 9
3 0
Month
Day
1 7 - A
Month
(Form Type)
(Fiscal Year)
Day
(Annual Meeting)
(Secondary License Type, If Applicable)
Dept. Requiring this Doc.
Amended Articles Number/Section
Total Amount of Borrowings
Total No. of Stockholders
Domestic
Foreign
To be accomplished by SEC Personnel concerned
File Number
LCU
Document ID
Cashier
ST AMPS
Remarks: Please use BLACK ink for scanning purposes.
::t
,~.
--"..' -.'\...
:a
SECURFfIES ANDEXCHANGECOMMISSION
,r\
,.\~J\\",
::a
SEC FORM 17-A
\1\\ \j):'
""'
"
"
\\>v
=t
OF
==e
::t
"'"i',q\l'\
,Q
September
2.
SEC Identification Number 9170
3,
BIR Tax Identification No.
~ ~\.:::'_..~.~'
-~
30, 2008
t5i0
\...::AIII<rn,u.
'---'
,
000-400-016-000
HRAD
"""',
,r.""I\"Q'IQ
~II
''''''J'O~
,
I
BY.
::e
4. Exact name of issuer as specified in its charter Universal R
==-
5. Quezon City, Philippines
Province, Country or other jurisdiction of incorporation or organization
--.
:::e
6.
Industry Classification Code:
[
) (SEC
Use Only)
7. 110 E. Rodri2uez Ave., Ba2Umbayan, Quezon City
Address of principal office
~
pi
f8
=-
1110
Postal Code
8. 671-2935~635-0751~671-3954
Issuer's telephone number; including area code
9.
Not Applicable
Former name, former address, and former fiscal year, if changed since last report.
10. Securities registered pursuant to Sections 8 and 12 of the SRC, or Sec. 4 and 8 ofthe RSA
Title of Each Class
Number of Shares of Common Stock
Outstanding and Amount of Debt
Common Shares, P1.00
Par value
2,149,747,281 shares
'
Fit
~
::8
:e
:8
=II!I-A
11. Are any or all of these securities listed on the Philippine Stock Exchange.
Yes [/]
No [ ]
,
,
I:"
I
1~~~\~-
CODE OF THE PHIL
",",,~.r-
1. For the fiscal year ended
'1\'
,
,'"
THEAS~~~~~~:~~~~~~~~~6~:~~~i
.~~
OF THE CORPORATION
i
,
r;l~
"'\\'1'\\\,,'
r"
12. Check whether the issuer:
a) has filed all reports required to be filed by Section 17 of the SRC and SRC Rule 17 thereunder
or Section 11 of the RSA and RSA Rule 11(a)-1 thereunder, and Sections 26 and 141 of The
Corporation Code of the Philippines during the preceding twelve (12) months (or for such
shorter period that the registrant was required to file such reports);
Yes [ / ]
No [ ]
b) has been subject to such filing requirements for the past ninety (90) days.
Yes [ / ]
No [ ]
13. State the aggregate market value of the voting stock held by non-affiliates of the registrant.
The aggregate market value of the voting stock held by non-affiliates is P7,775,305,685.
APPLICABLE ONLY TO ISSUERS INVOLVED IN
INSOLVENCY/SUSPENSION OF PAYMENTS PROCEEDINGS
DURING THE PRECEDING FIVE YEARS:
14. Check whether the issuer has filed all documents and reports required to be filed by Section 17 of
the Code subsequent to the distribution of securities under a plan confirmed by a court or the
Commission.
Not Applicable
DOCUMENTS INCORPORATED BY REFERENCE
If any of the following documents are incorporated by reference, briefly describe them and
identify the part of SEC Form 17-A into which the document is incorporated:
a) Any annual report to security holders;
None
b) Any proxy or information statement filed pursuant to SRC Rule 20 and
17.1(b);
None
c) Any prospectus filed pursuant to SRC Rule 8.1-1
None
TABLE OF CONTENTS
Page No.
PART I - BUSINESS AND GENERAL INFORMATION
Item 1
Business
1
Item 2
Properties
11
Item 3
Legal Proceedings
13
Item 4
Submission of Matters to a Vote of Security Holders
13
PART II - OPERATIONAL AND FINANCIAL INFORMATION
Item 5
Market for Registrant’s Common Equity and
Related Stockholder Matters
13
Management’s Discussion and Analysis or
Plan of Operation
15
Item 7
Financial Statements
30
Item 8
Changes in and Disagreements with Accountants and
Financial Disclosure
30
Independent Public Accountant and Audit Related Fees
31
Item 6
Item 9
PART III - CONTROL AND COMPENSATION INFORMATION
Item 10
Directors and Executive Officers of the Registrant
31
Item 11
Executive Compensation
36
Item 12
Security Ownership of Certain Beneficial Owners
and Management
37
Certain Relationships and Related Transactions
39
Item 13
PART IV - CORPORATE GOVERNANCE
Item 14
Corporate Governance
39
PART V - EXHIBITS AND SCHEDULES
Item 15
(a) Exhibits
(b) Reports on SEC Form 17-C (Current Report)
40
40
SIGNATURES
43
INDEX TO FINANCIAL STATEMENTS AND
SUPPLEMENTARY SCHEDULES
45
INDEX TO EXHIBITS
132
PART I – BUSINESS AND GENERAL INFORMATION
Item 1.
Business
Universal Robina Corporation (URC) is one of the largest branded food product companies in the
Philippines and has a growing presence in other Asian markets. It was founded in 1954 when Mr.
John Gokongwei, Jr. established Universal Corn Products, Inc., a cornstarch manufacturing plant in
Pasig. The Company is involved in a wide range of food-related businesses, including the
manufacture and distribution of branded consumer foods, production of hogs and day-old chicks,
manufacture of animal and fish feeds, glucose and veterinary compounds, flour milling, and sugar
milling and refining. The Company is a dominant player with leading market shares in Savory
Snacks, Candies and Chocolates, and is a significant player in Biscuits, with leading positions in
Cookies and Pretzels. URC is also the largest player in the RTD Tea market, and is a respectable 2nd
player in the Coffee business.
No material reclassifications, merger, consolidation, or purchase or sale of significant amount of assets
(not ordinary) were made in the past three years except those mentioned in the succeeding paragraph.
The Company’s financial condition has remained solid in the said period.
The Company operates its food business through operating divisions and wholly owned or majorityowned subsidiaries that are organized into three core business segments: branded consumer foods,
agro-industrial products and commodity food products.
Branded consumer foods (BCF), including our packaging division, is the Company’s largest segment
contributing about 76.5% of revenues for the fiscal year ended September 30, 2008. Established in the
1960s, the Company’s branded consumer foods division manufactures and distributes a diverse mix of
snack, chocolate, candy, biscuit, bakery, beverage, noodles and tomato-based products. The
manufacture, distribution, sales and marketing activities for the Company’s consumer food products
are carried out mainly through the Company’s branded consumer foods group consisting of snack
foods, beverage and grocery divisions, although the Company conducts some of its branded consumer
foods operations through its wholly-owned or majority-owned subsidiaries and joint venture
companies (i.e. Hunt-URC and Nissin-URC). The Company established URC-Packaging Division to
engage in the manufacture of polypropylene films for packaging companies. The bi-axially oriented
polypropylene plant (BOPP), located in Batangas, and began commercial operation in June 1998.
URC also formed Food Service and Industrial Division that supply BCF products in bulk to certain
institutions like hotels, restaurants, and schools.
In 2004, the company introduced and manufactured ready to drink tea in PET bottles, C2. The
company expanded the beverage product line to include functional beverages such as fitness water. In
2006, the Company supplied certain flexible packaging materials to BCF through its wholly owned
subsidiary, CFC Clubhouse Property, Inc. In 2007, the company acquired the water manufacturing
facilities and trademark from Nestle Water Philippines Inc. which added water to the beverage product
line. In 2008, the company acquired GMC’s Granny Goose brand and snacks line which further
expanded our snacks product lines.
The majority of the Company’s branded consumer foods business is conducted in the Philippines. In
2000, the Company began to expand its BCF business more aggressively into other Asian markets,
primarily through its subsidiary, URC International and its subsidiaries in China: Shanghai Peggy
Foods Co. Ltd., Panyu Peggy Foods Co. Ltd. and URC Hongkong Co. Ltd. (formerly Hongkong
``- 2 Peggy Snack Foods Co. Ltd.); in Malaysia: URC Snack Foods (Malaysia) Sdn. Bhd. (formerly Pacific
World Sdn. Bhd.) and Ricellent Sdn. Bhd.; in Thailand: URC (Thailand) Co. Ltd. (formerly Thai
Peggy Foods Co. Ltd.); in Singapore: URC Foods (Singapore) Pte. Ltd. (formerly Pan Pacific Snacks
Pte. Ltd.); in 2007 Acesfood Network Pte, Ltd. and in 2008 Advanson International Pte, Ltd.; in
Indonesia: PT URC Indonesia. In 2006, the Company started operations in Vietnam through its
subsidiary URC Vietnam Company Ltd. The Asian operations contributed about 20.4% of the
Company’s revenues for the fiscal year ended September 30, 2008.
The Company has a strong brand portfolio created and supported through continuous product
innovation, extensive marketing and experienced management. Its brands are household names in the
Philippines and a growing number of consumers across Asia are purchasing the Company’s branded
consumer food products.
The Company’s agro-industrial products segment operates three divisions, which engage in hog and
poultry farming (Robina Farms or “RF”), the manufacture and distribution of animal feeds, glucose
and soya products (Universal Corn Products or “UCP”), and the production and distribution of animal
health products (Robichem). This segment contributed approximately 12.3% of sale of goods and
services in fiscal year 2008.
The Company’s commodity food products segment engages in sugar milling and refining through its
Sugar divisions URSUMCO, CARSUMCO , SONEDCO , and in fiscal 2008, the company acquired
PASSI I and II which provide additional capacity to our existing sugar mills; and flour milling and
pasta manufacturing through URC Flour division. In fiscal 2008, the segment contributed
approximately 11.2% of aggregate sale of goods and services.
The Company is a core subsidiary of JG Summit Holdings, Inc. (JGSHI), one of the largest
conglomerates listed in the Philippine Stock Exchange based on total net sales. JGSHI has substantial
interests in property development, hotel management, banking and financial services,
telecommunications, petrochemicals, air transportation and business interests in other sectors,
including power generation, printing, and insurance.
The percentage contribution to the Company’s revenues for each of the three years in the period ended
September 30, 2006, 2007 and 2008 by each of the Company’s principal business segments is as
follows:
Branded Consumer Foods
Agro-Industrial Products
Commodity Food Products
For the fiscal years ended September 30
2006
2007
2008
75.6%
75.2%
76.5%
14.4
15.0
12.3
10.0
9.8
11.2
100.0%
100.0%
100.0%
The geographic percentage distribution of the Company’s revenues for each of the three years in the
period ended September 30, 2006, 2007 and 2008 is as follows:
``- 3 -
Philippines
ASEAN
China
For the fiscal years ended September 30
2006
2007
2008
77.9%
80.9%
79.6%
19.1
17.4
18.4
3.0
1.7
2.0
100.0%
100.0%
100.0%
Customers
None of the Company’s businesses is dependent upon a single customer or a few customers that a loss
of anyone of them would have a material adverse effect on the Company. The Company has no single
customer that, based upon existing orders, will account for 20.0% or more of the Company’s total sale
of goods and services.
Distribution, Sales and Marketing
The Company has developed an effective nationwide distribution chain and sales network that it
believes provide its competitive advantage. The Company sells its branded food products primarily to
supermarkets, as well as directly to top wholesalers, large convenience stores, large scale trading
companies and regional distributors, which in turn sell its products to other small retailers and down
line markets . The Company’s branded consumer food products are distributed to approximately
124,000 outlets in the Philippines and sold through its direct sales force and regional distributors.
URC intends to enlarge its distribution network coverage in the Philippines by increasing the number
of retail outlets that its sales force and distributors directly service.
The branded consumer food products are generally sold by the Company either from salesmen to
wholesalers or supermarkets, and regional distributors to small retail outlets. 15- to 30- day credit
terms are extended to wholesalers, supermarkets and regional distributors
The Company believes that its emphasis on marketing, product innovation and quality, and strong
brand equity has played a key role in its success in achieving leading market shares in the different
categories where it competes . In particular, URC launched “Jack n Jill” as a master umbrella brand
in order to enhance customer recognition of its products. URC devotes significant expenditures to
support advertising and branding to differentiate its products and further expand market share both in
the Philippines and in its overseas markets, including funding for advertising campaigns such as
television commercials and radio and print advertisements, as well as promotions for new product
launches by spending on average 5% of its branded consumer food division’s net sales this year.
Competition
The BCF business is highly competitive and competition varies by country and product category. The
Company believes that the principal competitive factors include price, taste, quality, convenience,
brand recognition and awareness, advertising and marketing, availability of products and ability to get
its product widely distributed. Generally, the Company faces competition from both local and
multinational companies in all of its markets. Major competitors in the market segments in which it
competes include, in the Philippines, Liwayway Manufacturing Corp., Columbia Foods International,
Republic Biscuit Corporation, Suncrest Foods Inc., Del Monte Phil. Inc., and Monde Nissin
Corporation, Nestle Philippines Inc., San Miguel Pure Foods Company Inc. and Kraft Foods Inc., and
internationally, Procter & Gamble, Effem Foods/Mars Inc., Lotte Group, Perfetti Van Melle Group,
``- 4 Mayora Inda PT, Calbee Group, Apollo Food, Frito-Lay, Nestlé S.A., Cadbury Schweppes plc,
Groupe Danone S.A. and Kraft Foods International.
Competition in the Philippine food and beverage industry is expected to increase in the future with
increased liberalization of trade by the Philippine government and the predicted accompanying growth
in imports due to the World Trade Organization (WTO) and ASEAN Free Trade Area (AFTA). Under
the WTO, tariff rates on food and agricultural items are being decreased and import quotas are being
eliminated among member countries, including the Philippines. AFTA is a free trade area formed by
10 South East Asian countries, including the Philippines. Under the AFTA, tariffs on manufactured
goods, including processed agricultural products, are being minimized or eliminated over a 15-year
period starting from January 1, 1993, and non-tariff barriers will be subsequently phased out.
The day-old chicks market is cyclical, very competitive and principally domestic. The Company
believes that the principal competitive factors are chick quality, supply dependability, price, and
breeder performance for broiler chicks. For layer chicks, competitive factors are egg productivity and
disease resistance. The Company’s principal competitors are RFM Corp. and Math Agro for broiler
chicks and Bounty Farms, Inc. for both broiler and layer chicks.
The live hog market is highly fragmented, competitive and principally domestic. The Company
believes that the principal competitive factors are quality, reliability of supply, price and proximity to
market. The Company’s principal competitors are San Miguel Corp. (Monterey) and Foremost Farms,
Inc. The main competition is from backyard raisers who supply 70%-80% of the total pork
requirement in the country. In 2008 the hog population decreases by 25-30% because of disease
outbreaks and farm closure(s) due to high cost inputs (Feeds) and lower live weight prices (due to
lower consumer spending starting June 2008). Due to the decrease in supply it is expected that farm
gate prices will relatively be higher in the 1 st half of 2009 pending any increase in pork importation.
The commercial animal feed market is highly fragmented and its products compete primarily with
domestic feed producers. As of September 30, 2008, there were 300 registered feed mills in the
Philippines, 35% of which sell commercial feeds. URC believes the principal competitive factors are
quality and price. The Company’s principal competitors are B-Meg and UNAHCO (Sarimanok &
Thunderbird). A number of multinationals including Cargil Purina Phils. Inc, CJ and Sun Jun of
Korea, and Bew Hope of China are also key players in the market.
The animal health products market is highly competitive. The market is dominated by multinationals
and the Company is one of only a few Philippine companies in this market. The Company’s principal
competitors are Pfizer, Inc., Univet Pharmaceuticals Ltd., and Merial Limited, a company jointly
owned by Merk and Co., Inc. and Aventis. S.A. The principal competitive factors are brand equity,
price, product effectiveness, and customer services.
Enhancement and development of New Products
The Company intends to continuously introduce innovative new products, product variants and line
extensions in the snackfoods (snacks, biscuits, candies, chocolates and bakery), beverage and grocery
(instant noodles, tomato-based). In fiscal 2008, the company acquired GMC’s Granny Goose brand
and snacks line to add products to its savory snacks line. This fiscal year alone, the Company’s
Branded Consumer Foods has introduced 89 new products.
``- 5 The Company also plans to selectively enter and expand its presence in segments of the Philippine
beverage market through the addition of branded beverage products designed to capture market share
in niches that complement its existing branded snack food product lines. In 2004, the company
introduced and manufactured ready to drink tea in PET bottles, C2. The company expanded the
beverage product line to include functional beverages such as fitness water. In fiscal year 2007, the
company acquired the water manufacturing facilities and trademark (Hidden Spring) from Nestle
Water Philippines and entered into a licensing agreement with Societe Des Produits Nestle S.A., to
manufacture and sell the products carrying the “Nestle Pure Life” trademark in the Philippines.
Raw Materials
A wide variety of raw materials are required in the manufacture of the Company’s food products,
including corn, wheat, flour, sugar, glucose and potatoes, some of which are purchased domestically
and some of which the Company imports. The Company also obtains a major portion of its raw
materials from its agro-industrial and commodity food products divisions, such as glucose, flour and
sugar and flexible packaging materials from wholly owned subsidiary CFC Clubhouse Property, Inc.
A portion of flexible packaging material requirements is also purchased both locally and from abroad
(Korea and Japan), while Tetra-pak packaging is purchased from Singapore. The Company’s policy is
to maintain a number of suppliers for its raw and packaging materials to ensure a steady supply of
quality materials at competitive prices. However, the prices paid for raw materials generally reflect
external factors such as weather conditions, commodity market fluctuations, currency fluctuations and
the effects of government agricultural programs. In the past year, the Company has experienced
higher prices for majority of its core raw materials including wheat and cooking oils. While the
Company has increased the prices of certain products to reflect the increased price of raw materials, it
has not been able to pass on the full extent of such increases. In response to these developments, the
Company realigned its resources to improve its operational efficiencies. This strategy includes
manufacturing its products in countries where the raw materials are available at the lowest cost.
For its day-old chicks business, the Company requires a number of raw materials, including parent
stock for its layer chicks, grandparent stock for its broiler chicks and medicines and other nutritional
products. The Company purchases the parent stock for its layer chicks from Hendrix Genetics and
from Hy-Line International in the United States under exclusive distribution agreements for the
Philippines. The Company purchases the grandparent stock for its broiler chicks from Hubbard SAS
in France. The Company purchases a significant amount of the vitamins, minerals, antibiotics and
other medications and nutritional products used for its day-old chicks business from its Robichem
division. The Company purchases vaccines from various suppliers, including Merial, Intervet
Philippines, Inc. and Boehringer Ingelheim GmbH and Ceva.
For its live hog business, the Company requires a variety of raw materials, primarily imported
breeding stocks or semen. The Company purchases all of the feeds it requires from its Universal Corn
Products division and substantially all of the minerals and antibiotics for its hogs from its Robichem
division. The Company purchases vaccines, medications and nutritional products from a variety of
suppliers based on the strengths of their products. Ample water supply is also available in its
locations. The Company maintains approximately one month of inventory of its key raw materials.
For its animal health products, the Company requires a variety of antibiotics and vitamins, which it
acquires from suppliers in Europe and Asia (particularly China). For its commercial animal feed
products, the Company requires a variety of raw materials, including corn grains, soya beans and
meals, feed- wheat grains, wheat bran, wheat pollard, rice bran, copra meal and fish meal. Tapioca
``- 6 starch and soya bean seeds, on the other hand, are required for its liquid glucose and soya bean
products, respectively. The Company purchases corn locally from corn traders and imports from
suppliers in China and Europe for feed-wheat and from the United States for soya bean seeds. The
Company imports tapioca starch from a number of suppliers, primarily in Vietnam and Thailand. The
Company purchases solvents locally from Shell Chemicals Philippines for use in the extraction of soya
oil & other soya-products from soya beans. The Company maintains approximately two months
physical inventory and one month in-transit inventory for its imported raw materials.
The Company obtains sugar cane from local farmers. Competition for sugar cane supply is very
intense and is a critical success factor for its sugar business. Additional material requirements for the
sugar cane milling process are either purchased locally or imported.
The Company generally purchases wheat, the principal raw material for its flour milling and pasta
business, through forward contracts from suppliers in the United States, Canada and China.
The Company maintains a number of suppliers for its raw materials to ensure a steady supply of
quality materials at competitive prices. The Company believes that alternative sources of supplies of
the raw materials that it uses are readily available. The Company’s policy is to maintain
approximately 30 to 90 days of inventory.
Patents, Trademarks, Licenses, Franchises, Concessions or Labor Contract
Intellectual property licenses are subject to the provisions of the Philippine Intellectual Property Code.
The Company owns a substantial number of trademarks registered with the Bureau of Trademarks of
the Philippine Intellectual Property Office. In addition, certain of its trademarks have been registered
in other Asian countries in which it operates. These trademarks are important in the aggregate because
brand name recognition is a key factor in the success of many of the Company’s product lines. In the
Philippines, the Company’s licensing agreements are registered with the Philippine Intellectual
Property Office. The former Technology Transfer Registry of the Bureau of Patents, Trademarks and
Technology Transfer Office issued the relevant certificates of registration for licensing agreements
entered into by URC prior to January 1998. These certificates are valid for a 10-year period from the
time of issuance which period may be terminated earlier or renewed for 10-year periods thereafter.
After the Intellectual Property Code of the Philippines (R.A. No. 8293) became effective in January
1998, technology transfer agreements, as a general rule, are no longer required to be registered with
the Documentation, Information and Technology Transfer Bureau of the Intellectual Property Office,
but the licensee may apply to the Intellectual Property Office for a certificate of compliance with the
Intellectual Property Code to confirm that the licensing agreement is consistent with the provisions of
the Intellectual Property Code. In the event that the licensing agreement is found by the Intellectual
Property Office to be not in compliance with the Intellectual Property Code, the licensor may obtain
from the Intellectual Property Office a certificate of exemption from compliance with the cited
provision.
The Company also uses brand names under licences from third parties. These licensing arrangements
are generally renewable based on mutual agreement. The Company’s licensed brands include:
Swiss Miss milk shakes and cocoa mix for sale in the Philippines;
Nissin’s Cup instant noodles for sale in the Philippines;
Hunt’s tomato and pork and bean products for sale in the Philippines; and
Nestle Purelife for sale in the Philippines
``- 7 -
URC has obtained from the Intellectual Property Office certificates of registration for its licensing
agreements with Nissin-URC, Hunt-URC and Societe Des Produits Nestle S.A. The Company was
also able to renew its licenses with Nissin - URC and Hunt-URC for another term.
Regulatory Overview
As manufacturer of consumer food and commodity food (flour) products, the Company is required to
guarantee that the products are pure and safe for human consumption, and that the Company conforms
to standards and quality measures prescribed by the Bureau of Food and Drug.
The Company’s sugar mills are licensed to operate by the Sugar Regulatory Administration. The
Company renews its sugar milling licenses at the start of every crop year.
All of the Company’s livestocks and feed products have been registered with and approved by the
Bureau of Animal Industry, an agency of the Department of Agriculture which prescribes standards,
conducts quality control test of feed samples, and provides technical assistance to farmers and feed
millers.
Some of the Company’s projects, such as the sugar mill and refinery, and poultry and hog farm
operations, certain snacks products , BOPP packaging , Flexible packaging and PET bottle
manufacturing , are registered with the Board of Investments (BOI) which allows the Company certain
fiscal and non-fiscal incentives.
Effects of Existing or Probable Governmental Regulations on the Business
The Company operates its businesses in a highly regulated environment. These businesses depend
upon licenses issued by government authorities or agencies for their operations. The suspension or
revocation of such licenses could materially and adversely affect the operation of these businesses.
Research and Development
The Company develops new products and variants of existing product lines, researches new processes
and tests new equipment on a regular basis in order to maintain and improve the quality of the
Company’s food products. In the Philippine operations alone, about =
P 41 million was spent for
research and development activities for fiscal year 2008 and approximately P
=26 million and =
P29
million for fiscal years 2007 and 2006, respectively.
The Company has research and development staff for its branded consumer foods and packaging
divisions of approximately 109 people located in its research and development facility in Metro
Manila. The Company also has research and development staff in each of its manufacturing facilities.
In addition, the Company hires experts from all over the world to assist its research and development
staff. The Company conducts extensive research and development for new products, line extensions
for existing products and for improved production, quality control and packaging as well as
customising products to meet the local needs and tastes in the international markets. The Company’s
commodity foods division also utilises this research and development facility to improve their
production and quality control. The Company also strives to capitalise on its existing joint ventures to
effect technology transfers.
``- 8 The Company has dedicated research and development staff for its agro-industrial business of
approximately thirty three persons. Its researchers are continually exploring advancements in breeding
and farming technology. The Company regularly conducts market research and farm-test for all of its
products.
The Company also has a diagnostic laboratory that enables it to perform its own serology tests and
offers its laboratory services directly to other commercial farms and Robichem offers its laboratory
services at a minimal cost as a service to some of its customers.
Transactions with Related Parties
The largest shareholder, JG Summit Holdings, Inc., is one of the largest conglomerates listed on the
Philippine Stock Exchange based on total net sales. JG Summit provides the Company with certain
corporate center services including corporate finance, corporate planning, procurement, human
resources, legal and corporate communications. JG Summit also provides the Company with valuable
market expertise in the Philippines as well as intra-group synergies. See Note 34 to Consolidated
Financial Statements for Related Party Transactions.
Costs and Effects of Compliance with Environmental Laws
The operations of the Company are subject to various laws enacted for the protection of the
environment, including the Pollution Control Law (R.A. No. 3931, as amended by P.D. 984), the Solid
Waste Management Act (R.A. No. 9003), the Clean Air Act (R.A. No. 8749), the Environmental
Impact Statement System (P.D. 1586) and the Laguna Lake Development Authority (LLDA) Act of
1966 (R.A. No. 4850). The Company believes that it has complied with all applicable environmental
laws and regulations, an example of which is the installation of wastewater treatments in its various
facilities. Compliance with such laws has not had, and in the Company’s opinion, is not expected to
have, a material effect upon the Company’s capital expenditures, earnings or competitive position. As
of September 30, 2008, the Company has invested about P
=333 million in wastewater treatment in its
facilities in the Philippines.
Employees and Labor
As of September 30, 2008, the number of permanent full time employees engaged in the Company’s
respective businesses is 8,783 and are deployed as follows:
Business
Company or Division
Branded consumer foods . . . . . . . . . . .
BCF, Nissin-URC, Hunt-URC
Packaging Division, URC Hotloops, URCICL
Agro-industrial products
Agribusiness . . . . . . . . . . .
Livestock feeds, corn
products, & vegetable oil . . .
Veterinary compounds . . . . .
Commodity food products
Sugar . . . . . . . . . . . . .
Flour . . . . . . . . . . . . . . . . . . .
Number
6,221
Robina Farms
836
UCP
Robichem
343
31
URSUMCO, SONEDCO, CARSUMCO,PASSI I and II
CMC
1,049
303
8,783
``- 9 Of the above 2,127 is managerial and administrative staff. As at the same date, approximately 8,300
contractual and agency employees are engaged in the Company’s businesses. The Company does not
anticipate any substantial increase in the number of its employees in 2009.
For most of the companies and operating divisions, collective bargaining agreements between the
relevant representatives of the employees’ union and the subsidiary or divisions are in effect. The
collective bargaining agreements generally cover a five-year term with a right to renegotiate the
economic provisions of the agreement after three years, and contain provisions for annual salary
increases, health and insurance benefits, and closed-shop arrangements. The collective bargaining
agreements are with 17 different unions. For fiscal 2008, 5 collective bargaining agreements were
signed and concluded with the labor unions which are as follows: Terai Labor Union (TLU), CIMC
Employee Union- Workers’ Solidarity Network (CIMCEU-WSN) MCDMonthly Independent Union (
MCD-MIU) and Cosolidated WorkersUnion (CWU).
The Company believes that good labor relations generally exist throughout the Company’s
subsidiaries and operating divisions.
The Company has established non-contributory retirement plan covering all of the regular employees
of URC. The plan provides retirement, separation, disability and death benefits to its members. The
Company, however, reserves the right to change the rate and amounts of its contribution at anytime on
account of business necessity or adverse economic conditions. The funds of the plan are administered
and managed by the trustees. Retirement ( gain) /cost (credited)/ charged to operations, including
amortization of past service cost, amounted to ( =
P 74) million in fiscal year 2008 and P
=144 million in
fiscal year 2007.
Risks
The major business risks facing the Company and its subsidiaries are as follows:
1) Competition
The Company and its subsidiaries face competition in all segments of its businesses both in the
Philippine market and in international markets where it operates. The Philippine food industry in
general is highly competitive. Although the degree of competition and principal competitive factors
vary among the different food industry segments in which the Company participates, the Company
believes that the principal competitive factors include price, product quality, brand awareness and
loyalty, distribution network, proximity of distribution outlets to customers, product variations and
new product introductions. (See page 3, Competition, for more details)
The Company’s ability to compete effectively includes continuous efforts in sales and marketing of its
existing products, development of new products and cost rationalization.
2) Financial Market
The Company has foreign exchange exposure primarily associated with fluctuations in the value of the
Philippine Peso against the U.S. dollar and other foreign currencies. Majority of the Company’s
revenues is denominated in Pesos, while certain of its expenses, including debt service and raw
material costs, are denominated in U.S. dollars or based on prices determined in U.S. dollars. In
``- 10 addition, the majority of the Company’s debt is denominated in foreign currencies. Prudent fund
management is employed to minimize effects of fluctuations in interest and currency rates.
3) Raw Materials
The Company’s production operations depend upon obtaining adequate supplies of raw materials on a
timely basis. In addition, its profitability depends in part on the prices of raw materials since a portion
of the Company’s raw material requirements is imported including packaging materials. To mitigate
these risks, alternative sources of raw materials are used in the Company’s operations. (See page 5,
Raw Materials, for more details)
4) Food Safety Concerns
The Company’s business could be adversely affected by the actual or alleged contamination or
deterioration of certain of its flagship products, or of similar products produced by third parties. A
risk of contamination or deterioration of its food products exists at each stage of the production cycle,
including the purchase and delivery of food raw materials, the processing and packaging of food
products, the stocking and delivery of the finished products to its customers, and the storage and
display of finished products at the points of final sale. The Company conducts extensive research and
development for new products, line extensions for existing products and for improved production,
quality control and packaging as well as customizing products to meet the local needs and tastes in the
international markets for its food business. For its agro-industrial business, its researchers are
continually exploring advancements in breeding and farming technology. The Company regularly
conducts market research and farm-test for all of its products. Moreover, the Company ensures that
the products are safe for human consumption, and that the Company conforms to standards and quality
measures prescribed by regulatory bodies such as Bureau of Food and Drug, Sugar Regulatory
Administration, Bureau of Animal Industry, and Department of Agriculture.
5) Mortalities
The Company’s agro-industrial business is subject to risks of outbreaks of various diseases. The
Company faces the risk of outbreaks of foot and mouth disease, which is highly contagious and
destructive to susceptible livestock such as hogs, and avian influenza or bird flu for its chicken
farming business. These diseases and many other types could result to mortality losses. Disease
control measures were adopted by the Company to minimize and manage this risk.
6) Intellectual Property Rights
Approximately 77% of the Company’s sale of goods and services in fiscal year 2008 were from its
branded consumer food group. The Company has put considerable efforts to protect the portfolio of
intellectual property rights, including trademark registrations. Security measures are continuously
taken to protect its patents, licenses and proprietary formulae against infringement and
misappropriation.
7)
8) Weather and Catastrophe
Severe weather condition may have an impact on some aspects of the Company’s business, such as its
sugar cane milling operations due to reduced availability of sugar cane. Weather condition may also
affect the Company’s ability to obtain raw materials and the cost of those raw materials. Moreover,
``- 11 the Philippines have experienced a number of major natural catastrophes over the years including
typhoons, droughts, volcanic eruptions, and earthquakes. The Company and its subsidiaries
continually maintain sufficient inventory level to neutralize any shortfall of raw materials from major
suppliers whether local or imported.
9) Environmental Laws and Other Regulations
The Company is subject to numerous environmental laws and regulations relating to the protection of
the environment and human health and safety, among others. The nature of the Company’s operations
will continue to subject it to increasingly stringent environmental laws and regulations that may
increase the costs of operating its facilities above currently projected levels and may require future
capital expenditures. The Company is continually complying with environmental laws and
regulations, such as the wastewater treatment plants as required by the Department of Environment
and Natural Resources, to lessen the effect of these risks.
The Company shall continue to adopt what it considers conservative financial and operational policies
and controls to manage the various business risks it faces.
Item 2.
Properties
The Company operates the manufacturing/farm facilities located in the following:
Location (Number of facilities)
Pasig City (4)
Type of Facility
Owned/Rented Condition
Owned
Good
Libis, Quezon City (1)
Branded consumer food plants,
feedmills and flourmill
Branded consumer food plant
Owned
Good
Canlubang, Laguna (1)
Branded consumer food plant
Owned
Good
Mandaue City, Cebu (2)
Owned
Good
Luisita, Tarlac (1)
Davao City, Davao (1)
San Fernando, Pampanga (2)
Dasmariñas, Cavite (2)
Cagayan de Oro (1)
Branded consumer food plant,
poultry farm and feedmill
Branded consumer food plant
Flourmill
Branded consumer food plants
Branded consumer food plants
Branded consumer food plant
Owned
Owned
Owned
Owned
Owned
Good
Good
Good
Good
Good
San Pablo, Laguna (1)
Branded consumer food plant
Owned
Good
``- 12 Location (Number of facilities)
Type of Facility
San Pedro, Laguna (2)
Branded consumer food plant
Antipolo, Rizal (4)
Teresa, Rizal (2)
Poultry and piggery farm
Poultry and piggery farms
Angono, Rizal (1)
Taytay, Rizal (1)
Owned/Rented Condition
Rented
Good
Owned/rented
Owned/rented
Good
Good
Poultry farm
Poultry farm
Owned
Rented
Good
Good
Naic Cavite (1)
Poultry farm
Rented
Good
San Miguel, Bulacan (3)
Poultry and piggery farms
Owned
Good
Novaliches, Quezon City (1)
Piggery farm
Owned
Good
Rosario, Batangas
Piggery farm
Owned
Good
Manjuyod, Negros Oriental (1)
Sugar mill
Owned
Good
Piat, Cagayan (1)
Sugar mill
Owned
Good
Kabankalan, Negros Occidental (1)
Sugar mill
Owned
Good
San Enrique, Iloilo City (1)
Sugar mill
Owned
Good
Man-it, Passi City (1)
Sugar mill
Owned
Good
Simlong, Batangas (2)
BOPP plant/Flexible Packaging
Owned
Good
Calamba, Laguna (1)
Branded consumer food plant
Rented
Good
Samutsakhorn Industrial Estate,
Samutsakhorn, Thailand (1)
Branded consumer food plant
Owned
Good
Pasir Gudang, Johor, Malaysia (1)
Branded consumer food plant
Owned
Good
Shiqiao Town, Guandong, China (1)
Branded consumer food plant
Owned
Good
Shanghai, China (1)
Industrial Town, Indonesia (1)
Branded consumer food plant
Branded consumer food plant
Owned
Owned
Good
Good
VSIP, Bin Duong Province,
Vietnam (1)
Acesfoods, Shantou, China (1)
Branded consumer food plant
Owned
Good
Branded consumer food plant
Owned
Good
The Company intends to expand the production and distribution of the branded consumer food
products internationally through the addition of manufacturing facilities located in geographically
desirable areas, especially in the ASEAN countries, the realignment of the production to take
advantage of markets that are more efficient for production and sourcing of raw materials, and
increased focus and support for exports to other markets from the manufacturing facilities. It also
intends to enter into alliances with local raw material suppliers and distributors.
Sugar mill facilities in Kabankalan, Negros Occidental has a net book value of =
P2.538 billion in
fiscal 2008 and =
P1.359 billion in fiscal 2007 of which =
P70 million and =
P92 million were used
to secure the loan from Philippine Sugar Corporation in fiscals 2008 and 2007, respectively. (See Note
22, Long-term Debt, to Consolidated Financial Statements for more details)
``- 13 Annual lease payment for Calamba plant for fiscal year 2008 amounted to =
P44 million pesos. Lease
contract is renewable annually. Land in Taytay, Rizal and Antipolo, Rizal, where farm’s facilities
are located, are owned by an affiliate and are rent-free while land in Naic Cavite where poultry
facilities are also located is leased starting September 2008.
Item 3.
Legal Proceedings
The Company is subject to lawsuits and legal actions in the ordinary course of its business. The
Company or any of its subsidiaries is not a party to, and its properties are not the subject of, any
material pending legal proceedings that could be expected to have a material adverse effect on the
Company’s financial position or results of operations.
Item 4.
Submission of Matters to a Vote of Security Holders
There were no matters submitted to a vote of security holders during the fourth quarter of the fiscal
year covered by this report.
PART II - OPERATIONAL AND FINANCIAL INFORMATION
Item 5.
Market for Registrant’s Common Equity and Related Stockholder Matters
Market Information
The principal market for URC’s common equity is the Philippine Stock Exchange. Sales prices of the
common stock follow:
Fiscal Year 2008
Oct. to Dec. 2007
Jan. to Mar. 2008
Apr. to Jun. 2008
Jul. to Sep. 2008
Fiscal Year 2007
Oct. to Dec. 2006
Jan. to Mar. 2007
Apr. to Jun. 2007
Jul. to Sep. 2007
High
Low
=15.00
P
14.25
14.75
10.75
=13.75
P
12.75
10.25
9.20
=19.25
P
17.25
18.75
16.50
=19.00
P
17.00
18.50
16.00
As of January 9, 2009, the latest trading date prior to the completion of this annual report, sales prices
of the common stock is at P
= 6.90.
The number of shareholders of record as of September 30, 2008 was approximately 1,236. Common
shares outstanding as of September 30, 2008 were 2,149,747,281.
``- 14 List of Top 20 Stockholders of Record
September 30, 2008
Name of Stockholders
1
2
3
4
5
6
7
8
8
8
8
8
9
10
11
12
13
14
15
16
17
18
19
20
JG Summit Holdings, Inc.
PCD Nominee Corporation (Non-Filipino)
PCD Nominee Corporation (Filipino)
Universal Robina Corporation
Elizabeth Y. Gokongwei &/or John Gokongwei, Jr.
Paul Gerald B. Del Rosario
Litton Mills, Inc.
Robina Gokongwei Pe &/or Elizabeth Gokongwei
Faith Gokongwei Ong &/or Elizabeth Gokongwei
Marcia Gokongwei Sy &/or Elizabeth Gokongwei
Hope Gokongwei Tang &/or Elizabeth Gokongwei
Lisa Yu Gokongwei &/or Elizabeth Gokongwei
Flora Ng Siu Kheng
Consolidated Robina Capital Corporation
Gilbert U. Du &/or Fe Socorro R. Du
Lily Cristina G. Ngochua
Pua Yok Bing
JG Summit Capital Services Corporation
Calvin Chua
Catalino S. Ngochua
Pablo Son Keng Po
Benilda S. Santos
Pedro Sen
Phimco Industries Provident Fund
OTHERS
TOTAL
Number of
Shares Held
1,314,435,609
657,870,757
160,923,235
4,460,000
2,479,400
2,432,300
2,237,434
575,000
575,000
575,000
575,000
575,000
379,500
253,000
188,485
151,800
142,485
127,765
126,500
86,020
85,514
82,600
75,900
72,864
261,113
2,149,747,281
Percent to
Total
Outstanding
61.14%
30.60%
7.49%
0.21%
0.12%
0.11%
0.10%
0.03%
0.03%
0.03%
0.03%
0.03%
0.01%
0.01%
0.01%
0.01%
0.01%
0.01%
0.01%
0.00%
0.00%
0.00%
0.00%
0.00%
0.01%
100%
Recent Sales of Unregistered Securities
Not applicable. All shares of the Company are listed on the Philippine Stock Exchange.
Dividends
The Company paid dividends as follows:
For fiscal year 2008, cash dividend of P0.68 per share was declared to all stockholders of record as of
May 16, 2008 and paid on June 12, 2008.
For fiscal year 2007, cash dividend of P0.68 per share was declared to all stockholders of record as of
May 18, 2007 and paid on June 14, 2007.
``- 15 For fiscal year 2006, stock dividends equivalent to 15% of total issued and outstanding shares was
declared to all stockholders of record as of January 14, 2006 and issued on February 7, 2006 and cash
dividend of =
P0.54 per share was declared to all stockholders of record as of May 19, 2006 and paid on
June 15, 2006.
Item 6.
Management’s Discussion and Analysis or Plan of Operation
The following discussion should be read in conjunction with the accompanying consolidated financial
statements and notes thereto, which form part of this Report. The consolidated financial statements
and notes thereto have been prepared in accordance with the Philippine Financial Reporting Standards
(PFRS).
Results of Operations
Fiscal Year 2008 Compare to Fiscal Year 2007
URC generated a consolidated sale of goods and services of P
=45.455 billion for the fiscal year ended
September 30, 2008, a 20.5% sales growth over last year. Sale of goods and services performance by
business segment follows:
·
Sale of goods and services in URC’s branded consumer foods segment (BCFG), excluding
packaging division, increased by =
P5.935 billion, or 21.7%, to P33.264 billion in fiscal 2008
from P
=27.329 billion registered in fiscal 2007. BCFG’s domestic operations posted a 19.2%
increase in net sales which was largely driven by the strong performance of its snackfoods
which grew by 22.7% on account of growth in sales volume as a result of snack and biscuit
sales force split and price increases in some categories. The launch of 89 SKU’s during the
year which contributed about 4% of the total sales and acquisition of Granny Goose snacks
line also helped boost sales in fiscal 2008. Beverage business sales grew by 8.4% due to
higher coffee sales which compensated for the flat sales of C2 due to increased competition.
Grocery products sales likewise improved 23.0% with the strong inroads of noodles against
its competitors. BCFG’s international sales increased by 28.9% to =
P9.269 billion against last
year due to higher revenues from Vietnam, Thailand, Malaysia and China operations. In US
dollar amount, sales registered an increase of 43.3% from US$150 million recorded in fiscal
2007 to US$215 million registered in fiscal 2008. Vietnam posted a phenomenal sales growth
due to surging C2 sales volume coupled by price increases.
Sale of goods and services of BCFG (excluding packaging division) accounted for 73.2% of
total URC consolidated sale of goods and services for fiscal 2008.
Sale of goods and services in URC’s packaging division rose to =
P1.499 billion in fiscal 2008
or up 44.0% from =
P1.041 billion reported last year due to increase in sales volume and prices.
·
Sale of goods and services in URC’s agro-industrial segment (AIG) aggregated to P
=5.570
billion in fiscal 2008, slightly lower from P
=5.648 billion recorded in fiscal 2007. URC’s
animal feed business grew by 5.0% to P
=2.768 billion on the back of higher prices, however,
volumes dropped as hog and poultry raisers nationwide contended with rising feed costs.
Farms business declined by 7.0% to P
=2.802 billion from P
=3.012 billion last year due to 8.2%
decline in sales volume caused by an influx of cheap imported meat.
``- 16 ·
Sale of goods and services in URC’s commodity foods segment amounted to =
P5.121 billion in
fiscal 2008 or up 38.3% from =
P3.702 billion reported in fiscal 2007. Flour net sales went up
by 30.9% to =
P3.320 billion from =
P2.537 billion posted last year on the back of numerous price
increases to offset higher wheat costs worldwide. Moreover, sugar net sales increased by
54.6% to P
=1.801 billion from =
P1.165 billion recorded last year as a result of higher sales
volume due to acquisition earlier this year of PASSI sugar milling and increased production
volume in two Negros mills.
URC’s cost of sales consists primarily of raw and packaging materials costs, manufacturing costs and
direct labor costs. Cost of sales increased to P
=34.600 billion in fiscal 2008, or 25.3% from P
=27.617
billion reported in fiscal 2007. This was due to increase in sales volume and costs of major raw
materials like whey powder, palm olein, skimmed milk, wheat, corn grain, coffee bean, ,refined sugar,
soya as well as bunker fuel and diesel.
URC’s gross profit for fiscal 2008 amounted to =
P10.855 billion, 7.4% up from =
P10.103 billion
recorded in fiscal 2007 despite the drop in average gross margin to 23.9% from 26.8% last year.
URC’s selling and distribution costs, and general and administrative expenses consist primarily of
compensation benefits, advertising and promotion costs, freight and other selling expenses,
depreciation, repairs and maintenance expenses and other administrative expenses. Selling and
distribution costs, and general and administrative expenses rose by =
P243 million or 3.5% to P
=7.166
billion in fiscal 2008 from P
=6.923 billion registered in fiscal 2007. This increase resulted primarily
from the following factors:
·
13.0% or =
P196 million increase in freight and handling expenses to =
P1.700 billion in fiscal
2008 from P
=1.504 billion in fiscal 2007. This was substantially due to increased sales volume
and freight rate charges associated with higher fuel prices and increase in trucking and
shipping costs.
·
8.0% or P
=186 million increase in advertising and promotion costs to P
=2.533 billion in fiscal
2008 from P
=2.347 billion in fiscal 2007 to support the new SKUs launched and boost up sales
of existing products in light of increasing market competition.
·
7.8% or P
=104 million decrease in personnel related expenses due to pension income resulting
from net actuarial gain recognized during the year.
As a result of the above factors, income after selling and distribution costs, and general and
administrative expenses increased by 16.0% to =
P3.688 billion in fiscal 2008 from =
P3.180 billion in
fiscal 2007. URC’s income after selling and distributions costs, and general and administrative
expenses by segment was as follows:
·
Income after selling and distributions costs and general and administrative expenses in URC’s
branded consumer foods segment, excluding packaging division, increased by =
P328 million to
=1.703 billion in fiscal 2008 from =
P
P1.375 billion in fiscal 2007. URC’s domestic operations
went up by 9.0% to =
P2.020 billion in fiscal 2008 from =
P1.853 billion in fiscal 2007 due to
rising input costs which were partially offset by price increases. International operations
posted a P
=316 million loss, lower than =
P477 million loss incurred last year. In US dollar
amount, international operations posted a loss after selling and distributions costs and general
``- 17 and administrative expenses of US$7.3 million, a 27.0% decrease from US$10.0 million loss
last year. The losses were primarily due to rising raw material cost and sales mix. Also,
Vietnam’s gross profit is still not yet maximized.
Loss after selling and distribution costs and general and administrative expenses in URC’s
packaging division went down by 85.4% from P
=126 million in fiscal 2007 to P
=18 million
in fiscal 2008 due to increased volume and better pricing.
·
Income after selling and distribution costs and general and administrative expenses in URC’s
agro-industrial segment declined by =
P479 million to P
=218 million in fiscal 2008 from P
=697
million in fiscal 2007 due to rising input costs which were not fully covered by selling price
adjustments. Sales of higher-margin feed products have suffered due to lower hogs and
poultry supply in the country.
·
Income after selling and distribution costs and general and administrative expenses in URC’s
commodity foods segment went up by P
=552 million to P
=1.785 billion in fiscal 2008 from
=1.233 billion in fiscal 2007. The flour division registered a 80.9% growth due to improved
P
operational efficiencies as well as bookings of lower wheat inventory costs and higher selling
prices. Growth in income after selling and distributions costs and general and administrative
expenses in sugar division of 27.1% was tempered by higher depreciation costs SONEDCO
mill expansion, lower tolling revenues and higher production costs due to delay in milling
early this year which was offset by more favorable prices in the middle of the year.
Market valuation loss on financial instruments at fair value through profit or loss of P
=2.264 billion was
reported in fiscal 2008 against =
P452 million market valuation gain in fiscal 2007. This was due to
significant dropped in market values of both bond investments and equity securities as a result of
global financial crisis.
URC’s finance costs consist primarily of interest expense which decreased by 21.4%, to P
=1.274
billion in fiscal 2008 from P
=1.621 billion posted in fiscal 2007 due to payment of URC Notes due
2008 and amortization of other long-term debts
URC’s finance revenue consists of interest income from investment in financial instruments, money
market placements, savings and dollar deposits and dividend income on investment in equity
securities. Finance revenue decreased by 31.5% to =
P1.070 billion in fiscal 2008 from =
P1.562 billion in
fiscal 2007 due to lower amount of investment in financial assets and money placements.
Impairment loss was reported at =
P299 million, 13.3% decrease from =
P345 million last year due to no
impairment provision on property, plant and equipment this year.
Foreign exchange loss-net was reported at P
=424 million, 66.0% increase from =
P255 million last year
due to depreciation of Philippine peso vis-à-vis US dollar.
Gain on sale of investment in fiscal 2007 represents gain on sale of equity investment in Robinsons
Land Corporation (RLC).
Equity in net income of an associate and a joint venture amounted to P
=28 million, up by 21.0% due to
higher net income of Hunt-Universal Robina Corporation for this year compared to last year.
``- 18 Other revenue (expenses) - net consists of rental income, gain on sale of fixed assets, loss on sale of
investments and other miscellaneous income. Other revenues (expenses) – net decreased by 114.6%
from P
=98 million other revenues – net in fiscal 2007 to P
=14 million other expenses -net in fiscal 2008
due to loss on investments.
URC recognized a provision for income tax in fiscal 2008 of P
=171 million, 62.3% decline from =
P452
million in fiscal 2007 due to lower taxable income this year and decrease in provision for deferred
income tax due to deferred tax on foreign exchange loss.
Minority interest represents primarily the share in net loss (income) attributable to minority
shareholders of the following subsidiaries of URC: URC International, URC’s direct subisidiary in
which it holds approximately 77.0% economic interest and Nissin-Universal Robina Corporation
(“Nissin-URC”), URC’s 65.0%-owned subsidiary. Minority interests in net loss of subsidiaries
decreased from P
=56 million in fiscal 2007 to P
=40 million in fiscal 2008 due to lower net loss of URC
International and higher net income of NURC.
Net income attributable to equity holders of the parent decreased by =
P5.176 billion or 93.1% to =
P381
million in fiscal 2008 from =
P5.557 billion in fiscal 2007 as a result of the factors discussed above.
Core earnings before tax ( operating profit after equity earnings , net of finance costs and other
expenses- net) increased by 7.9% to P
=3.499 billion in fiscal 2008 from P
=3.243 in fiscal 2007.
URC generated an EBITDA (operating income plus depreciation and amortization) of P
=6.382 billion
in fiscal year 2008, 16.7% higher than =
P5.468 billion in fiscal 2007.
The Company will continue to expand its regional operations and domestically firm up its leadership
in its core categories and has again set an aggressive target on the ensuing year to maintain its
dominance in the Philippine market as well as in the ASEAN regional market.
The Company is not aware of any material off-balance sheet transactions, arrangements and
obligations (including contingent obligations), and other relationship of the Company with
unconsolidated entities or other persons created during the reporting period that would have a
significant impact on the Company’s operations and/or financial condition.
Fiscal Year 2007 Compare to Fiscal Year 2006
URC posted a consolidated sale of goods and services of =
P37.720 billion for the fiscal year ended
September 30, 2007, a 7.2% increase over last year. The principal reasons for this increase were as
follows:
·
Sale of goods and services in URC’s branded consumer foods segment, including the
packaging division, increased by P1.774 billion, or 6.7%, to P28.370 billion in fiscal 2007
from P26.597 billion recorded in fiscal 2006. This increase was primarily due to the 12.6 %
increase in net sales of URC ‘s domestic operations coming mostly from the impressive
growth in sales of beverage and snack foods. Beverage continued its strong growth posting
49.7% growth in sales value primarily driven by its tea and coffee products . Revenue was
also pushed up by new products like Natures Harvest and the new water business ( Hidden
Spring and Nestle Purelife). Snackfoods, on the other hand, posted an 8.0% growth on
savory snacks, candies, chocolates, biscuits and bakery sales increases due to recovery in
``- 19 domestic consumption and election spending. Net sales in URC’s International operation in
US dollar term rose by 1.0% from US$ 148 million in fiscal 2006 to US$150 million in
fiscal 2007. However, in terms of Philippine Peso, net sales of URC International
operation was down 7.6% due to the appreciation in value of Philippine peso vis -a- vis US
dollar.
·
Sale of goods and services in URC’s agro-industrial segment amounted to P5.648 billion in
fiscal 2007, an increase of P565 million or 11.2% from P 5.083 billion recorded in fiscal 2006.
The increase was substantially driven by URC’s animal feeds business, which reported an
increase of 19.3% to P 2.637 billion in fiscal 2007 from P2.209 billion recorded in fiscal 2006
as a result of higher sales volume of feeds. The major driver for the favorable result is the
continuous success of its Uno and Stargain hog feeds in terms of market coverage and
positive feedback on marketing undertakings in establishing brand equity. Farm business
grew 4.8% due largely to exceptional performance of poultry business, higher selling prices
this year and steady hog volumes.
·
Sale of goods and services in URC’s commodity foods segment increased by P198 million, or
5.6%, to P3.702 billion in fiscal 2007 from P3.504 billion recorded in fiscal 2006. The
principal reason was the increased net sales from URC’s sugar business by 33.8% driven by
the increased volume this year.
URC’s cost of sales consist primarily of raw and packaging materials costs, direct labor costs and
overhead. Costs of sales increased by P1.257 billion, or 4.7%, to P 27.617 billion in fiscal 2007 from
P26.360 billion recorded in fiscal 2006. This increase was due mainly to higher costs for major raw
and packaging materials used in snacks, candies, chocolates, biscuits and flour products, such as
wheat , potatoes, coffee beans, and major raw materials for animal feeds such as soya and for our
BOPP films and flexible packaging such as resin. The increased cost of raw materials reflected the
general increase in many commodity prices during this period while the increased cost of packaging
materials reflected the increased price of many oil-based products during this period.
URC’s gross profit increased by P1.280 billion, or 14.5%, to P10.103 billion in fiscal 2007 from
P8.823 billion recorded in fiscal 2006. URC’s gross profit as a percentage of net sales grew by 2
percentage points to 27% in fiscal 2007 from 25% in fiscal 2006.
URC’s selling and distribution costs, and general and administrative expenses consist primarily of
compensation benefits, advertising and promotion costs, freight and other selling expenses,
depreciation, repairs and maintenance expenses and other administrative expenses. Selling and
distribution costs, and general and administrative expenses increased by P800 million or 13.1% to
P6.923 billion in fiscal 2007 from P6.123 billion recorded in fiscal 2006. This increase resulted
primarily from the following factors:
·
increase in freight and other selling expenses by P164 million, or 8.8%, to P2.038 billion in
fiscal 2007 from P1.874 billion recorded in fiscal 2006 due to increased sales volume and
freight rate charges associated with higher fuel prices and increase in trucking and shipping
cost
``- 20 ·
increase in non–manufacturing personnel expenses by 27.0% to P1.338 billion in fiscal
2007 from P1.054 billion in fiscal 2006 due to annual salary adjustment given in May 2007
and accrual of retirement benefits.
As a result of the above factors, income after selling and distribution costs, and general and
administrative expenses increased by P479 million, or 17.7% to P3.180 billion in fiscal 2007 from
P2.701 billion recorded in fiscal 2006. URC’s income after selling and distribution costs and general
and administrative expenses by segment was as follows:
·
Income after selling and distribution costs and general and administrative expenses in
URC’s branded consumer foods segment, including the packaging division, increased by P224
million to P1.250 billion in fiscal 2007 from P1.025 billion in fiscal 2006. Income after
selling and distribution and general and administrative expenses from domestic operations
went up by 9.5% to P1.727 billion in fiscal 2007 from P1.576 billion in fiscal 2006. This
was primarily driven by better margins of major categories as a result of price increases
instituted in the second half of the fiscal year. Moreover, URC’s international operations
posted a P477 million loss, lower than P551 million loss incurred in fiscal 2006. This was
attributed to significantly lower operating losses posted by China operations due to cost
rationalization efforts.
·
Income after selling and distribution costs and general and administrative expenses in URC’s
agro-industrial segment increased by P39 million or 6.0% to P697 million in fiscal 2007 from
P658 million in fiscal 2006 due to improved sales volume of animal feed business and
better pricing on hogs and poultry products as well as lower mortality this year versus last
year.
·
Income after selling and distribution costs and general and administrative expenses in URC’s
commodity foods segment increased by P215 million, or 21.2%, to P1.233 billion in fiscal
2007 from P1.018 billion in fiscal 2006. This was due to increase in sales volume of sugar
and better pricing and efficient production of flour products.
Gain on sale of investments represents gain on sale of equity investment in RLC shares.
URC’s finance revenue consists of interest income from investment in financial instrument and
dividend income on investment in equity securities. Finance revenue decreased by 32.6% to
P1.562 billion in fiscal 2007 from P2.320 billion in fiscal 2006 due to lower portfolio investment in
bonds.
URC’s market valuation gain on financial instruments at fair value through profit or loss represents
increase in market value of equity securities offsetting the decrease in market value of investment in
bonds.
URC’s principal investments accounted for under the equity method was in Hunt Universal Robina
Corporation (“Hunt-URC”) (its joint venture). Equity in net income of an associate and a joint venture
dropped to P23 million in fiscal 2007 from P320 million recorded in fiscal 2006 due to sale of equity
investment in RLC shares in October 2006.
``- 21 Finance costs consist mainly of interest expense which decreased by 28.6%, to P1.621 billion in fiscal
2007 from P2.272 billion recorded in fiscal 2006 due to retirement of URC06 notes and payment of
loans.
Impairment loss represents loss provision on receivables and BOPP fixed assets.
URC’s foreign exchange loss - net in fiscal 2007 represents loss on account of appreciation of
Philippine Peso vis -a- vis US dollar.
Other revenue (expenses) - net represents rental income, gain on sale of investment and fixed assets. In
fiscal 2006, URC posted other expenses - net due to amortization of premium on bond investment.
URC recognized a provision from income tax in fiscal 2007 of P452 million, an increase of 18.3%
from P382 million in fiscal 2006. This was attributed to higher taxable income this year and increase
in provision for deferred income tax due to recognition of foreign exchange gain as a result of the
appreciation of Philippine peso vis- a- vis US dollar.
Minority interest represents primarily the share in net loss (income) attributable to minority
shareholders of the following subsidiaries of URC: URC International, URC’s direct subsidiary in
which it holds approximately a 77.0% economic interest and Nissin-Universal Robina Corporation
(“Nissin-URC”), URC’s 65.0%-owned subsidiary. Minority interests in net loss of subsidiaries went
down from P108 million recorded in fiscal 2006 to P56 million in fiscal 2007 due to higher net
income of NUR which partially offset the lower net loss of URC International.
Net income attributable to equity holders of the parent increased by P2.538 billion, or 84.1%, to
P5.557 billion in fiscal 2007 from P3.019 billion in fiscal 2006 as a result of the factors discussed
above.
URC generated an EBITDA (operating income plus depreciation and amortization) of P5.468 billion
for the current fiscal year 2007, 16.4% higher than P
=4.696 billion it had in fiscal year 2006.
The Company will continue to expand its regional operations and domestically firm up its leadership
in its core categories and has again set an aggressive target on the ensuing year to maintain its
dominance in the Philippine market as well as in the ASEAN regional market.
The Company is not aware of any material off-balance sheet transactions, arrangements, and
obligations (including contingent obligations), and other relationship of the Company with
unconsolidated entities or other persons created during the reporting period that would have a
significant impact on the Company’s operations and/or financial condition.
Fiscal Year 2006 Compare to Fiscal Year 2005
URC posted a consolidated net sales and services of =
P35.184 billion for the fiscal year ended
September 30, 2006, a 12.8% increase over the same period last year. The principal reasons for this
increase were as follows:
·
Sale of goods and services in URC’s branded consumer foods segment, including the
packaging division, increased by P2.813 billion, or 11.8%, to P26.596 billion in fiscal 2006
``- 22 from P23.783 billion recorded in fiscal 2005. This increase was primarily due to an 11.4 %
increase in net sales of URC‘s international operations and 12.0% increase in net sales from
URC’s domestic operations. The increase in URC’s domestic branded consumer foods
substantially came from the tremendous growth in sales of beverage products like coffee and
tea. Sales of its other core product categories like snacks, candies and chocolates have also
shown favorable sales performances.
·
Sale of goods and services in URC’s agro-industrial segment amounted to P5.082 billion in
fiscal 2006, an increase of P868 million or 20.6% from P 4.214 billion recorded in fiscal
2005. The increase was substantially driven by URC’s animal feeds business, which reported
an increase in net sales of 40.9% to P 2.210 billion in fiscal 2006 from P1.569 billion recorded
in fiscal 2005 as a result of higher sales volume of feeds. The major driver for the favorable
result is the continuous success of its Uno and Stargain hog feeds in terms of market coverage
and positive feedback on marketing undertakings to establish brand equity. Likewise,
livestock business improved its revenue by 8.6% due to higher sales volume for both piggery
and poultry products.
·
Sale of goods and services in URC’s commodity foods segment increased by P303 million, or
9.5%, to P3.504 billion in fiscal 2006 from P3.201 billion recorded in fiscal 2005. The
principal reason was the increased net sales from URC’s sugar business by 24.9% due mainly
to higher selling prices this year. Flour business increased by P130 million or 5.2% to P 2.634
billion in fiscal 2006 from P 2.504 billion in fiscal 2005.
URC’s cost of sales consists primarily of raw and packaging materials costs, direct labor costs and
overhead. Cost of sales increased by P3.052 billion, or 13.1%, to P26.360 billion in fiscal 2006 from
P23.307 billion recorded in fiscal 2005. This increase was due mainly to higher costs for major raw
and packaging materials used in snacks, candies, chocolates, biscuits and flour products, such as wheat
, potatoes, coffee beans, and major raw materials for animal feeds such as soya and for our BOPP
films such as resin. The increased cost of raw materials reflected the general increase in many
commodity prices during this period while the increased cost of packaging materials reflected the
increased price of many oil-based products during this period.
URC’s gross profit increased by P932 million, or 11.8%, to P8.824 billion in fiscal 2006 from P7.891
billion recorded in fiscal 2005. URC’s gross profit as a percentage of net sales remains flat at 25% .
URC’s selling and distribution costs and general and administrative expenses consist primarily of
salaries, wages and other staff costs, advertising and promotion costs, freight and other selling
expenses, depreciation, repairs and maintenance expenses and other administrative expenses. Selling
and distribution and general and administrative expenses increased by P893 million, or 17.1%, to
P6.123 billion in fiscal 2006 from P5.230 billion recorded in fiscal 2005. This increase resulted
primarily from the following factors:
·
an increase in freight and other selling expenses by P421 million, or 28.9%, to P1.874 billion
in fiscal 2006 from P1.453 billion recorded in fiscal 2005 due to increased sales volume and
freight rate charges associated with higher fuel prices;
``- 23 ·
increased advertising and promotion costs by 27.7% both from URC’s domestic and
international operations due to new products launched this year and support for Jack and Jill
Mega branding.
As a result of the above factors, income after selling and distribution costs and general and
administrative expenses increased by P40 million, or 1.5% to P2.701 billion in fiscal 2006 from
P2.661 billion recorded in fiscal 2005. URC’s income after selling and distribution costs and general
and administrative expenses by segment was as follows:
·
Income after selling and distribution costs and general and administrative expenses in URC’s
branded consumer foods segment, including the packaging division, decreased by P162
million to P1.025 billion in fiscal 2006 from P1.187 billion in fiscal 2005. Though income
after selling and distribution costs and general and administrative expenses from domestic
operations went up by 2.6% to P1.576 billion in fiscal 2006 from P1.536 billion in fiscal 2005,
this was trimmed down by operating losses incurred by URC’s international operations which
increased to P551 million in fiscal 2006 from P349 million in fiscal 2005. Increased
operating losses in international operations were primarily a result of higher cost for
manpower, advertising and promotional expenses and freight and handling.
·
Income after selling and distribution costs and general and administrative expenses in URC’s
agro-industrial segment increased by P140 million or 26.8% to P659 million in fiscal 2006
from P519 million in fiscal 2005 due to improved sales volume of animal feeds business and
favorable gross margin.
·
Income after selling and distribution costs and general and administrative expenses in
URC’s commodity foods segment increased by P64 million, or 6.7%, to P1.019 billion in
fiscal 2006 from P955 million in fiscal 2005 due to increased net sales of sugar which was
principally driven by the increase in average selling price.
URC’s market valuation gain on financial instruments at fair value through profit or loss represents
increase in market value of investments in bonds and securities.
URC’s foreign exchange loss in fiscal 2006 represents loss on account of appreciation of Philippine
Pesos vis-a- vis US dollar.
URC’s finance revenue consists of investment in financial instrument and dividend income on
investment in equity securities. Finance revenue increased by 21.5% to P2.320 billion in fiscal 2006
from P1.909 billion in fiscal 2005. The increase was due in part to additional interest earned from
investing a significant portion of the proceeds of the primary offering of the Company’s common
shares on February 14, 2006. In addition, URC received higher dividends in fiscal 2006 from its equity
security investments.
URC’s principal investments accounted for under the equity method were: Hunt Universal Robina
Corporation (“Hunt-URC”) (its joint venture) and Robinsons Land Corporation. Equity in net income
of an associate and a joint venture increased to P320 million in fiscal 2006 from P245 million
recorded in fiscal 2005 due mainly to higher equity in net earnings from investment in Robinsons
Land Corporation as a result of higher income of Robinsons Land Corporation.
``- 24 Finance costs consist mainly of interest expense which increased by 7.4%, to P2.271 billion in fiscal
2006 from P2.115 billion recorded in fiscal 2005 due primarily to the additional interest payable on
the U.S.$200 million guaranteed notes issued in January 2005 and bank loans obtained in fiscal 2006.
Impairment loss represents impairment of the goodwill allocated to China subsidiaries amounting to
P241 million.
Other revenue (expenses) - net consists of, among others, loss on bond investments, severance pay and
other expenses. In fiscal 2006, URC had other charges -net of P156 million, lower by 36.8% from
P247 million other expenses - net recorded fiscal 2005.
URC recognized a provision from income tax in fiscal 2006 of P382 million, a decrease of 22.5%
from P493 million in fiscal 2005. The decrease in provision for current income tax was mainly due to
lower taxable income resulting from availment of income tax holiday incentive by a certain subsidiary.
The decrease in provisioning for deferred income tax was due to lower unrealized foreign exchange
gain recognized.
Minority interest represents primarily the share in net loss (income) attributable to minority
shareholders of the following subsidiaries of URC: URC International, URC’s direct subsidiary in
which it holds approximately a 77.0% economic interest and Nissin-Universal Robina Corporation
(“Nissin-URC”), URC’s 65.0%-owned subsidiary. Minority interests in net loss of subsidiaries went
down from P125 million recorded in fiscal 2005 to P108 million in fiscal 2006 due to higher net
income of NUR which partially offset the increase in net loss of URC International.
Net income attributable to equity holders of the parent increased by P493 million, or 19.5%, to
P3.019 billion in fiscal 2006 from P2.526 billion in fiscal 2005 as a result of the factors discussed
above.
URC generated an EBITDA ( operating income plus depreciation and amortization) of P4.696 billion
for the current fiscal year 2006, 8.5% more than =
P4.327 billion it had in fiscal 2005.
The Company will continue to expand its regional operations and domestically firm up its leadership
in its core categories and has again set an aggressive target on the ensuing year to maintain its
dominance in the Philippine market as well as in the ASEAN regional market.
The Company is not aware of any material off-balance sheet transactions, arrangements, and
obligations (including contingent obligations), and other relationship of the Company with
unconsolidated entities or other persons created during the reporting period that would have a
significant impact on the Company’s operations and/or financial condition.
Financial Condition
URC’s financial position remained strong. The Company has a current ratio of 1.4:1 as of September
30, 2008 lower than the 2.3:1 as of September 30, 2007 due to reclassification of certain financial
assets from current assets to non-current assets. Financial debt to equity ratio of 0.64:1 as of
September 30, 2008 is within comfortable level.
Total assets amounted to P
=57.931 billion as of fiscal 2008, lower than P
=59.834 billion as of fiscal
2007. Book value per share decreased to P
=14.65 as of September 30, 2008 from =
P15.44 as of
``- 25 September 30, 2007 due to payment of cash dividends during the year. Total outstanding common
shares decreased by 72 million shares, to 2.150 billion shares as of fiscal 2008 from 2.222 billion
shares as of fiscal 2007. This was due to buy-back program approved and implemented by the URC’s
board of directors on November 13, 2007.
The Company’s cash requirements have been sourced through cash flow from operations. The net cash
flow provided by operating activities for the fiscal year ended September 30, 2008 amounted to
=5.580 billion. Net cash used in investing activities amounted to =
P
P4.887 billion substantially coming
from capital expenditures of =
P4.744 billion which was partially offset by proceeds from sale of
financial assets. On the other hand, net cash used in financing activities amounted to =
P3.522 billion
which was mainly used to pay matured URC 2008 Notes, amortization of other long-term debts,
dividend payment and acquisition of Company’s shares, net of short-term borrowings.
The capital expenditures amounting to P
=4.744 billion represents the acquisition of Granny Goose
snacks line and PASSI sugar mills and expansion of SONDECO mills in Negros and beverage lines
in Indonesia and Vietnam.
The Company budgeted about =
P3.837 billion for capital expenditures (including maintenance
capex)and investment in fiscal 2009 which substantially consists of the following:
·
P2.705 billion for continued expansion of the branded consumer foods segment operations
=
primarily snack production facilities in the Philippines and beverage production facilities in
Thailand and Vietnam.
·
=520 million for sugar group for continued mill expansion.
P
·
P365 million for agro-industrial group consisting mainly of farm expansion and bulk handling
=
facility for feeds division.
No assurance can be given that the Company’s capital expenditures plan will not change or that the
amount of capital expenditures for any project or as a whole will not change in future years from
current expectations.
As of September 30, 2008, the Company is not aware of any events that will trigger direct or
contingent financial obligation that is material to the Company, including any default or acceleration
of an obligation.
``- 26 Material Changes in the 2008 Financial Statements
(Increase/Decrease of 5% or more versus 2007)
Income statements – Year ended September 30, 2008 versus Year ended September 30, 2007
20.5% increase in sale of goods and services was due to the following:
Sale of goods and services in URC’s branded consumer foods segment (BCFG), excluding packaging
P27.329 billion
division, increased by =
P5.935 billion, or 21.7%, to P33.264 billion in fiscal 2008 from =
registered in fiscal 2007. BCFG’s domestic operations posted a 19.2% increase in net sales which was
largely driven by the strong performance of its snackfoods which grew by 22.7% on account of
growth in sales volume as a result of snack and biscuit sales force split and price increases in some
categories. The launch of 89 SKU’s during the year which contributed about 4% of the total sales
and acquisition of Granny Goose snacks line also helped boost sales in fiscal 2008. Beverage business
sales grew by 8.4% due to higher coffee sales which compensated for the flat sales of C2 due to
increased competition. Grocery products sales likewise improved 23.0% with the strong inroads of
noodles against its competitors. BCFG’s international sales increased by 28.9% to P
=9.269 billion
against last year due to higher revenues from Vietnam, Thailand, Malaysia and China operations. In
US dollar amount, sales registered an increase of 43.3% from US$150 million recorded in fiscal 2007
to US$215 million registered in fiscal 2008. Vietnam posted a phenomenal sales growth due to
surging C2 sales volume coupled by price increases.
Sale of goods and services of BCFG (excluding packaging division) accounted for 73.2% of
total URC consolidated sale of goods and services for fiscal 2008.
Sale of goods and services in URC’s packaging division rose to =
P1.499 billion in fiscal 2008 or up
44.0% from =
P1.041 billion reported last year due to increase in sales volume and prices.
Sale of goods and services in URC’s agro-industrial segment (AIG) aggregated to P
=5.570 billion in
fiscal 2008, slightly lower from P
=5.648 billion recorded in fiscal 2007. URC’s animal feed business
grew by 5.0% to =
P2.768 billion on the back of higher prices, however, volumes dropped as hog and
poultry raisers nationwide contended with rising feed costs. Farms business declined by 7.0% to P
=
2.802 billion from =
P3.012 billion last year due to 8.2% decline in sales volume caused by an influx of
cheap imported meat.
Sale of goods and services in URC’s commodity foods segment amounted to =
P5.121 billion in fiscal
2008 or up 38.3% from =
P3.702 billion reported in fiscal 2007. Flour net sales went up by 30.9% to P
=
3.320 billion from =
P2.537 billion posted last year on the back of numerous price increases to offset
higher wheat costs worldwide. Moreover, sugar net sales increased by 54.6% to =
P1.801 billion from =
P
1.165 billion recorded last year as a result of higher sales volume due to acquisition earlier this year of
PASSI sugar milling and increased production volume in two Negros mills.
25.3% Increase in cost of sales
Due to increase in sales volume sold and rising cost of major raw materials, as well as bunker fuel and
diesel this year.
``- 27 9.7% Increase in selling and distribution costs
Substantially due to increase in advertising and promotion costs, and freight and other selling
expenses.
601.1% Decrease in market valuation gain (loss) on financial instruments at fair value through profit
or loss
Due to significant decrease in market values of both bond investments and equity securities as a result
of global financial crisis.
14.0% Decrease in general and administrative expenses
Due to lower compensation and benefits, depreciation expense and other administrative expenses.
21.4% Decrease in finance costs
Due to payment of matured long-term debt and amortization of other long-term debt
31.5% Decrease in finance revenue
Due to lower level of financial assets and money market placements.
13.3% Decrease in impairment loss
No impairment provision on property, plant and equipment this year.
66.0% Increase in foreign exchange loss - net
Due to depreciation of Philippine peso vis-à-vis US dollar.
Decrease in gain on sale of investment
No similar disposal was reported this year.
21.0% Increase in equity in net income of an associate and a joint venture
Due to higher equity share in net income of HUR.
114.6% Decrease in other revenues (expenses)- net
Due to loss on sale of investments.
62.3% Decrease in provision for income tax
Due to lower taxable income and decrease in provision for deferred income tax because of deferred tax
on unrealized foreign exchange loss.
28.8% Increase in minority interest
Due to decline in net loss of URC International and higher net income of NURC.
Balance sheets - September 30, 2008 versus September 30, 2007
56.1% Decrease in cash and cash equivalents
Due to decrease in money market placements which were used to pay the remaining URC 08 notes.
63.9% Decrease in financial assets at fair value through profit or loss
Due to disposal and decline in market values of bond investments and equities and the reclassification
made to available- for- sale in accordance with the amendments of PAS 39.
``- 28 6.8% Increase in receivables-net
Due to increase in trade receivables.
31.7% Increase in inventories
Due to increase in inventory levels specifically raw materials and finished goods to meet production
and sales requirements and increase in costs of raw materials.
72.4% Increase in other current assets
Due to increase input tax and prepaid expenses.
Assets of disposal group classified as held for sales
Represents assets of Tianjin Pacific Foods Manufacturing Co.Ltd.
9.8% Increase in property, plant and equipment
Due to acquisition of PASSI properties and GMC machineries and expansions in branded consumer
foods, sugar mill and refinery and farms .
100.0% Increase in available- for- sale investments
Due to reclassification of financial assets from financial assets through fair value profit or loss to
available for sale in accordance with the amendments of PAS 39.
37.4% Increase in biological assets
Due to expansion of breeder stock and increase in market value of hogs.
42.3% Increase in intangible assets
Due to acquisition of trademark and product formulation.
163.5% Increase in net pension assets
Due to actuarial gain recognized this year.
25.0% Increase in other noncurrent assets
Due to increase in deferred charges.
78.6% Increase in short-term debt
Due to short-term bank loans obtained during the year to meet working capital requirements.
12.2% Increase in accounts payable and other accrued liabilities
Due to increase in trade payables.
678.9% Increase in trust receipts and acceptance payable
Due to increase in importations of raw materials for branded, flour and feeds divisions.
82.6% Decrease in income tax payable
Due to lower taxable income, net of creditable withholding taxes.
33.0% Decrease in long term debt (including current portion)
Due to payment of matured URC 2008 notes and amortization of other long- term debts, net of
depreciation of the Philippine peso against US dollar.
``- 29 Liabilities directly associated with assets classified as held for sale
Represents payables of Tianjin Pacific Foods Manufacturing Co.,Ltd.
5.4% Decrease in Retained earnings
Due to payment of cash dividends .
5.7% Increase in cumulative translation adjustments
Due to depreciation in value of Philippine peso against US dollar.
Unrealized loss from available-for-sale investments
Represents decline in market value of bond investments classified as available-for-sale.
Treasury shares
Represents buy-back program implemented by management during the year
5.7% Decrease in equity attributable to minority interests
Due to decrease in net loss of URC international and higher income of NURC.
The Company’s key performance indicators are employed across all businesses. Comparisons are then
made against internal target and previous period’s performance. The Company and its significant
subsidiaries’ top five (5) key performance indicators are as follows: (in Million PhPs)
Universal Robina Corporation (Consolidated)
Revenues
EBIT
EBITDA
Net Income
Total Assets
FY 2008
45,455
3,688
6.382
341
57,931
FY 2007
37,720
3,180
5,468
5,501
58,834
Index
121
116
117
5
98
FY 2008
153
153
153
1,456
91
FY 2007
99
98
98
168
257
Index
155
156
156
868
36
Universal Robina (Cayman), Ltd.
Revenues
EBIT
EBITDA
Net Income
Total Assets
``- 30 URC Philippines, Limited
Revenues
EBIT
EBITDA
Net Income (loss)
Total Assets
FY 2008
(2,513)
12,359
FY 2007
(373)
17,373
Index
674
71
FY 2008
1,177
95
128
78
691
FY 2007
972
87
120
70
820
Index
121
105
109
107
84
Nissin – URC
Revenues
EBIT
EBITDA
Net Income
Total Assets
Majority of the above key performance indicators were within targeted levels.
Item 7.
Financial Statements
The consolidated financial statements and schedules listed in the accompanying Index to Financial
Statements and Supplementary Schedules (page 45) are filed as part of this Form 17-A (pages 46
to 150 ).
Item 8.
Changes in and Disagreements With Accountants on Accounting and Financial
Disclosure
None.
Item 9.
Independent Public Accountants and Audit Related Fees
Independent Public Accountants
The Corporation’s independent public accountant is the accounting firm of the Sycip, Gorres, Velayo
& Co. The same accounting firm is tabled for reappointment for the current year at the annual meeting
of stockholders. The representatives of the principal accountant have always been present at prior
year’s meetings and are expected to be present at the current year’s annual meeting of stockholders.
They may also make a statement and respond to appropriate questions with respect to matters for
which their services were engaged.
The current handling partner of SGV & Co. has been engaged by the Corporation for fiscal year 2008
and is expected to be rotated every five (5) years.
``- 31 Audit-Related Fees
The following table sets out the aggregate fees billed for each of the last three fiscal years for
professional services rendered by Sycip, Gorres Velayo & Co.
Fiscal Year 2006 Fiscal Year 2007 Fiscal Year 2008
( In pesos)
__________________________________________________________________________________
Audit and Audit-Related Fees
P9,651,000
P4,651,000
P5,117,000
Fees for services that are normally provided
by the external auditor in connection with
statutory and regulatory filings or engagements
Professional fees for due diligence review for
Bond/shares offering
Tax Fees
Other Fees
Total
4,651,000
4,651,000
5,117,000
5,000,000
none
none
P9,651,000
none
none
none
P4,651,000
P5,117,000
PART III - CONTROL AND COMPENSATION INFORMATION
Item 10.
Directors and Executive Officers of the Registrant
Name
Age
Position
Citizenship
John L. Gokongwei, Jr.................................
82
Director, Chairman Emeritus
Filipino
James L. Go................................
Director, Chairman and Chief Executive
Officer
Filipino
Lance Y. Gokongwei ................................
41
Director, President and Chief Operating
Officer
Filipino
Patrick Henry C. Go ................................
38
Director, Vice President
Filipino
Frederick D. Go ................................39
Director
Filipino
Johnson Robert G. Go, Jr.................................
43
Director
Filipino
Robert G. Coyiuto, Jr. ................................
57
Director
Filipino
Wilfrido E. Sanchez................................
71
Independent Director
Filipino
Pascual S. Guerzon ................................
71
Independent Director
Filipino
69
61
Executive Vice President
Bienvenido S. Bautista ................................
Patrick O. Ng................................
64
Executive Vice President
Filipino
Singaporean
``- 32 Name
Age
Position
Citizenship
Eugenie M.L. Villena................................
60
Senior Vice President — Chief Financial
Officer
Filipino
Constante T. Santos ................................
60
Filipino
Senior Vice President — Corporate
Controller
Bach Johann M. Sebastian ................................
47
Senior Vice President — Corporate Planning
Filipino
Geraldo N. Florencio ................................
56
First Vice President — Controller
Filipino
Jeanette U. Yu................................ 55
Vice President
Filipino
Ester T. Ang................................
Vice President – Treasurer
Filipino
Corporate Secretary
Filipino
50
Rosalinda F. Rivera................................
38
All of the above directors have served their respective offices since April 17, 2008. There are no other
directors who resigned or declined to stand for re-election to the board of directors since the date of
the last annual meeting of stockholders for any reason whatsoever.
Messrs. Wilfrido E. Sanchez and Pascual S. Guerzon are the independent directors of the
Corporation.
A brief description of the directors and executive officers’ business experience and other
directorships held in other reporting companies are provided as follows:
John L. Gokongwei, Jr. founded URC in 1954 and has been the Chairman Emeritus of URC effective
January 1, 2002. He had been Chairman of the Board of Directors until his retirement and resignation
from this position effective December 31, 2001. He continues to be a member of URC’s Board and is
the Chairman Emeritus of JG Summit and certain of its subsidiaries. He also continues to be a member
of the Executive Committee of JG Summit. He is currently the Chairman of the Gokongwei Brothers
Foundation, Inc., Deputy Chairman and Director of United Industrial Corporation, Ltd. and Singapore
Land, Ltd., and a director of JG Summit Capital Markets Corporation, Digital Telecommunications
Phils., Inc., Oriental Petroleum and Minerals Corporation, First Private Power Corporation and
Bauang Private Power Corporation. He is also a non-executive director of A. Soriano Corporation. Mr.
Gokongwei received a Master’s degree in Business Administration from the De La Salle University
and attended the Advanced Management Program at Harvard Business School.
James L. Go is the Chairman and Chief Executive Officer of URC. He had been President and Chief
Executive Officer and was elected to his current position effective January 1, 2002. He is also the
Chairman and Chief Executive Officer of JG Summit and as such, he heads the Executive Committee
of JG Summit. He is currently the Chairman and Chief Executive Officer of Robinsons Land
Corporation (“RLC”), JG Summit Petrochemical Corporation, CFC Corporation, Robinsons, Inc., and
Oriental Petroleum and Minerals Corporation (“OPMC”). He is also the President and a Trustee of the
Gokongwei Brothers Foundation, Inc. and the Vice Chairman, President and Chief Executive Officer
of Digital Telecommunications Phils., Inc. effective May 28, 2007. He is also a director of First
Private Power Corporation, Bauang Private Power Corporation, Cebu Air, Inc., Panay Electric Co.,
``- 33 United Industrial Corp., Ltd., Singapore Land, Ltd., Marina Center Holdings, Inc. and JG Summit
Capital Markets Corporation. He received a Bachelor of Science degree and a Master of Science
degree in Chemical Engineering from the Massachusetts Institute of Technology. Mr. James L. Go is a
brother of Mr. John Gokongwei, Jr. and joined URC in 1964.
Lance Y. Gokongwei is the President and Chief Operating Officer of URC. He had been Executive
Vice President and was elected President and Chief Operating Officer effective January 1, 2002. He is
the President and Chief Operating Officer of JG Summit Holdings, Inc. and JG Summit Petrochemical
Corporation and the Vice Chairman and Deputy Chief Executive Officer of Robinsons Land
Corporation. He is also the President and Chief Executive Officer of Cebu Air, Inc., Chairman of
Robinsons Savings Bank, Vice Chairman of JG Summit Capital Markets Corporation, and a director
of Digital Telecommunications Phils., Inc., OPMC, United Industrial Corporation, Ltd., and
Singapore Land, Ltd. He is also trustee, secretary and treasurer of Gokongwei Brothers Foundation,
Inc. He received a Bachelor of Science degree in Economics and a Bachelor of Science degree in
Applied Science from the University of Pennsylvania. Mr. Lance Y. Gokongwei is the son of Mr.
John Gokongwei, Jr. and joined URC in 1988.
Frederick D. Go has been a director of URC since June 2001. He is the President and Chief Operating
Officer of RLC. He is an alternate director of United Industrial Corporation Limited and Singapore
Land Limited. He is the President and director of Robinsons Recreation Corporation, Vice Chairman and
director of Robinsons Savings Bank, director of Cebu Air, Inc., Robinsons Handyman Inc., RobinsonsAbenson Appliance Corporation, Robinsons Convenience Stores, Inc., JG Summit Petrochemical
Corporation, Robinsons Distribution Center, Inc., CFC Corporation, North City Properties, Inc.,
Robinsons Ventures Corporation, Waltermart-Handyman, Inc., Handyman Express Mart, Inc., Cebu
Light Industrial Park, Philippine Hotels Federation and Philippine Retailers Association. He received a
Bachelor of Science degree in Management Engineering from the Ateneo de Manila University. Mr.
Frederick D. Go is Mr. John Gokongwei, Jr.’s nephew.
Patrick Henry C. Go is a director and Vice President of URC. He is also a director of JG Summit
Holdings, Inc., RLC, CFC Corporation, JG Cement Corporation, Robinsons Savings Bank and JG
Summit Petrochemical Corporation where he is also Business Unit General Manager. He is a trustee
of the Gokongwei Brothers Foundation, Inc. He received a Bachelor of Science degree in
Management from the Ateneo de Manila University and attended the General Manager Program at
Harvard Business School. Mr. Patrick Henry C. Go is a nephew of Mr. John Gokongwei, Jr.
Johnson Robert G. Go, Jr. was elected director of the Company on May 5, 2005. He is also a director
of Robinsons Land Corporation, Robinsons Savings Bank and CFC Corporation. He is also the President
of Robinsons Convenience Stores, Inc. He was elected director of JG Summit Holdings, Inc. on August
18, 2005 and was elected trustee of the Gokongwei Brothers Foundation, Inc. on September 1, 2005. He
received a Bachelor of Arts degree in Interdisciplinary Studies (Liberal Arts) from the Ateneo de Manila
University. He is a nephew of Mr. John Gokongwei, Jr.
Robert G. Coyiuto, Jr. - director of URC. He is the Chairman of Prudential Guarantee & Assurance,
Inc., PGA Cars, Inc., Nissan North Edsa, Pioneer Tours Corporation, Coyiuto Foundation, Calaca
High Power Corporation and Vice-Chairman of First Guarantee Life Assurance Company, Inc. He is
also the President and Chief Operating Officer of Oriental Petroleum and Minerals Corporation and
PGA Sompo Japan Insurance, Inc. He is the director of Canon Marketing (Philippines) Inc., Destiny
Financial Plans, Inc. and Interport Resources Corporation. He is the Sole Importer Principal of
Porsche and Audi, Nominee of R. Coyiuto Securities, Inc. and a Trustee of San Beda College.
``- 34 Wilfrido E. Sanchez has been an independent director of URC since 1995. He is also an independent
director of Kawasaki Motor Corp., NYK-TDG Maritime Academy, Magellan Capital Holdings
Corporation, Center for Leadership & Change, Inc., Omico Corporation, Amon Trading Corporation,
Mr. Sanchez is a director of Rizal Commercial Banking Corporation, EEI Corporation, Eton
Properties Philippines, Inc., Transnational Plans, Inc., Adventure International Tours, Inc.,
Transnational Diversified Group, Inc., Transnational Diversified Corporation, House of Investment,
Inc., Grepalife Asset Management Corporation, Grepalife Fixed Income Corporation and JVR
Foundation.
Pascual S. Guerzon was elected as an independent director of URC on September 20, 2007. He is
currently the Principal of Dean Guerzon & Associates (Business Development). He is the Founding
Dean of De La Salle Graduate School of Business. He was also the former President of the Management
Association of the Philippines Agribusiness and Countryside Development Foundation and the
Management Association of the Philippines Foundation, MBA Director of the Ateneo de Manila
Graduate School of Business, Director of Leverage International Consultants, Dep. Director of Asean
Chambers of Commerce and Industry and Section Chief of the Board of Investments. Mr. Guerzon is a
holder of an MBA in Finance from the University of the Philippines and a Ph.D. (N.D) in Management
from the University of Santo Tomas.
Bienvenido S. Bautista was appointed Executive Vice President of URC on April 1, 2004. He is also
Managing Director of the URC Branded Consumer Foods Group in the Philippines and Indonesia. He
is currently a director of Hunts Universal Robina Corporation and the President of Nissin Universal
Robina Corporation. Prior to joining URC, he was Chairman of Kraft Foods Philippines and Vice
President and Area Director of Kraft Foods International in South/Southeast Asia. He was formerly
President of San Miguel Brewing Philippines and of San Miguel Foods Group, President and General
Manager of Kraft General Foods Phil., Corporate Marketing Director of Wyeth Philippines, Inc.,
President and General Manager of PT Warner Lambert Indonesia, and National Sales Director Pharmaceuticals of Pfizer, Inc. In 2005 he was awarded the CEO Excel Award of Excellence by the
International Association of Business Communicators and in 2006 he was given the Executive of the
Year award by The Philippine Association of Secretaries and Administrative Professionals, Inc. He
was the first Asian and first Filipino to be appointed as Chair of the Jakarta International School
(1986-87) and in 1994 he was awarded the Agora Award for “Excellence in Marketing Management”
by the Philippine Marketing Association. Mr. Bautista received his degree of Bachelor of Science in
Economics from the Ateneo de Manila University. He received his Master’s degree in Business
Management from, and majored in Marketing and Finance at, the Ateneo Graduate School of
Business.
Bach Johann M. Sebastian is the Senior Vice President for Corporate Planning of URC effective
May 24, 2007. He is also the Senior Vice President and Head of Corporate Planning of JG Summit.
Prior to joining URC in 2002, he was Senior Vice President and Chief Corporate Strategist at PSI
Technologies and RFM Corporation. He was also Chief Economist, Director of the Policy and
Planning Group at the Department of Trade and Industry. He received a Bachelor of Arts in
Economics from the University of the Philippines and his Master in Business Management degree
from the Asian Institute of Management.
Constante T. Santos is the Senior Vice President — Corporate Controller of URC. He is also Senior
Vice President — Corporate Controller of JG Summit and RLC. Prior to joining URC in 1986, he
practiced public accounting with SyCip, Gorres, Velayo & Co. in the Philippines and Ernst &
``- 35 Whinney in the United States. He is a member of the Philippine Institute of Certified Public
Accountants. Mr. Santos received his Bachelor of Science degree in Business Administration from the
University of the East and attended the Management Development Program at the Asian Institute of
Management.
Patrick O. Ng is an Executive Vice President of URC. He is also managing director of URC
International Co. Ltd., URC Asean Brands Co. Limited, URC (Thailand) Co. Ltd., URC Snackfoods
(Malaysia) Sdn Bhd, URC Foods (Singapore) Pte. Ltd., URC Vietnam Co. Ltd., Hongkong China
Foods Co. Ltd., and a Director of PT URC Indonesia, URC Hong Kong Ltd., Panyu Peggy Foods Co.
Ltd., Shanghai Peggy Foods Co. Ltd. and Tianjin Pacific Foods Co. Ltd. Mr. Ng joined URC in 1967
and has held various positions in the JG Group including as Vice President of URC, CFC Corporation
and Litton Mills, Inc. He received a Bachelor of Science degree in Engineering from the Ateneo de
Manila University.
Geraldo N. Florencio is the First Vice President - Controller of URC. Prior to joining URC in 1992,
he practiced public accounting with SyCip, Gorres, Velayo & Co. in the Philippines. He is a member
of the Philippine Institute of Certified Public Accountants. Mr. Florencio received a Bachelor of
Science degree in Business Administration from the Philippine School of Business Administration.
He also attended the Management Development Program at the Asian Institute of Management.
Eugenie M.L. Villena is Senior Vice President - Chief Financial Officer of URC. She is also Senior
Vice President and Chief Financial Officer - Treasurer of JG Summit. Prior to joining URC, she
worked for Bancom Development Corporation, Philippine Pacific Capital Corporation and Pacific
Basin Securities, Co., Inc. She is a member of the Financial Executives Institute of the Philippines.
She received her Bachelor of Science in Business Administration and Masters in Business
Administration degrees from the University of the Philippines.
Jeanette U. Yu is Vice President of URC. She is also the Vice President-Treasurer of Cebu Air, Inc.,
Chief Financial Officer of Oriental Petroleum and Minerals Corporation, and the Senior Vice
President and Treasurer of JG Summit Capital Markets Corporation. Prior to joining URC in 1980, she
worked for AEA Development Corporation and Equitable Banking Corporation. Ms. Jeanette U. Yu
received her Bachelor of Science degree in Business Administration from St. Theresa’s College in
Quezon City.
Ester T. Ang is the Vice President - Treasurer of URC. Prior to joining URC in 1987, she
worked with Bancom Development Corporation and Union Bank of the Philippines. Ms.
Ester Ang, received her Bachelor of Science degree in Accounting from Ateneo De Davao
University in Davao City.
Rosalinda F. Rivera was appointed Corporate Secretary of URC on May 22, 2004 and has been
Assistant Corporate Secretary since May 2002. She is also the Corporate Secretary of JG Summit,
RLC, Cebu Air, Inc., JG Summit Petrochemical Corporation, CFC Corporation and JG Cement
Corporation. Prior to joining URC, she was a Senior Associate at Puno and Puno Law Offices. She
received a Juris Doctor degree from the Ateneo de Manila University School of Law and a Masters of
Law degree in International Banking from the Boston University School of Law. She was admitted to
the Philippine Bar in 1995.
``- 36 The members of the Company’s board of directors and executive officers can be reached at the address
of its registered office at 110 E. Rodriguez Avenue, Bagumbayan, Quezon City, Philippines.
Involvement in Certain Legal Proceedings of Directors and Executive Officers
None of the members of the Board of Directors and Executive Officers of the Company are involved
in the any criminal, bankruptcy or insolvency investigations or proceedings.
Family Relationships
Mr. James L. Go is a brother of Mr. John Gokongwei, Jr. while Mr. Lance Y. Gokongwei is his son.
Mr. Patrick Henry C. Go, Mr. Frederick D. Go and Mr. Johnson Robert G. Go, Jr. are the nephews of
Mr. John Gokongwei, Jr.
Item 11.
Executive Compensation
The following summarizes certain information regarding compensation paid or accrued during the last
two (2) fiscal years and to be paid in the ensuing fiscal year to the Company’s Directors and Executive
Officers:
Salary
CEO and Four (4) most
highly compensated
executive officers
All officers and directors as a
group unnamed
Estimated - FY2009
Bonus
Other
Actual
Total
2008
2007
=32,068,204
P
=600,000
P
=90,000
P
=32,758,204
P
=30,432,944
P
=29,004,993
P
93,849,392
1,200,000
180,000
95,229,392
95,162,398
87,751,559
The following are the five (5) highest compensated directors and/or executive officers of the
Company: 1. Director, Chairman Emeritus - John L. Gokongwei, Jr.; 2. Director, Chairman and Chief
Executive Officer - James L. Go; 3. Director, President and Chief Operating Officer - Lance Y.
Gokongwei; 4. Executive Vice President - Bienvenido S. Bautista; and 5. Executive Vice President –
Patrick Ng.
Standard Arrangements
There are no standard arrangements pursuant to which directors of the Company are compensated, or
are to be compensated, directly or indirectly, for any services provided as a director for the last
completed fiscal year and the ensuing year.
Other Arrangements
There are no other arrangements pursuant to which directors of the Company are compensated, or are
to be compensated, directly or indirectly, for any services provided as a director for the last completed
fiscal year and the ensuing year.
Employment Contracts and Termination of Employment and Change-in-Control Arrangement
``- 37 There are no special employment contracts between the Corporation and the named executive officers
There are no compensatory plan or arrangement with respect to a named executive officer.
Warrants and Options Outstanding
There are no outstanding warrants or options held by the Corporation’s CEO, the named executive
officers and all officers and directors as a group.
Item 12.
(1)
Security Ownership of Certain Beneficial Owners and Management
Security Ownership of Certain Record and Beneficial Owners
As of September 30, 2008, URC knows no one who beneficially owns in excess of 5% of URC’s
common stock except as set forth in the table below.
Title of
Class
Common
Common
Common
Names and addresses of record
owners and relationship with the
Corporation
Name of beneficial
owner and
relationship with
record owner
Same as record
owner
(See note 1)
JG Summit Holdings, Inc. 1
43/F Robinsons Equitable Tower,
ADB Avenue corner
Poveda Street, Ortigas Center, Pasig
City
(stockholder)
PCD Participants and
PCD Nominee Corporation2
their clients
(Non-Filipino)
(See note 2)
G/F Makati Stock Exchange Bldg.
6767 Ayala Ave., Makati City
(stockholder)
PCD Participants and
PCD Nominee Corporation2
their clients
(Filipino)
(See note 2)
G/F Makati Stock Exchange Bldg.
6767 Ayala Ave., Makati City
(stockholder)
Citizenship
Filipino
No. of Shares
Held
% to Total
Outstanding
1,314,435,609
61.14 %
Non-Filipino
657,870,757
30.60%
Filipino
160,923,235
7.49%
________________________
1.
As of September 30, 2008, Mr. John L. Gokongwei, Jr., Chairman Emeritus of JG Summit Holdings, Inc., (JGSHI), holds 1,009,339,915 shares
representing 14.85% of the total outstanding shares of the said corporation. The Chairman and the President are both empowered under the By-Laws of
JGSHI to vote any and all shares owned by JGSHI, except as otherwise directed by the Board of Directors. The incumbent Chairman and Chief Executive
Officer and President and Chief Operating Officer of JGSHI are Mr. James L. Go and Mr. Lance Y. Gokongwei, respectively.
2.
PCD Nominee Corporation, a wholly owned subsidiary of Philippine Central Depository, Inc. (“PCD”), is the registered owner of the shares in the books
of the Corporation’s transfer agent in the Philippines. The beneficial owners of such shares are PCD’s participants, who hold the shares on their behalf,
and their clients. PCD is a private company organized by the major institutions actively participating in the Philippine capital markets to implement an
automated book-entry system of handling securities transactions in the Philippines. Out of this account, “The Hongkong and Shanghai Banking Corp. Ltd.
-Clients’ Acct.” holds for various trust accounts the following shares of the Corporation as of September 30, 2008:
No. of shares
The Hongkong and Shanghai Banking
Corp. Ltd. -Clients’ Acct.
-
399,313,062
% to Outstanding
18.57%
``- 38 2)
Security Ownership of Management
Title of
Class
Name of beneficial
Owner
Named Executive Officers1
Common
1. John L. Gokongwei, Jr.2
Common
2. James L. Go
Common
3. Lance Y. Gokongwei
Common
4. Bienvenido S. Bautista
Position
Director, Chairman
Emeritus
Director, Chairman
& CEO
Director, President
& COO
Executive Vice
President
Sub-Total
Citizenship
Amount &
nature of
beneficial
ownership
2,479,401
Filipino
1
Filipino
*
1
Filipino
*
3,795
Filipino
*
2,483,198
Other Directors, Executive Officers and Nominees
Common
5. Patrick Henry C. Go
Director, Vice
President
Common
6. Frederick D. Go
Director
% to Total
Outstanding
0.12%
0.12%
45,540
Filipino
*
11,501
Filipino
*
Common
7. Johnson Robert G. Go, Jr.
Director
1
Filipino
*
Common
8. Robert G. Coyiuto, Jr.
Director
1
Filipino
*
Common
9. Wilfrido E. Sanchez
1
Filipino
*
Common
10. Pascual S. Guerzon
Director
(Independent)
Director
(Independent)
1
Filipino
*
57,045
All directors and executive officers as a group
unnamed
2,540,243
*
0.12%
______________________________
1.
2.
*
(3)
Chief Executive Officer and four (4) most highly compensated executive officers as of September 30, 2008
Sum of shares in the name of “John L. Gokongwei, Jr.” for one (1) share and “Elizabeth Y. Gokongwei and/or John Gokongwei, Jr.”
for 2,479,400.
less than 0.01%
Voting Trust Holders of 5% or more
``- 39 There are no persons holding more than 5% of a class under a voting trust or similar agreement.
Item 13.
Certain Relationships and Related Transactions
The Company, in its regular conduct of business, had engaged in transactions with its major
stockholder, JG Summit Holdings, Inc. and its affiliated companies. See Note 31 (Related Party
Disclosures) of the Notes to Consolidated Financial Statements (page 114) in the accompanying
Audited Financial Statements filed as part of this Form 17-A.
PART IV – CORPORATE GOVERNANCE
Item 14.
Corporate Governance
The Company adheres to the principles and practices of good corporate governance, as embodied in its
Corporate Governance Manual and pertinent SEC Circulars. Continuous improvement and monitoring
have been undertaken to ensure that the Company observes good governance and management
practices.
In 2003, the Board of Directors has approved its Corporate Governance Compliance Evaluation
System in order to provide a means to check and assess the level of compliance of the Company with
leading principles and practices on good corporate governance. The System highlights areas for
compliance improvement and actions needed to be undertaken. The Company’s Annual Corporate
Governance Compliance Evaluation Form is annually submitted to the SEC and PSE on or before
January 30 of each year starting with calendar year 2003.
Likewise, URC has consistently strived to raise its level of reporting to adopt and implement
prescribed Philippine Financial Reporting Standards.
``- 40 PART V - EXHIBITS AND SCHEDULES
Item 15.
(a)
Exhibits and Reports on SEC Form 17-C
Exhibits - See accompanying Index to Exhibits (page 132)
The following exhibit is filed as a separate section of this report:
(18) Subsidiaries of the Registrant
The other exhibits, as indicated in the Index to Exhibits are either not applicable to the Company
or require no answer.
(b) Reports on SEC Form 17-C
UNIVERSAL ROBINA CORPORATION
LIST OF CORPORATE DISCLOSURES/REPLIES TO SEC LETTERS
UNDER SEC FORM 17-C
APRIL 1, 2008 TO SEPTEMBER 30, 2008
Date of Disclosure
April 10, 2008
April 11, 2008
April 15, 2008
April 16, 2008
April 17, 2008
April 21, 2008
May 5, 2008
May 8, 2008
May 12, 2008
Description
Shares acquired on April 9 and 10 pursuant to the
share buyback program.
Shares acquired on April 11, 2008 pursuant to the
share buyback program.
Shares acquired on April 15, 2008 pursuant to the
share buyback program.
Shares acquired on April 16, 2008 pursuant to the
share buyback program.
a. Shares acquired on April 17, 2008 pursuant to
the share buyback program.
b. Notice of Cash Dividend Declaration
c. Election of Directors
d. Results of the Organizational Meeting of the
Board of Directors.
Clarification of news article entitled “URC bullish
on int’l business” which appeared in the April 19,
2008 issue of The Manila Times.
Clarification of the news article “Universal Robina
Corporation allots P105 million for egg venture.”
Press Release entitled “Universal Robina
Corporation signs Memorandum of Agreement
with General Milling Corporation.”
Reply to PSE Odisy letter dated May 9, 2008
requesting for additional information regarding the
execution of a memorandum of agreement with
``- 41 General Milling Corporation.
May 16, 2008
May 20, 2008
May 22, 2008
May 26, 2008
May 27, 2008
June 3, 2008
June 27, 2008
July 21, 2008
August 4, 2008
August 7, 2008
August 8, 2008
August 12, 2008
August 13, 2008
August 14, 2008
August 15, 2008
August 20, 2008
August 21, 2008
August 27, 2008
August 28, 2008
a. Shares acquired on May 15, 2008 pursuant to
the share buyback program.
b. Disclosure Statement on the results of
operations of URC for the Six Month Period ended
March 31, 2008.
Shares acquired on May 20, 2008 pursuant to the
buyback program.
Shares acquired on May 22, 2008 pursuant to the
buyback program.
Shares acquired on May 26, 2008 pursuant to the
buyback program.
Shares acquired on May 27, 2008 pursuant to the
buyback program.
Shares acquired on June 3, 2008 pursuant to the
buyback program.
a. Shares acquired on June 26, 2008 pursuant to
the buyback program.
b. Shares acquired on June 27, 2008 pursuant to
the buyback program.
Shares acquired on July 18, 2008 pursuant to the
buyback program.
Shares acquired on August 1, 2008 pursuant to the
buyback program.
Shares acquired on August 6, 2008 pursuant to the
buyback program.
Shares acquired on August 7, 2008 pursuant to the
buyback program.
Shares acquired on August 11, 2008 pursuant to the
buyback program.
Shares acquired on August 12, 2008 pursuant to the
buyback program.
Shares acquired on August 13, 2008 pursuant to the
buyback program.
Disclosure Statement on the results of operations of
URC for the period ended June 30, 2008.
Shares acquired on August 19, 2008 pursuant to the
buyback program.
Shares acquired on August 21, 2008 pursuant to the
buyback program.
Shares acquired on August 26, 2008 pursuant to the
buyback program.
Shares acquired on August 27, 2008 pursuant to the
buyback program.
``- 42 August 29, 2008
September 1, 2008
September 2, 2008
September 3, 2008
September 4, 2008
September 5, 2008
September 11, 2008
September 12, 2008
September 13, 2008
September 15, 2008
Shares acquired on August 28, 2008 pursuant to the
buyback program.
Shares acquired on August 29, 2008 pursuant to the
buyback program.
Shares acquired on September 1, 2008 pursuant to
the buyback program.
Shares acquired on September 2, 2008 pursuant to
the buyback program.
Shares acquired on September 3, 2008 pursuant to
the buyback program.
Shares acquired on September 4, 2008 pursuant to
the buyback program.
Sale of the shares held in Philex Mining
Corporation.
Shares acquired on September 11, 2008 pursuant to
the buyback program.
Shares acquired on September 12, 2008 pursuant to
the buyback program.
Shares acquired on September 15, 2008 pursuant to
the buyback program.
``- 45 -
UNIVERSAL ROBINA CORPORATION AND SUBSIDIARIES
INDEX TO FINANCIAL STATEMENTS AND SUPPLEMENTARY SCHEDULES
FORM 17- A, Item 7
Page No.
Consolidated Financial Statements
Statement of Management’s Responsibility for Financial Statements
Report of Independent Auditors
Consolidated Balance Sheets as of September 30, 2008 and 2007
Consolidated Statements of Income for each of the three years in the
period ended September 30, 2008
Consolidated Statements of Changes in Stockholders’ Equity for each of
the three years in the period ended September 30, 2008
Consolidated Statements of Cash Flows for each of the three years
in the period ended September 30, 2008
Notes to Consolidated Financial Statements
46
47
49
51
52
54
56
Supplementary Schedules
Report of Independent Auditors on Supplementary
Schedules
A. Marketable Securities - (Current Marketable Equity Securities
and Other Short-Term Cash Investments)
B. Amounts Receivable from Directors, Officers, Employees,
Related Parties and Principal Stockholders (Other than Affiliates)
C. Non-Current Marketable Equity Securities, Other Long-Term
Investments in Stock, and Other Investments
D. Indebtedness to Unconsolidated Subsidiaries and Affiliates
E. Property, Plant and Equipment
F. Accumulated Depreciation
G. Intangible Assets - Other Assets
H. Long-Term Debt
I. Indebtedness to Affiliates and Related Parties (Long-Term Loans
from Related Companies)
J. Guarantees of Securities of Other Issuers
K. Capital Stock
______
140
141
142
143
144
145
146
147
148
149
**
150
* Not applicable per section 1(b) (xii), 2(e) and 2 (I) of SRC Rule 68
** These schedules, which are required by Section 4(e) of SRC Rule 68, have been omitted because they are either not
required, not applicable or the information required to be presented is included/shown in the related URC & Subsidiaries’
consolidated financial statements or in the notes thereto.
- 47 -
SyCip Gor res Velayo & C o.
6760 Ayala Avenue
1226 Makati City
Philippines
Phone: (632) 891 0307
Fax:
(632) 819 0872
www.sgv.com.ph
BOA/PRC Reg. No. 0001
SEC Acc reditation No. 0012-FR-1
INDEPENDENT AUDITORS’ REPORT
The Stockholders and the Board of Directors
Universal Robina Corporation
110 E. Rodriguez Avenue
Bagumbayan, Quezon City
We have audited the accompanying consolidated financial statements of Universal Robina
Corporation and Subsidiaries, which comprise the consolidated balance sheets as at September 30,
2008 and 2007, and the consolidated statements of income, consolidated statements of changes in
equity and consolidated statements of cash flows for each of the three years in the period ended
September 30, 2008, and a summary of significant accounting policies and other explanatory notes.
Management’s Responsibility for the Financial Statements
Management is responsible for the preparation and fair presentation of these financial statements in
accordance with Philippine Financial Reporting Standards. This responsibility includes: designing,
implementing and maintaining internal control relevant to the preparation and fair presentation of
financial statements that are free from material misstatement, whether due to fraud or error; selecting
and applying appropriate accounting policies; and making accounting estimates that are reasonable in
the circumstances.
Auditors’ Responsibility
Our responsibility is to express an opinion on these financial statements based on our audits. We
conducted our audits in accordance with Philippine Standards on Auditing. Those standards require
that we comply with ethical requirements and plan and perform the audit to obtain reasonable
assurance whether the financial statements are free from material misstatement.
An audit involves performing procedures to obtain audit evidence about the amounts and disclosures
in the financial statements. The procedures selected depend on the auditor’s judgment, including the
assessment of the risks of material misstatement of the financial statements, whether due to fraud or
error. In making those risk assessments, the auditor considers internal control relevant to the entity’s
preparation and fair presentation of the financial statements in order to design audit procedures that are
appropriate in the circumstances, but not for the purpose of expressing an opinion on the effectiveness
of the entity’s internal control. An audit also includes evaluating the appropriateness of accounting
policies used and the reasonableness of accounting estimates made by management, as well as
evaluating the overall presentation of the financial statements.
*SGVMC111910*
A member firm of Ernst & Young Global Limited
- 48 -
- 48 We believe that the audit evidence we have obtained is sufficient and appropriate to provide a basis for
our audit opinion.
Opinion
In our opinion, the consolidated financial statements present fairly, in all material respects, the
financial position of Universal Robina Corporation and Subsidiaries as of September 30, 2008 and
2007, and their financial performance and their cash flows for each of the three years in the period
ended September 30, 2008 in accordance with Philippine Financial Reporting Standards.
SYCIP GORRES VELAYO & CO.
Vicky B. Lee-Salas
Partner
CPA Certificate No. 86838
SEC Accreditation No. 0115-AR-1
Tax Identification No. 129-434-735
PTR No. 1566436, January 5, 2009, Makati City
January 12, 2009
*SGVMC111910*
- 49 -
UNIVERSAL ROBINA CORPORATION AND SUBSIDIARIES
CONSOLIDATED BALANCE SHEETS
September 30
2007
(As restated
- Note 37)
2008
ASSETS
Current Assets
Cash and cash equivalents (Note 7)
Financial assets at fair value through profit or loss
(Notes 8 and 9)
Receivables - net (Notes 10 and 34)
Inventories (Note 11)
Other current assets (Note 12)
Assets of disposal group classified as held
for sale (Note 38)
Total Current Assets
Noncurrent Assets
Property, plant and equipment (Notes 6 and 13)
Available-for-sale investments (Notes 9 and 14)
Biological assets (Note 15)
Intangible assets (Note 16)
Net pension assets (Note 31)
Investments in an associate and a joint venture (Note 17)
Investment properties (Note 18)
Other noncurrent assets (Note 19)
Total Noncurrent Assets
P
=2,215,628,259
=5,045,041,438
P
5,979,184,879
6,175,873,872
7,774,455,180
1,036,364,089
23,181,506,279
16,536,868,784
5,781,478,724
5,903,328,679
607,201,493
33,873,919,118
197,416,861
23,378,923,140
–
33,873,919,118
24,327,344,376
6,304,842,703
1,443,259,742
1,646,762,912
243,810,600
93,056,645
79,003,584
413,631,365
34,551,711,927
P
=57,930,635,067
22,156,451,732
–
1,050,568,773
1,156,950,961
92,534,300
89,872,575
82,601,829
331,002,621
24,959,982,791
=58,833,901,909
P
P
=8,069,508,132
=4,519,172,112
P
4,964,941,584
3,000,776,510
20,761,736
48,031,798
16,104,019,760
4,423,728,767
385,279,591
119,192,023
5,072,751,025
14,520,123,518
8,727,389
16,112,747,149
–
14,520,123,518
LIABILITIES AND EQUITY
Current Liabilities
Short-term debt (Notes 20, 23 and 30)
Accounts payable and other accrued liabilities
(Notes 20, 21 and 34)
Trust receipts and acceptances payable (Notes 11 and 23)
Income tax payable
Current portion of long-term debt (Notes 22, 23 and 30)
Liabilities directly associated with assets of disposal
group classified as held for sale (Note 38)
Total Current Liabilities
(Forward)
*SGVMC111910*
- 50 September 30
2008
Noncurrent Liabilities
Long-term debt - net of current portion
(Notes 22, 23 and 30)
Deferred tax liabilities - net (Note 32)
Total Noncurrent Liabilities
Total Liabilities
Equity
Equity attributable to equity holders of the parent
Paid-up capital (Note 23)
Retained earnings (Note 23)
Deposits for future stock subscriptions (Note 23)
Cumulative translation adjustments (Note 39)
Unrealized loss on available-for-sale investments
(Note 14)
Treasury shares (Note 23)
Equity attributable to minority interests
Total Equity
2007
(As restated
- Note 37)
P
=9,429,770,492
243,687,670
9,673,458,162
25,786,205,311
=9,064,974,890
P
250,363,157
9,315,338,047
23,835,461,565
13,429,513,837
19,198,256,317
26,043,533
575,323,807
13,429,513,837
20,300,463,625
26,043,533
544,386,903
(826,240,308)
(916,666,046)
31,486,231,140
658,198,616
32,144,429,756
P
=57,930,635,067
–
–
34,300,407,898
698,032,446
34,998,440,344
=58,833,901,909
P
See accompanying Notes to Consolidated Financial Statements.
*SGVMC111910*
- 51 -
UNIVERSAL ROBINA CORPORATION AND SUBSIDIARIES
CONSOLIDATED STATEMENTS OF INCOME
2008
SALE OF GOODS AND SERVICES
(Notes 6 and 34)
COST OF SALES
(Notes 11, 24, 27, 28, and 34)
GROSS PROFIT
Selling and distribution costs
(Notes 25, 27 and 28)
Market valuation gain (loss) on financial
assets at fair value through profit
or loss (Note 8)
General and administrative expenses
(Notes 26, 27, 28 and 34)
Finance costs (Notes 6, 20, 22, 30 and 34)
Finance revenue (Notes 6 and 29)
Impairment losses
(Notes 6, 10, 11, 13, and 16)
Foreign exchange losses - net
Gain on sale of investment (Notes 6 and 17)
Equity in net income of an associate and a joint
venture (Notes 6 and 17)
Other revenues (expenses) - net
(Notes 6 and 18)
Years Ended September 30
2007
2006
= 45,454,500,015
P
=37,720,260,615
P
=35,183,814,854
P
34,599,920,305
27,616,777,337
26,359,974,231
10,854,579,710
10,103,483,278
8,823,840,623
(5,615,362,792)
(5,119,182,316)
(4,790,405,938)
(2,264,036,590)
451,809,003
923,670,697
(1,551,015,226)
(1,273,599,234)
1,070,053,254
(1,803,972,344)
(1,620,998,830)
1,562,117,043
(1,332,342,501)
(2,271,950,902)
2,319,815,409
(298,966,703)
(423,765,630)
(344,666,537)
(255,323,511)
2,858,765,293
(283,979,473)
(259,222,224)
–
–
28,184,000
23,287,500
319,996,500
(14,279,143)
97,966,109
(155,966,428)
INCOME BEFORE INCOME TAX
511,791,646
5,953,284,688
3,293,455,763
PROVISION FOR INCOME TAX
(Notes 6 and 32)
170,595,907
452,255,980
382,364,589
=341,195,739
P
=5,501,028,708
P
=2,911,091,174
P
=381,029,569
P
(39,833,830)
=341,195,739
P
=5,556,978,624
P
(55,949,916)
=5,501,028,708
P
=3,018,916,609
P
(107,825,435)
=2,911,091,174
P
NET INCOME
ATTRIBUTABLE TO
Equity holders of the parent (Note 33)
Minority interest
BASIC/DILUTED EARNINGS PER SHARE
ATTRIBUTABLE TO EQUITY
HOLDERS OF THE PARENT
(Notes 23 and 33)
= 0.17
P
=2.50
P
=1.42
P
See accompanying Notes to Consolidated Financial Statements.
*SGVMC111910*
- 52 -
UNIVERSAL ROBINA CORPORATION AND SUBSIDIARIES
CONSOLIDATED STATEMENTS OF CHANGES IN EQUITY
Paid-up Capital (Note 23)
Capital
Stock
Additional
Paid-in
Capital
For the Year Ended September 30, 2008
ATTRIBUTABLE TO EQUITY HOLDERS OF THE PARENT
Retained Earnings (Note 23)
Deposits for
Cumulative Unrealized Loss
Future Stock
Translation on Available-ForTotal Unappropriated
Appropriated
Total
Paid-up
Retained
Retained
Retained
Subscriptions
Adjustments Sale Investments
(Note 23)
Capital
Earnings
Earnings
Earnings
(Note 39)
(Note 14)
Balances as of September 30, 2007,
as previously reported
P2,221,851,481 P
=
= 11,207,662,356 P
= 13,429,513,837 P
= 17,300,463,625 =
P3,000,000,000 P
= 20,300,463,625
Increase in minority interest (Note 37)
–
–
–
–
–
–
Balances as of September 30, 2007,
as restated
2,221,851,481 11,207,662,356 13,429,513,837 17,300,463,625
3,000,000,000 20,300,463,625
Adjustments to foreign currency
translation
–
–
–
–
–
–
Changes in fair value of available-for-sale
investments
–
–
–
–
–
–
Net income and expense for the year
recognized directly in equity
–
–
–
–
–
–
Net income for the year
–
–
–
381,029,569
–
381,029,569
Total income (expense) recognized
for the year
–
–
–
381,029,569
–
381,029,569
Purchase of treasury shares (Note 23)
–
–
–
–
–
–
Cash dividends (Note 23)
–
–
–
(1,480,499,319)
–
(1,480,499,319)
Effect of restatement of Acesfood
Network Pte. Ltd. (Note 37)
–
–
–
(2,737,558)
–
(2,737,558)
Balances as of September 30, 2008
= 2,221,851,481 P
P
= 11,207,662,356 P
= 13,429,513,837 P
= 16,198,256,317 P
= 3,000,000,000 P
= 19,198,256,317
Treasury
Shares
(Note 23)
Total
=– P
P
= 34,300,407,898
–
–
ATTRIBUTABLE TO
MINORITY
INTEREST
TOTAL
EQUITY
= 26,043,533
P
–
= 544,386,903
P
–
=–
P
–
26,043,533
544,386,903
–
–
34,300,407,898
698,032,446
34,998,440,344
–
30,936,904
–
–
30,936,904
–
30,936,904
–
–
(826,240,308)
–
(826,240,308)
–
(826,240,308)
–
–
30,936,904
–
(826,240,308)
–
–
–
(795,303,404)
381,029,569
–
(39,833,830)
(795,303,404)
341,195,739
–
–
–
30,936,904
–
–
(826,240,308)
–
–
(414,273,835)
(916,666,046)
(1,480,499,319)
(39,833,830)
–
–
(454,107,665)
(916,666,046)
(1,480,499,319)
–
= 26,043,533
P
–
= 575,323,807
P
–
(P
= 826,240,308)
–
(916,666,046)
–
–
(2,737,558)
(P
= 916,666,046) P
= 31,486,231,140
= 695,294,888 =
P
P34,995,702,786
2,737,558
2,737,558
–
(2,737,558)
= 658,198,616 =
P
P32,144,429,756
*SGVMC111910*
- 53 -
Total
Paid-up
Capital
=13,429,513,837
P
–
–
–
–
–
=13,429,513,837
P
For the Year Ended September 30, 2007 (As restated - Note 37)
ATTRIBUTABLE TO EQUITY HOLDERS OF THE PARENT
Retained Earnings (Note 23)
Deposits for
Unappropriated
Appropriated
Total
Future Stock
Retained
Retained
Retained
Subscriptions
(Note 23)
Earnings
Earnings
Earnings
=13,254,343,977
P
=3,000,000,000
P
=16,254,343,977
P
=26,043,533
P
–
–
–
–
5,556,978,624
–
5,556,978,624
–
5,556,978,624
–
5,556,978,624
–
–
–
–
–
(1,510,858,976)
–
(1,510,858,976)
–
=17,300,463,625
P
=3,000,000,000
P
=20,300,463,625
P
=26,043,533
P
Cumulative
Translation
Adjustments
(Note 39)
=765,869,023
P
(221,482,120)
–
(221,482,120)
–
–
=544,386,903
P
Common
Stock
=1,686,479,549
P
Additional
Paid-in
Capital
=6,843,501,476
P
Total
Paid-up
Capital
=8,529,981,025
P
For the Year Ended September 30, 2006
ATTRIBUTABLE TO EQUITY HOLDERS OF THE PARENT
Retained Earnings (Note 23)
Deposits for
Unappropriated
Appropriated
Total
Future Stock
Retained
Retained
Retained
Subscriptions
(Note 23)
Earnings
Earnings
Earnings
=11,762,281,005
P
=3,000,000,000
P
=14,762,281,005
P
=26,043,533
P
Cumulative
Translation
Adjustments
(Note 39)
=993,318,822
P
Total
=24,311,624,385
P
–
1,686,479,549
–
–
–
282,400,000
252,971,932
–
=2,221,851,481
P
–
6,843,501,476
–
–
–
4,364,160,880
–
–
=11,207,662,356
P
–
8,529,981,025
–
–
–
4,646,560,880
252,971,932
–
=13,429,513,837
P
–
993,318,822
(227,449,799)
–
(227,449,799)
–
–
–
=765,869,023
P
(75,100,307)
24,236,524,078
(227,449,799)
3,018,916,609
2,791,466,810
4,646,560,880
–
(1,198,781,398)
=30,475,770,370
P
Paid-up Capital (Note 23)
Balances as of September 30, 2006
Adjustments to foreign currency translation
Net income for the year
Total income (expense) recognized for the year
Increase in minority interest (Note 37)
Cash dividends (Note 23)
Balances as of September 30, 2007
Common
Stock
=2,221,851,481
P
–
–
–
–
–
=2,221,851,481
P
Additional
Paid-in
Capital
=11,207,662,356
P
–
–
–
–
–
=11,207,662,356
P
Paid-up Capital (Note 23)
Balances as of September 30, 2005
Cumulative effect of change in accounting
policy for financial instruments as of
October 1, 2005
Balances as of October 1, 2005, as adjusted
Adjustments to foreign currency translation
Net income for the year
Total income (expense) recognized for the year
Issuance of common shares of stock
Stock dividends (Note 23)
Cash dividends (Note 23)
Balances as of September 30, 2006
(75,100,307)
11,687,180,698
–
3,018,916,609
3,018,916,609
–
(252,971,932)
(1,198,781,398)
=13,254,343,977
P
–
3,000,000,000
–
–
–
–
–
–
=3,000,000,000
P
(75,100,307)
14,687,180,698
3,018,916,609
3,018,916,609
–
(252,971,932)
(1,198,781,398)
=16,254,343,977
P
–
26,043,533
–
–
–
–
–
–
=26,043,533
P
Total
=30,475,770,370
P
(221,482,120)
5,556,978,624
5,335,496,504
–
(1,510,858,976)
=34,300,407,898
P
ATTRIBUTABLE
TO MINORITY
INTEREST
=751,244,804
P
–
(55,949,916)
(55,949,916)
2,737,558
–
=698,032,446
P
ATTRIBUTABLE
TO
MINORITY
INTEREST
=948,579,793
P
–
948,579,793
(89,509,554)
(107,825,435)
(197,334,989)
–
–
–
=751,244,804
P
TOTAL
EQUITY
=31,227,015,174
P
(221,482,120)
5,501,028,708
5,279,546,588
2,737,558
(1,510,858,976)
=34,998,440,344
P
TOTAL
EQUITY
=25,260,204,178
P
(75,100,307)
25,185,103,871
(316,959,353)
2,911,091,174
2,594,131,821
4,646,560,880
–
(1,198,781,398)
=31,227,015,174
P
See accompanying Notes to Consolidated Financial Statements.
*SGVMC111910*
- 54 -
UNIVERSAL ROBINA CORPORATION AND SUBSIDIARIES
CONSOLIDATED STATEMENTS OF CASH FLOWS
2008
CASH FLOWS FROM OPERATING
ACTIVITIES
Income before income tax
Adjustments for:
Depreciation and amortization of:
Property and equipment (Note 13)
Investment properties (Note 18)
Intangible assets (Note 16)
Market valuation loss (gain) on financial
assets at fair value through profit
or loss (Notes 4 and 8)
Finance costs (Note 30)
Finance revenue (Note 29)
Foreign exchange loss - net
Impairment losses on:
Available-for-sale investments (Note 14)
Receivables (Note 10)
Inventories (Note 11)
Property and equipment (Note 13)
Goodwill (Note 16)
Gain arising from changes in fair value less
estimated point-of-sale costs of swine
stocks (Note 15)
Loss (gain) on sale of financial assets at fair
value through profit or loss
Equity in net income of an associate and
a joint venture (Note 17)
Loss (gain) on sale of property and equipment
Gain on sale of investment (Note 17)
Amortization of debt issuance costs
Market valuation gain on derivative
transactions (Note 4)
Loss on reacquisition of long-term debt
Operating income before working capital changes
Decrease (increase) in:
Receivables
Inventories
Other current assets
Increase (decrease) in:
Accounts payable and other accrued
liabilities
Trust receipts and acceptances payable
Cash generated from operations
Interest paid
Interest received
Income taxes paid
Net cash provided by operating activities
Years Ended September 30
2007
(As restated
- Note 37)
2006
=511,791,646
P
=5,953,284,688
P
=3,293,455,763
P
2,687,054,654
3,598,245
2,767,636
2,172,452,012
3,598,245
1,383,818
1,990,987,053
3,598,245
–
2,264,036,590
1,273,599,234
(1,070,053,254)
423,765,630
(451,809,003)
1,620,998,830
(1,562,117,043)
255,323,511
(923,670,697)
2,271,950,902
(2,319,815,409)
259,222,224
11,674,554
94,901,001
192,391,148
–
–
–
141,230,297
–
203,436,240
–
–
43,290,658
–
–
240,688,815
(280,333,605)
(276,815,236)
(244,709,188)
(48,028,750)
(250,535,563)
(23,287,500)
(5,325,919)
(2,858,765,293)
26,473,920
(319,996,500)
(15,321,831)
–
19,739,316
2,106,621
(28,184,000)
2,693,255
–
12,971,614
29,724,214
–
6,134,505,183
(2,179,639)
–
5,149,853,178
–
14,523,978
4,063,407,766
(862,890,472)
(2,063,517,649)
(458,886,810)
(860,365,880)
(511,738,312)
(487,764,768)
(1,109,168,022)
316,204,821
18,944,885
108,676,565
2,615,496,919
5,473,383,736
(1,064,823,152)
1,337,706,170
(275,701,681)
5,470,565,073
48,908,263
(275,867,725)
3,063,024,756
(1,688,635,192)
1,617,886,531
(320,674,234)
2,671,601,861
794,525,773
(567,908,862)
3,516,006,361
(2,375,737,859)
2,473,385,348
(237,980,553)
3,375,673,297
(Forward)
*SGVMC111910*
- 55 -
2008
CASH FLOWS FROM INVESTING
ACTIVITIES
Acquisitions of:
Property and equipment
Subsidiaries, net of cash acquired (Note 37)
Proceeds from sale of:
Property and equipment
Investment in an associate (Note 17)
Net disposal of financial assets at fair
value through profit or loss
Decrease (increase) in:
Biological assets
Intangible assets
Net pension assets
Other noncurrent assets
Investments in an associate and a joint venture
Dividends received (Note 17)
Net cash provided by (used in) investing activities
CASH FLOWS FROM FINANCING
ACTIVITIES
Repayments of:
Long-term debt
Short-term debt
Proceeds from short-term debt
Cash dividends paid (Note 23)
Increase (decrease) in minority
interests (Note 37)
Proceeds from issuance of common shares of stock
Purchase of treasury shares (Note 23)
Net cash provided by (used in) financing activities
NET INCREASE (DECREASE) IN
CASH AND CASH EQUIVALENTS
CASH AND CASH EQUIVALENTS AT
BEGINNING OF YEAR
CASH AND CASH EQUIVALENTS AT
END OF YEAR
(P
=4,986,813,079)
–
Years Ended September 30
2007
(As restated
- Note 37)
(P
=3,837,068,215)
(94,841,444)
2006
(P
=5,830,795,216)
–
88,822,745
–
114,959,438
4,750,661,204
328,575,448
–
936,842,414
1,631,288,512
5,500,501,747
(112,357,364)
(492,579,587)
(151,276,300)
(87,923,963)
–
24,999,930
(4,780,285,204)
43,249,916
–
143,812,100
(164,343,162)
–
–
2,587,718,349
180,609,264
–
(66,235,600)
(495,814,416)
316,584,062
171,391,485
104,816,774
(4,672,895,239)
(253,721,480)
3,804,089,036
(1,480,499,319)
(5,178,787,070)
(35,000,000)
527,754,321
(1,510,858,976)
(3,596,331,326)
(423,512,167)
2,230,655,543
(1,198,781,397)
–
–
2,737,558
–
–
(89,509,553)
4,646,560,880
–
(916,666,046)
(3,519,693,048)
(6,194,154,167)
1,569,081,980
(2,829,413,179)
(934,833,957)
5,049,572,051
5,045,041,438
5,979,875,395
930,303,344
=2,215,628,259
P
=5,045,041,438
P
=5,979,875,395
P
See accompanying Notes to Consolidated Financial Statements.
*SGVMC111910*
- 56 -
UNIVERSAL ROBINA CORPORATION AND SUBSIDIARIES
NOTES TO CONSOLIDATED FINANCIAL STATEMENTS
1. Corporate Information
Universal Robina Corporation (hereinafter referred to as “the Parent Company” or “URC”) is
incorporated and domiciled in the Republic of the Philippines. The registered office address of the
Parent Company is 110 E. Rodriguez Avenue, Bagumbayan, Quezon City, Philippines.
The Parent Company is a majority owned subsidiary of JG Summit Holdings, Inc. (“the ultimate
parent” or “JGSHI”).
The Parent Company and its subsidiaries (hereinafter referred to as “the Group”) is one of the
largest branded food products companies in the Philippines and has a growing presence in other
markets in Asia. The Group is involved in a wide range of food-related businesses which are
organized into three (3) business segments: (a) the branded consumer food segment which
manufactures and distributes a diverse mix of salty snacks, chocolates, candies, biscuits, bakery
products, beverages, noodles and tomato-based products; (b) the agro-industrial segment which
engages in hog and poultry farming, production and distribution of animal health products and
manufacture and distribution of animal feeds, glucose and soya bean products; and (c) the
commodity food segment which engages in sugar milling and refining, flour milling and
manufacture and marketing of pasta. The Parent Company also engages in consumer productrelated packaging business through its packaging division which manufactures bi-axially oriented
polypropylene (BOPP) film and through its subsidiary, CFC Clubhouse Property, Inc., which
manufactures polyethylene terephthalate (PET) bottles and printed flexible packaging materials.
The Parent Company’s packaging division is included in the branded consumer food segment.
The operations of certain consolidated subsidiaries are registered with the Board of Investments
(BOI) as preferred pioneer and nonpioneer activities. Under the terms of the registrations and
subject to certain requirements, the Parent Company and certain subsidiaries are entitled to certain
fiscal and non-fiscal incentives, including among others, an income tax holiday (ITH) for a period
of four (4) years to six (6) years from respective start dates of commercial operations (Note 35).
The Group is also subject to certain regulations with respect to, among others, product
composition, packaging, labeling, advertising and safety.
The principal activities of the Group are further described in Note 6 to the consolidated financial
statements.
The accompanying consolidated financial statements of the Group were authorized for issue by the
Audit Committee (AC) and the Board of Directors (BOD) on January 12, 2009.
*SGVMC111910*
- 57 2. Summary of Significant Accounting Policies
Basis of Preparation
The accompanying consolidated financial statements of the Group have been prepared on a
historical cost basis, except for financial assets at fair value through profit or loss (FVPL),
available-for-sale (AFS) investments and derivative financial instruments that have been measured
at fair value, and biological assets and agricultural produce that have been measured at fair value
less estimated point-of-sale costs.
The consolidated financial statements of the Group are presented in Philippine Peso. The
functional and presentation currency of the Parent Company and its Philippine subsidiaries (except
certain consolidated foreign subsidiaries), is the Philippine Peso ( further discussion under Foreign
Currency Translation/Transactions).
Statement of Compliance
The financial statements of the Group have been prepared in compliance with Philippine Financial
Reporting Standards (PFRS).
Basis of Consolidation
The consolidated financial statements include the financial statements of the Parent Company and
the following wholly and majority owned subsidiaries:
Subsidiaries
CFC Clubhouse, Incorporated
CFC Clubhouse Property, Inc.
URC Confectionary Corporation
CFC Corporation
South Luzon Greenland, Inc. (Note 35)
Bio-Resource Power Generation Corporation
(formerly Universal Robina Sugar Milling
Corporation)
Southern Negros Development Corporation
(SONEDCO)
Nissin - URC
URC Philippines, Limited (URCPL)
URC Asean Brands Co., Ltd.
Hong Kong China Foods Co., Ltd.
URC International Co. Ltd. (URCICL)
Universal Robina (Cayman), Ltd. (URCL)
Shanghai Peggy Foods Co., Ltd.
Tianjin Pacific Foods Manufacturing Co., Ltd.
URC China Commercial Co. Ltd.
Xiamen Tongan Pacific Food Co., Ltd.
Panyu Peggy Foods Co., Ltd.
Country of
Incorporation
Philippines
- do - do - do - do -
Effective Percentages of Ownership
2007
2006
2008
100.00
100.00
100.00
100.00
100.00
100.00
100.00
100.00
100.00
100.00
100.00
100.00
100.00
100.00
–
- do -
100.00
100.00
100.00
- do - do British Virgin Islands
- do - do - do Cayman Islands
China
- do - do - do - do -
94.00
65.00
100.00
77.00
77.00
77.00
100.00
100.00
100.00
100.00
100.00
90.00
94.00
65.00
100.00
77.00
77.00
77.00
100.00
100.00
100.00
100.00
100.00
90.00
94.00
65.00
100.00
77.00
77.00
77.00
100.00
100.00
100.00
100.00
100.00
90.00
(Forward)
*SGVMC111910*
- 58 -
Subsidiaries
URC Hong Kong Company Limited (formerly
Hong Kong Peggy Snack Foods Co., Limited)
PT URC Indonesia
URC Snack Foods (Malaysia) Sdn. Bhd.
(formerly Pacific World Sdn. Bhd.)
Ricellent Sdn. Bhd.
URC Foods (Singapore) Pte. Ltd. (formerly
Pan Pacific Snacks Pte. Ltd.)
Acesfood Network Pte. Ltd. (Note 35)
Advanson International Pte. Ltd. (Note 37)
URC (Thailand) Co., Ltd. (formerly
Thai Peggy Foods Co. Ltd.)
URC Vietnam Co., Ltd.
Country of
Incorporation
Effective Percentages of Ownership
2007
2006
2008
Hong Kong
Indonesia
100.00
100.00
100.00
100.00
100.00
100.00
Malaysia
- do -
91.52
54.03
91.52
54.03
91.52
54.03
Singapore
- do - do -
100.00
96.08
100.00
100.00
96.08
–
100.00
–
–
Thailand
Vietnam
100.00
100.00
100.00
100.00
100.00
100.00
The consolidated financial statements are prepared using uniform accounting policies for like
transactions and other events in similar circumstances. All significant intercompany transactions
and balances, including intercompany profits and unrealized profits and losses, are eliminated in
the consolidation.
Subsidiaries are consolidated from the date of acquisition, being the date on which the Group
obtains control, and continue to be consolidated until the date that such control ceases.
Acquisitions of subsidiaries are accounted for using the purchase method. The cost of an
acquisition is measured as the fair value of the assets given, equity instruments issued and
liabilities incurred or assumed at the date of exchange, plus costs directly attributable to the
acquisition. Identifiable assets acquired and liabilities and contingent liabilities assumed in a
business combination are measured initially at their fair value at the acquisition date, irrespective
of the extent of any minority interest.
Any excess of the cost of the business combination over the Group’s interest in the net fair value
of the identifiable assets, liabilities and contingent liabilities represents goodwill. Any excess of
the Group’s interest in the net fair value of the identifiable assets, liabilities and contingent
liabilities over the cost of business combination is recognized in the consolidated statement of
income on the date of acquisition.
Minority interests represent the portion of income or loss and net assets not held by the Group and
are presented separately in the consolidated statement of income and within equity in the
consolidated balance sheet, separately from the parent shareholders’ equity. Acquisitions of
minority interests are accounted for using the parent entity extension method, whereby, the
difference between the consideration and the book value of the share of the net assets acquired is
recognized as goodwill.
*SGVMC111910*
- 59 Changes in Accounting Policies and Disclosures
The accounting policies adopted are consistent with those of the previous financial years, except
for the adoption of a new accounting standard, amendments to accounting standards and certain
Philippine Interpretations that are discussed below. Except for the amendments to PAS 39 and
PFRS 7, the adoption of the new and amended standards, as well as the Philippine Interpretations,
did not have any effect on the consolidated financial statements of the Group. They did, however,
give rise to additional disclosures.
·
PFRS 7, Financial Instruments: Disclosures
The Group adopted PFRS 7 which introduces new disclosures to improve the information
about financial instruments. PFRS 7 requires the disclosure of qualitative and quantitative
information about exposure to risks arising from financial instruments, including specified
minimum disclosures about credit risk, liquidity risk and market risk, as well as sensitivity
analysis to market risk. PFRS 7 replaces Philippine Accounting Standard (PAS) 30,
Disclosures in the Financial Statements of Banks and Similar Financial Institutions, and the
disclosure requirements in PAS 32, Financial Instruments: Disclosure and Presentation. The
adoption of this Standard resulted in the inclusion of additional disclosures such as market risk
sensitivity analysis (Note 4), contractual maturity analysis of financial liabilities for liquidity
risk (Note 4) and aging analysis on financial assets that are either past due or impaired
(Note 4).
In December 2007, the Financial Reporting Standards Council approved an amendment to the
transition provision of PFRS 7 that gives transitional relief with respect to the presentation of
comparative information for the new risk disclosures about the nature and extent of risks
arising from financial instruments under paragraphs 31 to 42 of PFRS 7. In relation to such
relief, the Group is allowed not to present comparative information for the new risk
disclosures under paragraphs 31 to 42 of PFRS 7 unless the disclosure was previously required
under PAS 30 or PAS 32.
Adoption of this standard resulted in the inclusion of additional disclosures in the consolidated
financial statements of the Group, where applicable (Note 4).
·
Amendment to PAS 1, Presentation of Financial Statements: Capital Disclosures
This amendment requires the Group to make new disclosures to enable users of the
consolidated financial statements to evaluate the Group’s objectives, policies and processes
for managing capital (Note 23).
·
Amendments to PAS 39 and PFRS 7, Reclassification of Financial Assets
The Group adopted the amendments to PAS 39, Financial Instruments: Recognition and
Measurement, and PFRS 7, which allow reclassifications of certain financial instruments heldfor-trading to either held-to-maturity, loans and receivables or available-for-sale categories, as
well as certain instruments from available-for-sale (AFS) investments to loans and
receivables.
*SGVMC111910*
- 60 The effective date of the amendments is July 1, 2008. At that date, the Group reclassified
certain financial instruments out of the FVPL category and into the AFS investments category.
The adoption of the amendments to PAS 39 and PFRS 7 did not result in the restatement of
prior year financial statements. The related disclosures are in Note 9 to the consolidated
financial statements.
·
Philippine Interpretation IFRIC 9, Reassessment of Embedded Derivatives
This Philippine Interpretation becomes effective for financial years beginning on or after
June 1, 2006. It establishes that the date to assess the existence of an embedded derivative is
the date an entity first becomes a party to the contract, with reassessment only if there is a
change to the contract that significantly modifies the cash flows. The adoption of this
Philippine Interpretation did not have any effect on the consolidated financial statements of
the Group.
·
Philippine Interpretation IFRIC 10, Interim Financial Reporting and Impairment
This Philippine Interpretation prohibits the reversal of impairment losses on goodwill and
available-for-sale (AFS) equity investments recognized in the interim financial reports even if
impairment is no longer present at the annual balance sheet date. The adoption of this
Philippine Interpretation did not have any effect on the consolidated financial statements of
the Group.
·
Philippine Interpretation IFRIC 11, PFRS 2 - Group and Treasury Share Transactions
This Philippine Interpretation requires arrangements whereby an employee is granted rights to
an entity’s equity instruments to be accounted for as an equity-settled scheme by the entity
even if: (a) the entity chooses or is required to buy those equity instruments (i.e. treasury
shares) from another party, or (b) the shareholder(s) of the entity provide the equity
instruments needed. It also provides guidance on how subsidiaries, in their separate financial
statements, account for such schemes when their employees receive rights to the equity
instruments of the parent. The Group currently does not have any active stock option plan,
and therefore does not expect this Philippine Interpretation to have any significant impact on
its consolidated financial statements.
Significant Accounting Policies
Revenue Recognition
Revenue is recognized to the extent that it is probable that the economic benefits will flow to the
Group and the revenue can be reliably measured. Revenue is measured at the fair value of the
consideration received, excluding discounts, rebates and other sales taxes or duty. The following
specific recognition criteria must also be met before revenue is recognized:
Sale of goods
Revenue from sale of goods is recognized upon delivery, when the significant risks and rewards of
ownership of the goods have passed to the buyer and the amount of revenue can be measured
reliably. Revenue is measured at the fair value of the consideration received or receivable, net of
any trade discounts, prompt payment discounts and volume rebates.
*SGVMC111910*
- 61 Rendering of services
Revenue derived from tolling activities, whereby raw sugar from traders and planters is converted
into refined sugar, is recognized as revenue when the related services have been rendered.
Dividend income
Dividend income is recognized when the shareholder’s right to receive the payment is established.
Rent income
Rent income arising on investment properties is accounted for on a straight-line basis over the
lease term on on-going leases.
Interest income
Interest is recognized as it accrues (using the effective interest rate method under which interest
income is recognized at the rate that exactly discounts estimated future cash receipts through the
expected life of the financial instrument to the net carrying amount of the financial asset).
Cash and Cash Equivalents
Cash includes cash on hand and in banks. Cash equivalents are short-term, highly liquid
investments that are readily convertible to known amounts of cash with original maturities of three
(3) months or less from dates of placement, and that are subject to an insignificant risk of changes
in value.
Recognition of Financial Instruments
Date of recognition
Financial instruments within the scope of PAS 39, Financial Instruments: Recognition and
Measurement, are recognized in the consolidated balance sheet when the Group becomes a party
to the contractual provisions of the instrument. Purchases or sales of financial assets that require
delivery of assets within the time frame established by regulation or convention in the marketplace
are recognized on the settlement date. Derivatives are recognized on trade date basis.
Initial recognition of financial instruments
Financial instruments are recognized initially at fair value. Except for financial instruments fair
value through profit or loss valued at fair value through profit or loss (FVPL), the initial
measurement of financial assets includes transaction costs. The Group classifies its financial
assets into the following categories: financial assets at FVPL, held-to-maturity (HTM)
investments, AFS investments, and loans and receivables. The Group classifies its financial
liabilities into financial liabilities at FVPL and other financial liabilities. The classification
depends on the purpose for which the investments were acquired and whether they are quoted in
an active market. Management determines the classification of its investments at initial
recognition and, where allowed and appropriate, re-evaluates such designation at every reporting
date.
Reclassification of financial assets
A financial asset is reclassified out of the FVPL category when the following conditions are met:
·
·
the financial asset is no longer held for the purpose of selling or repurchasing it in the near
term; and
there is a rare circumstance.
*SGVMC111910*
- 62 A financial asset that is reclassified out of the FVPL category is reclassified at its fair value on the
date of reclassification. Any gain or loss already recognized in the consolidated statement of
income is not reversed. The fair value of the financial asset on the date of reclassification
becomes its new cost or amortized cost, as applicable.
Determination of fair value
The fair value for financial instruments traded in active markets at the balance sheet date is based
on their quoted market price or dealer price quotations (bid price for long positions and ask price
for short positions), without any deduction for transaction costs. When current bid and ask prices
are not available, the price of the most recent transaction provides evidence of the current fair
value as long as there has not been a significant change in economic circumstances since the time
of the transaction.
For all other financial instruments not listed in an active market, the fair value is determined by
using appropriate valuation techniques. Valuation techniques include net present value
techniques, comparison to similar instruments for which market observable prices exist, options
pricing models and other relevant valuation models.
Day 1 difference
Where the transaction price in a non-active market is different from the fair value based on other
observable current market transactions in the same instrument or based on a valuation technique
whose variables include only data from an observable market, the Group recognizes the difference
between the transaction price and fair value (a Day 1 difference) in the consolidated statement of
income. In cases where variables used are made of data which is not observable, the difference
between the transaction price and model value is only recognized in the consolidated statement of
income when the inputs become observable or when the instrument is derecognized. For each
transaction, the Group determines the appropriate method of recognizing the Day 1 difference
amount.
Financial assets and financial liabilities at FVPL
Financial assets and financial liabilities at FVPL include financial assets and financial liabilities
held for trading purposes, derivative instruments, or those designated upon initial recognition
when any of the following criteria are met:
·
·
·
the designation eliminates or significantly reduces the inconsistent treatment that would
otherwise arise from measuring the assets or liabilities or recognizing gains or losses on them
on a different basis; or
the assets and liabilities are part of a group of financial assets, financial liabilities or both
which are managed and their performance are evaluated on a fair value basis, in accordance
with a documented risk management or investment strategy; or
the financial instrument contains an embedded derivative, unless the embedded derivative
does not significantly modify the cash flows or it is clear, with little or no analysis, that it
would not be separately recorded.
Financial assets and financial liabilities at FVPL are recorded in the consolidated balance sheet at
fair value. Changes in fair value are reflected in the consolidated statement of income. Interest
earned or incurred is recorded in interest income or expense, respectively, while dividend income
is recorded in other operating income according to the terms of the contract, or when the right of
the payment has been established.
*SGVMC111910*
- 63 The Group’s financial assets at FVPL consist of private bonds, government securities and equity
securities (Note 8).
Derivatives recorded at FVPL
The Parent Company is counterparty to certain derivative contracts, such as currency forwards.
These derivatives are entered into as a means of reducing or managing their respective foreign
exchange and interest rate exposures, as well as for trading purposes. Such derivative financial
instruments are initially recorded at fair value on the date at which the derivative contract is
entered into and are subsequently remeasured at fair value. Any gains or losses arising from
changes in fair values of derivatives (except those accounted for as accounting hedges) are taken
directly to the consolidated statement of income. Derivatives are carried as assets when the fair
value is positive and as liabilities when the fair value is negative.
For the purpose of hedge accounting, hedges are classified primarily as either: (a) a hedge of the
fair value of an asset, liability or a firm commitment (fair value hedge); or (b) a hedge of the
exposure to variability in cash flows attributable to an asset or liability or a forecasted transaction
(cash flow hedge). In 2008 and 2007, the Group did not apply hedge accounting treatment for its
derivative transactions.
The fair values of the Group’s derivative instruments are calculated by using certain standard
valuation methodologies and quotes obtained from third parties.
The Group assesses the existence of an embedded derivative on the date it first becomes a party to
the contract, and performs re-assessment where there is a change to the contract that significantly
modifies the cash flows.
The Group has identified certain derivatives that are embedded in host contracts (such as debt
instruments). These embedded derivatives include foreign currency denominated derivatives in
purchase orders. Embedded derivatives are bifurcated from their host contracts and carried at fair
value with fair value changes being reported through profit or loss, when the entire hybrid
contracts (composed of both the host contract and the embedded derivative) are not accounted for
as financial instruments at FVPL, and when their economic risks and characteristics are not
closely related to those of their respective host contracts.
Loans and receivables
Loans and receivables are nonderivative financial assets with fixed or determinable payments and
fixed maturities that are not quoted in an active market. After initial measurement, loans and
receivables are subsequently carried at amortized cost using the effective interest rate (EIR)
method less any allowance for impairment. Amortized cost is calculated taking into account any
discount or premium on acquisition and includes fees that are an integral part of the EIR and
transaction costs. The amortization is included under the Interest income account in the
consolidated statement of income. Gains and losses are recognized in the consolidated statement
of income when the loans and receivables are derecognized or impaired, as well as through the
amortization process.
This accounting policy applies primarily to the Group’s trade and other receivables (Note 10).
*SGVMC111910*
- 64 AFS investments
AFS investments are those nonderivative investments which are designated as such or do not
qualify to be classified or designated as financial assets at FVPL, HTM investments or loans and
receivables. They are purchased and held indefinitely, and may be sold in response to liquidity
requirements or changes in market conditions.
After initial measurement, AFS investments are subsequently measured at fair value. The
effective yield component of AFS debt securities, as well as the impact of restatement on foreign
currency-denominated AFS debt securities, is reported in the consolidated statement of income.
The unrealized gains and losses arising from the fair valuation of AFS investments are excluded,
net of tax, from reported earnings and are reported under the Equity section of the consolidated
balance sheet, if any.
When the security is disposed of, the cumulative gain or loss previously recognized in equity is
recognized in the consolidated statement of income. Interest earned on holding AFS investments
are reported as interest income using the EIR. Where the Group holds more than one (1)
investment in the same security these are deemed to be disposed of on a first-in, first-out basis.
Dividends earned on holding AFS investments are recognized in the consolidated statement of
income, when the right to receive payment has been established. The losses arising from
impairment of such investments are recognized in the consolidated statement of income.
Other financial liabilities
Issued financial instruments or their components, which are not designated at FVPL are classified
as other financial liabilities where the substance of the contractual arrangement results in the
Group having an obligation either to deliver cash or another financial asset to the holder, or to
satisfy the obligation other than by the exchange of a fixed amount of cash or another financial
asset for a fixed number of own equity shares. The components of issued financial instruments
that contain both liability and equity elements are accounted for separately, with the equity
component being assigned the residual amount after deducting from the instrument as a whole the
amount separately determined as the fair value of the liability component on the date of issue.
After initial measurement, other financial liabilities are subsequently measured at amortized cost
using the EIR method. Amortized cost is calculated by taking into account any discount or
premium on the issue and fees that are an integral part of the EIR.
This accounting policy applies primarily to the Group’s short-term and long-term debt, accounts
payable and other accrued liabilities and other obligations that meet the above definition (other
than liabilities covered by other accounting standards, such as income tax payable).
Classification of Financial Instruments Between Debt and Equity
A financial instrument is classified as debt if it provides for a contractual obligation to:
·
·
·
deliver cash or another financial asset to another entity; or
exchange financial assets or financial liabilities with another entity under conditions that are
potentially unfavorable to the Group; or
satisfy the obligation other than by the exchange of a fixed amount of cash or another financial
asset for a fixed number of own equity shares.
*SGVMC111910*
- 65 If the Group does not have an unconditional right to avoid delivering cash or another financial
asset to settle its contractual obligation, the obligation meets the definition of a financial liability.
The components of issued financial instruments that contain both liability and equity elements are
accounted for separately, with the equity component being assigned the residual amount after
deducting from the instrument as a whole the amount separately determined as the fair value of the
liability component on the date of issue.
Impairment of Financial Assets
The Group assesses at each balance sheet date whether there is objective evidence that a financial
asset or group of financial assets is impaired. A financial asset or a group of financial assets is
deemed to be impaired if, and only if, there is objective evidence of impairment as a result of one
(1) or more events that has occurred after the initial recognition of the asset (an incurred ‘loss
event’) and that loss event (or events) has an impact on the estimated future cash flows of the
financial asset or the group of financial assets that can be reliably estimated. Evidence of
impairment may include indications that the borrower or a group of borrowers is experiencing
significant financial difficulty, default or delinquency in interest or principal payments, the
probability that they will enter bankruptcy or other financial reorganization and where observable
data indicate that there is a measurable decrease in the estimated future cash flows, such as
changes in arrears or economic conditions that correlate with defaults.
Financial assets carried at amortized cost
If there is objective evidence that an impairment loss on financial assets carried at amortized cost
(i.e. receivables) has been incurred, the amount of the loss is measured as the difference between
the asset’s carrying amount and the present value of estimated future cash flows discounted at the
asset’s original EIR. The carrying amount of the asset is reduced through the use of an allowance
account. The loss is recognized in the consolidated statement of income. The asset, together with
the associated allowance accounts, is written off when there is no realistic prospect of future
recovery.
The Group first assesses whether objective evidence of impairment exists individually for
financial assets that are individually significant, and individually or collectively for financial
assets that are not individually significant. If it is determined that no objective evidence of
impairment exists for an individually assessed financial asset, whether significant or not, the asset
is included in a group of financial assets with similar credit risk characteristics and that group of
financial assets is collectively assessed for impairment. Those characteristics are relevant to the
estimation of future cash flows for groups of such assets by being indicative of the debtor’s ability
to pay all amounts due according to the contractual terms of the assets being evaluated. Assets
that are individually assessed for impairment and for which an impairment loss is or continues to
be recognized are not included in a collective assessment of impairment.
If, in a subsequent period, the amount of the impairment loss decreases and the decrease can be
related objectively to an event occurring after the impairment was recognized, the previously
recognized impairment loss is reversed. Any subsequent reversal of an impairment loss is
recognized in the consolidated statement of income to the extent that the carrying value of the
asset does not exceed its amortized cost at the reversal date.
*SGVMC111910*
- 66 The Group performs a regular review of the age and status of these accounts, designed to identify
accounts with objective evidence of impairment and provide the appropriate allowance for
impairment loss. The review is accomplished using a combination of specific and collective
assessment approaches, with the impairment loss being determined for each risk grouping
identified by the Group (Note 4).
AFS investments
The Group assesses at each balance sheet date whether there is objective evidence that a financial
asset or group of financial assets is impaired. In case of equity investments classified as AFS
investments, this would include a significant or prolonged decline in the fair value of the
investments below its cost. Where there is evidence of impairment, the cumulative loss which is
measured as the difference between the acquisition cost and the current fair value, less any
impairment loss on that financial asset previously recognized in the consolidated statement of
income is removed from equity and recognized in the consolidated statement of income.
Impairment losses on equity investments are not reversed through the consolidated statement of
income. Increases in fair value after impairment are recognized directly in equity.
In the case of debt instruments classified as AFS investments, impairment is assessed based on the
same criteria as financial assets carried at amortized cost. Interest continues to be accrued at the
original EIR on the reduced carrying amount of the asset and is recorded under Interest Income
account in the consolidated statement of income. If, in subsequent year, the fair value of a debt
instrument increases, and the increase can be objectively related to an event occurring after the
impairment loss was recognized in the consolidated statement of income, the impairment loss is
reversed through the consolidated statement of income.
Derecognition of Financial Instruments
Financial assets
A financial asset (or, where applicable a part of a financial asset or part of a group of financial
assets) is derecognized where:
·
·
·
the rights to receive cash flows from the asset have expired;
the Group retains the right to receive cash flows from the asset, but has assumed an obligation
to pay them in full without material delay to a third party under a “pass-through” arrangement;
or
the Group has transferred its rights to receive cash flows from the asset and either (a) has
transferred substantially all the risks and rewards of ownership and retained control of the
asset, or (b) has neither transferred nor retained the risk and rewards of the asset but has
transferred the control of the asset.
Where the Group has transferred its rights to receive cash flows from an asset or has entered into a
pass-through arrangement, and has neither transferred nor retained substantially all the risks and
rewards of the asset nor transferred control of the asset, the asset is recognized to the extent of the
Group’s continuing involvement in the asset. Continuing involvement that takes the form of a
guarantee over the transferred asset is measured at the lower of original carrying amount of the
asset and the maximum amount of consideration that the Group could be required to repay.
*SGVMC111910*
- 67 Financial liabilities
A financial liability is derecognized when the obligation under the liability is discharged or
cancelled or has expired. Where an existing financial liability is replaced by another from the
same lender on substantially different terms, or the terms of an existing liability are substantially
modified, such an exchange or modification is treated as a derecognition of the original liability
and the recognition of a new liability, and the difference in the respective carrying amounts is
recognized in the consolidated statement of income.
Financial Guarantee Contracts
In the ordinary course of business, the Parent Company gives financial guarantees. Financial
guarantees are initially recognized in the financial statements at fair value, and the initial fair value
is amortized over the life of the financial guarantee. The guarantee liability is subsequently
carried at the higher of this amortized amount and the present value of any expected payment
(when a payment under the guaranty has become probable).
Offsetting Financial Instruments
Financial assets and financial liabilities are offset and the net amount is reported in the
consolidated balance sheet if, and only if, there is a currently enforceable legal right to offset the
recognized amounts and there is an intention to settle on a net basis, or to realize the asset and
settle the liability simultaneously. This is not generally the case with master netting agreements;
thus, the related assets and liabilities are presented gross in the consolidated balance sheet.
Inventories
Inventories, including goods-in-process, are valued at the lower of cost or net realizable value
(NRV). NRV is the estimated selling price in the ordinary course of business, less estimated costs
of completion and the estimated costs necessary to make the sale. NRV for materials, spare parts
and other supplies represents the related replacement costs.
Costs incurred in bringing each product to its present location and condition are accounted for as
follows:
Finished goods, work-in-process, raw materials, containers and packaging materials
Cost is determined using the average method. Finished goods and work-in-process include direct
materials and labor, and a proportion of manufacturing overhead costs based on actual goods
processed and produced, but excluding borrowing costs.
Materials in-transit
Cost is determined using the specific identification basis.
Spare parts and supplies
Cost is determined using the average method.
Assets Held for Sale
The Group classifies assets as held for sale (disposal group) when their carrying amount will be
recovered principally through a sale transaction rather than through continuing use. For this to be
the case, the asset must be available for immediate sale in its present condition subject only to
terms that are usual and customary for sales of such assets and its sale must be highly probable.
For the sale to be highly probable, the appropriate level of management must be committed to a
*SGVMC111910*
- 68 plan to sell the asset and an active program to locate a buyer and complete the plan must have
been initiated. Furthermore, the asset must be actively marketed for sale at a price that is
reasonable in relation to its current fair value. In addition, the sale should be expected to qualify
for recognition as a completed sale within one (1) year from the date of classification.
The related results of operations and cash flows of the disposal group that qualify as discontinued
operations are separated from the results of those that would be recovered principally through
continuing use, and prior years’ consolidated statement of income and consolidated statement of
cash flows are re-presented. The results of operations and cash flows of the disposal group that
qualify as discontinued operations are presented in the consolidated statement of income and
consolidated statement of cash flows as items associated with discontinued operations.
Property, Plant and Equipment
Property, plant and equipment, except land, are carried at cost less accumulated depreciation and
amortization and impairment losses, if any. The cost of an item of property, plant and equipment
comprises its purchase price and any cost attributable in bringing the asset to its intended location
and working condition. Cost also includes: (a) interest and other financing charges on borrowed
funds used to finance the acquisition of property, plant and equipment to the extent incurred
during the period of installation and construction; and (b) asset retirement obligation (ARO)
relating to property, plant and equipment installed/constructed on leased properties, if any.
Land is stated at cost less any impairment in value.
Subsequent costs are capitalized as part of the Property, plant and equipment account, only when it
is probable that future economic benefits associated with the item will flow to the Group and the
cost of the item can be measured reliably. All other repairs and maintenance are charged against
current operations as incurred.
Foreign exchange differentials arising from the acquisition of property, plant and equipment are
charged against current operations and are no longer capitalized.
Construction in-progress are transferred to the related Property, Plant and Equipment account
when the construction or installation and related activities necessary to prepare the property, plant
and equipment for their intended use are completed, and the property, plant and equipment are
ready for service.
Depreciation and amortization of property, plant and equipment commence, once the property,
plant and equipment are available for use and are computed using the straight-line method over the
estimated useful lives (EUL) of the assets regardless of utilization.
The EUL of property, plant and equipment of the Group follow:
Land improvements
Buildings and improvements
Machinery and equipment
Transportation equipment
Furniture, fixtures and equipment
20 years
10-30 years
10 years
5 years
5 years
*SGVMC111910*
- 69 Leasehold improvements are amortized over the shorter of their EUL or the corresponding lease
terms.
Major spare parts and stand-by equipment items that the Group expects to use over more than one
(1) period and can be used only in connection with an item of property, plant and equipment are
accounted for as property, plant and equipment. Depreciation and amortization on these major
spare parts and stand-by equipment commence once these have become available for use (i.e.
when it is in the location and condition necessary for it to be capable of operating in the manner
intended by the Group).
An item of property, plant and equipment is derecognized upon disposal or when no future
economic benefits are expected to arise from the continued use of the asset. Any gain or loss
arising on derecognition of the asset (calculated as the difference between the net disposal
proceeds and the carrying amount of the item) is included in the consolidated statement of income,
in the year the item is derecognized.
The assets’ residual values, useful lives and methods of depreciation and amortization are
reviewed and adjusted, if appropriate, at each financial year-end.
Investment Properties
Investment properties consist of properties that are held to earn rentals or for capital appreciation
or both, and those which are not occupied by entities in the Group. Investment properties, except
for land, are carried at cost less accumulated depreciation and any impairment in value. Land is
carried at cost less any impairment in value. The carrying amount includes the cost of replacing
part of an existing investment property at the time that cost is incurred if the recognition criteria
are met; and excludes the cost of day-to-day servicing of an investment property.
The Group’s investment properties are depreciated using the straight-line method over their EUL
as follows:
Land improvements
Buildings and building improvements
10 years
10 to 30 years
Investment properties are derecognized when either they have been disposed of or when the
investment properties are permanently withdrawn from use and no future economic benefit is
expected from their disposal. Any gains or losses on the retirement or disposal of investment
properties are recognized in the consolidated statement of income in the year of retirement or
disposal.
Transfers are made to investment property when, and only when, there is a change in use,
evidenced by the end of owner occupation, commencement of an operating lease to another party
or by the end of construction or development. Transfers are made from investment property when,
and only when, there is a change in use, evidenced by commencement of owner occupation or
commencement of development with a view to sale.
*SGVMC111910*
- 70 For a transfer from investment property to owner-occupied property to inventories, the deemed
cost of property for subsequent accounting is its fair value at the date of change in use. If the
property occupied by the Group as an owner-occupied property becomes an investment property,
the Group accounts for such property in accordance with the policy stated under Property, Plant
and Equipment account up to the date of change in use.
Biological Assets
The biological assets of the Group are divided into two (2) major categories with sub-categories as
follows:
Swine livestock
-
Poultry livestock
-
Breeders (livestock bearer)
Sucklings (breeders’ offspring)
Weanlings (comes from sucklings intended to be breeders or to be
sold as fatteners)
Fatteners/finishers (comes from weanlings unfit to become breeders;
intended for the production of meat)
Breeders (livestock bearer)
Chicks (breeders’ offspring intended to be sold as breeders)
A biological asset shall be measured on initial recognition and at each balance sheet date at its fair
value less estimated point-of-sale costs, except for a biological asset where fair value is not clearly
determinable. Agricultural produce harvested from an entity’s biological assets shall be measured
at its fair value less estimated point-of-sale costs.
The Group is unable to measure fair values reliably for its poultry livestock breeders in the
absence of: (a) an available market determined prices or values; and (b) alternative estimates of
fair values that are determined to be clearly reliable; thus, these biological assets are measured at
cost less accumulated depreciation and any accumulated impairment losses. However, once the
fair values become reliably measurable, the Group measures these biological assets at their fair
values less estimated point-of-sale costs.
Agricultural produce is the harvested product of the Group’s biological asset. A harvest occurs
when agricultural produce is either detached from the bearer biological asset or when the asset’s
life processes of the agricultural produce ceases. A gain or loss arising on initial recognition of
agricultural produce at fair value less estimated point-of-sale cost shall be included in the
consolidated statement of income in the period in which it arises. The agricultural produce in
swine livestock is the suckling that transforms into weanling then into fatteners/finishers, while
the agricultural produce in poultry livestock is the hatched chick.
Biological assets at cost
The cost of an item of biological asset comprises its purchase price and any costs attributable in
bringing the biological asset to its location and conditions intended by management.
*SGVMC111910*
- 71 Depreciation is computed using the straight-line method over the EUL of the biological assets,
regardless of utilization. The EUL of biological assets is reviewed annually based on expected
utilization as anchored on business plans and strategies that considers market behavior to ensure
that the period of depreciation is consistent with the expected pattern of economic benefits from
items of biological assets. The EUL of biological assets ranges from two (2) to three (3) years.
The carrying values of biological assets are reviewed for impairment when events or changes in
the circumstances indicate that the carrying values may not be recoverable (see further discussion
under Impairment of Nonfinancial Assets).
Biological assets carried at fair values less estimated point-of-sale costs
Swine livestock are measured at their fair values less point-of-sale costs. The fair values are
determined based on current market prices of livestock of similar age, breed and genetic merit.
Point-of-sale costs include commissions to brokers and dealers, nonrefundable transfer taxes and
duties. Point-of-sale costs exclude transport and other costs necessary to get the biological assets
to the market.
A gain or loss on initial recognition of a biological asset at fair value less estimated point-of-sale
costs and from a change in fair value less estimated point-of-sale costs of a biological asset shall
be included in the consolidated statement of income in the period in which it arises.
Investments in an Associate and a Joint Venture
The Group’s 19% investment in Robinsons Land Corporation (RLC), an associate, is accounted
for using the equity method of accounting. An associate is an entity in which the Group has
significant influence and which is neither a subsidiary nor a joint venture. In 2007, the Group sold
its investment in RLC (Note 17).
The Group also has a 50% interest in Hunt-Universal Robina Corporation (HURC), a joint venture
which is a jointly controlled entity. A joint venture is a contractual arrangement whereby two (2)
or more parties undertake an economic activity that is subject to joint control, and a jointly
controlled entity is a joint venture that involves the establishment of a separate entity in which
each venturer has an interest.
The Group’s investments in its associate and joint venture are accounted for using the equity
method of accounting. Under the equity method, the investments in associate and joint venture are
carried in the consolidated balance sheet at cost plus post-acquisition changes in the Group’s share
of net assets of the associate and joint venture. The consolidated statement of income reflects the
share of the results of operations of the associate and joint venture. Where there has been a
change recognized directly in the investees’ equity, the Group recognizes its share of any changes
and discloses this, when applicable, in the consolidated statement of changes in equity. Profits
and losses arising from transactions between the Group and the associate are eliminated to the
extent of the interest in the associate and joint venture.
The investee companies’ accounting policies conform to those used by the Group for like
transactions and events in similar circumstances.
*SGVMC111910*
- 72 Goodwill
Goodwill represents the excess of the cost of the acquisition over the fair value of identifiable net
assets of the investee at the date of acquisition which is not identifiable to specific assets.
Goodwill acquired in a business combination from the acquisition date is allocated to each of the
Group’s cash-generating units, or groups of cash-generating units that are expected to benefit from
the synergies of the combination, irrespective of whether other assets or liabilities of the Group are
assigned to those units or groups of units. Each unit or group of units to which the goodwill is so
allocated:
·
·
represents the lowest level within the Group at which the goodwill is monitored for internal
management purposes; and
is not larger than a segment based on either the Group’s primary or secondary reporting format
determined in accordance with PAS 14, Segment Reporting.
Following initial recognition, goodwill is measured at cost, less any accumulated impairment
losses. Goodwill is reviewed for impairment annually or more frequently, if events or changes in
circumstances indicate that the carrying value may be impaired (see further discussion under
Impairment of Nonfinancial Assets).
If the acquirer’s interest in the net fair value of the identifiable assets, liabilities and contingent
liabilities exceeds the costs of the business combination, the acquirer shall recognize immediately
in the consolidated statement of income any excess remaining after reassessment.
Intangible Assets
Intangible assets acquired separately are measured on initial recognition at cost. Following initial
recognition, intangible assets are measured at cost less any accumulated amortization and
impairment losses, if any. The useful lives of intangible assets with finite life are assessed at the
individual asset level. Intangible assets with finite life are amortized over their useful lives.
Periods and method of amortization for intangible assets with finite useful lives are reviewed
annually or earlier when an indicator of impairment exists.
The EUL of intangible assets are assessed to be either finite or indefinite.
Intangible assets with finite lives are amortized over the EUL and assessed for impairment,
whenever there is an indication that the intangible assets may be impaired. The amortization
period and the amortization method for an intangible asset with a finite useful life are reviewed at
least at each financial year-end. Changes in the EUL or the expected pattern of consumption of
future economic benefits embodied in the asset is accounted for by changing the amortization
period or method, as appropriate, and treated as changes in accounting estimates. The
amortization expense on intangible assets with finite useful lives is recognized in the consolidated
statement of income in the expense category consistent with the function of the intangible asset.
Intangible assets with indefinite useful lives are tested for impairment annually either individually
or at the cash-generating unit level (see further discussion under Impairment of Nonfinancial
Assets). Such intangibles are not amortized. The useful life of an intangible asset with an
indefinite useful life is reviewed annually to determine whether indefinite life assessment
continues to be supportable. If not, the change in the useful life assessment from indefinite to
finite is made on a prospective basis.
*SGVMC111910*
- 73 A gain or loss arising from derecognition of an intangible asset is measured as the difference
between the net disposal proceeds and the carrying amount of the asset and is recognized in the
consolidated statement of income when the asset is derecognized.
A summary of the policies applied to the Group’s intangible assets follow:
Useful lives
Amortization method used
Internally generated or acquired
Product Formulation
Indefinite
No amortization
Acquired
Trademarks
Indefinite
Finite (4 years)
Straight-line
amortization
No amortization
Acquired
Acquired
Impairment of Nonfinancial Assets
This accounting policy applies primarily to the Group’s property, plant and equipment (Note 13),
investment properties (Note 18), investment in an associate and a joint venture (Note 17), and
intangible assets with finite lives (Note 16).
The Group assesses at each reporting date whether there is an indication that its nonfinancial
assets may be impaired. When an indicator of impairment exists or when an annual impairment
testing for an asset is required, the Group makes a formal estimate of recoverable amount.
Recoverable amount is the higher of an asset’s (or cash-generating unit’s) fair value less costs to
sell and its value in use and is determined for an individual asset, unless the asset does not
generate cash inflows that are largely independent of those from other assets or groups of assets, in
which case the recoverable amount is assessed as part of the cash-generating unit to which it
belongs. Where the carrying amount of an asset (or cash generating unit) exceeds its recoverable
amount, the asset (or cash-generating unit) is considered impaired and is written down to its
recoverable amount. In assessing value in use, the estimated future cash flows are discounted to
their present value using a pre-tax discount rate that reflects current market assessments of the
time value of money and the risks specific to the asset (or cash-generating unit).
Impairment losses are recognized under Impairment losses account in the consolidated statement
of income.
For assets excluding goodwill, an assessment is made at each reporting date as to whether there is
any indication that previously recognized impairment losses may no longer exist or may have
decreased. If such indication exists, the recoverable amount is estimated. A previously
recognized impairment loss is reversed only if there has been a change in the estimates used to
determine the asset’s recoverable amount since the last impairment loss was recognized. If that is
the case, the carrying amount of the asset is increased to its recoverable amount. That increased
amount cannot exceed the carrying amount that would have been determined, net of depreciation,
had no impairment loss been recognized for the asset in prior years. Such reversal is recognized in
the consolidated statement of income. After such a reversal, the depreciation expense is adjusted
in future years to allocate the asset’s revised carrying amount, less any residual value, on a
systematic basis over its remaining life.
The following criteria are also applied in assessing impairment of specific assets:
Goodwill
Goodwill is reviewed for impairment, annually or more frequently, if events or changes in
circumstances indicate that the carrying value may be impaired.
*SGVMC111910*
- 74 Impairment is determined by assessing the recoverable amount of the cash-generating unit (or
group of cash-generating units) to which the goodwill relates. Where the recoverable amount of
the cash-generating unit (or group of cash-generating units) is less than the carrying amount to
which goodwill has been allocated, an impairment loss is recognized. Where goodwill forms part
of a cash-generating unit (or group of cash-generating units) and part of the operation within that
unit are disposed of, the goodwill associated with the operation disposed of is included in the
carrying amount of the operation when determining the gain or loss on disposal of the operation.
Goodwill disposed of in this circumstance is measured on the basis of the relative fair values of
the operation disposed of and the portion of the cash-generating unit retained. Impairment losses
relating to goodwill cannot be reversed in future periods.
Biological assets at cost
The carrying values of biological assets are reviewed for impairment when events or changes in
the circumstances indicate that the carrying values may not be recoverable.
Intangible assets
Intangible assets with indefinite useful lives are tested for impairment annually as of year-end
either individually or at the cash-generating level, as appropriate.
Investment in an associate and a joint venture
After application of the equity method, the Group determines whether it is necessary to recognize
an additional impairment loss of the Group’s investments in its associate and joint venture. If this
is the case, the Group calculates the amount of impairment as being the difference between the fair
value of the associate and the acquisition cost and recognizes the amount in the consolidated
statement of income.
Short-term and Long-term Debt
All loans and borrowings are initially recognized at the fair value of the consideration received
less directly attributable debt issuance costs.
After initial recognition, interest-bearing loans and borrowings are subsequently measured at
amortized cost using the EIR method. Amortized cost is calculated by taking into account any
issue costs, and any discount or premium on settlement.
Gains and losses are recognized in the consolidated statement of income when the liabilities are
derecognized or impaired, as well as through the amortization process.
Debt Issuance Costs
Debt issuance costs are amortized using the EIR method and unamortized debt issuance costs are
offset against the related carrying value of the loan in the consolidated balance sheet. When a loan
is paid, the related unamortized debt issuance costs at the date of repayment are charged against
current operations (see accounting policy on Financial Instruments).
*SGVMC111910*
- 75 Treasury Shares
Treasury shares are recorded at cost and are presented as a deduction from equity. When the
shares are retired, the capital stock account is reduced by its par value. The excess of cost over par
value upon retirement is debited to the following accounts in the order given: (a) additional paid-in
capital to the extent of the specific or average additional paid-in capital when the shares were
issued, and (b) retained earnings. No gain or loss is recognized in the consolidated statement of
income on the purchase, sale, issue or cancellation of the Group’s own equity instruments.
Provisions
Provisions are recognized when: (a) the Group has a present obligation (legal or constructive) as a
result of a past event; (b) it is probable (i.e. more likely than not) that an outflow of resources
embodying economic benefits will be required to settle the obligation; and (c) a reliable estimate
can be made of the amount of the obligation. Provisions are reviewed at each balance sheet date
and adjusted to reflect the current best estimate. If the effect of the time value of money is
material, provisions are determined by discounting the expected future cash flows at a pre-tax rate
that reflects current market assessment of the time value of money and, where appropriate, the
risks specific to the liability. Where discounting is used, the increase in the provision due to the
passage of time is recognized as an interest expense in the consolidated statement of income.
Where the Group expects a provision to be reimbursed, the reimbursement is recognized as a
separate asset but only when the reimbursement is probable.
Contingencies
Contingent liabilities are not recognized in the consolidated financial statements but disclosed
unless the possibility of an outflow of resources embodying economic benefits is remote.
Contingent assets are not recognized in the consolidated financial statements but disclosed when
an inflow of economic benefits is probable.
Pension Costs
Pension cost is actuarially determined using the projected unit credit method. This method reflects
services rendered by employees up to the date of valuation and incorporates assumptions
concerning employees’ projected salaries. Actuarial valuations are conducted with sufficient
regularity, with option to accelerate when significant changes to underlying assumptions occur.
Pension cost includes current service cost, interest cost, expected return on any plan assets,
actuarial gains and losses and the effect of any curtailments or settlements.
Actuarial gains and losses arising from experience adjustments and changes in actuarial
assumptions are credited to or charged against income when the net cumulative unrecognized
actuarial gains and losses at the end of the previous period exceed 10% of the higher of the present
value of the defined benefit obligation and the fair value of plan assets at that date. The excess
actuarial gains or losses are recognized over the average remaining working lives of the employees
participating in the plan.
The asset or liability recognized in the consolidated balance sheet in respect of defined benefit
pension plans is the present value of the defined benefit obligation as of the balance sheet date less
the fair value of plan assets, together with adjustments for unrecognized actuarial gains or losses
and past service costs. The value of any asset is restricted to the sum of any past service cost not
yet recognized and the present value of the any economic benefits available in the form of refunds
from the plan or reductions in the future contributions to the plan. The defined benefit obligation
*SGVMC111910*
- 76 is calculated annually by an independent actuary using the projected unit credit method. The
present value of the defined benefit obligation is determined by discounting the estimated future
cash inflows using risk-free interest rates that have terms to maturity approximating the terms of
the related pension liability.
Past service costs, if any, are recognized immediately in the consolidated statement of income,
unless the changes to the pension plan are conditional on the employees remaining in service for a
specified period of time (the vesting period). In this case, past service costs are amortized on a
straight-line basis over the vesting period.
Income Taxes
Current tax
Current tax assets and liabilities for the current and prior periods are measured at the amount
expected to be recovered from or paid to the taxation authorities. The tax rates and tax laws used
to compute the amount are those that are enacted or substantially enacted at the balance sheet date.
Deferred tax
Deferred tax is provided using the balance sheet liability method on all temporary differences,
with certain exceptions, at the balance sheet date between the tax bases of assets and liabilities and
their carrying amounts for financial reporting purposes.
Deferred tax liabilities are recognized for all taxable temporary differences, with certain
exceptions. Deferred tax assets are recognized for all deductible temporary differences with
certain exceptions, and carryforward benefits of unused tax credits from excess minimum
corporate income tax (MCIT) over regular corporate income tax and unused net operating loss
carryover (NOLCO), to the extent that it is probable that taxable income will be available against
which the deductible temporary differences and carryforward benefits of unused tax credits from
excess MCIT and unused NOLCO can be utilized.
Deferred tax assets are not recognized when they arise from the initial recognition of an asset or
liability in a transaction that is not a business combination and, at the time of transaction, affects
neither the accounting income nor taxable income or loss. Deferred tax liabilities are not provided
on nontaxable temporary differences associated with investments in domestic subsidiaries,
associates and interests in joint ventures. With respect to investments in foreign subsidiaries,
associates and interests in joint ventures, deferred tax liabilities are recognized except where the
timing of the reversal of the temporary differences can be controlled and it is probable that the
temporary difference will not reverse in the foreseeable future.
The carrying amounts of deferred tax assets are reviewed at each balance sheet date and reduced to
the extent that it is no longer probable that sufficient taxable income will be available to allow all
or part of the deferred tax assets to be utilized. Unrecognized deferred tax assets are reassessed at
each balance sheet date, and are recognized to the extent that it has become probable that future
taxable income will allow the deferred tax asset to be recognized.
Deferred tax assets and liabilities are measured at the tax rate that is expected to apply to the
period when the asset is realized or the liability is settled, based on tax rates (and tax laws) that
have been enacted or substantively enacted as of balance sheet date.
*SGVMC111910*
- 77 Income tax relating to items recognized directly in equity is recognized in equity and not in the
consolidated statement of income.
Deferred tax assets and deferred tax liabilities are offset if a legally enforceable right exists to set
off current tax assets against current tax liabilities and the deferred taxes relate to the same taxable
entity and the same taxation authority.
Leases
The determination of whether an arrangement is, or contains a lease, is based on the substance of
the arrangement at inception date, and requires an assessment of whether the fulfillment of the
arrangement is dependent on the use of a specific asset or assets and the arrangement conveys a
right to use the asset. A reassessment is made after inception of the lease only if one (1) of the
following applies:
a. there is a change in contractual terms, other than a renewal or extension of the arrangement;
b. a renewal option is exercised or an extension granted, unless that term of the renewal or
extension was initially included in the lease term;
c. there is a change in the determination of whether fulfillment is dependent on a specified asset;
or
d. there is a substantial change to the asset.
Where a reassessment is made, lease accounting shall commence or cease from the date when the
change in circumstances gave rise to the reassessment for any of the scenarios above, and at the
date of renewal or extension period for scenario b.
Group as a lessee
Leases where the lessor retains substantially all the risks and benefits of ownership of the asset are
classified as operating leases. Operating lease payments are recognized as an expense in the
consolidated statement of income on a straight-line basis over the lease term.
Group as a lessor
Leases where the Group does not transfer substantially all the risks and benefits of ownership of
the assets are classified as operating leases. Initial direct costs incurred in negotiating operating
leases are added to the carrying amount of the leased asset and recognized over the lease term on
the same basis as the rental income. Contingent rents are recognized as revenue in the period in
which they are earned.
Borrowing Costs
Borrowing costs are generally expensed as incurred. Interest and other finance costs incurred
during the construction period on borrowings used to finance property development are capitalized
to the appropriate asset accounts. Capitalization of borrowing costs commences when the
activities to prepare the asset are in-progress and expenditures and borrowing costs are being
incurred. The capitalization of these borrowing costs ceases when substantially all the activities
necessary to prepare the asset for sale or its intended use are complete. If the carrying amount of
the asset exceeds its recoverable amount, an impairment loss is recorded. Capitalized borrowing
cost is based on the applicable weighted average borrowing rate.
Interest expense on loans is recognized using the EIR method over the term of the loans.
*SGVMC111910*
- 78 Foreign Currency Translation/Transactions
The functional and presentation currency of the Parent Company and its Philippine subsidiaries
(except for certain consolidated foreign subsidiaries), is the Philippine Peso.
Each entity in the Group determines its own functional currency and items included in the
consolidated financial statements of each entity are measured using that functional currency.
Transactions in foreign currencies are initially recorded in the functional currency rate ruling at the
date of the transaction. Monetary assets and liabilities denominated in foreign currencies are
retranslated at the functional currency rate of exchange ruling at the balance sheet date. All
differences are taken to the consolidated statement of income with the exception of differences on
foreign currency borrowings that provide a hedge against a net investment in a foreign entity.
These are taken directly to equity until the disposal of the net investment, at which time they are
recognized in the consolidated statement of income. Tax charges and credits attributable to
exchange differences on those borrowings are also dealt with in equity. Nonmonetary items that
are measured in terms of historical cost in a foreign currency are translated using the exchange rate
as at the date of initial transaction. Nonmonetary items measured at fair value in a foreign
currency are translated using the exchange rates at the date when the fair value was determined.
The functional currencies of the Group’s consolidated foreign subsidiaries follow:
Subsidiaries
URCPL
URC Asean Brands Co. Ltd.
Hong Kong China Foods Co. Ltd.
URCICL
URCL
Shanghai Peggy Foods Co., Ltd.
Tianjin Pacific Foods Manufacturing Co., Ltd.
URC China Commercial Co. Ltd.
Xiamen Tongan Pacific Food Co., Ltd.
Panyu Peggy Foods Co., Ltd.
URC Hong Kong Company Limited (formerly Hong Kong
Peggy Snacks Foods Co., Limited)
PT URC Indonesia
URC Snack Foods (Malaysia) Sdn. Bhd.
(formerly Pacific World Sdn. Bhd.)
Ricellent Sdn. Bhd.
URC Foods (Singapore) Pte. Ltd. (formerly Pan
Pacific Snacks Pte. Ltd.)
Acesfood Network Pte. Ltd.
Advanson International Pte. Ltd.
URC (Thailand) Co., Ltd. (formerly Thai Peggy
Foods Co. Ltd.)
URC Vietnam Co., Ltd.
Country of
Incorporation
British Virgin Islands
- do - do - do Cayman Islands
China
- do - do - do - do -
Functional
Currency
US Dollar
- do - do - do - do Chinese Yuan
- do - do - do - do -
Hong Kong
Indonesia
HK Dollar
Indonesian Rupiah
Malaysia
- do -
Malaysian Ringgit
- do -
Singapore
- do - do -
Singapore Dollar
- do - do -
Thailand
Vietnam
Thai Baht
Vietnam Dong
As of reporting date, the assets and liabilities of these subsidiaries are translated into the
presentation currency of the Group at the rate of exchange ruling at the balance sheet date and
their respective statements of income are translated at the weighted average exchange rates for the
year. The exchange differences arising on the translation are taken directly to a separate
component of equity. On disposal of a foreign entity, the deferred cumulative amount recognized
in equity relating to that particular foreign operation shall be recognized in the consolidated
statement of income.
*SGVMC111910*
- 79 Earnings Per Share (EPS)
Basic EPS is computed by dividing net income applicable to common stock (net income less
dividends on preferred stock) by the weighted average number of common shares issued and
outstanding during the year, adjusted for any subsequent stock dividends declared.
Diluted EPS amounts are calculated by dividing the net profit attributable to ordinary equity
holders of the parent by the weighted average number of ordinary shares outstanding during the
year plus the weighted average number of ordinary shares that would be issued on the conversion
of all the dilutive potential ordinary shares into ordinary shares.
Segment Reporting
The Group’s operating businesses are organized and managed separately according to the nature
of the products and services provided, with each segment representing a strategic business unit
that offers different products and serves different markets. Financial information on business
segments is presented in Note 6 to the consolidated financial statements.
Subsequent Events
Any post year-end event up to the date of approval of the BOD of the consolidated financial
statements that provides additional information about the Group’s position at the balance sheet
date (adjusting event) is reflected in the consolidated financial statements. Any post year-end
event that is not an adjusting event is disclosed in the notes to the consolidated financial
statements, when material.
New Accounting Standards, Interpretations, and Amendments to Existing Standards Effective
Subsequent to September 30, 2008
The Group will adopt the following standards and interpretations enumerated below when these
become effective. Except as otherwise indicated, the Group does not expect the adoption of these
new and amended PFRS and Philippine Interpretations to have significant impact on its financial
statements.
Effective in 2009
· PFRS 1, First-time Adoption of PFRS - Cost of an Investment in a Subsidiary, Jointly
Controlled Entity or Associate
The amended PFRS 1 allows an entity, in its separate financial statements, to determine the
cost of investments in subsidiaries, jointly controlled entities or associates (in its opening
PFRS financial statements) as one of the following amounts: a) cost determined in accordance
with PAS 27; b) at the fair value of the investment at the date of transition to PFRS,
determined in accordance with PAS 39; or c) previous carrying amount (as determined under
generally accepted accounting principles) of the investment at the date of transition to PFRS.
·
PFRS 2, Share-based Payment - Vesting Condition and Cancellations
The standard has been revised to clarify the definition of a vesting condition and prescribes the
treatment for an award that is effectively cancelled. It defines a vesting condition as a
condition that includes an explicit or implicit requirement to provide services. It further
requires non-vesting conditions to be treated in a similar fashion to market conditions. Failure
to satisfy a non-vesting condition that is within the control of either the entity or the
counterparty is accounted for as cancellation. However, failure to satisfy a non-vesting
condition that is beyond the control of either party does not give rise to a cancellation.
*SGVMC111910*
- 80 ·
PFRS 8, Operating Segments
PFRS 8 will replace PAS 14, Segment Reporting, and adopts a full management approach to
identifying, measuring and disclosing the results of an entity’s operating segments. The
information reported would be that which management uses internally for evaluating the
performance of operating segments and allocating resources to those segments. Such
information may be different from that reported in the consolidated balance sheet and
consolidated statement of income and the Group will provide explanations and reconciliations
of the differences. This Standard is only applicable to an entity that has debt or equity
instruments that are traded in a public market or that files (or is in the process of filing) its
financial statements with a securities commission or similar party. The Group will assess the
impact of this Standard to its current manner of reporting segment information.
·
Amendments to PAS 1, Presentation of Financial Statements
This Amendment introduces a new statement of comprehensive income that combines all
items of income and expenses recognized in the profit or loss together with ‘other
comprehensive income’ (OCI). Entities may choose to present all items in one statement, or
to present two linked statements, a separate statement of income and a statement of
comprehensive income. This Amendment also requires additional requirements in the
presentation of the balance sheet and owner’s equity as well as additional disclosures to be
included in the financial statements. The Group will assess and evaluate the options available
under the amendment to PAS 1, and will comply with such changes once effective.
·
PAS 23, Borrowing Costs
The standard has been revised to require capitalization of borrowing costs when such costs
relate to a qualifying asset. A qualifying asset is an asset that necessarily takes a substantial
period of time to get ready for its intended use or sale. In accordance with the transitional
requirements in the standard, the Group will adopt this as a prospective change. Accordingly,
borrowing costs will be capitalized on qualifying assets with a commencement date after
January 1, 2009. No changes will be made for borrowing costs incurred to this date that have
been expensed.
·
Amendments to PAS 27, Consolidated and Separate Financial Statements - Cost of an
Investment in a Subsidiary, Jointly Controlled Entity or Associate
Amendments to PAS 27 will be effective on January 1, 2009 which has changes in respect of
the holding companies separate financial statements including (a) the deletion of ‘cost
method’, making the distinction between pre- and post-acquisition profits no longer required;
and (b) in cases of reorganizations where a new parent is inserted above an existing parent of
the group (subject to meeting specific requirements), the cost of the subsidiary is the previous
carrying amount of its share of equity items in the subsidiary rather than its fair value. All
dividends will be recognized in profit or loss. However, the payment of such dividends
requires the entity to consider whether there is an indicator of impairment. The Group does
not expect significant changes in its accounting policies when it adopts the foregoing
accounting changes effective January 1, 2009.
*SGVMC111910*
- 81 ·
Amendment to PAS 32, Financial Instruments: Presentation and PAS 1 Presentation of
Financial Statements - Puttable Financial Instruments and Obligations Arising on Liquidation
These amendments specify, among others, that puttable financial instruments will be classified
as equity if they have all of the following specified features: (a) The instrument entitles the
holder to require the entity to repurchase or redeem the instrument (either on an ongoing basis
or on liquidation) for a pro rata share of the entity’s net assets, (b) The instrument is in the
most subordinate class of instruments, with no priority over other claims to the assets of the
entity on liquidation,(c) All instruments in the subordinate class have identical features (d) The
instrument does not include any contractual obligation to pay cash or financial assets other
than the holder’s right to a pro rata share of the entity’s net assets, and (e) The total expected
cash flows attributable to the instrument over its life are based substantially on the profit or
loss, a change in recognized net assets, or a change in the fair value of the recognized and
unrecognized net assets of the entity over the life of the instrument.
·
Philippine Interpretation IFRIC 12, Service Concession Arrangements (effective for annual
periods beginning on or after January 1, 2008)
This Philippine Interpretation applies to service concession operators and explains how to
account for the obligations undertaken and rights received in service concession arrangements.
This Philippine Interpretation is not relevant to the Group.
·
Philippine Interpretation IFRIC 13, Customer Loyalty Programmes (effective for annual
periods beginning on or after July 1, 2008)
This Philippine Interpretation requires customer loyalty credits to be accounted for as a
separate component of the sales transaction in which they are granted and therefore part of the
fair value of the consideration received and is allocated to the award credits and deferred over
the period that the award credits are fulfilled. The Group expects that this Philippine
Interpretation will have no impact on the Group’s consolidated financial statements, as no
such scheme currently exists.
·
Philippine Interpretation IFRIC 14, PAS 19, The Limit on a Defined Benefit Asset, Minimum
Funding Requirements and their Interaction (effective for annual periods beginning on or
after January 1, 2008)
This Philippine Interpretation provides guidance on how to assess the limit on the amount of
surplus in a defined benefit scheme that can be recognized as an asset under PAS 19,
Employee Benefits. The Group will assess the impact of adoption when it applies Philippine
Interpretation IFRIC 14 in 2008.
·
Philippine Interpretation IFRIC 16, Hedges of a Net Investment in a Foreign Operation
(effective for annual periods beginning on or after October 1, 2008)
This Interpretation provides guidance on identifying foreign currency risks that qualify for
hedge accounting in the hedge of net investment; where within the group the hedging
instrument can be held in the hedge of a net investment; and how an entity should determine
the amount of foreign currency gains or losses, relating to both the net investment and the
hedging instrument, to be recycled on disposal of the net investment. Currently, the Group
has no hedges of a net investment in a foreign operation.
*SGVMC111910*
- 82 Improvements to PFRSs
In May 2008, the International Accounting Standards Board issued its first omnibus of
amendments to certain standards, primarily with a view to removing inconsistencies and clarifying
wording. There are the separate transitional provisions for each standard:
PFRS 5, Non-current Assets Held for Sale and Discontinued Operations
· When a subsidiary is held for sale, all of its assets and liabilities will be classified as held for
sale under PFRS 5, even when the entity retains a non-controlling interest in the subsidiary
after the sale.
PAS 1, Presentation of Financial Statements
· Assets and liabilities classified as held for trading are not automatically classified as current in
the balance sheet.
PAS 16, Property, Plant and Equipment
· The amendment replaces the term ‘net selling price’ with ‘fair value less costs to sell’, to be
consistent with PFRS 5, Non-current Assets Held for Sale and Discontinued Operations, and
PAS 36, Impairment of Assets.
· Items of property, plant and equipment held for rental that are routinely sold in the ordinary
course of business after rental, are transferred to inventory when rental ceases and they are
held for sale. Proceeds of such sales are subsequently shown as revenue. Cash payments on
initial recognition of such items, the cash receipts from rents and subsequent sales are all
shown as cash flows from operating activities.
PAS 19, Employee Benefits
· Revises the definition of ‘past service costs’ to include reductions in benefits related to past
services (‘negative past service costs’) and to exclude reductions in benefits related to future
services that arise from plan amendments. Amendments to plans that result in a reduction in
benefits related to future services are accounted for as a curtailment.
· Revises the definition of ‘return on plan assets’ to exclude plan administration costs if they
have already been included in the actuarial assumptions used to measure the defined benefit
obligation.
· Revises the definition of ‘short-term’ and ‘other long-term’ employee benefits to focus on the
point in time at which the liability is due to be settled.
· Deletes the reference to the recognition of contingent liabilities to ensure consistency with
PAS 37, Provisions, Contingent Liabilities and Contingent Assets.
PAS 20, Accounting for Government Grants and Disclosures of Government Assistance
· Loans granted with no or low interest rates will not be exempt from the requirement to impute
interest. The difference between the amount received and the discounted amount is accounted
for as a government grant.
PAS 23, Borrowing Costs
· Revises the definition of borrowing costs to consolidate the types of items that are considered
components of ‘borrowing costs’, i.e., components of the interest expense calculated using the
EIR method.
*SGVMC111910*
- 83 PAS 28, Investment in Associates
· If an associate is accounted for at fair value in accordance with PAS 39, only the requirement
of PAS 28 to disclose the nature and extent of any significant restrictions on the ability of the
associate to transfer funds to the entity in the form of cash or repayment of loans applies.
·
An investment in an associate is a single asset for the purpose of conducting the impairment
test. Therefore, any impairment test is not separately allocated to the goodwill included in the
investment balance.
PAS 29, Financial Reporting in Hyperinflationary Economies
· Revises the reference to the exception that assets and liabilities should be measured at
historical cost, such that it notes property, plant and equipment as being an example, rather
than implying that it is a definitive list.
PAS 31, Interest in Joint ventures
· If a joint venture is accounted for at fair value, in accordance with PAS 39, only the
requirements of PAS 31 to disclose the commitments of the venturer and the joint venture, as
well as summary financial information about the assets, liabilities, income and expense will
apply.
PAS 36, Impairment of Assets
· When discounted cash flows are used to estimate ‘fair value less cost to sell’ additional
disclosure is required about the discount rate, consistent with disclosures required when the
discounted cash flows are used to estimate ‘value in use’.
PAS 38, Intangible Assets
· Expenditure on advertising and promotional activities is recognized as an expense when the
Group either has the right to access the goods or has received the services. Advertising and
promotional activities now specifically include mail order catalogues.
· Deletes references to there being rarely, if ever, persuasive evidence to support an
amortization method for finite life intangible assets that results in a lower amount of
accumulated amortization than under the straight-line method, thereby effectively allowing the
use of the unit of production method.
PAS 39, Financial Instruments: Recognition and Measurement
· Changes in circumstances relating to derivatives - specifically derivatives designated or dedesignated as hedging instruments after initial recognition - are not reclassifications.
· When financial assets are reclassified as a result of an insurance company changing its
accounting policy in accordance with paragraph 45 of PFRS 4 Insurance Contracts, this is a
change in circumstance, not a reclassification.
· Removes the reference to a ‘segment’ when determining whether an instrument qualifies as a
hedge.
· Requires use of the revised effective interest rate (rather than the original effective interest
rate) when re-measuring a debt instrument on the cessation of fair value hedge accounting.
*SGVMC111910*
- 84 PAS 40, Investment Properties
· Revises the scope (and the scope of PAS 16, Property, Plant and Equipment) to include
property that is being constructed or developed for future use as an investment property.
Where an entity is unable to determine the fair value of an investment property under
construction, but expects to be able to determine its fair value on completion, the investment
under construction will be measured at cost until such time as fair value can be determined or
construction is complete.
PAS 41, Agriculture
· Removes the reference to the use of a pre-tax discount rate to determine fair value, thereby
allowing use of either a pre-tax or post-tax discount rate depending on the valuation
methodology used.
· Removes the prohibition to take into account cash flows resulting from any additional
transformations when estimating fair value. Instead, cash flows that are expected to be
generated in the ‘most relevant market’ are taken into account.
Effective in 2010
Revised PFRS 3, Business Combinations and PAS 27, Consolidated and Separate Financial
Statements
The revised PFRS 3 introduces a number of changes in the accounting for business combinations
that will impact the amount of goodwill recognized, the reported results in the period that an
acquisition occurs, and future reported results. The revised PAS 27 requires, among others, that
(a) change in ownership interests of a subsidiary (that do not result in loss of control) will be
accounted for as an equity transaction and will have no impact on goodwill nor will it give rise to
a gain or loss; (b) losses incurred by the subsidiary will be allocated between the controlling and
non-controlling interests (previously referred to as ‘minority interests’); even if the losses exceed
the non-controlling equity investment in the subsidiary; and (c) on loss of control of a subsidiary,
any retained interest will be remeasured to fair value and this will impact the gain or loss
recognized on disposal. The changes introduced by the revised PFRS 3 and PAS 27 must be
applied prospectively and will affect future acquisitions and transactions with non-controlling
interests.
Amendment to PAS 39, Financial Instruments: Recognition and Measurement - Eligible hedged
items
Amendment to PAS 39 will be effective on July 1, 2009, which addresses only the designation of
a one-sided risk in a hedged item, and the designation of inflation as a hedged risk or portion in
particular situations. The amendment clarifies that an entity is permitted to designate a portion of
the fair value changes or cash flow variability of a financial instrument as a hedged item.
Effective in 2012
Philippine Interpretation IFRIC 15, Agreement for Construction of Real Estate
This Interpretation covers accounting for revenue and associated expenses by entities that
undertake the construction of real estate directly or through subcontractors. This Interpretation
requires that revenue on construction of real estate be recognized only upon completion, except
when such contract qualifies as construction contract to be accounted for under PAS 11,
Construction Contracts, or involves rendering of services in which case revenue is recognized
based on stage of completion. Contracts involving provision of services with the construction
materials and where the risks and reward of ownership are transferred to the buyer on a continuous
basis, will also be accounted for based on stage of completion.
*SGVMC111910*
- 85 3. Significant Accounting Judgments and Estimates
The preparation of the consolidated financial statements in compliance with PFRS requires the
Group to make estimates and assumptions that affect the reported amounts of assets, liabilities,
income and expenses and disclosure of contingent assets and contingent liabilities. Future events
may occur which will cause the assumptions used in arriving at the estimates to change. The
effects of any change in estimates are reflected in the consolidated financial statements as they
become reasonably determinable.
Judgments and estimates are continually evaluated and are based on historical experience and
other factors, including expectations of future events that are believed to be reasonable under the
circumstances.
Judgments
In the process of applying the Group’s accounting policies, management has made the following
judgments, apart from those involving estimations, which have the most significant effect on the
amounts recognized in the consolidated financial statements:
Classification of financial instruments
The Group exercises judgment in classifying a financial instrument, or its component parts, on
initial recognition as either a financial asset, a financial liability or an equity instrument in
accordance with the substance of the contractual arrangement and the definitions of a financial
asset, a financial liability or an equity instrument. The substance of a financial instrument, rather
than its legal form, governs its classification in the consolidated balance sheet.
In addition, the Group classifies financial assets by evaluating, among others, whether the asset is
quoted or not in an active market. Included in the evaluation on whether a financial asset is
quoted in an active market is the determination on whether quoted prices are readily and regularly
available, and whether those prices represent actual and regularly occurring market transactions on
an arm’s length basis.
Determination of fair values of financial instruments
The Group carries certain financial assets and liabilities at fair value, which requires extensive use
of accounting judgment and estimates. While significant components of fair value measurement
were determined using verifiable objective evidence (i.e. foreign exchange rates, interest rates,
volatility rates), the amount of changes in fair value would differ if the Group utilized different
valuation methodologies and assumptions (Notes 4, 8, 14 and 21). Any changes in fair value of
these financial assets and liabilities would affect profit and loss and equity.
Where the fair values of certain financial assets and financial liabilities recorded in the
consolidated balance sheet cannot be derived from active markets, they are determined using
internal valuation techniques using generally accepted market valuation models. The inputs to
these models are taken from observable market data where possible, but where this is not feasible,
estimates are used in establishing fair values. The judgments include considerations of liquidity
and model inputs such as correlation and volatility for longer dated derivatives.
*SGVMC111910*
- 86 The fair values of the Group’s financial assets and financial liabilities which require use of
accounting judgments and estimates follow:
Financial assets at FVPL (Note 8)
Derivative assets (included under Financial assets
at FVPL account in the consolidated balance
sheets) (Note 8)
AFS investments (Note 14)
Derivative liabilities (included under Accounts
payable and other accrued liabilities account
in the consolidated balance sheets) (Note 21)
2007
2008
=16,536,713,409
P
= 5,968,487,826 P
10,697,053
6,304,842,703
(40,421,267)
155,375
–
(7,266,667)
Classification of leases
Management exercises judgment in determining whether substantially all the significant risks and
rewards of ownership of the leased assets are transferred to the Group. Lease contracts, which
transfer to the Group substantially all the risks and rewards incidental to ownership of the leased
items, are capitalized. Otherwise, they are considered as operating leases.
Distinction between investment properties and owner-occupied properties
The Group determines whether a property qualifies as an investment property. In making its
judgment, the Group considers whether the property generates cash flows largely independent of
the other assets held by an entity. Owner-occupied properties generate cash flows that are
attributable not only to property but also to the other assets used in the production or supply
process.
Some properties comprise a portion that is held to earn rentals or for capital appreciation and
another portion that is held for use in the production or supply of goods or services or for
administrative purposes. If these portions cannot be sold separately, the property is accounted for
as investment property only if an insignificant portion is held for use in the production or supply
of goods or services or for administrative purposes. Judgment is applied in determining whether
ancillary services are so significant that a property does not qualify as an investment property. The
Group considers each property separately in making its judgment.
Contingencies
The Group is currently involved in various legal proceedings. The estimate of the probable costs
for the resolution of these claims has been developed in consultation with outside counsel
handling the defense in these matters and is based upon an analysis of potential results. The
Group currently does not believe these proceedings will have a material effect on the Group’s
financial position. It is possible, however, that future results of operations could be materially
affected by changes in the estimates or in the effectiveness of the strategies relating to these
proceedings (Note 36).
*SGVMC111910*
- 87 Estimates
The key assumptions concerning the future and other sources of estimation uncertainty at the
balance sheet date that have a significant risk of causing a material adjustment to the carrying
amounts of assets and liabilities within the next financial year are discussed below.
Estimation of allowance for impairment losses on trade and other receivables
The Group maintains allowances for impairment losses on trade receivables at a level considered
adequate to provide for potential uncollectible receivables. The level of this allowance is
evaluated by the management on the basis of factors that affect the collectibility of the accounts.
These factors include, but are not limited to, the length of relationship with the customer, the
customer’s payment behavior and known market factors. The Group reviews the age and status of
receivables, and identifies accounts that are to be provided with allowances on a continuous basis.
The Group provides full allowance for trade receivables that it deems uncollectible.
The amount and timing of recorded expenses for any period would differ if the Group made
different judgments or utilized different estimates. An increase in the allowance for impairment
losses on trade receivables would increase recorded operating expenses and decrease current
assets.
Provisions for impairment losses on trade receivables amounted to P
=94.9 million, P
=141.2 million
and P
=43.3 million in 2008, 2007 and 2006, respectively. Total receivables, net of allowance for
impairment losses, amounted to =
P6.2 billion and P
=5.8 billion as of September 30, 2008 and 2007,
respectively (Note 10).
Determination of NRV of inventories
The Group, in determining the NRV, considers any adjustment necessary for obsolescence which
is generally provided 100% for nonmoving items for more than one (1) year. The Group adjusts
the cost of inventory to the recoverable value at a level considered adequate to reflect market
decline in the value of the recorded inventories. The Group reviews the classification of the
inventories and generally provides adjustments for recoverable values of new, actively sold and
slow-moving inventories by reference to prevailing values of the same inventories in the market.
The amount and timing of recorded expenses for any period would differ if different judgments
were made or different estimates were utilized. An increase in inventory obsolescence and market
decline would increase recorded operating expenses and decrease current assets.
Inventory obsolescence and market decline (included under Impairment Losses account in the
consolidated statement of income) amounted to P
=192.4 million in 2008 (Note 11). The Group’s
inventories, net of inventory obsolescence and market decline, amounted to P
=7.8 billion and
=5.9 billion as of September 30, 2008 and 2007, respectively (Note 11).
P
EUL of property, plant and equipment and investment properties
The Group estimated the useful lives of its property, plant and equipment and investment
properties based on the period over which the assets are expected to be available for use. The
EUL of property, plant and equipment and investment properties are reviewed at least annually
and are updated if expectations differ from previous estimates due to physical wear and tear and
technical or commercial obsolescence on the use of these assets. It is possible that future results of
operations could be materially affected by changes in these estimates brought about by changes in
*SGVMC111910*
- 88 factors mentioned above. A reduction in the EUL of property, plant and equipment and
investment properties would increase depreciation expense and decrease noncurrent assets.
As of September 30, 2008 and 2007, the balances of the Group’s depreciable property, plant and
equipment and investment properties follow:
Property, plant and equipment - net (Note 13)
Investment properties - net (Note 18)
2007
2008
=19,463,828,376
P
=21,348,348,949 P
82,601,829
79,003,584
Fair values less estimated point-of-sale costs of biological assets
The fair values of swine are determined based on current market prices of livestock of similar age,
breed and genetic merit. Point-of-sale costs include commissions to brokers and dealers,
nonrefundable transfer taxes and duties. Point-of-sale costs exclude transport and other costs
necessary to get the biological assets to the market. The fair values are reviewed and updated if
expectations differ from previous estimates due to changes brought by both physical change and
price changes in the market. It is possible that future results of operations could be materially
affected by changes in these estimates brought about by the changes in factors mentioned.
As of September 30, 2008 and 2007, the Group’s biological assets carried at fair values less
estimated point-of-sale costs amounted to =
P1.2 billion and P
=1.0 billion as of September 30, 2008
and 2007, respectively (Note 15).
Impairment of nonfinancial assets
The Group assesses the impairment of assets whenever events or changes in circumstances
indicate that the carrying amount of an asset may not be recoverable. The factors that the Group
considers important which could trigger an impairment review include the following:
·
·
·
significant underperformance relative to expected historical or projected future operating
results;
significant changes in the manner of use of the acquired assets or the strategy for overall
business; and
significant negative industry or economic trends.
In the case of goodwill and intangible assets with indefinite lives, at a minimum, such assets are
subject to an annual impairment test and more frequently whenever there is an indication that such
asset may be impaired. This requires an estimation of the value in use of the cash-generating units
to which the goodwill is allocated. Estimating the value in use requires the Group to make an
estimate of the expected future cash flows from the cash-generating unit and to choose a suitable
discount rate in order to calculate the present value of those cash flows.
In determining the present value of estimated future cash flows expected to be generated from the
continued use of the assets, the Group is required to make estimates and assumptions that can
materially affect the consolidated financial statements.
*SGVMC111910*
- 89 As of September 30, 2008 and 2007, the balances of the Group’s nonfinancial assets, net of
accumulated depreciation and amortization and impairment losses follow:
Property, plant and equipment (Note 13)
Intangible assets (Note 16)
Investments in an associate and a joint venture
(Note 17)
Investment properties (Note 18)
2007
(As restated)
2008
P22,156,451,732
P
=24,327,344,376 =
1,156,950,961
1,646,762,912
93,056,645
79,003,584
89,872,575
82,601,829
Estimation of pension and other benefits costs
The determination of the obligation and cost of retirement and other employee benefits is
dependent on the selection of certain assumptions used in calculating such amounts. Those
assumptions include, among others, discount rates, expected returns on plan assets and salary
increase rates (Note 31). Actual results that differ from the Group’s assumptions are accumulated
and amortized over future periods and therefore, generally affect the recognized expense and
recorded obligation in such future periods.
While the Group believes that the assumptions are reasonable and appropriate, significant
differences between actual experiences and assumptions may materially affect the cost of
employee benefits and related obligations.
The Group also estimates other employee benefits obligation and expense, including the cost of
paid leaves based on historical leave availments of employees, subject to the Group’s policy.
These estimates may vary depending on the future changes in salaries and actual experiences
during the year.
As of September 30, 2008 and 2007, the balances of the Group’s net pension assets, actuarial
losses and other employee benefits follow:
Net pension assets (Note 31)
Unrecognized actuarial losses - net (Note 31)
Other employee benefits (Note 28)
2008
P
= 243,810,600
16,093,100
582,317,915
2007
P92,534,300
=
92,534,300
527,715,556
Recognition of deferred tax assets
The Group reviews the carrying amounts of deferred taxes at each balance sheet date and reduces
deferred tax assets to the extent that it is no longer probable that sufficient taxable income will be
available to allow all or part of the deferred tax assets to be utilized. The Group recognized
deferred tax assets amounting to P
=372.2 million and P
=363.2 million as of September 30, 2008 and
2007, respectively (Note 32), as the Group believes sufficient taxable income will allow these
deferred tax assets to be utilized.
Net deferred tax liabilities amounted to P
=243.7 million and =
P250.4 million as of September 30,
2008 and 2007, respectively (Note 32).
As of September 31, 2008 and 2007, the Group has certain subsidiaries which enjoy the benefits
of an ITH. As such, no deferred tax assets were set up on certain gross deductible temporary
differences that are expected to reverse within the ITH period (Note 35).
*SGVMC111910*
- 90 4. Financial Risk Management Objectives and Policies
The Group’s principal financial instruments, other than derivatives, comprise cash and cash
equivalents, financial assets at FVPL, AFS investments, and interest-bearing loans and other
borrowings. The main purpose of these financial instruments is to finance the Group’s operations
and related capital expenditures. The Group has various other financial assets and financial
liabilities, such as trade receivables and payables which arise directly from its operations. The
Parent Company is a counterparty to derivative contracts. These derivatives are entered into as a
means of reducing or managing their respective foreign exchange and interest rate exposures, as
well as for trading purposes.
The BOD of the Parent Company and its subsidiaries review and approve policies for managing
each of these risks and they are summarized below, together with the related risk management
structure.
Risk Management Structure
The Group’s risk management structure is closely aligned with that of the ultimate Parent
Company. The BOD of the Parent Company and the respective BOD of each subsidiary are
ultimately responsible for the oversight of the Group’s risk management processes that involve
identifying, measuring, analyzing, monitoring and controlling risks.
The risk management framework encompasses environmental scanning, the identification and
assessment of business risks, development of risk management strategies, design and
implementation of risk management capabilities and appropriate responses, monitoring risks and
risk management performance, and identification of areas and opportunities for improvement in
the risk management process.
Each BOD has created the board-level AC to spearhead the managing and monitoring of risks.
AC
The AC shall assist the Group’s BOD in its fiduciary responsibility for the over-all effectiveness
of risk management systems, and both the internal and external audit functions of the Group.
Furthermore, it is also the AC’s purpose to lead in the general evaluation and to provide assistance
in the continuous improvements of risk management, control and governance processes.
The AC also aims to ensure that:
a. financial reports comply with established internal policies and procedures, pertinent
accounting and auditing standards and other regulatory requirements;
b. risks are properly identified, evaluated and managed, specifically in the areas of managing
credit, market, liquidity, operational, legal and other risks, and crisis management;
c. audit activities of internal and external auditors are done based on plan, and deviations are
explained through the performance of direct interface functions with the internal and external
auditors; and
d. the Group’s BOD is properly assisted in the development of policies that would enhance the
risk management and control systems.
*SGVMC111910*
- 91 Enterprise Risk Management Group (ERMG)
The ERMG was created to be primarily responsible for the execution of the enterprise risk
management framework. The ERMG’s main concerns include:
a.
b.
c.
d.
recommending risk policies, strategies, principles, framework and limits;
managing fundamental risk issues and monitoring of relevant risk decisions;
providing support to management in implementing the risk policies and strategies; and
developing a risk awareness program.
Compliance with the principles of good corporate governance is also one (1) of the primary
objectives of the BOD. To assist the BOD in achieving this purpose, the BOD has designated a
Compliance Officer who shall be responsible for monitoring the actual compliance with the
provisions and requirements of the Corporate Governance Manual and other requirements on good
corporate governance, identifying and monitoring control compliance risks, determining
violations, and recommending penalties on such infringements for further review and approval of
the BOD, among others.
Risk Management Policies
The main risks arising from the use of financial instruments are foreign currency risk, equity price
risk, interest rate risk, credit risk and liquidity risk. The Group’s policies for managing the
aforementioned risks are summarized below.
Foreign currency risk
Foreign currency risk arises on financial instruments that are denominated in a foreign currency
other than the functional currency in which they are measured.
The Group has transactional currency exposures. Such exposures arise from sales and purchases
in currencies other than the entities’ functional currency. As of September 30, 2008, 2007 and
2006, approximately 20.4%, 19.1% and 22.1% of the Group’s total sales are denominated in
currencies other than the functional currency. In addition, 93.3% and 76.9% of the Group’s debt is
denominated in US Dollar as of September 30, 2008 and 2007, respectively. The Group’s capital
expenditures are likewise substantially denominated in US Dollar.
The Group does not have any foreign currency hedging arrangements.
The table below summarizes the Group’s exposure to foreign currency risk as of September 30,
2008.
Assets
Cash and cash equivalents
Financial assets at FVPL
Private bonds
Government bonds
Euro
US Dollar
Total
=–
P
=56,496,511
P
=56,496,511
P
710,394,136
474,499,900
1,184,894,036
–
–
56,496,511
710,394,136
474,499,900
1,241,390,547
Liabilities
Short-term debt
Trust receipts and acceptances payable
1,361,755,943
–
1,361,755,943
–
845,761,280
845,761,280
1,361,755,943
845,761,280
2,207,517,223
=176,861,907
P
=789,264,769
P
=966,126,676
P
Net Foreign Currency-Denominated Liabilities
*Other currencies include Singapore Dollar, Thai Baht, Chinese Yuan, Malaysian Ringgit, Indonesian Rupiah,
and Vietnam Dong
*SGVMC111910*
- 92 The following table sets forth the impact of the range of reasonably possible changes in the
US Dollar and Euro - Philippine Peso exchange rate on the Group’s income before income tax as
of September 30, 2008 follow:
Reasonably possible change in unit of Philippine
peso for every unit of foreign currency
=5.00
P
(P
=5.00)
US Dollar
(P
=83,875,108)
83,875,108
Euro
(P
= 13,045,665)
13,045,665
Equity price risk
Equity price risk is the risk that the fair values of equities decrease as a result of changes in the
levels of equity indices and the value of individual stocks. The effect on equity (as a result of a
change in fair value of equity instruments held as FVPL investments as of September 30, 2008)
due to a reasonably possible change in equity indices, with all other variables held constant, will
increase equity by =
P375.5 million if equity indices will increase by 1.0%. An equal change in the
opposite direction would have decreased equity by the same amount.
Interest rate risk
The Group’s exposure to market risk for changes in interest rates relates primarily to the Group’s
short-term and long-term debt obligations. The Group’s policy is to manage its interest cost using
a mix of fixed and variable rate debt. The Group’s policy has been revised to target a ratio of
99.42% fixed rate debt for US Dollar-denominated debts.
As of September 30, 2008 and 2007, 99.7% and 98.84% of the Group’s borrowings are at a fixed
rate of interest, respectively.
*SGVMC111910*
- 93 The following tables show information about the Group’s financial instruments that are exposed to interest rate risk and presented by maturity profile:
2008
Debt Carrying Value
Issuance
(in Philippine
Costs
Peso)
<1 year
>1-<2 years
>2-<3 years
>3-<4 years
>4-<5 years
Total
Total
(in Philippine
Peso)
US$1,327,114
USD LIBOR +
0.75%
US$–
US$–
US$–
US$–
US$1,327,114
P
=62,440,708
P
=–
P
=62,440,708
–
–
–
–
US$91,435,389
2.95% to 8.69%
US$
–
US$– US$199,127,866
–
8.25%
US$–
–
US$290,563,255
13,712,047,997
(41,046,858)
13,671,001,139
€20,089,134
4.6% to 5.10%
€–
–
€–
–
€–
–
€–
–
€20,089,134
1,365,615,959
–
1,365,615,959
1,079,610,000
5.375%
€–
–
€–
–
€–
–
€–
–
THB1,079,610,000
1,492,234,130
–
1,492,234,130
China Yuan loans
Interest rate
RMB86,800,000
5.375%
€–
–
€–
–
€–
–
€–
–
RMB86,800,000
597,941,418
–
597,941,418
Local currencies:
Fixed rate
Philippine Peso loans
Interest rate
P
=3,312,458,089
6.75%
P
=–
–
P
=–
–
P
=–
–
P
=46,395,489
7.5%
P
=3,358,853,578
3,358,853,578
–
3,358,853,578
Liabilities:
Foreign currencies:
Floating rate
US Dollar loans
Interest rate
Fixed rate
US Dollar loans
Interest rate
Euro loans
Interest rate
Thailand Baht loans
Interest rate
P
=20,589,133,790 (P
= 41,046,858) P
=20,548,086,932
*SGVMC111910*
- 94 2007
Liabilities:
Foreign currencies:
Floating rate
Euro loans
Interest rate
US Dollar loans
Interest rate
Fixed rate
US Dollar loans
Interest rate
Euro loans
Interest rate
Local currencies:
Fixed rate
Philippine Peso loans
Interest rate
Total
(In US Dollar)
Total
(in Philippine
Peso)
Debt
Issuance Costs
Carrying Value
(in Philippine
Peso)
<1 year
>1-<2 years
>2-<3 years
>3-<4 years
>4-<5 years
>5 years
Total
(In Euro)
€1,797,498
EURIBOR/
USD LIBOR +
0.75%
€–
€–
€–
€–
€–
€1,797,498
US$–
=116,961,425
P
(P
=2,499,103)
=114,462,322
P
–
–
–
–
–
US$–
US$–
US$–
US$–
US$–
–
2,211,856
99,622,015
–
99,622,015
–
US$2,211,856
USD LIBOR +
0.75%
–
–
–
–
US$187,048,008
4.30% to 9.00%
US$
–
US$–
–
US$– US$200,000,000
–
8.25%
US$–
–
–
387,048,008
17,647,857,560
(51,545,838)
17,596,311,722
€19,474,897
4.32% to 5.01%
€–
–
€–
–
€–
–
€–
–
€–
–
19,474,897
–
1,179,428,247
–
1,179,428,247
P–
=
–
P–
=
–
P–
=
–
P–
=
–
P–
=
–
=52,353,312
P
7.5%
–
–
52,353,312
–
52,353,312
€21,272,395 US$389,259,864 P
=19,096,222,559
(P
=54,044,941)
P
=19,042,177,618
*SGVMC111910*
- 95 The following table sets forth the impact of the range of reasonably possible changes in the
interest rates on the Group’s income before income tax and equity in 2008:
Reasonably Possible Changes in
Interest Rates
1.5%
(1.5%)
Change in
Income Before
Income Tax
Equity
(P
=1,039,387)
(P
=472,491,233)
1,039,387
472,491,233
Other than the potential impact on income before income tax, there is no other effect on equity.
Credit risk
The Group trades only with recognized and creditworthy third parties. It is the Group’s policy that
all customers who wish to trade on credit terms are subject to credit verification procedures. The
Credit and Collection Department of the Group continuously provides credit notification and
implements various credit actions, depending on assessed risks, to minimize credit exposure.
Receivable balances of trade customers are being monitored on a regular basis and appropriate
credit treatments are executed for overdue accounts. Likewise, other receivable balances are also
being monitored and subjected to appropriate actions to manage credit risk.
With respect to credit risk arising from the other financial assets of the Group, which comprise
cash and cash equivalents, financial assets at FVPL and certain derivative investments, the
Group’s exposure to credit risk arises from default of the counterparty with a maximum exposure
equal to the carrying amount of these instruments. The Group has a counterparty credit risk
management policy which allocates investment limits based on counterparty credit ratings and
credit risk profile.
The credit risk is concentrated to the following customers:
Type of Customers
Related parties
Third parties:
Supermarkets and convenience stores
Distribution companies
Total
Percentage
20.0%
41.4
38.6
80.0
100.0%
*SGVMC111910*
- 96a. Credit risk exposure
The table below shows the gross maximum exposure to credit risk (including derivatives) of
the Group as of September 30, 2008 and 2007, without considering the effects of collaterals
and other credit risk mitigation techniques.
2008
Loans and receivables:
Cash and cash equivalents (excluding cash
on hand amounting to =
P108.6 million
and P
=137.8 million as of September 30,
2008 and 2007, respectively) (Note 7)
Receivables - net (Note 10):
Trade receivables
Due from related parties
Interest receivable
Advances to officers, employees
and suppliers
Other receivables
Total loans and receivables
Financial assets at FVPL (Note 8):
Financial assets at FVPL
Private bonds
Equity securities
Government securities
Derivative assets (included under Financial
Assets at FVPL account in the
consolidated balance sheets)
Total financial assets at FVPL
AFS investments (Note 14):
Private bonds
Government securities
Total AFS investments
Asset of disposal group classified as held for sale
2007
(As restated)
P
=2,107,051,132
=4,907,194,621
P
4,389,616,993
448,124,520
142,815,439
3,366,090,767
896,599,119
410,468,355
477,809,078
717,507,842
8,282,925,004
441,906,587
666,413,896
10,688,673,345
4,343,133,416
1,625,354,410
–
9,981,812,179
2,202,652,517
4,352,248,713
10,697,053
5,979,184,879
155,375
16,536,868,784
4,080,459,883
2,224,382,820
6,304,842,703
35,711
P
=20,566,988,297
–
–
–
–
=27,225,542,129
P
b. Risk concentrations of the maximum exposure to credit risk
Concentrations arise when a number of counterparties are engaged in similar business
activities or activities in the same geographic region or have similar economic features that
would cause their ability to meet contractual obligations to be similarly affected by changes in
economic, political or other conditions. Concentrations indicate the relative sensitivity of the
Group’s performance to developments affecting a particular industry or geographical location.
Such credit risk concentrations, if not properly managed, may cause significant losses that
could threaten the Group's financial strength and undermine public confidence.
*SGVMC111910*
- 97The Group’s policies and procedures include specific guidelines to focus on maintaining a
diversified portfolio. In order to avoid excessive concentrations of risk, identified
concentrations of credit risks are controlled and managed accordingly.
i.
Concentration by geographical location
The Group’s credit risk exposures as of September 30, 2008 before taking into account
any collateral held or other credit enhancements, are categorized by geographic location as
follows:
Loans and receivables:
Cash and cash equivalents
(excluding cash on hand
amounting to P
=108.6 million as
of September 30, 2008)
(Note 7)
Receivables - net (Note 10):
Trade receivables
Due from related parties
Interest receivable
Advances to officers,
employees and suppliers
Other receivables
Total loans and receivables
Financial assets at FVPL (Note 8):
Financial assets at FVPL
Private bonds
Equity securities
Derivative assets (included under
Financial Assets at FVPL account
in the consolidated balance
sheets)
Total financial assets at FVPL
AFS investments (Note 14):
Private bonds
Government securities
Total AFS investments
Asset of disposal group classified as
held for sale
Philippines
Asia (excluding
Philippines)
United States
Total
=1,034,485,455
P
=428,022,880
P
=644,542,797
P
=2,107,051,132
P
3,149,286,334
341,478,640
343,428
1,240,330,659
52,526,442
–
–
54,119,438
142,472,011
4,389,616,993
448,124,520
142,815,439
282,841,359
506,382,175
5,314,817,391
194,967,719
211,125,667
2,126,973,367
–
–
841,134,246
477,809,078
717,507,842
8,282,925,004
–
677,335,726
–
–
4,343,133,416
948,018,684
4,343,133,416
1,625,354,410
–
677,335,726
–
–
10,697,053
5,301,849,153
10,697,053
5,979,184,879
–
–
–
–
–
–
4,080,459,883
2,224,382,820
6,304,842,703
4,080,459,883
2,224,382,820
6,304,842,703
–
=5,992,153,117
P
35,711
=2,127,009,078
P
–
35,711
P
=12,447,826,102 P
=20,566,988,297
*SGVMC111910*
- 98ii. Concentration by industry
The table below shows the industry sector analysis of the Group’s financial assets as of
September 30, 2008 before taking into account any collateral held or other credit
enhancements.
Loans and receivables:
Cash and cash equivalents
(excluding cash on
hand amounting to
=108.6 million
P
as of September 30,
2008) (Note 7)
Receivables - net (Note 10):
Trade receivables
Due from related parties
Interest receivable
Advances to officers,
employees and
suppliers
Other receivables
Total loans and receivables
Financial assets at FVPL
(Note 8):
Financial assets at FVPL
Private bonds
Equity securities
Derivative assets (included
under Financial Assets
at FVPL account in the
consolidated balance
sheets)
Total financial assets at FVPL
AFS investments (Note 14):
Private bonds
Government securities
Total AFS investments
Assets of disposal group classified
as held for sale
Manufacturing
Financial
Intermediaries
Agriculture
Others*
Total
=–
P
=2,107,051,132
P
=–
P
=–
P
=2,107,051,132
P
3,731,126,864
229,887,675
246,676
–
41,812,012
142,472,011
7,897,980
361,663
–
650,592,149
176,063,170
96,752
4,389,616,993
448,124,520
142,815,439
458,827,826
–
4,420,089,041
–
–
2,291,335,155
8,667,873
–
16,927,516
10,313,379
717,507,842
1,554,573,292
477,809,078
717,507,842
8,282,925,004
–
–
4,343,133,416
948,018,684
–
–
–
677,335,726
4,343,133,416
1,625,354,410
–
–
10,697,053
5,301,849,153
–
–
–
677,335,726
10,697,053
5,979,184,879
–
–
–
4,080,459,883
2,224,382,820
6,304,842,703
–
–
–
–
–
–
4,080,459,883
2,224,382,820
6,304,842,703
35,711
=4,420,124,752
P
–
=13,898,027,011
P
–
=16,927,516
P
–
=2,231,909,018
P
35,711
=20,566,988,297
P
* Others include consumer, community, social and personal services, education, mining and quarrying, and health and social work sectors
c. Credit quality per class of financial assets
The table below shows the credit quality by class of financial assets as of September 30, 2008
gross of allowance for impairment losses:
Neither Past Due Nor Impaired
Standard
Substandard
High
Grade
Grade
Grade
Loans and receivables:
Cash and cash equivalents
(excluding cash on
hand amounting to
=108.6 million as of
P
September 30, 2008)
(Note 7)
=2,107,051,132
P
=–
P
=–
P
Past Due
or Individually
Impaired
Total
=–
P
=2,107,051,132
P
(Forward)
*SGVMC111910*
- 99Neither Past Due Nor Impaired
Standard
Substandard
High
Grade
Grade
Grade
Receivables (Note 10):
Trade receivables
Due from related parties
Interest receivable
Advances to officers,
employees and
suppliers
Other receivables
Total loans and receivables
Financial assets at FVPL
(Note 8):
Financial assets at FVPL
Private bonds
Equity securities
Derivative assets (included
under Financial Assets at
FVPL account in the
consolidated balance
sheets)
Total financial assets at FVPL
AFS investments (Note 14):
Private bonds
Government securities
Total AFS investments
Assets of disposal group
classified as held for sale
Past Due
or Individually
Impaired
Total
=730,102,616
P
448,124,520
142,471,964
=3,401,009,687
P
–
343,475
=258,504,690
P
–
–
=224,312,699
P
–
–
=4,613,929,692
P
448,124,520
142,815,439
250,552,643
335,879,638
4,014,182,513
227,207,235
380,929,727
4,009,490,124
49,200
698,477
259,252,367
–
–
224,312,699
477,809,078
717,507,842
8,507,237,703
3,309,502,787
1,568,894,410
871,015,007
56,460,000
162,615,622
–
–
–
4,343,133,416
1,625,354,410
10,697,053
4,889,094,250
–
927,475,007
–
162,615,622
–
–
10,697,053
5,979,184,879
2,026,384,076
–
2,026,384,076
345,307,290
1,870,137,471
2,215,444,761
1,214,728,955
354,245,349
1,568,974,304
494,039,562
–
494,039,562
4,080,459,883
2,224,382,820
6,304,842,703
35,711
=10,929,696,550
P
–
=7,152,409,892
P
–
=1,990,842,293
P
–
35,711
=718,352,261 P
P
=20,791,300,996
High grade cash and cash equivalents are short-term placements and working cash fund
placed, invested, or deposited in foreign and local banks belonging to the top ten (10) banks in
the Philippines in terms of resources and profitability.
High grade accounts are accounts considered to be high value. The counterparties have a very
remote likelihood of default and have consistently exhibited good paying habits. Standard
grade accounts are active accounts with minimal to regular instances of payment default, due
to ordinary/common collection issues. These accounts are typically not impaired as the
counterparties generally respond to credit actions and update their payments accordingly.
Substandard grade accounts are accounts which have probability of impairment based on
historical trend. These accounts show propensity to default in payment despite regular followup actions and extended payment terms.
d. Impairment assessment
The Group recognizes impairment losses based on the results of the specific/individual and
collective assessment of its credit exposures. Impairment has taken place when there is a
presence of known difficulties in the servicing of cash flows by counterparties, infringement
of the original terms of the contract has happened, or when there is an inability to pay
principal or interest overdue beyond a certain threshold. These and the other factors, either
singly or in tandem with other factors, constitute observable events and/or data that meet the
definition of an objective evidence of impairment.
The two methodologies applied by the Group in assessing and measuring impairment include:
(1) specific/individual assessment; and (2) collective assessment.
*SGVMC111910*
- 100Under specific/individual assessment, the Group assesses each individually significant credit
exposure for any objective evidence of impairment, and where such evidence exists,
accordingly calculates the required impairment. Among the items and factors considered by
the Group when assessing and measuring specific impairment allowances are: (a) the timing of
the expected cash flows; (b) the projected receipts or expected cash flows; (c) the going
concern of the counterparty’s business; (d) the ability of the counterparty to repay its
obligations during financial crisis; (e) the availability of other sources of financial support; and
(f) the existing realizable value of collateral. The impairment allowances, if any, are evaluated
as the need arises, in view of favorable or unfavorable developments.
With regard to the collective assessment of impairment, allowances are assessed collectively
for losses on receivables that are not individually significant and for individually significant
receivables when there is no apparent or objective evidence of individual impairment. A
particular portfolio is reviewed on a periodic basis, in order to determine its corresponding
appropriate allowances. The collective assessment evaluates and estimates the impairment of
the portfolio in its entirety even though there is no objective evidence of impairment on an
individual assessment. Impairment losses are estimated by taking into consideration the
following deterministic information: (a) historical losses/write offs; (b) losses which are likely
to occur but has not yet occurred; and (c) the expected receipts and recoveries once impaired.
Liquidity risk
The Group’s liquidity management involves maintaining funding capacity to finance capital
expenditures and service maturing debts, and to accommodate any fluctuations in asset and
liability levels due to changes in the Group’s business operations or unanticipated events created
by customer behavior or capital market conditions. The Group maintains a level of cash and cash
equivalents deemed sufficient to finance its operations. As part of its liquidity risk management,
the Group regularly evaluates its projected and actual cash flows. It also continuously assesses
conditions in the financial markets for opportunities to pursue fund raising activities. Fund raising
activities may include obtaining bank loans and capital market issues both onshore and offshore.
The table below summarizes the maturity profile of the Group’s financial liabilities as of
September 30, 2008 based on undiscounted contractual payments.
Financial liabilities at
amortized cost:
Accounts payable and
other accrued liabilities
Due to related parties
(included under
Accounts payable and
other accrued
liabilities account
in the consolidated
balance sheets)
Short-term debt
Less than 1
Month
1 to 3
Months
3 to 12
Months
1 to 5
Years
Total
=804,409,356
P
=1,804,196,127
P
=2,188,299,743
P
=–
P
=4,796,905,226
P
127,615,090
–
–
6,095,840,860
–
2,075,439,361
–
–
127,615,090
8,171,280,221
(Forward)
*SGVMC111910*
- 101-
Trust receipts and
acceptances payable
Long-term debt
(including current
portion)
Total financial liabilities at
amortized cost
Financial liabilities at FVPL:
Derivative liabilities
(included under
Accounts payable and
other accrued
liabilities account in
the consolidated balance
sheets)
Liabilies directly associated
with assets classified as
held for sale
Less than 1
Month
1 to 3
Months
3 to 12
Months
1 to 5
Years
Total
=–
P
=384,769,438
P
=2,706,697,806
P
=–
P
=3,091,467,244
P
7,293,907
64,067,617
610,536,846
11,212,452,555
11,894,350,925
939,318,353
8,348,874,042
7,580,973,756
11,212,452,555
28,081,618,706
40,421,267
–
–
–
40,421,267
8,695,853
=988,435,473
P
–
=8,348,874,042
P
–
=7,580,973,756
P
–
=11,212,452,555
P
8,695,853
=28,130,735,826
P
Derivative Financial Instruments
The Group’s freestanding derivative financial instruments are accounted for as financial
instruments at FVPL. Gains or losses arising from fair value changes on these derivative
instruments are reported immediately in the consolidated statements of income.
The Group’s freestanding derivatives that are not designated as hedges consist of:
Notional amounts
Derivative assets (included
under Financial assets
at FVPL account in the
consolidated balance
sheets) (Note 8)
Derivative liabilities
(included under
Accounts payable and
other accrued liabilities
account in the
consolidated balance
sheets) (Note 21)
2008
Currency
Currency
Options
Total
Forwards
US$46,215,992 US$50,600,000 US$96,815,992
€750,000
€750,000
Currency
Forwards
US$1,000,000
2007
Currency
Options
US$200,000
Total
US$1,200,000
=754,743
P
=9,942,310
P
=10,697,053
P
=–
P
=155,375
P
=155,375
P
=19,373,529
P
= 21,047,738
P
=40,421,267
P
=1,884,564
P
=5,382,103
P
=7,266,667
P
The Group’s freestanding derivatives represents foreign currency forwards and foreign currency
options that are all due within one year from respective balance sheet dates.
*SGVMC111910*
- 102Fair value changes on derivatives
The net movements in fair value changes of all derivative instruments in 2008 and 2007 are as
follows:
2007
2008
Balance at beginning of year:
Derivative assets
Derivative liabilities
Net changes in fair value of derivatives
Fair value of settled instruments
Balance at end of year:
Derivative assets (Note 8)
Derivative liabilities (Note 21)
P
= 155,375
(7,266,667)
(29,724,214)
7,111,292
=3,200,097
P
(12,491,028)
(2,179,639)
4,359,278
P
=10,697,053
(P
=40,421,267)
P155,375
=
(P
= 7,266,667)
5. Fair Value Measurement
The following methods and assumptions were used to estimate the fair value of each class of
financial instrument for which it is practicable to estimate such value:
Cash and cash equivalents, receivables, accounts payable and other accrued liabilities and
trust receipts and acceptances payable
Carrying amounts approximate their fair values due to the relatively short-term maturity of these
instruments.
Amounts due from and due to related parties
Carrying amounts of due from and due to related parties which are payable and due on demand
approximate their fair values.
Financial assets at FVPL and AFS investments
Fair values of debt securities are generally based upon quoted market prices. If the market prices
are not readily available, fair values are estimated using either values obtained from independent
parties offering pricing services or adjusted quoted market prices of comparable investments or
using the discounted cash flow methodology.
Fair values of quoted equity securities are based on quoted prices published in markets. Fair
values of unquoted equity investments approximate carrying amounts (cost less allowance for
impairment) due to the unpredictable nature of future cash flows and lack of suitable methods of
arriving at reliable fair value.
Derivative financial instruments
The fair value of forward exchange contracts is calculated by reference to current forward
exchange rates for contracts with similar maturity profiles. The fair value of forward exchange
derivatives embedded in nonfinancial contracts is calculated by reference to the prevailing interest
differential and spot exchange rate as of valuation date, taking into account the remaining term-tomaturity of the forwards.
Currency options are valued using the simple option pricing model of Bloomberg.
*SGVMC111910*
- 103Long-term debt
The fair value is determined using the discounted cash flow methodology, with reference to the
Group’s current incremental lending rates for similar types of loans.
The following table summarizes the carrying amounts and fair values of the financial assets and
financial liabilities by category as of September 30, 2008 and 2007.
2008
Carrying Value
Financial Assets
Loans and receivables:
Cash and cash equivalents
Receivables
Due from related parties (included
under Receivables account in
the consolidated balance
sheets)
Total loans and receivables
Financial assets at FVPL:
Financial assets at FVPL
Private bonds
Equity securities
Government securities
Derivative assets (included under
Financial assets at FVPL
account in the consolidated
balance sheets)
Total financial assets at FVPL
AFS investments:
Private bonds
Government securities
Total AFS investments
Financial Liabilities
Financial liabilities at amortized cost:
Accounts payable and other
accrued liabilities
Due to related parties (included
under Accounts payable and
other accrued liabilities
account in the consolidated
balance sheets)
Short-term debt
Trust receipts and acceptances
payable
Long-term debt (including
current portion)
Total financial liabilities at
amortized cost
Financial liabilities at FVPL:
Derivative liabilities (included
under Accounts payable and
other accrued liabilities
account in the consolidated
balance sheets)
Fair Value
2007 (As restated)
Carrying Value
Fair Value
P
=2,215,628,259
5,727,749,352
P
=2,215,628,259
5,727,749,352
P5,045,041,438
=
4,884,879,605
P5,045,041,438
=
4,884,879,605
448,124,520
8,391,502,131
448,124,520
8,391,502,131
896,599,119
10,826,520,162
896,599,119
10,826,520,162
4,343,133,416
1,625,354,410
–
4,343,133,416
1,625,354,410
–
9,981,812,179
2,202,652,517
4,352,248,713
9,981,812,179
2,202,652,517
4,352,248,713
10,697,053
5,979,184,879
10,697,053
5,979,184,879
155,375
16,536,868,784
155,375
16,536,868,784
4,080,459,883
2,224,382,820
6,304,842,703
P
=20,675,529,713
4,080,459,883
2,224,382,820
6,304,842,703
P
=20,675,529,713
–
–
–
=27,363,388,946
P
–
–
–
=
P27,363,388,946
P
=4,837,326,494
P
=4,837,326,494
=4,089,574,237
P
=4,089,574,237
P
127,615,090
8,069,508,132
127,615,090
8,069,508,132
334,154,530
4,519,172,112
334,154,530
4,519,172,112
3,000,776,510
3,000,776,510
385,279,591
385,279,591
9,477,802,290
11,817,551,774
14,137,725,915
17,117,522,953
25,513,028,516
27,852,778,000
23,465,906,385
26,445,703,423
40,421,267
P
=25,553,449,783
40,421,267
P
=27,893,199,267
7,266,667
=23,473,173,052
P
7,266,667
=
P26,452,970,090
*SGVMC111910*
- 1046. Business Segment Information
For management purposes, the Group is organized into business units based on their products and
services, and has three (3) reportable operating segments as follows:
·
The branded consumer food products segment manufactures and distributes a diverse mix of
snack foods, instant coffee products, instant noodles, chocolates, soft and hard candies,
biscuits, tomato-based products and ready-to-drink beverages. This segment also includes the
packaging division which manufactures BOPP films primarily used in packaging. In 2006,
the Group began operations of its PET bottle manufacturing plant to supply the packaging
requirements of products in PET bottle format.
·
The agro-industrial products segment engages in hog and poultry farming, manufactures and
distributes animal feeds and soya products and manufactures and distributes animal health
products.
·
The commodity food products segment engages in sugar milling and refining, and flour
milling and pasta manufacturing.
Management monitors the operating results of its business units separately for the purpose of
making decisions about resource allocation and performance assessment. Segment performance is
evaluated based on operating profit or loss which in certain respects is measured differently from
operating profit or loss in the consolidated financial statements. Group financing (including
finance costs and revenue), market valuation gain (loss), foreign exchange loss and income taxes
are managed on a group basis and are not allocated to operating segments. Transfer prices
between operating segments are on an arm’s length basis in a manner similar to transactions with
third parties.
*SGVMC111910*
- 105The Group’s business segment information follows:
Sale of Goods and Services
Third party
Inter-segment
Result
Segment result
Finance revenue (Note 29)
Finance costs (Notes 20, 22 and 30)
Equity in net income of an associate
and a joint venture (Note 17)
Impairment losses
Other revenues (expenses) - net
Income before income tax
Provision for income tax
Net income
Other Information
Segment assets
Investment in an associate and a joint venture
Unallocated corporate assets
Total assets
Segment liabilities
Unallocated liabilities
Total liabilities
Capital expenditures (Note 13)
Depreciation and amortization (Note 27)
Non-cash expenses other than depreciation
and amortization
Impairment losses on:
Inventories (Note 11)
Receivables (Note 10)
AFS investment (Note 14)
Branded Consumer
Food Segment
Agro-Industrial
Segment
2008
Commodity
Food Segment
(In Thousand Pesos)
Adjustments and
Eliminations
Total
P
=34,763,058
4,891,954
P
=39,655,012
P
=5,570,334
2,973,112
P
=8,543,446
P
=5,121,108
3,740,531
P
=8,861,639
P
=–
(11,605,597)
(P
=11,605,597)
P
=45,454,500
–
P
=45,454,500
P
=1,685,398
P
=217,952
P
=1,784,852
P
=–
P
=3,688,202
1,070,053
(1,273,599)
28,184
(298,967)
(2,702,081)
511,792
(170,596)
P
=341,196
P
=28,276,245
P
=4,676,191
P
=8,171,169
P
=–
P
=6,192,129
P
=1,158,590
P
=3,689,740
P
=–
P
=2,830,712
P
=2,121,883
P
=791,961
P
=207,991
P
=1,364,140
P
=363,546
P
=–
P
=–
P
=41,123,605
93,057
16,713,973
P
=57,930,635
P
=11,040,459
14,745,746
P
=25,786,205
P
=4,986,813
P
=2,693,420
P
=12,959
94,901
11,675
P
=119,535
P
=179,432
–
–
P
=179,432
P
=–
–
–
P
=–
P
=–
–
–
P
=–
P
=192,391
94,901
11,675
P
=298,967
*SGVMC111910*
- 106-
Branded Consumer
Food Segment
Sale of Goods and Services
Third party
Inter-segment
Result
Segment result
Gain on sale of equity investment (Note 17)
Finance revenue (Note 29)
Finance costs (Notes 20, 22 and 30)
Equity in net income of an associate
and a joint venture (Note 17)
Impairment losses
Other revenues (expenses) - net
Income before income tax
Provision for income tax
Net income
Other Information
Segment assets
Investment in an associate and a joint venture
Unallocated corporate assets
Total assets
Segment liabilities
Unallocated liabilities
Total liabilities
Capital expenditures (Note 13)
Depreciation and amortization (Note 27)
Non-cash expenses other than depreciation
and amortization
Impairment losses on:
Receivables (Note 10)
Property and equipment (Note 13)
2007 (As restated - Note 37)
Agro-Industrial
Commodity Food
Segment
Segment
(In Thousand Pesos)
Adjustments and
Eliminations
Total
=28,370,359
P
3,265,165
=31,635,524
P
P5,647,937
=
2,375,669
=8,023,606
P
P3,701,965
=
2,600,364
=6,302,329
P
=–
P
(8,241,198)
(P
=8,241,198)
=37,720,261
P
–
=37,720,261
P
=1,249,737
P
=697,258
P
=1,233,333
P
=–
P
P3,180,328
=
2,858,765
1,562,117
(1,620,999)
23,288
(344,666)
294,451
5,953,284
(452,255)
=5,501,029
P
=26,665,456
P
=3,654,421
P
=6,064,615
P
=–
P
=6,050,051
P
=601,332
P
=900,762
P
=–
P
P2,452,751
=
=1,958,370
P
P367,993
=
=75,707
P
=1,016,324
P
=143,357
P
P–
=
=–
P
=36,384,492
P
89,873
22,359,537
=58,833,902
P
=7,552,145
P
16,283,317
=23,835,462
P
=3,837,068
P
=2,177,434
P
=141,230
P
203,436
=344,666
P
=–
P
–
=–
P
=–
P
–
=–
P
=–
P
–
=–
P
=141,230
P
203,436
=344,666
P
*SGVMC111910*
- 107-
Sale of Goods and Services
Third party
Inter-segment
Result
Segment result
Finance revenue (Note 29)
Finance costs (Notes 20, 22 and 30)
Equity in net income of an associate
and a joint venture (Note 17)
Impairment losses
Other revenues (expenses) - net
Income before income tax
Provision for income tax
Net income
Other Information
Segment assets
Investment in an associate and a joint venture
Unallocated corporate assets
Total assets
Segment liabilities
Unallocated liabilities
Total liabilities
Capital expenditures (Note 13)
Depreciation and amortization (Note 27)
Non-cash expenses other than depreciation
and amortization
Impairment losses on:
Goodwill (Note 16)
Receivables (Note 10)
Branded Consumer
Food Segment
Agro-Industrial
Segment
2006
Commodity Food
Segment
(In Thousand Pesos)
Adjustments and
Eliminations
Total
=26,596,746
P
1,607,301
=28,204,047
P
P5,082,758
=
2,275,294
=7,358,052
P
P3,504,311
=
2,090,690
=5,595,001
P
=–
P
(5,973,285)
(P
=5,973,285)
=35,183,815
P
–
=35,183,815
P
=1,025,354
P
=657,847
P
=1,017,891
P
=–
P
P2,701,092
=
2,319,815
(2,271,951)
319,996
(283,979)
508,483
3,293,456
(382,365)
=2,911,091
P
=25,027,816
P
=3,351,385
P
=5,273,461
P
=–
P
=5,718,080
P
=501,244
P
=1,129,802
P
=–
P
P4,093,163
=
=1,707,999
P
=1,350,911
P
=150,149
P
=386,721
P
P136,437
=
=–
P
P–
=
=33,652,662
P
1,958,481
24,078,802
=59,689,945
P
=7,349,126
P
21,113,804
=28,462,930
P
=5,830,795
P
=1,994,585
P
=240,689
P
43,290
=283,979
P
=–
P
–
=–
P
=–
P
–
=–
P
=–
P
–
=–
P
=240,689
P
43,290
=283,979
P
*SGVMC111910*
- 108 Geographical Segments
The Group operates in the Philippines, Thailand, Malaysia, Indonesia, China, Hong Kong,
Singapore and Vietnam.
The following table shows the distribution of the Group’s consolidated sales by geographical
market, regardless of where the goods were produced, and the carrying amounts of segment assets
and additions to property, plant, equipment, and intangible assets by geographical area in which
the assets are located.
P
=36,185,351
P
=47,568,532
P
=4,051,036
P
=1,979,082
2008
Foreign
(In Thousand Pesos)
P
=9,269,149
P
=10,362,103
P
=935,777
P
=714,338
P
=45,454,500
P
=57,930,635
P
=4,986,813
P
=2,693,420
P
=94,901
–
192,391
P
=287,292
P
=–
11,675
–
P
=11,675
P
=94,901
11,675
192,391
P
=298,967
Domestic
Sale of goods and services
Segment assets
Capital expenditures (Note 13)
Depreciation and amortization (Note 27)
Non-cash expenses other than depreciation
and amortization
Impairment losses on:
Receivables (Note 10)
AFS investments
Inventories
Sale of goods and services
Segment assets
Capital expenditures (Note 13)
Depreciation and amortization (Note 27)
Non-cash expenses other than depreciation
and amortization
Impairment losses on:
Receivables (Note 10)
Property and equipment (Note 13)
2007 (As restated - Note 37)
Domestic
Foreign
(In Thousand Pesos)
=30,528,379
P
=7,191,882
P
=49,375,242
P
=9,458,660
P
=3,030,932
P
=806,136
P
=1,520,550
P
=656,884
P
P141,230
=
203,436
=344,666
P
Total
P37,720,261
=
=58,833,902
P
=3,837,068
P
=2,177,434
P
P141,230
=
203,436
=344,666
P
P27,396,584
=
=49,743,001
P
=4,140,667
P
=1,377,048
P
2006
Foreign
(In Thousand Pesos)
=7,787,231
P
=9,946,944
P
=1,690,128
P
=617,537
P
P35,183,815
=
=59,689,945
P
=5,830,795
P
=1,994,585
P
=–
P
43,291
=43,291
P
=240,689
P
–
=240,689
P
=240,689
P
43,291
=283,980
P
Domestic
Sale of goods and services
Segment assets
Capital expenditures (Note 13)
Depreciation and amortization (Note 27)
Non-cash expenses other than depreciation
and amortization
Impairment losses on:
Goodwill (Note 16)
Receivables (Note 10)
=–
P
–
=–
P
Total
Total
*SGVMC111910*
- 109 7. Cash and Cash Equivalents
This account consists of:
Cash on hand
Cash in banks
Short-term investments
2008
P
= 108,577,127
729,054,382
1,377,996,750
P
= 2,215,628,259
2007
(As restated
- Note 37)
=137,846,817
P
515,458,143
4,391,736,478
=5,045,041,438
P
Cash in banks earns interest at the respective bank deposit rates. Short-term investments represent
money market placements that are made for varying periods depending on the immediate cash
requirements of the Group, and earn interest ranging from 3.2% to 5.4% and 4.1% to 5.8%, in
2008 and 2007, respectively.
8. Financial Assets at Fair Value Through Profit or Loss
This account consists of:
Investments held-for-trading
Derivative assets (Notes 3, 4 and 5)
2007
2008
=
P
16,536,713,409
P
= 5,968,487,826
155,375
10,697,053
=16,536,868,784
P
= 5,979,184,879 P
Investments that are held-for-trading consist of:
Private bonds
Equity securities
Government securities
2007
2008
=9,981,812,179
P
= 4,343,133,416 P
2,202,652,517
1,625,354,410
4,352,248,713
–
P16,536,713,409
P
= 5,968,487,826 =
The above investments consist of quoted debt and equity securities issued by certain domestic and
foreign entities.
Net market valuation loss on financial assets at FVPL amounted to P
=2.3 billion in 2008. Net
market valuation gain of financial assets at FVPL amounted to =
P451.8 million and =
P923.7 million
in 2007 and 2006, respectively.
*SGVMC111910*
- 110 9. Reclassification of Financial Assets
Following the amendments to PAS 39 and PFRS 7, Reclassification of Financial Assets, the
Group reclassified certain trading assets from the Financial Assets at FVPL category to the AFS
Investments category in the balance sheets. The recent global credit crunch had prompted the
amendments to be issued by the International Accounting Standards Board, and the adoption of
these amendments permitted the Group to revisit the existing classification of their financial
assets. The Group identified assets, eligible under the amendments, for which at July 1, 2008, it
had a clear change of intent to hold for the foreseeable future rather than to exit or trade in the
short term. The disclosures below detail the impact of the reclassifications to the Group.
The following table shows carrying values and fair values of the reclassified assets:
Private bonds
Government securities
September 30, 2007
=5,416,514,163
P
2,482,946,123
=7,899,460,286
P
July 1, 2008
P4,885,178,163
=
2,337,022,421
=7,222,200,584
P
September 30, 2008
=4,080,459,883
P
2,224,382,820
=6,304,842,703
P
As of the reclassification date, effective interest rates on reclassified trading assets ranged from
6.06% to 18.94% with expected recoverable cash flows of P
=12.5 billion. Ranges of effective
interest rates were determined based on weighted average rates by business.
Prior to reclassification, reduction in the fair values of the Group’s FVPL at July 1, 2008
amounted to =
P1.3 billion, which is included under Market Valuation Loss on Financial
Instruments at FVPL in the 2008 consolidated statement of income.
If the reclassification had not been made, the Group’s statement of income for the year ended
September 30, 2008 would have included an additional market valuation loss on FVPL on the
reclassified trading assets amounting to =
P826.2 million.
After reclassification, the reclassified financial assets contributed the following amounts to income
before income taxes for the year ended September 30, 2008.
Reduction in interest income
Provision for impairment losses
Foreign exchange losses
(P
=4,472,252)
(11,674,554)
(74,970,771)
*SGVMC111910*
- 111 10. Receivables
This account consists of:
2007
(As restated
- Note 37)
=3,574,791,465
P
441,906,587
896,599,119
410,468,355
666,413,896
5,990,179,422
208,700,698
=5,781,478,724
P
2008
P
= 4,613,929,692
477,809,078
448,124,520
142,815,439
717,507,842
6,400,186,571
224,312,699
P
= 6,175,873,872
Trade receivables
Advances to officers, employees and suppliers
Due from related parties (Note 34)
Interest receivable
Others
Less allowance for impairment losses
Others include receivable from URC Retirement Plan amounting to P
=131.0 and P
=132.7 million as
of September 30, 2008 and 2007, respectively.
Allowance for Impairment Losses on Trade Receivables
Changes in allowance for impairment losses on trade receivables follow:
Balances at beginning of year
Provision for impairment losses (Note 6)
Write offs
Balances at end of year
Individual
Assessment
P
=201,384,207
88,656,201
(79,289,000)
P
=210,751,408
2008
Collective
Assessment
P
=7,316,491
6,244,800
–
P
=13,561,291
Total
P
=208,700,698
94,901,001
(79,289,000)
P
=224,312,699
Balances at beginning of year
Provision for impairment losses (Note 6)
Write offs
Balances at end of year
Individual
Assessment
=343,684,733
P
136,668,558
(278,969,084)
=201,384,207
P
2007
Collective
Assessment
=16,420,813
P
4,561,739
(13,666,061)
=7,316,491
P
Total
P360,105,546
=
141,230,297
(292,635,145)
=208,700,698
P
Aging Analysis
The aging analysis of the Group’s receivables as of September 30, 2008 follows:
Trade receivables
Due from related
parties
Interest receivable
Advances to
officers,
employees and
suppliers
Others
Neither Past
Due Nor
Impaired
=740,790,431
P
Less than
30 Days
=1,809,583,326
P
Past Due But Not Impaired
30 to 60
60 to 90
Days
Days
=516,591,929
P
=131,276,922
P
448,124,520
142,472,011
–
200,356
–
143,072
238,911,073
347,521,208
=1,917,819,243
P
12,618,009
254,322,033
=2,076,723,724
P
199,854,867
69,201,165
=785,791,033
P
Over 90
Days
=1,191,374,385
P
Past
Due and
Impaired
=224,312,699
P
Total
=4,613,929,692
P
–
–
–
–
–
–
448,124,520
142,815,439
16,824,185
7,821,100
=155,922,207
P
9,600,944
38,642,336
=1,239,617,665
P
–
–
=224,312,699
P
477,809,078
717,507,842
=6,400,186,571
P
*SGVMC111910*
- 112 11. Inventories
This account consists of:
At cost:
Raw materials
Finished goods
At NRV:
Goods in-process
Containers and packaging materials
Spare parts and supplies
Materials in-transit
2008
2007
P
= 2,545,062,362
1,751,042,825
4,296,105,187
P1,855,797,593
=
1,358,168,438
3,213,966,031
135,327,500
996,108,728
1,128,048,470
2,259,484,698
1,218,865,295
P
= 7,774,455,180
127,880,688
959,536,372
904,731,722
1,992,148,782
697,213,866
=5,903,328,679
P
Under the terms of the agreements covering liabilities under trust receipts totaling =
P3.0 billion and
=0.4 billion as of September 30, 2008 and 2007, respectively, certain inventories have been
P
released to the Group in trust for the banks. The Parent Company is accountable to these banks
for the trusteed merchandise or their sales proceeds.
Inventory variances written down as expense (included under the Cost of sales account in the
consolidated statements of income) amounted to P
=44.4 million, =
P32.0 million and =
P57.0 million in
2008, 2007 and 2006, respectively.
Inventory obsolescence and market decline (included under the Impairment losses account in the
consolidated statements of income) amounted to P
=192.4 million in 2008.
12. Other Current Assets
This account consists of:
Input value-added tax
Prepaid expenses
Others
2008
P
= 792,557,645
229,976,892
13,829,552
P
= 1,036,364,089
2007
P408,463,933
=
193,382,651
5,354,909
=607,201,493
P
The increase in input value-added tax is due to various acquisitions of property, plant and
equipment during the year and advance value-added tax for certain raw materials.
Prepaid expenses include advertising and insurance amounting to =
P111.0 million and
=
P63.7 million, respectively as of September 30, 2008 and =
P31.7 million and =
P39.0 million,
respectively as of September 30, 2007.
*SGVMC111910*
- 113 13. Property, Plant and Equipment
The composition of and movements in this account follow:
Cost
Balance at beginning of year
Additions (Note 6)
Acquisitions of subsidiaries (Note 37)
Disposal group held for sale (Note 38)
Disposals and other adjustments
Balance at end of year
Accumulated Depreciation, Amortization and
Impairment Losses
Balance at beginning of year
Depreciation and amortization (Note 6)
Disposals and other adjustments
Balance at end of year
Net Book Value
Cost
Balance at beginning of year
Additions (Notes 6 and 37)
Acquisitions of subsidiaries (Note 37)
Disposal group held for sale (Note 38)
Disposals and other adjustments
Balance at end of year
Accumulated Depreciation, Amortization and
Impairment Losses
Balance at beginning of year
Depreciation and amortization (Note 6)
Disposals and other adjustments
Balance at end of year
Net Book Value
Land
P
=969,963,845
549,261,763
21,345,573
(41,955,827)
(300,000)
1,498,315,354
–
–
–
–
P
=1,498,315,354
Land
Improvements
2008
Buildings and
Improvements
Machinery and
Equipment
P
=1,369,336,414
280,850,755
–
–
68,599,231
1,718,786,400
P
=7,072,849,996
962,449,541
–
(117,233,613)
236,021,459
8,154,087,383
P
=28,082,149,332
2,063,868,932
49,923,755
(26,485,605)
383,728,063
30,553,184,477
P
=37,494,299,587
3,856,430,991
71,269,328
(185,675,045)
688,048,753
41,924,373,614
713,057,521
20,574,163
–
733,631,684
P
=985,154,716
3,027,140,515
273,000,759
(18,637,825)
3,281,503,449
P
=4,872,583,934
14,477,028,010
1,933,906,088
(78,991,003)
16,331,943,095
P
=14,221,241,382
18,217,226,046
2,227,481,010
(97,628,828)
20,347,078,228
P
=21,577,295,386
Transportation Furniture, Fixtures
Equipment
and Equipment
2008
Construction
In-progress
Equipment
In-transit
Sub-total
Total
P
=1,716,919,711
347,867,724
–
(247,161)
(43,674,016)
2,020,866,258
P
=1,605,179,902
243,621,316
–
(6,141,536)
(6,677,179)
1,835,982,503
P
=1,491,920,360
486,316,607
–
–
(780,872,486)
1,197,364,481
P
=230,739,151
52,576,441
–
–
–
283,315,592
P
=42,539,058,711
4,986,813,079
71,269,328
(192,063,742)
(143,174,928)
47,261,902,448
1,230,381,904
334,388,411
(38,659,918)
1,526,110,397
P
=494,755,861
934,999,029
125,185,233
1,185,185
1,061,369,447
P
=774,613,056
–
–
–
–
P
=1,197,364,481
–
–
–
–
P
=283,315,592
20,382,606,979
2,687,054,654
(135,103,561)
22,934,558,072
P
=24,327,344,376
*SGVMC111910*
- 114 -
Land
Cost
Balance at beginning of year
Additions (Notes 6 and 37)
Acquisition of a subsidiary (Note 37)
Disposals and other adjustments
Balance at end of year
Accumulated Depreciation, Amortization and
Impairment Losses
Balance at beginning of year
Depreciation and amortization (Note 6)
Impairment losses (Notes 6 and 27)
Disposals and other adjustments
Balance at end of year
Net Book Value
=958,734,712
P
31,371,406
–
(20,142,273)
969,963,845
–
–
–
–
–
=969,963,845
P
Transportation
Equipment
Cost
Balance at beginning of year
Additions (Notes 6 and 37)
Acquisition of a subsidiary (Note 37)
Disposals and other adjustments
Balance at end of year
Accumulated Depreciation, Amortization and
Impairment Losses
Balance at beginning of year
Depreciation and amortization (Note 6)
Impairment losses (Notes 6 and 27)
Disposals and other adjustments
Balance at end of year
Net Book Value
2007 (As restated - see Note 37)
Land
Buildings and
Machinery and
Improvements
Improvements
Equipment
Sub-total
=1,317,046,756
P
52,289,658
–
–
1,369,336,414
=6,365,865,314
P
706,984,682
–
–
7,072,849,996
=24,555,481,500
P
3,361,771,389
169,282,889
(4,386,446)
28,082,149,332
=33,197,128,282
P
4,152,417,135
169,282,889
(24,528,719)
37,494,299,587
686,332,793
26,724,728
–
–
713,057,521
=656,278,893
P
2,806,351,132
220,317,309
–
472,074
3,027,140,515
=4,045,709,481
P
12,503,631,352
1,750,694,264
203,436,240
19,266,154
14,477,028,010
=13,605,121,322
P
15,996,315,277
1,997,736,301
203,436,240
19,738,228
18,217,226,046
=19,277,073,541
P
Equipment
In-transit
Total
2007 (As restated - Note 37)
Furniture, Fixtures
Construction
and Equipment
In-progress
=1,661,748,178
P
88,620,714
–
(33,449,181)
1,716,919,711
=1,436,955,455
P
168,265,356
–
(40,909)
1,605,179,902
P591,516,328
=
900,404,032
–
–
1,491,920,360
P1,703,378,173
=
(1,472,639,022)
–
–
230,739,151
=38,590,726,416
P
3,837,068,215
169,282,889
(58,018,809)
42,539,058,711
1,188,136,996
81,592,697
–
(39,347,789)
1,230,381,904
=486,537,807
P
842,371,620
93,123,014
–
(495,605)
934,999,029
=670,180,873
P
–
–
–
–
–
=1,491,920,360
P
–
–
–
–
–
=230,739,151
P
18,026,823,893
2,172,452,012
203,436,240
(20,105,166)
20,382,606,979
=22,156,451,732
P
*SGVMC111910*
- 115 The total cost of fully depreciated property, plant and equipment which are still in use amounted to
=8.0 billion and =
P
P7.7 billion as of September 30, 2008 and 2007, respectively.
Property, plant and equipment with an aggregate net book value of P
=97.3 million have been
pledged as security for certain long-term debt as of September 30, 2008 and 2007 (Note 22).
14. Available-for-Sale Investments
As of September 30, 2008, this account consists of:
Private bonds
Government securities
P4,080,459,883
=
2,224,382,820
=6,304,842,703
P
In 2008, the Group recognized impairment losses on AFS investments amounting to =
P11.7 million
(Note 9). As of September 30, 2008, net unrealized loss on market revaluation amounted to
=826.2 million is shown as a separate component of equity in the consolidated balance sheets.
P
15. Biological Assets
Movements in this account follow:
2008
Swine (At Fair Values Less
Estimated Point-of-Sale Costs)
Mature
Immature
Cost
Balance at beginning of year
Additions
Disposal
Gain arising from changes in fair
value less estimated point ofsale costs
Balance at end of year
Accumulated Depreciation
Balance at beginning of year
Depreciation
Disposal
Balance at end of year
Net Book Value at End of Year
= 692,772,061
P
1,434,647,245
(1,430,057,316)
Sub-total
Poultry (At Cost)
Mature
Total
P273,462,319
=
788,664,241
(811,635,368)
= 966,234,380
P
2,223,311,486
(2,241,692,684)
= 138,024,030
P
555,610,525
(428,248,980)
= 1,104,258,410
P
2,778,922,011
(2,669,941,664)
140,109,450
837,471,440
140,224,155
390,715,347
280,333,605
1,228,186,787
–
265,385,575
280,333,605
1,493,572,362
–
–
–
–
= 837,471,440
P
–
–
–
–
=390,715,347
P
–
–
–
–
=1,228,186,787
P
53,689,637
81,504,856
(84,881,873)
50,312,620
= 215,072,955
P
53,689,637
81,504,856
(84,881,873)
50,312,620
= 1,443,259,742
P
*SGVMC111910*
- 116 2007
Swine (At Fair Values Less
Estimated Point-of-Sale Costs)
Mature
Immature
Cost
Balance at beginning of year
Additions
Disposal
Gain arising from changes in fair
value less estimated point ofsale costs
Balance at end of year
Accumulated Depreciation
Balance at beginning of year
Depreciation
Disposal
Balance at end of year
Net Book Value at End of Year
=555,415,570
P
1,312,996,220
(1,321,813,233)
=209,979,070
P
409,051,179
(476,209,662)
Sub-total
Poultry (At Cost)
Mature
=765,394,640
P
1,722,047,399
(1,798,022,895)
Total
P97,225,296
=
119,355,254
(78,556,520)
=862,619,936
P
1,841,402,653
(1,876,579,415)
146,173,504
692,772,061
130,641,732
273,462,319
276,815,236
966,234,380
–
138,024,030
276,815,236
1,104,258,410
–
–
–
–
=692,772,061
P
–
–
–
–
=273,462,319
P
–
–
–
–
=966,234,380
P
45,616,483
85,923,741
(77,850,587)
53,689,637
=84,334,393
P
45,616,483
85,923,741
(77,850,587)
53,689,637
=1,050,568,773
P
The Group has about 180,718 and 167,841 heads of swine as of September 30, 2008 and 2007,
respectively, and about 468,211 and 413,231 heads of poultry as of September 30, 2008 and 2007,
respectively.
16. Intangible Assets
The composition of and movements in this account follow:
2008
Cost
Balance at beginning of year
Additions (Note 37)
Balance at end of year
Accumulated Amortization and
Impairment Losses
Balance at beginning of year
Amortization during the year
Balance at end of year
Net Book Value at End of Year
Cost
Balance at beginning of year
Additions (Note 37)
Balance at end of year
Accumulated Amortization and
Impairment Losses
Balance at beginning of year
Amortization during the year
Balance at end of year
Net Book Value at End of Year
Goodwill
Trademark
Product
Formulation
Total
P
=1,113,484,248
17,579,587
1,131,063,835
P
=285,539,346
50,000,000
335,539,346
P
=–
425,000,000
425,000,000
P
=1,399,023,594
492,579,587
1,891,603,181
240,688,815
–
240,688,815
P
=890,375,020
1,383,818
2,767,636
4,151,454
P
=331,387,892
–
–
–
P
=425,000,000
242,072,633
2,767,636
244,840,269
P
=1,646,762,912
Goodwill
2007
Trademark
Total
=1,085,237,005
P
28,247,243
1,113,484,248
=190,223,400
P
95,315,946
285,539,346
=1,275,460,405
P
123,563,189
1,399,023,594
240,688,815
–
240,688,815
=872,795,433
P
–
1,383,818
1,383,818
=284,155,528
P
240,688,815
1,383,818
242,072,633
=1,156,950,961
P
*SGVMC111910*
- 117 The Group’s goodwill pertains to: (a) the acquisition of Advanson International Pte. Ltd.
(Advanson) in December 2007, (b) the acquisition of Acesfood Network Pte. Ltd. (Acesfood) in
May 2007, (c) the excess of the acquisition cost over the fair values of the net assets acquired by
Hong Kong China Foods Co. Ltd. (HCFCL) and URC Asean Brands Co. Ltd. (UABCL) in 2000,
and (d) the acquisition of Southern Negros Development Corporation (SONEDCO) in 1998. The
goodwill arising from the acquisitions of HCFCL, UABCL and Advanson was translated at the
applicable year-end exchange rate.
Due to continued losses from operations in HCFCL, the allocated goodwill on this subsidiary was
written down and a provision for impairment losses amounting to P
=240.7 million was recorded in
2006.
17. Investments in an Associate and a Joint Venture
This account consists of:
2008
Acquisition Cost
Balance at beginning of year
Disposal
Balance at end of year
Accumulated Equity in Net Earnings
Balance at beginning of year
Equity in net income during the year
Dividends received
Disposal
Balance at end of year
Net Book Value at End of Year
P
=1,250,000
–
1,250,000
88,622,575
28,184,000
(24,999,930)
–
91,806,645
P
=93,056,645
2007
P1,197,593,846
=
(1,196,343,846)
1,250,000
760,887,140
23,287,500
–
(695,552,065)
88,622,575
=89,872,575
P
The Parent Company has an equity interest in Hunt-Universal Robina Corporation (HURC),
a domestic joint venture. HURC manufactures and distributes food products under the “Hunt’s”
brand name, which is under exclusive license to HURC in the Philippines.
The Parent Company also had an equity interest in Robinsons Land Corporation (RLC), where it
exercised significant influence. In 2007, the Parent Company sold its investment in RLC. Total
gain on sale of said investments in common shares of RLC amounted to =
P2.9 billion.
The Parent Company’s equity in the net assets of HURC and its related percentage of ownership is
summarized below:
Percentage of Ownership
2007
2008
HURC
50.0
50.0
Equity in Net Assets
2007
2008
(In Million Pesos)
P89.9
=
P
=93.1
*SGVMC111910*
- 118 Summarized financial information of HURC as of September 30, 2008 and 2007 which are
accounted for under the equity method follow:
Current assets
Noncurrent assets
Current liabilities
Noncurrent liabilities
Revenue
Costs and expenses
Net income
2007
2008
(In Thousand Pesos)
=239,345
P
P
=355,731
4,323
7,105
(161,454)
(273,730)
(4,999)
(6,473)
614,149
733,742
(546,143)
(649,024)
45,060
55,417
18. Investment Properties
Movements in this account follow:
Cost
Balance at beginning and end of year
Accumulated Depreciation
Balance at beginning of year
Depreciation (Notes 25 and 27)
Balance at end of year
Net Book Value at End of Year
2008
2007
P
= 107,947,364
=107,947,364
P
25,345,535
3,598,245
28,943,780
P
=79,003,584
21,747,290
3,598,245
25,345,535
=82,601,829
P
The investment properties consist of land, building and plant which are made available for lease to
others.
The aggregate fair value of the Group’s investment properties amounted to =
P240.0 million as of
September 30, 2008 and 2007, respectively. The fair values of investment properties have been
determined by qualified independent appraisers. The fair value represents the amount at which the
assets could be exchanged between a knowledgeable, willing buyer and knowledgeable, willing
seller in an arm’s length transaction at the date of valuation.
Total rental income earned from investment properties (included under Other revenue (expenses) net account in the consolidated statements of income) amounted to P
=54.5 million, =
P50.3 million
and P
=50.0 million in 2008, 2007 and 2006, respectively. Direct operating expenses, included
under General and Administrative Expense in the consolidated statements of income arising from
investment properties amounted to P
=0.2 million, P
=0.2 million, and =
P0.3 million in 2008, 2007 and
2006, respectively.
*SGVMC111910*
- 119 19. Other Noncurrent Assets
This account consists of:
Input value-added tax
Miscellaneous deposits
Others
2008
P
= 171,456,867
83,144,404
159,030,094
P
= 413,631,365
2007
(As restated
- Note 37)
=205,464,745
P
74,419,424
51,118,452
=331,002,621
P
2008
2007
(As restated
- Note 37)
20. Short-term Debt
This account consists of:
Parent Company
Philippine Peso - with interest rate of
6.75% in 2008
Subsidiaries
Foreign currencies - with interest rates ranging
from 3.39% to 5.46% per annum in 2008
and 4.30% to 5.95% per annum in 2007
P
= 1,123,000,000
=–
P
6,946,508,132
P
= 8,069,508,132
4,519,172,112
P4,519,172,112
=
Interest is based on prevailing market rates and repriced quarterly. Accrued interest payable on
the Group’s short-term debt (included under Accounts payable and other accrued liabilities
account in the consolidated balance sheets) amounted to =
P91.3 million and =
P21.1 million as of
September 30, 2008 and 2007, respectively.
21. Accounts Payable and Other Accrued Liabilities
This account consists of:
Trade payables
Accrued expenses
Due to related parties (Note 34)
Customers’ deposits
Derivative liabilities (Notes 3 and 4)
Others
2008
P
= 3,307,224,907
1,105,488,749
127,615,090
80,397,227
40,421,267
303,794,344
P
= 4,964,941,584
2007
(As restated
- Note 37)
=2,568,212,666
P
1,151,334,365
334,154,530
58,131,585
7,266,667
304,628,954
=4,423,728,767
P
*SGVMC111910*
- 120 Other payables include advances to stockholders amounting to =
P107.6 million and =
P101.0 million
in 2008 and 2007, respectively, as well as withholding tax payable amounting to =
P65.6 million and
=52.3 million in 2008 and 2007, respectively.
P
The Accrued expenses account includes accruals for:
2008
P
= 425,096,130
208,776,082
125,711,137
345,905,400
P
= 1,105,488,749
Advertising and promotions
Interest payable
Freight and handling costs
Others
2007
P403,611,208
=
291,476,641
100,707,839
355,538,677
=1,151,334,365
P
Other accrued expenses include accrued 13th month pay amounting to P
=95.8 million and
=88.8 million in 2008 and 2007, respectively, and accrued contracted services amounting to
P
=85.6 million and =
P
P90.5 million in 2008 and 2007, respectively.
22. Long-term Debt
This account (net of debt issuance costs) consists of:
Maturities
Parent Company:
Foreign currencies
HypoVereinsbank term
loan facilities
Subsidiaries:
Foreign currencies:
URCPL US$125 million
guaranteed notes
URC US$200 million
guaranteed notes
Philippine Peso
Philippine Sugar
Corporation
restructured loan
Less current portion
Interest Rates
2008
2007
Various dates EURIBOR/
through
USD LIBOR +
0.75%
2009
= 62,440,707
P
=214,084,334
P
2008
9.00%
–
4,912,482,077
2012
8.25%
9,368,966,095
9,368,966,095
8,958,806,192
13,871,288,269
2013
7.50%
46,395,488
9,415,361,583
9,477,802,290
48,031,798
=9,429,770,492
P
52,353,312
13,923,641,581
14,137,725,915
5,072,751,025
=9,064,974,890
P
Long-term debt is shown net of unamortized debt issuance costs totaling =
P41.0 million
(US$0.9 million) and =
P54.0 million (US$1.2 million) as of September 30, 2008 and 2007,
respectively (Note 4).
*SGVMC111910*
- 121 Repayments of the long-term debt follow:
Due in:
2008
2009
2010
2011
2012
Thereafter
2008
2007
P
=–
48,031,798
27,698,579
7,401,385
9,417,969,442
17,747,944
P
=9,518,849,148
=5,072,751,025
P
46,253,466
26,809,413
7,401,385
8,958,806,194
25,704,432
=14,137,725,915
P
The exchange rates used to restate the foreign currency borrowings were P
=47.05 to US$1.00 and
=45.04 to US$1.00 as of September 30, 2008 and 2007, respectively.
P
The following significant transactions affected the Group’s long-term debt:
Parent Company HypoVereinsbank Term Loan Facilities
The Parent Company entered into two (2) credit term loan facilities with HypoVereinsbank to
finance the supply of certain property and equipment for its biaxially-oriented polypropylene plant
and flour mill plant. The loans obtained from said facility shall bear interest at floating rate based
on the EURIBOR/USD LIBOR plus 0.75%. The loan shall be payable in fourteen (14) equal,
consecutive, semi-annual payments starting six (6) months after the weighted average delivery
period of all units or, at the latest, starting six (6) months after August 1, 2002, whichever date
shall occur earlier, with the last repayment installment due October 15, 2009.
These loans contain negative covenants that, among others, prohibit merger or consolidation with
other entities, dissolution, liquidation or winding-up except with any of its subsidiaries; prohibit
purchase or redemption of any issued shares or reduction of registered and paid-up capital or
distribution of assets resulting in capital base impairment.
As of September 30, 2008 and 2007, the outstanding balance of the loan obtained from the term
loan facilities amounted to P
=62.4 million (US$1.3 million) and =
P214.1 million (US$4.8 million),
respectively.
URCPL US$125 Million Guaranteed Notes Due 2008
On February 5, 2003, URCPL issued US$125.0 million, 9% guaranteed notes due 2008 which are
unconditionally and irrevocably guaranteed by the Parent Company. Unless previously redeemed
or purchased and cancelled, the notes will be redeemed at their principal amount, plus accrued and
unpaid interest, on February 6, 2008. Related terms and conditions provide for financial
covenants to be complied with by URCPL and URC.
As of September 30, 2007, the outstanding balance of the notes amounted to P
=4.9 billion
(US$109.7 million). The loan was fully settled in 2008.
URCPL 8.25% Guaranteed Notes Due 2012
On January 14, 2005, URCPL issued US$200.0 million 8.25% notes due 2012 guaranteed by the
Parent Company. Unless previously redeemed or purchased and cancelled, the notes will be
redeemed at their principal amount, plus accrued and unpaid interest on January 20, 2012.
*SGVMC111910*
- 122 As of September 30, 2008 and 2007, the outstanding balance of the notes amounted to
=9.4 billion (US$199.1 million) and P
P
=9.0 billion (US$199.0 million), respectively.
Philippine Sugar Corporation Restructured Loan
Republic Act (RA) No. 7202 dated February 24, 1992 provided for, among others, the
condonation of all penalties and surcharges on loans granted to sugar producers from crop year
1974-1975 up to and including 1984-1985. The guidelines for the implementation of RA
No. 7202 was issued under Executive Order No. 31 dated October 29, 1992, directing all
government lending financial institutions to write off from their respective books the interest in
excess of 12% yearly and all penalties and surcharges due.
Certain property and equipment of a certain subsidiary with net book value of P
=97.3 million as of
September 30, 2008 and 2007 were used to secure the loan. The loan is payable in 25 equal
annual amortizations of =
P9.9 million. Unpaid interest on the loan amounted to P
=156.3 million and
=2.9 million as of September 30, 2008 and 2007, respectively.
P
Total interest expense and other related charges on all of these long-term debts amounted to
=806.9 million, P
P
=1.4 billion and =
P1.8 billion in 2008, 2007 and 2006, respectively (Note 30).
23. Equity
The details of the Parent Company’s common stock follow:
Authorized shares
Par value per share
Issued shares:
Balance at beginning of year
Issuance of common shares of
stock during the year
Balance at end of year
2008
2,998,000,000
P
=1.00
2007
2,998,000,000
=1.00
P
2006
2,998,000,000
=1.00
P
2,221,851,481
2,221,851,481
1,686,479,549
–
2,221,851,481
–
2,221,851,481
535,371,932
2,221,851,481
Capital Management
The primary objective of the Group’s capital management is to ensure that it maintains healthy
capital ratios in order to support its business and maximize shareholder value. The Group
manages its capital structure and makes adjustments to these ratios in light of changes in economic
conditions and the risk characteristics of its activities. In order to maintain or adjust the capital
structure, the Group may adjust the amount of dividend payment to shareholders, return capital
structure or issue capital securities. No changes have been made in the objective, policies and
processes as they have been applied in previous years.
*SGVMC111910*
- 123 The Group monitors its use of capital structure using a debt-to-capital ratio which is gross debt
divided by total capital. The Group includes within gross debt all interest-bearing loans and
borrowings, while capital represents total equity. Following is a computation of the Group’s debtto-capital ratio as of September 30, 2008 and 2007.
(a) Short-term debt
Trust receipts payable
Long-term debt
(b) Capital
(c) Debt-to-capital ratio (a/b)
2008
P
=8,069,508,132
3,000,776,510
9,477,802,290
P
=20,548,086,932
P
=32,144,429,756
0.64:1
2007
(As restated
- Note 37)
=4,519,172,112
P
385,279,591
14,137,725,915
=19,042,177,618
P
=34,998,440,344
P
0.54:1
The Group’s policy is to keep the debt-to-capital ratio at the 1.5:1 level.
Transaction costs on the issuance of additional common shares in February 2006 amounting to
=19.3 million have been accounted for as a deduction against additional paid-in capital.
P
Cumulative Redeemable Preferred Shares
The Group’s authorized preferred shares of stock are 12% cumulative, nonparticipating, and
nonvoting. In case of dissolution and liquidation of the Parent Company, the holders of the
preferred shares shall be entitled to be paid an amount equal to the par value of the shares or
ratably insofar as the assets of the Parent Company may warrant, plus accrued and unpaid
dividends thereon, if any, before the holders of the common shares of stock can be paid their
liquidating dividends. The authorized preferred stock is 2,000,000 shares at par value of
=1.0 per share. There have been no issuances of preferred stock as of September 30, 2008 and
P
2007.
Deposits for Future Stock Subscriptions
On August 3, 2001, the Parent Company’s BOD approved the issuance of 55.7 million shares to
JGSHI, Robinson’s Supermarket Corporation and a certain stockholder in exchange for two (2)
parcels of land and certain marketable securities which were valued at P
=250.5 million. This was
reflected as Deposits for future stock subscriptions in the consolidated balance sheets pending
approval of the Philippine SEC.
On June 19, 2003, the Philippine SEC approved the issuance of 49.9 million shares for the two (2)
parcels of land.
*SGVMC111910*
- 124 Retained Earnings
Dividends
Details of the Group’s dividend declarations follow:
Date of declaration
Dividend per share
Total dividends
Date of record
Date of payment
2008
April 17, 2008
=0.68
P
=1.5 billion
P
May 16, 2008
June 12, 2008
2007
April 19, 2007
=0.68
P
=1.5 billion
P
May 18, 2007
June 14, 2007
2006
April 20, 2006
=0.54
P
=1.2 billion
P
May 19, 2006
June 15, 2006
The Group intends to maintain an annual cash dividend payment ratio of 50% of the Group’s
consolidated net income from the preceding fiscal year, subject to the requirements of the
applicable laws and regulations and the absence of circumstances which may restrict the payment
of such dividends. The BOD may, at any time, modify such dividend payment ratio.
Appropriation of retained earnings
In 2003, the Group’s BOD approved the appropriation of retained earnings amounting to
=3.0 billion for the Group’s expansion plans.
P
Treasury Shares
On November 13, 2007, the Group’s BOD approved the creation and implementation of a share
buy-back program allotting up to =
P2.5 billion to reacquire a portion of the Parent Company’s
issued and outstanding common shares, representing approximately 7.63% of current market
capitalization.
As of September 30, 2008, the Parent Company has outstanding treasury shares of 72.1 million
shares amounting to P
=916.7 million, restricting the Parent Company from declaring an equivalent
amount from unappropriated retained earnings as dividends.
24. Cost of Sales
This account consists of:
Raw materials used
Direct labor (Note 28)
Overhead costs (Notes 26 and 27)
Total manufacturing costs
Goods in-process
Cost of goods manufactured
Finished goods
2008
= 26,558,862,561
P
915,861,232
7,529,632,027
35,004,355,820
(7,446,812)
34,996,909,008
(396,988,703)
= 34,599,920,305
P
2007
=20,964,162,832
P
817,733,243
5,969,474,472
27,751,370,547
27,097,141
27,778,467,688
(161,690,351)
=27,616,777,337
P
2006
=19,975,260,129
P
741,356,852
5,659,055,964
26,375,672,945
(60,810,866)
26,314,862,079
45,112,152
=26,359,974,231
P
Overhead costs include research and development cost amounting to P
=41.1 million, P
=26.5 million
and P
=29.3 million in 2008, 2007 and 2006, respectively.
*SGVMC111910*
- 125 25. Selling and Distribution Costs
This account consists of:
Advertising and promotions
Freight and other selling expenses
Compensation and benefits (Note 28)
Depreciation and amortization (Note 27)
Repairs and maintenance
Other selling and distribution costs
2008
=2,533,425,686
P
2,231,839,684
626,034,810
111,669,770
45,214,322
67,178,520
=5,615,362,792
P
2007
=2,346,564,689
P
2,038,261,862
552,941,525
80,666,522
43,219,005
57,528,713
=5,119,182,316
P
2006
=2,347,929,155
P
1,874,294,290
452,753,908
57,273,438
32,222,306
25,932,841
=4,790,405,938
P
2008
P608,486,528
=
158,941,108
46,124,157
737,463,433
=1,551,015,226
P
2007
P784,979,618
=
234,369,163
32,540,510
752,083,053
=1,803,972,344
P
2006
=600,807,483
P
123,739,621
27,276,993
580,518,404
=1,332,342,501
P
26. General and Administrative Expenses
This account consists of:
Compensation and benefits (Note 28)
Depreciation and amortization (Note 27)
Repairs and maintenance
Other general and administrative expenses
27. Depreciation, Amortization and Impairment Losses
Depreciation and Amortization
The breakdown of consolidated depreciation and amortization on property, plant and equipment,
investment in properties and intangible assets follows:
Cost of sales
General and administrative expenses
Selling and distribution costs
2008
=2,422,809,657
P
158,941,108
111,669,770
=2,693,420,535
P
2007
=1,862,398,389
P
234,369,163
80,666,522
=2,177,434,074
P
2006
=1,813,572,239
P
123,739,621
57,273,438
=1,994,585,298
P
Impairment Losses on Property and Equipment
In 2007, the Group recorded a provision for impairment losses on certain machinery and
equipment relating to its packaging operations amounting to =
P203.4 million (Note 13) (included in
Impairment Losses account in the consolidated statements of income). The recoverable amount
was determined as the higher of the assets’ net selling price and value in use. The Group used the
net selling price in computing for the provision on impairment losses.
*SGVMC111910*
- 126 28. Personnel Expenses
Personnel expenses consist of:
Salaries and wages
Other employee benefits
Pension expense (income) (Note 31)
2007
=1,531,700,153
P
527,715,556
144,599,400
=2,204,015,109
P
2006
=1,365,425,299
P
500,440,853
(55,251,591)
=1,810,614,561
P
2008
P956,887,161
=
626,034,810
608,486,528
=2,191,408,499
P
2007
P866,093,966
=
552,941,525
784,979,618
=2,204,015,109
P
2006
=757,053,170
P
452,753,908
600,807,483
=1,810,614,561
P
2008
2007
2006
P852,732,825
=
110,574,933
104,951,723
1,793,773
=1,070,053,254
P
=1,211,892,358
P
100,145,952
249,801,776
276,957
=1,562,117,043
P
=2,044,697,457
P
177,903,257
96,913,776
300,919
=2,319,815,409
P
2007
=1,407,852,157
P
210,818,317
2,328,356
=1,620,998,830
P
2006
=1,814,587,075
P
443,065,132
14,298,695
=2,271,950,902
P
2008
=1,681,713,584
P
582,317,915
(72,623,000)
=2,191,408,499
P
The breakdown of consolidated personnel expenses follows:
Cost of sales
Selling and distribution costs
General and administrative expenses
29. Finance Revenue
This account consists of:
Income from investments in financial
assets at FVPL
Dividend income
Bank interest income
Others
30. Finance Costs
This account consists of finance costs arising from:
Long-term debt
Short-term debt
Others
2008
P806,947,618
=
426,128,872
40,522,744
=1,273,599,234
P
*SGVMC111910*
- 127 31. Pension Costs
The Parent Company has a funded, noncontributory defined benefit retirement plan covering all its
regular employees. The plan provides for retirement, separation, disability and death benefits to
its members. The Parent Company, however, reserves the right to discontinue, suspend or change
the rates and amounts of its contributions at any time on account of business necessity or adverse
economic conditions. The retirement fund is being administered and managed by certain
stockholders as trustees. The latest actuarial valuation was made on December 16, 2008.
The following tables summarize the components of net pension expense (income) recognized in
the Parent Company’s statements of income, and the funded status and amounts recognized in the
balance sheets.
The amounts recognized in the Parent Company’s balance sheets follow:
Present value of funded obligation
Fair value of plan assets
Funded status
Unrecognized actuarial losses - net
Less asset not recognized due to limit
Net plan assets
Asset limit to be recognized in the
consolidated balance sheets
Net plan assets in excess of the asset
ceiling limit (not recognized in the
consolidated balance sheets)
2008
P1,113,492,800
=
1,341,210,300
227,717,500
16,093,100
–
=243,810,600
P
2007
P934,438,200
=
1,218,540,900
284,102,700
92,534,300
284,102,700
=92,534,300
P
=243,810,600
P
=92,534,300
P
=–
P
=284,102,700
P
As of September 30, 2008 and 2007, asset ceiling test follows:
(a) Retirement asset
(b) Asset ceiling limit
i. Unrecognized actuarial loss
ii. Present value of available reduction in future
contributions
Limit
Lower of (a) and (b)
2008
=243,810,600
P
2007
=373,637,000
P
16,093,100
92,834,300
227,717,500
243,810,600
=243,810,600
P
–
92,834,300
=92,534,300
P
Components of the Parent Company’s pension expense (income) follow:
Current service cost
Interest cost
Expected return on plan assets
Amortization of past service cost
Loss (gain) recognized under limit
on net assets
Total pension expense (income)
2008
P55,595,900
=
88,771,600
(67,019,700)
132,355,700
(284,102,700)
(P
= 74,399,200)
2007
P47,374,300
=
66,350,900
(81,406,000)
–
111,492,900
P143,812,100
=
2006
P35,275,200
=
67,463,600
(76,195,900)
–
(82,266,691)
(P
=55,723,791)
*SGVMC111910*
- 128 Past service costs recognized in 2008 were brought about by improvements in the Parent
Company’s retirement plan.
Movements in the present value of the defined benefit obligation follow:
Balance at beginning of year
Current service cost
Interest cost
Past service cost
Benefits paid
Actuarial losses (gains) - net (Note 3)
Balance at end of year
2008
=934,438,200
P
55,595,900
88,771,600
132,355,700
(16,115,800)
(81,552,800)
= 1,113,492,800
P
2007
=753,987,300
P
47,374,300
66,350,900
–
(7,614,900)
74,340,600
=934,438,200
P
2008
= 1,218,540,900
P
67,019,700
76,877,100
(16,115,800)
(5,111,600)
= 1,341,210,300
P
=61,908,100
P
2007
=1,162,943,500
P
81,406,000
–
(7,614,900)
(18,193,700)
=1,218,540,900
P
=63,212,300
P
Movements in the fair value of plan assets follow:
Balance at beginning of year
Expected return on plan assets
Actual contributions
Benefits paid
Actuarial gains (losses) - net
Balance at end of year
Actual return on plan assets
There are no reimbursement rights recognized as a separate asset as of September 30, 2008 and
2007.
The overall expected rate of return on assets is determined based on the market expectations
prevailing on that date, applicable to the period over which the obligation is to be settled.
Principal actuarial assumptions at the balance sheet date follow:
Discount rate
Salary rate increase
Expected rate of return on plan assets
Experience adjustments gains (losses) - net
Turnover rate
2008
8.27%
5.50%
8.27%
(P
=176,556,600)
0.00% - 21.96%
2007
9.50%
7.00%
5.50%
=78,783,300
P
0.00% - 25.00%
2006
8.80%
6.00%
6.94%
(P
=181,622,700)
0.00% - 15.00%
The Group’s plan assets consist of the following:
Cash
Receivables
Liabilities
(Notes 10 and 34)
2008
Amount
P
=76,906,537
1,395,296,498
%
5.73
104.03
2007
Amount
=27,090
P
1,351,241,612
%
–
110.89
2006
Amount
=26,130
P
1,289,301,558
%
–
110.87
(130,992,735)
P
=1,341,210,300
(9.76)
100.00
(132,727,802)
=1,218,540,900
P
(10.89)
100.00
(126,384,188)
=1,162,943,500
P
(10.87)
100.00
*SGVMC111910*
- 129 The Group expects to contribute about P
=50.4 million into the pension fund for the year ending in
2009.
Amounts for the current annual period and previous two annual periods are as follows:
2008
P1,113,492,800
=
1,341,210,300
227,717,500
Defined benefit obligation
Plan assets
Surplus
Experience adjustments on
Plan assets
Plan liabilities
(176,556,600)
(5,111,600)
2007
P934,438,200
=
1,218,540,900
284,102,700
78,783,300
(18,194,700)
The following tables summarize the components of total net pension expense recognized in
subsidiary’s statements of income, and the funded status and amounts recognized in the balance
sheets.
2008
P4,995,500
=
(1,530,100)
2007
P3,229,100
=
(1,539,900)
= 3,465,400
P
=1,689,200
P
2008
P567,200
=
306,800
2007
P390,200
=
185,000
2006
=211,200
P
110,200
826,100
76,100
–
=1,776,200
P
–
43,000
169,100
=787,300
P
–
6,000
144,800
=472,200
P
Present value of defined benefit obligation
Unrecognized actuarial loss
Liability to be recognized in the
balance sheets
Components of other subsidiary’s total pension expense follow:
Current service cost
Interest cost
Amortization amounts for:
Past service cost
Actuarial net losses
Increase in liability
Total pension expense
Movements in the present value of the defined benefit obligation follow:
Balance at beginning of year
Current service cost
Interest cost
Past service cost
Actuarial losses - net
Increase in liability
Balance at end of year
2008
= 3,229,100
P
567,200
306,800
826,100
66,300
–
= 4,995,500
P
2007
=2,022,000
P
390,200
185,000
–
607,700
24,200
=3,229,100
P
2007
9.50%
7.00%
2006
9.03%
6.00%
Principal actuarial assumptions at the balance sheet date follow:
Discount rate
Salary rate increase
2008
7.96% to 8.07%
5.50%
*SGVMC111910*
- 130 32. Income Taxes
Provision for income tax consists of:
Current
Deferred
2008
=177,271,394
P
(6,675,487)
=170,595,907
P
2007
P295,655,261
=
156,600,719
=452,255,980
P
2006
=256,450,512
P
125,914,077
=382,364,589
P
2008
2007
=235,973,362
P
=210,782,925
P
123,418,430
11,888,464
954,840
372,235,096
138,522,917
13,869,875
–
363,175,717
328,125,000
130,554,504
281,250,000
235,403,541
84,100,082
73,143,180
615,922,766
=243,687,670
P
96,885,333
–
613,538,874
=250,363,157
P
Components of the Group’s net deferred tax liabilities follow:
Deferred tax assets on:
Foreign subsidiaries
Impairment losses on trade receivables
and property and equipment
Inventory write-downs
Pension liabilities
Deferred tax liabilities on:
Undistributed income of foreign subsidiaries
Foreign exchange gain - net
Gain arising from changes in fair value less
estimated point-of-sale costs of swine stocks
Pension assets
Net deferred tax liabilities
Reconciliation between the Group’s statutory income tax rate and the effective income tax rate
follows:
Statutory income tax rate
Tax effects of:
Decline in value of financial assets at FVPL
Net income of subsidiaries for which
no tax was provided
Nondeductible interest expense
Income exempt from tax
Equity in net income of an associate
and a joint venture
Interest income subjected to final tax
Gain on sale of investment (Note 17)
Change in tax rates
Others
Effective income tax rate
2008
35.00%
2007
35.00%
2006
34.75%
154.83
(2.66)
(3.55)
(127.78)
1.30
–
(8.15)
–
(1.50)
(14.87)
0.14
(4.88)
(1.93)
(3.04)
–
(4.53)
(20.52)
33.33%
(0.14)
(0.06)
(16.81)
–
1.92
7.60%
(3.49)
(0.19)
–
–
3.70
11.61%
*SGVMC111910*
- 131 RA No. 9337
RA No. 9337 was enacted into law which amended various provisions in the existing 1997
National Internal Revenue Code, among the reforms introduced by the said RA were the reduction
in the regular corporate income tax rate from 35% to 30% beginning January 1, 2009;
Nondeductible interest expense from 42% of interest income subjected to final tax to 33%
beginning January 1, 2009.
Entertainment, Amusement and Recreation (EAR) Expenses
Revenue Regulation No. 10-2002 defines expenses to be classified as EAR expenses and sets a
limit for the amount that is deductible for tax purposes. EAR expenses are limited to 0.5% of net
sales for sellers of goods or properties or 1% of net revenue for sellers of services. For sellers of
both goods or properties and services, an apportionment formula is used in determining the ceiling
on such expenses. EAR expenses amounted to P
=27.1 million, P
=22.3 million and P
=19.2 million in
2008, 2007 and 2006, respectively.
33. Earnings Per Share
The following reflects the income and share data used in the basic/dilutive EPS computations:
Net income attributable to equity holders
of the parent
Weighted average number of
common shares
Basic/dilutive EPS
2008
2007
2006
=381,029,569
P
=5,556,978,624
P
=3,018,916,609
P
2,180,503,348
=0.17
P
2,221,851,481
=2.50
P
2,127,851,482
=1.42
P
The weighted average number of common shares take into account the treasury shares at year end.
There have been no other transactions involving ordinary shares or potential ordinary shares
between the reporting date and the date of completion of these financial statements.
There were no potential dilutive shares in 2008, 2007 and 2006.
34. Related Party Transactions
The Group, in the regular conduct of its business, has entered into transactions with JGSHI, its
ultimate parent, and other related parties principally consisting of sales, purchases, advances and
reimbursement of expenses, various guarantees, regular banking transactions, leases and,
management and administrative service agreements.
*SGVMC111910*
- 132 Intercompany transactions are eliminated in the accompanying consolidated financial statements.
Related party transactions not eliminated are as follows:
Due from related parties (shown under
Receivables account in the consolidated
balance sheets) (Note 10)
Due to related parties (shown under Accounts
payable and other accrued liabilities
account in the consolidated balance sheets)
(Note 21)
2008
2007
(As restated
- Note 27)
P
= 448,124,520
=896,599,119
P
P
= 127,615,090
=334,154,530
P
The Group’s significant transactions with related parties follow:
(a) Sales to related parties amounted to =
P704.7 million, =
P641.0 million and =
P586.3 million in
2008, 2007 and 2006, respectively.
(b) The Group purchases polypropylene resin for BOPP film from JG Summit Petrochemical
Corporation (JGSPC), an affiliate. BOPP film is used as one (1) of the raw materials for the
Group’s packaging division. Said purchases amounted to P
=917.3 million, P
=559.3 million and
=568.3 million in 2008, 2007 and 2006, respectively.
P
(c) The Group also purchases power from Litton Mills, Inc. and JGSPC. Said purchases
amounted to =
P181.8 million, =
P139.4 million and =
P129.0 million in 2008, 2007 and 2006,
respectively.
(d) JGSHI provides the Group certain corporate services including corporate finance, corporate
planning, procurement, human resources, legal and corporate communications.
(e) The Group leases certain properties from JGSHI. Expenses relating to said lease amounted to
=16.9 million, P
P
=15.4 million and P
=10.7 million in 2008, 2007 and 2006, respectively.
(f) The Group leases certain properties to various related parties. Rent income earned from said
properties amounted to =
P54.5 million, P
=50.3 million and P
=49.6 million and P
=52.7 million in
2008, 2007 and 2006, respectively.
(g) The Group engages in regular bank transactions with Robinsons Savings Bank Corp., an
affiliated local commercial bank.
Compensation of Key Management Personnel
The compensation of the Group’s key management personnel by benefit type follows:
Short-term employee benefits
Post-employment benefits
2008
=125,595,342
P
12,313,759
=137,909,101
P
2007
=116,756,552
P
2,533,899
=119,290,451
P
2006
=87,864,148
P
1,707,426
=89,571,574
P
*SGVMC111910*
- 133 There are no agreements between the Group and any of its directors and key officers providing for
benefits upon termination of employment, except for such benefits to which they may be entitled
under the Group’s pension plans.
As of September 30, 2008 and 2007, the Group’s plan asset includes a due to the Parent Company
amounting to P
=131.0 million and P
=132.7 million, respectively (Notes 10 and 31).
35. Registration with the BOI
Certain operations of consolidated subsidiaries are registered with the BOI as preferred pioneer
and nonpioneer activities. As registered enterprises, these consolidated subsidiaries are subject to
some requirements and are entitled to certain tax and non-tax incentives which are considered in
the computation of the provision for income tax.
URSUMCO
In 2005, the five (5)-year ITH granted to URSUMCO under its old BOI registration as a new
domestic producer of refined sugar in 1995 expired. However, the following incentives are still
available to URSUMCO under said BOI registration: (a) tax credits on taxes and duties on raw
materials and supplies used in the manufacture of export products and forming parts thereof;
(b) additional deduction from taxable income on wages subject to certain terms and conditions;
(c) exemption from wharfage dues and any export tax, duty impost and fees for ten (10) years
from date of registration; (d) exemption from taxes and duties on imported spare parts and
supplies for certain producers at least 70% of production; and (e) other non-fiscal incentives that
may be applicable.
In 2004, URSUMCO applied for a new registration with the BOI as expanding producer of refined
sugar and molasses. The application for registration for the new activity was approved and
granted by the BOI in April 2004. Under the terms of its new registration, URSUMCO is entitled,
among others, to the following incentives: (a) ITH for a period of three (3) years from April 2004
or actual start of operations, whichever is earlier; (b) tax credits on taxes and duties on raw
materials and supplies used in the manufacture of export products and forming parts thereof for
ten (10) years from start of commercial operations; (c) additional deduction from taxable income
on wages subject to certain terms and conditions; (d) exemption from wharfage dues and any
export tax, duty impost and fees for ten (10) years from date of registration; (e) exemption from
taxes and duties on imported spare parts and supplies for export producers with Customs Bonded
Manufacturing Warehouse (CBMW) exporting at least 70% of production; and (f) importation of
consigned equipment for a period of ten (10) years from date of registration. ITH ended March
2007.
The new corporate name of URSUMCO is Bio-Resource Power Generation Corporation.
SONEDCO
In November 2005, SONEDCO was registered with the BOI as a new producer of refined sugar
and its by-product (molasses) on a pioneer status.
*SGVMC111910*
- 134 Under the terms of the registration and subject to certain requirements, SONEDCO is entitled to
the following fiscal and non-fiscal incentives: (a) ITH for a period of six (6) years from November
2006; (b) additional deduction from taxable income on wages subject to certain terms and
conditions; (c) employment of foreign nationals; (d) tax credits on taxes and duties on raw
materials and supplies used in the manufacture of export products and forming parts thereof for
ten (10) years from start of commercial operations; (e) simplification of customs procedures for
the importation of equipment, spare parts, raw materials and supplies; (f) access to CBMW subject
to Custom rules and regulations provided firm exports at least 70% of production output;
(g) exemption from wharfage dues and any export tax, duty, impost and fees; (h) importation of
consigned equipment for a period of ten (10) years from date of registration; and (i) exemption
from taxes and duties on imported spare parts and consumable supplies for exports producers with
CBMW exporting at least 70% of production.
CFC Clubhouse Property, Inc.
In June 2005, CCPI was registered with the BOI as a new producer of printed flexible packaging
materials on a non-pioneer status, and as a new producer of PET bottles on a non-pioneer status.
Under the terms of the registration and subject to certain requirements, CCPI is entitled to the
following fiscal and non-fiscal incentives: (a) ITH for a period of four (4) years from April 2007
(as a new producer of printed flexible packaging materials) and from January 2007 (as a new
producer of PET bottles); (b) additional deduction from taxable income on wages subject to
certain terms and conditions; (c) employment of foreign nationals; (d) tax credits on taxes and
duties on raw materials and supplies used in the manufacture of export products and forming parts
thereof for ten (10) years from start of commercial operations; (e) simplification of customs
procedures for the importation of equipment, spare parts, raw materials and supplies; (f) access to
CBMW subject to Custom rules and regulations provided firm exports at least 70% of production
output; (g) exemption from wharfage dues and any export tax, duty, impost and fees
(h) importation of consigned equipment for a period of ten (10) years from date of registration;
and (i) exemption from taxes and duties on imported spare parts and consumable supplies for
exports producers with CBMW exporting at least 70% of production.
36. Commitments and Contingencies
Operating Lease Commitments - Group as a Lessee
The Group leases land where certain of its facilities are located. The operating lease agreements
are for periods ranging from one (1) to five (5) years from the date of the contracts and are
renewable under certain terms and conditions. The Group’s rentals incurred on these leases
(included under Selling and distribution costs account in the consolidated statements of income)
amounted to =
P76.9 million, =
P55.0 million and =
P62.4 million in 2008, 2007 and 2006, respectively.
Future minimum rentals payable under noncancellable operating leases follow:
Within one (1) year
After one (1) year but not more than
five (5) years
2008
= 16,953,651
P
2007
=14,199,136
P
2006
=44,005,896
P
67,814,604
P84,768,255
=
59,982,842
P74,181,978
=
2,319,970
=46,325,866
P
*SGVMC111910*
- 135 Operating Lease Commitments - Group as a Lessor
The Group has entered into a (1) one-year renewable, noncancellable lease with various related
parties covering certain land and building where office spaces are located.
Future minimum rentals receivable under noncancellable operating leases follow:
Within one (1) year
2008
= 55,934,613
P
2007
=50,329,035
P
2006
=49,968,169
P
Others
The Group has various contingent liabilities arising in the ordinary conduct of business which are
either pending decision by the courts, under arbitration or being contested, the outcome of which
are not presently determinable. In the opinion of management and its legal counsel, the eventual
liability under these lawsuits or claims, if any, will not have a material or adverse effect on the
Group’s financial position and results of operations. The information usually required by PAS 37,
Provisions, Contingent Liabilities and Contingent Assets, is not disclosed on the grounds that it
can be expected to prejudice the outcome of these lawsuits, claims, arbitration and assessments.
37. Business Combinations and Purchase Agreements
The Group engaged in the following business acquisitions and purchase transactions in 2007:
Acquisition of South Luzon Greenland, Inc. and Purchase of Assets from Nestlé Waters
Philippines Inc.
On March 1, 2007, the Group wholly acquired the related assets of the water business of Nestlé
Waters Philippines, Inc. (NWPI) for an aggregate amount of approximately US$5.0 million
(P
=248.9 million).
In connection with the foregoing acquisition, the Group’s BOD also approved the following:
(a) the assignment and purchase from NWPI of the “Hidden Spring” trademark and copyright;
(b) the purchase from the NWPI of the buildings/improvements and accessories, plants,
machinery; (c) laboratory equipment, and furniture; (d) the acquisition of the water source and
manufacturing site, through the purchase of all the outstanding shares of stock of South Luzon
Greenland, Inc. (SLGI) which are owned by NWPI and Nestlé Philippines, Inc. Retirement Fund;
(e) the assignment and transfer to the Group by NWPI of all of its financial claims from SLGI
consisting of shareholder’s advances; (f) the purchase from NWPI of its inventory of finished
products, raw and packaging materials, the consideration for which is not included in the purchase
price mentioned above and shall be determined on closing date; and (g) the execution of a
licensing agreement with Société Des Produits Nestlé S.A., pursuant to which the Group shall be
licensed to manufacture, promote, distribute and sell, the products carrying the “Nestlé Pure Life”
trademark in the Philippines.
*SGVMC111910*
- 136 SLGI was acquired for an aggregate amount of =
P7.7 million in 2007. The fair values of the
identifiable assets and liabilities of SLGI as of the date of acquisition were:
Cash
Property and equipment
Other current assets
Liabilities
Total assets acquired
Cash consideration
=565,944
P
31,458,905
40,778
(24,398,499)
=7,667,128
P
=7,667,128
P
Acquisition of Acesfood Network Pte. Ltd.
On May 10, 2007, the Group acquired 96.08% of the assets and assumed the liabilities of
Acesfood Network Pte. Ltd. (Acesfood) for a total consideration of SGD3.0 million
(approximately =
P95.3 million), inclusive of costs directly attributable to the acquisition. As a
result, the Group assumed 96.08% ownership interest in Acesfood. The acquisition was accounted
for as a business combination and the fair value adjustments as of September 30, 2007 were
provisional as the Group had sought an independent valuation for the assets owned by Acesfood.
The results of this valuation had not been received as of the date the 2007 consolidated financial
statements were authorized for issue by management.
As of June 30, 2008, the valuation had been finalized and the fair values of the assets acquired and
liabilities assumed have been determined. The final allocation of the cost of acquisition to the
identifiable assets, liabilities and goodwill is shown below:
Cash and cash equivalents
Receivables
Inventories
Due from affiliates
Trademark (Note 16)
Property, plant and equipment
Accounts payable and other liabilities
Due to affiliates
Short-term debt
Loans payable
Other current liabilities
Net assets
Minority interest (3.92%)
Total net assets acquired
Goodwill arising on acquisition
Consideration, satisfied by cash
=1,650,389
P
292,491,056
62,565,111
346,855,240
84,014,765
169,282,889
956,859,450
455,442,096
210,840,906
101,686,122
109,104,923
10,005,616
887,079,663
69,779,787
(2,737,558)
67,042,229
28,247,244
=95,289,473
P
*SGVMC111910*
- 137 The upward (downward) adjustments to the provisional values arose from the following accounts:
Cash and cash equivalents
Receivables
Inventories
Due from affiliates
Trademark
Property, plant and equipment
Goodwill
Other noncurrent assets
Accounts payable and other accrued liabilities
Short term debt
Loans payable
Due to affiliates
Other current liabilities
Minority interest
(P
=10,444,787)
237,129,870
4,114,316
304,496,968
84,014,765
(110,214,633)
28,247,243
(176,344,526)
=360,999,216
P
(P
=80,925,122)
101,686,122
109,104,923
218,390,118
10,005,617
2,737,558
=360,999,216
P
The 2007 comparative information has been restated to reflect this adjustment. The decrease in
depreciation expense on the property and equipment from the acquisition date to September 30,
2007 amounted to =
P3.1 million.
Acesfood contributed an P
=82.9 million loss, from May 10, 2007 (the date of acquisition) to
September 30, 2007, to the income for the year of the Group. If the combination had taken place
at the beginning of that year, the income for the Group would have been =
P341.2 million.
The fair value of the trade receivables amounted to P
=182.9 million. The gross amount of trade
receivables is P
=182.9 million. None of the trade receivables have been impaired and it is expected
the full contractual amount can be collected.
The goodwill of P
=28.2 million comprises the fair value of expected synergies arising from
acquisition.
Purchase of Assets from PASSI (Iloilo) Sugar Central, Inc.
On October 3, 2007, the Parent Company purchased the manufacturing assets of PASSI (Iloilo)
Sugar Central, Inc. (PASSI). Costs incurred by the Parent Company that are directly attributable
to the purchase amounted to =
P13.9 million, and are included in the cost of the acquisition. PASSI
operates two (2) sugar mills with a combined milling capacity of over 8,000 tons of cane per day.
*SGVMC111910*
- 138 The fair values of the manufacturing assets of PASSI as of the date of acquisition were:
Land
Land improvements
Building
Furniture and fixtures
Machinery and equipment
Transportation equipment
Total net assets acquired
PASSI 1
=247,564,737
P
217,352
59,858,084
380
124,430,246
371,386
=432,442,185
P
PASSI 2
=210,310,206
P
76,504
16,572,381
145
33,755,071
715,019
=261,429,326
P
Total
=457,874,943
P
293,856
76,430,465
525
158,185,317
1,086,405
=693,871,511
P
Acquisition of Advanson International Pte. Ltd.
On December 14, 2007, the Group acquired 1.8 million shares (representing 100.0% ownership)
of Advanson International Pte. Ltd. and its wholly-owned subsidiary, Jiangsu Acesfood
(collectively referred to as Advanson), for an aggregate purchase price of US$1.7 million and
RMB2.0 million (approximately =
P61.2 million), inclusive of costs directly associated with the
acquisition.
The fair value of the identifiable assets and liabilities of Advanson as of the date of the acquisition
were:
Cash and cash equivalents
Due from affiliates
Other receivables
Property, plant and equipment (Note 13)
Other noncurrent assets
Short term loan
Due to affiliates
Other liabilities
Total net assets acquired
Goodwill arising from acquisition
Cash consideration
P1,949,608
=
2,581,871
1,820,572
71,269,328
8,822,946
86,444,325
28,666,698
344,000
13,824,939
42,835,637
43,608,688
17,579,587
=61,188,275
P
From the date of acquisition, Advanson has contributed a P
=0.1 loss to the income for the year. If
the combination had taken place at the beginning of the year, the profit for the year for the Group
would have been =
P341.2 million.
The goodwill of P
=17.6 million comprises the value of expected synergies arising from the
acquisition.
Purchase of Assets from General Milling Corporation
In June 2008, the Group entered into a purchase agreement with General Milling Corporation
(GMC) and with its foreign affiliate, wherein their snack manufacturing assets and certain
intangible assets (Note 16) were acquired by the Group. GMC is the second largest corn chips
manufacturer in the Philippines. It produces and sells corn and wheat-based snacks such as
Kornets, Tortillos, and Brew Bud under the “Granny Goose” trademark.
*SGVMC111910*
- 139 38. Disposal Group Held for Sale
In May 2008, the Group, through Hong Kong Peggy Foods Co., Ltd. (HK Peggy) executed an
agreement with Tianjin Hope Shipbuilding Construction Co., Ltd. (Tianjin) and Xinyuda Ocean
Engineering (Hong Kong) Co., Ltd. (Xinyuda) to sell all the shares of stock of Tianjin Pacific
Foods Manufacturing Co., Ltd. (TPFMC), a 100%-owned subsidiary of the Group, for a total
consideration of RMB32.7 million (approximately P
=245.1 million).
As of September 30, 2008, the sale has not been fully consummated as there are closing conditions
that have not been met. As such, the assets and liabilities of TPFMC have been presented
separately at the balance sheets as assets and liabilities of disposal group classified as held for sale.
The operations result of TPFMC for the year ended September 30, 2008 is presented below:
=7,413,011
P
(36,072,977)
=28,659,966
P
Interest income
Operating and other expenses
Loss for the period from disposal group
The major classes of assets and liabilities classified as held for sale as of September 30, 2008
follow:
Assets:
Cash and cash equivalents
Property, plant and equipment (Note 13)
Other assets
=57,900
P
192,063,742
5,295,219
197,416,861
Liabilities:
Accounts payable
Due to subsidiaries
31,536
8,695,853
8,727,389
=188,689,472
P
39. Supplemental Disclosures of Noncash Investing Activity
The Group’s noncash investing activity pertains to the movement of the Cumulative Translation
Adjustment account.
Cumulative translation adjustment
2008
= 30,936,903
P
2007
(P
=221,482,120)
2006
(P
=227,449,799)
In 2008, the Group reclassified certain trading assets from the Financial assets at FVPL category
to the AFS investments category in the consolidated balance sheets (Note 9).
*SGVMC111910*
SyCip Gor res Velayo & C o.
6760 Ayala Avenue
1226 Makati City
Philippines
Phone: (632) 891 0307
Fax:
(632) 819 0872
www.sgv.com.ph
BOA/PRC Reg. No. 0001
SEC Acc reditation No. 0012-FR-1
INDEPENDENT AUDITORS’ REPORT
ON SUPPLEMENTARY SCHEDULE
The Stockholders and the Board of Directors
Universal Robina Corporation
110 E. Rodriguez Avenue
Bagumbayan, Quezon City
We have audited, in accordance with Philippine Standards on Auditing, the consolidated financial
statements of Universal Robina Corporation and Subsidiaries (the Group) included in this Form 17-A
and have issued our report thereon dated January 12, 2009. Our audits were made for the purpose of
forming an opinion on the basic financial statements taken as a whole. The schedules listed in the
Index to Consolidated Financial Statements and Supplementary Schedules are the responsibility of the
Group’s management and are presented for purposes of complying with Securities Regulation Code
Rule 68.1 and are not part of the basic consolidated financial statements. These schedules have been
subjected to the auditing procedures applied in the audit of the basic consolidated financial statements
and, in our opinion, fairly state in all material respects the financial data required to be set forth therein
in relation to the basic consolidated financial statements taken as a whole.
SYCIP GORRES VELAYO & CO.
Vicky B. Lee-Salas
Partner
CPA Certificate No. 86838
SEC Accreditation No. 0115-AR-1
Tax Identification No. 129-434-735
PTR No. 1566436, January 5, 2009, Makati City
January 12, 2009
*SGVMC111910*
A member firm of Ernst & Young Global Limited
- 141 -
UNIVERSAL ROBINA CORPORATION AND SUBSIDIARIES
SCHEDULE A - FINANCIAL ASSETS AT FVPL
(CURRENT MARKETABLE EQUITY SECURITIES AND
OTHER SHORT-TERM INVESTMENTS)
SEPTEMBER 30, 2008
Name of Issuing Entity and
Description of Each Issue
Various / Private Bonds
Various / Equity Securities
Derivative Assets
Citibank
Foreign Exchange Forwards
Foreign Exchange Options
Total
See Note 8 of the Consolidated Financial Statements.
Number of
Shares or
Principal
Amount of Bonds
and Notes
Value Based
on Market
Quotations at
Balance Sheet
Date
Amount
Shown in the
Balance Sheet/Notes
Income
Received
and Accrued
(Including
Dividends Received)
P
4,343,133,416
1,625,354,410
P
4,343,133,416
1,625,354,410
P
852,732,825
110,574,933
P
5,968,487,826
P
5,968,487,826
P
963,307,758
P
745,743
9,951,310
P
745,743
9,951,310
P
10,697,053
P
10,697,053
P
5,979,184,879
P
5,979,184,879
- 142 -
UNIVERSAL ROBINA CORPORATION AND SUBSIDIARIES
SCHEDULE B - ADVANCES TO OFFICERS AND EMPLOYEES
RECEIVABLE FROM DIRECTORS, OFFICERS, EMPLOYEES, RELATED
PARTIES AND PRINCIPAL STOCKHOLDERS (OTHER THAN RELATED PARTIES)
SEPTEMBER 30, 2008
Beginning
Balance
Name of Debtor
Additions
Collections
Ending Balance
Non-Current
Current
Total
Advances to officers and employees P
Advances to stockholders
60,750,514
2,083,100
P
7,167,192
-
P
(2,083,100)
P
67,917,706
-
P
-
P
67,917,706
-
P
62,833,614
P
7,167,192
P
(2,083,100)
P
67,917,706
P
-
P
67,917,706
See Note 10 of the Consolidated Financial Statements.
- 143 -
UNIVERSAL ROBINA CORPORATION AND SUBSIDIARIES
SCHEDULE C - LONG-TERM INVESTMENTS IN SECURITIES
(NONCURRENT MARKETABLE EQUITY SECURITIES,
OTHER LONG-TERM INVESTMENTS IN STOCK,
AND OTHER INVESTMENTS)
SEPTEMBER 30, 2008
BEGINNING BALANCE
Name of Issuing Entity and
Description of Investment
Number
Shares
of Principal
Amount of
Bonds and Notes
ADDITIONS
Equity in
Earnings (Losses)
of Investees
for the Period
Amount in
Pesos
DEDUCTIONS
Distribution of
Earnings by
Investees
Others
ENDING BALANCE
Number
Shares
of Principal
Amount of
Bonds and Notes
Others
HUNT- Universal Robina Corporation
1,400,000
P
89,872,575
P
28,184,000
P
-
P
(24,999,930)
P
Total
1,400,000
P
89,872,575
P
28,184,000
P
-
P
(24,999,930)
P
-
Amount in
Pesos
1,400,000
P
93,056,645
P
-
1,400,000
P
93,056,645
P
-
5,845,304
Note:
Description of investments
HUNT- Universal Robina Corporation
See Note 17 of the Consolidated Financial Statements.
Percentage of ownership
50%
Dividends
Received/accrue
d from
Investments Not
Accounted for
by the Equity
Method
- 144 -
UNIVERSAL ROBINA CORPORATION AND SUBSIDIARIES
SCHEDULE D - ADVANCES TO UNCONSOLIDATED
SUBSIDIARIES AND AFFILIATES
SEPTEMBER 30, 2008
Beginning
Balance
Name of Affiliate
Digital Telecommunications Philippines., Inc.
JG Summit Holdings Inc.
Cebu Air, Inc.
Hunt - Universal Robina Corporation
Robinsons Land Corporation
Terai Industrial Corporation
Chic Centre Corp.
Robinson's Convenient Store
Big R Store
Others
228,748,970
494,905,768
30,899,896
56,839,080
7,031,007
11,102,249
5,017,179
2,173,076
1,496,628
58,385,266
P
See Note 10 of the Consolidated Financial Statements.
Ending
Balance
896,599,119
264,397,891
39,977,617
31,238,408
13,990,629
12,085,906
11,112,249
7,328,565
4,084,069
1,506,565
62,402,621
P
448,124,520
- 145 -
UNIVERSAL ROBINA CORPORATION AND SUBSIDIARIES
SCHEDULE E - PROPERTY, PLANT AND EQUIPMENT
SEPTEMBER 30, 2008
Classification
Acquisitions and
Additions at
Cost
Beginning
Balance
Retirements
and Other
Adjustments
Ending
Balance
Cost:
Land
P
Land improvements
Buildings and improvements
Machinery and equipment
Transportation equipment
Furniture, fixtures and equipment
Construction in progress
Equipment in transit
P
969,963,845
1,369,336,414
7,072,849,996
28,082,149,332
1,716,919,711
1,605,179,902
1,491,920,360
230,739,151
42,539,058,711
See Note 13 of the Consolidated Financial Statements.
P
P
570,607,336
280,850,755
962,449,541
2,113,792,687
347,867,724
243,621,316
486,316,607
52,576,441
5,058,082,407
P
P
(42,255,827)
68,599,231
118,787,846
357,242,458
(43,921,177)
(12,818,715)
(780,872,486)
(335,238,670)
P
P
1,498,315,354
1,718,786,400
8,154,087,383
30,553,184,477
2,020,866,258
1,835,982,503
1,197,364,481
283,315,592
47,261,902,448
- 146 -
UNIVERSAL ROBINA CORPORATION AND SUBSIDIARIES
SCHEDULE F - ACCUMULATED DEPRECIATION
SEPTEMBER 30, 2008
Description
Accumulated Depreciation:
Land improvements
Buildings and improvements
Machinery and equipment
Transportation equipment
Furniture, fixtures and equipment
Additions
Charged to Costs
and Expenses
Beginning
Balance
P
P
713,057,521
3,027,140,515
14,477,028,010
1,230,381,904
934,999,029
20,382,606,979
See Note 13 of the Consolidated Financial Statements.
P
P
20,574,163
273,000,759
1,933,906,088
334,388,411
125,185,233
2,687,054,654
Retirements
and Other
Adjustments
P
P
(18,637,825)
(78,991,003)
(38,659,918)
1,185,185
(135,103,561)
Ending
Balance
P
P
733,631,684
3,281,503,449
16,331,943,095
1,526,110,397
1,061,369,447
22,934,558,072
- 147 -
UNIVERSAL ROBINA CORPORATION AND SUBSIDIARIES
SCHEDULE G - INTANGIBLE ASSETS / OTHER NONCURRENT ASSETS
SEPTEMBER 30, 2008
Beginning
Balance
Description
Additions
at Cost
Deductions/Amortizations
Charged to Cost
Charged to
and Expenses
Other Accounts
Goodwill
Trademark
Product Formulation
P
872,795,433
284,155,528
-
P
17,579,587
50,000,000
425,000,000
P
(2,767,636)
-
P
-
Intangible Assets
P
1,156,950,961
P
492,579,587
P
(2,767,636)
P
-
Other ChangesAdditions
(Deductions)
P
P
Ending
Balance
-
P
890,375,020
331,387,892
425,000,000
-
P
1,646,762,912
P
171,456,867
83,144,404
159,030,094
P
413,631,365
See Note 16 of the Consolidated Financial Statements.
Input value added tax - net P
Miscellaneous deposits
Others
205,464,745
74,419,424
51,118,452
P
8,724,980
107,911,642
P
-
P
-
Other Noncurrent Assets
331,002,621
P
116,636,622
P
-
P
-
P
See Note 19 of the Consolidated Financial Statements.
P
P
(34,007,878)
-
- 148 -
UNIVERSAL ROBINA CORPORATION AND SUBSIDIARIES
SCHEDULE H - LONG-TERM DEBT
SEPTEMBER 30, 2008
Amount
Authorized by
Indenture
Name of Issuer and
Type of Obligation
Amount
Shown as
Current
Amount
Shown as
Long-Term
Total
URC Philippines, Ltd. 8.25%
Guaranteed Notes Due 2012
$
200,000,000
Bayerische Vereinsbank AG
Credit Term Loan Facility
$
6,236,038
41,627,138
20,813,569
62,440,707
Philippine Sugar Corporation
Restructured Loan
P
110,180,000
6,404,660
39,990,828
46,395,488
P
P
See Note 22 of the Consolidated Financial Statements.
-
48,031,798
P
P
9,368,966,095
9,429,770,492
P
P
9,368,966,095
9,477,802,290
- 149 -
UNIVERSAL ROBINA CORPORATION AND SUBSIDIARIES
SCHEDULE I - ADVANCES FROM UNCONSOLIDATED
SUBSIDIARIES AND AFFILIATES
SEPTEMBER 30, 2008
Beginning
Balance
Name of Affiliate
JG Summit Petrochemical Corp.
Solid Finance
Robinsons Supermarket
Xiamen Ting teng
Pan Pacific Investment Co. Ltd.
Others
49,504,373
22,137,536
13,275,755
237,481,014
3,432,183
8,323,669
P
See Note 21 of the Consolidated Financial Statements.
Ending
Balance
334,154,530
33,980,122
28,950,116
28,813,611
19,090,896
3,432,183
13,348,162
P
127,615,090
- 150 -
UNIVERSAL ROBINA CORPORATION AND SUBSIDIARIES
SCHEDULE K - CAPITAL STOCK
SEPTEMBER 30, 2008
Title of Issue
Number of
Shares
Authorized
Preferred stock - P1 par value
2,000,000
Common stock - P1 par value
2,998,000,000
Number of
Shares Issued
and
Outstanding
(Net of
Treasury
Shares)
Number of
Shares Reserved
for Options, Warrants,
Conversions, and
Other Rights
Number of Shares Held By
Affiliates
Directors,
Officers and
Employees
Others
None
2,149,747,281
See Note 23 of the Consolidated Financial Statements.
1,317,053,808
14,240,243
818,453,230


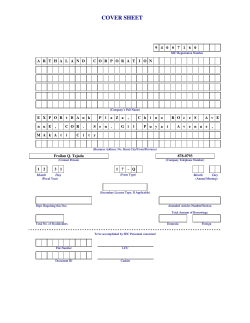
© Copyright 2026