
Document 254551
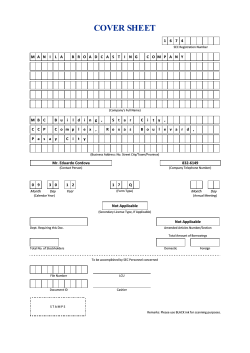
COVER SHEET
9 4 0 0 7 1 6 0
SEC Registration Number
A R T H A L A N D
C O R P O R A T I O N
(Company’s Full Name)
E X P O R t B A n k
n u E ,
C O R .
M A k A t
i
C i
P l
S e n
t
a Z a
.
,
G i
C h
l
i
n o
P u y a
R O c e S
t
A v E
A v e n u e
,
y
(Business Address: No. Street City/Town/Province)
1 2
Month
Froilan Q. Tejada
878-0793
(Contact Person)
(Company Telephone Number)
3 1
Day
1 7
- Q
(Form Type)
Month
(Fiscal Year)
Day
(Annual Meeting)
(Secondary License Type, If Applicable)
Dept. Requiring this Doc.
Amended Articles Number/Section
Total Amount of Borrowings
Total No. of Stockholders
Domestic
To be accomplished by SEC Personnel concerned
File Number
LCU
Document ID
Cashier
Foreign
ARTHALAND, CORPORATION
(Company’s Full Name)
ExportBank Plaza, Chino Roces Avenue Cor. Gil Puyat Ave., Makati City
(Company’s Address)
878-0390/878-0536
(Telephone Number)
December 31
(Fiscal year ending)
(month & day)
Any Day in April
(Annual Meeting)
SEC FORM 17 – Q QUARTERLY REPORT
(Form Type)
Amendment Designation (If applicable)
SEPTEMBER 30, 2009
(Period Ended Date)
____________________________________
(Secondary License Type & File Number)
__________________
LCU
____________________
(Cashier)
___________________
DTU
ASO-94-007160
(SEC Number)
_____________________
Central Receiving Unit
____________________
File Number
____________________
Document I.D.
2
SECURITIES AND EXCHANGE COMMISSION
SEC FORM 17-Q
QUARTERLY REPORT PURSUANT TO SECTION 11 OF THE
REVISED SECURITIES ACT AND RSA RULE 11(a)-1 (b)(2) THEREUNDER
1. For the quarterly period ended September 30, 2009
2. Commission Identification No. AS94-007160
3. BIR TIN 116-004-450-721
4. Exact name of registrant as specified in its character
ARTHALAND, CORPORATION
5. Incorporated in Metro Manila, Philippines on August 10, 1994.
6. Industry Classification Code ___________________________.
7. Address of registrant’s principal office
Postal Code
ExportBank Plaza, Chino Roces Avenue Cor. Gil Puyat Ave., Makati City
1200
8. Registrant’s Telephone Number : 878-0536/878-0548/878-0390/878-9100
9. Former name, former address and former fiscal year, if changed since last report: NA
10. Securities registered pursuant to Sections 4 and 8 of the RSA
Title of each class
Number of shares common
stock outstanding or amount
of debt outstanding.
Common Shares
5,118,095,199 common shares
11. Are any or all of the securities listed on the Philippine Stock Exchange?
YES [ X ]
NO [ ]
12. Indicate by check mark whether the registrant :
3
4
ITEM 1.
Financial Statements Required under SRC RULE 68.1
1.
Basic and Diluted Earnings per Share (See attached Income Statement)
2.
The accompanying consolidated interim financial statements of Arthaland, Corporation were
prepared in accordance with accounting principles generally accepted in the Philippines as set
forth in Philippine Financial Reporting Standards (PFRS) and Philippine Accounting Standards
(PAS).
3.
Notes to Financial Statements:
a. The accompanying financial statements of Arthaland Corporation and its subsidiaries
Urban Property Holdings. Inc. (UPHI), Cazneau Inc., Technopod, Irmo. were prepared in
accordance with PFRS. The financial statements have been prepared using the historical cost
basis and are presented in Philippine Pesos.
b. There is no significant seasonality or cycle of interim operations.
c. There are no material events subsequent to the end of the interim period.
d. There are no changes in the composition of the issuer during the interim period including
business combinations, acquisition or disposal of subsidiaries and long-term investments,
restructurings and discontinuing operations.
e. There are no material changes in the contingent liabilities or contingent assets since the last
annual balance sheet date.
f.
There are no material contingencies and any other events or transactions that are material
to an understanding of the current interim period.
5
ARTHALAND CORPORATION AND SUBSIDIARIES
(Formerly, EIB Realty Developers, Inc.)
CONSOLIDATED BALANCE SHEETS
SEPTEMBER 30, 2009 & DECEMBER 31, 2008
(Amounts in Philippine Pesos)
SEPTEMBER 30, 2009 DECEMBER 31, 2008
UNAUDITED
AUDITED
INCREASE
(DECREASE)
%
A S S ETS
CURRENT ASSETS
Cash
Receivables- net
Other current assets
Total Current Assets
NON-CURRENT ASSETS
Investment properties - net
Property and equipment - net
Other non-current assets - net
Total Non-current
Assets
TOTAL ASSETS
15,263,371
392,692,761
57,066,447
6,268,100
253,745,842
15,201,995
8,995,271
138,946,919
41,864,452
144%
55%
275%
465,022,579
275,215,937
189,806,641
69%
3,184,554,142
11,814,677
187,605,746
3,174,560,787
12,732,787
186,497,330
9,993,355
-918,110
1,108,416
0%
-7%
1%
3,383,974,565
3,373,790,904
10,183,659
0%
3,848,997,144
3,649,006,841
199,990,301
5%
150,000,000
214,720,025
-64,720,025
-30%
3,211,820,233
2,891,721,498
320,098,735
11%
3,361,820,233
3,106,441,523
255,378,710
8%
433,757,136
122,596,436
-73,457,405
415,037,518
122,424,123
172,313
4,280,744
4,931,364
487,176,912
542,565,318
-55,388,408
-10%
3,848,997,144
3,649,006,841
199,990,303
5%
LIABILITIES AND EQUITY
CURRENT LIABILITIES
Loans payable
Accounts payable, accrued
expenses and other liabilities
Total Liabilities
EQUITY
Capital stock
Retained earnings
Net Income
Minority Interest
Total Equity
TOTAL LIABILITIES AND EQUITY
18,719,618
5%
172,313
0%
-73,629,718 -42730%
0
-650,620
-13%
6
ARTHALAND CORPORATION AND SUBSIDIARIES
(Formerly, EIB Realty Developers, Inc.)
UNAUDITED CONSOLIDATED BALANCE SHEETS
SEPTEMBER 30, 2009 & SEPTEMBER 30, 2008
(Amounts in Philippine Pesos)
SEPTEMBER 30, 2009 SEPTEMBER 30, 2008
INCREASE
(DECREASE)
%
A S S E T S
CURRENT ASSETS
Cash
Receivables- net
Other current assets
Total Current
Assets
NON-CURRENT ASSETS
Investment properties - net
Property and equipment - net
Other non-current assets - net
Total Noncurrent Assets
TOTAL ASSETS
LIABILITIES AND EQUITY
LIABILITIES
Loans payable
Accounts payable, accrued
expenses and other liabilities
Total Liabilities
15,263,371
392,692,761
57,066,447
62,098,800
404,542,731
-46,835,429
-11,849,970
57,066,447
-75%
-3%
465,022,579
466,641,531
-1,618,952
0%
3,184,554,142
11,814,677
187,605,746
3,129,899,278
6,888,872
6,456,061
54,654,864
4,925,805
181,149,685
2%
72%
2806%
3,383,974,565
3,143,244,211
240,730,354
8%
3,848,997,145
3,609,885,742
239,111,402
7%
150,000,000
150,000,000
0
3,211,820,233
2,902,811,791
309,008,442
11%
3,361,820,233
3,052,811,791
309,008,442
10%
433,757,136
122,596,436
-73,457,405
246,257,136
168,780,382
54,000,000
122,424,123
-38,517,675
187,500,000
-168,780,382
-54,000,000
172,313
-34,939,730
76%
-100%
-100%
0%
91%
4,280,744
4,129,985
150,759
4%
487,176,910
557,073,951
-69,897,039
-13%
3,848,997,144
3,609,885,742
239,111,402
7%
EQUITY
Capital stock
Deposits on subscription
Advances from a stockholder with
Retained earnings
Net Income
Minority interest
Total Equity
TOTAL LIABILITIES AND EQUITY
7
NOTES TO FINANCIAL STATEMENTS
Cash and Cash Equivalents
Petty Cash Fund
Cash in Bank
Investment in Special Savings Account
13,000
8,300,371
6,950,000
15,263,371
Receivables
Accounts Receivable - Tenants
Accounts Receivable - PAS 17
Accounts Receivable - EIB
Accounts Receivable-OTHERS
8,344,683
37,817,739
325,974,896
20,555,443
392,692,761
Other Current Assets
Creditable Withholding Taxes
Deferred Charges
Prepayments
16,851,639
4,005,252
36,209,556
57,066,447
Investment Property
Building
Land and developmental cost
Asset Under Construction
2,509,073,194
605,232,149
70,248,799
3,184,554,142
Property and Equipment
Transportation equipment
Furniture, Fixture & Equipment
Leasehold Rights & Improvements
7,983,261
3,038,276
793,140
11,814,677
Accounts payable and accrued expenses
Accounts Payable
Unearned rental
Accrued Expenses Payable
Loans Payable
Non trade Payables
Accounts Payable - EIB
Security deposit
Advance Rental
28,466,694
1,674,091
214,037,113
150,000,000
189,507,862
2,693,521,067
45,209,854
39,403,552
3,361,820,233
8
ARTHALAND CORPORATION AND SUBSIDIARIES
(Formerly, EIB Realty Developers, Inc.)
CONSOLIDATED STATEMENTS OF INCOME
JANUARY TO SEPTEMBER 30, 2009
UNAUDITED
JANUARY TO DECEMBER 2008
AUDITED
REVENUES
Rental
Recovery of impairment loss
Reversal of provision
Interest
Others
204,709,720
557,674
114,997
235,189,678
52,700,000
15,000,000
453,348
6,034,478
TOTAL INCOME
OPERATING EXPENSES
205,382,391
309,377,504
Depreciation and amortization
Taxes and licenses
Salaries and Wages
Management and professional fees
Representation
Insurance
Brokerage fees
Association dues
Power, light and water
Transportation and travel
Security services
Supplies
Communications
Advertising
Annual dues and fees
Others
50,256,884
29,081,659
23,987,183
10,500,738
3,598,122
2,472,384
750,868
3,082,798
3,293,896
1,619,658
1,192,682
1,204,357
703,713
225,497
493,263
1,458,107.30
64,828,479
37,391,265
23,569,341
17,476,366
8,004,320
2,616,360
2,328,652
1,985,856
1,969,893
1,379,726
1,065,120
931,185
676,612
599,231
519,548
4,160,657
TOTAL EXPENSES
133,921,809
169,502,611
OPERATING INCOME (LOSS)
FINANCE COSTS
INCOME (LOSS) BEFORE TAX
TAX EXPENSE
NET INCOME (LOSS)
71,460,583
145,568,609
(74,108,027)
(74,108,027)
139,874,893
140,358,922
(484,029)
125,701
(609,730)
Equity holders of Parent
Minority interest
(73,457,405)
(650,621)
172,313
(782,043)
-0.01
-0.0004
EARNINGS (LOSS) PER SHARE
9
ARTHALAND CORPORATION AND SUBSIDIARIES
(Formerly, EIB Realty Developers, Inc.)
CONSOLIDATED STATEMENTS OF INCOME
JANUARY TO SEPTEMBER 30, 2009
UNAUDITED
JANUARY TO SEPTEMBER 2008
UNAUDITED
REVENUES
Rental
Recovery of impairment loss
Reversal of provision
Interest
Others
204,709,720
170,322,277
557,674
114,997
244,027
4,622,447
TOTAL INCOME
OPERATING EXPENSES
205,382,391
175,188,751
50,256,884
29,081,659
23,987,183
10,500,738
3,598,122
2,472,384
750,868
3,082,798
3,293,896
1,619,658
1,192,682
1,204,357
703,713
225,497
493,263
1,458,107
48,268,300
24,074,023
14,235,100
17,405,179
5,144,987
4,419,739
1,905,096
1,719,912
1,209,707
494,697
727,923
93,196
354,245
14,850
866,363
1,551,572
TOTAL EXPENSES
133,921,809
122,484,889
OPERATING INCOME (LOSS)
FINANCE COSTS
INCOME (LOSS) BEFORE TAX
TAX EXPENSE
NET INCOME (LOSS)
71,460,583
145,568,609
(74,108,027)
52,703,862
91,810,802
(39,106,939)
(74,108,027)
(39,106,939)
Equity holders of Parent
Minority interest
(73,457,405)
(650,621)
(38,517,675)
(589,264)
-0.01
-0.0286
Depreciation and amortization
Taxes and licenses
Salaries and Wages
Management and professional fees
Representation
Insurance
Brokerage fees
Association dues
Power, light and water
Transportation and travel
Security services
Supplies
Communications
Advertising
Annual dues and fees
Others
EARNINGS (LOSS) PER SHARE
10
ARTHALAND CORPORATION AND SUBSIDIARIES
(Formerly, EIB Realty Developers, Inc.)
CONSOLIDATED STATEMENTS OF INCOME
JULY 1 TO SEPTEMBER 30, 2009
UNAUDITED
JULY 1 TO SEPTEMBER 30, 2008
UNAUDITED
Increase
(Decrease)
%
REVENUES
Rental
Recovery of impairment loss
Reversal of provision
Interest
Others
64,712,396
58,093,895
207,066
33,824
6,618,500
0
0
277,820
69,932
484,886
103,756
TOTAL INCOME
OPERATING EXPENSES
134%
207%
65,301,038
58,334,785
6,966,252
12%
Depreciation and amortization
Taxes and licenses
Salaries and Wages
Management and professional fees
Representation
Insurance
Brokerage fees
Association dues
Power, light and water
Transportation and travel
Security services
Supplies
Communications
Advertising
Annual dues and fees
Others
16,792,789
8,656,385
8,307,073
7,156,185
1,865,486
282,097
154,352
1,136,479
1,687,183
1,207,786
400,854
505,406
225,461
144,729
115,300
663,736
16,229,544
7,786,958
8,725,277
8,586,195
3,162,147
1,460,930
423,556
28,260
466,808
160,808
(35,092)
57,329
109,940
0
978,719
974,228
TOTAL EXPENSES
49,301,300
49,115,608
OPERATING INCOME (LOSS)
FINANCE COSTS
INCOME (LOSS) BEFORE TAX
TAX EXPENSE
NET INCOME (LOSS)
15,999,737
47,512,093
(31,512,355)
9,219,177
33,863,477
(24,644,300)
6,780,560
13,648,616
(6,868,055)
(31,512,355)
(24,644,300)
(6,868,055)
Equity holders of Parent
Minority interest
(31,339,686)
(172,669)
(24,182,087)
(462,213)
(7,157,599)
289,544
(0.01)
(0.02)
EARNINGS (LOSS) PER SHARE
11%
563,246
3%
869,427
11%
(418,204)
-5%
(1,430,011)
-17%
(1,296,660)
-41%
(1,178,833)
-81%
(269,204)
-64%
1,108,219 3922%
1,220,375
261%
1,046,978
651%
435,945 -1242%
448,077
782%
115,521
105%
144,729
(863,419)
-88%
(310,492)
-32%
185,692
0%
74%
40%
0.01
11
ARTHALAND CORPORATION ANDS SUBSIDIARIES
(Formerly, EIB Realty Developers, Inc.)
UNAUDITED CONSOLIDATED STATEMENT OF CASH FLOW
FOR THE PERIODS JANUARY 01 TO SEPTEMBER 30, 2009 & 2008
2009
CASH FLOW FROM OPERATING ACTIVITIES
Income (Loss) Before Income T ax
Adjustments to reconcile income (loss) before income tax
to net cash generated from (used in) operations:
Interest Expense
Provision for Probable Losses
Depreciation and Amortization
Interest Income
Changes in operating assets and liabilities:
Decrease (increase) in:
Receivables
Investment Properties
Property and Equipment
Other Assets
Increase (decrease) in:
Accounts Payable and Accrued Expenses
Net Cash Generated from (used in) Operations
Interest Received
Interest Paid
(74,108,027)
50,256,884
2008
(39,106,939)
48,263,621
-
(138,946,919)
(60,250,239)
918,110
(42,972,866)
(350,493,055)
(56,219,957)
-
255,378,709
277,241,078
(9,724,347)
(120,315,252)
Net Cash Provided by (used in) Operating Activities
CASH FLOWS FROM INVESTING ACTIVITY
168,780,382
Increase in Deposits in Subscription
Increase in Capital
18,719,618
Decrease in Equity Investments and Advances
CASH FLOWS FROM FINANCING ACTIVITIES
Increase/(Decrease) in Notes Payable
Net Cash Provided by Financing Activities
8,995,271
48,465,130
6,268,100
13,633,670
15,263,371
62,098,800
NET INCREASE (DECREASE) IN CASH AND CASH
EQUIVALENTS
CASH AND CASH EQUIVALENTS AT BEGINNING
OF YEAR
CASH AND CASH EQUIVALENTS AT END OF YEAR
12
ARTHALAND CORPORATION AND SUBSIDIARIES
(Formerly, EIB Realty Developers, Inc.)
UNAUDITED CONSOLIDATED STATEMENTS OF CHANGES IN EQUITY
FOR THE PERIODS JANUARY 01 TO SEPTEMBER 30, 2009 & 2008
Sept 30, 2009
Sept 30, 2008
CAPITAL STOCK
Common Shares
Authorized - 16,368,095,199 shares in 2008, 1,368,095,199
shares in 2007
Issued -
1,368,095,199
Subscribed during the year 2008 -
3,750,000,000
Total
5,118,095,199
Capital Stock
Deposit on Subscription
Advances from Stochholder with Indefinite Repayment Term
Retained Earnings (Deficit)
Net Income (Loss)
Minority Interest in a Consolidated Subsidiary
TOTAL EQUITY
433,757,136
122,596,436
(73,457,405)
246,257,135.82
168,780,381.97
54,000,000.00
122,424,122.85
(38,517,675.07)
482,896,167
552,943,966
4,280,744
4,129,984.54
487,176,910
557,073,950
13
ARTHALAND CORPORATION
AGING OF ACCOUNTS RECEIVABLE
AS OF September 30, 2009
Type of Accounts Receivable
Total
Within
Within
6 Mos.
6 Mos. - 1 year
a) TRADE RECEIVABLE
1. Tenants
2. ____________________
3. ____________________
Sub Total
Less: Allow. For Doubtful Accounts
NET TRADE RECEIVABLE
8,344,683.12
0.00
0.00
8,344,683.12
0.00
8,344,683.12
5,985,710.84
b) NON TRADE RECEIVABLES
1. Others
2. Suppliers
Sub Total
Less: Allow. For Doubtful Accounts
NET NON-TRADE RECEIVABLE
NET RECEIVABLES (A+B)
2,358,972.24
5,985,710.84
2,358,972.24
5,985,710.84
2,358,972.24
9,916,530.94
10,638,912.09
20,555,443.03
20,555,443.03
5,289,688.11
10,638,912.09
15,928,600.20
15,928,600.20
4,626,842.83
4,626,842.83
4,626,842.83
28,900,126.15
21,914,311.04
6,985,815.07
ACCOUNTS RECEIVABLE DESCRIPTION:
Type of Receivable
Nature / Description
Colletion Period
1. Tenants
Rentals
Regular billings are made
2. Others
Advances and Working Fund
for daily & emergency exp.
Regular billings are made / monthly
reimbursement / replenishment.
14
ARTHALAND, CORPORATION
ITEM 2.
Management’s Discussion and Analysis of Financial Condition and Results of
Operation
Comparable Discussion of Interim Period as of 30 September 2009
The consolidated net loss of the Group as of the September 2009 increased by P 35.132 Mn to P 74.108
Mn from a net loss of P 39.106 Mn for the same period in 2008. This is primarily due to an increase in
expenditures related to increase in manpower and interest charges incurred to finance operations.
As of September 2009, total expenses increased by P 65.195 Mn. This increase in expenses is primarily
due to salaries and wages, P 9.752 Mn , Taxes and Licenses which increased by P 5.256Mn and finance
charges by P53.758 Mn. As of September 30, 2009, ALCO has 27 employees compared to 14 during the
same period in 2008.
ALCO posted a 17.23% increase in revenues as of September 2009 against the same period in 2008 due
to a rental escalation recognized in 2009.
FINANCIAL CONDITION
The Group’s aggregate resources was P 3.848 Bn as of 30 September 2009.
Impact of New Amendments and Interpretations to Existing Standards
(a)
Effective in 2008
There are standards and interpretations to published standards that are mandatory for accounting
periods beginning on or after 01 January 2008. These standards and interpretations, however, are not
currently relevant to the Group’s operations.
Philippine Interpretation
Financial Reporting
Interpretations
Committee (IFRIC) 14:
PAS 39 and PFRS 7
(Amendments):
Philippine Accounting Standards
(PAS) 19 – The Limit on a Defined
Benefit Asset, Minimum Funding
Requirements and their Interaction
PAS 39, Financial Instruments:
Recognition and Measurement
and PFRS 7, Financial Instruments:
Disclosures
15
Philippine Interpretation
IFRIC 11:
Philippine Interpretation
IFRIC 12:
Group and Treasury Share
Transactions
Service Concession Arrangements
The first time application of the standard and the amendment has not resulted in any prior period
adjustments of cash flows, net income or balance sheet line items.
(b) Effective Subsequent to 2008
There are new and amended standards that are effective for periods subsequent to 2008. The following
new standards, effective for annual periods beginning on or after 01 January 2009 are relevant to the
Group, and which the Group will apply in accordance with their transitional provisions.
PAS 1 (Revised 2007):
PAS 40 (Amendment):
Presentation of Financial Statements
PAS 40, Investment Property
Below is a discussion of the possible impact of these accounting standards.
(i) PAS 1 (Revised 2007), Presentation of Financial Statements (effective from January 1, 2009).
The amendment requires an entity to present all items of income and expense recognized in the
period in a single statement of comprehensive income or in two statements: a separate income
statement and a statement of comprehensive income. The income statement shall disclose
income and expense recognized in profit and loss in the same way as the current version of PAS
1. The statement of comprehensive income shall disclose profit or loss for the period, plus each
component of income and expense recognized outside of profit and loss classified by nature
(e.g., gains or losses on available for-sale assets or translation differences related to foreign
operations). Changes in equity arising from transactions with owners are excluded from the
statement of comprehensive income (e.g., dividends and capital increase). An entity would also
be required to include in its set of financial statements a statement showing its financial position
(or balance sheet) at the beginning of the previous period when the entity retrospectively
applies an accounting policy or makes a retrospective restatement. The Group will apply PAS 1
(Revised 2007) in its 2009 financial statements.
(ii) PAS 40 (Amendment), Investment Property. This standard is amended to include property
under construction or development for future use as investment property in its definition of
investment property. This results in such property being within the scope of PAS 40; previously,
it was within the scope of PAS 16. Also, if an entity’s policy is to measure investment property at
fair value, but during construction or development of an investment property the entity is
unable to reliably measure its fair value, then the entity would be permitted to measure the
investment property at cost until construction or development is complete. At such time, the
entity would be able to measure the investment property at fair value.
Minor amendments are made to several other standards; however, those amendments are not
expected to have any material impact on the Company’s financial statements
16
RISK MANAGEMENT OBJECTIVES AND POLICIES
The Group is exposed to a variety of financial risks which result from both its operating and investing
activities. The Group’s risk management is coordinated with its Parent, in close cooperation with the
Board of Directors, and focuses on actively securing the Group’s short- to medium-term cash flows by
minimizing the exposure to financial markets. Long-term financial investments are managed to generate
lasting returns.
The Group does not actively engage in the trading of financial assets for speculative purposes nor does it
write options. The most significant financial risks to which the Group is exposed to as described below.
Credit Risk Analysis
The Group and the Parent’s exposure to credit risk is limited to the carrying amount of financial assets
recognized as of 30 September 2009.
Generally, the maximum credit risk exposure of financial assets is the carrying amount of the financial
assets as shown on the face of the balance sheet. Credit risk, therefore, is only disclosed in
circumstances where the maximum potential loss differs significantly from the financial asset’s carrying
amount.
For advances to subsidiaries and associate, the Group is not exposed to significant risk more than the
carrying amount of the advances since such net assets of the subsidiary and associate are sufficient to
cover the Group’s investments and advances.
Liquidity Risk
Liquidity risk is the risk that there are insufficient funds available to adequately meet the credit demands
of the Group’s customers and repay liabilities on maturity.
The Group closely monitors the current and prospective maturity structure of its resources and liabilities
and the market condition to guide pricing and asset/liability allocation strategies to manage its liquidity
risks.
17
Key Performance Indicators
September 2009
December 2008
13.38%
13.16%
0.40%
0.17%
-14.39%
0.13%
Capital Adequacy Ratio
Total Equity to Total Assets Ratio
Liquidity
Liquid to Total Assets Ratio
Profitability
Return on Average Equity
The Group’s Capital Adequacy Ratio (CAR) stood at 13.38%, a minimal increase of .22% compared to last
year’s level of 13.16% . CAR is computed by dividing the Total Average Stockholder’s Equity over the
Total Assets:
Capital Adequacy Ratio
Total Equity to Total
Assets Ratio
September 30, 2009
514,871,115
December 31, 2008
13.38%
3,848,997,144
480,147,867
13.16%
3,649,006,841
Liquidity ratio indicates the proportion of total assets which can be readily converted into cash. It also
measures the extent to which the assets can be converted into cash to meet its liquidity requirements.
Liquid assets include cash and other cash items. Below is the computation for the Liquidity Ratio:
Liquidity
Liquid to Total Assets
Ratio
September 30, 2009
15,263,371
3,848,997,144
December 31, 2008
6,268,100
0.40%
3,649,006,841
0.17%
The ratio of the Group’s return on average equity (ROE) decreased from negative 0.13% in December
2008 to negative 14.39 % in September 2009. The Return on Average Equity Ratio is calculated as
follows:
Profitability
Return
Equity
on
September 30, 2009
Average
(74,108,027)
514,871,115
December 31, 2008
-14.39%
(629,209)
-0.13%
480,147,867
18
Discussion and Analysis of Materials Events
(1)
i.
The proposed increase in ALCO’s authorized capital stock was approved on 24
December 2008. This gave way to additional capital infusion by investors which will enable the
Company to generate the liquidity required for future developments. Additional paid in capital
was noted at P18 Mn in May 2009.
ii.
There are no other known trends, commitments, events or uncertainties that will have a
material impact on ALCO’s liquidity within the next twelve (12) months except for those
mentioned above.
(2)
i.
There are no material commitments as of the date of this Report for capital
expenditures.
ii.
There are no events that will trigger any direct or contingent financial obligation that is
material to the Group or any default or acceleration of an obligation for the period.
(3)
There is nothing to disclose regarding any material off-balance sheet transactions,
arrangements, obligations (including contingent obligations) and other relationships of ALCO
with unconsolidated entities or other persons created during the reporting period.
(4)
There are no other significant elements of income or loss that did not arise from ALCO’s
operations or borrowings for its projects.
(5)
The causes of the material changes of 5% or more from period to period of the following
accounts are as follows:
Balance Sheet Accounts – September 30, 2009 versus end 2008
(i)
144% increase in Cash and Cash Equivalent –due to proceeds from short term
notes payable and additional paid in capital
(ii)
55% increase in Receivables due to Advances to Suppliers and Contractor as a
result of the start of Project in Fort Bonifacio and Receivables from Tenants that
increased in value as a result of lease rate escalation.
(iii)
275% increase in Other Current Assets – mainly due to Creditable Withholding
Taxes, Rental Deposits, Meter Deposits
(iv)
8% increase in total liabilities is due to loans acquired from various lenders
19
Income statement - Q2 2009 versus Q2 2008
(i)
11% increase in Gross Income is due to renewal of Lease Contracts at higher
lease rates
(ii)
8 % increase in taxes and licenses is due to the taxes related to the processing of
various loan agreements.
(iii)
Increase in Power, Light and Water, Annual Dues and Fees, Transportation,
Communication and Supplies is related to the increase in manpower
compliment form 14 to 27
- nothing follows -
20


© Copyright 2026