
MUNICIPAL SECONDARY MARKET DISCLOSURE INFORMATION COVER SHEET
MUNICIPAL SECONDARY MARKET DISCLOSURE
INFORMATION COVER SHEET
This cover sheet should be sent with all submissions made to the Municipal Securities Rulemaking Board, Nationally
Recognized Municipal Securities Information Repositories, and any applicable State Information Depository pursuant to
Securities and Exchange Commission Rule 15c2-12 or any analogous state statute.
***
Issuer’s and/or Other Obligated Person’s Name: Alameda Corridor Transportation Authority
CUSIP Numbers (attach additional sheet if necessary):
[ X ] Nine-digit number(s) to which the information relates. Please see Exhibit A
[ ] Information relates to all securities issued by the issuer having the following six-digit number(s):
***
Number of pages of attached information:
Annual Report and Comprehensive Annual Financial Report: 216.
Description of Material Event Notice / Financial Information (Check one):
1. ___ Principal and interest payment delinquencies
2. ___ Non-payment related defaults
3. ___ Unscheduled draws on debt service reserves reflecting financial difficulties
4. ___ Unscheduled draws on credit enhancements reflecting financial difficulties.
5. ___ Substitution of credit or liquidity providers, or their failure to perform
6. ___ Adverse tax opinions or events affecting the tax-exempt status of the security
7. ___ Modifications to rights of security holders
8. ___ Bond calls
9. ___ Defeasances
10. ___ Release, substitution, or sale of property securing repayment of the securities
11. X Rating changes
12. ___ Failure to provide annual financial information as required
13. ___ Other material event notice (specify)
*14. X Annual Financial Information
Fiscal Period Covered: Fiscal Year 2008
Audited Financial Statements: Yes [ X ] No [ ]
*Financial information should not be filed with the MSRB.
EXHIBIT A
MUNICIPAL SECONDARY MARKET DISCLOSURE
INFORMATION COVER SHEET
CUSIP1 NUMBERS
$494,893,616.80 Tax-Exempt Senior Lien Revenue Bonds, Series 1999A
010869AC9
010869BH7
010869BJ3
010869AD7
010869AE5
010869BL8
010869BK0
010869AF2
010869AG0
010869BM6
010869BN4
010869AH8
010869AJ4
010869BP9
010869BQ7
010869AK1
010869AL9
010869BR5
010869BS3
010869AM7
010869AN5
010869BT1
010869BD6
010869AP0
010869AQ8
010869AR6
010869AS4
010869AT2
010869AU9
010869AV7
010869AW5
010869AX3
010869AY1
$497,453,395.74 Taxable Senior Lien Revenue Bonds, Series 1999C
010869BZ7
010869CD5
010869CA1
010869CB9
010869CC7
010869CE3
010869CF0
010869CG8
010869CH6
010869CJ2
010869CK9
010869CL7
010869CM5
$145,635,000 Taxable Subordinate Lien Revenue Bonds, Series 1999D
010869CU7
010869CV5
010869CW3
010869CX1
010869CY9
010869CZ6
$475,292,386.40 Tax-Exempt Subordinate Lien Revenue Refunding Bonds, Series 2004A
010869DK8
010869DL6
010869DM4
010869DN2
010869DP7
010869DQ5
010869DR3
010869DS1
010869DT9
010869DU6
010869DV4
010869EL5
010869EM3
010869EN1
010869EP6
010869EQ4
$210,731,702.85 Taxable Subordinate Lien Revenue Refunding Bonds, Series 2004B
010869DZ5
010869EA9
010869EB7
010869EC5
1
010869ED3
010869EE1
010869EF8
010869EG6
010869EH4
010869EJ0
010869EK7
CUSIP is a registered trademark of American Bankers Association. CUSIP data herein is set forth for convenience of reference only. The Authority
assumes no responsibility for the accuracy of such data.
ANNUAL REPORT
for the Fiscal Year Ended June 30, 2008
Relating to:
ALAMEDA CORRIDOR TRANSPORTATION AUTHORITY
$494,893,616.80 Tax-Exempt Senior Lien Revenue Bonds, Series 1999A
$497,453,395.70 Taxable Senior Lien Revenue Bonds, Series 1999C
$145,635,000.00 Taxable Subordinate Lien Revenue Bonds, Series 1999D
and
$475,292,386.40 Tax-Exempt Subordinate Lien Revenue Refunding Bonds, Series 2004A
$210,731,702.85 Taxable Subordinate Lien Revenue Refunding Bonds, Series 2004B
Dated as of
March 31, 2009
TABLE OF CONTENTS
INTRODUCTION .........................................................................................................................................................2
Official Statements and Prior Reports ....................................................................................................................2
Disclaimers.............................................................................................................................................................2
DISCUSSION OF EVENTS .........................................................................................................................................3
Listed Events ..........................................................................................................................................................3
Notices Regarding Change in Ratings....................................................................................................................4
Economic Developments and Shipping Activity....................................................................................................5
FURTHER INFORMATION ........................................................................................................................................5
ACTA FINANCIAL AND OPERATING INFORMATION........................................................................................6
Table – Estimated Authority Revenue in Bond Year 2008 .............................................................................6
Table – Railroad Corridor Traffic in Bond Year 2008 ....................................................................................6
Table – M&O Charges - Invoices & Receipts from Railroads (Calendar Year 2008) ....................................7
PORT OF LOS ANGELES FINANCIAL AND OPERATING INFORMATION .......................................................8
Table – Schedule of Operating Revenues........................................................................................................8
Table – Revenue Tonnage Summary ..............................................................................................................9
Table – Revenue Tonnage by Cargo Type ......................................................................................................9
Table – Revenue Tonnage by Trade Route ...................................................................................................10
Table – Revenue Tonnage by Leading Trading Partners ..............................................................................10
Table – Comparative Summary of Statement of Revenues and Expenses ....................................................11
Table – Major Tenants of the Port of Los Angeles .......................................................................................11
PORT OF LONG BEACH FINANCIAL AND OPERATING INFORMATION ......................................................12
Table – Schedule of Operating Revenues......................................................................................................12
Table – Revenue Tonnage Summary ............................................................................................................13
Table – Revenue Tonnage by Cargo Type ....................................................................................................13
Table – Revenue Tonnage by Trade Route ...................................................................................................14
Table – Revenue Tonnage by Leading Trading Partners ..............................................................................14
Table – Comparative Summary of Statement of Revenues and Expenses ....................................................15
Table – Major Tenants of The Harbor Department of the City of Long Beach (As of
September 30, 2008).........................................................................................................................15
AUDITED FINANCIAL STATEMENTS ..................................................................................................................16
CERTIFICATION .......................................................................................................................................................16
APPENDIX A:
APPENDIX B:
APPENDIX C:
ALAMEDA CORRIDOR TRANSPORTATION AUTHORITY BASIC FINANCIAL
STATEMENTS FOR THE FISCAL YEARS ENDED JUNE 30, 2008 AND 2007 (WITH
INDEPENDENT AUDITORS’ REPORT THEREON)
PORT OF LOS ANGELES (HARBOR DEPARTMENT OF THE CITY OF LOS ANGELES), A
COMPONENT UNIT OF THE CITY OF LOS ANGELES, CALIFORNIA FINANCIAL
STATEMENTS FOR THE FISCAL YEARS ENDED JUNE 30, 2008 AND 2007 (WITH
INDEPENDENT AUDITORS’ REPORT THEREON)
THE HARBOR DEPARTMENT OF THE CITY OF LONG BEACH, CALIFORNIA
FINANCIAL STATEMENTS FOR THE FISCAL YEARS ENDED SEPTEMBER 30, 2008 AND
2007 (WITH INDEPENDENT AUDITORS’ REPORT THEREON)
INTRODUCTION
This Annual Report (this “Report”), including the cover page and appendices hereto, is being
furnished by the Alameda Corridor Transportation Authority (the “Authority”) to provide updated
financial and operating information of the Authority of the type included in the final official statements
for the:
•
$494,893,616.80 aggregate principal amount of Tax-Exempt Senior Lien Revenue Bonds,
Series 1999A (the “1999A Bonds”);
•
$497,453,395.70 aggregate principal amount of Taxable Senior Lien Revenue Bonds, Series
1999C (the “1999C Bonds”);
•
$145,635,000.00 aggregate principal amount of Taxable Subordinate Lien Revenue Bonds,
Series 1999D (the “1999D Bonds”, and together with the 1999C Bonds, the “1999CD
Bonds”);
•
$475,292,386.40 aggregate principal amount of Tax-Exempt Subordinate Lien Revenue
Refunding Bonds, Series 2004A (the “2004A Bonds”); and
•
$210,731,702.85 aggregate principal amount of Taxable Subordinate Lien Revenue
Refunding Bonds, Series 2004B (the “2004B Bonds,” and together with the 2004A Bonds,
the “2004 Bonds”).
The 1999A Bonds, the 1999CD Bonds and the 2004 Bonds are referred to herein as the “Bonds.”
This Report is provided pursuant to covenants made by the Authority, the City of Long Beach,
acting by and through its Board of Harbor Commissioners (“POLB”), and the City of Los Angeles, acting
by and through its Board of Harbor Commissioners (“POLA”, and together with POLB, the “Ports”), in
connection with the issuance of: (i) the 1999A Bonds and the 1999CD Bonds pursuant to that certain
Continuing Disclosure Certificate of the Authority, POLA and POLB dated January 1, 1999; and (ii) the
2004 Bonds pursuant to that certain Continuing Disclosure Certificate of the Authority, POLA and POLB
dated February 1, 2004 (collectively, the “Continuing Disclosure Certificates”).
Official Statements and Prior Reports
For further information and a more complete description of the Authority, POLA, POLB and the
Bonds, reference is made to the Official Statement for the 1999A Bonds (the “1999A Official
Statement”), the Official Statement for the 1999CD Bonds (the “1999CD Official Statement, and together
with the 1999A Official Statement, the “1999 Official Statements”) and the Official Statement for the
2004 Bonds (the “2004 Official Statement,” and together with the 1999 Official Statements, the “Official
Statements”) and the Authority’s previous Annual Continuing Disclosure Reports for the fiscal years
ended June 30, 1999 through June 30, 2007 (the “Prior Reports”), respectively, all of which speak only as
of their respective dates. Capitalized terms used but not defined herein have the meanings given to them
in the Official Statements and the Continuing Disclosure Certificates.
Disclaimers
To the extent the Authority provides information herein that the Authority is not obligated to
present or update, the Authority is not obligated to present or update such information in future annual
reports. Except as set forth herein, the Authority has not updated any information contained in the Prior
Reports.
Investors are advised to refer to the Official Statements for information concerning the initial
issuance of and security for the Bonds. THE BONDS ARE SPECIAL, LIMITED OBLIGATIONS OF
THE AUTHORITY AND ARE PAYABLE SOLELY FROM AND ARE SECURED BY A LIEN ON
THE TRUST ESTATE. THE BONDS ARE NOT OBLIGATIONS OF THE STATE OF CALIFORNIA
2
OR ANY POLITICAL SUBDIVISION OF THE STATE OF CALIFORNIA AND ARE NOT
OBLIGATIONS OF THE CITY OF LONG BEACH OR THE CITY OF LOS ANGELES (TOGETHER,
THE “CITIES”), THE PORTS OR THE RAILROADS. THE PROJECT IS NOT SECURITY FOR THE
BONDS, AND THE BONDS ARE NOT SECURED BY A LIEN ON ANY PROPERTIES OR
IMPROVEMENTS OF THE AUTHORITY, THE CITIES THE PORTS OR THE RAILROADS OR BY
A PLEDGE OF ANY REVENUES OF THE CITIES, THE PORTS OR THE RAILROADS.
By providing the information herein, the Authority does not imply or represent (a) that all
information provided herein is material to investors’ decisions regarding investment in the Bonds, (b) the
completeness or accuracy of any financial, operational or other information not included herein or in the
Official Statements, (c) that no changes, circumstances or events have occurred since June 30, 2008 (other
than as contained herein), or (d) that no other information exists which may have a bearing on the
Authority’s financial condition, the security for the Bonds or an investor’s decision to buy, sell or hold the
Bonds.
The information set forth herein and incorporated hereby has been furnished by the Authority and
is believed to be accurate and reliable but is not guaranteed as to accuracy or completeness. Statements
contained in or incorporated by this Report which involve estimates, forecasts or other matters of opinion,
whether or not expressly so described herein, are intended solely as such and are not to be construed as
representations of fact. Further, expressions of opinion contained herein or incorporated hereby are
subject to change without notice and the delivery of this Report will not, under any circumstances, create
any implication that there has been no change in the affairs of the Authority.
No statement contained herein should be construed as a prediction or representation about future
financial performance of the Authority. Historical results presented herein may not be indicative of future
operating results.
DISCUSSION OF EVENTS
Listed Events
Except as described below under “Notices Regarding Change in Ratings,” the Authority hereby
reports no events with respect to the Bonds that are referred to in Section 5(a) of the Continuing
Disclosure Certificates, consisting of the following:
•
principal and interest payment delinquencies;
•
non-payment related defaults;
•
unscheduled draws on debt service reserves reflecting financial difficulties;
•
unscheduled draws on credit enhancements reflecting financial difficulties;
•
substitution of credit or liquidity providers or their failure to perform;
•
adverse tax opinions or events affecting the tax status of the Bonds;
•
modifications to the rights of Owners of the Bonds;
•
Bond calls other than mandatory sinking fund repayments;
•
defeasances;
•
release, substitution, or sale of property, if any, securing repayment of the Bonds; and
•
rating changes.
3
Notices Regarding Change in Ratings
Since March 31, 2008, the date of the Authority’s last Annual Report with respect to the Bonds,
the Authority has filed the following notices as required by the Continuing Disclosure Certificates:
1. Notice Regarding Change in Ratings dated April 14, 2008, filed in connection with
changes in the insured ratings of the 1999A Bonds, the 1999C Bonds and the 1999D
Bonds based on a change in the rating of the insurer of such bonds;
2. Notice Regarding Change in Ratings dated June 25, 2008, filed in connection with
changes in the insured ratings of the Bonds based on changes in the ratings of the insurers
of the Bonds;
3. Notice Regarding Change in Ratings dated July 15, 2008, filed in connection with
changes in the insured ratings of the 2004 Bonds based on a change in the rating of the
insurer of the 2004 Bonds; and
4. Notice Regarding Change in Ratings dated November 25, 2008, filed in connection with
changes in the insured ratings of the 1999D Bonds and the 2004 Bonds based on changes
in the ratings of the insurers of such bonds.
Copies of the foregoing notices may be obtained from the Authority. The notices speak only as of
their respective dates and the content of the foregoing notices are not incorporated herein.
Additionally, MBIA Insurance Corporation of Illinois (“MBIA”) provides bond insurance for the
1999A Bonds, the 1999C Bonds and the 1999D Bonds (together, the “MBIA Insured Bonds”).
On February 18, 2009, Standard & Poor’s Ratings Services, a Division of The McGraw-Hill
Companies, Inc. (“S&P”), downgraded the financial strength rating of MBIA from “AA” to “AA-.” As a
result of such action, the ratings on certain MBIA-insured bond issues, including certain maturities of the
MBIA Insured Bonds (the “Downgraded MBIA Bonds”), were changed by S&P from “AA” to “AA-.”
In connection with the issuance of the MBIA Insured Bonds, S&P assigned unenhanced/underlying
ratings of “BBB+” with respect to the 1999A Bonds and the 1999C Bonds; and “BBB” with respect to the
1999D Bonds. As of the date hereof, S&P has assigned unenhanced/underlying ratings of “A” with
respect to the 1999A Bonds and the 1999C Bonds; and “A-” with respect to the 1999D Bonds.
The Downgraded MBIA Bonds are bonds of the Authority insured by MBIA and are as follows:
Issue
1999A Bonds
Maturities
(October 1)
2009-2019,
2021, 2025,
2029
Base CUSIP No. (010869)
AC9, BH7, BJ3, AD7, AE5, BL8, BK0,
AF2, AG0, BM6, BN4, AH8, AJ4, BP9,
AK1, BQ7, AL9, BR5, AM7, BS3, AN5,
BT1, BD6, AP0, AQ8
1999C Bonds
2019, 2029
BZ7, CD5
1999D Bonds
2009-2014
CU7, CV5, CW3, CX1, CY9, CZ6
The Authority has not been notified by any rating agency in connection with the ratings actions
taken with respect to the Downgraded MBIA Bonds, that the unenhanced/underlying ratings with respect
to the Bonds have changed. The ratings actions described above express only the view of the respective
rating agencies. An explanation of the significance of such ratings may be obtained from the respective
rating agencies; provided, however, that no information provided by the respective rating agencies is
incorporated herein. The actions of the respective rating agencies are not a recommendation to buy, sell
or hold any Bonds. There is no assurance that any ratings on any Bonds will remain in effect for any
given period of time or that they will not be revised, either downward or upward, or withdrawn entirely,
by the respective rating agencies if, in the judgment of either of them, circumstances so warrant. The
4
Authority undertakes no responsibility to oppose any revision or withdrawal of such ratings. Any such
downward revision or withdrawal of such ratings may have an adverse effect on the market price of the
Bonds. The filing of this Report does not constitute or imply any representation that no other information
exists which may have a bearing on the Authority’s financial condition, the security for the Bonds or an
investor’s decision to buy, sell or hold the Bonds. The information set forth herein has been furnished by
the Authority and is believed to be accurate and reliable but is not guaranteed as to accuracy or
completeness.
Economic Developments and Shipping Activity
The shipping industry as a whole and the level of shipping traffic activity is dependent upon a
variety of factors, including: (i) local, regional, national and international economic and trade conditions,
(ii) international political conditions and hostilities, (iii) cargo security concerns, (iv) shipping industry
economics, including the cost and availability of labor, fuel, vessels, containers and insurance,
(v) competition among shipping companies and ports, including with respect to timing, routes and
pricing, (vi) governmental regulation, including security regulations and taxes imposed on ships and
cargo, as well as maintenance and environmental requirements and (vii) demand for shipments.
Recent events in the national and global economy and financial markets, including falling home
prices, limited credit availability, financial instability, failures of banks and other major financial
institutions, a downturn in consumer spending, business bankruptcies, declining real property and
investment values, a significant increase in real property foreclosures and increased job losses, among
other factors, have weighed heavily on the global, national and local economies. Cargo traffic has been
impacted by downturns in the global, national and local economies, increasing fuel costs and instability in
the U.S. dollar.
Unless otherwise noted, the information provided in this Report is as of the fiscal year ended June
30, 2008. As of June 30, 2008, the global economy, the national economy and the California economy
showed signs of decline. Since June 30, 2008, economic conditions have worsened significantly. As a
result, cargo traffic growth has slowed, or even decreased in certain markets since June 30, 2008. For
example, total twenty-foot equivalent units (“TEUs”) at the Ports for February 2009 were a combined
35.99% less than February 2008 and total TEUs for the eight months ended February 28, 2009 at the
Ports as compared to the eight months ended February 29, 2008 at the Ports have decreased by a
combined 12.94%.
The recent downturn in the global economy has had a particularly significant impact on the
economy of the Far East region, which accounts for more than 90% of all TEUs at the Ports. Because the
Far East accounts for such a large portion of the Ports’ business, continued declines in the economy of the
Far East region and in the economies of individual Far East countries may cause significant reductions in
the Ports’ imports and exports, thereby affecting the Authority.
FURTHER INFORMATION
For further information regarding this Report, please address your questions to:
Mr. James P. Preusch
Chief Financial Officer
Alameda Corridor Transportation Authority
One Civic Plaza
Suite 350
Carson, California 90745
(310) 233-7480
5
ACTA FINANCIAL AND OPERATING INFORMATION
The period of each Bond Year is October 1 through September 30. The following table sets forth
the Authority’s estimated revenues for Bond Year 2008, ended September 30, 2008.
ALAMEDA CORRIDOR TRANSPORTATION AUTHORITY
ESTIMATED AUTHORITY REVENUE IN BOND YEAR 2008*
Revenue Component
Estimated Revenue
Waterborne Full
$
% of Total Revenue
89,690,928
95.60%
Waterborne Empty
2,175,567
2.32
Non-Waterborne
1,105,279
1.18
Misc. Full Railcars
844,300
Total
$
0.90
93,816,073
100.00%
*Totals may not add due to rounding.
Source: Alameda Corridor Transportation Authority
The following table sets forth the Authority’s railroad corridor container traffic for Bond Year
2008.
ALAMEDA CORRIDOR TRANSPORTATION AUTHORITY
RAILROAD CORRIDOR TRAFFIC IN BOND YEAR 2008
Railroad
Traffic
Category
Full International TEUs
4,847,951
Empty International TEUs
464,858
Total
Domestic combined*
5,312,809
217,455
*
Inclusive of both empty and full containers.
Source: Alameda Corridor Transportation Authority
6
The following tables present the M & O Charges, as defined in the Master Indenture, paid to the
Authority by the Railroads for the calendar year 2008. M & O Charges are not deemed to be Revenues or
Dedicated Revenues under the Master Indenture. The insurance portion of M & O Charges is paid
pursuant to separate invoices.
ALAMEDA CORRIDOR TRANSPORTATION AUTHORITY
M&O CHARGES - INVOICES & RECEIPTS FROM RAILROADS
CALENDAR YEAR 2008
(amounts in U.S. $)
Date
Jan-08
Feb-08
Mar-08
Apr-08
May-08
Jun-08
Jul-08
Aug-08
Sep-08
Oct-08
Nov-08
Dec-08
Type
Monthly M&O
Monthly M&O
Monthly M&O
Monthly M&O
Monthly M&O
Monthly M&O
Monthly M&O
Monthly M&O
Monthly M&O
Monthly M&O
Monthly M&O
Monthly M&O
Insurance
Invoice
Amount
203,732.34
206,732.33
206,732.33
206,732.33
206,732.33
206,732.33
206,732.33
206,732.33
206,732.33
206,732.33
206,732.33
206,732.33
1,469,364.75
Payment
Amount
(203,732.34)
(119,816.74)
(206,732.33)
(206,732.33)
(182,534.19)
(256,659.54)
(206,732.33)
(206,732.33)
(206,732.33)
(206,732.33)
(206,732.33)
(206,732.33)
(1,393,709.31)
Credit Memo
Applied
(136,842.38)
-
Balance
(49,926.79)
24,198.14
(49,927.21)
75,655.44
Total
3,947,152.72
(3,810,310.76)
(136,842.38)
(0.42)
Source: Alameda Corridor Transportation Authority
[REMAINDER OF PAGE INTENTIONALLY LEFT BLANK]
7
PORT OF LOS ANGELES FINANCIAL AND OPERATING INFORMATION
PORT OF LOS ANGELES
OPERATING REVENUES
FISCAL YEAR 2004 THROUGH 2008(1)(2)
(in thousands)
2008
Operating Revenues:
Shipping Services:
Dockage
Wharfage
Storage
Demurrage
Pilotage
Assignment Charges
$
6,957
335,172
102
276
7,677
22,750
2007
$
8,201
331,919
129
246
8,829
23,687
2006
$
8,484
330,933
197
283
7,737
23,312
2005
$
7,577
288,415
123
310
6,951
22,283
2004
$
7,150
270,616
99
361
7,266
22,509
Cranes
Total shipping services
1,944
$ 374,878
2,460
$ 375,471
2,402
$ 373,348
3,155
$ 328,814
3,383
$ 311,384
Less: Provision for bad debts(3)
Net shipping services
Rentals:
Land
Wharf and shed
Buildings
$ 374,878
(5,499)
$ 369,972
(19,958)
$ 353,390
(13,199)
$ 315,615
(17,407)
$ 293,977
$
$
$
$
Warehouse
Total rentals
Royalties, fees and other
operating revenues:
Fees, permits and concessions
Oil royalties
Other
Total royalties, etc.
Total operating revenues
41,587
1,267
501
2,169
37,146
1,190
457
30,807
1,135
441
1,528
1,493
31,788
1,073
255
1,514
30,908
778
268
1,307
$
45,524
$
40,322
$
33,876
$
34,630
$
33,261
$
3,701
122
$
3,994
79
$
3,693
84
$
3,388
75
$
2,790
54
$
2,120
5,943
$ 426,345
2,795
6,867
$
$ 417,160
(1)
$
1,116
4,893
$ 392,159
$
1,921
5,384
$ 355,629
$
2,172
5,016
$ 332,254
Fiscal Year ended June 30.
Totals may not add due to rounding.
(3)
Provision for bad debts formerly included in wharfage, now classified as a separate item.
Note: In 2007, Macias Gini & O’Connell LLP succeeded KPMG LLP as preparer of the Harbor Department’s audited
financial statements. At that time, certain reclassifications were made to the amounts reported in 2006 in order to conform
with the 2007 presentation. Such reclassifications had no effect on previously reported change in net assets.
Source: Harbor Department of the City of Los Angeles
(2)
8
PORT OF LOS ANGELES
REVENUE TONNAGE SUMMARY
FISCAL YEAR 2004 THROUGH 2008
(in revenue tons(1))
2008
2007
2006
2005
2004
INBOUND CARGO
Foreign
Coastwise/Intercoastal
Total Inbound Cargo
100,742,551
4,491,712
105,234,263
112,246,665
5,995,487
118,242,152
102,756,243
9,706,707
112,462,950
94,213,528
7,115,689
101,329,217
97,734,607
6,531,681
104,266,288
OUTBOUND CARGO
Foreign
Coastwise/Intercoastal
Bunkers
Total Outbound Cargo
64,700,150
407,421
2,175,000
67,282,571
68,017,985
1,490,526
2,355,000
71,863,511
60,438,033
6,305,831
2,428,000
69,171,864
52,908,913
5,958,275
1,913,054
60,780,242
54,542,600
1,582,333
1,676,716
57,801,649
(370,936)
172,145,898
190,105,663
181,634,814
162,109,459
162,067,937
105,234,263
67,282,571
8,083,000
118,242,152
71,863,511
8,657,644
112,462,950
69,171,864
7,802,201
101,329,217
60,780,242
7,272,766
104,266,288
57,801,649
7,351,110
Advance Wharfage & Accruals
GRAND TOTAL
Total Inbound Cargo
Total Outbound Cargo
Container Count in TEUs(2)
(1)
A metric revenue ton is equal to either 1,000 kilograms or one cubic meter, whichever results in greater revenue.
Adjusted TEUs.
Source: Harbor Department of the City of Los Angeles
(2)
PORT OF LOS ANGELES
REVENUE TONNAGE BY CARGO TYPE
FISCAL YEARS 2007 AND 2008
(In thousands of metric revenue tons)
Cargo Type
Dry Bulk
General Cargo
Liquid Bulk
Total
*
(1)
2008*
Revenue Tonnage
1,900
161,900
13,400
177,200
2007*
Percent of Total
1.1%
91.4%
7.6%
100.0%
Revenue Tonnage
2,800
171,900
15,400(1)
190,100
Differences with corresponding numbers in other tables are due to rounding.
Liquid bulk data for Fiscal Year 2007 includes 7,354 of adjustments for prior years.
Source: Harbor Department of the City of Los Angeles
9
Percent of Total
1.5%
90.4%
8.1%
100.0%
PORT OF LOS ANGELES
REVENUE TONNAGE BY TRADE ROUTE
FISCAL YEAR 2008
(in thousands of metric revenue tons)
Inbound
95,743
4,492
1,164
952
Far East
Domestic
Australia & New Zealand
India, Persian Gulf, Red Sea
Western Mexico, Central and
Western South America
Caribbean
Eastern South America
Western Europe
Mediterranean
Outbound
62,700
407
1,039
503
Total
158,443
4,899
2,203
1,455
% of Total
Volume
93.0%
2.9%
1.3%
0.9%
1,160
810
542
241
93
150
96
99
114
1,310
906
542
340
207
0.8%
0.5%
0.3%
0.2%
0.1%
Africa
Sub-total
37
105,234
65,108
37
170,342
0.0%
100.0%
Advance Wharfage & Accruals
Total
105,234
65,108
(371)
169,971
100.0%
Source: Harbor Department of the City of Los Angeles
PORT OF LOS ANGELES
REVENUE TONNAGE BY LEADING TRADING PARTNERS
FISCAL YEAR 2004 THROUGH 2008
(in thousands of metric revenue tons)
Inbound
China
Taiwan
Japan
South Korea
Hong Kong
2008
50,131
10,636
6,649
5,405
4,121
2007
46,031
11,565
7,498
6,739
9,928
2006
43,980
11,050
7,164
6,439
9,486
2005
40,584
11,067
5,916
5,239
12,251
2004
40,091
10,013
6,681
6,857
14,384
Outbound
China
Taiwan
Japan
South Korea
Hong Kong
26,996
10,044
3,535
1,940
1,113
26,442
8,484
5,682
2,349
5,105
25,264
8,106
5,429
2,244
4,878
22,817
5,711
5,524
2,743
6,215
22,976
3,727
4,454
3,259
6,198
Source: Harbor Department of the City of Los Angeles
10
PORT OF LOS ANGELES
COMPARATIVE SUMMARY OF STATEMENT OF REVENUES AND EXPENSES
FISCAL YEAR 2004 THROUGH 2008(1)
( in thousands)
2008
$ 426,345
2007
$ 417,161
2006
$ 392,159
2005
$ 355,629
2004
$ 332,254
Operating and administrative expenses
Income before depreciation
Provision for depreciation
221,752
204,593
78,295
163,775
253,386
88,106
184,132
208,027
98,779
170,891
184,738
70,040
130,174
202,080
67,934
Income from operations
126,298
165,280
109,248
114,698
134,146
Non-operating revenues (expenses):
Other income and expenses, net
Income from investments
Interest expense on bonds and notes payable
(2,536)
39,303
(38,052)
11,018
28,448
(50,038)
7,222
13,884
(37,787)
11,842
10,809
(42,279)
(13,724)
5,093
(43,034)
(1,285)
14,161
(10,572)
(18,146)
(16,681)
2,044
(19,628)
-
(51,665)
(1,651)
Total operating revenues
Net non-operating revenues
Capital Contributions
Change in net assets
$ 139,174
$ 136,562
$
94,611
$
95,070
$
80,830
(1)
Fiscal Year ended June 30.
Source: Harbor Department of the City of Los Angeles
MAJOR TENANTS OF THE PORT OF LOS ANGELES
As of June 30, 2008
California Cartage Co.
China Shipping
Del Monte
Eagle Marine Services Ltd. (subsidiary of American President Lines Ltd.)
Evergreen Marine Corp.
Exxon-Mobil
GATX Terminals (subsidiary of Kinder-Morgan)
Maersk Pacific Ltd. (APM)
Parking Concepts
Pasha Stevedoring & Terminals, LP
_____________________________________________
Source: Harbor Department of the City of Los Angeles
Princess Cruises
Royal Caribbean Cruise Lines
SA Recycling
Shell Oil Company
SP/Union Pacific Railroad
Trans Pacific Container Services (subsidiary of Mitsui OSK Lines Ltd.)
Vopak International
WWL Vehicle Services Americas
Yang Ming Transport Ltd.
Yusen Terminals Inc. (subsidiary of NYK)
11
PORT OF LONG BEACH FINANCIAL AND OPERATING INFORMATION
THE HARBOR DEPARTMENT OF THE CITY OF LONG BEACH
OPERATING REVENUES
FISCAL YEARS ENDED SEPTEMBER 30, 2004 THROUGH 2008
(thousands)
2008
2007
2006
2005
2004
Berths and special facilities
Wharfage
Dockage
Rentals
Bunkers
Special facilities rental
Crane rentals
Other
Total berths and special facilities
$ 289,381
14,499
2,012
21,589
12,789
255
$ 340,525
$ 298,416
16,244
2,335
21,710
12,789
397
$ 351,891
$ 283,020
18,250
2,417
21,017
12,804
167
$ 337,676
$ 264,125
17,358
1,876
18,611
12,402
191
$ 314,563
$ 224,899
14,660
1,524
17,053
9,238
81
$ 267,456
Rental properties
Utilities/Miscellaneous
Subtotal
14,496
4,324
$ 18,819
14,633
4,308
$ 18,941
11,458
4,160
$ 15,619
10,926
3,719
$ 14,645
10,164
3,162
$ 13,326
Total operating revenues
$ 359,344
$ 370,832
$ 353,294
$ 329,207
$ 280,782
Source: Harbor Department of the City of Long Beach
[REMAINDER OF PAGE INTENTIONALLY LEFT BLANK]
12
THE HARBOR DEPARTMENT OF THE CITY OF LONG BEACH
REVENUE TONNAGE SUMMARY(1)
FISCAL YEARS ENDED SEPTEMBER 30, 2004 THROUGH 2008
(in metric revenue tons)
2008
2007
2006
2005
2004
103,777,099
14,785,341
118,562,440
116,834,397
16,088,293
132,922,690
114,723,789
17,367,762
132,091,551
102,144,682
21,023,918
123,168,600
89,294,993
18,582,633
107,877,626
37,529,273
4,075,297
2,088,496
43,693,066
162,255,506
32,233,158
5,059,516
2,459,654
39,752,328
172,675,018
28,648,207
4,649,824
2,624,618
35,922,649
168,014,200
26,753,401
5,974,166
2,010,674
34,738,241
157,906,841
22,280,780
6,019,842
1,531,283
29,831,905
137,709,531
654,434
654,434
361,503
361,503
401,575
401,575
229,142
229,142
313,044
313,044
GRAND TOTAL
162,909,940
173,036,521
168,415,775
158,135,983
138,022,575
Total inbound cargo
119,216,874
133,284,193
132,493,126
123,397,742
108,190,670
Total outbound cargo
43,693,066
39,752,328
35,922,649
34,738,241
29,831,905
6,736,756
7,361,881
7,166,771
6,644,080
5,355,972
Municipal berths
INBOUND CARGO
Foreign
Coastwise/Intercoastal
Total inbound cargo
OUTBOUND CARGO
Foreign
Coastwise/Intercoastal
Bunkers
Total outbound cargo
Total municipal cargo
Private Berths
Inbound
Outbound
Total private cargo
Container count in TEU’s
(1)
A metric revenue ton is equal to either 1,000 kilograms or one cubic meter.
Source: Harbor Department of the City of Long Beach
THE HARBOR DEPARTMENT OF THE CITY OF LONG BEACH
REVENUE TONNAGE BY CARGO TYPE
FISCAL YEARS ENDED SEPTEMBER 30, 2007 AND 2008
(in thousands of metric revenue tons) (1)(2)
Cargo Type
Containerized
Dry bulk
General cargo
Petroleum/liquid bulk
Total
Revenue
Tonnage
121,633
7,384
2,188
31,706
162,910
Percentage
of Total
75%
5%
1%
19%
100.0%
2008
Revenue
(000’s)(3)
$280,149
18,388
24,200
17,787
$340,525
Percent of
Revenue
82%
5%
7%
5%
100.0%
(1)
Revenue
Tonnage
127,816
7,947
2,673
34,601
173,037
Percentage
of Total
74%
5%
2%
20%
100.0%
2007
Revenue
(000’s)(3)
$289,650
18,027
25,361
18,852
$[_____]
Percent of
Revenue
82%
5%
7%
5]%
100.0%
Totals may not add due to rounding.
Reflects cargo handled at municipal berths only.
(3)
Total revenues includes operating revenues from wharfage, dockage, storage/demurrage, rentals, bunkers, special facilities rentals, crane
rentals and other sources.
Source: Harbor Department of the City of Long Beach
(2)
13
THE HARBOR DEPARTMENT OF THE CITY OF LONG BEACH
REVENUE TONNAGE BY TRADE ROUTE
FISCAL YEAR ENDED SEPTEMBER 30, 2008
(thousands of metric revenue tons)
Inbound
71,065
19,892
Far East (Asia)
Domestic
Western South America /
Mexico/Central America
India/Persian/Red Sea
Australia/New Zealand/Oceania
Western Europe
Eastern South America
Greece/Mediterranean
Canada
Africa
Caribbean
TOTAL
Outbound
29,653
9,298
% of
Total Volume
66.4%
19.3
Total
100,718
29,189
7,137
3,613
1,476
1,399
1,118
1,102
643
531
207
717
370
2,385
443
403
7
24
106
7
7,854
3,983
3,861
1,843
1,521
1,109
667
637
214
108,182
43,413
151,595
5.2
2.6
2.5
1.2
1.0
0.7
0.4
0.4
0.1
100.0%
Source: Harbor Department of the City of Long Beach
THE HARBOR DEPARTMENT OF THE CITY OF LONG BEACH
REVENUE TONNAGE BY LEADING TRADING PARTNERS
FISCAL YEARS ENDED SEPTEMBER 30, 2004 THROUGH 2008
(thousands of metric revenue tons)
2008
2007
2006
2005
2004
Inbound
China
Hong Kong
South Korea
Japan
Iraq
51,709
4,773
4,504
3,809
2,958
60,517
5,303
5,361
4,794
2,830
59,900
5,649
6,809
5,286
2,917
48,998
5,694
5,869
4,441
1,085
36,163
7,403
5,970
4,372
1,887
Outbound
China
Japan
South Korea
Taiwan
Hong Kong
9,165
5,779
3,898
3,164
3,013
9,771
4,874
3,476
1,958
2,448
8,811
4,366
3,180
967
1,934
7,834
3,357
3,013
990
1,746
6,551
3,027
2,720
697
1,299
Source: Harbor Department of the City of Long Beach
14
THE HARBOR DEPARTMENT OF THE CITY OF LONG BEACH
COMPARATIVE SUMMARY OF STATEMENT OF REVENUES AND EXPENSES
FISCAL YEARS ENDED SEPTEMBER 30, 2004 THROUGH 2008
(in thousands)
2007
2006
2005
2004
$ 340,525
14,496
4,324
$ 359,344
$ 351,891
14,633
4,308
$ 370,832
$ 337,676
11,458
4,160
$ 353,294
$ 314,563
10,926
3,718
$ 329,207
$ 267,456
10,164
3,162
$ 280,782
Port Operating Expenses:
Operating/Administrative
Depreciation/Amortization
Total Port Operating Expenses
116,166
79,497
$ 195,663
96,964
83,067
$180,031
75,541
85,465
$ 161,006
62,015
86,754
$ 148,769
54,207
82,921
$ 137,128
Income from operations
$ 163,681
$ 190,801
$ 192,288
$ 180,438
$ 143,654
2008
Port Operating Revenues:
Berths/Special Facilities
Rental Properties
Miscellaneous
Total Port Operating Revenues
Non-operating revenues (expenses)
Interest income
Interest expense, net of interest capitalized
Gain (Loss) on sale of property
Equity in income of joint ventures, net
Income (Loss) from Harbor oil operations
Capital grants
Clean Air Action Plan Income (Loss)
Other income (expense), net
Total non-operating income (expense)
33,347
(46,391)
(255)
4,441
31,153
3,742
(13,867)
1,047
13,218
43,374
(53,073)
0
4,675
(21,070)
10,020
28,302
(54,110)
(1,392)
4,302
6,126
2,298
17,964
(57,448)
(400)
3,535
13,541
2,208
13,450
(60,545)
(93)
2,795
1,807
5,752
1,267
(14,807)
(9,596)
(24,071)
(8,117)
(28,717)
(4,972)
(41,806)
Income before operating transfers
$ 176,899
$ 175,994
$ 168,218
$ 151,722
$ 101,848
Operating transfers
$ (16,059)
$ (15,400)
$ (14,222)
$
$
(6,851)
Increase in net assets - Net income
$ 160,840
$ 160,595
$ 153,995
$ 142,222
$
94,997
(9,500)
Source: Harbor Department of the City of Long Beach
MAJOR TENANTS OF THE HARBOR DEPARTMENT OF THE CITY OF LONG BEACH
AS OF SEPTEMBER 30, 2008
BP West Coast Products, LLC
California United Terminals
Catalyst Paper
CEMEX USA
Chemoil Corp.
Cooper / T. Smith Stevedoring Co. Inc.
Crescent Terminals, Inc.
International Transportation Service, Inc.
Jacobsen Pilot Service, Inc.
Koch Carbon, Inc.
Long Beach Container Terminal, Inc.
Matson Navigation Co.
Mercedes Benz U.S.A., LLC
Metropolitan Stevedore Company
Mitsubishi Cement Corporation
Oxbow Carbon & Minerals, LLC
Pacific Coast Recycling, LLC
Pacific Container Terminal / Pacific Maritime Services, Inc.
Sea Launch Company, LLC
SSA Marine – Long Beach
Tesoro
Thums Long Beach Company
Total Terminals International, LLC
Toyota Motor Sales, U.S.A., INC.
Weyerhauser Co.
Source: Harbor Department of the City of Long Beach
15
APPENDIX A
ALAMEDA CORRIDOR TRANSPORTATION AUTHORITY
BASIC FINANCIAL STATEMENTS FOR THE FISCAL YEARS ENDED JUNE 30, 2008 AND 2007
(WITH INDEPENDENT AUDITORS’ REPORT THEREON)
A-1
ALAMEDA CORRIDOR TRANSPORTATION AUTHORITY
Basic Financial Statements
June 30, 2008 and 2007
(With Independent Auditors’ Report Thereon)
ALAMEDA CORRIDOR TRANSPORTATION AUTHORITY
Table of Contents
Page
Independent Auditors’ Report
1
Management’s Discussion and Analysis
3
Basic Financial Statements:
Balance Sheets
10
Statements of Revenues, Expenses, and Changes in Net Assets
11
Statements of Cash Flows
12
Notes to Basic Financial Statements
13
KPMG LLP
Suite 2000
355 South Grand Avenue
Los Angeles, CA 90071-1568
Independent Auditors’ Report
The Governing Board
Alameda Corridor Transportation Authority:
We have audited the accompanying basic financial statements of the Alameda Corridor Transportation
Authority (the Authority) as of and for the years ended June 30, 2008 and 2007, as listed in the
accompanying table of contents. These basic financial statements are the responsibility of the Authority’s
management. Our responsibility is to express an opinion on these basic financial statements based on our
audits.
We conducted our audits in accordance with auditing standards generally accepted in the United States of
America and the standards applicable to financial audits contained in Government Auditing Standards,
issued by the Comptroller General of the United States. Those standards require that we plan and perform
the audit to obtain reasonable assurance about whether the financial statements are free of material
misstatement. An audit includes consideration of internal control over financial reporting as a basis for
designing audit procedures that are appropriate in the circumstances, but not for the purpose of expressing
an opinion on the effectiveness of the Authority’s internal control over financial reporting. Accordingly,
we express no such opinion. An audit also includes examining, on a test basis, evidence supporting the
amounts and disclosures in the financial statements, assessing the accounting principles used and the
significant estimates made by management, as well as evaluating the overall financial statement
presentation. We believe that our audits provide a reasonable basis for our opinion.
In our opinion, the basic financial statements referred to above present fairly, in all material respects, the
financial position of the Alameda Corridor Transportation Authority as of June 30, 2008 and 2007 and the
changes in its financial position and its cash flows for the years then ended in conformity with U.S.
generally accepted accounting principles.
In accordance with Government Auditing Standards, we have also issued our report dated November 4,
2008 on our consideration of the Authority’s internal control over financial reporting and on our tests of its
compliance with certain provisions of laws, regulations, contracts and grant agreements, and other matters.
The purpose of that report is to describe the scope of our testing of internal control over financial reporting
and compliance and the results of that testing, and not to provide an opinion on the internal control over
financial reporting or on compliance. That report is an integral part of an audit performed in accordance
with Government Auditing Standards and should be considered in assessing the results of our audits.
KPMG LLP, a U.S. limited liability partnership, is the U.S.
member firm of KPMG International, a Swiss cooperative.
Management’s discussion and analysis on pages 3 through 9 and the schedule of funding progress on
page 35 are not required parts of the basic financial statements but are supplementary information required
by U.S. generally accepted accounting principles. We have applied certain limited procedures, which
consisted principally of inquiries of management regarding the methods of measurement and presentation
of the required supplementary information. However, we did not audit the information and express no
opinion on it.
November 4, 2008
2
ALAMEDA CORRIDOR TRANSPORTATION AUTHORITY
Management’s Discussion and Analysis
June 30, 2008 and 2007
Description of Basic Financial Statements
The Alameda Corridor Transportation Authority (ACTA or the Authority) presents its basic financial statements
using the economic resources measurement focus and full accrual basis of accounting. The Authority’s basic
financial statements include a balance sheet, statement of revenues, expenses, and changes in net assets, and
statement of cash flows. The basic financial statements also include notes that explain the information presented
in the basic financial statements.
Financial Highlights
The assets of the Authority exceeded its liabilities (net assets) at June 30, 2008 and 2007 by $235,650,517 and
$281,087,392, respectively. Of this amount, $392,536,493 and $398,922,282, respectively, is invested in the
Authority’s capital assets, net of related debt, at June 30, 2008 and 2007. The Authority’s net assets decreased by
$45,436,875 and $34,076,101 in the years ended June 30, 2008 and 2007, respectively.
The Authority’s revenues included $480,061 and $1,859,335 in grants for the fiscal years ended June 30, 2008
and 2007, respectively. The majority of the grants were received from the State of California Department of
Transportation (Caltrans) for the State Route 47 Expressway and the Redondo Junction Grade Separation
projects.
The 2007 and 2008 fiscal years marked the fifth and sixth full years of operations for the Authority. The
Authority earned $97,964,403 and $98,720,958 from use fees, container charges, and maintenance-of-way
charges during fiscal years ended June 30, 2008 and 2007, respectively. The Authority’s use fees and container
charges for the year 2008 shorted the 2007 total by 0.8%. All of the operating revenues and a majority of
maintenance-of-way charges are received from the Union Pacific (UP) and Burlington Northern Santa Fe
(BNSF) railroads that utilize the Authority’s Alameda Corridor (Corridor).
Lastly, the Authority’s total revenues and remaining bond proceeds on hand were sufficient to cover debt service
payments for the year.
3
(Continued)
ALAMEDA CORRIDOR TRANSPORTATION AUTHORITY
Management’s Discussion and Analysis
June 30, 2008 and 2007
Condensed Financial Information
The following condensed financial information provides an overview of the Authority’s financial position for the
fiscal years ended June 30, 2008, 2007, and 2006:
Years ended June 30
2008
Change
between 2008
and 2007
Change
between 2007
and 2006
2007
2006
$ 1,946,229,844
62,323,123
276,149,033
1,973,473,299
65,742,146
258,584,940
1,987,249,328
69,211,136
245,521,843
(27,243,455)
(3,419,023)
17,564,093
(13,776,029)
(3,468,990)
13,063,097
Total assets
2,284,702,000
2,297,800,385
2,301,982,307
(13,098,385)
(4,181,922)
Liabilities:
Long-term liabilities
Other current liabilities
1,989,869,990
59,181,493
1,962,844,848
53,868,145
1,933,274,511
53,544,303
27,025,142
5,313,348
29,570,337
323,842
2,049,051,483
2,016,712,993
1,986,818,814
32,338,490
29,894,179
392,536,493
17,100,805
9,161,519
398,922,282
10,889,220
8,772,574
403,247,434
6,886,290
6,308,867
(6,385,789)
6,211,585
388,945
(4,325,152)
4,002,930
2,463,707
61,549,024
(244,697,324)
51,689,298
(189,185,982)
33,328,528
(134,607,626)
9,859,726
(55,511,342)
18,360,770
(54,578,356)
235,650,517
281,087,392
315,163,493
(45,436,875)
(34,076,101)
Assets:
Capital assets, net
Bond issuance costs
Other assets
Total liabilities
Net assets:
Invested in capital assets, net
of related debt
Restricted for debt service
Restricted for capital projects
Restricted by Master Trust
Indenture
Unrestricted
Total net assets
$
Net Assets
Net assets, the difference between assets and liabilities, decreased by $45.4 million, or 16.2%, and $34.1 million,
or 10.8%, during the years ended June 30, 2008 and 2007, respectively. The majority of this decrease is due to a
$55.8 million and $53.2 million increase in accrued interest payable during the years ended June 30, 2008 and
2007, respectively, as well as depreciation expense of $21.7 million and $22.7 million during the years ended
June 30, 2008 and 2007, respectively. The decrease is offset by a $23.2 million and $21.2 million decrease in the
outstanding bonds payable due to payment of principal in fiscal year 2008. The remaining offset to the decrease
in net assets is the result of the excess of nonoperating expenses, primarily interest expense, over operating
income for both 2008 and 2007 fiscal years.
The Master Trust Indenture
In conjunction with the sale of project revenue and refunding bonds in 1999 and 2004 (Bonds), the Authority
entered into a Master Trust Indenture (MTI) with US Bank, the bond trustee (Trustee), pursuant to which the
Authority assigned all of its rights, title, and interest in and to the Alameda Corridor project, including the receipt
of certain Use Fees and Container Charges and other revenues known as “ACTA revenues” to the Trustee as
security for the repayment of the Bonds. Pursuant to the terms of the MTI, the Trustee is required to establish
4
(Continued)
ALAMEDA CORRIDOR TRANSPORTATION AUTHORITY
Management’s Discussion and Analysis
June 30, 2008 and 2007
certain funds and accounts and to apply ACTA’s revenues for the purposes specifically set forth therein. The
MTI establishes debt service funds, debt service reserve funds, construction funds, maintenance and capital
reserve funds, and certain other restrictive funds. The MTI also establishes a priority of payments, which restricts
the manner, timing, and sequence of transfers into and out of such funds and accounts, and among such funds and
accounts. The MTI requires that the Authority comply with certain operational and financial covenants, restricts
the types of investments the Trustee and Authority may make, and requires regular financial reporting and
disclosure.
Capital Assets
Net capital assets, which are made up of property, plant, and equipment, decreased by $27.2 million, or 1.4%,
and $13.8 million, or 0.7%, between 2008 and 2007 and 2007 and 2006, respectively. These decreases are due
primarily to the depreciation of capital assets and the sale of ByPass Track project and partially offset by the
additional costs of ongoing capital projects during the years ended June 30, 2008 and 2007, respectively. The
Corridor was substantially complete on April 15, 2002, when revenue operations began. Most capital project
costs incurred on various elements of the Corridor were placed into service on July 1, 2002.
Bond Issuance Costs
No additional bond issuance costs were capitalized in 2008 or 2007. Amortization expense related to bond
issuance costs was $3.4 million and $3.5 million for fiscal years 2008 and 2007, respectively.
Other Assets
Other assets consist of cash, investments, receivables, condemnation deposits, and prepaid expenses. These assets
increased by $17.6 million, or 6.8%, during fiscal year 2008 and increased by $13.1 million, or 5.3%, during
fiscal year 2007, due primarily, in both years, to an increase in cash and investments.
Long-Term Liabilities
Long-term liabilities increased by $27.0 million, or 1.4%, in fiscal year 2008 compared to fiscal year 2007 due to
accrued interest on Capital Appreciation Bonds. Long-term liabilities increased by $29.6 million, or 1.5%, in
fiscal year 2007 compared to fiscal year 2006 also due to accrued interest on Capital Appreciation Bonds.
Other Current Liabilities
Other current liabilities consist of accounts payable, retention payable, right-of-way payable, deferred revenue,
other payables, as well as principal and interest currently due on the long-term bonds payable. Bonds payable,
current portion, increased $4.9 million due to an increase in the principal payments due in fiscal year 2009.
5
(Continued)
ALAMEDA CORRIDOR TRANSPORTATION AUTHORITY
Management’s Discussion and Analysis
June 30, 2008 and 2007
Maintenance-of-way revenues, representing 4.0% in fiscal year 2008 and 3.5% in fiscal year 2007 of operating
revenues, were $3.9 million and $3.5 million, respectively. Revenue from use fees (for actual railroad use of the
Corridor) and container charges (paid for containers that were trucked around the Corridor but left California by
rail) were $94.0 million and $95.2 million in fiscal years 2008 and 2007, respectively.
Operating Expenses
Operating expenses consist of salaries, benefits, administrative costs, professional services, maintenance-of-way,
and depreciation. Professional services were capitalized in years prior to 2005, due to the fact that those costs
were project related and charged to capital projects and subject to depreciation. A portion of the professional
services incurred during FY 2007 was capitalized and the remainder was included as administrative expenses
based on the specific tasks that were assigned and completed. During the years ended June 30, 2008 and 2007,
operating expenses decreased by $0.5 million, or 1.5%, and increased by $0.3 million, or 0.8%, respectively.
Depreciation expense accounted for the majority of the change with a decrease of $1.0 million, or 4.4%, and an
increase of $0.3 million, or 1.3%, due to the yearly depreciation of infrastructure and capital assets being placed
into service in 2008 and 2007, respectively.
Nonoperating Revenues and Expenses
Nonoperating revenues and expenses consist of interest and investment earnings, interest expense, grant
revenues, miscellaneous revenues, loss on sale of fixed assets, and amortization of bond issuance costs. During
the fiscal years ended June 30, 2008 and 2007, interest and investment income increased by $1.2 million, or
9.6%, and $3.8 million, or 45.9%, respectively. The increase in investment income is due to an increase in the
average investments held by the Authority, as well as an increase in the average interest rate earned. Interest
expense increased $2.0 million each in both 2008 and 2007. The increase in both years is due to an increase in
interest incurred on the 1999 and 2004 series bonds. Grant revenues decreased $1.4 million and $1.5 million, or
74.2% and 44.3%, in 2008 and 2007, respectively, due to completion of the PCH Project. Miscellaneous
revenues (expenses) decreased by $8.9 million due to the loss from sale of the ByPass Track.
Capital Assets and Debt Administration
At June 30, 2008, and 2007, the Authority had approximately $2.0 billion of capital assets and approximately
$2.0 billion of long-term debt outstanding.
Capital Assets
During fiscal years 2008 and 2007, the Authority expended $13.1 million and $9.6 million, respectively, on
capital project activities. The chart on the following page provides a summary of capital project expenditures by
type for the years ended June 30, 2008 and 2007.
7
(Continued)
ALAMEDA CORRIDOR TRANSPORTATION AUTHORITY
Management’s Discussion and Analysis
June 30, 2008 and 2007
Additional capital asset information can be found in note 5 to the basic financial statements.
Capital Project Costs by Type – Fiscal Year 2008
Highway Bridge
Structures
7%
Right-of-Way
2%
Equipment
1%
Trench Structures
2%
Rail Bridge Structures
5%
Track and Signals
84%
Capital Project Costs by Type – Fiscal Year 2007
Equipment
0%
Right-of-Way
22%
Highway Bridge
Structures
10%
Rail Bridge Structures
5%
Trench Structures
7%
Track and Signals
56%
Long-Term Debt
As of June 30, 2008 and 2007, the Authority’s total long-term debt in revenue bonds was $1.732 billion and
$1.760 billion, respectively, (net of the current portion amount of $28.0 million and $23.2 million, and
$3.8 million of unamortized discount, in fiscal year 2008 and in fiscal year 2007, respectively).
Additional debt information can be found in note 6 to the basic financial statements.
8
(Continued)
ALAMEDA CORRIDOR TRANSPORTATION AUTHORITY
Management’s Discussion and Analysis
June 30, 2008 and 2007
Other Developments
The Authority’s Alameda Corridor Project opened on schedule, April 15, 2002. On that date, the Authority
commenced operations and began collecting revenues for intermodal containers and rail cars using the
Authority’s Alameda Corridor, as authorized in the Use and Operating Agreement between the Authority and the
participating railroads (Use and Operating Agreement). The first cash collections were received from the
railroads in June 2002 as required by the Use and Operating Agreement. Since the Corridor’s opening, actual
cash collections of nearly $452.4 million have been received from the railroads. These revenues, combined with
remaining interest income, have been more than sufficient to meet debt service, fund reserve account required
deposits, and pay the cost of revenue collections, monitoring, and administrative fees.
The Authority’s program manager, Alameda Corridor Engineering Team (ACET), together with the Authority’s
staff are actively working to complete construction of the remaining original Alameda Corridor projects and
closing out completed projects. Most of the Authority’s largest projects either have reached completion or are on
the verge of final closeout, with minimal additional outstanding claims or unresolved issues.
The Authority’s Governing Board (the Board) modified the Alameda Corridor Project to include the addition of
several Corridor-related projects, consistent with the Authority’s Joint Powers Agreement, the Use and Operating
Agreement, and its bond-related documents. Significant among those projects are the PCH Project and a
feasibility study of the State Route 47 Expressway (SR47).
Also, the Board authorized an expanded mission for the Authority, many portions of which have been concluded.
The expanded mission includes:
1.
Assisting in the evaluation and implementation of extended operating hours of the cargo distribution
system (concluded with the implementation of PierPASS).
2.
Assisting the Ports of Los Angeles and Long Beach in optimizing the use of existing on-dock rail facilities
(concluded).
3.
Evaluating the viability of a shuttle train operation (determined to lack financial feasibility and railroad
support).
4.
Supporting the development of a new near-dock Intermodal Container Transfer Facility.
5.
Continuing the planning of an improved SR47.
6.
Participating in goods-movement studies in conjunction with the Los Angeles County Metropolitan
Transportation Authority (LACMTA) (concluded).
7.
Developing funding options and alternatives for such expanded mission activities, and authorizing
$3.2 million in initial funding (concluded).
8.
Evaluating opportunities for addressing near-port empty container storage issues (concluded).
The SR47 Project has progressed, and ACTA is currently working in conjunction with Caltrans to finalize the
EIR/EIS, to finalize project funding, and to begin the design and development of the new bridge and flyover.
9
ALAMEDA CORRIDOR TRANSPORTATION AUTHORITY
Balance Sheets
June 30, 2008 and 2007
Assets
Current assets:
Restricted cash and cash equivalents
Receivables, net of allowance of $3,979,848 at June 30, 2008 and 2007
Condemnation deposits
Prepaid expenses
$
Total current assets
Noncurrent assets:
Restricted cash and cash equivalents
Restricted investments
Bond issuance costs
Capital assets:
Buildings and equipment
Alameda Corridor project infrastructure, right-of-way, and land
improvements
Less accumulated depreciation
Capital assets, net
Total noncurrent assets
Total assets
2008
2007
59,181,493
14,160,845
15,805
1,727,065
53,868,145
16,441,236
39,840
1,431,220
75,085,208
71,780,441
49,898,939
151,164,886
62,323,123
57,409,518
129,394,981
65,742,146
10,575,816
10,760,127
2,064,598,293
(128,944,265)
2,071,765,352
(109,052,180)
1,946,229,844
1,973,473,299
2,209,616,792
2,226,019,944
$ 2,284,702,000
2,297,800,385
Liabilities
Current liabilities:
Accounts payable
Right-of-way acquisition payable
Contract retention payable
Deferred revenue
Accrued interest payable, current portion
Revenue bonds payable, current portion
Other liabilities
$
Total current liabilities
Noncurrent liabilities:
Accrued interest payable, net of current portion
Revenue bonds payable, net of current portion, and unamortized discount
Total noncurrent liabilities
Total liabilities
7,441,181
15,805
184,508
7,592,605
15,571,398
28,039,173
336,823
7,216,240
39,840
5,000
8,274,791
14,889,419
23,155,840
287,015
59,181,493
53,868,145
258,209,847
1,731,660,143
203,140,360
1,759,704,488
1,989,869,990
1,962,844,848
$ 2,049,051,483
2,016,712,993
Net Assets
Invested in capital assets, net of related debt
Restricted for debt service
Restricted for capital projects
Restricted by Master Trust Agreement
Unrestricted deficit
$
Total net assets
Total liabilities and net assets
See accompanying notes to basic financial statements.
10
392,536,493
17,100,805
9,161,519
61,549,024
(244,697,324)
398,922,282
10,889,220
8,772,574
51,689,298
(189,185,982)
235,650,517
281,087,392
$ 2,284,702,000
2,297,800,385
ALAMEDA CORRIDOR TRANSPORTATION AUTHORITY
Statements of Revenues, Expenses, and Changes in Net Assets
Years ended June 30, 2008 and 2007
2008
2007
94,048,421
3,915,982
95,220,756
3,500,202
97,964,403
98,720,958
2,218,692
3,016,835
1,720,580
4,902,139
21,673,838
1,939,188
3,597,946
1,218,151
4,612,400
22,661,287
Total operating expenses
33,532,084
34,028,972
Operating income
64,432,319
64,691,986
13,190,152
480,061
864,279
12,038,493
1,859,335
1,818,854
14,534,492
15,716,682
112,997,115
3,419,023
7,987,548
111,007,779
3,476,990
—
Total nonoperating expenses
124,403,686
114,484,769
Change in net assets
(45,436,875)
(34,076,101)
281,087,392
315,163,493
235,650,517
281,087,392
Operating revenues:
Use fees and container charges
Maintenance-of-way charges
$
Total operating revenues
Operating expenses:
Salaries and benefits
Administrative expenses
Professional services
Maintenance-of-way
Depreciation
Nonoperating revenues:
Interest and investment revenue, net
Grants
Miscellaneous revenue
Total nonoperating revenues
Nonoperating expenses:
Interest
Amortization of bond issuance costs
Loss from sale of fixed assets
Total net assets – beginning of year
Total net assets – end of year
$
See accompanying notes to basic financial statements.
11
ALAMEDA CORRIDOR TRANSPORTATION AUTHORITY
Statements of Cash Flows
Years ended June 30, 2008 and 2007
2008
2007
98,893,798
(10,237,172)
(2,168,884)
100,730,654
(11,599,520)
(1,885,646)
86,487,742
87,245,488
1,655,058
864,279
5,684,350
1,818,854
2,519,337
7,503,204
(13,086,103)
10,668,172
(23,155,840)
(57,250,821)
(9,554,812)
—
(21,148,982)
(57,895,827)
(82,824,592)
(88,599,621)
(152,265,119)
130,898,327
12,987,074
(131,225,763)
104,803,422
9,179,356
Net cash used in investing activities
(8,379,718)
(17,242,985)
Net decrease in cash and cash equivalents
(2,197,231)
(11,093,914)
111,277,663
122,371,577
$
109,080,432
111,277,663
$
64,432,319
64,691,986
21,673,838
22,661,287
929,395
(301,772)
(295,846)
49,808
2,009,695
(2,130,334)
(40,689)
53,543
86,487,742
87,245,488
Cash flows from operating activities:
Receipts from customers for services
Payment to suppliers for good and services
Payment to employees
$
Net cash provided by operating activities
Cash flows from noncapital financing activities:
Grants
Miscellaneous revenue
Net cash provided by noncapital financing activities
Cash flows from capital and related financing activities:
Purchases of capital assets
Sales of capital assets
Principal paid on notes and bonds payable
Interest payments on capital debt
Net cash used in capital and related financing activities
Cash flows from investing activities:
Purchases of investments
Sales of investments
Interest received
Cash and cash equivalents, beginning of year
Cash and cash equivalents, end of year
Reconciliation of operating income to net cash provided by
operating activities:
Operating income
Adjustments to reconcile operating income to net cash
provided by operating activities:
Depreciation expense
Change in assets and liabilities:
Accounts receivable
Accounts payable, other payables and deferred revenue
Prepaid expenses
Other liabilities
Net cash provided by operating activities
See accompanying notes to basic financial statements.
12
$
ALAMEDA CORRIDOR TRANSPORTATION AUTHORITY
Notes to Basic Financial Statements
June 30, 2008 and 2007
(1)
Organization and Summary of Significant Accounting Policies
(a)
Reporting Entity
The Alameda Corridor Transportation Authority (ACTA or the Authority) was established in
August 1989 through a Joint Exercise of Powers Agreement (JPA) between the cities of Los Angeles
and Long Beach, California. The purpose of the Authority is to acquire, construct, finance, and
operate a consolidated transportation corridor, including an improved railroad expressway between
the ports of Los Angeles and Long Beach (collectively known as the Ports) and downtown Los
Angeles (the route between the two locations has become known as the Alameda Corridor).
The Authority’s independent Governing Board has seven members, comprised of two members each
from the Ports, one member each from the cities of Los Angeles and Long Beach, and one member
representing the Los Angeles County Metropolitan Transportation Authority (LACMTA).
As of June 30, 2008, the members of the Authority’s Governing Board were:
Chairperson – Hon. Bonnie Lowenthal, Vice Mayor, City of Long Beach
Vice Chairperson – Hon. Janice Hahn, Councilwoman, City of Los Angeles
Member – Mr. Don Knabe, Supervisor, County of Los Angeles and Chairperson, LACMTA
Member – Dr. Geraldine Knatz, Executive Director, Port of Los Angeles
Member – Mr. Richard Steinke, Executive Director, Port of Long Beach
Member – Hon. Douglas Krause, Commissioner, Port of Los Angeles
Member – Mr. James C. Hankla, President, Port of Long Beach.
The Authority is empowered to explore alternative methods of financing, to develop existing
property, and to coordinate other governmental efforts necessary for a consolidated transportation
corridor, including the completion of the Alameda Corridor Project (the Project). The Authority may
issue revenue bonds to carry out its obligations under the JPA. Such bonds will be payable from
revenues generated from the Alameda Corridor, from one or more pledges of revenues from the
Authority, the Board of Harbor Commissioners of Long Beach and Los Angeles, from pledges of
revenues from other responsible agencies, or from any other legally available funds.
(b)
Program Management Agreement
In January 1996, the Authority’s Governing Board entered into a 10-year Program Management
Agreement (Agreement) with the Alameda Corridor Engineering Team (ACET), a joint venture
comprised of Daniel, Mann, Johnson, and Mendenhall (now DMJM Harris); Moffatt and Nichol
Engineers; Jenkins, Gales, and Martinez, Inc.; and TELACU Construction Management, Inc., to
provide the broad program management services necessary to assist the Authority in implementing
the Corridor. The Agreement calls for ACET to provide the Authority with professional services
related to management, engineering, construction support, procurement, coordination, and
13
(Continued)
ALAMEDA CORRIDOR TRANSPORTATION AUTHORITY
Notes to Basic Financial Statements
June 30, 2008 and 2007
administration of the Alameda Corridor Project Construction Program. This agreement was amended
twice by the Governing Board and is now extended through December 2013.
(c)
Use and Operating Agreement
In October 1998, the cities of Long Beach and Los Angeles, the Authority, Union Pacific railroad
(UP), and Burlington Northern Santa Fe Railway Company (BNSF) entered into a use and operating
agreement (the Use and Operating Agreement). The Use and Operating Agreement outlines the
provisions for the construction, operation, and use of the Rail Corridor (as defined in the Use and
Operating Agreement). Specifically, it grants UP and BNSF the right to use the Rail Corridor
constructed by the Authority for all Through Train (as defined in the Use and Operating Agreement)
movements upon substantial completion in exchange for paying maintenance, operating charges,
container charges, and use fees to the Authority. Proceeds of the container charges and use fees will
be used to repay the revenue bonds.
(d)
Master Trust Indenture
In conjunction with the sale of project revenue and refunding bonds in 1999 and 2004 (Bonds), the
Authority entered into a Master Trust Indenture (MTI) with US Bank, the bond trustee (Trustee),
pursuant to which the Authority assigned all of its rights, title, and interest in and to the Alameda
Corridor Project, including the receipt of certain Use Fees and Container Charges and other revenues
known as “ACTA revenues” to the Trustee as security for the repayment of the Bonds. Pursuant to
the terms of the MTI, the Trustee is required to establish certain funds and accounts and to apply
ACTA’s revenues for the purposes specifically set forth therein. The MTI establishes debt service
funds, debt service reserve funds, construction funds, maintenance and capital reserve funds, and
certain other restrictive funds. The MTI also establishes a priority of payments, which restricts the
manner, timing, and sequence of transfers into and out of such funds and accounts, and among such
funds and accounts. The MTI requires that the Authority comply with certain operational and
financial covenants, restricts the types of investments the Trustee and Authority may make, and
requires regular financial reporting and disclosure.
(e)
Basis of Presentation
The basic financial statements of the Authority have been prepared in conformity with U.S. generally
accepted accounting principles (GAAP) as applied to governmental units. The Governmental
Accounting Standards Board (GASB) is the recognized standard-setting body for establishing
governmental accounting and financial reporting principles for state and local governments within
the United States of America.
In accordance with GAAP, the Authority’s operations are accounted for as a business-type activity.
In this regard, the Authority follows the economic resources measurement focus and the accrual
basis of accounting, whereby revenues are recognized when they are earned, and expenses are
recorded when they are incurred, irrespective of when paid.
14
(Continued)
ALAMEDA CORRIDOR TRANSPORTATION AUTHORITY
Notes to Basic Financial Statements
June 30, 2008 and 2007
Under GAAP, the Authority has the option of consistently following or not following
pronouncements issued by the Financial Accounting Standards Board (FASB) subsequent to
November 30, 1989. The Authority has elected not to follow FASB standards issued after that date,
unless such standards are specifically adopted by GASB.
(f)
Cash and Cash Equivalents
The Authority has defined, for purposes of the preparation of its statements of cash flows, that cash
and cash equivalents include deposits, money market accounts, and investments with an original
maturity date of three months or less, including investments in the State of California Local Agency
Investment Fund (LAIF). As all cash and cash equivalents are restricted, cash and cash equivalents in
excess of current liabilities have been classified as noncurrent.
(g)
Investments
Investments are stated at fair value. The value of each investment security has been determined
based on the published closing price of the security as of June 30, 2008 and 2007. The net changes in
fair value of investments, consisting of realized gains or losses and the unrealized
appreciation/depreciation on those investments, have been included in interest and investment
revenue as shown in the accompanying statements of revenues, expenses, and changes in net assets.
The Authority’s investment practices are governed by a board-approved investment policy. The
types of investment authorized by the policy are described further in note 2.
The Authority participates in the State of California’s LAIF, a non-Securities and Exchange
Commission registered investment pool open to all government units in the State of California.
(h)
Capital Assets
Capital assets purchased or constructed are carried at cost, including capitalized interest during
construction. Donated assets are valued at the estimated fair value on the date received. Depreciation
is provided over the estimated useful life of each asset and computed on a straight-line basis
beginning with the fiscal year after the asset is placed in service. Trench structures, tracks and
signals, rail bridge structures, and highway bridge structures include both depreciable and
nondepreciable components. The nondepreciable components comprised costs related to demolition,
excavation, backfill, utility relocation, right-of-way, and hazardous materials remediation.
15
(Continued)
ALAMEDA CORRIDOR TRANSPORTATION AUTHORITY
Notes to Basic Financial Statements
June 30, 2008 and 2007
Estimated useful lives of classes of capital assets are as follows:
Computer equipment/software
Tenant improvements
Automotive vehicles
Other equipment
Buildings
Right-of-way improvements and
hazardous materials remediation
Tracks and signal systems
Roads
Highway bridge structures
Trench structures
Rail bridge structures
3 years
3 years
5 years
3 – 5 years
30 years
Nondepreciable
40 years
50 years
100 years
100 years
100 years
Capital assets acquired with state and local grants are also included in property and equipment.
Depreciation on these assets is also included in the results of operations for the year.
(i)
Restricted Assets
Certain proceeds of the Authority’s revenue bonds, as well as certain resources set aside for their
repayment, are classified as restricted assets on the balance sheet because their use is limited by
applicable bond covenants. The revenue bonds’ capitalized interest, debt service reserve, indemnity,
and revenue fund accounts have been classified as restricted assets, because these accounts are first
restricted to the payment of interest and principal on the outstanding revenue bonds. After payment
of debt service, remaining revenues, if any, are restricted to the payment of the Authority’s other
costs and legal obligations (e.g., Port Shortfall Advances) as defined by the Authority’s Use and
Operating Agreement. The reserve account has also been classified as restricted assets, because the
amount in this account is restricted for specific purposes under the Use and Operating Agreement
and the revenue bond covenants.
Remaining long-term debt proceeds that have been set aside for capital projects are also reported as
restricted assets.
(j)
Operating Revenues and Expenses
Operating revenues and expenses generally result from the operation of the Rail Corridor. The
principal operating revenues of the Authority are fees assessed to the railroads for use and
maintenance of the Corridor. These fees are recognized in the period earned. Operating expenses
include revenue collection and other administrative expenses, maintenance, and depreciation on
capital assets. All revenues and expenses not meeting this definition are reported as nonoperating
revenues and expenses.
16
(Continued)
ALAMEDA CORRIDOR TRANSPORTATION AUTHORITY
Notes to Basic Financial Statements
June 30, 2008 and 2007
(k)
Compensated Absences
All Authority’s employees accumulate time off with payroll accrual for vacation and illness each pay
period. While sick hours are accrued at a uniform rate among all employees, vacation accrual is
based on length of service. Vacation hours are payable to employees when used at the employee’s
current rate of pay. Any unused vacation remaining at the time of termination is also payable to the
employee at his/her then rate of pay. All vacation hours that have been earned but not paid as of
June 30, 2008 and 2007 have been accrued in the accompanying basic financial statements. Sick
hours are paid to employees when used. ACTA’s sick leave policy also provides that employees will
be paid 50% of the remaining value of their sick leave hours upon termination. Consequently, 50%
of all unused sick hours for each employee totaling $119,899 and $102,035 as of June 30, 2008 and
2007, respectively, have also been accrued in other liabilities of the accompanying basic financial
statements.
(l)
Use of Estimates
The preparation of basic financial statements in conformity with GAAP requires that management
make estimates and assumptions that may affect the reported amount of assets and liabilities and
disclosure of contingent assets and liabilities at the date of the basic financial statements and the
reported amount of revenues and expenses during the reporting period. Actual results could differ
from those estimates.
(m)
Reclassifications
Certain reclassifications have been made to the 2007 financial statement information to conform to
the 2008 financial statement presentation. The changes were primarily related to the reclassification
of restricted cash and cash equivalents and restricted investments between current and noncurrent
assets.
(2)
Cash and Investments
Cash and investments as of June 30, 2008 and 2007 are classified in the accompanying basic financial
statements as follows:
June 30, 2008
fair value
Restricted cash and cash equivalents (current)
Restricted cash and cash equivalents (noncurrent)
Restricted investments
Total cash and investments
17
$
59,181,493
49,898,939
151,164,886
$
260,245,318
(Continued)
ALAMEDA CORRIDOR TRANSPORTATION AUTHORITY
Notes to Basic Financial Statements
June 30, 2008 and 2007
June 30, 2007
fair value
Restricted cash and cash equivalents (current)
Restricted cash and cash equivalents (noncurrent)
Restricted investments
Total cash and investments
(a)
$
53,868,145
57,409,518
129,394,981
$
240,672,644
Deposits
At June 30, 2008 and 2007, the net carrying amount of the Authority’s deposit account with Bank of
America was $1,509,274 and $2,232,638, while the corresponding bank balance was $1,626,943 and
$3,243,572, respectively. Outstanding checks account for the respective differences between the
carrying amounts and bank balances. Of the aforementioned bank balance, $100,000 is covered by
the Federal Deposit Insurance Corporation with the excess being secured with collateral of securities
held by the pledging financial institution’s trust or agent in the Authority’s name.
The California Government Code Section 53601 requires California banks and savings and loan
associations to secure a public agency’s deposits not covered by federal depository insurance by
pledging government securities as collateral. The carrying amount of pledged securities must equal
at least 110% of the agency’s deposits. California law also allows financial institutions to secure
agency deposits by pledging first trust deed mortgage notes having a value of 150% of the
Authority’s total deposits. The collateral must be held at the pledging bank’s trust department or
other bank acting as the pledging bank’s agent in the Authority’s name.
(b)
Investments
The Authority’s investments are invested pursuant to the investment policy guidelines adopted by the
Governing Board of the Authority. The objectives of the policy are, in order of priority, preservation
of capital, liquidity, and yield. The policy addresses the types of investment instruments and the
percentage of the portfolio in which the Authority may invest its funds as permitted by the California
Government Code. Generally, investments shall be made in the context of the “prudent investor”
rule.
(c)
Interest Rate Risk
Interest rate risk is the risk that changes in market interest rates will adversely affect the fair value of
an investment. Generally, the longer the maturity of an investment, the greater the sensitivity of its
fair value to changes in the market interest rates. One of the ways that the Authority manages its
exposure to interest rate risk is by purchasing a combination of short-term and medium-term
investments, and by timing cash flows from maturities so that a portion of the portfolio is maturing
or coming close to maturity evenly over time as necessary to provide the cash flow and liquidity
needed for operations. The Authority monitors the interest rate risk inherent in its portfolio by
measuring the weighted average maturity of its portfolio. The Authority has no specific limitations
with respect to this metric.
18
(Continued)
ALAMEDA CORRIDOR TRANSPORTATION AUTHORITY
Notes to Basic Financial Statements
June 30, 2008 and 2007
Under provision of the Authority’s investment policy, and in accordance with Section 53601 of the
California Government Code, the Authority may invest in the following types of investments:
Authorized investment type
ACTA bonds
U.S. Treasury bills, notes, or bonds
State warrants or bonds
U.S. local agency bonds, notes, or
warrants
Federal agency obligations
Callable federal agency securities
Bankers’ acceptances
Commercial paper
Negotiable certificates of deposit
Repurchase agreements
State of California Local Agency
Investment Fund (LAIF)
Time deposits
L.A. County Treasurer Investment
Pool
Money market funds
Medium-term maturity corporate notes
Mortgage- or asset-backed securities
Maximum
maturity
Maximum
percentage
of portfolio
Maximum
investment
in one issuer
N/A
5 years
None
None
None
None
N/A
None
None
None
5 years
5 years
180 days
270 days
2 years
90 days
None
None
20%
40
25
30
50
None
None
None
10%
10
None
None
N/A
1 year
None
15%
None
None
N/A
None
None
5 years
None
20%
30
20
None
10%
10
None
The MTI allows for exception of the maximum maturity prescript in the Authority’s investment
policy. The Authority is allowed a maximum maturity of 10 years for investments in the debt service
reserve funds.
19
(Continued)
ALAMEDA CORRIDOR TRANSPORTATION AUTHORITY
Notes to Basic Financial Statements
June 30, 2008 and 2007
The following schedules indicate the interest rate risk of the Authority’s investments as of June 30,
2008 and 2007:
2008
Cash and investment type:
Cash
Money market fund
LAIF
U.S. Treasury notes
U.S. corporate notes
Commercial paper
Federal agency obligations
$
500
7,809,499
3,705,454
12,691,170
21,815,541
20,422,480
193,800,674
—
—
—
4.28
1.68
0.10
1.01
$
260,245,318
1.11
2007
Cash and investment type:
Cash
Money market fund
LAIF
U.S. Treasury notes
U.S. corporate notes
Commercial paper
Federal agency obligations
$
$
20
Weighted
average
maturity
(in years)
Weighted
average
maturity
(in years)
500
5,046,895
3,183,819
8,451,472
22,345,653
23,499,294
178,145,011
—
—
4.24
1.62
0.11
1.12
240,672,644
1.14
(Continued)
ALAMEDA CORRIDOR TRANSPORTATION AUTHORITY
Notes to Basic Financial Statements
June 30, 2008 and 2007
(d)
Disclosures Relating to Credit Risk
Generally, credit risk is the risk that an issuer of an investment will not fulfill its obligation to the
holder of the investment. This is measured by the assignment of a rating by a nationally recognized
statistical rating organization. Presented below is the minimum of a rating by (where applicable) the
Authority’s Investment Policy, debt agreements, and the actual rating as of year-end for each
investment type:
Not rated
Investment type:
Cash and money
market fund
$
LAIF
U.S. Treasury
notes
U.S. corporate
notes
Commercial paper
Federal agency
obligations
Totals
$
Totals
$
Ratings as of June 30, 2008
A+ & AA+
A
A-1
AA-
A-1+
A- & TSY
Total
1,509,774
3,705,454
6,300,225
—
—
—
—
—
—
—
—
—
—
—
—
—
7,809,999
3,705,454
—
—
—
—
—
—
—
12,691,170
12,691,170
—
—
3,749,358
—
3,118,067
—
8,909,653
—
6,038,463
—
—
9,069,772
—
11,352,708
—
—
21,815,541
20,422,480
—
58,861,263
—
—
—
—
134,939,411
—
193,800,674
5,215,228
68,910,846
3,118,067
8,909,653
6,038,463
9,069,772
146,292,119
12,691,170
260,245,318
AAA & AA
AA-
Not rated
Investment type:
Cash and money
market fund
$
LAIF
U.S. Treasury
notes
U.S. corporate
notes
Commercial paper
Federal agency
obligations
AAA & AA
Ratings as of June 30, 2007
A+ & AA+
A
A-1
A-1+
A- & TSY
Total
2,298,345
3,183,819
2,749,050
—
—
—
—
—
—
—
—
—
—
—
—
—
5,047,395
3,183,819
—
—
—
—
—
—
—
8,451,472
8,451,472
—
—
2,828,468
—
3,941,901
—
6,404,970
—
7,909,612
—
—
7,388,048
—
16,111,246
1,260,702
—
22,345,653
23,499,294
—
178,145,011
—
—
—
—
—
—
178,145,011
5,482,164
183,722,529
3,941,901
6,404,970
7,909,612
7,388,048
16,111,246
9,712,174
240,672,644
21
(Continued)
ALAMEDA CORRIDOR TRANSPORTATION AUTHORITY
Notes to Basic Financial Statements
June 30, 2008 and 2007
(e)
Concentration of Credit Risk
The Authority’s Investment Policy contains no limitations on the amount that can be invested in any
one issuer beyond that stipulated by the California Government Code. Investments in any one issuer
(other than U.S. Treasury securities, mutual funds, and external investment pools) that represent 5%
or more of the total Authority’s investments are as follows:
Federal Home Loan Bank
Fannie Mae
Federal Home Loan
Mortgage Corp.
2008
2007
Federal agency obligations $
Federal agency obligations
54,792,653
76,534,192
29,929,683
78,272,121
Federal agency obligations
55,497,630
67,759,132
186,824,475
175,960,936
$
(f)
Investment in State of California Local Agency Investment Pool
The Authority is a voluntary participant in the LAIF that is regulated by the California Government
Code under the oversight of the Treasurer of the State of California. The fair value of the Authority’s
investment in this pool is reported in the accompanying basic financial statements as cash
equivalents at amounts based upon the Authority’s pro rata share of the fair value provided by LAIF
for the entire LAIF portfolio. The balance available for withdrawal is based on the accounting
records maintained by LAIF, which is recorded on an amortized cost basis. At June 30, 2008 and
2007, the fair value of the balance of such deposits is $3,705,454 and $3,183,819, respectively.
(g)
Risks and Uncertainties
Recent market conditions have resulted in an unusually high degree of volatility and increased the
risks associated with certain investments held by the Authority, which could impact the value of
investments after the date of these financial statements.
(3)
Receivables
Receivables consist of grants, use fees, and other amounts due from private entities. The following
provides a summary of the amounts of accounts and other receivables:
June 30
2008
Grants receivable
Interest receivable
Use fees receivable, net of allowance of $3,979,848 and
$3,979,848 at June 30, 2008 and 2007, respectively
Other receivables
Total
$
$
22
2007
1,176,588
1,815,493
2,351,585
2,015,527
10,727,995
440,769
11,708,400
365,724
14,160,845
16,441,236
(Continued)
ALAMEDA CORRIDOR TRANSPORTATION AUTHORITY
Notes to Basic Financial Statements
June 30, 2008 and 2007
(4)
Capital Assets
The following schedule summarizes capital assets for the years ended June 30, 2008 and 2007:
Balance,
July 1, 2007
Right-of-way and land improvements,
not being depreciated
$
Additions
Deletions
Balance,
June 30, 2008
154,506,480
242,268
(2,517,282)
152,231,466
456,384
622,038
186,825
72,334
1,102,594
—
—
—
—
—
(374,287)
(20,024)
—
—
—
82,097
602,014
186,825
72,334
1,102,594
8,319,952
210,000
10,760,127
210,000
(394,311)
10,575,816
715,152,056
205,011,379
408,814,608
148,854,351
194,687
10,590,122
519,253
686,884
—
(17,525,880)
—
—
715,346,743
198,075,621
409,333,861
149,541,235
224,033,204
66,984,578
101,953,808
60,989
349,988
74,807
—
—
—
224,094,193
67,334,566
102,028,615
46,454,888
157,105
—
46,611,993
Alameda Corridor Project
Infrastructure
1,917,258,872
12,633,835
(17,525,880)
1,912,366,827
Total fixed assets
2,082,525,479
13,086,103
(20,437,473)
2,075,174,109
(51,959,200)
(14,461,637)
(25,908,809)
(8,500,333)
(439,569)
(738,551)
(18,456)
(72,337)
(217,456)
(10,423,963)
(3,167,001)
(5,289,619)
(1,987,605)
(16,814)
(35,977)
—
—
(36,753)
—
1,387,442
—
—
374,287
188,393
(168,369)
—
—
(62,383,163)
(16,241,196)
(31,198,428)
(10,487,938)
(82,096)
(586,135)
(186,825)
(72,337)
(254,209)
(6,735,832)
(716,106)
(109,052,180)
(21,673,838)
1,781,753
(128,944,265)
1,973,473,299
(8,587,735)
(18,655,720)
1,946,229,844
Buildings and equipment:
Automotive vehicles
Office equipment
Other equipment
Tenant improvements
Buildings
Revenue assessment and
verification system
Total buildings and
equipment
Alameda Corridor Project Infrastructure:
Capital assets, being depreciated:
Trench structures
Track and signals
Rail bridge structures
Highway bridge structures
Capital assets, not being depreciated:
Trench structures
Track and signals
Rail bridge structures
Highway bridge structures of
the Corridor
Less accumulated depreciation for:
Trench structures
Track and signals
Rail bridge structures
Highway bridge structures
Automotive vehicles
Office equipment
Other equipment
Tenant improvements
Buildings
Revenue assessment and
verification system
Total accumulated
depreciation
Capital assets, net
$
23
—
—
8,529,952
(7,451,938)
(Continued)
ALAMEDA CORRIDOR TRANSPORTATION AUTHORITY
Notes to Basic Financial Statements
June 30, 2008 and 2007
Balance,
July 1, 2006
Right-of-way and land improvements,
not being depreciated
Buildings and equipment:
Automotive vehicles
Office equipment
Other equipment
Tenant improvements
Buildings
Revenue assessment and
verification system
$
Total buildings and
equipment
Alameda Corridor Project Infrastructure:
Capital assets, being depreciated:
Trench structures
Track and signals
Rail bridge structures
Highway bridge structures
Capital assets, not being depreciated:
Trench structures
Track and signals
Rail bridge structures
Highway bridge structures of
the Corridor
Additions
Deletions
(669,554)
Balance,
June 30, 2007
153,064,201
2,111,833
154,506,480
456,384
611,827
186,825
72,334
1,102,594
—
—
—
—
—
—
—
456,384
622,038
186,825
72,334
1,102,594
8,310,387
—
10,211
—
—
—
—
9,565
10,740,351
19,776
—
10,760,127
714,613,316
200,752,953
408,434,842
148,052,558
538,740
4,258,426
379,766
801,793
—
—
—
—
715,152,056
205,011,379
408,814,608
148,854,351
223,864,435
65,985,987
101,870,788
168,769
998,591
83,020
—
—
—
224,033,204
66,984,578
101,953,808
46,260,790
194,098
—
46,454,888
8,319,952
Alameda Corridor Project
Infrastructure
1,909,835,669
7,423,203
Total fixed assets
2,073,640,221
9,554,812
(41,543,090)
(11,269,328)
(20,619,190)
(6,512,728)
(439,569)
(670,334)
(15,775)
(71,123)
(180,703)
(10,416,110)
(3,192,309)
(5,289,619)
(1,987,605)
—
(68,217)
(2,681)
(1,214)
(36,753)
—
—
—
—
—
—
—
—
—
(51,959,200)
(14,461,637)
(25,908,809)
(8,500,333)
(439,569)
(738,551)
(18,456)
(72,337)
(217,456)
(5,069,053)
(1,666,779)
—
(6,735,832)
Less accumulated depreciation for:
Trench structures
Track and signals
Rail bridge structures
Highway bridge structures
Automotive vehicles
Office equipment
Other equipment
Tenant improvements
Buildings
Revenue assessment and
verification system
Total accumulated
depreciation
Capital assets, net
$
(86,390,893)
(22,661,287)
1,987,249,328
(13,106,475)
24
—
(669,554)
—
(669,554)
1,917,258,872
2,082,525,479
(109,052,180)
1,973,473,299
(Continued)
ALAMEDA CORRIDOR TRANSPORTATION AUTHORITY
Notes to Basic Financial Statements
June 30, 2008 and 2007
(5)
Bonds Payable
The 1999 Series A, B, C, and D Bonds and the 2004 Series A and B Bonds are payable solely from and
secured by a pledge of, among other revenues, use fees and container charges to be paid by the Union
Pacific Railroad Company and Burlington Northern Santa Fe Railway Company for use of the Project and
from shortfall advances to be paid under certain circumstances by the City of Long Beach, acting by and
through its Board of Harbor Commissioners, and the City of Los Angeles, acting by and through its Board
of Harbor Commissioners.
As of June 30, 2008 and 2007, the unamortized discount balance on the 1999 and 2004 Series Bonds was
$3,831,964 and $3,826,792, respectively. Interest on the 1999 Series A and C Capital Appreciation Bonds
for fiscal year 2008 and 2007, respectively, amounted to $12,401,472 and $11,657,192 and was recognized
in the accompanying statements of revenues, expenses, and changes in net assets for the years ended
June 30, 2008 and 2007, respectively.
(a)
1999 Series A Current Interest Bonds
The Series A Tax-Exempt Current Interest Lien Revenue Bonds (Series A) were issued by the
Authority in the aggregate amount of $444,440,000 on January 1, 1999. Proceeds from the sale of
this insured 1999 Series A Current Interest Bonds were used to finance a portion of the cost of
design and construction of the Project.
Interest on the 1999 Series A Current Interest Bonds is payable semiannually on April 1 and
October 1 of each year commencing April 1, 1999, with principal payments commencing October 1,
2006. The 1999 Series A Current Interest Bonds, which mature on October 1, 2029, bear interest at
rates ranging from 4.00% to 5.25%. The balance outstanding on the 1999 Series A Current Interest
Bonds at June 30, 2008 and 2007 is $435,755,000 and $443,705,000, respectively.
The 1999 Series A Current Interest Bonds due on or after October 1, 2010 are redeemable at the
option of the Authority on or after October 1, 2009, in whole or in part at any time, from any moneys
that may be provided for such purpose and at the redemption process set forth in the table below,
expressed as a percentage of the principal amount of such Series A Bonds, so redeemed plus accrued
interest to the date fixed for redemption:
Redemption period (both dates inclusive)
October 1, 2009 through September 30, 2010
October 1, 2010 through September 30, 2011
October 1, 2011 and thereafter
25
Redemption
price
(expressed as
a percentage
of principal
amount)
101.0%
100.5
100.0
(Continued)
ALAMEDA CORRIDOR TRANSPORTATION AUTHORITY
Notes to Basic Financial Statements
June 30, 2008 and 2007
The remaining debt service of the 1999 Series A Current Interest Bonds is as follows:
Annual debt service requirement
Principal
Interest
Total
Fiscal year(s):
2009
2010
2011
2012
2013
2014 – 2018
2019 – 2023
2024 – 2028
2029 – 2030
Total
(b)
$
8,605,000
9,310,000
10,045,000
10,850,000
11,700,000
73,125,000
102,885,000
140,315,000
68,920,000
21,422,285
21,006,724
20,542,981
20,025,819
19,465,944
87,072,748
64,862,238
35,296,425
3,497,000
30,027,285
30,316,724
30,587,981
30,875,819
31,165,944
160,197,748
167,747,238
175,611,425
72,417,000
$
435,755,000
293,192,164
728,947,164
1999 Series A Capital Appreciation Bonds
The Series A Tax-Exempt Capital Appreciation Lien Revenue Bonds (1999 Series A CABs) were
issued by the Authority in the aggregate amount of $50,453,617 on February 2, 1999. Proceeds from
the sale of these insured 1999 Series A CABs were used to finance a portion of the cost of design
and construction of the Alameda Corridor Project.
The first maturity of the bonds will commence on October 1, 2030. The 1999 Series A CABs, which
mature between October 1, 2030 and October 1, 2037, have an accretion yield to maturity at rates
ranging from 5.25% to 5.27%. The principal and accrued interest balance outstanding on the 1999
Series A CABs at June 30, 2008 and 2007 are $50,453,617 and $31,941,734 and $50,453,617 and
$27,751,685, respectively. The 1999 Series A CABs are not subject to optional redemption.
The remaining debt service of the 1999 Series A CABs is as follows:
Annual debt service requirement
Principal
Interest
Total
Fiscal year(s):
2029 – 2033
2034 – 2038
Total
(c)
$
20,988,875
29,464,742
93,016,125
168,280,259
114,005,000
197,745,001
$
50,453,617
261,296,384
311,750,001
1999 Series C Current Interest Bonds
The Series C Taxable Current Interest Lien Revenue Bonds (1999 Series C Current Interest Bonds)
were issued by the Authority in the aggregate amount of $430,155,000 on January 1, 1999. Proceeds
from the sale of these insured 1999 Series C Current Interest Bonds were used to finance a portion of
the cost of the design and construction of the Project.
26
(Continued)
ALAMEDA CORRIDOR TRANSPORTATION AUTHORITY
Notes to Basic Financial Statements
June 30, 2008 and 2007
Interest on the 1999 Series C Current Interest Bonds is payable semiannually on April 1 and
October 1 of each year commencing April 1, 1999, with principal payments commencing October 1,
2015. The 1999 Series C Current Interest Bonds, which mature on October 1, 2029, bear interest at
rates ranging from 6.50% to 6.60%. The principal balance outstanding on the 1999 Series C Current
Interest Bonds is $430,155,000 and $430,155,000 at June 30, 2008 and 2007, respectively. The 1999
Series C Current Interest Bonds are not subject to optional redemption.
The remaining debt service of the Authority’s 1999 Series C Current Interest Bonds is as follows:
Annual debt service requirement
Principal
Interest
Total
Fiscal year(s):
2009
2010
2011
2012
2013
2014 – 2018
2019 – 2023
2024 – 2028
2029 – 2030
Total
(d)
$
—
—
—
—
—
72,765,000
56,910,000
197,775,000
102,705,000
28,260,555
28,260,555
28,260,555
28,260,555
28,260,555
134,053,813
102,931,650
68,537,865
6,904,755
28,260,555
28,260,555
28,260,555
28,260,555
28,260,555
206,818,813
159,841,650
266,312,865
109,609,755
$
430,155,000
453,730,858
883,885,858
1999 Series C Capital Appreciation Bonds
The Series C Taxable Capital Appreciation Lien Revenue Bonds (1999 Series C CABs) were issued
by the Authority in the aggregate amount of $67,298,396 on February 9, 1999. Proceeds from the
sale of these insured 1999 Series C CABs were used to finance a portion of the cost of the design and
construction of the Project.
The first maturity of the bonds will commence on October 1, 2020. The 1999 Series C CABs, which
mature between October 1, 2020 and October 1, 2037, have an accretion yield to maturity at rates
ranging from 6.69% to 6.83%. The principal balance and accrued interest outstanding on the 1999
Series C CABs at June 30, 2008 and 2007 are $67,298,396 and $59,187,068 and $67,298,396 and
$50,975,644, respectively. The 1999 Series C CABs are not subject to optional redemption.
27
(Continued)
ALAMEDA CORRIDOR TRANSPORTATION AUTHORITY
Notes to Basic Financial Statements
June 30, 2008 and 2007
The Authority’s remaining debt service on the 1999 Series C CABs is as follows:
Annual debt service requirement
Principal
Interest
Total
Fiscal year(s):
2019 – 2023
2024 – 2028
2029 – 2033
2034 – 2038
Total
(e)
$
22,052,990
—
19,430,060
25,815,346
75,812,010
—
154,424,940
275,724,654
97,865,000
—
173,855,000
301,540,000
$
67,298,396
505,961,604
573,260,000
1999 Series D Bonds
The Series D Taxable Subordinate Lien Revenue Bonds (1999 Series D Bonds) were issued by the
Authority in the aggregate principal amount of $145,635,000 on January 1, 1999. Proceeds from the
sale of these insured 1999 Series D Bonds were used to finance a portion of the cost of the design
and construction of the Project.
Interest on the 1999 Series D Bonds is payable semiannually on April 1 and October 1 of each year
commencing April 1, 1999, with principal payments commencing October 1, 2003. The 1999 Series
D Bonds, which mature on October 1, 2014, bear interest at rates ranging from 5.47% to 6.37%. The
principal balance outstanding on the 1999 Series D Bonds is $103,145,000 and $113,505,000 at
June 30, 2008 and 2007, respectively. The 1999 Series D Bonds are not subject to optional
redemption.
The Authority’s remaining debt service on the 1999 Series D Bonds is as follows:
Annual debt service requirement
Principal
Interest
Total
Fiscal year(s):
2009
2010
2011
2012
2013
2014 – 2015
Total
(f)
$
11,420,000
12,555,000
13,620,000
14,890,000
16,460,000
34,200,000
5,943,538
5,236,733
4,463,315
3,614,825
2,664,038
2,094,975
17,363,538
17,791,733
18,083,315
18,504,825
19,124,038
36,294,975
$
103,145,000
24,017,424
127,162,424
2004 Series A Capital Appreciation Bonds
The 2004 Series A Capital Appreciation Bonds Tax-Exempt Subordinate Lien Revenue Refunding
Bonds (2004 Series A Bonds) were issued by the Authority in the aggregate amount of $475,292,386
on April 22, 2004. Proceeds from the sale of these insured 2004 Series A Capital Appreciation
Bonds were used to refund the U.S. Department of Transportation Loan.
28
(Continued)
ALAMEDA CORRIDOR TRANSPORTATION AUTHORITY
Notes to Basic Financial Statements
June 30, 2008 and 2007
The 2004 Series A Bonds are capital appreciation bonds. Of the total $475,292,386 of 2004 Series A
Bonds issued, $200,300,100 are not convertible or callable, and $274,992,286 are convertible to
current interest bonds on October 1, 2012 and callable on October 1, 2017. The first maturity of the
bonds, which are not convertible or callable, will commence on October 1, 2012. The 2004 Series A
Bonds, which are not convertible or callable, mature between 2012 and 2030 and have an accretion
yield to maturity at rates ranging from 4.30% to 5.72%. The accrued interest for all 2004 Series A
Bonds is $114,610,606 and $84,676,653 at June 30, 2008 and 2007, respectively. The principal
balance outstanding on the 2004 Series A Bonds, which are not convertible or callable, at June 30,
2008 and 2007 was $200,300,100 and $200,300,100, respectively.
The Authority’s remaining debt service on the 2004 Series A Non-Convertible and Non-Callable
Bonds is as follows:
Annual debt service requirement
Principal
Interest
Total
Fiscal year(s):
2013
2014 – 2018
2019 – 2023
2024 – 2028
2029 – 2033
Total
$
3,052,968
83,621,154
77,276,558
—
36,349,420
1,312,032
62,343,846
93,528,441
—
121,330,580
4,365,000
145,965,000
170,804,999
—
157,680,000
$
200,300,100
278,514,899
478,814,999
The Authority’s remaining debt service on the 2004 Series A Convertible and Callable Bonds is as
follows:
Annual debt service requirement
Principal
Interest
Total
Fiscal year(s):
2013
2014 – 2018
2019 – 2023
2024 – 2028
Total
$
—
—
100,934,059
174,058,227
11,450,550
114,505,500
161,872,313
120,608,766
11,450,550
114,505,500
262,806,372
294,666,993
$
274,992,286
408,437,129
683,429,415
The 2004 Series A Bonds, which are convertible and callable, accrete to full face value of $5,000 per
bond on October 1, 2012. These bonds convert automatically and pay interest semiannually on
April 1 and October 1 of each year commencing with April 1, 2013. The first maturity of the 2004
Series A Bonds, which are convertible and callable, will commence on October 1, 2021. The 2004
Series A Bonds, which are convertible and callable, mature between 2021 and 2025 and bear interest
at rates ranging from 5.25% to 5.45%. These bonds are also callable at par, with accrued interest, if
any, on October 1, 2017 or any date thereafter. The principal balance outstanding on the 2004 Series
29
(Continued)
ALAMEDA CORRIDOR TRANSPORTATION AUTHORITY
Notes to Basic Financial Statements
June 30, 2008 and 2007
A Bonds, which are convertible and callable, was $274,992,286 and $274,992,286 at June 30, 2008
and 2007, respectively.
(g)
2004 Series B Capital Appreciation Bonds
The 2004 Series B Capital Appreciation Bonds Taxable Subordinate Lien Refunding Bonds
(2004 Series B Bonds) were issued by the Authority in the aggregate amount of $210,731,703 on
April 22, 2004. Proceeds from the sale of these insured 2004 Series B Bonds were used to repay the
U.S. Department of Transportation Loan.
The 2004 Series B Bonds are capital appreciation bonds with the first maturity commencing
October 1, 2006. The 2004 Series B Bonds mature between October 1, 2006 and October 1, 2033
and have an accretion yield to maturity at rates ranging from 3.05% to 6.33%. The 2004 Series B
Bonds are not subject to optional redemption. The principal balance and accrued interest outstanding
on the 2004 Series B Bonds are $201,431,881 and $52,470,439 and $206,277,723 and $39,736,378,
at June 30, 2008 and 2007, respectively.
The Authority’s remaining debt service on the 2004 Series B Capital Appreciation Bonds is as
follows:
Annual debt service requirement
Principal
Interest
Total
Fiscal year(s):
2009
2010
2011
2012
2013
2014 – 2018
2019 – 2023
2024 – 2028
2029 – 2033
2034 – 2037
Total
$
8,014,173
10,396,088
13,275,692
16,892,075
21,721,443
—
—
48,607,903
66,413,487
16,111,020
1,530,827
2,658,912
4,454,308
7,262,925
11,633,557
—
—
152,742,097
279,256,513
84,563,980
9,545,000
13,055,000
17,730,000
24,155,000
33,355,000
—
—
201,350,000
345,670,000
100,675,000
$
201,431,881
544,103,119
745,535,000
30
(Continued)
ALAMEDA CORRIDOR TRANSPORTATION AUTHORITY
Notes to Basic Financial Statements
June 30, 2008 and 2007
(h)
Accrued Interest Payable
The Authority’s accrued interest payable is as follows:
Current
interest bond
1999 Series A Bonds
1999 Series C Bonds
1999 Series D Bonds
2004 Series A Bonds
2004 Series B Bonds
Total
1999 Series A Bonds
1999 Series C Bonds
1999 Series D Bonds
2004 Series A Bonds
2004 Series B Bonds
Total
June 30, 2008
Long-term
CABs
Total
$
5,405,753
7,065,139
1,569,679
—
1,530,827
31,941,734
59,187,068
—
114,610,606
52,470,439
37,347,487
66,252,207
1,569,679
114,610,606
54,001,266
$
15,571,398
258,209,847
273,781,245
Current
interest bond
June 30, 2007
Long-term
CABs
Total
$
5,494,704
7,065,139
1,720,417
—
609,159
27,751,685
50,975,644
—
84,676,653
39,736,378
33,246,389
58,040,783
1,720,417
84,676,653
40,345,537
$
14,889,419
203,140,360
218,029,779
31
(Continued)
ALAMEDA CORRIDOR TRANSPORTATION AUTHORITY
Notes to Basic Financial Statements
June 30, 2008 and 2007
(i)
Combined 1999 and 2004 Debt Service
The Authority’s debt service of the 1999 Series A, B, C, and D Bonds and the 2004 Series A and B
Bonds, in aggregate, is as follows:
Annual debt service requirement
Principal
Interest
Total
Fiscal year(s):
2009
2010
2011
2012
2013
2014 – 2018
2019 – 2023
2024 – 2028
2029 – 2033
2034 – 2038
$
Total
28,039,173
32,261,088
36,940,692
42,632,075
52,934,411
263,711,154
360,058,608
560,756,131
314,806,841
71,391,107
57,157,205
57,162,924
57,721,159
59,164,124
74,786,675
400,070,881
499,006,652
377,185,153
658,429,914
528,568,893
85,196,378
89,424,012
94,661,851
101,796,199
127,721,086
663,782,035
859,065,260
937,941,284
973,236,755
599,960,000
$ 1,763,531,280
2,769,253,580
4,532,784,860
Long-term liability activity for the years ended June 30, 2008 and 2007 was as follows:
Balance,
July 1, 2007
Bonds payable:
1999 Series A Bonds
1999 Series C Bonds
1999 Series D Bonds
2004 Series A Bonds
2004 Series B Bonds
Total bonds
payable
Less unamortized bond
discounts
Interest payable:
Accrued interest payable
Net long-term
liabilities
Additions
Deletions
Balance,
June 30, 2008
Due within
one year
494,158,617
497,453,396
113,505,000
475,292,386
206,277,721
—
—
—
—
—
(7,950,000)
—
(10,360,000)
—
(4,845,840)
486,208,617
497,453,396
103,145,000
475,292,386
201,431,881
8,605,000
—
11,420,000
—
8,014,173
1,786,687,120
—
(23,155,840)
1,763,531,280
28,039,173
(3,826,792)
—
5,172
(3,831,964)
—
218,029,779
113,002,287
(57,250,821)
273,781,245
15,571,398
$ 2,000,890,107
113,002,287
(80,401,489)
2,033,480,561
43,610,571
$
32
(Continued)
ALAMEDA CORRIDOR TRANSPORTATION AUTHORITY
Notes to Basic Financial Statements
June 30, 2008 and 2007
Balance,
July 1, 2006
Bonds payable:
1999 Series A Bonds
1999 Series B Bonds
1999 Series C Bonds
1999 Series D Bonds
2004 Series A Bonds
2004 Series B Bonds
Total bonds
payable
Less unamortized bond
discounts
Interest payable:
Accrued interest payable
Net long-term
liabilities
(6)
$
Additions
Deletions
Balance,
June 30, 2007
Due within
one year
494,893,617
6,595,000
497,453,396
122,870,000
475,292,386
210,731,703
—
—
—
—
—
—
(735,000)
(6,595,000)
—
(9,365,000)
—
(4,453,982)
494,158,617
—
497,453,396
113,505,000
475,292,386
206,277,721
7,950,000
—
—
10,360,000
—
4,845,840
1,807,836,102
—
(21,148,982)
1,786,687,120
23,155,840
(3,794,827)
—
31,965
(3,762,862)
—
164,877,861
111,007,779
(57,855,861)
218,029,779
14,889,419
$ 1,968,919,136
111,007,779
(78,972,878)
2,000,954,037
38,045,259
Retirement Plan
(a)
Plan Description
Effective January 8, 1996, the Authority entered into a contract with the California Public Employee
Retirement System (CALPERS), an agent multiple employer, defined benefit pension plan, public
employee retirement system that acts as common investment and administrative agent for
participating public entities within the State of California. The Authority selects benefit provisions
by contract with CALPERS and adopts those benefits through Governing Board authorization.
CALPERS issues a separate comprehensive annual financial report. Copies of the CALPERS annual
financial report may be obtained from CALPERS Executive Office – 400 P Street, Sacramento, CA
95814.
All regular Authority’s employees who reach 1,000 hours in a fiscal year are eligible to participate in
CALPERS. Benefits vest after 5 years of service. Employees who retire at or after age 50, with 5
years of credited service, are entitled to an annual retirement benefit, payable monthly for life, in an
amount based on the average of the employee’s highest 12 consecutive monthly pay rates during
employment that varies from 1.426% at age 50 to a maximum of 2.418% at age 63 for each year of
credited service. The system also provides for death and survivor benefits. These benefit provisions
and all other requirements are established by State statute and the Authority’s Governing Board
authorization.
(b)
Funding Policy
Active members in the Plan are required to contribute 7% of their annual covered payroll. The
Authority pays this required employee contribution on behalf of its employees. The Authority is
required to contribute actuarially determined remaining amounts necessary to fund benefits for its
members. The actuarial methods and assumptions used are those adopted by CALPERS’ Board of
33
(Continued)
ALAMEDA CORRIDOR TRANSPORTATION AUTHORITY
Notes to Basic Financial Statements
June 30, 2008 and 2007
Administration. The required employer contribution rate was 12.70% and 13.42% for the years
ended June 30, 2008 and 2007, respectively. The Authority’s covered payroll for the employees
participating in CALPERS for the years ended June 30, 2008 and 2007 was $1,497,954 and
$1,328,187, respectively. Total payroll for fiscal years 2008 and 2007 was $1,556,627 and
$1,409,522, respectively.
The contribution requirements of the plan members are established by State statute, and the employer
contribution rate is established and may be amended by CALPERS.
(c)
Annual Pension Cost
For fiscal years 2008 and 2007, the Authority’s Annual Required Contribution (ARC) was $190,195
and $178,243, respectively, which the Authority contributed. The required contribution for 2008 and
2007 was determined as part of the June 2005 actuarial valuation using the entry-age-actuarial-cost
method with the contributions determined as a percentage of pay. The actuarial assumptions included
(a) 7.75% investment return (net of expenses), (b) projected salary increase of 3.25% – 14.45%
depending on age, service, and type of employment, (c) merit increase that varies by length of
service, and (d) payroll growth of 3.25%. Both (a) and (b) include an inflation component of 3.00%.
The actuarial value of the Plan’s assets was determined using a technique that smoothes the effect of
short-term volatility in the market value of investments over a three-year period. The Plan’s
unfunded accrued actuarial liability (UAAL) is amortized using a level-percentage-of-projectedpayroll method, on a closed basis over a 20-year period.
Annual
pension cost
(APC)
Fiscal year:
2000
2001
2002
2003
2004
2005
2006
2007
2008
$
65,210
199,017
180,802
177,695
185,119
216,150
201,711
178,243
190,195
34
Percentage of
APC
contributed
100% $
100
100
100
100
100
100
100
100
Net pension
obligation
—
—
—
—
—
—
—
—
—
(Continued)
ALAMEDA CORRIDOR TRANSPORTATION AUTHORITY
Notes to Basic Financial Statements
June 30, 2008 and 2007
Schedule of Funding Progress (Unaudited)
Valuation date
June 30, 1998
June 30, 1999
June 30, 2000
June 30, 2001
June 30, 2002
June 30, 2003
Entry age
normal accrued
liability
$
100,450
238,705
372,911
829,789
1,157,396
1,770,125
Actuarial
value of
assets
93,881
208,813
358,515
710,868
952,452
1,280,728
Funding status
Unfunded
liability
(excess assets) Funded status
6,569
29,892
14,396
118,921
204,944
489,397
93.46
87.48
96.14
85.67
82.29
72.35
Annual
covered
payroll
266,081
655,996
912,589
1,443,236
1,575,203
1,675,305
UAAL as a
percentage
of payroll
2.469
4.557
1.577
8.240
13.011
29.212
Effective with the June 30, 2003 actuarial valuation, the Authority was required to participate in a
risk pool within CALPERS because its Plan had less than 100 active members. Separate information
regarding the funding status is not available for the years ended June 30, 2004 through June 30,
2007.
(d)
Prefunding of OPEB
Effective fiscal year 2008, the Authority commenced prefunding of medical coverage as Other Post
Employment Benefits (OPEB) through participation in the California Employers’ Retiree Benefit
Trust (CERBT), an agent multiple employer plan. The Authority’s measure of OPEB liabilities is
scheduled on a biennial valuation cycle.
Schedule of Funding Progress and Employer Contributions
Annual Required
Percentage of ARC
Contribution (ARC)
contributed
Total OPEB costs
Fiscal year
2007-2008
$
80,000
100% $
2,572.05
The ARC for fiscal year 2007 – 2008 is $82,600, and the next Biennial Actuarial Valuation Date is
June 30, 2009.
(7)
Commitments and Contingencies
The Authority is subject to claims and lawsuits arising in the normal course of business. Such claims are
routinely evaluated by the Authority’s legal counsel. Management may make provisions for probable
losses if deemed appropriate on advice of legal counsel. To the extent provisions for damages are
considered necessary, appropriate amounts are reflected in the accompanying basic financial statements. It
is the opinion of the Authority’s management, based on consultation with legal counsel, that the estimated
liability for unreserved claims and suits will not have a material impact on the Authority’s basic financial
statements.
The Authority is exposed to various risks of loss related to torts; theft of, damage to, and destruction of
assets, errors, and omissions; and natural disasters for which the Authority carries commercial insurance.
In each of the past three fiscal years, the Authority has experienced no losses that have not been covered by
existing insurance policy limits.
35
(Continued)
ALAMEDA CORRIDOR TRANSPORTATION AUTHORITY
Notes to Basic Financial Statements
June 30, 2008 and 2007
The Use and Operating Agreement with the railroads provides for payment by the railroads to the
Authority for cargo that moves into or out of Southern California by rail. The Authority captures revenues
from cargo loaded on rail at Port facilities or trucked between nearby rail-loading facilities and the Ports
and invoices the railroads accordingly. However, the Authority has not been paid or has been underpaid by
the railroads for certain cargo, which the Authority believes is subject to payment of Use Fees or Container
Charges under the terms of the Use and Operating Agreement. These invoiced but uncollected amounts
have been reserved as 100% uncollectible.
The Authority is vigorously pursuing what it believes to be its entitlement to these revenues with both
railroads through negotiation and other available means at its disposal. Management of the Authority
believes it will continue to meet its outstanding debt obligations based on existing and projected revenues
supported by the contingent pledge of the Ports to repay up to 40% of the annual debt service requirement.
As a recipient of federal and state grant funds, the Authority is subject to periodic audits and compliance
reviews by, or on behalf of, the granting agencies to determine if the expenditure of granted funds has been
made in accordance with grant provisions. Such audits and compliance reviews could result in the potential
disallowance of expenditures claimed by the Authority. The Authority’s management believes that the
Authority has complied with the terms of its grant agreements and that the possible adverse effects, if any,
of disallowed grant expenditures that may be determined by the granting agencies upon the Authority
would not be material to the Authority.
36
APPENDIX B
PORT OF LOS ANGELES (HARBOR DEPARTMENT OF THE CITY OF LOS ANGELES),
A COMPONENT UNIT OF THE CITY OF LOS ANGELES, CALIFORNIA
FINANCIAL STATEMENTS FOR THE FISCAL YEARS ENDED JUNE 30, 2008 AND 2007
(WITH INDEPENDENT AUDITORS’ REPORT THEREON)
B-1
PORT OF LOS ANGELES
(HARBOR DEPARTMENT OF THE
CITY OF LOS ANGELES),
A COMPONENT UNIT OF THE
CITY OF LOS ANGELES, CALIFORNIA
Annual Financial Report
June 30, 2008 and 2007
(With Independent Auditor’s Report Thereon)
PORT OF LOS ANGELES
(HARBOR DEPARTMENT OF THE
CITY OF LOS ANGELES),
A COMPONENT UNIT OF THE
CITY OF LOS ANGELES, CALIFORNIA
Table of Contents
Page
Section I – Introduction
Letter of Transmittal
1
Organization Chart
5
Administrative Staff
6
Section II – Financial Statements
Independent Auditor's Report
7
Management’s Discussion and Analysis (Required Supplementary Information - Unaudited)
9
Financial Statements:
Statements of Net Assets
25
Statements of Revenues, Expenses, and Changes in Net Assets
27
Statements of Cash Flows
29
Notes to Financial Statements
31
Section III – Required Supplemental Information – Unaudited
Schedules of Funding Progress
98
Section IV – Supplemental Information – Unaudited
Capital Development Program Budget
100
Ten-Year Comparisons:
Schedule of Net Assets by Components
101
Schedule of Key Information on Revenue Statistics
102
Summary of Revenues, Expenses, and Changes in Net Assets
103
Schedule of Revenue Tonnage by Trade Routes
104
Summary of Debt Service Coverage (Pledged Revenue)
105
Highlights of Operating Information
106
December 17, 2008
Ms. Geraldine Knatz, Ph.D.
Executive Director
Port of Los Angeles
San Pedro, California
This Component Unit Financial Report of the Port of Los Angeles, Harbor Department of the City
of Los Angeles, California, for the years ended June 30, 2008 and 2007, is hereby submitted.
Introduction
The management of the Port of Los Angeles (the Port) has prepared this annual report. The
responsibility for both the accuracy of the presented data, and the completeness and fairness of the
presentation, including all disclosures, rests with the Port. To the best of management’s
knowledge and belief, the enclosed data are accurate in all material respects and are reported in a
manner designed to present fairly the financial position and changes in financial position of the
Port. All disclosures necessary to enable the reader to gain an understanding of the Port’s financial
activities have been included. The report contains the audited financial statements of the Port for
the years ended June 30, 2008 and 2007, which have received an unqualified opinion from the
Port’s independent auditors and are presented in accordance with Governmental Accounting
Standards Board Statement No. 34, Financial Statements – and Management’s Discussion and
Analysis – for State and Local Governments. The report is presented in four sections: Introduction,
Management’s Discussion and Analysis, Financial Statements, and Supplemental Information.
The introductory section outlines the relationship of the Port to the City of Los Angeles and
describes the organization and reporting entity. It additionally provides an overview of Port
properties, operations, and key statistical data.
The management’s discussion and analysis presents a comparative review of financial position
and changes in financial position for fiscal years 2008 and 2007. Also included in this section are
a description of current and proposed capital development plans, a discussion of prospective
revenue growth, and an overview of the economic conditions and the competitive environment in
which the Port operates.
The financial section includes the financial statements prepared on an accrual basis and using an
economic resources measurement focus. Management’s discussion and analysis, notes and the
auditor’s report accompany these financial statements. The financial statements are comprised of
statements of net assets that present the financial position of the Port as of June 30, 2008 and
2007; statements of revenues, expenses, and changes in net assets depicting financial performance
for fiscal years 2008 and 2007; and statements of cash flows that present the source and
application of funds from operations, financing, and investment activities for fiscal years 2008 and
2007. The accompanying notes to financial statements explain some of the information in the
financial statements and provide more detailed data.
The financial section includes the financial statements prepared on an accrual basis and using an
economic resources measurement focus. Management’s discussion and analysis, notes and the
auditor’s report accompany these financial statements. The financial statements are comprised of
statements of net assets that present the financial position of the Port as of June 30, 2008 and 2007;
statements of revenues, expenses, and changes in net assets depicting financial performance for
fiscal years 2008 and 2007; and statements of cash flows that present the source and application of
funds from operations, financing, and investment activities for fiscal years 2008 and 2007. The
accompanying notes to financial statements explain some of the information in the financial
statements and provide more detailed data.
The supplemental information section includes selected unaudited financial and statistical
information, generally presented on a multi-year basis that further explain and support the
information in the financial statements.
The Port of Los Angeles
The Port is a proprietary department of the City of Los Angeles (the City) and was created by the
City Charter to promote and develop a deep-water port facility. It is governed by a five-member
Board of Harbor Commissioners (the Board), which has the duty to provide for the needs of
commerce, navigation, and fishery for the citizens of California. It operates similar to a private
business and is substantially autonomous from the City. In accordance with generally accepted
accounting principles (GAAP), the accompanying financial statements are included as a
component unit of the City, based upon the primary oversight responsibility that the City Council
(the Council) and the City have on all matters affecting Port activities.
Also, based on the foregoing criteria of oversight responsibility and accountability of all Port
related entities, the operations of the Los Angeles Harbor Improvements Corporation, a nonprofit
corporation, have been included in the accompanying financial statements. Two joint ventures
with the Port of Long Beach have been recorded as investments of the Port in accordance with the
equity method of accounting. Until March 2007, the Port also participated in a shareholder
agreement that was created to form the Los Angeles Export Terminal (LAXT). Additional
information regarding these joint ventures and shareholders agreement may be found in the notes
to the financial statements for the Port.
The management and operation of the Port are under the direction of the Executive Director, who
is responsible for coordinating and directing the activities of several major management groups.
These groups fall under the responsibilities of the Deputy Executive Director of Development,
Deputy Executive Director of Finance & Administration, Deputy Executive Director of
Operations and Deputy Executive Director of Business Development. The Senior Director of
Communications and the Director of Legislative Affairs, report directly to the Executive Director.
The Deputy Executive Director of Development is responsible for the Environmental
Management, Goods Movement, Maintenance, Construction and Engineering divisions of the
Port.
The Deputy Executive Director of Finance & Administration oversees the financial affairs as well
as administrative side of the Port. Reporting to this position are the Finance Group made up of
Accounting, Financial Management, Debt Management, Management/Internal Audit and Risk
Management divisions; Contracts & Purchasing; Human Resources; and Information Technology
divisions.
Reporting to the Deputy Executive Director of Operations are the Construction & Maintenance,
Homeland Security, Los Angeles Pilot Service, Port Police, and Wharfinger divisions of the Port.
2
The Deputy Executive Director of Business Development directs the Real Estate, Planning, Trade
Services, Economic Development and Marketing divisions of the Port.
The Senior Director of Communications & Legislative Affairs is charged with the dissemination
of information to the public, news media liaison, advertising, legislative coordination, and
community involvement activities. This position is also responsible for the communications
services unit, which provides multimedia and graphic arts services to the Port.
The Port is located in San Pedro Bay, approximately 20 miles south of downtown Los Angeles.
The Port’s facilities lie within the shelter of a nine-mile long breakwater constructed by the federal
government in several stages, the first of which commenced in 1899. The breakwater encloses the
largest man-made harbor in the Western hemisphere.
The Port operates primarily as a landlord, as opposed to an operating port. Its docks, wharves,
transit sheds, and terminals are leased to shipping or terminal companies, agents, and to other
private firms. Although the Port owns these facilities, it has no direct hand in managing the daily
movement of cargoes. The Port is also landlord to various fish markets, boat repair yards,
railroads, restaurants, a shipyard, and other similar activities.
The major sources of income for the Port are from shipping services (wharfage, dockage, pilotage,
assignment charges, etc.), land rentals, and fees, concessions and royalties. It currently serves over
80 shipping companies and agents with facilities that include approximately 200 berthing facilities
along 43 miles of waterfront.
In terms of its size, the Port is one of the largest West coast ports. The Port encompasses
approximately 4,200 acres of land and 3,300 acres of water.
Within the Port are 27 terminals. Two major railroads serve the Port, and it lies at the terminus of
two major freeways within the Los Angeles freeway system. Subsurface pipelines link the Port to
major refineries and petroleum distribution terminals within the Los Angeles Basin.
The Port provides leases to more than 250 tenants, ranging from individual stalls at the fish market
to a 484-acre container terminal. The Port encompasses container and automobile terminals, dry
bulk, liquid bulk and break-bulk facilities, and omni terminals. The Intermodal Container Transfer
Facility (ICTF) and other intermodal facilities are also on Port property. The Port also provides
slips for pleasure craft, sport fishing boats, and charter vessels.
The Port has a main channel with a minimum depth of 45 feet below the mean low water mark.
The Port’s channels are essentially maintenance free because there is no source of sand or silt
coming into the harbor.
The Port currently handles the largest volume of containerized cargo of all U.S. ports, leading the
nation for the past eight years, and additionally ranks as number one in cargo value for
U.S. waterborne foreign traffic.
The Port’s major trading partners are concentrated along the Pacific Rim and include China,
Japan, Taiwan, Thailand, and South Korea. Cargo to and from these countries represents the bulk
of the total value of all cargo shipped through the Port.
The Port continues to maintain an AA credit rating with Standard & Poor’s, Moody’s, and Fitch
Ratings. This is the highest credit rating for any stand-alone U.S. port and reflects the confidence
of the financial community in the strength, continuing financial performance, and competitive
position of the Port.
3
The Port is not subsidized by tax dollars and has maintained its financial strength
through generated revenues. The Port of Los Angeles is one of the few U.S. ports that
remain self-sufficient.
Sincerely,
CHUNGMIN CHU
Director of Accounting
4
LO S AN G ELES H AR BO R D EPAR TM EN T
O R G A N IZ A T IO N C H A R T
2 0 0 8 /2 0 0 9
C o m m is s io n O f f ic e
B o a rd o f H a rb o r
C o m m is s io n e r s
C o m m u n ic a t io n s
E x e c u t iv e D ir e c t o r
C it y A t t o r n e y
L e g is la t iv e A f f a ir s
L a b o r R e la t io n s
F in a n c e a n d
A d m in is t r a t io n
D e v e lo p m e n t
O p e r a t io n s
B u s in e s s D e v e lo p m e n t
C h ie f F in a n c ia l O f f ic e r
A c c o u n t in g
C o n t r a c t s / P u r c h a s in g
C o n s t r u c t io n
C o n s t r u c t io n &
M a in t e n a n c e
T r a d e S e r v ic e s
D ebt M anagem ent
H u m a n R e s o u rc e s
E n g in e e r in g
H o m e la n d S e c u r it y
M a r k e t in g
F in a n c ia l M a n a g e m e n t
I n f o r m a t io n T e c h n o lo g y
E n v ir o n m e n t a l
M anagem ent
P o r t P ilo t s
R e a l E s ta te
G oods M ovem ent
P o r t P o lic e
P la n n in g & R e s e a r c h
W h a r f in g e r s
E c o n o m ic
D e v e lo p m e n t
In te r n a l/M a n a g e m e n t
A u d it
R is k M a n a g e m e n t
5
Board of Harbor Commissioners
S. David Freeman, President
Jerilyn López Mendoza, Vice-President
Kaylynn L. Kim, Commissioner
Douglas P. Krause, Commissioner
Joseph R. Radisich, Commissioner
Senior Management
Geraldine Knatz, Ph.D. Executive Director
Michael Christensen, Deputy Executive Director, Development
Molly Campbell, Deputy Executive Director, Finance & Administration
Capt. John M. Holmes, Deputy Executive Director, Operations
Kathryn McDermott, Deputy Executive Director, Business Development
Arley Baker, Senior Director of Communications
Management Staff
Theresa Adams Lopez, Director of Public & Community Relations
Ralph Appy, Director of Environmental Management
Diane Boskovich, Chief Wharfinger
Ronald Boyd, Chief of Port Police
Kerry Cartwright, Director of Goods Movement
Chungmin Chu, Director of Accounting
George Cummings, Director of Homeland Security
Michael DiBernado, Director of Marketing
Michael Galvin II, Director of Real Estate
Tony Gioiello, Chief Harbor Engineer of Design
Margaret Hernandez, Director of Contracts & Purchasing
Ralph Hicks, Director of Economic Development
Lance Kaneshiro, Director of Information Technology
Tish Lorenzana, Director of Human Resources
Jim MacLellan, Director of Trade Services
David Mathewson, Director of Planning & Research
Kathy Merkovsky, Director of Risk Management
Capt. Jim Morgan, Pilot Service Manager
Julia Nagano, Director of Corporate Communications
James Olds, Director of Management/Internal Audit
Karl Pan, Chief Financial Officer
Soheila Sajadian, Director of Debt Management
Shaun Shahrestani, Chief Harbor Engineer of Construction
Eileen Yoshimura, Director of Financial Management
(Pending Appointment), Director of Construction and Maintenance
(Pending Appointment), Director of Legislative Affairs
(Pending Appointment), Director of Public Labor & Workplace Relations
Legal Staff
Thomas Russell, General Counsel
6
Independent Auditor's Report
The Board of Harbor Commissioners
Port of Los Angeles (Harbor Department
of the City of Los Angeles):
We have audited the accompanying basic financial statements of the Port of Los Angeles (Harbor Department of
the City of Los Angeles), a component unit of the City of Los Angeles, California, as of and for the year ended
June 30, 2008 and 2007, as listed in the table of contents. These financial statements are the responsibility of the
Port of Los Angeles’ management. Our responsibility is to express an opinion on these financial statements based
on our audits.
We conducted our audits in accordance with auditing standards generally accepted in the United States of
America and the standards applicable to financial audits contained in Government Auditing Standards, issued by
the Comptroller General of the United States. Those standards require that we plan and perform the audit to obtain
reasonable assurance about whether the financial statements are free of material misstatement. An audit includes
consideration of internal control over financial reporting as a basis for designing audit procedures that are
appropriate in the circumstances, but not for the purpose of expressing an opinion on the effectiveness of the Port
of Los Angeles’ internal control over financial reporting. Accordingly, we express no such opinion. An audit also
includes examining, on a test basis, evidence supporting the amounts and disclosures in the financial statements,
assessing the accounting principles used and the significant estimates made by management, as well as evaluating
the overall financial statement presentation. We believe that our audit provides a reasonable basis for our opinion.
In our opinion, the financial statements referred to above present fairly, in all material respects, the financial
position of the Port of Los Angeles as of June 30, 2008 and 2007 and the changes in its financial position and its
cash flows for the year then ended in conformity with accounting principles generally accepted in the United
States of America.
In accordance with Government Auditing Standards, we have also issued our report dated December 17, 2008 on
our consideration of the Port of Los Angeles’ internal control over financial reporting and on our tests of its
compliance with certain provisions of laws, regulations, contracts, grant agreements and other matters for the year
ended June 30, 2008. The purpose of that report is to describe the scope of our testing of internal control over
financial reporting and compliance and the results of that testing, and not to provide an opinion on the internal
control over financial reporting or on compliance. That report is an integral part of an audit performed in
accordance with Government Auditing Standards and should be considered in assessing the results of our audit.
Management’s discussion and analysis on pages 9 to 24 is not a required part of the basic financial statements but
is supplementary information required by accounting principles generally accepted in the United States of
America. We have applied certain limited procedures, which consisted principally of inquiries of management
regarding the methods of measurement and presentation of the required supplementary information. However, we
did not audit the information and express no opinion on it.
Our audit was conducted for the purpose of forming an opinion on the basic financial statements taken as a whole.
The introduction and supplemental information sections listed in the accompanying table of contents are
presented for purposes of additional analysis and are not a required part of the basic financial statements. The
introduction and supplemental information sections have not been subjected to the auditing procedures applied in
the audit of the basic financial statements and, accordingly, we express no opinion on them.
Certified Public Accountants
Los Angeles, California
December 17, 2008
8
PORT OF LOS ANGELES
(HARBOR DEPARTMENT OF THE
CITY OF LOS ANGELES),
A COMPONENT UNIT OF THE
CITY OF LOS ANGELES, CALIFORNIA
Management’s Discussion & Analysis
June 30, 2008 and 2007
(Unaudited)
This section of the Port of Los Angeles’ (the Port) annual financial report presents a discussion and analysis of the
Port’s financial performance during the years that ended June 30, 2008 and 2007. Please read it in conjunction
with the transmittal letter at the front of this report and the Port’s financial statements, which follow this section.
The Port uses enterprise fund accounting and the financial statements are prepared on an accrual basis using the
economic resources measurement focus in accordance with U.S. generally accepted accounting principles
promulgated by the Governmental Accounting Standards Board. Revenues are recognized when services are
rendered, as opposed to when cash is received, and expenses are recognized when incurred, not when liability is
paid. Capital assets are recognized as properties or fixed assets and are depreciated over their useful lives (except
land and intangible asset). See the notes to the financial statements for a description of the Port’s significant
accounting policies.
The following is a condensed summary of the Port’s net assets as of June 30, 2008, 2007, and 2006:
Net Assets
(In thousands)
2008
June 30
2007
2006
772,618
2,758,500
652,139
2,726,407
571,606
2,732,704
3,531,118
3,378,546
3,304,310
Long-term debt outstanding
781,752
804,815
887,765
Other liabilities
272,323
235,862
215,238
1,054,075
1,040,677
1,103,003
1,985,653
9
491,381
2,477,043
1,931,037
62
406,770
2,337,869
1,854,468
63,917
282,922
2,201,307
Current and other assets
Capital assets
$
Total assets
Total liabilities
Net assets:
Invested in capital assets, net of related debt
Restricted
Unrestricted
Total net assets
$
9
(Continued)
PORT OF LOS ANGELES
(HARBOR DEPARTMENT OF THE
CITY OF LOS ANGELES),
A COMPONENT UNIT OF THE
CITY OF LOS ANGELES, CALIFORNIA
Management’s Discussion & Analysis
June 30, 2008 and 2007
(Unaudited)
Net assets of the Port increased 6.0% to $2.5 billion in fiscal year 2008. Of these net assets, restricted assets make
up very negligible portions for fiscal years 2008 and 2007. The remaining net assets are either unrestricted or are
invested in capital assets such as land, facilities, infrastructure, equipment, and the like, net of related debt. These
assets are under the management of the Port and must be used for the operation and maintenance of Port facilities
and the acquisition and construction of improvements as provided under the State of California Tidelands Trust
Act.
Current and other assets of the Port increased 18.5% to $772.6 million in fiscal year 2008 and 14.1% to $652.1
million in fiscal year 2007. Increases in these assets are mainly from the continued growth of revenues generated
from operations.
Other liabilities of the Port increased 15.5% to $272.3 in fiscal year 2008 and 9.6% to $235.9 million in fiscal
year 2007. The Port recognized a $17.0 million liability for the Westway Oil settlement in fiscal year 2008. Trade
payables also increased $18.5 million. In fiscal year 2007, liability under securities lending increased by $25.2
million or 57.3%.
10
(Continued)
PORT OF LOS ANGELES
(HARBOR DEPARTMENT OF THE
CITY OF LOS ANGELES),
A COMPONENT UNIT OF THE
CITY OF LOS ANGELES, CALIFORNIA
Management’s Discussion & Analysis
June 30, 2008 and 2007
(Unaudited)
The following is a condensed summary of the Port’s changes in net assets for the years ended June 30, 2008,
2007, and 2006:
Changes in Net Assets
(In thousands)
2008
Net operating revenues
Income from investments in Joint Powers
Authorities and other entities
Interest and investment income
Other income and expense, net
2006
426,345
417,161
392,159
4,440
34,863
(2,536)
4,675
23,773
11,018
4,302
9,582
7,222
Total revenues
463,112
456,627
413,265
Expenses:
Operating and administrative expenses
Depreciation
Interest expense on bonds/notes payable
221,752
78,295
38,052
163,775
88,106
50,038
184,132
98,779
37,787
Total expenses
338,099
301,919
320,698
Income before capital contributions
Capital contributions
Special item
125,013
14,161
—
154,708
4,145
(22,291)
92,567
2,044
—
Changes in net assets
139,174
136,562
94,611
Total net assets - beginning of year
2,337,869
2,201,307
2,106,696
2,477,043
2,337,869
2,201,307
Total net assets - end of year
$
Year ended June 30
2007
$
Fiscal Year 2008
Net assets for the Port increased $139.2 million in fiscal year 2008. Approximately 90.8% of total revenues were
derived from fees for shipping services and leasing of facilities to customers. Since the Port operates as a
landlord, operating expenses are principally administrative in nature. Operating and administrative expense
increased $58.0 million, or 35.4% over the prior fiscal year. The increase is mainly from salaries and benefits due
as the Port continues to expand its human resources in fiscal year 2008 primarily in security and construction and
maintenance services.
11
(Continued)
PORT OF LOS ANGELES
(HARBOR DEPARTMENT OF THE
CITY OF LOS ANGELES),
A COMPONENT UNIT OF THE
CITY OF LOS ANGELES, CALIFORNIA
Management’s Discussion & Analysis
June 30, 2008 and 2007
(Unaudited)
Depreciation expense decreased $9.8 million to $78.3 million in fiscal year 2008. About $3.0 million of the
upward adjustment of the depreciation expense recorded in fiscal year 2008 pertains to periods prior to fiscal year
2007. A substantial amount of capital projects put in depreciable capital assets in fiscal year 2007 were actually
completed and placed in service before 2007. Catch up in depreciation for these assets increased depreciation
expense in fiscal year 2007. LAXT facilities were removed from the capital asset in fiscal year 2007 and further
reduced depreciation by $2.0 million in fiscal year 2008.
Other income, net of other expense, decreased $13.6 million to negative $2.5 million in fiscal year 2008, from
$11.0 million recorded in the prior year. Delinquent charges for late payments greatly dropped when outstanding
LAXT accounts were reversed per settlement agreement with POLA. Also, funds deferred for Todd Shipyard
were recognized as other income in fiscal year 2007.
Capital contributions of $14.2 million represent funds for capital grants received in fiscal year 2008 and $4.1
million in fiscal year 2007.
Income before capital contributions decreased $29.7 million to $125.0 million, a 19.2% decrease over the fiscal
year 2007 amount of $154.7 million. This decrease reflects the combined effect of the $6.5 million increase in
total revenues and the $36.2 million increase in total expenses.
Fiscal Year 2007
Net assets for the Port increased $136.6 million in fiscal year 2007. Approximately 91.1% of total revenues were
derived from fees for shipping services and leasing of facilities to customers. Since the Port operates as a
landlord, operating expenses are principally administrative in nature. Operating and administrative expense
decreased $20.4 million, or 11.1% over the prior fiscal year. The decrease mainly reflects a reduction in litigation
expense this year for LAXT.
Depreciation expense decreased $10.7 million to $88.1 million in fiscal year 2007. The decrease mainly reflects
that some $14.8 million of the upward adjustment of the depreciation expense recorded in fiscal year 2006 that
pertained to periods prior to fiscal year 2006. Certain capital projects that began depreciation in fiscal year 2006
were actually completed and placed in service before 2006.
Other income, net of other expense, increased $3.8 million to $11.0 million in fiscal year 2007 from $7.2 million
recorded in the prior year. The Port recognized $2.8 million of unearned revenue as other income in 2007.
Capital contributions of $4.1 million represent funds for capital grants received in fiscal year 2007.
Income before capital contributions increased $62.1 million to $154.7 million; a 67.1% increase over fiscal year
2006 reported income before capital contributions of $92.6 million. This increase reflects the addition of $43.3
million in total revenues and a decline of $18.8 million in total expenses.
12
(Continued)
PORT OF LOS ANGELES
(HARBOR DEPARTMENT OF THE
CITY OF LOS ANGELES),
A COMPONENT UNIT OF THE
CITY OF LOS ANGELES, CALIFORNIA
Management’s Discussion & Analysis
June 30, 2008 and 2007
(Unaudited)
Operating Revenues
(In thousands)
2008
Shipping services
Percentage of total revenues
Rentals
Percentage of total revenues
Royalties, fees, other operating revenues
Percentage of total revenues
Total
Year ended June 30
2007
2006
$
374,878
87.9%
45,524
10.7%
5,943
1.4%
375,471
88.8%
40,322
9.6%
6,867
1.6%
373,348
90.6%
33,876
8.2%
4,893
1.2%
$
426,345
422,660
412,117
Fiscal Year 2008
Operating revenues for fiscal year 2008 rose to $426.3 million, reflecting a 0.9% increase from prior year
revenues of $422.7 million and is principally attributed to the $3.3 million increase in wharfage revenue and the
$4.4 million increase in land rental income. The Port moved 8.1 million 20-foot equivalent units (TEUs) in
container volume during fiscal year 2008, or a 6.3% drop from the prior year.
Fiscal Year 2007
Operating revenues for fiscal year 2007 rose to $422.7 million, reflecting a 2.6% increase from prior year
revenues of $412.1 million and is principally attributed to the $1.0 million increase in wharfage revenue and the
$6.3 million increase in land rental income. The Port moved 8.7 million 20-foot equivalent units (TEUs) in
container volume during fiscal year 2007, or 11.0% growth over the prior year.
Shipping Services
Shipping service revenues consist of several classifications of fees assessed for various activities relating to vessel
or cargo movement. Of these fees, wharfage is the most significant and comprised 89.4% and 88.4% of the total
shipping service revenues in fiscal years 2008 and 2007, respectively. Wharfage is the fee charged against
merchandise for passage over wharf premises, between vessels, onto or from barges.
13
(Continued)
PORT OF LOS ANGELES
(HARBOR DEPARTMENT OF THE
CITY OF LOS ANGELES),
A COMPONENT UNIT OF THE
CITY OF LOS ANGELES, CALIFORNIA
Management’s Discussion & Analysis
June 30, 2008 and 2007
(Unaudited)
Revenue from shipping services in fiscal year 2008 diminished to $374.9 million, reflecting a decline of $0.6
million, or 0.2%, over fiscal year 2007. The decline in container volume from container terminals coupled with
higher efficiency discounts given to the customers on revenue sharing agreements brought down shipping services
income. Revenue from shipping services in fiscal year 2007 rose to $375.5 million, reflecting a growth of $2.1
million, or 0.6%, over fiscal year 2006. Increased cargo volumes and tariff rates were the principal reasons for the
growth. Strong economic growth both domestically and in East Asia, ongoing development of improved
intermodal facilities, the addition of Pier 400 container terminal, and increasing strength of shipping alliances
based in the Port all contributed to growth in market share during fiscal year 2007.
The following are summaries of cargo volumes by major classification handled by the Port and container volumes
and associated tonnage:
Cargo Type in Metric Revenue Tons
(In thousands)
2008
Container/general cargo
Liquid bulk
Dry bulk
Total
Year ended June 30
2007
2006
161,901
6,208
1,862
171,907
15,433
2,766
155,255
22,797
3,583
169,971
190,106
181,635
Container Volume in TEUs
(In thousands)
2008
Import TEUs
Export TEUs
Total
Year ended June 30
2007
2006
4,325
3,758
4,628
4,029
4,150
3,651
8,083
8,657
7,801
Metric revenue tons are the measure used to determine cargo volumes that move through the Port. The figure
represents the actual weight of cargo, when the figure is available, or the weight is closely approximated by
calculation when cargo weight is not provided. A total of 170.0 million metric revenue tons were billed in fiscal
year 2008, or 10.6% below fiscal year 2007. A total of 190.1 million metric revenue tons were billed in fiscal year
2007, or a 4.7% growth over fiscal year 2006 volume. Decrease in revenue tonnage does not necessarily come
with the same effect in revenue dollars. There are other factors such as revenue sharing, timing of billing and
other increases that offset the effect of decline in revenue tonnage.
14
(Continued)
PORT OF LOS ANGELES
(HARBOR DEPARTMENT OF THE
CITY OF LOS ANGELES),
A COMPONENT UNIT OF THE
CITY OF LOS ANGELES, CALIFORNIA
Management’s Discussion & Analysis
June 30, 2008 and 2007
(Unaudited)
During fiscal year 2008, tonnage from dry bulk decreased 32.7%, or 0.9 million metric revenue tons, due
principally to decrease in scrap metal export and bulk cement import. Petroleum, or mainly bulk oil, decreased
59.8%, or 9.2 million metric revenue tons. About 7.2 million revenue tons relating to fiscal years 2007, 2006 and
2005 wharfage statistics were adjusted in fiscal year 2008, hence, the drastic drop in petroleum for this year.
Tonnage for general cargo billed in fiscal year 2008 was down 10.0 million metric revenue tons compared to the
prior year. This represents the drop in equivalent revenue tons of container volume.
During fiscal year 2007, tonnage from dry bulk decreased 22.8%, or 0.8 million metric revenue tons, due
principally to reduced bulk coal and coke exports. Petroleum decreased 32.3%, or 7.4 million metric revenue tons.
Tonnage for general cargo billed in fiscal year 2007 increased 16.7 million metric revenue tons compared to the
prior year. Additional information for volume by cargo type is presented in the supplementary information section
of this report in the schedule titled “Key Information on Revenue Statistics.”
Rentals
The Port makes available to customers various types of rental properties on Port-controlled lands. These
properties include land, buildings, warehouses, wharves, and sheds. Rates are set for these properties using
various methodologies and are broken into two general classifications, waterfront and backland. Independent
appraisals are performed periodically to establish benchmark rates for these broad land classifications. Rates
ultimately set in land rental agreements may be adjusted, within reason, to reflect general market conditions.
Rates for other categories of properties are also set through negotiations and will further take into account the
condition, location, utility, and other aspects of the property. In all cases, the Port currently seeks to achieve the
12% rate of return on improvements and 10% of land that has been set by Board policy.
During fiscal year 2008, rental income at the Port increased $5.2 million, or 12.9%, over last year and represented
10.7% of fiscal year 2008 total operating revenues. The growth is the result of the second year increase in land
rental rates of the majority of the leases effective September 2007, as a result of the periodic review by the Port.
During fiscal year 2007, rental income at the Port increased $6.4 million, or a 19.0% growth over the prior year
and represented 9.7% of fiscal year 2007 total operating revenues. This growth is principally attributable to the
fact that land rental rates of the majority of the leases were increased effective September 2006 as a result of the
periodic review by the Port.
Royalties, Fees, and Other Operating Revenue
The Port levies fees for a variety of activities conducted on Port properties. Examples include royalties from the
production of oil and natural gas, fees for parking lots, motion picture productions, foreign trade zone operations,
miscellaneous concessions, distribution of utilities, and maintenance and repair services conducted by the Port at
the request of customers.
Revenues in this category totaled $5.9 million for fiscal year 2008, a decrease of $0.9 million or 13.5% behind the
prior fiscal period. The catch up on prior years' reimbursable costs of maintenance jobs performed by the Port has
diminished in fiscal year 2008. Movie permits declined $0.3 million in the current year.
15
(Continued)
PORT OF LOS ANGELES
(HARBOR DEPARTMENT OF THE
CITY OF LOS ANGELES),
A COMPONENT UNIT OF THE
CITY OF LOS ANGELES, CALIFORNIA
Management’s Discussion & Analysis
June 30, 2008 and 2007
(Unaudited)
In fiscal year 2007, revenues from royalties, fees, and other operating revenues totaled $6.9 million, an increase of
$2.0 million or 40.3% over the prior fiscal period. The growth mainly reflects the catch up on prior years
reimbursable costs of maintenance jobs performed by the Port.
Operating and Administrative Expenses
During fiscal year 2008, operating and administrative expenses increased $58.0 million to $221.8 million, a
35.4% increase from prior fiscal year expense of $163.8 million. During fiscal 2007, operating and administrative
expenses fell $20.4 million to $163.8 million, or 11.0% decrease from fiscal year 2006 expense of $184.1 million.
Categories of expense reflecting more significant increases include salaries and benefits, outside services,
materials and supplies, and other operating expenses. Changes in other categories of expenses were less
significant.
Operating and Administrative Expenses (O&A)
(In thousands)
2008
Salaries and benefits
Percentage of total O&A
Marketing and public relations
Percentage of total O&A
Travel and entertainment
Percentage of total O&A
Outside services
Percentage of total O&A
Materials and supplies
Percentage of total O&A
City services
Percentage of total O&A
Other operating expenses
Percentage of total O&A
Total O&A
$
95,444
43.0%
5,274
2.4%
1,128
0.5%
37,937
17.1%
8,950
4.1%
27,101
12.2%
45,918
20.7%
$
221,752
Year ended June 30
2007
74,313
45.4%
4,521
2.8%
604
0.4%
33,277
20.3%
5,813
3.5%
28,640
17.5%
16,607
10.1%
163,775
2006
65,705
35.7%
3,333
1.8%
822
0.5%
33,673
18.3%
5,400
2.9%
20,821
11.3%
54,378
29.5%
184,132
Fiscal Year 2008
Salaries and benefits expense rose $21.1 million, or 28.4% over the prior fiscal year. The increase is the result of
scheduled employee pay increases, a $1.1 million retro pay adjustment, a $2.0 million upward adjustment in
benefit expense, a $5.2 million one-time payment of City Fire & Police pension for the transfer of Port Police
pension from LACERS to LAFPP, and the continued expansion of the Port workforce mainly in Port Police and
Construction & Maintenance in fiscal year 2008.
16
(Continued)
PORT OF LOS ANGELES
(HARBOR DEPARTMENT OF THE
CITY OF LOS ANGELES),
A COMPONENT UNIT OF THE
CITY OF LOS ANGELES, CALIFORNIA
Management’s Discussion & Analysis
June 30, 2008 and 2007
(Unaudited)
The $4.7 million increase in outside services reflects the combined outcome of the drop of $2.2 million in Port
security-related expenditures, $0.8 million decrease in capital construction services, $2.1 million increase in
environmental assessment cost (net of capitalized amount), $2.6 million increase in Public and Community
Relations expenditures for its community outreach programs, $1.8 million increase in maintenance services, a
collective increase of $1.5 million in data processing and financial and legal services.
Materials and supplies grew $3.1 million over the prior fiscal year due to $2.2 million surge in acquisitions of
parts and materials made by Construction & Maintenance and the $0.9 million increase in administrative and
operating supplies.
City services, net of capitalized amount, decreased $1.5 million during the comparative fiscal years. The decrease
reflects the higher capitalized amount of $1.0 million in fiscal year 2008 because higher salary expenses were
capitalized.
Other operating expenses for fiscal year 2008 increased $29.3 million over prior year due to $7.2 million increase
in subsidy payment for Clean Truck Program (CTP), a $0.5 million increase in provision for workers’
compensation claims, and a $20.7 million increase in litigation and settlement expenses. The net increase of $20.7
million in litigation and settlement expenses over prior year reflects the $17.0 million settlement to be paid by the
Port to Westway Oil Terminal, a $1.2 million increase in China Shipping mitigation fund due to excess in TEU
cap, and reduction in litigation reserve of $3.3 million for the settlement received by the Port from Santa Monica
Baykeeper in fiscal year 2007.
Fiscal Year 2007
Salaries and benefits expense rose $8.6 million, or 13.1% over the prior fiscal year. The increase is the outcome of
scheduled employee pay increase, a one-time $1.4 million retro pay adjustment, and the continued build up of the
Port workforce in fiscal year 2007.
City services, net of capitalized amount, increased $7.8 million during fiscal year 2007. The increase reflects the
$3.0 million higher charges in recreation and park services by the City of Los Angeles. Additionally, a refund of
$1.9 million reduced City services in fiscal year 2006.
Other operating expenses for fiscal year 2007 decreased $37.8 million from the prior year. The decrease reflects a
$36.0 million reduction in provision for the litigation reserve, a substantial portion of which relates to the LAXT.
Most of the litigation reserve for LAXT was made in fiscal year 2006 and the Port made no additional litigation
reserve in fiscal year 2007. The City (Port) reached a Settlement Agreement, Mutual Release and Compliance,
and Permit Termination Agreement with LAXT in fiscal year 2007. Also, there is a reduction in provision for
workers’ compensation claims this year by $5.5 million, arising from a one-time charge of $5.0 million to set
aside additional reserves to meet actuarial requirements in fiscal year 2006.
17
(Continued)
PORT OF LOS ANGELES
(HARBOR DEPARTMENT OF THE
CITY OF LOS ANGELES),
A COMPONENT UNIT OF THE
CITY OF LOS ANGELES, CALIFORNIA
Management’s Discussion & Analysis
June 30, 2008 and 2007
(Unaudited)
Nonoperating Income and Expense
Fiscal Year 2008
Net nonoperating expense for fiscal year 2008 decreased $9.3 million from the prior year to $1.3 million.
Interest and investment income increased $11.1 million to $34.9 million for fiscal year 2008. The increase
includes a $10.3 million increase in interest income from Harbor Revenue Fund and restricted funds. The average
yields as well as the average investable balance were higher this fiscal year than prior year. Unrealized gain from
the City of Los Angeles investment pool also went up by $5.6 million over prior year. Offsetting the increase is
the $4.1 million interest income recorded in fiscal year 2007 from the refunded 1996 Harbor Revenue Bonds.
Interest expense showed a decrease of $12.0 million to $38.1 million in fiscal year 2008 due to a $13.5 million
interest expense recognized in fiscal year 2007 for refunding of 1996 Harbor Revenue Bonds. In addition, Harbor
Revenue Bonds principal balances are lower than last fiscal year.
Other income, net of other expense, decreased $13.6 million to negative $2.5 million in fiscal year 2008, from
$11.0 million recorded in the prior year. The decrease reflects a $10.9 million decrease in other income and a $2.6
million increase in other expense. Income from delinquent charges for late payments was greatly reduced by $2.6
million, when outstanding LAXT accounts were reversed, per settlement agreement with the Port. Federal
operating grants received in fiscal year 2008 were $5.6 million less than the grant receipts last year. A $2.9
million funds deferred for Todd Shipyard were recognized as other income in fiscal year 2007. Fiscal year 2008
also showed a $1.7 million increase in cost of abandoned projects charged to expense as well as a $0.7 million
increase in loss on sale of assets.
Fiscal Year 2007
Net nonoperating expense for fiscal year 2007 decreased $6.1 million from the prior year to $10.6 million.
Interest and investment income increased $14.2 million to $23.8 million for fiscal year 2007. The increase
includes $7.5 million in higher interest income and a $6.7 million increase in fair value adjustment for the Port’s
share in the City of Los Angeles’ investment pool.
Interest expense showed an increase of $12.3 million to $50.0 million in fiscal year 2007. This is mainly caused
by an understatement of $7.2 million in interest expense in fiscal year 2006, and an overstatement of same amount
in fiscal year 2007. The Port failed to record the prior year’s accrued interest expense for 1996 Bonds totaling
$7.2 million, which was paid through the defeasance escrow accounts in fiscal year 2007.
Long-Term Debt and Capital Assets
Long-Term Debt
The Port’s long-term debt is comprised of senior debt in the form of Harbor Revenue Bonds and subordinated
debt in the form of loans. As of June 30, 2008 and 2007, the Port’s outstanding long-term debt was $781.8 million
18
(Continued)
PORT OF LOS ANGELES
(HARBOR DEPARTMENT OF THE
CITY OF LOS ANGELES),
A COMPONENT UNIT OF THE
CITY OF LOS ANGELES, CALIFORNIA
Management’s Discussion & Analysis
June 30, 2008 and 2007
(Unaudited)
and $804.8 million, respectively. For all outstanding bonds, the Port continues to maintain Aa2, AA and AA
credit ratings from Moody's, Standard & Poor’s and Fitch Ratings.
Bonded Debt
On October 13, 2005, the Port advance refunded a portion of the outstanding 1996A and 1996B Bonds with the
issuance of the 2005 Refunding Bonds. Proceeds from 2005A Refunding Bonds and 2005B Refunding Bonds
were deposited into the related Crossover Refunding Escrow Funds and invested to refund $30.9 million of the
1996A Bonds and $31.7 million of the 1996B Bonds on their call dates (the Crossover Dates) of August 1, 2006
and November 1, 2006, respectively. Prior to their respective Crossover Dates, interest payments on the 2005A
and the 2005B Refunding Bonds are payable from and secured by investment receipts from the deposit in the
related Crossover Refunding Escrow Funds. The Crossover Refunding 2005A and 2005B Bonds are not on parity
with other Harbor Revenue Bonds until their respective Crossover Dates.
In addition, the Port issued and applied the proceeds of the 2005 Series C-1 Refunding Bonds to provide funds to
reimburse Citigroup and De La Rosa for funds advanced by them for the purchase of $15.5 million of
1996A Bonds and $27.7 million of the 1996B Bonds tendered by the holders thereof in response to a voluntary
open market purchase solicitation. All such purchased 1996A Bonds and 1996B Bonds were cancelled on the date
of delivery of the Series 2005C-1 Bonds.
On May 4, 2006, the Port issued the 2006A Bonds for $200.7 million on a forward delivery basis to currently
refund the remaining $202.7 million of 1996A Bonds. All such 1996A Bonds were redeemed and cancelled on
their call date of August 1, 2006.
On August 3, 2006, the Port issued the 2006B Bonds for $209.8 million and the 2006C Bonds for $16.5 million
on a forward-delivery basis to currently refund $211.9 million of the outstanding 1996B Bonds and $17.1 million
of the 1996C Bonds. All such 1996B Bonds and 1996C bonds were redeemed and cancelled on their call date of
November 1, 2006.
The refunding of 1996B Bonds and 1996C Bonds were completed on November 1, 2006. In combination with the
completion of refunding of 1996A Bonds, the Port in effect achieved the aggregate debt service savings for
approximately $87 million, representing a net present value benefit of $51.8 million.
Commercial Paper Notes
On November 7, 2001, the Port issued its Offering Memorandum for the issuance of Commercial Paper Notes
(Notes) not to exceed $375 million in three series, Series A (Non-AMT), Series B (AMT), and Series C
(Taxable). The purpose of the Notes is to provide interim financing for the construction, maintenance, and
replacement of the Port’s structures, facilities, and equipment. Rates vary on the Notes from 2.38% to 3.45%
during the fiscal year ended June 30, 2006. Due dates also vary, but within the maximum of 270 days from the
issue dates.
19
(Continued)
PORT OF LOS ANGELES
(HARBOR DEPARTMENT OF THE
CITY OF LOS ANGELES),
A COMPONENT UNIT OF THE
CITY OF LOS ANGELES, CALIFORNIA
Management’s Discussion & Analysis
June 30, 2008 and 2007
(Unaudited)
In fiscal years 2006 and 2005, the Notes were remarketed for principal only. Therefore, the outstanding balance at
June 30, 2006 remained unchanged from fiscal year 2005 at $113.6 million. On August 31, 2006, the Port issued
its 2006D Refunding Bonds in the aggregate principal amount of $111.3 million through a competitive sale to
refund the Notes. The bonds were awarded to Lehman Brothers who submitted the bid with the lowest true
interest cost (TIC) of 4.7106%. The reasons for refunding short-term variable Notes with long-term fixed rate
revenue bonds are: (1) to avoid potential increases in costs of funds due to rising short-term interest rates; (2) to
take advantage of the long-term low interest rates in the current bond market; and (3) to more closely match the
debt to the expected economic life of the financed projects.
Under Section 609 of the City Charter of the City of Los Angeles and the Bond Procedural Ordinance, the Port’s
capacity to issue debt is not limited. However, the Port’s capacity is constrained contractually under covenants of
the currently outstanding debt to an aggregate ratio of revenue to annual debt service of at least one hundred
twenty-five percent (125%). As of June 30, 2008, this capacity is approximately $2.1 billion, calculated by using
available operating revenues and current interest rate assumptions of 6.0%. The Port’s existing Debt Policy has
set the maximum outstanding debt to be $2 billion.
No bonds were issued in fiscal year 2008.
Long-term debt consisted of the following as of June 30, 2008, 2007, and 2006 (in thousands):
Revenue bonds payable
Notes payable
Commercial paper
Total
2008
2007
2006
$
778,481
3,271
—
801,118
3,697
—
770,099
4,105
113,561
$
781,752
804,815
887,765
Capital Assets
Capital assets, net of accumulated depreciation consisted of the following as of June 30, 2008, 2007, and 2006
(in thousands):
2008
Land
Harbor facilities and equipment, net
Intangible assets
Construction in progress
Preliminary costs – capital projects
Total
2007
2006
$
1,012,297
1,366,028
1,050
239,291
139,834
991,153
1,400,854
—
211,329
123,071
955,824
1,448,659
—
232,412
95,809
$
2,758,500
2,726,407
2,732,704
20
(Continued)
PORT OF LOS ANGELES
(HARBOR DEPARTMENT OF THE
CITY OF LOS ANGELES),
A COMPONENT UNIT OF THE
CITY OF LOS ANGELES, CALIFORNIA
Management’s Discussion & Analysis
June 30, 2008 and 2007
(Unaudited)
Capital expenditures for fiscal year 2008 increased to $111.0 million from $108.2 million in the prior year.
Spending was higher in commercial development, port security and other miscellaneous projects. Approximately
26% of the fiscal year 2008 funds were expended on terminal improvements, 25% on commercial development
and 16% on Port security. The remaining 33% was primarily used for dredging, environmental enhancements,
infrastructure improvements, and Port security.
Major Capital Expenditure – Facilities and Infrastructure
(In thousands)
2008
Year ended June 30
2007
2006
Commercial development
Dredging
Environmental studies and credits
Infrastructure improvements
Port security
Terminal development
Transportation improvements
Others
$
27,981
2,252
4,345
2,102
17,663
28,957
1,274
26,443
13,147
26,690
9,598
4,452
8,819
36,232
2,762
6,546
33,913
17,277
14,126
1,136
1,921
25,070
2,434
21,172
Total
$
111,017
108,246
117,049
Budgeted expenditures for the Port’s fiscal year 2009 Capital Improvement Program has increased from the
previous fiscal year. The more significant fiscal year 2009 expenditures will include the San Pedro and
Wilmington Waterfront Development Projects, Port Security, Cruise Terminal AMP, TraPac Development, and
Pier 300 Improvements.
The Berth 131-148 (TraPac) terminal expansion program is being designed and will upgrade and redevelop 110
acres and develop an additional 57+/- acre of container terminal. Improvements include the construction of
2,600 feet of wharf, five new cranes (purchased by TraPac), 100 foot gauge crane rail, alternative maritime power
(AMP), dredging to -53 ft., new buildings (including administration building, maintenance and repair, yard
operations, crane maintenance/marine building and driver service buildings), new main gate, relocation of the
Pier A Street Rail Yard, ICTF, new reefer wash, demolition of existing buildings, concrete transtainer runways,
and general container yard and infrastructure improvements. The estimated project completion date is
November 2013.
The Pier 300 development will construct approximately 1,250 linear feet of wharf, develop 40 acres of backland
and improve infrastructure to existing terminal. The estimated completion date is fall of 2012.
The Port Police Headquarters Project consists of the design and construction of a new 51,000-square-foot
three-story Port police station at 320 S. Center Street with subterranean parking and an adjacent two-level parking
structure. The expected construction completion of the project is May 2011.
21
(Continued)
PORT OF LOS ANGELES
(HARBOR DEPARTMENT OF THE
CITY OF LOS ANGELES),
A COMPONENT UNIT OF THE
CITY OF LOS ANGELES, CALIFORNIA
Management’s Discussion & Analysis
June 30, 2008 and 2007
(Unaudited)
The Homeland Security Program consists of five projects: a waterside security surveillance system, facility
security enhancements, passenger complex vehicle screening, passenger complex perimeter security, and a
waterborne perimeter security barrier. For these projects, the Port is responsible for the design and installation of
integrated surveillance systems including cameras, motion detectors, nonintrusive inspection for vehicles, and
waterborne perimeter security barriers. Estimated project completion is February 2010.
The Los Angeles Waterfront is envisioned as a catalyst to provide public access waterfront and includes specific
development projects and associated infrastructure improvements. The plan has five major programs: 1) Gateway
2) Enhancements 3) Waterfront 4) Cabrillo Way Marina and 5) Cruise Terminal.
The Waterfront Gateway Program includes approximately 2.5 miles of pedestrian promenade, multi-use parkway,
and open space including lighting, signage, landscaping, irrigation, and landscaping. In addition, the program
includes water features at the Gateway Plaza and 2nd Street, and automatic restrooms. Project completion is
expected by summer 2010.
The San Pedro Waterfront Enhancements Program will improve existing, and construct new, pedestrian walks and
plazas, create green open spaces, provide additional vehicular parking, construct Angel’s Walk LA stanchions,
and new landscaping between the Port and waterfront. Project completion is expected in October 2010.
The San Pedro Waterfront will construct new promenades along the water’s edge, water cuts, parks and open
space, museum and maintenance facilities for the Red Car, roadway improvement and clean-up and development
of the former Westway property at Berth 70-71. Estimated program completion date is summer of 2018.
The Wilmington Waterfront Development Program is a 95-acre development incorporating landscaping,
commercial/retail/restaurant development, cultural/community facilities, and transportation improvements.
Projects include the Avalon Triangle Park, Catalina Freight Relocation, Harry Bridges Boulevard Buffer, and
Avalon Boulevard Corridor – Phase I & II.
Cabrillo Way Marina Phase II will include new floating docks with boat slips, boater restrooms, shower facilities,
public restrooms, boater and public parking lots, trailer boat and dry storage, and hoist launching facilities.
Estimated completion date is June 2011.
The Cruise Terminal Program includes a proposed upgrade of the existing cruise terminal facilities at
Berth 91-93, a temporary cruise terminal baggage building at Berth 90-91, AMP, a proposed new cruise terminal
in the outer harbor at Berth 46-47, and new multi-level/shared use parking structure. Estimated program
completion is expected in summer of 2011.
Open purchase orders and uncompleted construction contracts amounted to approximately $290,152,000 as of
June 30, 2008
22
(Continued)
PORT OF LOS ANGELES
(HARBOR DEPARTMENT OF THE
CITY OF LOS ANGELES),
A COMPONENT UNIT OF THE
CITY OF LOS ANGELES, CALIFORNIA
Management’s Discussion & Analysis
June 30, 2008 and 2007
(Unaudited)
Factors That May Affect the Port’s Operations
In November 2006, the governing boards of the Ports of Los Angeles and Long Beach voted to approve the
landmark San Pedro Bay Ports Clean Air Action Plan (CAAP), the most comprehensive plan that addresses
emissions from the trucks, oceangoing vessels, trains, terminal equipment and harbor craft that serve the Port.
The $2 billion CAAP is expected to reduce Port-related emissions by nearly 50% by 2011.
The major component of this plan is the Clean Truck Program (CTP). This program will replace or retrofit high
polluting diesel trucks with ones that meet 2007 EPA emission standards.
The Vessel Speed Reduction Program (VSRP) provides incentives to vessel operators to reduce vessel speeds
from 20 knots or more to 12 knots on approach to and departure from the port.
Competitive Environment
In the year ended June 30, 2008, 99.5% of the entire U.S. West Coast containerized cargo market was controlled
by six major containerports: the ports of Los Angeles, Long Beach, and Oakland in California; the ports of Seattle
and Tacoma in Washington State; and the port of Portland in Oregon. The ports of Los Angeles and Long Beach
together controlled 71.8% of all U.S. West Coast market share.
23
(Continued)
PORT OF LOS ANGELES
(HARBOR DEPARTMENT OF THE
CITY OF LOS ANGELES),
A COMPONENT UNIT OF THE
CITY OF LOS ANGELES, CALIFORNIA
Management’s Discussion & Analysis
June 30, 2008 and 2007
(Unaudited)
The industry is capital intensive and requires long lead times to plan and develop new facilities and infrastructure.
Resources are typically allocated and facilities developed upon the commitment of customers to long-term leases
of 25 to 30 years. Occupancy remains high and West Coast ports have limited capacity for expansion.
Additionally, the greater Los Angeles area represents not only a large destination market for waterborne goods,
but is also the most attractive point of origin for trans-shipments to Midwest and East Coast destinations.
West Coast Container Market Share*
(In thousands)
Year ended
June 30
2008
Los Angeles
Long Beach
Oakland
Tacoma
Seattle
Portland
All others
Total
5,698
4,908
1,461
1,178
1,246
207
75
14,773
June 30
2007
2006
Loaded TEUs
(In thousands)
5,705
4,743
1,378
1,135
1,218
189
73
14,441
5,309
4,799
1,442
1,163
1,318
139
73
14,243
2008
38.6%
33.2%
9.9%
8.0%
8.4%
1.4%
0.5%
100.0%
2007
Market share
Percentage
39.5%
32.8%
9.6%
7.9%
8.4%
1.3%
0.5%
100.0%
2006
37.3%
33.7%
10.1%
8.2%
9.3%
1.0%
0.4%
100.0%
* Source: Port Import Export Reporting Service.
Contacting the Port’s Financial Management
Questions about this report or requests for additional financial information should be addressed to the Chief
Financial Officer, Port of Los Angeles, 425 S. Palos Verdes Street, San Pedro, CA 90731.
24
(Continued)
BASIC FINANCIAL STATEMENTS
PORT OF LOS ANGELES
(HARBOR DEPARTMENT OF THE
CITY OF LOS ANGELES),
A COMPONENT UNIT OF THE
CITY OF LOS ANGELES, CALIFORNIA
Statements of Net Assets
June 30, 2008 and 2007
(In thousands of dollars)
Assets:
Current assets:
Cash and investments, unrestricted (note 2)
Cash and investments, restricted (note 2)
Accounts receivable, less allowance for doubtful accounts of
$8,397 and $8,714 in 2008 and 2007, respectively (note 14)
Grants receivable (note 13)
Materials and supplies inventories
Prepaid and deferred expenses
Accrued interest receivable
Current portion of notes receivable, less allowance for
doubtful accounts of $0 and $0 in 2008 and 2007,
respectively (notes 10 and 14)
Total current assets
Noncurrent restricted assets (note 2):
Restricted investments – bond funds
Other restricted cash and investments
Accrued interest receivable
Total noncurrent restricted assets
Capital assets (notes 3 and 8):
Land
Harbor facilities and equipment, less accumulated depreciation
of $1,058,157 and $993,988 in 2008 and 2007, respectively
Intangible assets
Construction in progress
Preliminary costs – capital projects
Net capital assets
Notes receivable (note 10)
Investment in Joint Powers Authorities and other entities, less
allowance for investment loss of $0 and $0 for 2008 and 2007
(notes 4 and 14)
Other assets
Total assets
25
$
2008
2007
488,893
158,769
380,139
149,087
38,012
8,340
2,311
3,525
5,148
46,890
1,521
1,973
1,192
3,863
4,136
4,013
709,134
588,678
9
9,545
61
62
9,180
110
9,615
9,352
1,012,297
991,153
1,366,028
1,050
239,291
139,834
1,400,854
—
211,329
123,071
2,758,500
2,726,407
32,902
37,056
12,255
8,712
7,814
9,239
3,531,118
3,378,546
(Continued)
PORT OF LOS ANGELES
(HARBOR DEPARTMENT OF THE
CITY OF LOS ANGELES),
A COMPONENT UNIT OF THE
CITY OF LOS ANGELES, CALIFORNIA
Statements of Net Assets
June 30, 2008 and 2007
(In thousands of dollars)
2008
Liabilities:
Current liabilities:
Accounts payable
Current installments of notes payable and bond
indebtedness (note 5)
Accrued interest
Accrued employee benefits (note 5)
Unearned revenue and other deferred credits (note 5)
Liabilities under the City of Los Angeles’ securities lending
program (note 2)
Accrued construction costs payable
Other current liabilities (notes 5, 7, 18 and 19)
$
Total current liabilities
Long-term liabilities (note 5):
Bonds payable, net of deferred amount on refunding and
unamortized discount/premium of $11,231 and $11,793
in 2008 and 2007, respectively
Notes payable, net of current installments
Accrued employee benefits
Other liabilities (notes 7 and 18)
Liabilities payable from restricted assets – other liabilities
Total long-term liabilities
Total liabilities
2007
61,237
42,774
23,655
16,251
10,626
1,865
22,501
16,739
13,438
358
73,692
1,376
82,004
69,252
1,228
62,391
270,706
228,681
755,271
2,826
7,952
7,857
9,463
779,043
3,271
7,291
13,110
9,281
783,369
811,996
1,054,075
1,040,677
1,985,653
9
491,381
1,931,037
62
406,770
2,477,043
2,337,869
Commitments and contingencies (notes 11, 15, 17, and 19)
Net assets:
Invested in capital assets, net of related debt
Restricted, bond proceeds
Unrestricted
Total net assets
$
See accompanying notes to financial statements.
26
PORT OF LOS ANGELES
(HARBOR DEPARTMENT OF THE
CITY OF LOS ANGELES),
A COMPONENT UNIT OF THE
CITY OF LOS ANGELES, CALIFORNIA
Statements of Revenues, Expenses, and Changes in Net Assets
Years ended June 30, 2008 and 2007
(In thousands of dollars)
2008
2007
335,172
6,957
276
1,944
7,677
22,750
102
331,919
8,201
246
2,460
8,829
23,687
129
374,878
375,471
41,587
501
2,169
1,267
37,147
457
1,528
1,190
45,524
40,322
3,701
122
2,120
3,994
78
2,795
5,943
6,867
426,345
422,660
Provision for bad debts
—
(5,499)
Net operating revenues
426,345
417,161
95,444
5,274
1,128
37,937
8,950
74,313
4,521
604
33,277
5,813
27,101
1,347
19,836
24,735
28,640
860
(912)
16,659
Total operating and administrative expenses
221,752
163,775
Income from operations before depreciation
204,593
253,386
78,295
88,106
126,298
165,280
Operating revenues (note 8):
Shipping services:
Wharfage
Dockage
Demurrage
Cranes
Pilotage
Assignment charges
Storage
$
Total shipping services
Rentals:
Land
Buildings
Warehouses
Wharf and shed revenue
Total rentals
Royalties, fees, and other operating revenues:
Fees, concessions, and royalties
Oil royalties
Other
Total royalties, fees, and other operating revenues
Total operating revenues
Operating and administrative expenses (notes 1 and 9):
Salaries and benefits
Marketing and public relations
Travel and entertainment
Outside services
Materials and supplies
City services, net of capitalized amounts of $8,342 and
$6,097 in 2008 and 2007, respectively (note 12)
Provision for workers’ compensation claims
Litigation, claims, and settlement expenses (note 7, 15, 18, and 19)
Other operating expenses
Depreciation (note 3)
Operating income
27
(Continued)
PORT OF LOS ANGELES
(HARBOR DEPARTMENT OF THE
CITY OF LOS ANGELES),
A COMPONENT UNIT OF THE
CITY OF LOS ANGELES, CALIFORNIA
Statements of Revenues, Expenses, and Changes in Net Assets
Years ended June 30, 2008 and 2007
(In thousands of dollars)
2008
Nonoperating revenues (expenses):
Income from investments in Joint Powers Authorities and
other entities (note 4)
Interest and investment income
Interest expense on bond indebtedness and notes payable
(notes 3 and 5)
Other income and expenses, net
$
2007
4,440
34,863
4,675
23,773
(38,052)
(2,536)
(50,038)
11,018
(1,285)
(10,572)
125,013
154,708
14,161
4,145
—
(22,291)
Changes in net assets
139,174
136,562
Total net assets – beginning of year
2,337,869
2,201,307
2,477,043
2,337,869
Net nonoperating expenses
Income before capital contributions
Capital contributions (note 13)
Special item (note 14)
Total net assets – end of year
$
See accompanying notes to financial statements.
28
PORT OF LOS ANGELES
(HARBOR DEPARTMENT OF THE
CITY OF LOS ANGELES),
A COMPONENT UNIT OF THE
CITY OF LOS ANGELES, CALIFORNIA
Statements of Cash Flows
Years ended June 30, 2008 and 2007
(In thousands of dollars)
2008
2007
383,525
45,627
6,072
367,874
40,720
6,205
(97,592)
(89,903)
5,169
(67,784)
(103,787)
3,437
252,898
246,665
1,990
7,506
1,990
7,506
(124,720)
168
7,353
(22,075)
—
(426)
(38,849)
(107,928)
38
3,625
(27,470)
(54,166)
(408)
(44,606)
(178,549)
(230,915)
25,993
22,919
4,440
7,633
4,031
—
25,238
2,043
4,434
3,500
Net cash provided by investing activities
42,097
58,134
Net increase in cash and cash equivalents
118,436
81,390
529,226
647,662
447,836
529,226
Cash flows from operating activities:
Shipping service fees collected
Rentals collected
Royalties, fees, and other operating revenues collected
Payments for employee salaries and benefits, net of capitalized
amount of $12,254 and $10,051 in 2008 and 2007, respectively
Payments for goods and services
Net cash provided by other nonoperating income and expenses
$
Net cash provided by operating activities
Cash flows from noncapital financing activities:
Proceeds from non-capital grants
Net cash provided by noncapital financing activities
Cash flows from capital and related financing activities:
Payments for property acquisitions and construction
Proceeds from sales of capital assets
Proceeds from capital grant
Principal repayment – bonds
Payment to escrow agent for bond refunding
Principal repayment – notes
Interest paid
Net cash used in capital and related financing
activities
Cash flows from investing activities:
Receipt of interest
Increase in liabilities under the City of Los Angeles’ securities
lending program
Increase in fair value of pooled investments
Payments received on notes receivable
Distribution from Joint Powers Authorities and other entities
Cash and cash equivalents, beginning of year
Cash and cash equivalents, end of year (note 2)
$
29
(Continued)
PORT OF LOS ANGELES
(HARBOR DEPARTMENT OF THE
CITY OF LOS ANGELES),
A COMPONENT UNIT OF THE
CITY OF LOS ANGELES, CALIFORNIA
Statements of Cash Flows
Years ended June 30, 2008 and 2007
(In thousands of dollars)
Reconciliation of operating income to net cash provided by
operating activities:
Operating income
2008
2007
126,298
165,280
78,295
—
88,106
5,499
5,169
8,878
(338)
(2,333)
23,213
(2,151)
(5,253)
3,437
(8,324)
(211)
2,633
13,378
6,530
5
21,120
(29,668)
126,600
81,385
$
252,898
246,665
$
—
1,376
6,088
2,726
—
307
520
1,228
10,838
4,073
350,403
1,779
$
Adjustments to reconcile operating income to net cash
provided by operating activities:
Depreciation
Provision for doubtful accounts
Net cash provided by other nonoperating
income and expense
Change in accounts receivable
Change in materials and supplies inventories
Change in prepaid and deferred expenses
Change in accounts payable
Change in accrued employee benefits
Change in other long-term operating liabilities
Change in unearned revenue and other deferred credits
and other current operating liabilities
Total adjustments
Net cash provided by operating activities
Noncash investing, capital, and financing activities:
Contributions of capital assets from other government
Acquisition of capital assets with construction costs payable
Acquisition of capital assets with accounts payable
Write-off of discontinued construction projects
Bond proceeds deposited to escrow accounts for refundings
Capitalized interest expense, net
See accompanying notes to financial statements.
30
PORT OF LOS ANGELES
(HARBOR DEPARTMENT OF THE
CITY OF LOS ANGELES),
A COMPONENT UNIT OF THE
CITY OF LOS ANGELES, CALIFORNIA
Notes to Financial Statements
June 30, 2008 and 2007
(1)
Organization and Summary of Significant Accounting Policies
The financial statements of the Port of Los Angeles (Harbor Department of the City of Los Angeles),
hereafter referred to as “Port of Los Angeles” or “Port,” have been prepared in conformity with
U.S. generally accepted accounting principles (GAAP) as applied to governmental units. The
Governmental Accounting Standards Board (GASB) is the accepted standard-setting body for establishing
governmental accounting and financial reporting principles. The more significant of the Port’s accounting
policies are described below.
(a)
Organization and Reporting Entity
The Port of Los Angeles is an independent, self-supporting department of the City of Los Angeles,
California (the City), formed for the purpose of providing shipping, fishing, recreational, and other
resources and benefits for the enjoyment of the citizens of Los Angeles and surrounding
communities. The Port is under the control of a five-member Board of Harbor Commissioners
(appointed by the Mayor and approved by the City Council) and is administered by an Executive
Director, subject to the State of California Tidelands Trust Act. The Port is granted control of
tidelands, and all monies arising out of the operation of the Port are limited as to use for the
operation and maintenance of Port facilities, the acquisition and construction of improvements, and
other such trust considerations under the Tidelands Trust and the Charter of the City of Los Angeles.
The Port prepares and controls its own financial plan, administers and controls its fiscal activities,
and is responsible for all Port construction and operations.
The Port operates as principal landlord for the purpose of assigning or leasing port facilities and land
areas. The Port’s principal source of revenue is from shipping services under tariffs (dockage and
wharfage, etc.), rental of land and facilities, royalties (oil wells), and other fees. Capital construction
is financed from operations, bonded debt, and loans secured by future revenues and federal grants.
Daily operation of the port facilities and regular maintenance are performed by the Port’s permanent
work force. Generally, major maintenance and new construction projects are assigned to commercial
contractors.
Operations of the Port are financed in a manner similar to that of a private business. The Port
recovers its costs of providing services and improvements through tariff charges for shipping
services and the leasing of facilities to Port customers.
In evaluating how to define the Port for financial reporting purposes, management has considered all
potential component units. The decision to include a potential component unit in the reporting entity
was made by applying the criteria set forth in GASB Statement No. 14, The Financial Reporting
Entity, (GASB Statement No. 14) which the Port adopted effective July 1, 1993. The financial
statements include only the financial activities of the Port of Los Angeles and are not intended to
present fairly the financial position and results of operations of the City in conformity with GAAP.
31
(Continued)
PORT OF LOS ANGELES
(HARBOR DEPARTMENT OF THE
CITY OF LOS ANGELES),
A COMPONENT UNIT OF THE
CITY OF LOS ANGELES, CALIFORNIA
Notes to Financial Statements
June 30, 2008 and 2007
The Los Angeles Harbor Improvements Corporation (LAHIC) is a nonprofit public benefit
corporation organized under the laws of the state of California for public purposes. LAHIC was
formed to assist the Port by constructing, replacing, extending, or improving facilities and services
that the Board of Harbor Commissioners deems necessary for the promotion and accommodation of
commerce. From time to time, LAHIC has issued long-term indebtedness to finance specific capital
facilities improvements on behalf of the Port’s tenants. The nature of these financings is such that the
long-term indebtedness will be that of the Port tenant and not LAHIC, nor the Port, nor the City.
Therefore, for purposes of the accompanying financial statements, the long-term indebtedness of
LAHIC and the corresponding lease receivable from the tenant are eliminated.
The board of directors of LAHIC consists of five members. Election of the LAHIC board of directors
occurs by vote of the Board of Harbor Commissioners.
Although the tenant reimburses LAHIC for its costs of operations, the Board of Harbor
Commissioners is financially responsible for LAHIC’s activities. Further, although LAHIC is legally
separate from the Port, LAHIC is reported as if it were part of the Port in accordance with the
provisions of GASB Statement No. 14, because its sole purpose is to finance and construct facilities
and improvements, which directly benefit the Port.
LAHIC is included in the reporting entity of the Port, and accordingly, the operations of LAHIC are
blended in the Port’s accompanying financial statements.
(b)
Summary of Significant Accounting Policies
Method of Accounting – The Port activities are accounted for as enterprise fund, and as such, its
financial statements are presented using the economic resources measurement focus and the accrual
method of accounting. Under this method of accounting, revenues are recognized when earned and
expenses are recorded when liabilities are incurred without regard to receipt or disbursement of cash.
The measurement focus is on determination of changes in net assets, financial position, and cash
flows.
The Port follows private-sector standards of accounting and financial reporting issued by the
Financial Accounting Standards Board (FASB) prior to November 30, 1989, unless those standards
conflict with or contradict guidance of the GASB. The Port also has the option of following
subsequent private-sector guidance subject to the same limitation. The Port has elected not to follow
subsequent private-sector guidance.
Materials and Supplies Inventories – Inventories of materials and supplies are stated at average
cost on a first-in, first-out basis.
Capital Assets – Capital assets are carried at cost or at appraised fair market value at the date
received, in the case of properties acquired by donation, and by termination of leases for tenant
improvements, less allowance for accumulated depreciation.
32
(Continued)
PORT OF LOS ANGELES
(HARBOR DEPARTMENT OF THE
CITY OF LOS ANGELES),
A COMPONENT UNIT OF THE
CITY OF LOS ANGELES, CALIFORNIA
Notes to Financial Statements
June 30, 2008 and 2007
Depreciation – Depreciation is computed by use of the straight-line method over the estimated
useful lives of the assets.
Current ranges of useful lives for depreciable assets are as follows:
Wharves and sheds
Buildings and facilities
Equipment
10 to 15 years
10 to 50 years
3 to 20 years
Capitalization – The Port capitalizes all purchases greater than $5,000.
Preliminary Costs of Proposed Capital Projects – Development costs for proposed capital projects
that are incurred prior to the finalization of formal construction contracts are capitalized. Upon
completion of capital projects, such preliminary costs are transferred to the appropriate property
account. In the event the proposed capital projects are abandoned, the associated preliminary costs
are charged to expense in the year of abandonment.
Indirect Project Costs – The Port capitalizes indirect project costs associated with the acquisition,
development, and construction of new capital projects of the Port. Approximately $4,759,000 and
$3,876,000 of such indirect project costs were allocated to construction projects for the years 2008
and 2007, respectively.
Investments in Joint Powers Authorities and Other Entities – Investments in joint power
authorities are accounted for by the equity method.
Interest Costs – The Port capitalized interest paid during development and construction of its capital
projects, net of any investment income earned during the temporary investment of project related
borrowings. During the years ended June 30, 2008 and 2007, the Port capitalized net interest expense
of $307,000 and $1,779,000, respectively. For 2008, gross interest expense of $309,000 related to
Harbor Revenue Bonds 2006D was reduced by $2,000 of interest income. For fiscal year (FY) 2007,
gross interest expense of $330,000 related to commercial paper and $1,453,000 related to Harbor
Revenue Bonds 2006D were reduced by $4,000 of interest income. The remaining interest was
expensed as certain projects financed by the commercial paper and Harbor Revenue Bond 2006D
proceeds have been completed.
33
(Continued)
PORT OF LOS ANGELES
(HARBOR DEPARTMENT OF THE
CITY OF LOS ANGELES),
A COMPONENT UNIT OF THE
CITY OF LOS ANGELES, CALIFORNIA
Notes to Financial Statements
June 30, 2008 and 2007
Pooled Cash and Investments – In order to maximize investment return, the Port pools its available
cash with that of the City. The City Treasurer makes investment decisions.
Interest income and realized gains and losses arising from such pooled cash and investments are
apportioned to each participating City department/fund based on the relationship of such
department/fund’s respective daily cash balances to aggregate pooled cash and investments
(see note 2). The change in the fair value of pooled investments is allocated to each participating
City department/fund based on the aggregate respective cash balances at year-end.
The Port’s investments, including its share of the City’s pooled investments, are stated at fair value.
Fair value is determined based upon market closing prices or bid/asked prices for regularly traded
securities. The fair value of investments with no regular market is estimated based on similar traded
investments. The fair value of mutual funds, government-sponsored investment pools, and other
similar investments is stated at share value or appropriate allocation of fair value of the pool, if
separately reported. Certain money market investments with initial maturities at the time of purchase
of less than one year are recorded at cost. The calculation of realized gains is independent of the
calculation of the net increase in the fair value of investments. Realized gains and losses on
investments that had been held more than one fiscal year and sold in the current year may have been
recognized as an increase or decrease in fair value of investments reported in the prior year and the
current year.
Securities Lending – As a participant in the City of Los Angeles Investment Pool, the Port also
participates in the City of Los Angeles securities lending program. The investment collateral
received by the City together with the corresponding liability created is allocated among the City’s
participating funds using the same basis as allocation of interest income and realized gains or losses.
Accrued Employee Benefits – The Port records all accrued employee benefits, including
accumulated vacation and sick pay, as a liability in the period the benefits are earned. Accrued
employee benefits are treated as a liability for financial statement presentation.
Operating Leases – A substantial portion of the Port lands and facilities is leased to others. The
majority of these leases provide for cancellation on a 30-day notice by either party and for retention
of ownership by the Port or restoration of the property at the expiration of the agreement;
accordingly, no leases are considered capital leases for purposes of financial reporting (see note 8).
Statements of Cash Flows – For purposes of the statements of cash flows, the Port considers all
cash and investments pooled with the City, plus any other cash deposits or investments with initial
maturities of three months or less, to be cash and cash equivalents.
Pension and OPEB Plans – All full-time employees of the Port are eligible to participate in the City
Employees’ Retirement System of the City (the System), a plan available to substantially all City
full-time employees. Also, starting FY 2007, all full-time Port Police Officers are eligible to
participate in the Los Angeles Fire and Police Pension System (LAFPP), a defined benefit single34
(Continued)
PORT OF LOS ANGELES
(HARBOR DEPARTMENT OF THE
CITY OF LOS ANGELES),
A COMPONENT UNIT OF THE
CITY OF LOS ANGELES, CALIFORNIA
Notes to Financial Statements
June 30, 2008 and 2007
employer pension plan available to all full-time active sworn firefighters and police officers (except
Airport Police) of the City of Los Angeles. The Port’s policy is to fund its entire share of the System
and LAFPP pensions and the respective other postemployment benefit (OPEB) costs billed by the
City. The costs to be funded are determined annually as of July 1 by the System’s actuary and are
incorporated into the payroll burden rate to reimburse the City for the Port’s pro rata share of
contributions made (see note 9).
Capital Contributions – The Port receives grants for the purpose of acquisition or construction of
property and equipment. These grants are recorded as capital contributions when the grant is earned.
Grants are generally earned upon expenditure of funds.
Statement of Net Assets – The statements of net assets are designed to display the financial position
of the Port. The Port’s equity is reported as net assets, which is classified into three categories
defined as follows:
•
Invested in capital assets, net of related debt – This component of net assets consists of capital
assets, net of accumulated depreciation and reduced by the outstanding balances of any bonds,
notes, or other borrowings that are attributable to the acquisition, construction, or
improvement of those assets.
•
Restricted – This component of net assets consists of constraints placed on net asset use through
external constraints imposed by creditors (such as through debt covenants), grantors,
contributors, or law or regulations of other governments. It also pertains to constraints
imposed by law or constitutional provisions or enabling legislation.
•
Unrestricted – This component of net assets consists of net assets that do not meet the definition
of “restricted” or “invested in capital assets, net of related debt.”
When both restricted and unrestricted resources are available for use, it is the Port’s policy to use
restricted resources first, and then unrestricted resources, as they are needed.
Effects of Recent GASB Pronouncements –
The following GASB Statements will be implemented in future years.
35
(Continued)
PORT OF LOS ANGELES
(HARBOR DEPARTMENT OF THE
CITY OF LOS ANGELES),
A COMPONENT UNIT OF THE
CITY OF LOS ANGELES, CALIFORNIA
Notes to Financial Statements
June 30, 2008 and 2007
In December 2006, GASB issued Statement No. 49, "Accounting and Financial Reporting for
Pollution Remediation Obligations." This statement requires state and local governments to provide
the public with better information about the financial impact of environmental cleanup and identifies
the circumstances under which a government entity would be required to report a liability related to
pollution remediation and how to measure that liability. The statement also requires governments to
disclose information about their pollution obligations associated with clean up efforts in the notes to
the financial statements. GASB Statement No. 49 will be effective for financial statements for
periods beginning after December 15, 2007, but liabilities will be measured at the beginning of that
period so that beginning net assets can be restated.
The Port is required to implement the statement for the FY 2009 financial statements. The
Environmental Management group of the Port has identified the obligating events and has estimated
the amount that the Port needs to remedy the pollution. The group will continue to monitor and
gather the information that will be needed in FY 2009 reporting.
GASB Statement No. 51, “Accounting and Financial Reporting for Intangible Assets.” Issued in
June 2007, this statement establishes standards for accounting and financial reporting for intangible
assets, for all state and local governments. Types of assets that may be considered intangible assets
include easements, water rights, timber rights, patents, trademarks, and computer software. GASB
Statement No. 51 will be effective for the Port beginning in FY 2010. Retroactive reporting is
required. In FY 2008, the Port reported as an intangible asset the radio frequency that was acquired
for the Port Police. The Port will continue to analyze and record the intangible assets that will be
acquired in the future.
Use of Estimates – The preparation of financial statements in conformity with U.S. GAAP requires
management to make estimates and assumptions that affect certain reported amounts and disclosures.
Accordingly, actual results could differ from those estimates.
Reclassifications – Certain reclassifications have been made to the amounts reported in 2007 in
order to conform to the 2008 presentation. Such reclassifications had no effect on previously
reported change in net assets.
(2)
Cash and Investments
(a)
Cash and Pooled Investments
The cash balances of substantially all funds on deposit in the City Treasury are pooled and invested
by the City Treasurer for the purpose of maximizing interest earnings through pooled investment
activities but safety and liquidity still take precedence over return. Interest earned on pooled
investments is allocated to the participating funds based on each fund’s average daily deposit balance
during the allocation period with all remaining interest allocated to the General Fund. Investments in
the City Treasury are stated at fair value based on quoted market prices except for money market
36
(Continued)
PORT OF LOS ANGELES
(HARBOR DEPARTMENT OF THE
CITY OF LOS ANGELES),
A COMPONENT UNIT OF THE
CITY OF LOS ANGELES, CALIFORNIA
Notes to Financial Statements
June 30, 2008 and 2007
investments that have remaining maturities of one year or less at time of purchase, which are
reported at amortized cost.
Pursuant to California Government Code Section 53607 and the Los Angeles City Council File No.
94-2160, the City Treasury provides an Annual Statement of Investment Policy (the Policy) to the
City Council. The policy governs the City’s pooled investment practices. The Policy addresses
soundness of financial institutions in which the Treasurer will deposit funds and types of investment
instruments permitted by California Government Code Sections 53600-53636 and 16429.1.
Examples of investments permitted by the City’s pooled investment policy are obligations of the
U.S. Treasury and government agencies, commercial paper notes, negotiable certificates of deposit,
guaranteed investment contracts (none was invested in the General Pool or three of the Port’s Special
Investment Programs), bankers’ acceptances, medium-term corporate notes, money market accounts,
and the State of California Local Agency Investment Fund.
The Investment Advisory Committee (IAC) reviews investment performance and strategy. The IAC
is composed of the City Treasurer as chairperson, the Office of the Mayor, City Controller, Chief
Legislative Analyst, City Administrative Officer, Director of Office of Finance, and an external
investment advisor.
The Port’s cash and investments consist of the following (in thousands):
Cash in bank and certificates of deposit
Investment in U.S. Treasury money market fund
Equity in the City of Los Angeles Investment Pool
Total cash and investments
$
$
37
2008
2,415
9
654,792
657,216
2007
395
62
538,011
538,468
(Continued)
PORT OF LOS ANGELES
(HARBOR DEPARTMENT OF THE
CITY OF LOS ANGELES),
A COMPONENT UNIT OF THE
CITY OF LOS ANGELES, CALIFORNIA
Notes to Financial Statements
June 30, 2008 and 2007
Certain of the Port’s cash and investments are restricted as to use either by reason of bond indenture
requirements or actions of the Board. The Port’s unrestricted and restricted cash and investments are
as follows (in thousands):
2008
488,893
2007
380,139
Restricted cash and investments:
Current:
Emergency Fund
China Shipping Mitigation Fund
Community Aesthetics Mitigation Fund for Parks
Owner-Controlled Insurance Program
U.S. Customs House, Terminal Island
Other
Sub-total- Current
96,839
51,539
3,490
6,349
552
158,769
91,775
46,652
3,449
500
6,230
481
149,087
Noncurrent:
Harbor Revenue Bond Funds
Customer security deposits
Batiquitos Environmental Fund
Harbor Restoration Fund
Sub-total - Noncurrent
Total restricted cash and investments
Total cash and investments
9
3,206
5,796
543
9,554
168,323
657,216
62
3,154
5,508
518
9,242
158,329
538,468
Unrestricted cash and investments:
(b )
$
$
Deposits – Custodial Credit Risk
The Port has cash deposits and certificates of deposit with several major financial institutions
amounting to $2,414,846 and $395,160 at June 30, 2008 and 2007, respectively, with corresponding
bank balances of $166,665 and $167,718, respectively. The deposits are entirely covered by federal
depository insurance or are collateralized by securities held by the financial institutions in the Port’s
name in conformance with the State Government Code.
38
(Continued)
PORT OF LOS ANGELES
(HARBOR DEPARTMENT OF THE
CITY OF LOS ANGELES),
A COMPONENT UNIT OF THE
CITY OF LOS ANGELES, CALIFORNIA
Notes to Financial Statements
June 30, 2008 and 2007
(c)
Investments Authorized by the City’s Investment Policy
General Pool Investments
The table below identifies the investment types that are authorized for the Port by the City’s
investment policy for its General Pool, which conforms to the State Government Code. The table
also identifies certain provisions of the City’s investment policy that address interest rate risk, credit
risk, and concentration of credit risk. The City's investment policy is the same for 2008 and 2007.
Maximum
maturities
U.S. Treasury and Federal Agency Securities
Bonds issued by local agencies
Registered State Warrants and Municipal Notes
Bankers' Acceptances
Commercial Paper
Negotiable certificates of deposit or time deposits
Yankee certificates of deposit
CRA Certificates of Deposit or Time Deposits
Repurchase Agreements
Reverse Repurchase Agreements
Medium Term Corporate Notes
Shares of a Money Market Mutual Fund
Securities Lending Program
Asset Backed Securities
Collateralized Mortgage Obligations
Local Agency Investment Fund (LAIF)
*
**
***
5 years
5 years
5 years
180 days
270 days
180 days
180 days
180 days
32 days
92 days
5 years
N/A
N/A
5 years
5 years
Maximum
concentration
100
100
100
40
40
30
30
30
15
5*
30
20
20
20**
20**
(per state limit)***
The total of reverse repurchase agreements and the securities subject to a securities
lending agreement may not exceed 20% of the total portfolio.
Combined total for mortgage-backed and asset-backed securities
Current account limit is $40 million.
Special Investment Programs
The Port has three restricted funds that are invested in the City’s Special Investment Pools. These
are Emergency Fund 751, Restoration Fund 70L, and Batiquitos Long-term Investment Fund 72W.
Investments in the special pools are managed in accordance with the respective pool’s policy. If
none exists, the pool’s policy will be deemed to be the California State Government Code Sections
53600-53636 et seq. Funds in the three restricted funds were solely invested in government agency
securities with maturities of 182 days or less per Harbor department instruction, thus the lower rate
of return.
39
(Continued)
PORT OF LOS ANGELES
(HARBOR DEPARTMENT OF THE
CITY OF LOS ANGELES),
A COMPONENT UNIT OF THE
CITY OF LOS ANGELES, CALIFORNIA
Notes to Financial Statements
June 30, 2008 and 2007
(d)
City of Los Angeles Investment Pool
At June 30, 2008 and 2007, the investments held in the City Treasury’s General and Special
Investment Pool Programs and their maturities are as follows (in thousands):
Type of Investments
U.S. Treasury Notes
U.S. Agencies
Medium-Term Notes
Commercial Paper
State of California LAIF
Certificates of Deposit
Guaranteed Investment Contracts
Short-Term Investment Funds
Securities Lending Cash Collateral:
U.S. Treasury Notes
U.S. Agencies
Total General and
Special Pools
$
$
Investment Maturities June 30, 2008
31 ot 60
61 to 365
366 Days
Days
Days
To 5 Years
Amount
1 to 30
Days
1,619,055
1,530,897
1,186,097
1,984,742
1
8,000
135,224
38
—
230,356
—
1,450,906
1
—
135,224
38
—
174,594
—
386,282
—
—
—
—
—
224,569
352,990
147,554
—
8,000
—
—
1,619,055
901,378
833,107
—
—
—
—
—
918,758
10,721
—
—
—
—
—
—
918,758
10,721
7,393,533
1,816,525
560,876
733,113
4,283,019
40
(Continued)
PORT OF LOS ANGELES
(HARBOR DEPARTMENT OF THE
CITY OF LOS ANGELES),
A COMPONENT UNIT OF THE
CITY OF LOS ANGELES, CALIFORNIA
Notes to Financial Statements
June 30, 2008 and 2007
Type of Investments
Amount
U.S. Treasury Notes
$
U.S. Agencies
Medium-Term Notes
Commercial Paper
State of California LAIF
Short-Term Investment Funds
Securities Lending Cash
Collateral:
U.S. Treasury Notes
U.S. Agencies
Total General and
Special Pools
1 to 30
days
$
Investment Maturities June 30, 2007
31 ot 60
61 to 365
366 days
days
days
to 5 years
1,651,432
2,588,342
1,135,468
900,606
2,664
314,860
7
—
270,397
—
811,139
2,664
314,860
7
—
63,258
—
54,758
—
—
—
100,394
267,283
364,595
34,710
—
—
—
1,551,038
1,987,404
770,873
—
—
—
—
898,087
217,385
—
—
—
—
5,386
—
892,701
217,385
7,708,851
1,399,067
118,016
772,368
5,419,401
The City Treasurer manages a General Pool and various Special Investment Pools. The investment
disclosure information by pool is not available. Accordingly, disclosures provided herein represent
the combined General and Special Investment Pools.
The Port has $654,792,000 and $538,011,000 invested in the City’s General Pool and three Special
Investment Programs, which represent approximately 8.9% and 7.0% of the City Treasury’s General
Pool at June 30, 2008 and 2007, respectively.
Interest Rate Risk: The City’s investment policy limits the maturity of its investments as set forth in
(c) above.
Credit Risk: The City’s pooled investment policy requires that for all classes of investments, except
linked banking program certificates of deposits, the issuers’ minimum credit ratings shall be by
Standard and Poor’s Corporation (S&P) A-1/A or Moody’s Investor Services (Moody’s) P-1/A2 and,
if available Fitch IBCA F1/A. In addition, domestic banks are limited to those with a current Fitch
Ratings BankWatch of “B/C” or better and an A-1 short-term rating. The City Treasurer is granted
the authority to specify approved California banks with a Fitch Ratings BankWatch of “C” or better
and an A-2 rating where appropriate. In addition to a “AAA” rating for country risk, foreign banks
with domestic licensed offices must be rated “B” or better and TBW-1 short-term rating by Fitch
Ratings BankWatch. Domestic savings banks must be rated “B/C” or better and a TBW-1 short-term
rating by Fitch Ratings BankWatch.
Medium term notes must be issued by corporations operating within the United States and having
total assets in excess of $500 million. Commercial paper issuers must meet the preceding
41
(Continued)
PORT OF LOS ANGELES
(HARBOR DEPARTMENT OF THE
CITY OF LOS ANGELES),
A COMPONENT UNIT OF THE
CITY OF LOS ANGELES, CALIFORNIA
Notes to Financial Statements
June 30, 2008 and 2007
requirement or must be issued by corporations organized in the United States as a special purpose
corporation, trust or limited liability company having program-wide credit enhancements.
The City’s $1.53 billion investments in U.S. government-sponsored enterprises consist of securities
issued by the Federal Home Loan Bank - $594.5 million, Federal National Mortgage Association $293.8 million, Federal Home Loan Mortgage Corporation - $537.2 million, and Federal Farm
Credit Bank - $105.5 million. As of June 30, 2008, these securities carried the highest ratings of
AAA (S&P) and Aaa (Moody’s).
The City’s $1.19 billion investments in medium term notes consist of securities issued by banks and
corporations that comply with the requirements discussed above and were rated “A” or better by
S&P and “A3” or better by Moody’s.
The City’s $1.98 billion investments in commercial paper comply with the requirements discussed
above and were rated AAA/A-1+ by S&P and Aaa/P-1 by Moody’s.
The issuers of the guaranteed investment contracts (none was invested in the General Pool or three of
Port’s Special Investment Programs), certificate of deposits and the State of California Local Agency
Investment Fund (LAIF) are not rated.
Concentration of Credit Risk: The City’s investment policy does not allow more than 10.0% of its
investments portfolio, except U.S. Treasury and U.S. sponsored agency issues, to be invested in
securities of a single issuer including its related entities. The City’s investment policy further
provides for a maximum concentration limit of 30% on any individual federal agency or
government-sponsored entity. The City’s pooled investments comply with these requirements.
GAAP requires disclosure of certain investments in any one issuer that represent 5% or more of total
investments. Of the City’s total pooled investments as of June 30, 2008, $594.5 million (8%) was
invested in securities issued by the Federal Home Loan Bank and $537.2 million (7%) was invested
in securities issued by Federal Home Loan Mortgage Corporation.
(e)
City of Los Angeles Securities Lending Program
The Securities Lending Program (the SLP) is permitted and limited under provisions of California
Government Code Section 53601. The City Council approved the SLP on October 22, 1991 under
Council File No. 91-1860, which complies with the California Government Code. The objectives of
the SLP in priority order are: safety of loaned securities; and prudent investment of cash collateral to
enhance revenue from the investment program. The SLP is governed by a separate policy and
guidelines, with oversight responsibility of the Investment Advisory Committee.
The City’s custodial bank acts as the securities lending agent. In the event a counterparty defaults by
reason of an act of insolvency, the bank shall take all actions which it deems necessary or
appropriate to liquidate permitted investment and collateral in connection with such transaction and
shall make a reasonable effort for two business days (Replacement Period) to apply the proceeds
42
(Continued)
PORT OF LOS ANGELES
(HARBOR DEPARTMENT OF THE
CITY OF LOS ANGELES),
A COMPONENT UNIT OF THE
CITY OF LOS ANGELES, CALIFORNIA
Notes to Financial Statements
June 30, 2008 and 2007
thereof to the purchase of securities identical to the loaned securities not returned. If during the
Replacement Period the collateral liquidation proceeds are insufficient to replace any of the loaned
securities not returned, the bank shall, subject to payment by the City of the amount of any losses on
any permitted investments, pay such additional amounts as necessary to make such replacement.
Under the provisions of the SLP, and in accordance with the California Government Code, no more
than 20% of the market value of the General Investment Pool (the Pool) shall be available for
lending. The City receives cash as collateral on loaned securities, which is reinvested in securities
permitted under the Policy.
In accordance with the California Government Code, the securities lending agent marks to market
the value of both the collateral and the reinvestments daily. Except for open loans where either party
can terminate a lending contract on demand, term loans shall have a maximum life of 90 days.
Earnings from securities lending shall accrue to the Pool and shall be allocated on a pro-rata basis to
all Pool participants.
The Port’s share of cash collateral received and corresponding liability aggregated approximately
$73,692,000 and $69,252,000 at June 30, 2008 and 2007, respectively.
During the fiscal year, collateralizations on all loaned securities were within the required 102% of
market value. The City can sell collateral securities only in the event of borrower default. The
lending agent provides indemnification for borrower default. There were no violations of legal or
contractual provisions and no borrower or lending agent default losses during the year. There was no
credit risk exposure to the City because the amounts owed to the borrowers exceeded the amounts
borrowed. Loaned securities are held by the City’s agents in the City’s name and are not subject to
custodial credit risk.
(f)
Other Investment
Other investments of $9,351 and $61,809 at June 30, 2008 and 2007, respectively, consist of
investments in a money market mutual fund. With an objective of seeking maximum current income
to the extent consistent with preservation of capital and maintenance of liquidity, these investments
are made through the bond fund trustee bank and they may be invested, as specified in the indenture
of trust, with a portfolio consisting of: (1) U.S. dollar denominated deposit account, certificates of
deposit, federal funds and banker’s acceptances with domestic commercial banks, which have a
rating on their short term certificates of deposit on the date of purchase of the highest rating by Fitch,
if Fitch rates such instruments, “A-1” or “A-1+” by S&P and “P-1” by Moody’s and maturing no
more than 360 days after the date of purchase; (2) commercial paper which is rated at the time of
purchase in the single highest classification, by Fitch, if Fitch rates such instruments, “A-1+” by
S&P and “P-1” by Moody’s and which matures not more than 270 days after the date of purchase; (3)
investments in a money market fund rated “AAAm” or “AAAm-G” or better by S&P and “Aaa” by
Moody’s; and (4) pre-refunded municipal obligations defined as any bonds or other obligations of
any state of the U.S. or any agency, instrumentality or local government unit of any such state; (5)
43
(Continued)
PORT OF LOS ANGELES
(HARBOR DEPARTMENT OF THE
CITY OF LOS ANGELES),
A COMPONENT UNIT OF THE
CITY OF LOS ANGELES, CALIFORNIA
Notes to Financial Statements
June 30, 2008 and 2007
investment agreements approved in writing by each Insurer with a provider whose long-term
unsecured debt is rated in not lower than the second highest rating category of at least two of the
rating agencies and which will not adversely affect Fitch, Moody's or S&P's underlying rating on the
Bonds; (6) municipal obligations rated Aaa/AAA or general obligations of states rated in not lower
than the second highest rating category of at least two of the rating agencies; and, (7) other forms of
investments (including repurchase agreements) approved in writing by each Insurer and which will
not adversely affect Fitch, Moody's or S&P's underlying rating on the Bonds.
As of June 30, 2008, this money market fund was rated “Aaa” by Moody’s and “AAAm” by S&P.
44
(Continued)
PORT OF LOS ANGELES
(HARBOR DEPARTMENT OF THE
CITY OF LOS ANGELES),
A COMPONENT UNIT OF THE
CITY OF LOS ANGELES, CALIFORNIA
Notes to Financial Statements
June 30, 2008 and 2007
(3)
Capital Assets
The Port’s capital assets consist of the following activity for the years ended June 30, 2008 and 2007
(in thousands):
July 1,
2007
Capital assets not being depreciated:
Land
Construction in progress
Preliminary costs – capital projects
Intangible asset - radio frequency
$
Total capital assets not
being depreciated
Capital assets being depreciated/amortized:
Wharves and sheds
Buildings/facilities
Equipment
Total capital assets being
depreciated/amortized
Less accumulated depreciation/
amortization for:
Wharves and sheds
Buildings/facilities
Equipment
Subtotal
Total capital assets being
depreciated/amortized, net
Total capital assets, net
45
Decreases
991,153
211,329
123,071
-
21,144
85,895
17,936
1,050
(57,933)
(1,173)
-
1,012,297
239,291
139,834
1,050
1,325,553
126,025
(59,106)
1,392,472
661,963
1,669,330
63,549
4,932
33,712
12,136
(6,587)
(13,489)
(1,361)
660,308
1,689,553
74,324
2,394,842
50,780
(21,437)
2,424,185
(18,275)
(54,959)
(5,061)
(78,295)
12,715
1,411
14,126
(284,190)
(731,832)
(42,135)
(1,058,157)
1,400,854
(27,515)
(7,311)
1,366,028
2,726,407
98,510
(66,417)
2,758,500
(265,915)
(689,588)
(38,485)
(993,988)
$
Increases
June 30,
2008
(Continued)
PORT OF LOS ANGELES
(HARBOR DEPARTMENT OF THE
CITY OF LOS ANGELES),
A COMPONENT UNIT OF THE
CITY OF LOS ANGELES, CALIFORNIA
Notes to Financial Statements
June 30, 2008 and 2007
July 1,
2006
Capital assets not being depreciated:
Land
Construction in progress
Preliminary costs – capital projects
$
Total capital assets not
being depreciated
Capital assets being depreciated/
amortized:
Wharves and sheds
Buildings/facilities
Equipment
Total capital assets being
depreciated/amortized
$
June 30,
2007
35,336
36,641
27,398
(7)
(57,724)
(136)
991,153
211,329
123,071
1,284,045
99,375
(57,867)
1,325,553
656,696
1,661,073
62,203
5,267
48,527
8,871
(40,270)
(7,525)
661,963
1,669,330
63,549
2,379,972
62,665
(47,795)
2,394,842
(247,251)
(642,484)
(41,578)
(18,664)
(65,063)
(4,379)
17,959
7,472
(265,915)
(689,588)
(38,485)
(931,313)
(88,106)
25,431
(993,988)
1,448,659
(25,441)
(22,364)
1,400,854
2,732,704
73,934
(80,231)
2,726,407
Total accumulated
depreciation
Total capital assets, net
Decreases
955,824
232,412
95,809
Less accumulated depreciation/
amortization for:
Wharves and sheds
Buildings/facilities
Equipment
Total capital assets being
depreciated/
amortized, net
Increases
Net interest expense of $307,000 and $1,779,000 were capitalized for 2008 and 2007, respectively.
46
(Continued)
PORT OF LOS ANGELES
(HARBOR DEPARTMENT OF THE
CITY OF LOS ANGELES),
A COMPONENT UNIT OF THE
CITY OF LOS ANGELES, CALIFORNIA
Notes to Financial Statements
June 30, 2008 and 2007
(4)
Investment in Joint Powers Authorities and Other Entities
The Port has entered into two joint exercise of powers agreements and a shareholders’ agreement as
follows:
(a)
Intermodal Container Transfer Facility Joint Powers Authority
The Port and the Harbor Department of the City of Long Beach, California (Port of Long Beach)
entered into a joint exercise of powers agreement to form the Intermodal Container Transfer Facility
Joint Powers Authority (ICTF) for the purpose of financing and constructing a facility to transfer
cargo containers between trucks and railroad cars. The Port contributed $2,500,000 to the ICTF as
part of the agreement. The facility, which began operations in December 1986, was developed by
Southern Pacific Transportation Company (SPTC, subsequently a wholly owned subsidiary of Union
Pacific Corporation), which operates the facility under a long-term lease agreement. The Port
appoints two members of the ICTF’s five-member governing board and accounts for its investment
using the equity method. Both the Port of Los Angeles and the Port of Long Beach share income and
equity distributions equally.
Pursuant to an indenture of trust dated November 1, 1984, the ICTF issued $53,915,000 in bonds
(1984 Bonds) on behalf of the SPTC to construct the facility. In 1989, the ICTF issued $52,315,000
in refunding bonds (1989 Bonds) on behalf of the SPTC to advance refund all of the 1984 Bonds. In
1999, the ICTF, on behalf of the SPTC, again issued $42,915,000 of refunding bonds (1999 Bonds)
to advance refund all of the 1989 Bonds. The 1999 Bonds are payable solely from payments by the
SPTC under the lease agreement for use of the facility. The nature of the bonds is such that the
indebtedness is that of the SPTC and not of the ICTF, nor the Port of Los Angeles, nor the Port of
Long Beach.
The ICTF’s operations are financed from lease revenues by ICTF activities. The ICTF is empowered
to perform those actions necessary for the development of its facilities and related facilities,
including acquiring, constructing, leasing, and selling any of its property. The Port’s share of the
ICTF’s share of net assets at June 30, 2008 and 2007 is $12,255,000 and $7,814,000, respectively.
Separate financial statements for ICTF may be obtained from the Executive Director, Port of Long
Beach, 925 Harbor Plaza, Long Beach, California 90802.
(b)
Alameda Corridor Transportation Authority
In August 1989, the Port and the Port of Long Beach entered into a joint exercise of powers
agreement and formed the Alameda Corridor Transportation Authority (ACTA) for the purpose of
establishing a comprehensive transportation corridor and related facilities consisting of street and
railroad rights-of-way and an improved highway and railroad network along Alameda Street between
the Santa Monica Freeway and the Ports of Los Angeles and Long Beach in San Pedro Bay linking
the two ports to the central Los Angeles area. The Port of Los Angeles and the Port of Long Beach
share income and equity distributions equally.
47
(Continued)
PORT OF LOS ANGELES
(HARBOR DEPARTMENT OF THE
CITY OF LOS ANGELES),
A COMPONENT UNIT OF THE
CITY OF LOS ANGELES, CALIFORNIA
Notes to Financial Statements
June 30, 2008 and 2007
During fiscal year 1995, the Port and the Port of Long Beach purchased railroad rights-of-way and
other assets totaling approximately $370 million along the proposed corridor route.
At June 30, 1998, the Port had advanced a total of $13,334,000 to the ACTA to fund its share of
planning and other costs incurred to date. During fiscal year 1999, the ACTA reimbursed the Port for
all amounts advanced plus approximately $3.2 million of interest on such advances out of debt or
grant financing proceeds. In addition, the ACTA reimbursed the Port for approximately
$81.7 million of capital assets directly related to the ACTA’s mission, which the Port had previously
included in construction in progress. Of the capital assets transferred, approximately $22.2 million
had been funded by capital grants, which the Port had previously included in contributions/land
valuation equity. The Port has no share of the ACTA’s net assets and income at June 30, 2008 and
2007 and, accordingly, they have not been recorded in the accompanying financial statements.
Separate financial statements for ACTA may be obtained from the Chief Financial Officer, Alameda
Corridor Transportation Authority, One Civic Plaza Drive, Suite 350, Carson, California 90745.
(c)
Los Angeles Export Terminal, Inc.
On April 12, 1993, the Port entered into a shareholders’ agreement, which formed the LAXT for the
purpose of financing, constructing, and managing a dry bulk handling facility for the export of coal,
petroleum coke, and related products on land leased by permit from the Port.
The Port has contributed $19,000,000 to LAXT as part of the agreement. Such contribution
represents a 13.2% share of the total committed capital of $143,174,000. This capital was raised
from the shareholders through a purchase of stock in LAXT. The Port had the right to nominate two
directors to a 19-member board of directors. As of June 30, 1998, the terminal began operating under
a long-term lease agreement with a terminal manager/operator.
In June 2003, LAXT loaded the last coal vessel, thereby ceasing the coal operations at the facility.
As a result of a Settlement Agreement, Mutual Release and Compromise, and Permit Termination
Agreement, the Port, in March 2007, wrote off its $19,000,000 investment, or 100% of its share of
equity participation in the LAXT (see note 14.)
48
(Continued)
PORT OF LOS ANGELES
(HARBOR DEPARTMENT OF THE
CITY OF LOS ANGELES),
A COMPONENT UNIT OF THE
CITY OF LOS ANGELES, CALIFORNIA
Notes to Financial Statements
June 30, 2008 and 2007
(5)
Long-Term Liabilities
(a) Long-term debt consists of the following at June 30, 2008 and 2007:
Parity Bonds
HRB, Issue 2001, Series
HRB, Issue 2001, Series
HRB, Issue 2002, Series
HRB, Issue 2005, Series
HRB, Issue 2005, Series
HRB, Issue 2005, Series
HRB, Issue 2006, Series
HRB, Issue 2006, Series
HRB, Issue 2006, Series
HRB, Issue 2006, Series
A
B
A
A
B
C-1
A
B
C
D
Call
Provisions
8/1/2011 @
8/1/2011 @
8/1/2012 @
8/1/2015 @
8/1/2015 @
8/1/2015 @
8/1/2016 @
8/1/2016 @
8/1/2016 @
8/1/2016 @
100%
100%
100%
102%
102%
102%
102%
102%
102%
102%
Interest Rate
%
%
5.00
5.25 5.50
5.50
3.25 5.00
3.00 5.00
3.50 5.00
5.00
5.00
5.00
4.50 5.00
Maturity
Fiscal Year
2026
2023
2016
2027
2027
2018
2027
2027
2026
2037
Total Parity Bonds
Original
Amount
$
36,180
64,925
63,520
29,930
30,110
43,730
200,710
209,815
16,545
111,300
Balance
July 1, 2007
36,180
64,925
50,735
29,930
30,110
42,025
197,760
209,815
16,545
111,300
-
4,740
3,340
8,360
3,990
1,645
Balance
June 30, 2008
36,180
64,925
45,995
29,930
30,110
38,685
189,400
205,825
16,545
109,655
Additions
Reductions
Due Within
One Year
5,000
125
4,145
7,545
4,430
235
1,730
$
806,765
789,325
-
22,075
767,250
23,210
$
4,000
4,000
1,767
1,930
-
220
206
1,547
1,724
230
215
$
8,000
3,697
-
426
3,271
445
Department of Boating and Waterways (DBW) Loans
C#82-21-148
C#83-21-147
4.50
4.50
2014
2015
Total DBW Loans
Unamortized bond premium, net
Deferred loss on refunding
Current maturities of long-term debt
$
Total long-term debt
49
27,906
(16,113)
(22,501)
(24,248)
1,616
(1,054)
(23,094)
782,314
(24,248)
(31)
(Continued)
26,290
(15,059)
(23,655)
758,097
23,655
PORT OF LOS ANGELES
(HARBOR DEPARTMENT OF THE
CITY OF LOS ANGELES),
A COMPONENT UNIT OF THE
CITY OF LOS ANGELES, CALIFORNIA
Notes to Financial Statements
June 30, 2008 and 2007
Long-term debt consists of the following at June 30, 2007 and 2006:
Call
Parity Bonds
HRB, Issue 1996B
HRB, Issue 1996B&C
HRB, Issue 2001, Series A
HRB, Issue 2001, Series B
HRB, Issue 2002, Series A
HRB, Issue 2005, Series A
HRB, Issue 2005, Series B
HRB, Issue 2005, Series C-1
HRB, Issue 2005, Series C-2
HRB, Issue 2006, Series A
HRB, Issue 2006, Series B
HRB, Issue 2006, Series C
HRB, Issue 2006, Series D
Total Parity Bonds
Commercial Paper Notes
Provisions
8/1/2006 @ 101%
11/1/2006 @ 101%
8/1/2011 @ 100%
8/1/2011 @ 100%
8/1/2012 @ 100%
8/1/2015 @ 102%
8/1/2015 @ 102%
8/1/2015 @ 102%
Non-callable
8/1/2016 @ 102%
8/1/2016 @ 102%
8/1/2016 @ 102%
8/1/2016 @ 102%
Department of Boating and Waterways (DBW) Loans
C#82-21-148
C#83-21-147
Total DBW Loans
Maturity
Original
%
6.25
6.25
5.00
5.50
5.50
5.00
5.00
5.00
4.75
5.00
5.00
5.00
5.00
Fiscal Year
2027
2027
2026
2023
2016
2027
2027
2018
2007
2027
2027
2026
2037
Amount
$
300,000
320,000
36,180
64,925
63,520
29,930
30,110
43,730
4,090
200,710
$ 1,093,195
$
113,561
4.50
4.50
2014
2015
Interest Rate
%
5.25 5.25 5.25 3.25 3.00 3.50 -
4.50 -
$
$
Unamortized bond premium, net
Deferred loss on refunding
Current maturities of long-term debt
Total Debt
Balance
July 1, 2006
37,260
268,555
36,180
64,925
55,230
29,930
30,110
43,730
4,090
200,710
770,720
113,561
4,000
4,000
8,000
1,978
2,127
4,105
$
$
50
15,587
(16,208)
(90,503)
797,262
Balance
Additions
209,815
16,545
111,300
337,660
13,033
(1,707)
(22,501)
326,485
Reductions
37,260
268,555
-
Due Within
June 30, 2007
One Year
4,495
1,705
4,090
2,950
319,055
113,561
36,180
64,925
50,735
29,930
30,110
42,025
197,760
209,815
16,545
111,300
789,325
-
4,740
3,340
8,360
3,990
1,645
22,075
-
211
197
408
1,767
1,930
3,697
220
206
426
714
(1,802)
(90,503)
341,433
(Continued)
27,906
(16,113)
(22,501)
782,314
22,501
PORT OF LOS ANGELES
(HARBOR DEPARTMENT OF THE
CITY OF LOS ANGELES),
A COMPONENT UNIT OF THE
CITY OF LOS ANGELES, CALIFORNIA
Notes to Financial Statements
June 30, 2008 and 2007
(a)
Bonds Payable
1996 Series A Bonds
The Revenue Bonds, Issue of 1996 (the 1996 Series A Bonds), were issued by the Port of the City of
Los Angeles in the aggregate principal amount of $300,000,000 on April 23, 1996. Proceeds from
the sale of these insured 1996 Series A Bonds were used to finance construction of and
improvements to certain facilities owned by the Port, to redeem at maturity certain short-term
revenue certificates previously issued by the Port, and to pay certain costs of issuance in connection
with the 1996 Series A Bonds.
Interest on the 1996 Series A Bonds is payable semiannually on February 1 and August 1 of each
year commencing August 1, 1996. The 1996 Series A Bonds with maturity dates ranging from
August 1, 1997 through 2026 bear interest at rates from 5.00% to 6.25%. The term bonds are subject
to mandatory early redemption. The bonds maturing on or after August 1, 2006 are subject to
optional redemption with an early redemption premium. The bonds maturing on or after August 1,
2008 are subject to optional redemption without an early redemption premium. The 1996 Series A
Bonds are legal obligations of the Port payable solely from revenues of the Port and do not constitute
or evidence indebtedness of the City of Los Angeles.
On October 13, 2005, the Port issued the 2005 Series A Refunding Bonds for $29,930,000 to
advance refund, on a crossover basis, $30,935,000 of the 1996 Series A Bonds. Such 1996 Series A
Bonds were redeemed on their call date (the Crossover Date) of August 1, 2006 at a redemption
price of 101%.
In addition, the Port issued and applied a portion of the 2005 Series C-1 Refunding Bonds to provide
funds to reimburse Citigroup and De La Rosa for funds advanced by them for the purchase of
$15,525,000 of 1996 Series A Bonds tendered by the holders thereof in response to a voluntary open
market purchase solicitation. All such purchased 1996 Series A Bonds were cancelled on the date of
delivery of the Series 2005 Series C-1 Bonds.
On May 4, 2006, the Port issued the 2006 Series A Refunding Bonds for $200,710,000 to currently
refund, on a forward delivery basis, $202,705,000 of the 1996 Series A Bonds. On August 1, 2006,
all 1996 Series A Bonds were redeemed. For the Port's current refunding and advance refunding of
bonds, the difference between the reacquisition price and the net carrying amount of the refunded
bonds is deferred and amortized as interest expense over the life of the refunding bonds, which is
shorter than the remaining life of the refunded bonds.
The refunding transaction with the 2006 Series A Bonds resulted in an economic gain of
$27,665,368 and a reduction of $44,824,990 in future debt service payments.
51
(Continued)
PORT OF LOS ANGELES
(HARBOR DEPARTMENT OF THE
CITY OF LOS ANGELES),
A COMPONENT UNIT OF THE
CITY OF LOS ANGELES, CALIFORNIA
Notes to Financial Statements
June 30, 2008 and 2007
1996 Series B and C Bonds
The Revenue Bonds, Issue of 1996 Series B and Series C (the 1996 Series B and C Bonds), were
issued by the Port of the City of Los Angeles in the aggregate principal amount of $320,000,000 on
December 4, 1996. Proceeds from the sale of these insured 1996 Series B and C Bonds were used to
finance construction of and improvements to certain facilities owned by the Port, to pay certain costs
of issuance in connection with the 1996 Series B and C Bonds, and to advance refund the
outstanding balance of the 1995 Series A Bonds.
Interest on the 1996 Series B and C Bonds is payable semiannually on May 1 and November 1 of
each year commencing May 1, 1997, with principal payments commencing November 1, 1997. The
1996 Series B and C Bonds consist of serial and term bonds maturing in amounts ranging from
$340,000 to $21,960,000 at rates ranging from 4.875% to 6.25%.
The final maturity dates for 1996 Series B Bonds and 1996 Series C Bonds are November 1, 2026,
and 2025, respectively. The term bonds are subject to mandatory early redemption. The bonds
maturing on or after November 1, 2006 are subject to optional redemption with an early redemption
premium. The bonds maturing on or after November 1, 2008 are subject to optional redemption
without an early redemption premium. The 1996 Series B and C Bonds are legal obligations of the
Port payable solely from revenues of the Port and do not constitute or evidence indebtedness of the
City of Los Angeles.
The $21,350,000 of 1996 Series C Bonds was issued to advance refund $19,750,000 of outstanding
1995 Series A Bonds. The advance refunding resulted in a difference between the reacquisition price
and the net carrying amount of the 1995 Series A Bonds of $1,175,000. This difference, reported in
the accompanying financial statements as a deduction from bonds payable, is being charged to
operations through 2025 using the straight-line method.
On October 13, 2005, the Port issued the 2005 Series B Refunding Bonds for $30,110,000 to
advance refund, on a crossover basis, $31,690,000 of the 1996 Series B Bonds. Such 1996 Series B
Bonds were redeemed and cancelled on their call date (the Crossover Date) of November 1, 2006 at
the redemption price of 101%.
In addition, the Port issued and applied a portion of the 2005 Series C-1 Refunding Bonds to
reimburse Citigroup and De La Rosa for funds advanced by them for the purchase of $27,725,000 of
the 1996 Series B Bonds tendered by the holders in response to a voluntary open market purchase
solicitation. All such purchased 1996 Series B Bonds were cancelled on the date of delivery of
the 2005C-1 Series Bonds.
The Port issued the 2006 Series B Refunding Bonds for $209,815,000 and the 2006 Series C
Refunding Bonds for $16,545,000, on a forward-delivery basis, to currently refund $211,895,000 of
the 1996 Series B Bonds and $17,065,000 of the 1996 Series C Bonds. Such 1996 Series B Bonds
and 1996 Series C Bonds were redeemed and cancelled on their call date of November 1, 2006.
52
(Continued)
PORT OF LOS ANGELES
(HARBOR DEPARTMENT OF THE
CITY OF LOS ANGELES),
A COMPONENT UNIT OF THE
CITY OF LOS ANGELES, CALIFORNIA
Notes to Financial Statements
June 30, 2008 and 2007
The refunding of 1996 Series B Bonds and 1996 Series C Bonds was completed on November 1,
2006. The refunding transaction with the 2006 Series B Bonds resulted in an economic gain of
$18,879,238 and a reduction of $34,739,094 in future debt service payments. The refunding
transaction with the 2006 Series C Bonds resulted in an economic gain of $1,217,279 and a
reduction of $1,552,163 in future debt service payments.
2001 Series A Refunding Bonds
On July 11, 2001, the Port issued the 2001 Series A Refunding Bonds in the aggregate principal
amount of $36,180,000 to advance refund, on a crossover basis, $33,330,000 of the 1995 Series B
Bonds. Interest on the 2001 Series A Refunding Bonds is payable semiannually on February 1 and
August 1 of each year commencing February 1, 2002. The 2001 Series A Refunding Bonds with
maturity dates ranging from August 1, 2022 to 2025, bear interest at a rate of 5.0%. The bonds
maturing on or after August 1, 2011 are subject to optional redemption without an early redemption
premium.
The outstanding balances on the 2001 Series A Refunding Bonds, net of unamortized discount of
$870,566 and $921,776 and unamortized deferred amount on refunding of $793,166 and $839,823
were $34,516,268 and $34,418,401 at June 30, 2008 and 2007, respectively.
53
(Continued)
PORT OF LOS ANGELES
(HARBOR DEPARTMENT OF THE
CITY OF LOS ANGELES),
A COMPONENT UNIT OF THE
CITY OF LOS ANGELES, CALIFORNIA
Notes to Financial Statements
June 30, 2008 and 2007
Debt service of the Port’s 2001 Series A Refunding Bonds is as follows (in thousands):
Fiscal Year
2009
2010
2011
2012
2013
2014-2018
2019-2023
2024-2026
$
Sub-total
Annual Debt Service Requirement
Principal
Interest
Total
1,809
1,809
1,809
1,809
1,809
1,809
1,809
1,809
1,809
1,809
9,045
9,045
9,018
9,018
36,180
2,689
38,869
36,180
29,797
65,977
Unamortized Deferred Amount on Refunding
of 1995 Series B
(793)
-
(793)
Unamortized Discount
(871)
-
(871)
34,516
29,797
64,313
Total
$
2001 Series B Bonds
The Port issued the 2001 Series B Refunding Bonds in the aggregate principal amount of
$64,925,000 to purchase $60,850,000 of the 1995 Series B Bonds tendered by bondholders in
response to an open market purchase solicitation conducted through its underwriters.
Interest on the 2001 Series B Refunding Bonds is payable semiannually on February 1 and August 1
of each year commencing on February 1, 2002. The 2001 Series B Refunding Bonds with maturity
dates ranging from August 1, 2015 to 2022, bear interest at rates from 5.25% to 5.50%. The bonds
maturing on or after August 1, 2011 are subject to optional redemption without an early redemption
premium.
The outstanding balances on the 2001 Series B Refunding Bonds, net of unamortized premium of
$725,427 and $777,243 and unamortized deferred amount on refunding of $2,994,396 and
$3,208,281, were $62,656,031 and $62,493,962 at June 30, 2008 and 2007, respectively.
54
(Continued)
PORT OF LOS ANGELES
(HARBOR DEPARTMENT OF THE
CITY OF LOS ANGELES),
A COMPONENT UNIT OF THE
CITY OF LOS ANGELES, CALIFORNIA
Notes to Financial Statements
June 30, 2008 and 2007
Debt service of the Port’s 2001 Series B Refunding Bonds is as follows (in thousands):
Fiscal Year
2009
2010
2011
2012
2013
2014-2018
2019-2023
$
Annual Debt Service Requirement
Principal
Interest
Total
3,547
3,547
3,547
3,547
3,547
3,547
3,547
3,547
3,547
3,547
18,365
16,523
34,888
46,560
6,456
53,016
Sub-total
64,925
Unamortized Deferred Amount on Refunding
of 1995 Series B
(2,994)
Unamortized Premium
Total
$
40,714
-
105,639
(2,994)
725
-
725
62,656
40,714
103,370
2002 Series A Bonds
The 2002 Series A Refunding Bonds were issued in the aggregate principal amount of $63,520,000
on May 6, 2002, on a crossover basis, to advance refund $64,110,000 of the outstanding 1995
Series B Bonds at their first redemption date of August 1, 2002, with the exception of 1995 Series B
Bonds maturing on August 1, 2002 and 2003.
Interest on the 2002 Series A Refunding Bonds is payable semiannually on February 1 and August 1
of each year commencing on August 1, 2002. The 2002 Series A Refunding Bonds with maturity
ranging from August 1, 2004 to 2015, bear interest at a rate of 5.50%. The bonds maturing on or
after August 1, 2012 are subject to optional redemption without an early redemption premium.
Prior to the Crossover Date, interest on the 2002 Series A Refunding Bonds were secured and
payable solely from amounts held in a crossover refunding escrow account created pursuant to the
issue’s indenture. The outstanding balances on the 2002 Series A Refunding Bonds, net of
unamortized premium of $1,277,077 and $1,457,371 and unamortized deferred amount on refunding
of $1,096,429 and $1,251,219 were $46,175,648 and $50,941,152 at June 30, 2008 and 2007,
respectively.
55
(Continued)
PORT OF LOS ANGELES
(HARBOR DEPARTMENT OF THE
CITY OF LOS ANGELES),
A COMPONENT UNIT OF THE
CITY OF LOS ANGELES, CALIFORNIA
Notes to Financial Statements
June 30, 2008 and 2007
Debt service of the Port’s 2002 Series A Refunding Bonds is as follows (in thousands):
Fiscal Year
2009
2010
2011
2012
2013
2014-2016
$
Annual Debt Service Requirement
Principal
Interest
Total
5,000
2,392
7,392
5,275
2,110
7,385
5,565
1,812
7,377
5,865
1,497
7,362
6,190
1,166
7,356
18,100
1,391
19,491
Sub-total
45,995
Unamortized Deferred Amount on Refunding
of 1995 Series B
(1,096)
-
(1,096)
1,277
-
1,277
46,176
10,368
56,544
Unamortized Premium
Total
$
10,368
56,363
On August 1, 2002, the refunding of 1995 Series B Bonds was completed and resulted in a difference
between the reacquisition price and the net carrying amount of the 1995 Series B Bonds of
$3,818,649. The difference is prorated to 2001 Series A Bonds, 2001 Series B Bonds, and 2002
Series A Bonds based on the face value. They are reported in the accompanying financial statements
as a deduction from bonds payable and charged to operations through 2025 using the straight-line
method.
2005 Series A Bonds
The 2005 Series A Refunding Bonds were issued on October 13, 2005 in the aggregate principal
amount of $29,930,000 to advance refund, on a crossover basis, $30,935,000 of the 1996 Series A
Bonds on their call date of August 1, 2006 .
Interest on the 2005 Series A Bonds is payable semiannually on February 1 and August 1 of each
year commencing February 1, 2006. The 2005 Series A Bonds with maturity dates ranging from
August 1, 2010 to 2026, bear interest at rates from 3.25% to 5.00%. The bonds maturing on or after
August 1, 2015 are subject to optional redemption at the redemption price of 102%.
Prior to the Crossover Date, interest on the Series 2005 Series A Bonds is payable from and secured
solely by investment receipts from and amounts on deposit in the related crossover refunding escrow
accounts. Until the crossover date, the 2005 Series A Bonds are not on parity with other outstanding
Harbor Revenue Bonds.
56
(Continued)
PORT OF LOS ANGELES
(HARBOR DEPARTMENT OF THE
CITY OF LOS ANGELES),
A COMPONENT UNIT OF THE
CITY OF LOS ANGELES, CALIFORNIA
Notes to Financial Statements
June 30, 2008 and 2007
The outstanding balance on the 2005 Series A Bonds, plus the unamortized premium of $1,741,611
and $1,838,921 and unamortized deferred amount on refunding of $527,346 and $556,508 were
$31,144,265 and $31,212,413 at June 30, 2008 and 2007, respectively.
Debt service of the Port’s 2005 Series A Bonds is as follows (in thousands):
Fiscal Year
2009
2010
2011
2012
2013
2014-2018
2019-2023
2024-2027
$
Sub-total
29,930
Unamortized Deferred Amount on Refunding
of 1996 Series A
(527)
Unamortized Premium
Total
Annual Debt Service Requirement
Principal
Interest
Total
1,433
1,433
1,433
1,433
275
1,428
1,703
1,285
1,401
2,686
1,315
1,358
2,673
7,575
5,846
13,421
9,730
3,702
13,432
9,750
1,006
10,756
$
17,607
-
47,537
(527)
1,742
-
1,742
31,145
17,607
48,752
2005 Series B Bonds
The 2005 Series B Refunding Bonds were issued on October 13, 2005 in the aggregate principal
amount of $30,110,000, on a crossover basis, to advance refund $31,690,000 of the 1996 Series B
Bonds on their call date of November 1, 2006 (the Crossover Date).
Interest on the 2005 Series B Bonds is payable semiannually on February 1 and August 1 of each
year, commencing February 1, 2006. The 2005 Series B Bonds with maturity dates ranging from
August 1, 2008 to August 1, 2026, bear interest at rates from 3.00% to 5.00%. The bonds maturing
on or after August 1, 2015 are subject to optional redemption at the redemption price of 102%.
Prior to the Crossover Date, interest on the 2005 Series B Bonds is payable from and secured solely
by investment receipts from deposits in the related crossover refunding escrow funds. Until the
Crossover Date, the 2005 Series B Bonds are not on parity with other outstanding Harbor Revenue
Bonds.
57
(Continued)
PORT OF LOS ANGELES
(HARBOR DEPARTMENT OF THE
CITY OF LOS ANGELES),
A COMPONENT UNIT OF THE
CITY OF LOS ANGELES, CALIFORNIA
Notes to Financial Statements
June 30, 2008 and 2007
The outstanding balance on the 2005 Series B Bonds, plus the unamortized premium of $1,778,702
and $1,877,063 and unamortized deferred amount on refunding of $508,123 and $536,222 were
$31,380,579 and $31,450,841 at June 30, 2008 and 2007, respectively.
Debt service of the Port’s 2005 Series B Bonds is as follows (in thousands):
Fiscal Year
2009
2010
2011
2012
2013
2014-2018
2019-2023
2024-2027
$
Sub-total
Annual Debt Service Requirement
Principal
Interest
Total
125
1,434
1,559
850
1,419
2,269
1,200
1,382
2,582
1,215
1,334
2,549
1,280
1,284
2,564
7,455
5,458
12,913
9,575
3,347
12,922
8,410
783
9,193
30,110
Unamortized Deferred Amount on Refunding
of 1996 Series B
16,441
(508)
Unamortized Premium
-
1,779
Total
$
31,381
$
46,551
(508)
-
1,779
16,441
47,822
2005 Series C Refunding Bonds
The 2005 Series C-1 Refunding Bonds were issued on October 13, 2005 in the aggregate principal
amount of $43,730,000, to reimburse Citigroup and De La Rosa for and to pay fees associated with
the purchase on the open market of the purchased 1996 Bonds.
Interest on the 2005 Series C-1 Bonds is payable semiannually on February 1 and August 1 of each
year commencing February 1, 2006, with principal payments commencing August 1, 2006. The 2005
Series C-1 Bonds with maturity dates ranging from August 2006 to 2017, bear interest at rates from
3.50% to 5.00%. The bonds maturing on or after August 1, 2015 are subject to optional redemption
at the redemption price of 102%.
The 2005 Series C-2 Bond was issued for $4,090,000 to pay certain issuance costs. The 2005 Series
C-2 Bond was sold at rate of 4.75%. The bond matured on August 1, 2006 and was not subject to
redemption prior to maturity.
58
(Continued)
PORT OF LOS ANGELES
(HARBOR DEPARTMENT OF THE
CITY OF LOS ANGELES),
A COMPONENT UNIT OF THE
CITY OF LOS ANGELES, CALIFORNIA
Notes to Financial Statements
June 30, 2008 and 2007
The outstanding balances on the 2005 Series C Refunding Bonds, net of unamortized premium of
$1,999,705 and $2,219,856 and unamortized deferred amount on refunding of $1,392,898 and
$1,546,245, were $39,291,807 and $42,698,611 at June 30, 2008 and 2007, respectively.
Debt service of the Port’s 2005 Series C Bonds is as follows (in thousands):
Fiscal Year
2009
2010
2011
2012
2013
2014-2018
$
Annual Debt Service Requirement
Principal
Interest
Total
4,145
1,822
5,967
1,540
1,680
3,220
7,125
1,463
8,588
15,290
903
16,193
521
521
10,585
2,237
12,822
Sub-total
38,685
Unamortized Deferred Amount on Refunding
of 1996 Series A & 1996 Series B
(1,393)
-
(1,393)
2,000
-
2,000
39,292
8,626
47,918
Unamortized Premium
Total
$
8,626
47,311
The 2005 Series A, B and C refunding transactions resulted in an economic gain of $4,049,353 and a
reduction of $6,103,824 in future debt service payments.
2006 Series A Refunding Bonds
The 2006 Series A Refunding Bonds were issued on May 4, 2006 in the aggregate principal amount
of $200,710,000, on a forward delivery basis, to currently refund $202,705,000 of the 1996A Bonds.
Interest on the 2006 Series A Bonds is payable semiannually on February 1 and August 1 of each
year. Principal and interest are payable commencing August 1, 2006. The 2006 Series A Bonds bear
interest at rate of 5.00% with maturity dates ranging from August 1, 2007 to August 1, 2026. The
bonds maturing on or after August 1, 2016 are subject to optional redemption at the redemption price
of 102%.
The outstanding balance of the 2006 Series A Bonds, net of unamortized premium of $7,722,507 and
$8,149,558 and unamortized deferred amount on refunding of $3,383,348 and $3,570,446 were
$193,739,159 and $202,339,112 at June 30, 2008 and 2007, respectively.
59
(Continued)
PORT OF LOS ANGELES
(HARBOR DEPARTMENT OF THE
CITY OF LOS ANGELES),
A COMPONENT UNIT OF THE
CITY OF LOS ANGELES, CALIFORNIA
Notes to Financial Statements
June 30, 2008 and 2007
Debt service of the Port’s 2006 Series A Bonds is as follows (in thousands):
Fiscal Year
2009
2010
2011
2012
2013
2014-2018
2019-2023
2024-2027
Annual Debt Service Requirement
Interest
Total
Principal
7,545
9,281
16,826
8,515
8,880
17,395
1,270
8,635
9,905
800
8,584
9,384
7,015
8,388
15,403
43,835
35,643
79,478
55,125
23,597
78,722
65,295
7,001
72,296
$
Sub-total
189,400
Unamortized Deferred Amount
on Refunding of 1996 Series A
Unamortized Premium
Total
$
110,009
299,409
(3,384)
-
(3,384)
7,724
-
7,724
193,740
110,009
303,749
The 2006 Series A refunding transactions resulted in an economic gain of $27,665,368 and a
reduction of $44,824,990 in future debt service payments.
2006 Series B Refunding Bonds
The 2006 Series B Refunding Bonds were issued on August 3, 2006 in the aggregate principal
amount of $209,815,000, on a forward delivery basis, to currently refund $211,895,000 of the 1996B
Bonds.
Interest on the 2006 Series B Bonds is payable semiannually on February 1 and August 1 of each
year. The 2006 Series B Bonds bear interest at rate of 5.00% with maturity dates ranging from
August 1, 2007 to August 1, 2026. The bonds maturing on or after August 1, 2016 are subject to
optional redemption at the redemption price of 102%.
The outstanding balance on the 2006 Series B Bonds, net of unamortized premium of $7,555,445
and $7,973,257 and unamortized deferred amount on refunding of $4,041,568 and $4,265,064 was
$209,338,877 and $213,523,193 at June 30, 2008 and 2007, respectively.
60
(Continued)
PORT OF LOS ANGELES
(HARBOR DEPARTMENT OF THE
CITY OF LOS ANGELES),
A COMPONENT UNIT OF THE
CITY OF LOS ANGELES, CALIFORNIA
Notes to Financial Statements
June 30, 2008 and 2007
Debt service of the Port’s 2006 Series B Bonds is as follows (in thousands):
Fiscal Year
2009
2010
2011
2012
2013
2014-2018
2019-2023
2024-2027
$
Sub-total
205,825
Unamortized Deferred Amount
on Refunding of 1996 Series B
Unamortized Premium
Total
Annual Debt Service Requirement
Principal
Interest
Total
4,430
10,181
14,611
5,975
9,920
15,895
7,885
9,574
17,459
9,377
9,377
9,935
9,128
19,063
43,890
38,432
82,322
71,290
24,764
96,054
62,420
6,257
68,677
$
117,633
323,458
(4,042)
-
(4,042)
7,556
-
7,556
209,339
117,633
326,972
The 2006 Series B refunding transactions resulted in an economic gain of $18,879,238 and a
reduction of $34,739,094 in future debt service payments.
2006 Series C Refunding Bonds
The 2006 Series C Refunding Bonds were issued on August 3, 2006 in the aggregate principal
amount of $16,545,000, on a forward delivery basis, to currently refund $17,065,000 of the 1996
Series C Bonds.
Interest on the 2006 Series C Bonds is payable semiannually on February 1 and August 1 of each
year. The 2006 Series C Bonds bear interest at rate of 5.00% with maturity dates ranging from
August 1, 2008 to August 1, 2025. The bonds maturing on or after August 1, 2016 are subject to
optional redemption at the redemption price of 102%.
The outstanding balance on the 2006 Series C Bonds, net of unamortized premium of $918,253 and
$972,005 and unamortized deferred amount on refunding of $320,205 and $338,949 was
$17,143,048 and $17,178,056 at June 30, 2008 and 2007, respectively.
61
(Continued)
PORT OF LOS ANGELES
(HARBOR DEPARTMENT OF THE
CITY OF LOS ANGELES),
A COMPONENT UNIT OF THE
CITY OF LOS ANGELES, CALIFORNIA
Notes to Financial Statements
June 30, 2008 and 2007
Debt service of the Port’s 2006 Series C Bonds is as follows (in thousands):
Fiscal Year
2009
2010
2011
2012
2013
2014-2018
2019-2023
2024-2026
$
Sub-total
Annual Debt Service Requirement
Principal
Interest
Total
235
821
1,056
635
800
1,435
665
767
1,432
700
733
1,433
730
697
1,427
4,250
2,885
7,135
5,415
1,681
7,096
3,915
299
4,214
16,545
Unamortized Deferred Amount
on Refunding of 1996 Series C
Unamortized Premium
Total
$
8,683
25,228
(320)
-
(320)
918
-
918
17,143
8,683
25,826
The 2006 Series C refunding transactions resulted in an economic gain of $1,217,279 and a
reduction of $1,552,163 in future debt service payments.
62
(Continued)
PORT OF LOS ANGELES
(HARBOR DEPARTMENT OF THE
CITY OF LOS ANGELES),
A COMPONENT UNIT OF THE
CITY OF LOS ANGELES, CALIFORNIA
Notes to Financial Statements
June 30, 2008 and 2007
2006 Series D Refunding Bonds
The 2006 Series D Refunding Bonds were issued on August 31, 2006 in the aggregate principal
amount of $111,300,000, to refund $113,561,000 of the Commercial Paper Notes.
Interest on the 2006 Series D Bonds is payable semiannually on February 1 and August 1 of each
year. The 2006 Series D Bonds bear interest at rates ranging from 4.5% to 5.00% with maturity dates
from August 1, 2007 to August 1, 2036. The bonds maturing on or after August 1, 2014 are subject
to optional redemption at the redemption price of 101%.
The outstanding balance on the 2006 Series D Bonds, net of unamortized premium of $3,440,453
and $3,562,962 was $113,095,453 and $114,862,962 at June 30, 2008 and 2007, respectively.
Debt service of the Port’s 2006 Series D Bonds is as follows (in thousands):
Fiscal Year
2009
2010
2011
2012
2013
2014-2018
2019-2023
2024-2028
2029-2033
2034-2037
Annual Debt Service Requirement
Principal
Interest
Total
1,730
5,368
7,098
1,820
5,279
7,099
1,915
5,186
7,101
2,010
5,088
7,098
2,115
4,984
7,099
12,310
23,180
35,490
15,810
19,683
35,493
20,295
15,202
35,497
25,825
9,670
35,495
25,825
2,571
28,396
$
Sub-total
Unamortized Premium
Total
$
63
109,655
96,211
205,866
3,440
-
3,440
113,095
96,211
209,306
(Continued)
PORT OF LOS ANGELES
(HARBOR DEPARTMENT OF THE
CITY OF LOS ANGELES),
A COMPONENT UNIT OF THE
CITY OF LOS ANGELES, CALIFORNIA
Notes to Financial Statements
June 30, 2008 and 2007
Bond Premium and Discount
The Port amortizes the original issue discount or premium over the life of each bond issue. Unamortized
bond discount or premium, at the time of refunding, is amortized over the shorter of the life of the refunded
bonds or the life of the refunding bonds. The unamortized amount for each Port issue is as follows:
2008
(D isco u n t)
P rem iu m
B o n d Issu e
2001A
2001B
2002A
2005A
2005B
2 0 0 5 C -1
2006A
2006B
2006C
2006D
T o ta l
$
$
2007
(D isco u n t)
P rem iu m
(8 7 1 )
725
1 ,2 7 7
1 ,7 4 2
1 ,7 7 9
2 ,0 0 0
7 ,7 2 4
7 ,5 5 6
918
3 ,4 4 0
2 6 ,2 9 0
(9 2 2 )
777
1 ,4 5 7
1 ,8 3 8
1 ,8 7 7
2 ,2 2 0
8 ,1 5 1
7 ,9 7 3
972
3 ,5 6 3
2 7 ,9 0 6
64
(Continued)
PORT OF LOS ANGELES
(HARBOR DEPARTMENT OF THE
CITY OF LOS ANGELES),
A COMPONENT UNIT OF THE
CITY OF LOS ANGELES, CALIFORNIA
Notes to Financial Statements
June 30, 2008 and 2007
The Port’s required debt service payments for long-term debt for the years ending June 30 are as
follows:
Fiscal Ye ar Ending
Principal
2009
2010
2011
2012
2013
2014-2018
2019-2023
2024-2028
2029-2033
2034-2037
$
Subtotal
Unamortized bond (discount) premium, net
Deferred loss on refunding
Current maturities of long term debt
(b)
$
Total
23,655
25,075
26,386
27,673
29,111
167,200
214,595
205,175
25,825
25,826
38,235
37,004
35,709
34,357
32,944
140,690
92,248
33,237
9,670
2,572
61,890
62,079
62,095
62,030
62,055
307,890
306,843
238,412
35,495
28,398
770,521
456,666
1,227,187
26,290
(15,059)
(23,655)
Total debt service payments
Inte re st
758,097
456,666
26,290
(15,059)
(23,655)
1,214,763
Other Debt
Commercial Paper
On November 1, 2001, the Port obtained a credit agreement to provide liquidity support for the
issuance of Commercial Paper Notes (Notes) not to exceed $375,000,000 as a means of interim
financing primarily for the construction, maintenance, and replacement of the Port’s structures,
facilities, and equipment. Rates vary on the Notes from 2.38% to 3.45% during the fiscal year ended
June 30, 2006. Due dates also vary, but within the limit of 270 days from the issue dates.
In fiscal year 2006, the Notes were remarketed for principal only. On August 31, 2006, the
outstanding Commercial Paper of $113,561,000 was refunded through the issuance of the 2006
Series D Refunding Bonds in the aggregate principal amount of $111,300,000.
At June 30, 2008 and 2007, the outstanding Commercial Paper balance was zero.
65
(Continued)
PORT OF LOS ANGELES
(HARBOR DEPARTMENT OF THE
CITY OF LOS ANGELES),
A COMPONENT UNIT OF THE
CITY OF LOS ANGELES, CALIFORNIA
Notes to Financial Statements
June 30, 2008 and 2007
California Department of Boating and Waterways
The Port obtained two loans aggregating $8,000,000 from the California Department of Boating and
Waterways. The notes currently bear interest at 4.5%. The Port makes annual payments of interest
and principal and the notes will mature in 2014 and 2015, respectively. The Port’s obligation with
respect to the payment of such notes is subordinate to the lien of the Port’s Parity Obligations on the
Harbor Revenue Funds. The outstanding balances on such notes were $3,270,841 and $3,696,946 at
June 30, 2008 and 2007, respectively.
Debt service of the Port’s indebtedness is as follows (in thousands):
F iscal y ea r
2009
2010
2011
2012
2013
2 0 1 4 -2 0 1 5
T o tal
(c)
$
$
P rin cip al
445
465
486
508
531
836
3 ,2 7 1
In terest
147
127
106
84
61
51
576
T o tal
592
592
592
592
592
887
3 ,8 4 7
Current Year and Prior Years’ Defeasance of Debt
Bonds were defeased through the establishment of irrevocable escrow funds with a major financial
institution. Monies placed in trust, when considered with interest to be earned thereon, will be
sufficient to make required debt service payments through the earliest possible debt retirement dates.
Accordingly, the liability for those bonds has been removed from the accompanying financial
statements.
The remaining bonds in the defeasance escrows held by the trustee at June 30, 2008 and 2007 were
as follows (in thousands):
1988 Bonds
2008
84,665
$
66
2007
89,525
(Continued)
PORT OF LOS ANGELES
(HARBOR DEPARTMENT OF THE
CITY OF LOS ANGELES),
A COMPONENT UNIT OF THE
CITY OF LOS ANGELES, CALIFORNIA
Notes to Financial Statements
June 30, 2008 and 2007
(d)
Changes in Long-Term Liabilities
Long-term liability activity for the years ended June 30, 2008 and 2007 was as follows
(in thousands):
Revenue bonds payable
$
Less unamortized
discount/premium
Unamortized deferred
amount on refunding
Total revenue
bonds payable
Notes payable
Unearned revenue and other
deferred credit
Accrued employee benefits
Other liabilities
(notes 7, 16, 18 and 19)
Total long-term
liabilities
$
July 1,
2007
789,325
Additions
—
Reductions
(22,075)
June 30,
2008
767,250
27,906
—
(1,616)
26,290
—
(16,113)
—
1,054
(15,059)
—
801,118
3,697
—
—
(22,637)
(426)
778,481
3,271
23,210
445
358
20,729
1,507
—
—
(2,151)
1,865
18,578
1,865
10,626
84,782
49,135
(34,593)
99,324
82,004
910,684
50,642
(59,807)
901,519
118,150
67
Due within
one year
23,210
(Continued)
PORT OF LOS ANGELES
(HARBOR DEPARTMENT OF THE
CITY OF LOS ANGELES),
A COMPONENT UNIT OF THE
CITY OF LOS ANGELES, CALIFORNIA
Notes to Financial Statements
June 30, 2008 and 2007
July 1,
2006
770,720
Revenue bonds payable
$
Less unamortized
discount/premium
15,587
Unamortized deferred
amount on refunding
(16,208)
Total revenue
bonds payable
770,099
Notes payable
4,105
Commercial paper
113,561
Unearned revenue and other
deferred credit
3,141
Accrued employee benefits
14,199
Other liabilities
(note 7, 16 and 18)
111,662
Total long-term
liabilities
$ 1,016,767
(6)
Additions
337,660
Reductions
(319,055)
June 30,
2007
789,325
Due within
one year
22,075
13,033
(714)
27,906
(1,707)
1,802
(16,113)
348,986
—
—
(317,967)
(408)
(113,561)
801,118
3,697
—
22,075
426
—
—
6,530
(2,783)
—
358
20,729
358
13,438
5,073
(31,953)
84,782
62,391
360,589
(466,672)
910,684
98,688
—
—
Employee-Deferred Compensation Plan
The City offers a deferred compensation plan created in accordance with Internal Revenue Code
Section 457 to its employees, in which the Port and its employees participate, allowing them to defer or
postpone receipt of income. Amounts so deferred may not be paid to the employee during employment
with the City, except for a catastrophic circumstance creating an undue financial hardship for the
employee.
As a result of changes to Section 457 deferred compensation plans resulting from the Small Business Job
Protection Act of 1996, the City’s deferred compensation plan administrator established a custodial
account on behalf of the plan participants. All amounts deferred by the Port’s employees are paid to the
City, which in turn pays them to the deferred compensation plan administrator. All amounts of
compensation deferred under the plan, all property and rights purchased with those amounts, and all
income attributable to those amounts are held in such custodial account for the exclusive benefit of the
employee participants and their beneficiaries. Information on the Port employees’ share of plan assets is
not available.
68
(Continued)
PORT OF LOS ANGELES
(HARBOR DEPARTMENT OF THE
CITY OF LOS ANGELES),
A COMPONENT UNIT OF THE
CITY OF LOS ANGELES, CALIFORNIA
Notes to Financial Statements
June 30, 2008 and 2007
While the City has full power and authority to administer and to adopt rules and regulations for the plan,
all investment decisions under the plan are the responsibility of the plan participants. The City has no
liability for losses under the plan, but does have the duty of due care that would be required of an ordinary
prudent investor. Under certain circumstances, employees may modify their arrangements with the plan to
provide for greater or lesser contributions or to terminate their participation. If participants retire under the
plan or terminate service with the City, they may be eligible to receive payments under the plan in
accordance with the provisions thereof. In the event of serious financial emergency, the City may approve,
upon request, withdrawals from the plan by the participants, along with their allocated contributions.
(7)
Risk Management
The Port purchases insurance on certain risk exposures such as property, railroad, automobiles, fleet,
pilotage, and public official. The Port is, however, self-insured for general liability/litigation-type claims
and workers’ compensation of the Port’s employees. In addition, the Port carries excess insurance on
certain claims over $1,000,000. There have been no settlements related to these programs that exceeded
insurance coverage in the last three years.
Claims expenses and liabilities are reported when it is probable that a loss has been incurred and the
amount of that loss, including those incurred but not reported, can be reasonably estimated. The Port
utilizes actuarial studies, historical data, and individual claims reviews to estimate these liabilities. At
June 30, 2008 and 2007, approximately $8,733,000 and $15,055,000, respectively, were accrued for
litigation claims and workers’ compensation claims, which are included in other liabilities in the
accompanying statements of net assets.
Changes in the reported liability for the years ended June 30, 2008 and 2007 are as follows (in thousands):
Beginning
liability
Current year
claims and
Estimate
changes
Claim
payments
Balance at
Fiscal
year end
2007 – 2008:
Workers’ compensation
General liability/litigation
$
8,400
6,655
2,812
(6,459)
(2,579)
(96)
8,633
100
2006 – 2007:
Workers’ compensation
General liability/litigation
$
8,400
38,075
1,440
(3,377)
(1,440)
(28,043)
8,400
6,655
69
(Continued)
PORT OF LOS ANGELES
(HARBOR DEPARTMENT OF THE
CITY OF LOS ANGELES),
A COMPONENT UNIT OF THE
CITY OF LOS ANGELES, CALIFORNIA
Notes to Financial Statements
June 30, 2008 and 2007
(8)
Leases, Rentals, and Revenue Sharing Agreements
A substantial portion of the Port lands and facilities is leased to others. The majority of these leases provide
for cancellation on a 30-day notice by either party and for retention of ownership by the Port or restoration
of the property at the expiration of the agreement; accordingly, no leases are considered capital leases for
purposes of financial reporting.
These lease agreements are intended to be long-term in nature (as long as 30 years) and to provide the Port
with a firm tenant commitment for a minimum fixed-income stream. Many agreements also provide for
additional payment beyond the fixed portion, based upon tenant usage, revenues, or volume. These
agreements are also generally subject to periodic inflationary escalation of base amounts due the Port. For
the years ended June 30, 2008 and 2007, the minimum rental income from such agreements aggregated
approximately $259,495,000 and $248,278,000, respectively.
The property on lease at June 30, 2008 consists of the following (in thousands):
Wharves and sheds
Cranes and bulk facilities
Municipal warehouses
Port pilot facilities and equipment
Buildings and other facilities
Cabrillo Marina
$
660,308
56,640
10,647
6,116
740,359
41,772
1,515,842
Less accumulated depreciation
Total
(690,974)
$
824,868
Assuming that current agreements are carried to contractual termination, minimum tenant commitments
due to the Port over the next five years are as follows (in thousands):
Year ended June 30:
2009
2010
2011
2012
2013
Total
70
$
260,406
260,953
261,901
262,867
263,852
$
1,309,979
(Continued)
PORT OF LOS ANGELES
(HARBOR DEPARTMENT OF THE
CITY OF LOS ANGELES),
A COMPONENT UNIT OF THE
CITY OF LOS ANGELES, CALIFORNIA
Notes to Financial Statements
June 30, 2008 and 2007
(9)
Retirement Plan
Los Angeles City Employees Retirement System
(a)
Retirement Plan Description
All full-time employees of the Port, are eligible to participate in the Los Angeles City Employees’
Retirement System (LACERS) of the City of Los Angeles, California, a single employer defined
benefit pension plan. LACERS serves as a common investment and administrative agent for various
City departments and agencies that participate in LACERS. The Port makes contributions to
LACERS for its pro rata share of retirement costs attributable to its employees. The Port Police
joined the Los Angeles Fire and Police Retirement System effective July 1, 2007.
LACERS provides retirement, disability, death benefits, postemployment healthcare benefits and
annual cost-of-living adjustments based on the employees’ years of service, age and final
compensation. Employees with ten or more years of service may retire if they are at least 55 years
old, or if the retirement date is between October 2, 1996 and September 30, 1999 at age 50 or older
with at least 30 years of service. Normal retirement allowances are reduced for employees under age
60 at the time of retirement, unless they have more than 30 years of service and are age 55 or older.
Employees aged 70 or above may retire at any time with no required minimum period of service.
LACERS does not have a mandatory retirement age and none of the Port’s employees are required to
contribute to LACERS.
(b)
Actuarially Determined Contribution Requirements and Contributions Made
The Board of Administration of LACERS establishes and may amend the contribution requirements
of System members and the City. Covered employees contribute to LACERS at a rate (8.22% to
13.33%) established through the collective bargaining process for those whose membership began
prior to January 1, 1983 and at a fixed rate of 6% of salary for those who entered membership on or
after January 1, 1983. The City subsidizes member contributions as determined by the actuarial
consultant of LACERS. The Port’s pro rata share of the combined actuarially required contributions
(ARC) for pension and postemployment healthcare benefits and actual contributions made to
LACERS were approximately $13,765,000 (100% of ARC), $10,908,000 (100% of ARC) and
$8,577,000 (100% of ARC) for the years ended June 30, 2008, 2007, and 2006, respectively. The
allocation of contributions between the pension and postemployment healthcare benefits is not
available.
71
(Continued)
PORT OF LOS ANGELES
(HARBOR DEPARTMENT OF THE
CITY OF LOS ANGELES),
A COMPONENT UNIT OF THE
CITY OF LOS ANGELES, CALIFORNIA
Notes to Financial Statements
June 30, 2008 and 2007
LACERS’s funding policy provides for actuarially determined periodic contributions at rates such
that sufficient assets will be available to pay benefits when due. The current year contribution
requirement was determined based on the June 30, 2006 and prior year was determined based on
June 30, 2005 actuarial valuation, using the following actuarial assumptions (same in both years):
LACERS
Actuarial valuation date
June 30, 2006 and 2005
Actuarial cost method
Projected unit credit
Amortization method
Level percent of payroll
Remaining amortization
Period
Multiple layers not
exceeding 30 years,
closed
Asset valuation method
5-year market related
Actuarial assumptions:
Investment rate of
return
8%
Projected salary
increases
4.75% - 10%
Inflation rate
3.75%
Cost of living
adjustments
3%
72
(Continued)
PORT OF LOS ANGELES
(HARBOR DEPARTMENT OF THE
CITY OF LOS ANGELES),
A COMPONENT UNIT OF THE
CITY OF LOS ANGELES, CALIFORNIA
Notes to Financial Statements
June 30, 2008 and 2007
The City and member contribution rates for the year ended June 30, 2008 and 2007 are as follows:
Contribution rates:
City
Plan members
LACERS
14.6% of covered
payroll
8.22% to 13.33% of
salaries at entry
age with City
subsidy for
members prior
to February 1983;
6% for entry date
after January 1983
The City’s annual pension cost, the percentage of annual pension cost contributed to the plan, and
the net pension obligation for fiscal year 2008 and the two preceding years for the plan are as follows
(in thousands):
LACERS
Year Ended
06/30/08
06/30/07
06/30/06
Annual Pension
Cost (APC)
$
286,368
276,190
227,006
Percentage of
APC Contributed
100%
100%
100%
Net Pension
Obligation
$ (79,972)
(81,723)
(83,049)
The City allocated a pro rata share of its net pension obligation to the Port and the amounts recorded
at June 30, 2008 and 2007 were $2,367,000 and $2,172,000, respectively.
73
(Continued)
PORT OF LOS ANGELES
(HARBOR DEPARTMENT OF THE
CITY OF LOS ANGELES),
A COMPONENT UNIT OF THE
CITY OF LOS ANGELES, CALIFORNIA
Notes to Financial Statements
June 30, 2008 and 2007
(c)
Funded Status of LACERS
Based upon available data, the following is funded status information for the plan as of the most
recent actuarial valuation dated June 30, 2008, separate information for the Port is not available
(dollars in thousands):
LACERS
Actuarial Accrued Liability (AAL)
$
11,186,404
Actuarial Value of Assets
9,438,318
Underfunded AAL
1,748,086
Funded Ratio
Covered Payroll
84.4%
$
1,977,645
Underfunded AAL as a
percentage of
covered payroll
88.4%
74
(Continued)
PORT OF LOS ANGELES
(HARBOR DEPARTMENT OF THE
CITY OF LOS ANGELES),
A COMPONENT UNIT OF THE
CITY OF LOS ANGELES, CALIFORNIA
Notes to Financial Statements
June 30, 2008 and 2007
The funded status of the plan as of June 30, 2008 was based on the following actuarial assumptions:
LACERS
Actuarial valuation date
June 30, 2008
Actuarial cost method
Projected unit credit
Amortization method
Level percent of payroll
Remaining amortization
Period
Multiple layers not
exceeding 30 years,
closed
Asset valuation method
5-year market related
Actuarial assumptions:
Investment rate of
return
8%
Projected salary
increases
4.75% - 12.25%
Inflation rate
3.75%
Cost of living
adjustments
3%
Actuarial valuations involve the estimate of the value of reported amounts and assumptions about the
probability of events in the future. Amounts determined regarding the funded status of the plan and
the annual required contribution of the City are subject to continual revision as actual results are
compared to past expectations and new estimates are made about the future. The required schedule
of funding progress, presented as Required Supplementary Information (RSI) on page 98, present
multiyear trend information about whether the actuarial value of plan assets is increasing or
decreasing over time relative to the AAL for benefits.
75
(Continued)
PORT OF LOS ANGELES
(HARBOR DEPARTMENT OF THE
CITY OF LOS ANGELES),
A COMPONENT UNIT OF THE
CITY OF LOS ANGELES, CALIFORNIA
Notes to Financial Statements
June 30, 2008 and 2007
Other contribution information and ten-year historical trend information can be found in LACERS’s
Comprehensive Annual Financial Report. Copies of LACERS’s Comprehensive Annual Financial
Report can be obtained from LACERS, 360 East Second Street, 2nd Floor, Los Angeles, California
90012.
(d)
Other Postemployment Benefits (OPEB)
The Port, as a participant in LACERS, also provides a Retiree Health Insurance Premium Subsidy.
Under Division 4, Chapter 11 of the City’s Administrative Code, certain retired employees are
eligible for this health insurance premium subsidy. This subsidy is to be funded entirely by the City.
Employees with ten or more years of service who retire after age 55, or employees who retire at age
70 with no minimum service requirement, are eligible for a health premium subsidy with a Cityapproved health carrier. LACERS is advance funding the retiree health benefits on an actuarialdetermined basis.
Projections of benefits are based on the substantive plan and include the types of benefits in force at
the valuation date. Actuarial calculations reflect a long-term perspective and employ methods and
assumptions that are designed to reduce short-term volatility in actuarial accrued liabilities and the
actuarial value of assets.
76
(Continued)
PORT OF LOS ANGELES
(HARBOR DEPARTMENT OF THE
CITY OF LOS ANGELES),
A COMPONENT UNIT OF THE
CITY OF LOS ANGELES, CALIFORNIA
Notes to Financial Statements
June 30, 2008 and 2007
The City’s annual required contribution rate for OPEB was 5.5% and 6.1% of annual covered payroll
for 2008 and 2007, and was determined based on the June 30, 2006 and 2005 actuarial valuations,
respectively. Significant methods and assumptions are as follows (same in both years):
LACERS OPEB
Actuarial valuation date
June 30, 2006 and 2005
Actuarial cost method
Projected unit credit
Amortization method
Level percent of payroll
Remaining amortization
Period
Multiple layers not
exceeding 30 years,
closed
Asset valuation method
5-year market related
Actuarial assumptions:
Investment rate of
return
8%
Projected salary
increases
N/A
Inflation rate
3.75%
Healthcare cost
trend rates:
Medical
Dental
12% graded down over
7 years to ultimate rate
of 5%
5%
77
(Continued)
PORT OF LOS ANGELES
(HARBOR DEPARTMENT OF THE
CITY OF LOS ANGELES),
A COMPONENT UNIT OF THE
CITY OF LOS ANGELES, CALIFORNIA
Notes to Financial Statements
June 30, 2008 and 2007
Amounts contributed specifically to the Retiree Health Insurance Premium Subsidy by the Port alone
are not available.
The City’s annual OPEB cost, the percentage of annual OPEB cost contributed to the plan, and the
net OPEB asset (obligation) for fiscal year 2008 and the two preceding years for the plan are as
follows (dollars in thousands):
LACERS
Year Ended
06/30/08
06/30/07
06/30/06
Annual OPEB
Cost (AOC)
$
108,849
115,233
76,116
Percentage of
OPEB Cost Contributed
100%
100%
100%
Net OPEB
Asset
(Obligation)
-
From the most recent data made available by the City, as of June 30, 2008, LACERS membership
consists of 30,236 active plan participants and 14,975 retired members. Also as of June 30, 2008, the
date of the latest actuarial valuation of the City’s Retiree Health Insurance Premium Subsidy, the
total underfunded health benefit subsidy applicable to LACERS as a whole was approximately
$585,123,000 as follows (dollars in thousands):
LACERS OPEB
Actuarial Accrued Liability (AAL)
$
1,928,043
Actuarial Value of Assets
1,342,920
Underfunded AAL
585,123
Funded Ratio
Covered Payroll
69.7%
$
1,977,645
Underfunded AAL as a
percentage of
covered payroll
29.6%
78
(Continued)
PORT OF LOS ANGELES
(HARBOR DEPARTMENT OF THE
CITY OF LOS ANGELES),
A COMPONENT UNIT OF THE
CITY OF LOS ANGELES, CALIFORNIA
Notes to Financial Statements
June 30, 2008 and 2007
The funded status of the OPEB plan as of June 30, 2008 was based on the following actuarial
assumptions:
LACERS OPEB
Actuarial valuation date
June 30, 2008
Actuarial cost method
Projected unit credit
Amortization method
Level percent of payroll
Remaining amortization
Period
Multiple layers not
exceeding 30 years,
closed
Asset valuation method
5-year market related
Actuarial assumptions:
Investment rate of
return
8%
Projected salary
increases
N/A
Inflation rate
3.75%
Healthcare cost
trend rates
Medical
8.75% graded down over
8 years to ultimate rate
of 5%
Dental
5%
79
(Continued)
PORT OF LOS ANGELES
(HARBOR DEPARTMENT OF THE
CITY OF LOS ANGELES),
A COMPONENT UNIT OF THE
CITY OF LOS ANGELES, CALIFORNIA
Notes to Financial Statements
June 30, 2008 and 2007
Actuarial valuations involve estimate of the value of reported amounts and assumptions about the
probability of events in the future. Amounts determined regarding the funded status of the plans and
the annual required contributions of the City are subject to continual revision as actual results are
compared to past expectations and new estimates are made about the future. The required schedule
of funding progress, presented as RSI on page 98, present multiyear trend information about whether
the actuarial value of plan assets is increasing or decreasing over time relative to the AAL for
benefits.
City of Los Angeles Fire and Police Pensions
(a)
Retirement Plan Description
The Los Angeles City Council approved Ordinance No. 177214 that allows Harbor Department (Port
Police Officers) the option to transfer from LACERS to Tier 5 of Los Angeles Fire and Police
Pensions (LAFPP). The election period was from January 8, 2006 to January 5, 2007 and the
decision to transfer is irrevocable.
Only “sworn” service with the Harbor Department is transferable to LAFPP. Other “non-sworn”
service with other City Departments is not eligible for transfer. All new employees hired by the
Harbor Department after the effective date of the Ordinance automatically go into Tier 5 of LAFPP.
LACERS transferred $6.1 million of allocated discounted Harbor Port Police assets to LAFPP in
October 2007 for fiscal year 2007.
(b)
Actuarially Determined Contribution Requirements and Contributions Made
The Board of Administration/Commissioners of LAFPP establishes and may amend the contribution
requirements of members and the City. The City’s annual cost for the plan is calculated based on the
annual required contribution (ARC) of the employer, an amount actuarially determined in
accordance with the parameters of the applicable GASB Statements. The ARC represents a level of
funding that, if paid on an ongoing basis, is projected to cover normal cost each year and to amortize
unfunded actuarial liabilities over a period not to exceed thirty years. The City Administrative Code
and related ordinance define member contributions.
80
(Continued)
PORT OF LOS ANGELES
(HARBOR DEPARTMENT OF THE
CITY OF LOS ANGELES),
A COMPONENT UNIT OF THE
CITY OF LOS ANGELES, CALIFORNIA
Notes to Financial Statements
June 30, 2008 and 2007
The current year contribution requirement was determined based on the June 30, 2006 actuarial
valuation, using the following actuarial assumptions:
LAFPP
Actuarial valuation date
June 30, 2006
Actuarial cost method
Entry age Normal
Amortization method
Level dollar - Tier 1
Level percent of payrollTiers 2, 3, 4, & 5
Remaining amortization
Period
Multiple layers not
exceeding 30 years,
closed
Asset valuation method
5-year market related
Actuarial assumptions:
Investment rate of
return
8%
Projected salary
increases
4.90% - 10.09%
Inflation rate
3.75%
Cost of living
adjustments
3.75% - Tiers 1 & 2
3% - Tiers 3, 4, & 5
81
(Continued)
PORT OF LOS ANGELES
(HARBOR DEPARTMENT OF THE
CITY OF LOS ANGELES),
A COMPONENT UNIT OF THE
CITY OF LOS ANGELES, CALIFORNIA
Notes to Financial Statements
June 30, 2008 and 2007
The City and member contribution rates for the year ended June 30, 2008 are as follows:
Contribution rates:
City
Plan members
LAFPP
21.7 % of covered
payroll
6% - Tier 1
7% - Tier 2
8% - Tier 3 & 4
9% - Tier 5
The City’s annual pension cost and the percentage of annual pension cost contributed to the plan for
fiscal year 2008 and the two preceding years for the plan are as follows (dollars in thousands):
LAFPP
Year Ended
06/30/08
06/30/07
06/30/06
Annual Pension
Cost (APC)
$
261,635
224,946
143,946
82
Percentage of
APC Contributed
100%
100%
100%
(Continued)
PORT OF LOS ANGELES
(HARBOR DEPARTMENT OF THE
CITY OF LOS ANGELES),
A COMPONENT UNIT OF THE
CITY OF LOS ANGELES, CALIFORNIA
Notes to Financial Statements
June 30, 2008 and 2007
(c)
Funded Status of LAFPP
Based upon available data, the following is funded status information for the plan as of June 30,
2008, separate information for the Port is not available (in thousands):
LAFPP
Actuarial Accrued Liability (AAL)
$
14,279,116
Actuarial Value of Assets
14,153,296
Underfunded AAL
125,820
Funded Ratio
Covered Payroll
99.1%
$
1,206,589
Underfunded AAL as a
percentage of
covered payroll
10.43%
83
(Continued)
PORT OF LOS ANGELES
(HARBOR DEPARTMENT OF THE
CITY OF LOS ANGELES),
A COMPONENT UNIT OF THE
CITY OF LOS ANGELES, CALIFORNIA
Notes to Financial Statements
June 30, 2008 and 2007
The funded status of the plan as of June 30, 2008 was based on the following actuarial assumptions:
LAFPP
Actuarial valuation date
June 30, 2008
Actuarial cost method
Entry age normal
Amortization method
Level dollar - Tier 1
Level percent of payrollTiers 2, 3, 4, & 5
Remaining amortization
Period
Multiple layers not
exceeding 30 years,
closed
Asset valuation method
5-year market related
Actuarial assumptions:
Investment rate of
return
8%
Projected salary
increases
4.9% - 10.09%
Inflation rate
3.75%
Cost of living
adjustments
3.75% - Tiers 1 & 2
3% - Tiers 3, 4, &5
84
(Continued)
PORT OF LOS ANGELES
(HARBOR DEPARTMENT OF THE
CITY OF LOS ANGELES),
A COMPONENT UNIT OF THE
CITY OF LOS ANGELES, CALIFORNIA
Notes to Financial Statements
June 30, 2008 and 2007
Actuarial valuations involve estimate of the value of reported amounts and assumptions about the
probability of events in the future. Amounts determined regarding the funded status of the plan and
the annual required contribution of the City are subject to continual revision as actual results are
compared to past expectations and new estimates are made about the future. The required schedule
of funding progress, presented as RSI on page 99, present multiyear trend information about whether
the actuarial value of plan assets is increasing or decreasing over time relative to the AAL for
benefits.
Other contribution information and ten-year historical trend information can be found in LAFPP’s
Comprehensive Annual Financial Report. Copies of LAFPP’s Comprehensive Annual Financial
Report can be obtained from LAFPP, 360 East Second Street, Suite 400, Los Angeles, California
90012.
(d)
Other Postemployment Benefits (OPEB)
The City Charter, the Administrative Code and related ordinance define the postemployment
healthcare benefits. There are no member contributions for healthcare benefits. The Port, as a
participant in LAFPP, also provides a Retiree Health Insurance Premium Subsidy.
Projections of benefits are based on the substantive plan and include the types of benefits in force at
the valuation date. Actuarial calculations reflect a long-term perspective and employ methods and
assumptions that are designed to reduce short-term volatility in actuarial accrued liabilities and the
actuarial value of assets.
85
(Continued)
PORT OF LOS ANGELES
(HARBOR DEPARTMENT OF THE
CITY OF LOS ANGELES),
A COMPONENT UNIT OF THE
CITY OF LOS ANGELES, CALIFORNIA
Notes to Financial Statements
June 30, 2008 and 2007
The City’s annual required contribution rate for OPEB was 4.9% of annual covered payroll and was
determined based on the June 30, 2006 actuarial valuation. Significant methods and assumptions are
as follows:
LAFPP OPEB
Actuarial valuation date
June 30, 2006
Actuarial cost method
Entry age normal
Amortization method
Level percent of payroll
Remaining amortization
Period
29 years, closed
Asset valuation method
5-year market related
Actuarial assumptions:
Investment rate of
return
8%
Projected salary
increases
4.25%
Inflation rate
3.75%
Healthcare cost
trend rates:
Medical
Dental
9% graded down by .5%
per year for 8 years to
ultimate rate of 5%
5%
86
(Continued)
PORT OF LOS ANGELES
(HARBOR DEPARTMENT OF THE
CITY OF LOS ANGELES),
A COMPONENT UNIT OF THE
CITY OF LOS ANGELES, CALIFORNIA
Notes to Financial Statements
June 30, 2008 and 2007
Amounts contributed specifically to the Retiree Health Insurance Premium Subsidy by the Port alone
are not available.
The City’s annual OPEB cost, the percentage of annual OPEB cost contributed to the plan, and the
net OPEB asset (obligation) for fiscal year 2008 and the two preceding years for the plan are as
follows (in thousands):
LAFPP
Year Ended
06/30/08
06/30/07
06/30/06
Annual OPEB
Cost (AOC)
$
99,615
55,163
31,413
Percentage of
OPEB Cost Contributed
79%
100%
100%
Net OPEB
Asset
(Obligation)
(21,358)
-
From the most recent data made available by the City, as of June 30, 2008, LAFPP membership
consists of 13,495 active plan participants, 81 vested terminated members, and 12,182 retired
members and beneficiaries. Also as of June 30, 2008, the date of the latest actuarial valuation of the
City’s Retiree Health Insurance Premium Subsidy, the total underfunded health benefit subsidy
applicable to LAFPP, as a whole was approximately $1,069,193,000 as follows (in thousands):
LAFPP OPEB
Actuarial Accrued Liability (AAL)
$
1,836,840
Actuarial Value of Assets
767,648
Underfunded AAL
1,069,193
Funded Ratio
Covered Payroll
41.8%
$
1,206,589
Underfunded AAL as a
percentage of
covered payroll
88.6%
87
(Continued)
PORT OF LOS ANGELES
(HARBOR DEPARTMENT OF THE
CITY OF LOS ANGELES),
A COMPONENT UNIT OF THE
CITY OF LOS ANGELES, CALIFORNIA
Notes to Financial Statements
June 30, 2008 and 2007
The funded status of the OPEB plan as of June 30, 2008 was based on the following actuarial
assumptions:
LAFPP OPEB
Actuarial valuation date
June 30, 2008
Actuarial cost method
Entry age normal
Amortization method
Level percent of payroll
Remaining amortization
Period
29 years, closed
Asset valuation method
5-year market related
Actuarial assumptions:
Investment rate of
return
8%
Projected salary
increases
4.25%
Inflation rate
3.75%
Healthcare cost
trend rates
Medical
9% graded down .5% per
year over 8 years to
ultimate rate of 5%
Dental
5%
Actuarial valuations involve estimate of the value of reported amounts and assumptions about the
probability of events in the future. Amounts determined regarding the funded status of the plans and
88
(Continued)
PORT OF LOS ANGELES
(HARBOR DEPARTMENT OF THE
CITY OF LOS ANGELES),
A COMPONENT UNIT OF THE
CITY OF LOS ANGELES, CALIFORNIA
Notes to Financial Statements
June 30, 2008 and 2007
the annual required contributions of the City are subject to continual revision as actual results are
compared to past expectations and new estimates are made about the future. The required schedule
of funding progress, presented as RSI on page 99, present multiyear trend information about whether
the actuarial value of plan assets is increasing or decreasing over time relative to the AAL for
benefits.
(10)
Notes Receivable
(a)
City of Los Angeles Settlement
In 1994, the City undertook a series of studies to determine whether or not the Port received services
from the City for which the Port had not been inclusively billed. These studies, collectively referred
to as the Nexus Study, were conducted under the auspices of the City Attorney. The studies found
that the City could have billed the Port for substantial amounts for services undertaken on behalf of
the Port by the City or for City services conducted within the Harbor’s jurisdiction.
It is and has been the policy of the Port to pay the City all of the amounts to which the City is
entitled. In light of these studies, the Board of Harbor Commissioners adopted a resolution providing
for the reimbursement to the City of certain expenditures incurred by the City on behalf of the Port,
but which the City had never inclusively billed the Port. Under its resolution, the Board of Harbor
Commissioners authorized the Port to make, and the Port paid to the City, two annual payments of
$20,000,000 for the 1994/95 and 1995/96 fiscal years. The Board of Harbor Commissioners further
authorized the Executive Director to negotiate additional amounts as may be determined to be due,
and accordingly, a memorandum of understanding with the City was executed on June 27, 1997
(1997 MOU).
The California State Lands Commission is responsible for oversight of the State’s Tideland Trust
Lands. This Commission, together with the State Office of Attorney General, has expressed concerns
regarding the methodologies employed in the studies and whether such transfers of monies from the
Port to the City comply with the criteria for compliance with applicable California State Tidelands
Trust Land laws. Prior to the adoption of the above-referenced resolution, the California State Lands
Commission officials and the Office of the Attorney General requested the Board of Harbor
Commissioners to postpone any decision involving these trust funds until the California State Lands
Commission and Office of Attorney General could complete an inquiry into the studies and transfers.
Subsequently, various organizations, including the Steamship Association of Southern California,
which represents carriers using the Port, together with the California State Lands Commission and
Office of Attorney General, have brought legal action against the City and Port regarding the Board
of Harbor Commissioners’ action.
On January 19, 2001, the City, along with the Port and the California State Lands Commission,
entered into a settlement and mutual release agreement to amicably resolve their disputes concerning
the City’s entitlement to historic and future reimbursements for costs the City incurred or would
incur providing services to the Port. The settlement agreement provides that the City, as
89
(Continued)
PORT OF LOS ANGELES
(HARBOR DEPARTMENT OF THE
CITY OF LOS ANGELES),
A COMPONENT UNIT OF THE
CITY OF LOS ANGELES, CALIFORNIA
Notes to Financial Statements
June 30, 2008 and 2007
reimbursement for payments made by the Port to the City for retroactive billings for City services
provided during the period July 1, 1977 through June 30, 1994, inclusive, pay the Port $53,400,000
in principal plus 3% simple interest over a 15-year period.
The settlement agreement also provides that the City reimburse the Port for the payment differential,
that amount representing the difference between the actual payments and the amount to which the
City would have been entitled to reimbursement during fiscal year 1994-95 and fiscal year
2002-2003, inclusive, had the reimbursement been computed during each of those fiscal years using
the settlement formula. This amount is estimated at $8,352,000. Payment for this period is to be
reimbursed to the Port over 15 years, including 3% simple interest. The agreement also states that at
any time after five years from January 19, 2001, the City, the Port, and California State Lands
Commission may negotiate to amend this agreement to account for new or changed circumstances.
The State, the City, and the Port agreed to mutually release and discharge the other from any and all
claims, demands, obligations, and causes of action, of whatever kind or nature pertaining in any way
to the use, payment, transfer, or expenditure for any of the services or facilities identified in the
Nexus Study or the 1997 MOU and provided for during the period July 1, 1977 through June 30,
2002.
Accordingly, the Port of Los Angeles had recorded the amount due from the City as a note
receivable of $32,265,000 and $36,348,000 and a current portion of notes receivable of $4,083,000
and $3,962,000 as of June 30, 2008 and 2007, respectively.
(b)
Note Receivable – LAXT
In August of 2001, LAXT issued a note to the Port to defer payment of $2.0 million of the minimum
annual rent required in their lease. This note provides for quarterly interest payments to be made to
the Port until such time as the note is fully repaid on or before July 1, 2004. As a result of the
Settlement Agreement, Mutual Release and Compromise, and Permit Termination Agreement
(Settlement Agreement) with LAXT, the Port wrote off, in March 2007, the $2.0 million note
receivable against the reserve that was made before.
(c)
Note Receivable – Yusen
In order to settle the then outstanding $2,350,867 terminal construction cost overruns, the Port
agreed in 1994 that Yusen, one of the Port container terminal tenants, be permitted to pay over
22 years in equal monthly installments of $106,857. To record the transaction, an amortization
schedule using a 5% interest rate was prepared and the note balance was adjusted to $1,476,887, with
the balance of $873,980 recognized as the Port’s capital assets in fiscal year 1995. The note matures
in October 2015. The balance outstanding on the Yusen note is $690,639 and $759,520 at June 30,
2008 and 2007, respectively.
90
(Continued)
PORT OF LOS ANGELES
(HARBOR DEPARTMENT OF THE
CITY OF LOS ANGELES),
A COMPONENT UNIT OF THE
CITY OF LOS ANGELES, CALIFORNIA
Notes to Financial Statements
June 30, 2008 and 2007
(11) Commitments and Contingencies
Open purchase orders and uncompleted construction contracts amounted to approximately $290,152,000 as
of June 30, 2008. Such open commitments do not lapse at the end of the Port’s fiscal year and are carried
forth to succeeding periods until fulfilled.
In 1985, the Port received a parcel of land, with an estimated value of $14,000,000 from the federal
government, for the purpose of constructing a marina. The Port has agreed to reimburse the federal
government up to $14,000,000 from excess revenues, if any, generated from marina operations after the
Port has recovered all costs of construction. No such payments were made in 2008 or 2007.
The Port has certain operating leases whose future minimum payments are insignificant.
The Port is also involved in certain litigation arising in the normal course of business. In the opinion of
management, there is no pending litigation or unasserted claims, the outcome of which would materially
affect the financial position of the Port.
Alameda Corridor Transportation Authority Agreement (ACTA)
In August 1989, the Port and the Port of Long Beach (the POLB and, together with the Port, the Ports)
entered into a joint exercise of powers agreement and formed ACTA for the purpose of establishing a
comprehensive transportation corridor and related facilities consisting of street and railroad rights-of-way
and an improved highway and railroad network along Alameda Street between the Santa Monica Freeway
and the Ports in San Pedro Bay, linking the two Ports to the central Los Angeles area. The Alameda
Corridor began operating on April 15, 2002. ACTA is governed by a seven-member board which is
comprised of two members from each Port, one each from the Cities of Los Angeles and Long Beach and
one from the Metropolitan Transportation Authority. In 2003, ACTA agreed to an expanded mission to
develop and support projects that more effectively move cargo to points around Southern California, ease
truck congestion, improve air quality, and make roads safer. If in the future ACTA becomes entitled to
distribute income or make equity distributions, the Ports shall share any such income or equity
distributions equally.
In October 1998, the Ports, ACTA, and the railroad companies, which operate on the corridor, entered into
a Corridor Use and Operating Agreement (Corridor Agreement). The Corridor Agreement obligates the
railroad companies to pay certain use fees and container charges (Use Fees), which ACTA will assess for
the privilege of using the corridor to transport cargo into and out of the Ports. ACTA negotiated with
BNSF Railway Company (BNSF) and Union Pacific (UP) regarding certain types of cargo movements
(transload movements) for which BNSF and UP are not paying Use Fees. In the Settlement and Release
Agreement (the Agreement), dated as July 5, 2006, ACTA, BNSF, and UP agreed to resolve the
“Transloading Dispute.” ACTA, the Ports, the City of Los Angeles, and the City of Long Beach (the
ACTA Releasing Parties) each release, acquit, and discharge BNSF and UP of all liability and costs, as
stated in the Agreement, arising from or relating to the Transloading Dispute. BNSF and UP (the Railroad
Releasing Parties) each release, acquit, and discharge the ACTA Releasing Parties from any and all
91
(Continued)
PORT OF LOS ANGELES
(HARBOR DEPARTMENT OF THE
CITY OF LOS ANGELES),
A COMPONENT UNIT OF THE
CITY OF LOS ANGELES, CALIFORNIA
Notes to Financial Statements
June 30, 2008 and 2007
liability and costs, as stated in the Agreement, arising from or relating to any claim by the Railroad
Releasing Parties. These Use Fees are used to pay (a) the debt service that ACTA incurs on approximately
$1.2 billion of bonds, which ACTA issued in early 1999 and approximately $686 million of bonds issued
in 2004, and (b) for the cost of funding required reserves and costs associated with the financing, including
credit enhancement and rebate requirements, if any (collectively, ACTA Obligations). Use Fees end after
35 years or sooner if the ACTA Obligations are paid off earlier.
If ACTA revenues are insufficient to pay ACTA Obligations, the Corridor Agreement obligates each Port
to pay up to twenty percent (20%) of the shortfall (Shortfall) on an annual basis. If this contingency occurs,
the Ports’ payments to ACTA are intended to provide cash for debt service payments and to assure that the
Alameda Corridor is available to maintain continued cargo movement through the Ports. The Ports are
required to include expected Shortfall payments in their budgets, but Shortfall payments are subordinate to
other obligations of the Port, including the 2005 and 2006 Bonds, and neither the Port nor the POLB is
required to take Shortfall payments into account when determining whether it may incur additional
indebtedness or when calculating compliance with rate covenants under their respective bond indentures
and resolutions.
In April 2004, it was estimated by ACTA that the Ports would be required to make Shortfall payments
totaling approximately $20.5 million (the Port and POLB each being liable for their one-half share of
$10.25 million) through 2027. Pursuant to the ACTA Operating Agreement, the Port is obligated to include
any forecasted Shortfall payments in its budget each fiscal year. No Shortfall payments were payable by
the Port in the prior years. ACTA notified the two ports in March 2008 that no Shortfall payment was
required for the fiscal year ending June 30, 2008 due to transfers from other available sources and that the
total amount of the Shortfall payment for FY 2007-08 is estimated to be zero.
Estimates of Shortfalls are prepared by ACTA and such Shortfalls could vary materially from the
estimates. It is not possible to predict whether, when, or how much the Port will be liable for Shortfall
payments. In the opinion of management, shortfall payments, if any, would not materially affect the
financial position of the Port.
Community Redevelopment Agency Agreement
On September 20, 2007, the Los Angeles Board of Harbor Commissioners approved the agreement
between the City of Los Angeles and the Community Redevelopment Agency of the City of Los Angeles
(CRALA) for the purpose of readying the underutilized and contaminated industrial properties within the
Wilmington Industrial Park, the project area for development.
CRALA may execute note(s) in an aggregate amount not to exceed $25 million. The note(s) will accrue
interest at the General Pool Rate compounded monthly. All notes will become due and payable sixty
months from the date of the first executed note pursuant to this agreement unless the term of the note(s) is
otherwise extended and approved in writing by CRALA and the Port. The CRALA and the Port may agree
in writing to no more than two options to extend the term of this agreement and the notes granted
hereunder, each option period not to exceed five additional years.
92
(Continued)
PORT OF LOS ANGELES
(HARBOR DEPARTMENT OF THE
CITY OF LOS ANGELES),
A COMPONENT UNIT OF THE
CITY OF LOS ANGELES, CALIFORNIA
Notes to Financial Statements
June 30, 2008 and 2007
CRALA shall pay down the line of credit by applying proceeds generated from the periodic sale and
disposition of acquired properties. Repayment of each draw (principal and accruing interest) is deferred
until such time as the property that was acquired with the funds at issue is disposed of. CRALA shall repay
any outstanding draw (principal and interest) at the end of the term of the line of credit. The line of credit
will be frozen if any fund draws are outstanding for longer than sixty months. CRALA shall repay the then
outstanding principal together with the interest, promptly upon selling a property, provided that the amount
shall be repaid in one balloon payment no later than the 72nd month.
As of June 30, 2008 there has been no drawdown made by CRALA from this line of credit.
Trapac Project and Environmental Impact Report
On December 6, 2007, the Board of Harbor Commissioners (Board) certified the Final Environmental
Impact Report (FEIR) for Trapac and approved the Trapac project. The project involves the development
of the various improvements to Berths 136-147, currently occupied by Trapac. Subsequent to the project
approval, certain entities (Appellants) appealed to the City Council the certification/project approval under
the provisions of the California Environmental Quality Act (CEQA).
On April 3, 2008, the Board approved a Memorandum of Understanding (MOU) between the City and the
Appellants of the Trapac EIR. The term of the MOU is five years and after the first five years, the
agreement may be renewed for a successive five-year period by mutual agreement of the Port and a
majority of the Appellants. The MOU provides for the revocation of the appeals and the establishment of a
Port Community Mitigation Trust Fund.
The MOU provides that the Port’s first year funding to be placed in the Community Mitigation Trust Fund
is estimated at $11,240,000 geared towards the identified Trapac projects in the MOU. Contributions from
the Port to the Fund over the subsequent four years of the initial MOU term may vary based on the volume
of cargo processed at the Port.
(12) Related-Party Transactions
During the normal course of business, the Port is charged for services provided and use of land owned by
the City, the most significant of which is related to fire protection, museum/park maintenance, and legal
services. Total amounts charged by the City for services approximate $35,443,000 and $34,737,000 in
fiscal years 2008 and 2007, respectively.
(13) Capital Contributions
Amounts either received or to be reimbursed for the restricted purpose of the acquisition, construction of
capital assets, or other grant-related capital expenditures are recorded as capital contributions. During the
years ended June 30, 2008 and 2007, the Port reported capital contributions of $14,161,000 and $4,145,000
respectively, for certain capital construction and grant projects.
93
(Continued)
PORT OF LOS ANGELES
(HARBOR DEPARTMENT OF THE
CITY OF LOS ANGELES),
A COMPONENT UNIT OF THE
CITY OF LOS ANGELES, CALIFORNIA
Notes to Financial Statements
June 30, 2008 and 2007
(14) Los Angeles Export Terminal
Los Angeles Export Terminal (LAXT) is an approximately 120-acre dry bulk facility that handled coal and
petroleum coke destined for Asia and the Americas. When incorporated, LAXT’s ownership was
comprised of a coalition of 51% US firms involved in the coal chain and 49% Japanese utility, steel, and
energy companies. Since LAXT’s formation, the Port has made equity contributions of $19.0 million.
Beginning in fiscal year 2001, business conditions have been such that LAXT has been unable to meet its
minimum rent guarantee to the Port. Accordingly, the Port fully reserved for its share of investment in
LAXT and any trade receivables due from LAXT.
On June 10, 2004, LAXT, Oxbow Carbon & Minerals, Inc., and Oxbow Terminals LLC (collectively,
the Claimants) filed a claim against the City for damages in excess of $400 million (the LAXT Claim). The
Claimants assert, among other things, that the City breached fiduciary duties to LAXT, breached its lease
with LAXT, and interfered with LAXT’s efforts to raise additional revenues. The City rejected the LAXT
claim on June 23, 2004. The Claimants subsequently filed a court action in which they claimed damages in
excess of $600 million. The Port filed an answer and cross-claim to the court action. The parties reached a
Settlement Agreement, Mutual Release and Compromise, and Permit Termination Agreement (Settlement
Agreement) effective March 16, 2007 and the City paid the claimants a total of $27,412,000 as part of the
settlement. The Port also wrote off $66,922,000 in accounts receivable and $2,000,000 in note receivable
that are due from LAXT and $19,000,000 in LAXT investment against reserves specifically made for
LAXT in prior years.
As a result of this settlement, certain Port capital assets that are related to LAXT operations have suffered
permanent impairment of their value and are due for demolition. The Port charged a total of $22,291,000
as a special item in fiscal year 2007 and reduced the book value of these impacted assets to zero.
(15) Natural Resources Defense Council Settlement Judgment
In March 2003, the Port of Los Angeles settled a lawsuit entitled: Natural Resources Defense Council, Inc.,
et al. v. City of Los Angeles, et al., regarding the environmental review of a Port project. The settlement
calls for a total of $50 million in mitigation measures to be undertaken by the Port. This $50 million charge
was recorded to expense in fiscal year 2003.
The terms of the agreement require that the Port fund various mitigation activities in the amount of
$10 million per year over a five-year term ending fiscal year 2007. As of June 30, 2008, a total of $50.0
million has been transferred from Harbor Revenue Fund to the restricted mitigation funds.
Pursuant to the settlement, the Port is also obligated to expend up to $5 million to retrofit customer vessels
to receive shore-side power as an alternative to using on-board diesel fueled generators. Through the end of
fiscal year 2008, the Port has spent $5.0 million for this program.
In June 2004, the Port agreed to amend the original settlement to include, and transferred to the restricted
fund an additional $3.5 million for the creation of parks and open space in San Pedro.
94
(Continued)
PORT OF LOS ANGELES
(HARBOR DEPARTMENT OF THE
CITY OF LOS ANGELES),
A COMPONENT UNIT OF THE
CITY OF LOS ANGELES, CALIFORNIA
Notes to Financial Statements
June 30, 2008 and 2007
The settlement agreement also established a throughput restriction at China Shipping Terminal per
calendar year. Actual throughput at the terminal exceeded the cap for calendar years 2007 and 2006 and in
May 2008 and in April 2007 the Port charged to non-operating expense and deposited in the restricted
mitigation funds an additional $5,767,000 and $3,862,050, respectively.
As of June 30, 2008 the Port has disbursed a total of $22.3 million, $3.1 million of this amount was made
in FY 2008, as provided in accordance with the provisions of the settlement.
(16) China Shipping Settlement Agreement
In June 2005, the Port of Los Angeles settled a claim filed by China Shipping Holding Company, Ltd.
(China Shipping), a current Port tenant, claiming damages and costs resulting from the delays in timely
delivery of the premises at Berths 100-102, and environmental mitigation costs.
The settlement provided for an immediate payment of $10 million to China Shipping and amended their
operating permit to provide various credits to the claimant in the form of reduction of minimum annual
guarantee and container charges of $12.2 million to be applied in fiscal year 2005 – 2006. The amendment
also provides for additional other credits amounting up to $7.1 million, if certain acreage or wharf
improvements are not delivered within 24 – 48 months following approval of the environmental impact
report for the project. Port management believes no conditions currently exist that will impact timely
delivery of the facilities. Accordingly, a liability of $22.2 million was recorded as of June 30, 2005 and
payment of $10 million was made and credits of $12.2 million issued in fiscal year 2006.
(17) Alleged Misuse of Federal Funds – Stanley D. Mosler vs. City of Los Angeles
An individual has brought a lawsuit under the Federal Civil False Claims Act against the Port, the City,
and the Port’s former Executive Director, challenging the use by the Port of certain federal funds obtained
from the United States under the Water Resources Development Act of 1986 and State funds in the form of
Tidelands Revenues for the construction of Pier 400 at the Port. The plaintiff alleges that the federal
contribution amount to the construction of Pier 400 was $108 million and the State contribution was
approximately $1 billion. The case was under seal from 2002 to 2005 while the federal government
determined whether to join as a plaintiff. In 2005, the federal government decided not to join as a plaintiff.
An amended complaint was served on the Port in August 2005 requesting treble damages. The Port
believes that any claims alleging misuse of federal funds and State funds are without merit. The
defendants, including the City, filed motions to have the court dismiss the complaint or grant judgment in
their favor. On August 11, 2006, the Court granted the City’s and Port’s motion to disqualify the plaintiff,
on the grounds that the plaintiff is not an attorney and therefore cannot represent the interests of the United
States or the State in the action, and dismissed the lawsuit. Subsequently the plaintiff brought motions to
vacate the dismissal and to allow the substitution of an attorney. The trial court denied both of these
motions. On October 13, 2006 the plaintiff in proper filed a notice of appeal seeking review of three court
orders: the August 14, 2006 order granting defendant’s motion to disqualify relator and dismiss his claims,
the October 6, 2006 order denying relator’s motion for substitution of counsel, and the October 6, 2006
order denying relator’s motion to vacate order of dismissal. The relator Stanley Mosler appealed the
95
(Continued)
PORT OF LOS ANGELES
(HARBOR DEPARTMENT OF THE
CITY OF LOS ANGELES),
A COMPONENT UNIT OF THE
CITY OF LOS ANGELES, CALIFORNIA
Notes to Financial Statements
June 30, 2008 and 2007
dismissal of the action to the Ninth Circuit. While the appeal was pending, the trial court judge issued a
memorandum indicating that he may not have given the relator adequate notice that dismissal would result
from his failure to have counsel. While the matter was pending on appeal, the relator retained counsel. The
Ninth Circuit allowed the trial court to reconsider and vacate its prior order of dismissal. Recently, the
Ninth Circuit has issued rulings dismissing the pending appeals and granting remand to the trial court. The
parties anticipate further proceedings on the merits of the case in the trial court that should lead to a final
adjudication.
(18) Asbestos Removal Liabilities
The Port acquired the U.S. Customs House property on Terminal Island from the U.S. General Services
Administration in 2005. The Port is aware of the fact that the U.S. Customs House facility is in need of
asbestos abatement. The estimate for removal of asbestos materials and lead-based paint materials is
$3,000,000. The Port would incur these asbestos removal costs if the Port’s future use of the site requires
demolition of the existing structure. Development of the site would require future Board action and
approval. The Port has accrued the $3,000,000 asbestos removal liability in the financial statements as of
June 30, 2008 and 2007.
(19) Westway Terminal Co., Inc. Settlement Agreement
Westway operates a marine liquid bulk terminal at the Port under a permit that expires in March 2025. On
August 21, 2007, the City of Los Angeles approved the Port's Settlement Agreement, Mutual Release and
Compromise, and Permit Termination Agreement with Westway. Under the settlement, Westway's permit
will be early terminated and Westway will vacate and surrender the premises on or before February 23,
2009. Within 30 days after the vacate and surrender date, the Port will pay Westway $17 million, less any
applicable charges, as settlement payment. On August 21, 2007, the City (Port) assumed responsibility for
the cleanup and abatement order that the Regional Water Quality Control Board had issued to Westway.
On and after the vacate and surrender date, the City (Port) will assume responsibility for all claims,
demands and damages related to the environmental conditions. Estimate of costs for any clean up and
abatement of the property has not been determined.
Westway Terminal vacated the San Pedro premises effective September 15, 2008. In accordance with the
terms of the Settlement Agreement, the Port wired the $17 million to the account of Westway Terminal on
October 2, 2008, within 30 calendar days after the Vacate and Surrender Date. This amount was accrued as
of June 30, 2008.
(20) Subsequent Events
(a)
Cash Funding of Reserve Fund
As of June 30, 2008, the Department had $767,250,000 of outstanding parity bonds. Each Indenture for
the outstanding bonds requires the Department to establish a reserve fund and authorizes the Department to
obtain one or more reserve sureties in lieu of fully funding the reserve fund with cash. Three bond insurers
(Ambac, FGIC and MBIA) provide the reserve sureties for the Department’s outstanding bonds.
96
(Continued)
PORT OF LOS ANGELES
(HARBOR DEPARTMENT OF THE
CITY OF LOS ANGELES),
A COMPONENT UNIT OF THE
CITY OF LOS ANGELES, CALIFORNIA
Notes to Financial Statements
June 30, 2008 and 2007
Until December 2007, these three bond insurers maintained “AAA” ratings from the three rating agencies:
Fitch, Moody’s, and Standard & Poor’s (S&P). Starting in January 2008, the rating agencies began
downgrading the bond insurers. The Department filed material event notices as part of its continuing
disclosure undertakings subsequent to each of the related downgrades or placements on negative outlook.
The downgrade of MBIA by S&P on June 5, 2008 triggered certain specific requirements in compliance
with the 2005/2006 indenture. The Department opted to cash fund its reserve funds in order to comply
with its bond covenants. In so doing, the Board of Harbor Commissioners on September 18, 2008
approved the one-time cash funding of the entire reserve requirement of $61,519,938 to be transferred
from the Harbor Emergency Fund (Fund 751) to the Department’s bond trustee prior to December 2008.
(b)
Financial Market Volatility
Subsequent to June 30, 2008, investment market conditions have resulted in an unusually high degree of
volatility and increased risks associated with certain investments held by the City of Los Angeles that
could impact the value of investments after the date of this financial statements. The Port has
proportionate share in the City Treasurer’s General Investment Pool, which is managed by the City
Treasurer according to their investment policies. The future potential adverse impact of the economic
downturn on the market value of these pool investments will be determined by the changes in the fair
market value of the City Treasurer’s General Investment Pool with the Port’s proportionate share. The
impact of these future events cannot be determined at this time.
97
PORT OF LOS ANGELES
(HARBOR DEPARTMENT OF THE
CITY OF LOS ANGELES),
A COMPONENT UNIT OF THE
CITY OF LOS ANGELES, CALIFORNIA
Required Supplemental Information (Unaudited)
Schedules of Funding Progress
June 30, 2008
(1) Los Angeles City Employees’ Retirement System (LACERS)
a) Retirement Plan
Based upon available data, the following represents the LACERS Schedule of Funding Progress,
separate information for the Port is not available (dollars in thousands):
Retirement Plan
Schedule of Funding Progress
(in thousands)
Valuation date
(June 30)
2006
2007
2008
Actuarial
accrued
liability
Actuarial
(AAL)
value of assets
$ 9,870,662
$ 7,674,999
10,526,874
8,599,700
11,186,404
9,438,318
Unfunded
Funded
AAL
ratio
$(2,195,663) 77.8%
(1,927,174) 81.7%
(1,748,086) 84.4%
Covered
payroll
$ 1,733,340
1,896,609
1,977,645
Unfunded
AAL as a %
of covered
payroll
(126.7)%
(101.6)%
(88.4)%
b) Other Postemployment Benefits (OPEB)
Based upon available data, the following represents the LACERS Schedule of Funding Progress for
the OPEB Plan, separate information for the Port is not available (dollars in thousands):
Other Postemployment Benefits Healthcare Plans
Schedule of Funding Progress
(in thousands)
Valuation date
(June 30)
2006
2007
2008
Actuarial
accrued
liability
Actuarial
(AAL)
value of assets
$ 1,730,799
$ 990,270
1,730,400
1,185,544
1,928,043
1,342,920
98
Unfunded Funded
AAL
ratio
$ (740,529) 57.2%
(544,856) 68.5%
(585,123) 69.7%
Covered
payroll
$ 1,733,340
1,896,609
1,977,645
Unfunded
AAL as a %
of covered
payroll
(42.7)%
(28.7)%
(29.6)%
(Continued)
PORT OF LOS ANGELES
(HARBOR DEPARTMENT OF THE
CITY OF LOS ANGELES),
A COMPONENT UNIT OF THE
CITY OF LOS ANGELES, CALIFORNIA
Required Supplemental Information (Unaudited)
Schedules of Funding Progress
June 30, 2008
(2) Los Angeles Fire and Police Pensions (LAFPP)
a) Retirement Plan
Based upon available data, the following represents the LAFPP Schedule of Funding Progress,
separate information for the Port is not available (dollars in thousands):
Retirement Plan
Schedule of Funding Progress
(in thousands)
Valuation date
(June 30)
2006
2007
2008
Actuarial
accrued
liability
(AAL)
$ 12,811,384
13,324,089
14,279,116
Actuarial
value of assets
$ 12,121,403
13,215,668
14,153,296
Unfunded
AAL
$ (689,981)
(108,421)
(125,820)
Funded
ratio
94.6%
99.2%
99.1%
Covered
payroll
$1,092,815
1,135,592
1,206,589
Unfunded
AAL as a %
of covered
payroll
(63.1)%
(9.5)%
(10.4)%
b) Other Postemployment Benefits Healthcare Plans
Based upon available data, the following represents the LAFPP Schedule of Funding Progress for the
OPEB Plan, separate information for the Port is not available (dollars in thousands):
Other Postemployment Benefits Healthcare Plans
Schedule of Funding Progress
(in thousands)
Valuation date
(June 30)
2006
2007
2008
Actuarial
accrued
liability
Actuarial
(AAL)
value of assets
$ 1,631,187
$ 613,782
1,656,653
687,096
1,836,840
767,647
99
Unfunded Funded
AAL
ratio
$(1,017,405) 37.6%
(969,557) 41.5%
(1,069,193) 41.8%
Covered
payroll
$ 1,092,814
1,135,592
1,206,589
Unfunded
AAL as a %
of covered
payroll
(93.1)%
(85.4)%
(88.6)%
PORT OF LOS ANGELES
(HARBOR DEPARTMENT OF THE
CITY OF LOS ANGELES),
A COMPONENT UNIT OF THE
CITY OF LOS ANGELES, CALIFORNIA
Capital Development Program Budget
Fiscal Year 2008/2009
(In thousands of dollars)
Estimated
expenditure
Project description
Terminal Improvements, General
Minor Capital Projects
POLA Administrative Building Modifications
Environmental Assessment & Remediation
World Cruise Center - General Improvements
Berth 161 - Maintenance - Yard Improvements
Wilmington Waterfront
Berths 97-115 Redevelopment
West Channel Cabrillo Beach Recreation Complex - Phase II
Harry S. Bridges Blvd. Improvement
Berths 142-147 Terminal Redevelopment
Pier 300 - Wharf & Backland Improvements
Berths 225-236 Container Terminal Redevelopment
Main Channel Deepening
Pier A Street Yard Redevelopment
Berths 115-131 Redevelopment
Waterfront Red Car Line
Berths 212-225 Backland Development
Harbor Wide Beautification Projects
San Pedro Waterfront Project - San Pedro Waterfront
San Pedro Waterfront Project - Cabrillo Beach Improvements
Port-Wide Transportation Improvements
B. 206-211 Redevelopment
Pacific Energy Liquid Bulk Terminal
Port Security
LA Port Police Headquarters
San Pedro Waterfront Project - B. 46-72 Warehouse District
San Pedro Waterfront Project - B. San Pedro Downtown Harbor
San Pedro Waterfront Project - B. 73 Fisherman's Wharf
San Pedro Waterfront Project - Ports-O-Call
Alternative Maritime Power Port-wide
B. 258 - 269 (Fish Harbor) Rehabilitation
Intermodal Container Transfer Facility (ICTF) South
San Pedro Slip Improvements
B. 191-194 Improvements
Marine Oil Terminal Engineering
POLA Tree Planting Program
Port-Wide Solar Panel Program
B. 45-50 - Outer Harbor
Supplemental Eng./Arch.Services
Total Estimated Capital Improvement Program Cost
100
$
143
1,650
3,380
2,093
8,413
2,682
25,436
1,955
14,076
2,745
18,119
12,451
830
583
201
2,146
698
3,353
363
14,877
8,330
6,520
402
1,216
18,059
23,599
2,145
2,562
1,102
1,660
24,144
2,580
446
1,971
915
8,452
192
13,506
2,165
28,343
$
264,503
PORT OF LOS ANGELES
(HARBOR DEPARTMENT OF THE
CITY OF LOS ANGELES),
A COMPONENT UNIT OF THE
CITY OF LOS ANGELES, CALIFORNIA
Schedule of Net Assets by Components
Last Ten Fiscal Years
(Unaudited)
(In thousands of dollars)
1999
Net assets:
Invested in capital assets,
net of related debt
Restricted
Unrestricted
Total net assets
2000
2001
2002
2003
2004
2005
2006
2007
2008
$
1,299,889
197
206,269
1,347,288
204
238,278
1,446,072
29
299,319
1,682,470
195
179,093
1,786,780
95
143,921
1,853,776
17
157,833
1,890,002
16
216,678
1,854,468
63,917
282,922
1,931,037
62
406,770
1,985,653
9
491,381
$
1,506,355
1,585,770
1,745,420
1,861,758
1,930,796
2,011,626
2,106,696
2,201,307
2,337,869
2,477,043
101
PORT OF LOS ANGELES
(HARBOR DEPARTMENT OF THE
CITY OF LOS ANGELES),
A COMPONENT UNIT OF THE
CITY OF LOS ANGELES, CALIFORNIA
Schedule of Key Information on Revenue Statistics
Last Ten Fiscal Years
(Unaudited)
1999
Rates:
General cargo tariff rate
Basic dockage (600’)
Required rate of return
2001
2002
2003
2004
2005
2006
2007
2008
5.15
2,033
12.0%
5.67
2,236
12.0%
5.67
2,236
12.0%
5.67
2,236
12.0%
5.95
2,236
12.0%
5.95
2,348
12.0%
5.95
2,348
12.0%
6.25
2,465
12.0%
6.25
2,465
12.0%
6.25
2,465
12.0%
Containerized cargo volume (in millions of TEUs)
3.51
4.37
4.99
5.63
6.70
7.35
7.27
7.80
8.66
8.08
Revenue tons (million):
General cargo
Liquid bulk
Dry bulk
66.8
10.2
5.1
81.9
12.5
7.1
97.6
10.9
5.4
107.1
12.9
6.2
131.9
11.4
4.2
146.3
11.9
3.9
145.0
12.8
4.3
155.2
22.8
3.6
171.9
15.4
2.8
161.9
6.2
1.9
Total
$
2000
82.1
101.5
113.9
126.2
147.5
162.1
162.1
181.6
190.1
170.0
2,683
3,060
2,899
2,778
2,845
2,812
2,646
2,771
2,920
2,467
Cruise passengers
998,086
1,110,053
1,073,357
1,099,552
1,057,293
803,308
1,097,204
1,205,947
1,194,984
1,191,449
Vehicles
272,348
388,619
312,248
314,986
347,067
213,933
242,024
232,149
144,068
185,978
Vessel arrivals
102
PORT OF LOS ANGELES
(HARBOR DEPARTMENT OF THE
CITY OF LOS ANGELES),
A COMPONENT UNIT OF THE
CITY OF LOS ANGELES, CALIFORNIA
Summary of Revenues, Expenses, and Changes in Net Assets
Last Ten Fiscal Years
(Unaudited)
(In thousands of dollars)
1999
2000
2001
2002
2003
2004
2005
2006
2007
2008
171,798
37,494
3,329
208,436
35,594
5,059
232,749
36,554
4,195
248,624
34,691
5,362
281,700
36,563
5,013
293,977
33,261
5,016
315,615
34,630
5,384
353,390
33,876
4,893
369,972
40,322
6,867
374,878
45,524
5,943
Total operating revenues
212,621
249,089
273,498
288,677
323,276
332,254
355,629
392,159
417,161
426,345
Operating and administrative expenses:
Salaries and benefits
Marketing and public relations
Travel and entertainment
Outside services
Material and supplies
City services and payments
Other operating expenses
39,863
1,648
567
13,339
3,373
20,574
7,549
35,274
2,229
557
12,715
3,069
22,961
7,189
39,554
2,385
716
16,583
3,108
20,395
7,275
40,682
3,064
713
21,468
3,508
19,210
10,632
44,427
3,654
658
21,971
3,771
18,525
55,409
53,165
3,769
758
32,104
4,682
18,729
16,967
58,182
3,455
743
39,672
5,320
22,361
41,158
65,705
3,333
822
33,673
5,400
20,821
54,378
74,313
4,521
604
33,277
5,813
28,640
16,607
95,444
5,274
1,128
37,937
8,950
27,101
45,918
Operating revenues:
Shipping services
Rentals
Royalties, fees, and other operating revenues
$
Total operating and administrative expenses
86,913
83,994
90,016
99,277
148,415
130,174
170,891
184,132
163,775
221,752
Income from operations before depreciation
125,708
165,095
183,482
189,400
174,861
202,080
184,738
208,027
253,386
204,593
Depreciation
56,081
56,205
63,187
59,680
59,365
67,934
70,040
98,779
88,106
78,295
69,627
108,890
120,295
129,720
115,496
134,146
114,698
109,248
165,280
126,298
Nonoperating revenues/(expenses):
Income from investments in JPAs and other entities
Interest and investment income
Interest expense
Other income and expenses, net
1,662
11,041
(36,611)
(2,873)
2,146
12,432
(37,300)
(2,716)
4,485
20,092
(45,983)
(1,146)
4,912
11,003
(47,555)
(1,123)
3,717
11,430
(44,293)
(18,698)
2,795
2,298
(43,034)
(13,724)
3,543
7,266
(42,279)
11,842
4,302
9,582
(37,787)
7,222
4,675
23,773
(50,038)
11,018
4,440
34,863
(38,052)
(2,536)
Net nonoperating expenses
(26,781)
(25,438)
(22,552)
(32,763)
(47,844)
(51,665)
(19,628)
(16,681)
(10,572)
(1,285)
42,846
83,452
97,743
96,957
67,652
82,481
95,070
92,567
154,708
125,013
5,582
—
(17,378)
2,809
—
(6,846)
7,500
61,752
(7,345)
17,203
2,178
—
1,386
—
—
867
—
(2,518)
—
—
—
2,044
—
—
4,145
(22,291)
—
14,161
—
—
Operating income
Income before capital contributions
Capital contributions
Special item
Deletions of capital contribution
Changes in net assets
31,050
79,415
159,650
116,338
69,038
80,830
95,070
94,611
136,562
139,174
Total net assets – beginning of year
1,475,305
1,506,355
1,585,770
1,745,420
1,861,758
1,930,796
2,011,626
2,106,696
2,201,307
2,337,869
1,506,355
1,585,770
1,745,420
1,861,758
1,930,796
2,011,626
2,106,696
2,201,307
2,337,869
2,477,043
Total net assets – end of year
$
See accompanying independent auditors’ report.
103
PORT OF LOS ANGELES
(HARBOR DEPARTMENT OF THE
CITY OF LOS ANGELES),
A COMPONENT UNIT OF THE
CITY OF LOS ANGELES, CALIFORNIA
Schedule of Revenue Tonnage by Trade Routes
Last Ten Fiscal Years
(Unaudited)
(In thousands of metric revenue tons)
Trade routes
Far East
Domestic
Australia and New Zealand
Western Mexico, Central and Western S. America
India, Persian Gulf, and Red Sea
Eastern South America
Western Europe
Caribbean
Mediterranean
Africa
Advance Wharfage and Accruals
Total
Percentage of total volume
Trade routes
Far East
Domestic
Australia and New Zealand
Western Mexico, Central and Western S. America
India, Persian Gulf, and Red Sea
Eastern South America
Western Europe
Caribbean
Mediterranean
Africa
Advance Wharfage and Accruals
Total
1999
2000
2001
2002
2003
2004
2005
2006
2007
2008
61,140
9,770
2,629
3,317
4,610
722
1,727
853
593
19
(3,252)
73,707
9,905
2,797
2,960
5,485
1,665
1,496
930
560
31
1,973
83,727
9,465
2,755
3,185
2,225
1,009
1,953
860
148
88
8,539
102,482
10,979
3,233
2,332
2,614
1,665
1,671
676
206
77
(2,523)
131,304
10,171
3,004
2,246
1,970
988
882
612
159
94
(3,887)
143,005
8,808
3,649
2,077
1,795
754
960
1,102
157
54
(292)
142,385
8,408
3,716
1,797
1,888
1,099
1,128
1,369
151
188
(20)
151,971
15,941
4,204
1,360
2,502
1,409
1,752
1,432
227
25
811
166,277
9,750
4,577
1,586
2,258
800
1,642
1,273
165
28
1,749
158,442
4,899
2,203
1,311
1,455
542
339
906
208
37
(371)
82,128
101,509
113,954
123,412
147,543
162,069
162,109
181,634
190,105
169,971
1999
74.4%
11.9%
3.2%
4.0%
5.6%
0.9%
2.1%
1.0%
0.7%
0.0%
(4.0)%
100.0%
2000
2001
72.6%
9.8%
2.8%
2.9%
5.4%
1.6%
1.5%
0.9%
0.6%
0.0%
1.9%
73.5%
8.3%
2.4%
2.8%
2.0%
0.9%
1.7%
0.8%
0.1%
0.1%
7.5%
100.0%
100.0%
2002
83.0%
8.9%
2.6%
1.9%
2.1%
1.3%
1.4%
0.5%
0.2%
0.1%
(2.0)%
100.0%
See accompanying independent auditors’ report.
104
2003
89.0%
6.9%
2.0%
1.5%
1.3%
0.7%
0.6%
0.4%
0.1%
0.1%
(2.6)%
100.0%
2004
88.2%
5.4%
2.3%
1.3%
1.1%
0.5%
0.6%
0.7%
0.1%
0.0%
(0.2)%
100.0%
2005
87.8%
5.2%
2.3%
1.1%
1.2%
0.7%
0.7%
0.8%
0.1%
0.1%
(0.0)%
100.0%
2006
2007
83.7%
8.8%
2.3%
0.7%
1.4%
0.8%
1.0%
0.8%
0.1%
0.0%
0.4%
87.5%
5.1%
2.4%
0.8%
1.2%
0.4%
0.9%
0.7%
0.1%
0.0%
0.9%
100.0%
100.0%
2008
93.2%
2.9%
1.3%
0.8%
0.9%
0.3%
0.2%
0.5%
0.1%
0.0%
(0.2)%
100.0%
PORT OF LOS ANGELES
(HARBOR DEPARTMENT OF THE
CITY OF LOS ANGELES),
A COMPONENT UNIT OF THE
CITY OF LOS ANGELES, CALIFORNIA
Summary of Debt Service Coverage (Pledged Revenue)
Last Ten Fiscal Years
(Unaudited)
(In thousands of dollars)
Operating revenues (1)
Operating expenses (2)
$
Net available revenue (3) = (1) – (2)
Debt service, revenue bonds
Debt service, commercial papers
Total debt service (4)
$
Coverage (5) = (3) / (4)
Net cash flow from operations (6)
Coverage (7) = (6) / (4)
(1)
(2)
$
1999
2000
2001
2002
2003
2004
2005
2006
2007
2008
212,621
86,913
249,089
83,994
273,498
90,016
288,677
99,277
323,276
148,415
332,254
130,174
355,629
170,891
392,159
184,132
417,161
163,775
426,345
221,752
125,708
165,095
183,482
189,400
174,861
202,080
184,738
208,027
253,386
204,593
53,343
53,336
53,333
54,310
—
54,097
988
57,994
1,029
58,515
2,021
58,673
3,431
71,117
792
61,321
—
53,343
53,336
53,333
54,310
55,085
59,023
60,536
62,104
71,909
61,321
2.4
3.1
3.4
3.5
3.2
3.4
3.1
3.3
3.5
3.3
136,803
167,228
200,342
176,083
215,117
208,762
226,037
201,575
246,665
252,898
2.6
3.1
3.8
3.2
3.9
3.5
3.7
3.2
3.4
4.1
Operating revenues do not include income from investment and other nonoperating revenues.
Depreciation and amortization expense, interest expense, and other nonoperating expenses are not included.
Debt service includes principal and interest payments on issued bonds as well as on commercial paper notes, which are debts backed by pledged-revenue.
Debt service does not include loans from the California Department of Boating and Waterways, which are not backed by pledged-revenue.
Note: Details regarding the Port of Los Angeles’ outstanding debt can be found in the notes to the financial statements.
105
PORT OF LOS ANGELES
(HARBOR DEPARTMENT OF THE
CITY OF LOS ANGELES),
A COMPONENT UNIT OF THE
CITY OF LOS ANGELES, CALIFORNIA
Highlights of Operating Information
Last Ten Fiscal Years
(Unaudited)
(In millions of dollars)
1999
Cash:
Cash balance – Harbor
revenue fund
Cash balance – Restricted
Property:
Total property
Allowance for depreciation
Net property
2000
2001
2002
2003
2004
2005
2006
2007
2008
$
192.6
73.5
201.6
73.5
246.4
82.7
74.2
87.2
84.5
97.1
117.3
107.3
211.2
122.4
256.3
201.3
380.1
158.3
488.9
168.3
$
2,576.8
480.1
2,675.5
535.0
2,810.9
594.0
3,120.2
653.4
3,346.0
711.8
3,471.4
764.2
3,556.1
833.7
3,664.0
931.3
3,720.4
994.0
3,816.7
1,058.2
$
2,096.7
2,140.5
2,216.9
2,466.8
2,634.2
2,707.2
2,722.4
2,732.7
2,726.4
2,758.5
Construction and maintenance:
Additions to properties
Maintenance expenses
$
0.3
12.3
542.3
13.1
154.2
12.4
330.4
13.4
227.8
15.2
208.0
17.4
85.3
18.4
109.3
21.0
104.2
23.5
117.7
28.1
Employees:
Salaries
Number of employees
$
38.5
577
37.5
541
39.0
542
41.2
557
43.9
594
48.9
634
53.0
659
56.9
706
64.9
737
75.9
850
106
APPENDIX C
THE HARBOR DEPARTMENT OF THE CITY OF LONG BEACH, CALIFORNIA
FINANCIAL STATEMENTS FOR THE FISCAL YEARS ENDED SEPTEMBER 30, 2008 AND 2007
C-1
THE HARBOR DEPARTMENT OF THE CITY OF LONG BEACH
Financial Statements
September 30, 2008 and 2007
(With Independent Auditors’ Report Thereon)
THE HARBOR DEPARTMENT OF THE CITY OF LONG BEACH
Financial Statements
September 30, 2008 and 2007
Table of Contents
Page(s)
Independent Auditors’ Report
1–2
Management’s Discussion and Analysis (Unaudited)
3–9
Financial Statements:
Statements of Net Assets
10 – 11
Statements of Revenues, Expenses, and Changes in Fund Net Assets
12
Statement of Cash Flows
13
Notes to Financial Statements
14 – 47
KPMG LLP
Suite 2000
355 South Grand Avenue
Los Angeles, CA 90071-1568
Independent Auditors’ Report
The Honorable Mayor and City Council
The Honorable Members of the Board of Harbor Commissioners:
We have audited the accompanying financial statements of the Harbor Department of the City of Long
Beach (the Department), an enterprise fund of the City of Long Beach, California, as of and for the years
ended September 30, 2008 and 2007, as listed in the table of contents. These financial statements are the
responsibility of the Department’s management. Our responsibility is to express an opinion on these
financial statements based on our audits.
We conducted our audits in accordance with auditing standards generally accepted in the United States of
America. Those standards require that we plan and perform the audit to obtain reasonable assurance about
whether the financial statements are free of material misstatement. An audit includes consideration of
internal control over financial reporting as a basis for designing audit procedures that are appropriate in the
circumstances, but not for the purpose of expressing an opinion on the effectiveness of the Department’s
internal control over financial reporting. Accordingly, we express no such opinion. An audit also includes
examining, on a test basis, evidence supporting the amounts and disclosures in the financial statements,
assessing the accounting principles used and significant estimates made by management, as well as
evaluating the overall financial statement presentation. We believe that our audits provide a reasonable
basis for our opinion.
As discussed in note 1, the financial statements of the Department are intended to present the financial
position, and the changes in financial position and, where applicable, cash flows of only that portion of the
governmental activities, the business-type activities, each major fund and the aggregate remaining fund
information of the City of Long Beach, California, that is attributable to the transactions of the Department.
They do not purport to, and do not, present fairly the financial position of the City of Long Beach,
California, as of June 30, 2008 and 2007, the changes in its financial position, or where applicable, its cash
flows for the year then ended in conformity with U.S. generally accepted accounting principles
In our opinion, the financial statements referred to above present fairly, in all material respects, the
financial position of the Harbor Department of the City of Long Beach, California, as of September 30,
2008 and 2007, and the changes in its financial position and its cash flows for the years then ended in
conformity with U.S. generally accepted accounting principles.
As discussed in notes 1 and 9 to the financial statements, effective July 1, 2007, the Department adopted
Governmental Accounting Standards Board (GASB) Statement No. 45, Accounting and Financial
Reporting by Employers for Postemployment Benefits Other Than Pensions, in accounting for its
postretirement healthcare costs.
KPMG LLP, a U.S. limited liability partnership, is the U.S.
member firm of KPMG International, a Swiss cooperative.
Management’s discussion and analysis on pages 3 through 9 is not a required part of the basic financial
statements but is supplementary information required by U.S. generally accepted accounting principles.
We have applied certain limited procedures, which consisted principally of inquiries of management
regarding the methods of measurement and presentation of the required supplementary information.
However, we did not audit the information and express no opinion on it.
March 25, 2009
2
THE HARBOR DEPARTMENT OF THE CITY OF LONG BEACH
Management’s Discussion and Analysis (Unaudited)
September 30, 2008 and 2007
As management of the Harbor Department of the City of Long Beach, California (the Department), we offer
readers of the financial statements this discussion and analysis of the financial activities for the fiscal years ended
September 30, 2008 and 2007.
Overview of the Financial Statements
The Department’s financial statements include the statements of net assets, the statements of revenues, expenses,
and changes in fund net assets, the statements of cash flows, and the notes to the financial statements. This
discussion is intended to serve as an introduction to the Department’s financial statements.
Condensed Financial Position Information
The Statements of Net Assets presents information concerning the Department’s assets, liabilities, and net assets.
The following condensed financial information provides an overview of the Department’s financial position as of
September 30 of 2008, 2007, and 2006.
Summary of Net Assets
September 30, 2008, 2007, and 2006
2008
Assets:
Capital assets, net
Other assets
Total assets
Net assets:
Invested in capital assets, net of related debt
Restricted
Unrestricted
Total net assets
2006
$ 2,243,615,808
1,160,749,854
2,245,291,679
1,142,439,210
2,191,431,430
1,031,344,405
3,404,365,662
3,387,730,889
3,222,775,835
840,616,156
260,169,291
1,032,894,146
212,096,250
1,096,106,131
144,523,851
1,100,785,447
1,244,990,396
1,240,629,982
1,335,522,370
330,508,412
637,549,433
1,162,931,088
296,775,465
683,033,940
1,079,606,148
317,730,496
584,809,209
$ 2,303,580,215
2,142,740,493
1,982,145,853
Liabilities:
Long-term obligations, net of current portion
Current liabilities
Total liabilities
2007
Analysis of Fiscal Year 2008
At the end of fiscal year 2008, the assets of the Department exceeded its liabilities by $2,303,580,215
(net assets). Total net assets increased by $160,839,722. This change consists mainly of $163,681,269 current
year operating income, $4,440,935 income from equity in the Intermodal Container Transfer Facility Joint
Powers Authority (ICTF) joint venture, $3,742,240 income derived from grants received from federal and state
governments, $31,153,305 profit from oil operations; less $42,178,027 from other net nonoperating expenses,
including financing costs and 10% of increase in net assets transfer to the City of Long Beach’s (the City)
Tidelands Operating Fund, which amounts to $16,059,464.
3
(Continued)
THE HARBOR DEPARTMENT OF THE CITY OF LONG BEACH
Management’s Discussion and Analysis (Unaudited)
September 30, 2008 and 2007
The Department’s investment in capital assets (land; structures and facilities; furniture, fixtures, and equipment;
construction in progress; and rights of way) less any related debt is $1,335,522,370 or 58% of the aggregate net
assets. Capital assets facilitate tenants’ cargo operations and the Department does not intend to liquidate them to
fund ongoing port operations.
The Department holds $330,508,412 of net assets subject to restrictions, an increase of $33,732,947 from
last year. The increase consists of matching contribution for future federal and state grants for projects such as
bridges, rail, roadway, and port security paired with reductions on the bonded debt service requirements, rail and
roadway fund, and full utilization of the RDA Westside restricted funds. Restricted net assets are thus identified
in the Statements of Net Assets and represent 14% of the Department’s total net assets.
At the end of fiscal year 2008, the Department reported unrestricted net assets of $637,549,433, a decrease of
$45,484,507 when compared to 2007. This change included an increase in net assets of $160,839,722, less
$172,591,282 used to finance capital assets, net of related liabilities, and the net effect of setting reserves for the
Gerald Desmond Bridge, the rail and roadway fund, rail projects, and security projects (a net reduction of
$33.73 million). Unrestricted net assets represented 28% of the Department’s aggregate net assets, and were not
subject to external restrictions. Unrestricted net assets were available to fund the Department’s continuing
obligations and designated projects.
Analysis of Fiscal Year 2007
At the end of fiscal year 2007, the assets of the Department exceeded its liabilities by $2,142,740,493
(net assets). Total net assets increased by $160,594,640. This change consisted mainly of $190,800,991 current
year operating income, $4,674,546 income from equity in the ICTF joint venture, $10,019,920 income derived
from grants received from federal and state governments; less $21,070,305 loss from oil operations, and
$23,830,512 from other net nonoperating expenses, including financing costs and 10% transfer to the City’s
Tidelands Operating Fund, which amounted to $15,399,535.
The Department’s investment in capital assets (land; structures and facilities; furniture, fixtures, and equipment;
construction in progress; and rights of way) less any related debt was $1,162,931,088 or 54% of the aggregate net
assets.
The Department held $296,775,465 of net assets subject to restrictions, a reduction of $20,955,031 from 2006.
The decrease is related to the utilization of funds earmarked for the City of Long Beach RDA Westside projects
and the reclassification of funds restricted for non-related party debt-service contingency, and matching
contribution for future federally funded projects. Restricted net assets were thus identified in the Statements of
Net Assets and represented 14% of the Department’s total net assets.
At the end of fiscal year 2007, the Department reported unrestricted net assets of $683,033,940, an increase of
$98,224,731 when compared to 2006. This increase included an increase in net assets of $160,594,640, less
$83,324,940 used to finance capital assets, net of related liabilities, plus the reversing of funds originally
allocated to fund the Gerald Desmond Bridge and the Rail and Roadway Reserves netting $18,403,799, and an
increase in unrestricted net assets as a result of a $2,551,231 moved out of restricted net assets for qualifying
expenses for the RDA Westside project. Unrestricted net assets represented 32% of the Department’s aggregate
net assets, and were not subject to external restrictions. Unrestricted net assets were available to fund the
Department’s continuing obligations and designated projects.
4
(Continued)
THE HARBOR DEPARTMENT OF THE CITY OF LONG BEACH
Management’s Discussion and Analysis (Unaudited)
September 30, 2008 and 2007
Summary of Operations and Changes in Net Assets
The statements of revenues, expenses, and changes in fund net assets illustrates the Department’s change in net
assets from prior to current fiscal year. These changes are reported as soon as the underlying event giving rise to
the change occurs, regardless of the timing of related cash flows. Thus, some revenues and expenses reported in
this statement will only affect future period cash flows, for example: uncollected receivables and earned, but
unused, vacation leave.
The table below summarizes the operations for fiscal years 2008, 2007, and 2006.
Changes in Fund Net Assets
Years ended September 30, 2008, 2007, and 2006
Operating revenues:
Berth and special facilities
Miscellaneous
2008
2007
2006
340,524,798
18,819,335
351,891,119
18,940,814
337,675,886
15,618,591
359,344,133
370,831,933
353,294,477
(81,440,115)
(34,725,802)
(79,496,947)
(69,959,326)
(27,004,526)
(83,067,090)
(54,341,202)
(21,199,838)
(85,465,306)
(195,662,864)
(180,030,942)
(161,006,346)
163,681,269
190,800,991
192,288,131
(16,059,464)
(13,044,028)
31,153,305
(254,540)
4,440,935
(13,866,798)
1,046,803
(15,399,535)
(9,698,643)
(21,070,305)
179
4,674,546
—
1,267,487
(14,222,184)
(25,807,784)
6,125,571
(1,391,831)
4,301,663
—
(9,596,403)
(6,583,787)
(40,226,271)
(40,590,968)
157,097,482
150,574,720
151,697,163
3,742,240
10,019,920
2,298,184
160,839,722
160,594,640
153,995,347
2,142,740,493
1,982,145,853
1,828,150,506
$ 2,303,580,215
2,142,740,493
1,982,145,853
$
Total operating revenues
Operating expenses:
Facility and infrastructure
General and administrative
Depreciation and amortization
Total operating expenses
Operating income
Non-operating revenues (expenses):
Intergovernmental expense
Investment expense, net of income
Income (loss) from oil operations
Loss (gain) on sale of capital assets
Income from equity in joint venture
Clean Air Action Plan expense
Other income (expense), net
Net nonoperating expenses
Income before capital grants
Capital grants
Change in net assets
Total net assets – beginning
Total net assets – ending
5
(Continued)
THE HARBOR DEPARTMENT OF THE CITY OF LONG BEACH
Management’s Discussion and Analysis (Unaudited)
September 30, 2008 and 2007
Analysis of Fiscal Year 2008
A comparison of the operating revenues for fiscal years 2008 and 2007 shows a decrease of 3%. All the revenue
categories, except dry bulk (2% increase), decreased: containerized cargo 3%, liquid bulk 6%, steel 1%, vehicles
1%, lumber 4%, other terminals 20%, rentals 1%.
In terms of volume (measured in metric revenue tons), all types of cargo decreased during fiscal year 2008:
containerized cargo 5%, dry bulk 7%, vehicles 19%, steel 13%, lumber 17%, and liquid bulk 8%.
Operating expenses increased due to higher maintenance costs on the Gerald Desmond Bridge, increased levels
of service provided by the Long Beach Police and Fire Departments; revamping and modernization of the Port’s
Security Division, and additional costs incurred to patrol and secure water areas around the Port complex.
Upgrades and maintenance of access roads, sanitation systems, and far reaching efforts to promote community
awareness were also factors causing the increase in operating expenses.
Depreciation expense is affected by acquisition/retirement of operating assets, their useful lives, and the dates
when such assets are placed in service. Depreciation expense for fiscal year 2008 was lower than that of 2007
because many of the capital assets owned by the Port have maximized their allowable depreciation. Investment
income was lower due to the recording of the loss on Lehman Brothers commercial paper investment. Interest
expense was lower because of the full payment of the 2002A bonds and the reduction, due to regular debt
servicing, on the principal balances of the other debt carried by the Department.
Oil operations net revenues increased to $31.2 million from a $21.1 million loss in previous year due to favorable
crude oil prices prevailing during the fiscal year. Fiscal year 2008 is the first year in which expenses were
incurred on the Clean Trucks Program, which is an important component of the Clean Air Action Plan (CAAP);
net expenses for the year were $13.9 million; the portion of the capital grant project expenses subsidized with
grant revenues decreased from $10 million in FY 2007 to $3.7 million in FY 2008 because these projects were
delayed.
Analysis of Fiscal Year 2007
A comparison of the results of operations for fiscal years 2007 and 2006 showed an increase in operating
revenues of 5%. The following revenue categories increased: containerized cargo 6%, liquid bulk 6%, other
facilities 10%, rentals 28%, vehicles 1%, and miscellaneous income 4%; the following revenue categories
decreased: dry bulk facilities 11%, steel 3%, and lumber 16%. Gross oil operations revenue decreased by 1%.
In terms of volume (measured in metric revenue tons), only containerized cargo increased by 5%, while
decreases were experienced by dry bulk 12%, vehicles 16%, steel 6%, lumber 7%, and miscellaneous 25%.
Liquid bulk moved up by less than 1%.
Operating expenses increased due to the ongoing implementation of the Green Port policy, which encompasses
programs such as the CAAP. The policy provides resources to support efforts geared toward a cleaner
environment within and around the Port complex. Another element is the safety and security concerns faced by
the maritime industry inducing the Port to increase its security expenses. Upgrades and maintenance of access
roads, sanitation systems, and revamping of community outreach and involvement were also factors increasing
operating expenses.
6
(Continued)
THE HARBOR DEPARTMENT OF THE CITY OF LONG BEACH
Management’s Discussion and Analysis (Unaudited)
September 30, 2008 and 2007
Depreciation expense decreased during 2007; changes are in direct proportion to the acquisition/retirement of
operating assets; date when assets are placed in service and when assets are recorded in the books; and partial
closing of projects.
Investment expense was lower because of smaller bonded debt principal balances. Interest income increased due
to higher interest rates and higher cash balances maintained by the Port.
Oil operations changed from a $6.1 million income in 2006 to a $21.1 million loss in 2007. The change was
mainly related to the recognition of an environmental remediation liability related to cleaning up waste on Pier A
West.
Capital Assets and Debt Administration
Capital Assets
The Department’s investments in capital assets, net of accumulated depreciation, as of September 30, 2008,
2007, and 2006 are as follows:
Capital Assets, Net
September 30, 2008, 2007, and 2006
Non-depreciable capital assets :
Land
Construction in progress
Rights of way
Subtotal nondepreciable capital
assets
Depreciable capital assets (net):
Structures and facilities
Furniture, fixtures, and equipment
Subtotal depreciable capital assets
Total capital assets, net
2008
2007
2006
858,813,707
164,535,655
207,823,264
850,704,021
225,836,752
207,823,264
848,903,831
145,554,036
207,823,264
1,231,172,626
1,284,364,037
1,202,281,131
1,008,240,275
4,202,907
956,920,248
4,007,394
985,583,964
3,566,335
1,012,443,182
960,927,642
989,150,299
$ 2,243,615,808
2,245,291,679
2,191,431,430
$
Analysis of Fiscal Year 2008
The Department’s investments in capital assets include land; structures and facilities; furniture, fixtures, and
equipment; construction in progress; and rights of way. Capital assets decreased by less than 1% when compared
to fiscal year 2007. Additions/transfer to capital asset accounts were offset by reductions, either by transfers to
capital asset accounts or by closing projects to operating expenses, in construction in progress. Information
regarding the Department’s capital assets can be found in note 5 to the financial statements.
7
(Continued)
THE HARBOR DEPARTMENT OF THE CITY OF LONG BEACH
Management’s Discussion and Analysis (Unaudited)
September 30, 2008 and 2007
Analysis of Fiscal Year 2007
The Department’s investments in capital assets include land; structures and facilities; furniture, fixtures, and
equipment; construction in progress; and rights of way. Capital assets increased 2% when compared to fiscal year
2006. The increase is related to higher activity in the construction in progress accounts, and as a result, more
projects started or continued. As more projects were completed, more assets were placed in service and aging
carpool and utility vehicles were replaced with ones with more fuel efficient and cleaner emissions. Additionally,
the Port is upgrading and modernizing its security equipment. Information regarding the Department’s capital
assets can be found in note 5 to the financial statements.
Debt Administration
The following table summarizes the Department’s debt, originally incurred as long-term, as of September 30,
2008, 2007, and 2006. For consistency purposes, this schedule includes the current portion.
Debt Originally Incurred as Long-Term Debt
September 30, 2008, 2007, and 2006
2008
Bond debt (principal and net premiums)
Commercial paper outstanding
Notes payable
Total long-term debt
2007
2006
$
842,403,531
60,150,000
—
1,016,164,146
60,150,000
41,333
1,055,949,798
60,150,000
82,667
$
902,553,531
1,076,355,479
1,116,182,465
Analysis of Fiscal Year 2008
The Department’s total long-term debt decreased by $173,801,948, or 16%. The decrease was the result of
scheduled bond debt service-payments and the retirement of the 2002A variable rate debt obligation
(VRDO) bonds ($133.8 million).
The underlying ratings assigned to the Department’s bond issues are as follows: Standard & Poor’s: AA, stable
outlook; Moody’s Investors Services: Aa2, stable outlook; and Fitch Ratings: AA, stable outlook. The ratings are
the result of factors such as: the Port’s significant size and strength among the West Coast container ports; its
status as a world-class facility; its prime location to attract Pacific Rim trade; convenient links to inter-modal
connections; its healthy financial condition and high liquidity; the proactive approach to secure and protect its
facilities and to make them as safe as possible; the continued implementation of an environmentally responsible
capital program supported by the Board of Harbor Commissioners; and management’s commitment to efficiency,
sustainability, environmental protection, and customer service.
The debt-service coverage ratios for fiscal years ended 2008 and 2007 are 3.1 and 3.5, respectively. The
minimum rate required by the Department’s various bond indenture documents is 1.25. Additional information
on the Department’s long-term debt can be found in notes 6, 7, and 8 on pages 28-35 of this report.
8
(Continued)
THE HARBOR DEPARTMENT OF THE CITY OF LONG BEACH
Management’s Discussion and Analysis (Unaudited)
September 30, 2008 and 2007
Analysis of Fiscal Year 2007
The Department’s total long-term debt decreased by $39,826,986; or approximately 4%. The decrease was the
result of scheduled bond debt service-payments.
The underlying ratings assigned to the Department’s bond issues are as follows: Standard & Poor’s: AA, stable
outlook; Moody’s Investors Services: Aa2, stable outlook; and Fitch Ratings: AA, stable outlook. The ratings are
the result of factors such as: the Port’s significant size and strength among the West Coast container ports; its
status as a world-class facility; its prime location to attract Pacific Rim trade; convenient links to inter-modal
connections; its healthy financial condition and high liquidity; the proactive approach to protect its facilities and
to make them as safe and secure as possible; the continued implementation of an environmentally responsible
capital program supported by the Board of Harbor Commissioners; and management’s commitment to efficiency,
sustainability, environmental protection, and customer service.
The debt-service coverage ratios for fiscal years ended 2007 and 2006 are 3.5 and 3.4, respectively. The
minimum rate required by the Department’s various bond indenture documents is 1.25. Additional information
on the Department’s long-term debt can be found in notes 6, 7, and 8 on pages 28-35 of this report.
Notes to the Financial Statements
The notes to the Department’s financial statements can be found on pages 14-47 of this report. These notes
provide additional information that is essential to a full understanding of the financial statements.
Requests for Information
This financial report is designed to provide a general overview of the Department’s finances for people or entities
interested in the financial aspects of the Port. Questions concerning any of the information provided in this report
or requests for additional financial information should be addressed to the Chief Financial Officer, 925 Harbor
Plaza, Long Beach, CA 90802.
9
THE HARBOR DEPARTMENT OF THE CITY OF LONG BEACH
Statements of Net Assets
September 30, 2008 and 2007
Assets
2008
2007
725,689,304
50,090,855
581,213
2,228,927
2,267,630
742,222
681,822,132
46,928,166
535,260
—
5,930,537
734,102
781,600,151
735,950,197
232,528,585
21,473,654
32,228,105
258,912,893
21,788,988
32,228,368
286,230,344
312,930,249
Total current assets
1,067,830,495
1,048,880,446
Non-current assets:
Capital assets (notes 5 and 10):
Land:
Purchased
Constructed
439,913,481
418,900,226
439,913,481
410,790,540
858,813,707
850,704,021
1,947,975,911
(939,735,636)
1,818,157,460
(861,237,212)
1,008,240,275
956,920,248
17,499,336
(13,296,429)
16,683,825
(12,676,431)
4,202,907
4,007,394
164,535,655
207,823,264
225,836,752
207,823,264
2,243,615,808
2,245,291,679
27,435,000
27,435,000
10,903,015
44,278,068
7,903,276
2,400,000
11,083,355
44,278,068
7,462,341
3,300,000
92,919,359
93,558,764
2,336,535,167
2,338,850,443
$ 3,404,365,662
3,387,730,889
Current assets:
Pooled cash and cash equivalents (note 2)
Accounts receivable, net of allowance (note 3)
Interest receivable
Nonperforming investments (note 3)
Due from other governmental agencies (note 3)
Inventories of supplies
$
Subtotal
Harbor Revenue Bond Funds and other funds restricted as to
use (notes 2 and 8):
Pooled cash and cash equivalents
Non-pooled cash and cash equivalents
Non-pooled investments
Subtotal restricted current assets
Net land
Structures and facilities
Less accumulated depreciation
Net structures and facilities
Furniture, fixtures, and equipment
Less accumulated depreciation
Net furniture, fixtures, and equipment
Construction in progress
Rights of way (note 4)
Net capital assets
Other assets:
Long-term receivables (note 3)
Oil facilities (net of accumulated depletion of $70,232,840 and
$70,052,500, respectively)
Environmental mitigation credits (note 14)
Investments in joint venture (note 11)
Other non-current assets
Total other assets
Total non-current assets
Total assets
10
(Continued)
THE HARBOR DEPARTMENT OF THE CITY OF LONG BEACH
Statements of Net Assets
September 30, 2008 and 2007
Liabilities and Net Assets
Current liabilities payable from current assets:
Accounts payable and accrued expenses
Accrued claims and judgments (note 12)
Accrued interest – commercial paper (note 6)
Commercial paper outstanding (note 6)
Deferred credits and unearned revenue
Due to City of Long Beach (note 13)
Environmental remediation (note 12)
Notes payable (note 7)
2008
2007
53,972,310
—
185,725
60,150,000
14,586,669
16,274,861
60,411,804
—
50,810,785
2,385,000
282,852
60,150,000
15,920,605
15,605,875
9,600,000
41,333
205,581,369
154,796,450
38,145,000
16,442,922
40,170,000
17,129,800
54,587,922
57,299,800
260,169,291
212,096,250
804,258,531
16,457,625
19,900,000
975,994,146
38,100,000
18,800,000
840,616,156
1,032,894,146
1,100,785,447
1,244,990,396
1,335,522,370
1,162,931,088
184,184,312
44,278,068
102,046,032
143,870,930
49,096,654
103,807,881
637,549,433
683,033,940
$ 2,303,580,215
2,142,740,493
$
Total current liabilities payable from current assets
Current liabilities payable from restricted assets:
Current portion of bonds indebtedness (note 8)
Accrued interest – bonds
Total current liabilities payable from restricted assets
Total current liabilities
Long-term obligations net of current portion:
Bonds indebtedness (note 8)
Environmental remediation (note 12)
Oil wells abandonment (note 12)
Total non-current liabilities
Total liabilities
Net assets (note 15):
Invested in capital assets, net of related debt
Restricted-nonrelated-party debt service contingency and matching
contribution for future federally funded projects (note 12)
Restricted-capital projects
Restricted-debt service (note 8)
Unrestricted:
Unrestricted
Total net assets
See accompanying notes to financial statements.
11
THE HARBOR DEPARTMENT OF THE CITY OF LONG BEACH
Statements of Revenues, Expenses, and Changes in Fund Net Assets
Fiscal years ended September 30, 2008 and 2007
2008
2007
340,524,798
14,495,795
4,323,540
351,891,119
14,633,060
4,307,754
359,344,133
370,831,933
7,870,391
45,556,412
21,353,046
6,660,266
34,725,802
9,777,839
29,916,302
20,472,349
9,792,836
27,004,526
116,165,917
96,963,852
79,496,947
83,067,090
Total Port operating expenses
195,662,864
180,030,942
Operating income
163,681,269
190,800,991
Nonoperating income (expense):
Investment income, net
Interest expense
Income (loss) from Harbor oil operations
Gain (loss) on disposition of capital assets
Income from equity in joint ventures (note 11)
Clean Air Action Plan (net)
Other income
33,346,928
(46,390,956)
31,153,305
(254,540)
4,440,935
(13,866,798)
1,046,803
43,374,260
(53,072,903)
(21,070,305)
179
4,674,546
—
1,267,487
Net nonoperating income (expense)
9,475,677
(24,826,736)
173,156,946
165,974,255
3,742,240
(16,059,464)
10,019,920
(15,399,535)
160,839,722
160,594,640
2,142,740,493
1,982,145,853
$ 2,303,580,215
2,142,740,493
Port operating revenues (note 10):
Berths and special facilities
Rental properties
Miscellaneous
$
Total Port operating revenues
Port operating expenses:
Facility maintenance
Infrastructure maintenance
Fire and safety
Other indirect
General and administrative
Port operating expenses before depreciation and
amortization
Depreciation and amortization
Income before capital grants and transfers
Capital grants
Transfers to the City of Long Beach (note 13)
Increase in net assets
Total net assets, at beginning of year
Total net assets, at end of year
See accompanying notes to financial statements.
12
THE HARBOR DEPARTMENT OF THE CITY OF LONG BEACH
Statements of Cash Flows
Fiscal years ended September 30, 2008 and 2007
Cash flows from operating activities:
Cash received from customers
Cash paid to employees net of capitalized labor of $4,786,307
and $6,017,758 in 2008 and 2007, respectively
Cash paid to suppliers
$
Net cash provided by operating activities
Cash flows from investing activities:
Harbor oil operations providing cash
Interest received
Return on investment in joint venture
Net cash provided by investing activities
Cash flows from non-capital financing activities:
Clean Air Action Plan
Intergovernmental transfers
Net cash used in non-capital financing activities
Cash flows from capital and related financing activities:
Grant proceeds
Interest paid
Payments for capital acquisitions
Principal payment – notes
Principal repayment – bonds
Proceeds from the sales of capital assets
Net cash used in capital and related financing activities
Net increase in cash and cash equivalents
Cash and cash equivalents, at beginning of year
2008
2007
359,339,856
366,577,042
(32,679,627)
(51,260,792)
(27,599,780)
(68,436,839)
275,399,437
270,540,423
29,727,236
31,072,311
8,000,000
11,122,605
43,417,824
—
68,799,547
54,540,429
(1,147,823)
(15,399,535)
—
(14,222,184)
(16,547,358)
(14,222,184)
7,046,639
(50,787,577)
(97,517,285)
(41,333)
(170,130,000)
945,460
4,613,447
(54,964,815)
(104,545,559)
(41,333)
(38,335,000)
—
(310,484,096)
(193,273,260)
17,167,530
117,585,408
962,524,013
844,938,605
Cash and cash equivalents, at end of year
$
979,691,543
962,524,013
Reconciliation of operating income to net cash provided by operating activities:
Operating income
$
163,681,269
190,800,991
79,496,947
26,954
83,067,090
—
587,025
(8,120)
7,939,727
(814,410)
21,333
24,459,654
9,058
(3,322,113)
(194,009)
924,284
(53,337)
(539,035)
—
(143,448)
$
275,399,437
270,540,423
$
725,689,304
232,528,585
21,473,654
681,822,132
258,912,893
21,788,988
$
979,691,543
962,524,013
Adjustments to reconcile operating income to net cash provided by
operating activities:
Depreciation and amortization
Bad debt expense
Effects of changes in operating assets and liabilities:
Decrease (increase) in receivables
Increase in inventory
Increase in accounts payable
Decrease in deferred revenue
Increase (decrease) in customer deposits
Increase in environmental remediation liabilities
(Decrease) increase in due to other funds
Net cash provided by operating activities
Reconciliation of cash and cash equivalents:
Pooled cash and cash equivalents
Restricted pooled cash and cash equivalents
Restricted non-pooled cash and cash equivalents
See accompanying notes to financial statements.
13
THE HARBOR DEPARTMENT OF THE CITY OF LONG BEACH
Notes to Financial Statements
September 30, 2008 and 2007
(1)
Summary of Significant Accounting Policies
(a)
The Reporting Entity
Article XII of the City Charter of the City of Long Beach, California (the City) created the Harbor
Department of the City of Long Beach (the Department) to promote and develop the Port of Long
Beach (the Port). The Department’s operations are included in the City’s reporting entity as an
enterprise fund; its activities are conducted in the Tidelands Trust area of the City and are subject to
coastal area laws of the State of California and to the terms of the trust agreement between the City
and the State of California.
The Harbor Facilities Corporation (the Corporation), a nonprofit public benefit corporation, has been
inactive since 1995 and did not have any activity during the 2008 and 2007 fiscal years. If the
Corporation would have any transactions with financial implications, they would be included in the
Department’s financial statements.
The Department, together with the Harbor Department of the City of Los Angeles, formed a joint
venture to finance the construction of the Intermodal Container Transfer Facility (ICTF). The ICTF
venture has been recorded as an investment under the equity method of accounting in the
accompanying financial statements (see note 11).
In 1989, the cities of Los Angeles and Long Beach entered into a Joint Exercise of Powers
Agreement to create the Alameda Corridor Transportation Authority (ACTA). This agreement was
amended and restated in 1996. The purpose of ACTA was to acquire, construct, finance, and operate
the Alameda Corridor (the Project). The Project consists of a 20-mile-long rail cargo expressway
connecting the ports in San Pedro Bay to the transcontinental rail yards near downtown Los Angeles
and it began operating in April 2004. ACTA prepares its own financial statements, and its
transactions are not included as part of the Department’s financial statements.
(b)
Basis of Accounting and Measurement Focus
Disbursement of funds derived from Department’s operations is restricted to Harbor Trust
Agreement purposes. The costs of providing port services are recovered entirely through leases,
tariffs, and other charges assessed to Department’s tenants. Consistent with U.S. generally accepted
accounting principles for enterprise funds, the accounting policies of the Department conform to the
accrual basis of accounting. The measurement focus of the accompanying financial statements is on
the determination of changes in net assets and changes in financial position. Operating revenues and
expenses are generated and incurred through cargo activities performed by port tenants; operating
expenses include maintenance of facilities and infrastructure, security, and payments to other City
departments for services provided to the port. Administration and depreciation expenses are also
considered operating expenses. Other revenues and expenses not included in the above categories are
reported as nonoperating income (expense). The Department applies all applicable Governmental
Accounting Standards Board (GASB) pronouncements and all Financial Accounting Standards
Board (FASB) statements and interpretations issued on or before November 30, 1989, except for
those that conflict with or contradict GASB pronouncements.
14
(Continued)
THE HARBOR DEPARTMENT OF THE CITY OF LONG BEACH
Notes to Financial Statements
September 30, 2008 and 2007
The Department recognizes operating revenues when they are earned. Proceeds from federal or state
grants are considered as nonoperating revenues, recognized as such when reimbursable expenses are
incurred, and are identified as capital grants in the statements of revenues, expenses, and changes in
fund net assets. Operating revenues or capital grant funds that have either been billed or received but
not earned are identified as deferred credits and unearned revenue in the statements of net assets.
(c)
New Accounting Pronouncements
Effective October 1, 2007, the Department adopted Governmental Accounting Standards Board
(GASB) Statement No. 45, Accounting and Financial Reporting by Employers for Postemployment
Benefits Other Than Pensions, in accounting for its postretirement healthcare costs. The adoption of
this pronouncement, GASB 45, did not have a material effect on the Department’s financial
statements.
(d)
Pooled Cash and Cash Equivalents
In accordance with City Charter requirements, the Department pools its available cash with that of
the City. The City’s cash management pool is used essentially as a demand deposit account by the
participating City organizational units. For purposes of the statements of cash flows, the Department
defines cash and cash equivalents as pooled cash and investments, including restricted pooled cash
and investments and short-term, easily convertible to cash, nonpooled investments. Investment
decisions are made by the City Treasurer and approved by an investment committee whose
membership includes members of the Department’s management ranks.
Investment income and gains/losses arising from such pooled cash and investments are apportioned
to each participating unit based on the relationship of the unit’s average daily cash balances to the
aggregate pooled cash and investments. The Department’s share of pooled cash and investments, as
of September 30, 2008 and 2007, is stated at fair market value (see note 2).
(e)
Non-Pooled Cash and Cash Equivalents
The Department considers all highly liquid investments with an original maturity date of
three months or less to be cash and cash equivalents.
(f)
Investments
Investments are reflected at fair value using quoted market prices. Realized and unrealized gains and
losses are included in the accompanying statements of revenues, expenses and changes in net assets
as investment income, net.
(g)
Inventories
Inventories of supplies are valued at the lower of average cost or market.
(h)
Capital Assets
Capital assets are valued at historical costs. The capitalization threshold for capital assets is $5,000.
Depreciation is determined using the straight-line method with no allowance for salvage values.
When appropriate, provision for obsolescence is recognized by charging depreciation at an
15
(Continued)
THE HARBOR DEPARTMENT OF THE CITY OF LONG BEACH
Notes to Financial Statements
September 30, 2008 and 2007
accelerated rate on specific assets. The estimated economic lives used to determine annual rates of
depreciation are subject to periodic review and revision, if appropriate, to assure that the cost of the
respective assets will be written off over their economic lives. Estimated useful lives used in the
computation of depreciation of capital assets are as follows:
Structures and facilities:
Bridges and overpasses
Wharves and bulkheads
Transit sheds and buildings
State highway connections
Others
Furniture, fixtures, and equipment
(i)
50 to 75 years
40 years
20 years
10 years
5 to 50 years
2 to 30 years
Oil Operation
Oil facilities are valued at historical cost plus estimated future oil well abandonment costs. Oil field
depletion is determined using the estimated economic life of the oil field. Donated assets are valued
at their estimated fair value on the donation date.
(j)
Investments in Joint Ventures
Investments in joint power authorities are accounted for by the equity method.
(k)
Compensated Absences
The Department records all accrued employee benefits, including accumulated vacation and sick
leave, as a liability in the period when the benefits are earned. Accrued employee benefits are treated
as a current liability for financial statement presentation.
(l)
Pension Plan and Postretirement Benefits
All full-time Department’s employees are members of the State of California Public Employees’
Retirement System (CalPERS). The Department’s policy is to fund all accrued pension costs. These
costs are determined annually as of October 1 by CalPERS, and are incorporated into the payroll
burden rate reimbursable to the City’s Employee Benefits Internal Service Fund. The Department
participates in the City’s Retired Employee Health Insurance Program. This program is a single
employer defined benefit healthcare plan.
(m)
Allowance for Doubtful Accounts Receivable
The allowance for doubtful accounts is estimated at a level to absorb expected accounts receivable
losses. An Allowance for Doubtful Accounts Receivable (the Allowance) is established to reflect the
amount of the Port’s receivables that Management estimates will be uncollectible ensuring that
Port’s receivables will not be overstated for financial reporting purposes. The allowance shall be set
at the greater of: (1) one-half of one percent (0.5%) of estimated annual operating revenues or (2) the
sum of 75% of aged receivable amounts over 120 days delinquent, plus 50% of amounts over
90 days delinquent, plus 25% of amounts over 60 days delinquent, plus 10% of amounts over
30 days delinquent.
16
(Continued)
THE HARBOR DEPARTMENT OF THE CITY OF LONG BEACH
Notes to Financial Statements
September 30, 2008 and 2007
To determine uncollectibility, the Department’s Finance Division reviews all delinquent accounts
around August of each year. Amounts deemed uncollectible are proposed to be written off. The
balances of the allowance for uncollectible Accounts Receivable for the fiscal years 2008 and 2007
were $1,796,604 and $1,853,422, respectively (see note 3).
(n)
Use of Estimates
The preparation of financial statements in conformity with U.S. generally accepted accounting
principles requires management to make estimates and assumptions that affect the reported amount
of assets and liabilities and the disclosure of contingent assets and liabilities as of the date of the
financial statements. Actual results could differ from those estimates.
(o)
Reclassifications
Certain amounts reported in fiscal year 2007 have been reclassified to conform to the fiscal year
2008 presentation. Such reclassifications had no effect on the previously reported change in net
assets.
(p)
Net Assets
The Department has adopted a policy of generally utilizing restricted funds, prior to unrestricted
funds, when an expense is incurred for purposes for which both are available.
The Department’s net assets are classified into the following net asset categories:
Invested in Capital Assets, Net of Related Debt – Capital assets, net of accumulated
depreciation and outstanding principal balances of debt attributable to the acquisition,
construction, or improvement of those assets.
Restricted – Expendable – Net assets subject to externally imposed conditions or constraints
that can be fulfilled by the actions of the Department or by the passage of time. The
restrictions are externally imposed by creditors, grantors, contributors, laws or regulations of
other governments, or by law through constitutional provisions or enabling legislation.
Unrestricted – All other categories of net assets. Additionally, unrestricted net assets may be
designated for use by management of the Department or have legislative or bond indenture
requirements associated with their use. These requirements limit the area of operations for
which expenditures of net assets may be made and require that unrestricted net assets be
designated to support future operations in these areas. The future funding commitments of the
Department related to the Clean Air Action Plan are a primary example of unrestricted net
assets with designated uses (see note 12).
17
(Continued)
THE HARBOR DEPARTMENT OF THE CITY OF LONG BEACH
Notes to Financial Statements
September 30, 2008 and 2007
(2)
Pooled Cash, Cash Equivalents, and Other Investments
The Department’s cash and cash equivalents and investments as of September 30, 2008 and 2007 are
classified in the accompanying statement of net assets as follows:
Pooled cash and cash equivalents
Pooled cash and cash equivalents, restricted
2008
2007
725,689,304
232,528,585
681,822,132
258,912,893
958,217,889
940,735,025
21,473,654
32,228,105
21,788,988
32,228,368
53,701,759
54,017,356
$ 1,011,919,648
994,752,381
$
Total pooled cash and cash equivalents
Bond reserves held by fiscal agents:
Non-pooled cash and cash equivalents
Non-pooled investments
Total bond reserves held by fiscal agents
Total pooled cash and cash equivalents and bond
reserves held by fiscal agents
The majority of the Department’s cash and investments, including restricted cash and investments, are
pooled with other City funds and maintained by the City Treasurer. The City Charter requires the
Department to participate in the City Treasurer’s pool. The Department’s portion of the City’s total pooled
cash and cash equivalents amount as of September 30, 2008 and 2007 were $958,217,889 or 56.2% and
$940,735,025 or 55.8% of the City’s pooled cash and cash equivalents. The Department’s bond reserves
held by fiscal agents for the 2002, 2004, and 2005 bonds were $53,701,759 and $54,017,356 as of
September 30, 2008 and 2007, respectively. The City’s investment policy authorizes the pool to invest in
obligations issued or guaranteed by the federal government and its agencies and instrumentalities as well as
in commercial paper rated A-1 by Standard & Poor’s Corporation or P-1 by Moody’s Commercial Paper
Record, bankers’ acceptances, repurchase agreements, reverse repurchase agreements, bank certificate of
deposits, the State Treasurer’s Local Agency Investment Fund, and shares of beneficial interest (mutual
funds) issued by diversified management companies.
It is the policy of the City Treasurer to invest funds in a manner that will provide the highest investment
return with the maximum security while meeting the daily cash flow demands of the City and its
Departments and to conform to all state and local statutes governing the investment of public funds, using
the “prudent person” standard for managing the overall portfolio. The primary objective of the policy is
safety of principal, liquidity, yield, and maintaining the public trust. Individual departmental cash deposits
and investments within this pool cannot be specifically identified among the participating units. Interest
income and gains and losses earned on pooled cash and investments are allocated monthly to the various
pool participants based on their average daily cash balances.
18
(Continued)
THE HARBOR DEPARTMENT OF THE CITY OF LONG BEACH
Notes to Financial Statements
September 30, 2008 and 2007
(a)
Investments Authorized by the California Government Code and the City’s Investment Policy
The table below identifies the investment types that are authorized for the City by the City’s
investment policy. The table also identifies certain provisions of the City’s investment policy that
address interest rate risk, credit risk, and concentration of credit risk. This table does not address debt
proceeds held by bond trustee, which are governed by the provisions of debt agreements of the City,
rather than the general provision of the California Government Code or the City’s investment policy.
Maximum
maturity
Authorized investment type
Bonds issued by the City
U.S. Treasury notes, bonds, or bills
Registered state warrants or
treasury notes or bonds of the
State of California
Local agency bonds
Federal agency securities
Banker’s acceptances
Commercial paper
Negotiable certificates of deposit
Time certificates of deposit
Repurchase agreements
Reverse repurchase agreements
Securities lending program
Medium-term notes
Money market funds
Local agency investment
fund (LAIF)
Asset-backed securities
Mortgage-backed securities
5 years *
5 years *
5 years *
5 years *
5 years *
180 days
270 days
5 years *
5 years *
90 days
92 days
92 days
5 years *
N/A
N/A
5 years
5 years
Maximum
percentage of
portfolio
Maximum
investment in
one issuer
30%
None
30%
30
40
40
25
30
100
100
20
20
30
20
None
20%
20
None
None
None
None
None
30%
10
10
10
None
None
None
10%
10
$40 million per
account
None
None
* Maximum maturity of (5) years unless a longer maturity is approved by the
City Council, either specifically or as part of an investment program, at least (3) months
prior to purchase.
(b)
Investments Authorized by Debt Agreement
Investment of debt proceeds held by bond trustee is governed by provisions of the debt agreements.
19
(Continued)
THE HARBOR DEPARTMENT OF THE CITY OF LONG BEACH
Notes to Financial Statements
September 30, 2008 and 2007
(c)
Interest Rate Risk
Interest rate risk is the risk that changes in market interest rates will adversely affect the fair value of
an investment. Generally, the longer the maturity of an investment, the greater the sensitivity of its
fair value to changes in market interest rates. One of the ways that the City manages its exposure to
interest rate risk is by purchasing a combination of shorter term and longer term investments, and by
timing cash flows from maturities so that a portion of the portfolio is maturing or coming closer to
maturing evenly over time as necessary to provide cash flow and liquidity need for operations. The
following schedule indicates the interest rate risk of the City’s investments, which includes the
amount the Fund has invested with the City as of September 30 (in thousands):
2008
Investment Type
Cash and Investments in City
Pool:
Interdepartment Loan
(Health SAVERS)
$
U.S. Treasury Notes
Federal Agency Securities
Medium-term Notes
Short-term Commercial Paper
LAIF
Government Managed Rate
Account
Subtotal City Pool
Cash and Deposits
Outstanding Checks
Total City Pool
Non Performing Short-term
Investment
2007
Weighted
average
maturity
(in years)
Weighted
average
maturity
(in years)
2,892
55,817
1,289,370
84,148
—
160,849
10.60
0.41
1.96
0.99
—
0.09
69,931
—
$
3,098
145,149
1,190,784
49,881
135,874
139,156
11.60
0.90
2.28
1.83
0.02
0.01
—
—
1,663,007
1,663,942
60,313
(19,752)
32,878
(10,379)
$
1,703,568
$
3,963
20
—
$
1,686,441
$
—
—
(Continued)
THE HARBOR DEPARTMENT OF THE CITY OF LONG BEACH
Notes to Financial Statements
September 30, 2008 and 2007
The following schedule indicates the interest rate risk of the Department’s cash held by fiscal agent:
2008
Amount
2000 Bonds Reserve – First American Treasury Obligation – Held by
U.S. Bank
$
2004 Bonds Reserve – AIG Matched Funding Agreement – Held by U.S. Bank
2005 Bonds Reserve – FSA Capital Management Services – Held by
U.S. Bank
Total cash held by fiscal agent
$
2007
(d)
20,855,544
53,701,759
Amount
2000 Bonds Reserve – First American Treasury Obligation – Held by
U.S. Bank
$
2004 Bonds Reserve – AIG Matched Funding Agreement – Held by U.S. Bank
2005 Bonds Reserve – FSA Capital Management Services – Held by
U.S. Bank
Total cash held by fiscal agent
21,473,654
11,372,561
$
21,788,988
11,372,583
20,855,785
54,017,356
Investments with Fair Values Highly Sensitive to Investment Risk
The City had no investments with values that were highly sensitive to investment risk as of
September 30, 2008 and 2007. Highly sensitive investments are investments whose sensitivity to
market interest rate fluctuations are not fully addressed by use of one of the five methods for
reporting interest rate risk.
(e)
Risk and Uncertainties
The City may invest in various types of investment securities. Investment securities are exposed to
various risks, such as interest rate, market and credit risks. Due to the level of risk associated with
certain investments securities, it is at least reasonably possible that changes in the values of
investment securities will occur in the near tem and that such changes could materially affect the
amounts reported in the statements of financial position.
The City invests in securities with contractual cash flows, such as asset-backed securities and
mortgage-backed securities. The value, liquidity and related income of these securities are sensitive
to change in economic conditions, including real estate value, delinquencies or defaults, or both, and
may be adversely affected by shifts in the market’s perception of the issuers and changes in interest
rates.
21
(Continued)
THE HARBOR DEPARTMENT OF THE CITY OF LONG BEACH
Notes to Financial Statements
September 30, 2008 and 2007
(f)
Disclosures Relating to Credit Risk
Generally, credit risk is the risk that an issuer of an investment will not fulfill its obligation to the
holder of the investment. This is measured by the assignment of a rating by a nationally recognized
statistical rating organization. Presented on the following page is the minimum rating required by the
California Government Code, the City’s investment policy, and the actual rating as of year-end for
each investment type (in thousands):
Rating as of year-end 2008
City’s Pooled
Investments
Investment Type
Cash and Investments
In City Pool:
Interdepartment Loan
(Health SAVRS)
U.S. Treasury Notes
Federal Agency
Securities
Medium-term Notes
LAIF
Government Managed
Rate Account
Minimum
legal
rating
Not
required to
be rated
N/A
N/A
$
2,892
55,817
—
—
—
—
N/A
A
N/A
1,289,370
84,148
160,849
—
—
160,849
—
—
—
—
—
—
N/A
69,931
69,931
—
—
1,663,007
289,489
—
—
60,313
(19,752)
—
—
—
—
—
—
1,703,568
289,489
—
—
—
—
—
Cash and Deposits
Outstanding Checks
Total City
Pool
City’s Pooled
Investments
Investment Type
Interdepartment Loan
(Health SAVRS)
U.S. Treasury notes
Federal Agency Securities
Medium-term Notes
Short-term Commercial
Paper
LAIF
Subtotal City
Pool
Cash and Deposits
Outstanding Checks
Total City
Pool
A-1
2,892
55,817
Subtotal
City Pool
Non Performing Short-term
Investment
A-1+
$
N/A
$
3,963
N/A
N/A
$
—
—
1,289,370
84,148
—
—
1,373,518
—
—
1,373,518
—
Rating as of year-end 2007
Not
required to
be rated
A-1+
A-1
AAA
Minimum
legal
rating
N/A
N/A
N/A
A
AAA
AA-
Unrated
—
—
—
—
—
—
—
—
—
—
—
—
—
—
—
—
60,313
(19,752)
—
40,561
—
3,963
AA-
Unrated
3,098
145,149
1,190,784
49,881
3,098
145,149
—
—
—
—
—
—
—
—
—
—
—
—
1,190,784
44,861
—
—
—
5,020
—
—
—
135,874
139,156
—
139,156
54,350
—
81,524
—
—
—
—
—
—
—
1,663,942
287,403
54,350
81,524
1,235,645
5,020
—
32,878
(10,379)
—
—
—
—
—
—
—
—
—
—
32,878
(10,379)
$ 1,686,441
287,403
54,350
81,524
1,235,645
5,020
22,499
22
(Continued)
THE HARBOR DEPARTMENT OF THE CITY OF LONG BEACH
Notes to Financial Statements
September 30, 2008 and 2007
(g)
Concentration of Credit Risk
The investment policy of the City contains no limitations on the amount that can be invested in any
one issuer beyond that stipulated by the California Government Code. Investments in any one issuer
that represents 5% or more of the City’s total pooled investments are as follows (in thousands):
Issuer
Federal Farm Credit Bank
Federal Home Loan Bank
Federal Home Loan
Mortgage Association
Federal National
Mortgage Association
U.S. Treasury
Commercial paper
LAIF
(h)
Reported amount
2008
2007
Investment type
Federal agency securities
Federal agency securities
$
93,000
477,696
89,334
354,763
Federal agency securities
359,571
307,865
Federal agency securities
U.S. Treasury notes and
bonds
Unsecured corporate debt
State pool investment
359,103
438,822
55,817
—
160,849
145,149
135,874
139,156
Custodial Credit Risk
Custodial credit risk for deposits is the risk that, in the event of failure of a depository financial
institution, a government will not be able to recover its deposits or will not be able to recover
collateral securities that are in the possession of an outside party. The custodial credit risk for
investments is the risk that, in the event of the failure of the counterparty (e.g., broker/dealer) to a
transaction, a government will not be able to recover the value of its investment or collateral
securities that are in the possession of another party. The California Government Code and the City’s
investment policy do not contain legal or policy requirements that would limit the exposure to
custodial credit risk for deposits or investments, other than the following provision for deposits. The
California Government Code requires that a financial institution secure deposits made by state or
local government units by pledging securities in an undivided collateral pool held by a depository
regulated under the state law (unless so waived by the governmental unit). The market value of the
pledged securities in the collateral pool must equal at least 110% of the total amount deposited by the
public agencies. California law also allows financial institutions to secure the City’s deposits by
pledging first trust deed mortgage notes having a value of 150% of the secured public deposits.
All securities owned by the City are deposited in trust for safekeeping with a custodial bank different
from the City’s primary bank except for one City-issued bond and investment in the State’s LAIF.
As of September 30, 2008, the City reported deposits of $60,313,000 less $19,752,000 for checks
outstanding. As of September 30, 2007, the City’s deposits were $32,878,000 less $10,379,000 for
checks outstanding.
23
(Continued)
THE HARBOR DEPARTMENT OF THE CITY OF LONG BEACH
Notes to Financial Statements
September 30, 2008 and 2007
(i)
Investment in State Investment Pool
The City is a voluntary participant in the LAIF that is regulated by California Government Code
Section 16429 under the oversight of the treasurer of the State of California. The fair value of the
City’s investment in this pool is reported in the City’s financial statements at amounts based upon
the City’s pro rata share of the fair value provided by LAIF for the entire LAIF portfolio (in relation
to the amortized cost of that portfolio). The balance available for withdrawal is based on the
accounting records maintained by LAIF, which are recorded on an amortized-cost basis. Included in
LAIF’s investment portfolio are mortgage-backed securities, loans to certain state funds, securities
with interest rates that vary according to changes in rates greater than an one-for-one basis, and
structured basis.
(j)
Reverse Repurchase Agreements
There were no transactions involving reverse repurchase agreements during the fiscal years ended
September 30, 2008 and 2007.
(k)
GASB Statement No. 31
GASB Statement No. 31, Certain Investments and External Investment – Pools, requires that certain
investments and external investment pools be reported at fair value. At September 30, 2008 and
2007, the effect of reporting the City’s investments at fair value did not have a material impact on the
City’s and agency’s financial position.
(l)
Securities Lending
The City did not engage in any securities lending programs for the fiscal years ended September 30,
2008 and 2007. Accordingly, in accordance with GASB Statement No. 28, Accounting and Financial
Reporting for Securities Lending Transactions, no assets or liabilities have been recorded in the
accompanying financial statements. However, from time to time, the City engages in limited
securities lending activities. These activities are governed by formal agreement with the City’s
contract bank. This agreement limits the nature and amount of the transactions and provides for full
collateralization of each transaction.
(3)
Accounts Receivable and Other Receivables
Accounts receivable as of September 30 included the following:
2008
Trade accounts receivable
Less allowance for doubtful accounts
$
Oil operations receivable
Intermodal Container Transfer Facility distribution
Pier A West receivable
Accounts receivable, net
$
24
2007
46,271,949
(1,796,604)
40,289,588
(1,853,422)
44,475,345
38,436,166
—
—
5,615,510
4,492,000
4,000,000
—
50,090,855
46,928,166
(Continued)
THE HARBOR DEPARTMENT OF THE CITY OF LONG BEACH
Notes to Financial Statements
September 30, 2008 and 2007
The Pier A West receivable relates to the portion of environmental remediation expenses to be reimbursed
in accordance to the agreement with Anadarko Petroleum Co. (see note 12(f)).
Other receivables as of September 30 included the following:
2008
Due from other governmental agencies:
Current:
Federal grant – Department of Homeland Security
Reimbursements due from Caltrans
State of California
$
Nonperforming investments – Lehman Brothers
Total current
Long term:
Redevelopment Agency – Convention Center
Total due from other governmental agencies
$
2007
1,429,165
311,831
526,634
5,876,433
54,104
2,267,630
5,930,537
2,228,927
—
4,496,557
5,930,537
27,435,000
27,435,000
31,931,557
33,365,537
The receivable related to nonperforming investments – Lehman Brothers pertain to the portion of the value
of the commercial paper investment held with Lehman Brothers that management considers as recoverable
from assets liquidated by Lehman Brothers as it goes through bankruptcy proceedings.
Redevelopment Agency – Convention Center
In 1993, the Department advanced $30,000,000 to the Long Beach Redevelopment Agency (the Agency)
to fund construction costs related to the Long Beach Convention Center expansion project. Such advance
was part of an amended agreement with the Agency to fund $90,000,000 of the Long Beach Convention
Center project and was to be repaid from revenue sources arising from future City transient occupancy tax
revenues, payable in equal amounts over 17 years beginning October 1, 1997.
In August 1995, the Board of Harbor Commissioners amended this agreement and agreed to subordinate
the repayment of the entire receivable to a contingent City obligation related to a bond issuance to fund the
construction of the Aquarium of the Pacific (the Aquarium), a not-for-profit facility in the Queensway Bay
area of the City. Provided the anticipated future revenue sources from the Aquarium would not cover their
bond debt service requirements, the Agency agreed to fund the remaining debt service with transient
occupancy tax revenues. A subsequent amendment deferred the initial repayment to the first quarter of
fiscal year 1999, with the balance of the advance to be repaid in quarterly installments over 16 years.
In a more recent development, the City and the Department amended the agreement to provide for a
two-year deferral of the payments scheduled for fiscal years 2000 and 2001. As of September 30, 2001, the
Agency had an unpaid liability to the Department of $27,435,000. Under that agreement, $1,765,000 was
payable during the 2002 fiscal year and was considered a current asset for financial statement purposes.
Since 2004, the Agency has not had sufficient funds in excess of the Aquarium debt annual debt service
25
(Continued)
THE HARBOR DEPARTMENT OF THE CITY OF LONG BEACH
Notes to Financial Statements
September 30, 2008 and 2007
and has not made any of the agreed-upon payments. Since the Department does not expect to receive any
payment during the upcoming 12 months, it will maintain the entire debt, $27,435,000, as a long-term
receivable.
(4)
Alameda Corridor Right-of-Way Purchase
In December 1994, the Department and the Harbor Department of the City of Los Angeles (collectively,
the Ports) executed the purchase of the rights-of-way needed for the development of the Alameda Corridor
Project (the Project), which is a comprehensive transportation corridor between the Ports and the central
Los Angeles area. The Ports purchased these rights, sharing the cost on a 50/50 basis, from the three
railroad companies then serving the Ports: Union Pacific Railroad Company, Southern Pacific Railroad
Company, and Atchison, Topeka and Santa Fe Railroad Companies. After the purchase, Southern Pacific
merged into Union Pacific and Atchison, Topeka, and Santa Fe merged with Burlington Northern to form
the Burlington Northern Santa Fe.
The total purchase comprised the right-of-way property from the three former railroad companies and a
drill track from Southern Pacific to provide an additional right-of-way to access local businesses along the
Project. As of September 30, 2008 and 2007, total costs to the Department related to the rights-of-way
purchase amounted to $207,823,264.
Construction of the Project began in 1997 and it was completed in April 2002. Funding for the Project
came from federal, state, and local sources, and from issuance of debt (see note 12). Some of the benefits
derived from the Project are the consolidation of the railroad services onto a single set of rail lines, the
improvement of the rail transportation conditions around the Ports, the securing of efficient and
competitive service to and from the Ports, and the increase in public safety along the route on which
Port-related traffic occurs. These benefits will extend to other governmental entities by allowing them to
utilize the right of way.
Repayment to the Ports for their investments in the right-of-way and for any advances provided to the
Project will occur after the Project has generated revenues sufficient to retire all debt and to fund
maintenance reserve (see note 12).
26
(Continued)
THE HARBOR DEPARTMENT OF THE CITY OF LONG BEACH
Notes to Financial Statements
September 30, 2008 and 2007
(5)
Capital Assets
Capital Assets Rollforward Schedule
Balance,
October 1,
2007
Additions
Disposals
Description
Nondepreciable capital assets:
Purchased land
Constructed land
Construction in progress
Rights-of-way (note 4)
Transfers
Balance,
September 30,
2008
439,913,481
410,790,540
225,836,752
207,823,264
—
—
76,778,067
—
—
—
—
—
—
8,109,686
(138,079,164)
—
439,913,481
418,900,226
164,535,655
207,823,264
1,284,364,037
76,778,067
—
(129,969,478)
1,231,172,626
1,818,157,460
6,597
(4)
129,811,858
1,947,975,911
16,683,825
1,036,417
(378,526)
157,620
17,499,336
1,834,841,285
1,043,014
(378,530)
129,969,478
1,965,475,247
Total capital assets $ 3,119,205,322
77,821,081
(378,530)
—
3,196,647,873
$
Subtotal
Depreciable capital assets:
Structures and facilities
Furniture, fixtures and
equipment
Subtotal
Balance,
October 1,
2006
Additions
Disposals
Transfers
Balance,
September 30,
2007
439,812,839
409,090,992
145,554,036
207,823,264
—
1,839,835
164,240,704
—
—
(140,287)
(40,503,519)
—
100,642
—
(43,454,469)
—
439,913,481
410,790,540
225,836,752
207,823,264
1,202,281,131
166,080,539
(40,643,806)
(43,353,827)
1,284,364,037
1,782,556,550
5,557,031
(12,636,957)
42,680,836
1,818,157,460
15,439,437
577,334
(5,937)
672,991
16,683,825
1,797,995,987
6,134,365
(12,642,894)
43,353,827
1,834,841,285
Total capital assets $ 3,000,277,118
172,214,904
(53,286,700)
—
3,119,205,322
Description
Nondepreciable capital assets:
Purchased land
Constructed land
Construction in progress
Rights-of-way (note 4)
Subtotal
Depreciable capital assets:
Structures and facilities
Furniture, fixtures, and
equipment
Subtotal
$
27
(Continued)
THE HARBOR DEPARTMENT OF THE CITY OF LONG BEACH
Notes to Financial Statements
September 30, 2008 and 2007
Description
Accumulated Depreciation Rollforward Schedule
Balance,
October 1,
Disposals/
2007
Additions
Transfers
Structures and facilities
Furniture, fixtures and equipment
Total accumulated
depreciation
$
861,237,212
12,676,431
78,558,860
998,524
(60,436)
(378,526)
939,735,636
13,296,429
$
873,913,643
79,557,384
(438,962)
953,032,065
Balance,
October 1,
2006
$
$
Description
Structures and facilities
Furniture, fixtures and equipment
Total accumulated
depreciation
(6)
Balance,
September 30,
2008
Additions
Disposals/
Transfers
Balance,
September 30,
2007
796,972,586
11,873,102
76,529,713
803,329
(12,265,087)
—
861,237,212
12,676,431
808,845,688
77,333,042
(12,265,087)
873,913,643
Commercial Paper Notes
In 1994, the Board of Harbor Commissioners authorized the issuance of up to $383,500,000 in commercial
paper notes and the Department issued $148,000,000 of Series A notes to pay for acquisition costs of
property, facilities, and oil rights in the North Harbor District. The notes are designated as follows:
Series A – Subject to Internal Revenue Service Code Alternative Minimum Tax (AMT)
Series B – Not subject to AMT
Series C – Taxable
28
(Continued)
THE HARBOR DEPARTMENT OF THE CITY OF LONG BEACH
Notes to Financial Statements
September 30, 2008 and 2007
The Department’s gross revenues secure the notes. The obligation to pay the principal portion of
outstanding notes is further supported by a revolving line of credit, which is currently $175,000,000. The
notes are in bearer form, in denominations of $100,000 with integral multiples of $50,000 in excess
thereof, and will mature not more than 270 days after date of issuance. Management may consider paying
the commercial paper and related interest obligations and satisfy this obligation within the 2009 fiscal year.
The remaining principal balance and accrued interest outstanding at September 30, 2008 were $60,150,000
and $185,725, respectively, and were classified as current liabilities. If paid in full or in part, the
Department intends to leave open the option to reissue any amount of the commercial paper. The principal
balance and accrued interest outstanding at September 30, 2007 was $60,150,000 and $282,852,
respectively, and were classified as current liabilities.
Commercial Paper – Principal Only – Rollforward Schedule
Balance,
October 1,
Description
2007
Additions
Reductions
Series A: maturity dates
11/05/08 – 11/06/08; range of
interest rates: 1.23% – 3.69% $
Description
Series A: maturity dates
11/05/07 – 8/06/08; range of
interest rates: 3.48% – 3.74% $
(7)
60,150,000
—
Balance,
October 1,
2006
Additions
60,150,000
—
—
Reductions
—
Balance,
September 30,
2008
60,150,000
Balance,
September 30,
2007
60,150,000
Notes Payable
Notes payable relate to purchase and sale agreements of real estate property. The $41,333 balance as of
September 30, 2007 was unsecured, and paid in full during fiscal year 2008. Accordingly, there was no
outstanding notes payable balance at the end of fiscal year 2008.
Property acquired
W. 9th street, 14 years, 6%
Notes Payable Rollforward Schedule
Balance,
October 1,
2007
Additions
Reductions
$
Property acquired
W. 9th street, 14 years, 6%
$
41,333
—
(41,333)
Balance,
October 1,
2006
Additions
Reductions
82,667
—
(41,334)
29
Balance,
September 30,
2008
—
Balance,
September 30,
2007
41,333
(Continued)
THE HARBOR DEPARTMENT OF THE CITY OF LONG BEACH
Notes to Financial Statements
September 30, 2008 and 2007
(8)
Bonded Indebtedness
Outstanding bonded indebtedness as of September 30 was as follows:
1998 Harbor Revenue Refunding Bonds:
Maturing 2009 through 2019 at 5.5% to 6.0% interest
Plus unamortized premium
Total 1998 Harbor Revenue Refunding Bonds
2000A Harbor Revenue Bonds :
Maturing 2009 through 2025 at 5.5% to 5.75% interest
Plus unamortized premium
Total 2000A Harbor Revenue Bonds
2002A Harbor Revenue Bonds (Variable rate portion):
Bonds were redeemed during fiscal year 2008
Plus unamortized premium
Total 2002A Harbor Revenue Bonds
2002B Harbor Revenue Bonds (Fixed rate portion):
Maturing 2009 through 2027 at 5.0% to 5.5% interest
Plus unamortized premium
Total 2002B Harbor Revenue Bonds
2004A & B Harbor Revenue Refunding Bonds:
Maturing 2009 through 2018 at 4.0% to 5.0% interest
Plus unamortized premium
Total 2006A & B Harbor Revenue Refunding
Bonds
2005A & B Harbor Revenue Refunding Bonds:
Maturing 2009 through 2025 at 5.0% interest
Plus unamortized premium
Total 2005A & B Harbor Revenue Refunding
Bonds
Summary:
Principal
Net premium
Less current portion
Net long term bonded indebtedness
30
2008
2007
$
138,755,000
1,726,511
147,535,000
1,889,007
$
140,481,511
149,424,007
$
232,320,000
1,458,608
240,415,000
1,546,344
$
233,778,608
241,961,344
$
—
—
133,820,000
2,299,228
$
—
136,119,228
$
129,355,000
5,780,043
133,295,000
6,090,381
$
135,135,043
139,385,381
$
88,080,000
3,748,890
94,900,000
4,138,384
$
91,828,890
99,038,384
$
234,840,000
6,339,479
243,515,000
6,720,802
$
241,179,479
250,235,802
$
823,350,000
19,053,531
(38,145,000)
993,480,000
22,684,146
(40,170,000)
$
804,258,531
975,994,146
(Continued)
THE HARBOR DEPARTMENT OF THE CITY OF LONG BEACH
Notes to Financial Statements
September 30, 2008 and 2007
Description
1998
2000 A
2002 A
2002 B
2004 A & B
2005 A & B
Description
1998
2000 A
2002 A
2002 B
2004 A & B
2005 A & B
Harbor Revenue Bonds Payable Rollforward Schedule
Balance,
Balance,
October 1,
September 30,
2007
Additions
Reductions
2008
Amounts due
within one year
$
147,535,000
240,415,000
133,820,000
133,295,000
94,900,000
243,515,000
—
—
—
—
—
—
8,780,000
8,095,000
133,820,000
3,940,000
6,820,000
8,675,000
138,755,000
232,320,000
—
129,355,000
88,080,000
234,840,000
9,270,000
8,540,000
—
4,135,000
7,095,000
9,105,000
$
993,480,000
—
170,130,000
823,350,000
38,145,000
Harbor Revenue Bonds Payable Rollforward Schedule
Balance,
Balance,
October 1,
September 30,
2006
Additions
Reductions
2007
$
Amounts due
within one year
155,865,000
248,085,000
137,480,000
137,085,000
101,525,000
251,775,000
—
—
—
—
—
—
8,330,000
7,670,000
3,660,000
3,790,000
6,625,000
8,260,000
147,535,000
240,415,000
133,820,000
133,295,000
94,900,000
243,515,000
8,780,000
8,095,000
3,860,000
3,940,000
6,820,000
8,675,000
$ 1,031,815,000
—
38,335,000
993,480,000
40,170,000
Aggregate debt service requirements on bonded indebtedness to maturity are summarized as follows:
Year(s) ending September 30:
2009
2010
2011
2012
2013
2014 – 2018
2019 – 2023
2024 – 2027
Principal
Interest
Total
$
38,145,000
40,120,000
42,225,000
44,515,000
46,940,000
276,010,000
218,950,000
116,445,000
43,847,791
41,876,091
39,763,691
37,465,654
35,042,179
133,877,995
63,660,087
11,296,203
81,992,791
81,996,091
81,988,691
81,980,654
81,982,179
409,887,995
282,610,087
127,741,203
$
823,350,000
406,829,691
1,230,179,691
Details of each outstanding debt issue are as follows:
(a)
1998 Harbor Revenue Refunding Bonds
The City of Long Beach Harbor Revenue Refunding Bonds Series 1998A (the 1998 Bonds) are
secured by the Department’s gross revenues. The 1998 Bonds, dated February 1, 1998, amounting to
$206,330,000 were issued to current refund all of the City’s Harbor Revenue Bonds Series 1989A
31
(Continued)
THE HARBOR DEPARTMENT OF THE CITY OF LONG BEACH
Notes to Financial Statements
September 30, 2008 and 2007
(the 1989 Bonds). The 1989 Bonds were defeased and the liability for those bonds was removed
from the Department’s statements of net assets. No amounts remain outstanding as of September 30,
2008. Serial bonds aggregating to $138,755,000 are outstanding and will mature on May 15 of each
year from 2009 to 2019 in amounts ranging from $9,270,000 to $16,600,000 with interest payable
semiannually on May 15 and November 15 at coupon rates of 5.5% to 6.0%. The 1998 Bonds are not
subject to optional or mandatory redemption before their respective maturity dates.
Funds have been allocated at September 30, 2008 to the respective accounts in conformity with the
bond resolution as follows:
2008
Service account (amount reserved to meet current
debt service requirements)
Reserve account (amount reserved for maximum annual
debt service requirements)
$
$
2007
6,598,238
6,595,575
17,596,976
17,596,976
24,195,214
24,192,551
The current refunding resulted in a difference between the reacquisition price and net carrying
amount on the old debt of $8,569,501. This difference, reported in the accompanying financial
statements as a deduction from bonds payable, is amortized using the straight-line method over the
life of the new bonds.
(b)
2000A Harbor Revenue Bonds
The City of Long Beach Harbor Revenue Bonds Series 2000A (the 2000A Bonds) are secured by the
Department’s gross revenues. The 2000A Bonds, dated November 1, 2000, amounting to
$275,000,000 were issued to finance certain capital improvements at the Port, to fund capitalized
interest on a portion of the debt issuance, to fund a repayment reserve, and to finance the costs of
issuance.
Serial bonds aggregating to $232,320,000 will mature on May 15 of each year from 2009 to 2025 in
amounts ranging from $8,540,000 to $20,180.000 with interest payable semiannually on May 15 and
November 15 at coupon rates ranging from 5.25% to 5.75%. The 2000A Bonds maturing on or
before May 15, 2010 will not be subject to call and redemption before maturity. Serial bonds
maturing on or after May 15, 2011 are subject to call and redemption, prior to maturity, at the option
of the Board of Harbor Commissioners, as a whole or in part on any date, on or after May 15, 2010
at premiums of 1.0%, from May 15, 2010 through May 14, 2011; at 0.5% from May 15, 2011 to
May 14, 2012; and at par from May 15, 2012 and thereafter.
32
(Continued)
THE HARBOR DEPARTMENT OF THE CITY OF LONG BEACH
Notes to Financial Statements
September 30, 2008 and 2007
Funds have been allocated at September 30, to the respective accounts in conformity with the bond
resolution as follows:
2008
Service account (amount reserved to meet current
debt service requirements)
Reserve account (amount reserved for maximum annual
debt service requirements)
$
$
(c)
2007
7,984,868
7,984,952
21,473,654
21,788,988
29,458,522
29,773,940
2002A Harbor Revenue Bonds
The City of Long Beach Harbor Revenue Bonds Series 2002A (the 2002A Bonds) were fully
refunded during fiscal year 2008. All the reserve and deferred costs or revenues related to this issue
were written off as well. There are no balances remaining at the end of the fiscal year.
(d)
2002B Harbor Revenue Bonds
The City of Long Beach Harbor Revenue Bonds Series 2002B (the 2002B Bonds) are secured by the
Department’s gross revenues. The 2002B Bonds were remarketed in the principal amount of
$144,240,000 and are dated June 26, 2002, the date of delivery of the original bonds.
Serial bonds aggregating to $90,910,000 will mature on May 15 of each year from 2009 to 2023 in
amounts ranging from $4,135,000 to $8,460,000 with interest payable semiannually on May 15 and
November 15 at coupon rates ranging from 5.00% to 5.50%. Bonds maturing on or before May 15,
2014 are not subject to call and redemption prior to maturity; bonds maturing on or after May 2015
will be subject to call and redemption prior to maturity, at the option of the Board, as a whole or in
part on any date, on or after May 15, 2014, at a redemption price equal to the principal amount of the
Series 2002B Bonds to be redeemed, plus accrued interest thereon to the date fixed for redemption,
without premium.
Term bonds of $38,445,000 will mature on May 15, 2027. The term bonds have an interest rate of
5.2%. Term bonds will be subject to call and redemption prior to maturity and redeemed at a
redemption price equal to the par amount thereof from Mandatory Sinking Account Payments in
amounts from $8,895,000 to $10,335,000, from 2024 to 2027, respectively, for the term bonds
scheduled to mature on May 15, 2027.
Funds have been allocated at September 30 in conformity with the bond resolution as follows:
2008
Service account (amount reserved for maximum annual
debt service requirements)
33
$
4,084,335
2007
4,085,085
(Continued)
THE HARBOR DEPARTMENT OF THE CITY OF LONG BEACH
Notes to Financial Statements
September 30, 2008 and 2007
(e)
2004 Harbor Revenue Refunding Bonds
The City of Long Beach Harbor Revenue Refunding Bonds Series 2004A & B (the 2004 Bonds) are
secured by the Department’s gross revenues. The 2004 Bonds, dated March 10, 2004, amounting to
$113,410,000 were issued to current refund and to defease all of the City’s Harbor Revenue Bonds
Series 1993, to pay the premium for the Bond Insurance Policy, to fund the Series 2004 Reserve
Fund, and to finance the costs of issuance of the Series 2004 Bonds. The 1993 Bonds are defeased
and the liability for those bonds has been removed from the Department’s statements of net assets.
No amounts remain outstanding as of September 30, 2008.
Serial bonds aggregating to $88,080,000 are outstanding and will mature on May 15 of each year
from 2009 to 2018 in amounts ranging from $7,095,000 to $10,825,000 with interest payable
semiannually on May 15 and November 15 at coupon rates ranging from 4.0% to 5.0%. The
Series 2004 Bonds maturing on or before May 15, 2014 are not subject to call and redemption prior
to maturity.
The Series 2004 Bonds maturing on or after May 15, 2015 will be subject to call and redemption
prior to maturity, at the option of the Board, as a whole or in part on any date, on or after May 15,
2014, at a redemption price equal to the principal amount of the Series 2004 Bonds to be redeemed,
plus accrued interest thereon to the date fixed for redemption, without premium.
Funds have been allocated at September 30 to the respective accounts in conformity with the bond
resolution as follows:
2008
Service account (amount reserved to meet current
debt service requirements)
Reserve account (amount reserved for maximum annual
debt service requirements)
$
$
2007
4,262,231
4,261,406
11,372,561
11,372,583
15,634,792
15,633,989
The current refunding resulted in a difference between the reacquisition price and net carrying
amount on the old debt of $1,445,775. This difference, reported in the accompanying financial
statements as a deduction from bonds payable, is amortized using the straight-line method over the
life of the new bonds.
(f)
2005 Harbor Revenue Refunding Bonds
The City of Long Beach Harbor Revenue Refunding Bonds Series 2005A & B (the 2005 Bonds) are
secured by the Department’s gross revenues. The 2005 Bonds, dated March 23, 2005, amounting to
$257,975,000 were issued to current refund and to defease all of the City’s Harbor Revenue Bonds
Series 1995, to pay the premium for the Bond Insurance Policies, to fund a repayment reserve for the
Series 2005 Bonds, and to finance the costs of issuance of the Series 2005 Bonds.
34
(Continued)
THE HARBOR DEPARTMENT OF THE CITY OF LONG BEACH
Notes to Financial Statements
September 30, 2008 and 2007
The 1995 Bonds are defeased and the liability for those bonds was removed from the Department’s
statements of net assets. No amounts remain outstanding as of September 30, 2008. Serial bonds
aggregating to $209,870,000 are outstanding and will mature on May 15 of each year from 2009 to
2025 in amounts ranging from $9,105,000 to $19,785,000 with interest payable semiannually on
May 15 and November 15 at coupon rates of 5%. Serial bonds aggregating to $24,970,000 are
outstanding and will mature on May 15 of 2017 and 2018 with amounts due of $13,430,000 to
$11,540,000, respectively; with interest payable semiannually on May 15 and November 15 at 5.0%
coupon rate.
The Series 2005 Bonds maturing on or before May 15, 2015 are not subject to call and redemption
prior to maturity. The Series 2005 Bonds maturing on or after May 15, 2016 are subject to call and
redemption prior to maturity, at the option of the Board, as a whole or in part on any date, on or after
May 15, 2015, at a redemption price equal to 100% of the principal amount of the Series 2005 Bonds
to be redeemed, plus accrued interest thereon to the date fixed for redemption, without premium.
Funds have been allocated at September 30 to the respective accounts in conformity with the bond
resolution as follows:
2008
Service account (amount reserved to meet current
debt service requirements)
Reserve account (amount reserved for maximum annual
debt service requirements)
$
$
2007
7,817,625
7,819,031
20,855,544
20,855,785
28,673,169
28,674,816
The current refunding resulted in a difference between the reacquisition price and net carrying
amount on the old debt of $4,214,084. This difference, reported in the accompanying financial
statements as a deduction from bonds payable, is amortized using the straight-line method over the
life of the new bonds.
(g)
Debt Covenants
The Department’s management believes that it has complied with all the covenants related to the
outstanding debt as of September 30, 2008 and 2007.
(9)
Retirement Programs
(a)
Pension Plan
The Department participates on a cost-sharing basis with the City in the California Public
Employees’ Retirement System (CalPERS), a defined benefit, agent multiple-employer pension
system that acts as a common investment and administrative agent for entities in California. The
system also provides death and disability benefits.
The Department is billed by the City for its share of pension costs based upon rates established by
CalPERS for the City’s general employees. CalPERS does not calculate a separate pension
35
(Continued)
THE HARBOR DEPARTMENT OF THE CITY OF LONG BEACH
Notes to Financial Statements
September 30, 2008 and 2007
obligation for the Department; therefore, no separate Department obligation can be presented herein.
The Department paid $4,213,160, $3,855,758, and $3,459,949 to the City, which was equal to its
annual required contribution for fiscal years 2008, 2007 and 2006, respectively.
As employees of the City, the Department’s full-time employees are eligible to participate in
CalPERS, becoming vested in the system after five years of service. Upon vesting, employees on
tier 1 (those hired on or before October 20, 1989) and who retire at age 55 are entitled to receive an
annual retirement benefit, payable for life, in an amount not to exceed 2.7% (with up to a 5.0%
annual Cost of Living Adjustment (COLA) increase) of their average salary during the highest paid
year of employment for each year of credited service. On September 2006, the basis to compute the
retirement benefits was unified under tier 1 with the exception of the Cost of Living Adjustment:
employees on tier 2 (those hired after October 20, 1989) who retire at age 55 are entitled to receive
an annual retirement benefit, payable for life, in an amount not to exceed 2.7% (with up to a 2.0%
annual COLA increase) of their average salary computed considering the three highest paid years of
employment for each year of credited service.
Further information regarding the City’s participation in CalPERS may be found in the City’s
Comprehensive Annual Financial Report for the year ended September 30, 2008.
(b)
Postretirement Health Care Benefits
Plan Description
The Department participates in the City’s Retired Employees Health Insurance Program. This
program is a single-employer defined benefit healthcare plan.
Under the provisions of the City’s Personnel Ordinance, upon retirement, the City allows retirees,
their spouses and eligible dependents to use the cash value at retirement of the retiring employee’s
accumulated unused sick leave to pay for health, dental and long-term care insurance premiums.
Full-time City employees are entitled to receive up to 96 hours of sick leave per year. Unused sick
leave may be accumulated until termination or retirement. No sick leave benefits are vested. The
City has provided two one-time early retirement incentive programs. The first had a maximum value
of $25,000 for employees, based on age, who retired during calendar year 1996 and the second
incentive offered a 16 hour increase in sick leave per year of service to management employees who
retired by June 30, 2004. In all cases, once the cash value of the retired employee’s unused sick leave
is exhausted, the retiree can terminate coverage or elect to continue paying the premiums at the
retiree’s expense.
At September 30, 2008, there were 635 participants in the City’s Retired Employees Health
Insurance Program, and the non-interest bearing cash value equivalent of the remaining unused sick
leave for the current retires totaled $16,369,000. Total premiums and actual claims paid by the City
under the Retired Employees Health Insurance Program for the fiscal year ended September 30, 2008
were $6,212,000, and are included in the expenses of the Employee Benefits Internal Service Fund.
The City has recorded a liability in the Employee Benefits Internal Service Fund of $72,751,000,
based on an actuarial study of current and future retiree accumulated sick leave as of September 30,
2005 and updated as of September 30, 2007.
36
(Continued)
THE HARBOR DEPARTMENT OF THE CITY OF LONG BEACH
Notes to Financial Statements
September 30, 2008 and 2007
While the City does not directly contribute any funding towards the cost of premiums for retirees, the
ability to obtain coverage at an active employees rate constitutes a significant economic benefit to
the retirees. The inclusion of the retirees in the City’s healthcare benefit plans increases overall
health plan rates. The economic benefit is defined as an “implicit subsidy” under Government
Accounting Standards Board Statement No. 45 (GASB 45). The purpose of this valuation was to
determine the amount of the subsidy.
The ability to participate in the City’s plan by self-paying the premiums extends for the lifetime of
the retiree. However, upon attaining the age of Medicare eligibility the retiree may enter a plan
coordinated by Medicare. Standard actuarial practice assumes that Medicare supplemental plans do
not generally give rise to an implicit subsidy, and while we have included Medicare eligible retirees
in this valuation, their liability under GASB 45 and their implicit subsidy are both zero.
This plan does not issue a separate financial report.
Funding Policy
The contribution requirement of plan members and the City are established and may be amended by
the City. The required contribution is based on projected pay-as-you-go financing requirements, with
an additional amount to prefund benefits as determined annually by the City Council. As of
September 30, 2008, the City has not contributed to the plan.
Annual OPEB Cost and Net OPEB Obligation
The City’s annual other postemployment benefit (OPEB) cost (expense) is calculated based on the
annual required contribution of the employer (ARC), an amount that is actuarially determined in
accordance with the requirements of GASB 45. The ARC represents the level of funding that, if paid
on an ongoing basis, is projected to cover normal cost each year and amortize any unfunded actuarial
liabilities (or funding excess) over a period not to exceed 30 years. The following table shows the
components of the City’s annual OPEB cost for the year, the amount actually contributed to the plan,
and changes in the City’s net OPEB obligation (in thousands):
Annual required contribution
Interest on net OPEB obligation
Adjustment to annual required contribution
$
Annual OPEB cost (expense)
8,102
—
—
8,102
Contribution made
(2,853)
Increase in net OPEB obligation
5,249
Net OPEB obligation – beginning of year
—
Net OPEB obligation – end of year
$
37
5,249
(Continued)
THE HARBOR DEPARTMENT OF THE CITY OF LONG BEACH
Notes to Financial Statements
September 30, 2008 and 2007
The ARC was determined as part of the January 2006 actuarial valuation. For the year ended
September 30, 2008, the City’s annual OPEB cost, the percentage of annual OPEB cost contributed
to the plan, and the net OPEB obligation were as follows (in thousands):
Annual OPEB
cost
Fiscal year ended:
September 30, 2008
$
8,102
% of annual
OPEB cost
contributed
Net OPEB
obligation
35.2% $
5,249
The OPEB liability is not recorded in the Department’s financial statements.
Funded Status and Funding Progress
The funded status of the plan as of September 30, 2008 was as follows (in thousands):
Actuarial accrued liability (AAL)
Actuarial value of plan assets
Unfunded actuarial accrued liability (UAAL)
Funded ratio (actuarial value of plan assets/AAL)
Covered payroll
UAAL as a percentage of covered payroll
ARC as a percentage of covered payroll
$
86,868
—
$
86,868
$
—%
284,484
30.5%
2.8
Actuarial valuations of an ongoing plan involve estimates of the value of reported amounts and
assumptions about the probability of occurrence of events far into the future. Examples include
assumptions about future employment, mortality, and the healthcare cost trend. Amounts determined
regarding the funded status of the plan and the annual required contributions of the employer are
subject to continual revision as actual results are compared with past expectations and new estimates
are made about the future. The schedule of funding progress, presented as required supplementary
information following the notes to the financial statements, presents multi-year trend information
that shows whether the actuarial value of plan assets is increasing or decreasing over time relative to
the actuarial accrued liabilities for benefits.
Actuarial Methods and Assumption
Projections of benefits for financial reporting purposes are based on the substantive plan (the plan as
understood by the employer and plan members) and include the types of benefits provided at the
time of each valuation and the historical pattern of sharing of benefit costs between the employer and
plan members to that point. The actuarial methods and assumptions used include techniques that are
designed to reduce short-term volatility in actuarial accrued liabilities and the actuarial value of
assets, consistent with the long-term perspective of the calculations.
In the January 1, 2006, actuarial valuation the entry age normal cost method was used. The actuarial
assumptions included a five percent investment rate of return (net of administrative expenses), an
38
(Continued)
THE HARBOR DEPARTMENT OF THE CITY OF LONG BEACH
Notes to Financial Statements
September 30, 2008 and 2007
annual healthcare trend rate that begins at 12 percent for HMO plans and nine percent for PPO plans
that grades down to four and one half percent for all plans by September 30, 2017, and an inflation
assumption of three percent. The Entry Age Normal (EAN) cost method spreads plan costs for each
participant from entry date to the expected retirement date. Under the EAN cost method the plan’s
normal cost is developed as a level amount over the participants’ working lifetime. The actuarial
value of plan assets was zero. The plans unfunded actuarial accrued liability is being amortized using
the level percentage of payroll method on an open basis over 30 years.
(c)
Deferred Compensation Plan
The City offers its employees the option to participate in a deferred compensation plan created in
accordance with Internal Revenue Code Section 457 allowing them to defer or postpone receipt of
income. Amounts deferred may not be paid to the employee during employment with the City except
for a catastrophic circumstance creating an undue financial hardship for the employee. Further
information regarding the City’s deferred compensation plan may be found in the City’s
Comprehensive Annual Financial Report for the year ended September 30, 2008.
(10) Operating Leases
The major portion of the Department’s property is leased to others. Such property includes marine terminal
facilities, special purpose facilities, office and commercial space, and land.
Some marine terminal facilities are leased under agreements that provide the tenants with preferential but
not exclusive use of the facilities. Some leases provide for rentals based on gross revenues or, in the case of
marine terminal facilities, on annual usage of the facilities. The leases and the preferential assignments
generally provide for minimum rentals.
Property under lease at September 30 consisted of the following:
Land
Docks and wharves
Warehouses and sheds
Cranes and shiploaders
Buildings and other facilities
Infrastructure
2008
2007
758,853,968
485,934,116
46,103,617
164,981,252
298,616,223
714,287,139
745,054,683
453,145,573
46,103,617
164,981,252
293,371,188
660,151,429
2,468,776,315
2,362,807,742
(679,698,718)
(610,631,090)
$ 1,789,077,597
1,752,176,652
$
Historical cost of leased property
Less accumulated depreciation
Book value of leased property
39
(Continued)
THE HARBOR DEPARTMENT OF THE CITY OF LONG BEACH
Notes to Financial Statements
September 30, 2008 and 2007
The future minimum rental income under noncancelable operating leases having an initial term in excess of
one year is as follows:
Year(s) ending September 30:
2009
2010
2011
2012
2013
2014 – 2018
2019 – 2023
2024 – 2028
2029 and thereafter
Total
$
222,839,000
210,491,000
206,637,000
203,445,000
201,993,000
974,244,000
848,628,000
427,232,000
5,618,000
$ 3,301,127,000
(11) Investment in Joint Venture
Intermodal Container Transfer Facility Joint Powers Authority (ICTF)
The Department and the Harbor Department of the City of Los Angeles (the Venturers) entered into a joint
venture agreement to form ICTF for the purposes of financing and constructing an intermodal container
transfer facility (the facility) to transfer cargo containers between trucks and railroad cars. The facility has
been leased to Southern Pacific Transportation Company, now merged with Union Pacific Railroad
(the Tenant). The facility was developed by the Tenant who assumed operational responsibility for the
facility. The Venturers’ share net income and equity distributions from ICTF equally. Audited balance
sheets and statement of income and venturers’ equity (in condensed format) for the years ended June 30,
2008 and 2007 were as follows:
Condensed Balance Sheets
Current assets
Property and equipment
Total assets
Current liabilities
2008
2007
$
21,117,285
3,059,129
20,144,858
3,167,160
$
24,176,414
23,312,018
$
24,744
8,042,218
12,255,153
11,896,517
7,807,369
7,462,431
24,151,670
15,269,800
24,176,414
23,312,018
Venturers’ equity:
Harbor Department of the City of Los Angeles
Harbor Department of the City of Long Beach
Total Venturers’ equity
Total liabilities and Venturers’ equity
40
$
(Continued)
THE HARBOR DEPARTMENT OF THE CITY OF LONG BEACH
Notes to Financial Statements
September 30, 2008 and 2007
Condensed Statement of Income and Venturers’ Equity
2008
Operating revenue
Operating expense
$
2007
8,339,855
(108,030)
8,894,072
(108,030)
8,231,825
8,786,042
650,045
368,215
Net income
8,881,870
9,154,257
Venturers’ equity, July 1, 2007 and 2006
Cash disbursement to venturers
15,269,800
—
14,115,543
(8,000,000)
24,151,670
15,269,800
Operating income
Interest income
Venturers’ equity, June 30, 2008 and 2007
$
On September 3, 2008, ICTF authorized the cash distribution of $8,000,000 to be shared equally by the
Venturers.
Pursuant to an indenture of trust dated November 1, 1984, ICTF issued $53,900,000 of 1984 Series A
bonds on behalf of the Tenant to construct the facility. In 1989, ICTF issued $52,300,000 of 1989 Series A
Refunding Revenue Bonds on behalf of the Tenant to advance refund the 1984 Series A Bonds.
In 1999, ICTF issued its Intermodal Container Transfer Facility Refunding Revenue Bonds, 1999 Series A.
In connection with the issuance, Union Pacific Railroad Company and ICTF entered into a Second
Amended and Restated Installment Sale and Security Agreement dated October 1, 1999. The proceeds of
the 1999 Bonds, together with other funds, were used by ICTF to redeem all of the Intermodal Container
Transfer Facility Refunding Revenue Bonds, 1989 Series A. The bonds are payable solely from payments
by the Tenant under a long-term lease agreement for the use of the facility.
The nature of the bonds is such that the long-term indebtedness is that of the Tenant and not of ICTF, the
Department, or the Harbor Department of the City of Los Angeles. The ICTF financial statements for the
year ended June 30, 2008 can be obtained from the Department.
(12) Commitments and Contingencies
The Department is subject to claims and lawsuits arising from the normal course of business. The City
Attorney’s office evaluates these claims on a regular basis. Department management may make provision
for probable losses if deemed appropriate on advice of legal counsel. To the extent that such provision for
damages is considered necessary, appropriate amounts are reflected in the accompanying financial
statements.
Based upon information obtained from the City Attorney with respect to remaining cases, it is the opinion
of management that the estimated liability for unreserved claims and suits will not have a material impact
on the financial statements of the Department. Contract commitments and purchase orders for which
materials or services were not received at September 30, 2008 and 2007 aggregated $60,114,329 and
$130,327,106, respectively.
41
(Continued)
THE HARBOR DEPARTMENT OF THE CITY OF LONG BEACH
Notes to Financial Statements
September 30, 2008 and 2007
(a)
Risk Management
The Department currently carries an all-risk property insurance program covering loss or damage by
fire and other risks (excluding earthquake and flood) with a loss limit of $1,000,000,000. A total of
$500,000,000 of terrorism insurance coverage is also purchased from a combination of insurers.
To address third-party liability exposure, an excess liability insurance program is carried by the
Department with total limits of $150,000,000 in excess of a $1,000,000 self-insured retention. The
excess liability policy covers the Department’s operations and includes acts of terrorism within the
$150,000,000 limit. In addition, the Department carries specialized insurance policies providing
coverage for damage to owned vessels, damage to other vessels, and pollution liability. The amount
of settlements reached by the Department did not exceed the amount of insurance coverage in any of
the past three fiscal years.
The Department, as needed, funds an Insurance Reserve account intended to cover uninsured losses
or the payment of deductibles and self-insured minimums. During fiscal year 2008, there was no
contribution to this reserve, but interest earnings brought the balance up to $53,936,411 from
$51,765,512 at the end of fiscal year 2007. Balances at the end of both fiscal years consist of
contributions plus earnings.
The Department participates in the City’s self-insured workers’ compensation program. During fiscal
years 2008 and 2007, it made payments to the City’s Insurance Fund totaling $1,173,934 and
$1,167,894, respectively, for permanent and temporary Department’s employees. Amounts in the
City’s Insurance Fund are accumulated to meet losses as they arise.
Claims expenditures and liabilities are reported when it is probable that a loss has been incurred and
the amount of that loss, including those incurred but not reported, can be reasonably estimated.
Based on an opinion from legal counsel, the Department is not recognizing any litigation claim or
judgment for fiscal year 2008. At September 30, 2007, the Department recognized litigation claim
liabilities of $2,385,000.
Liability for Claims and Judgments Rollforward Schedule
Balance,
October 1,
Description
2007
Additions
Reductions
Accrued claims and
judgments
$
Description
Accrued claims and
judgments
$
2,385,000
—
2,385,000
Balance,
October 1,
2006
Additions
Reductions
2,385,000
—
—
42
Balance,
September 30,
2008
—
Balance,
September 30,
2007
2,385,000
(Continued)
THE HARBOR DEPARTMENT OF THE CITY OF LONG BEACH
Notes to Financial Statements
September 30, 2008 and 2007
(b)
Potential Obligations Related to the Alameda Corridor Transportation Authority
The Alameda Corridor Use and Operating Agreement was executed by the Department, the Harbor
Department of the City of Los Angeles (Port of Los Angeles), the ACTA, and the Burlington
Northern Santa Fe and Union Pacific Railroads (the railroads). This agreement provides for a
payment of funds, known as a “Shortfall Advance,” to be made, under certain circumstances, to
ACTA by the Department and the Port of Los Angeles. Revenues generated by Use Fees and
Container Charges, paid by the railroads, will be used to pay debt service on ACTA financing, to
establish and maintain a bond repayment reserve account, and to pay ACTA’s reasonable expenses
relating to administration of the rail corridor.
To the extent that the revenues from use and container charges are not sufficient to meet ACTA’s
obligations, the Department and the Port of Los Angeles have agreed to advance the funds necessary
to make up the difference. This obligation began after completion of the corridor project and is
limited to a total of 40% of the total annual required amount, with the Department and the Port of
Los Angeles each responsible for one-half or 20% of the required amount.
ACTA’s latest Notice of Estimated Shortfall Advances and Reserve Accounting Funding
(the Notice) was transmitted to the Department on August 21, 2008; estimates included in the Notice
are dependent upon the accuracy of the assumptions used in their formulation. It is anticipated that
there will be differences between estimates and actual results; the differences may be material. The
projected shortfall for fiscal year 2009, based on the Notice submitted by ACTA, is $0. Any shortfall
advance made by the Department and the Port of Los Angeles is reimbursable, with interests, by
ACTA. Reimbursement could begin as soon as 2018. The Department is funding a cash reserve to
satisfy claims related to the shortfall advance potential obligation. The balances of the reserve, as of
September 30, 2008 and 2007, were $36,882,792 and $84,039,840, respectively.
(c)
New Gerald Desmond Bridge Matching Contribution
The Department is pursuing the replacement of the Gerald Desmond Bridge. The total cost to replace
the bridge is estimated at $850,000,000. The Department anticipates that funding of this project will
come primarily from federal and state sources, but local matching funds will also be required.
In anticipation of this funding requirement, the Department has set aside funds to provide the
expected 10% local match. As of September 30, 2008 and 2007, funds earmarked for this project
were $51,978,585 and $59,831,090, respectively.
(d)
Clean Air Action Plan (CAAP)
In January 2006, the Department adopted a wide-ranging Green Port Policy that greatly expanded the
Department’s commitment to sustain the environment by establishing new guidelines for Port’s
current operations and future development. Key provisions include protection of the community
from the harmful impacts of port operations and employment of state-of-the-art technology to
minimize environmental impacts. Air emissions from ships at berth account for over one-third of all
vessel air emissions. Providing electrification reduces emissions significantly. With electrification, or
“cold ironing,” vessels can shut down their auxiliary engines, while at berth, and plug into dockside
electric substations.
43
(Continued)
THE HARBOR DEPARTMENT OF THE CITY OF LONG BEACH
Notes to Financial Statements
September 30, 2008 and 2007
In November 2006, the governing boards of the ports of Long Beach and Los Angeles approved the
landmark San Pedro Bay Ports CAAP. This plan commits the ports to an aggressive plan to reduce
pollution by at least 45% in the next five years. The $2 billion plan addresses all port-related
emission sources – ships, trains, trucks, terminal equipment, and harbor craft – to significantly
reduce health risks posed by air pollution.
The Clean Trucks Program (CTP) is a key element of CAAP. Beginning October 1, 2008, CTP
banned pre-1989 trucks from entering Port’s shipping terminals. By January 1, 2010, only trucks
built after 1993 will be allowed into the Port’s shipping terminals, and by January 1, 2012, all trucks
must meet 2007 federal Environmental Protection Agency emission standards that make new trucks
more than 80% less polluting than older trucks. In order to assist with the replacement of trucks, the
Port offers three options: lease to own; grants for an engine retrofit; and loan subsidy for the
purchase of clean trucks. While the Port does not own or operate the more than 16,000 drayage
trucks that serve port terminals, CTP will greatly accelerate the reduction of air pollution and public
health risks posed by dirty diesel trucks that would otherwise remain on the roadways for many years
if not decades.
At the end of fiscal years 2008 and 2007, the Department has set aside $211,168,871 and
$217,300,000, respectively, to fund CAAP. Projects funded from this reserve must improve air
quality, foster the use of ship-to-shore electricity at the ports, and, enhance use pollution-based
impact fees to improve air quality and public health.
(e)
Future Oil Well Abandonment Costs
Costs related to the abandonment and site clearance of oil properties (abandonment costs) purchased
in March 1994 are based on estimates provided by the Department of Gas and Oil of the City of
Long Beach. Estimates of abandonment costs are reviewed annually, and adjusted to reflect changes
in abandonment practices, increased abandonment expenses, number and life of productive wells,
general changes in the life of the oil field, and changes in oil price levels.
The future oil well abandonment cost liability at September 30, 2008 and 2007 were $19,900,000
and $18,800,000, respectively. The amounts related to oil properties acquired in 1994 are presented
as long-term abandonment cost liabilities in the financial statements.
Future Oil Well Abandonment Cost Liability Rollforward Schedule
Balance,
Balance,
October 1,
September 30,
Description
2007
Additions
Reductions
2008
Oil abandonment liability $
Description
Oil abandonment liability $
18,800,000
1,100,000
Balance,
October 1,
2006
Additions
18,300,000
500,000
44
—
Reductions
—
19,900,000
Balance,
September 30,
2007
18,800,000
(Continued)
THE HARBOR DEPARTMENT OF THE CITY OF LONG BEACH
Notes to Financial Statements
September 30, 2008 and 2007
(f)
Environmental Remediation
The Department purchased 725 acres of property in the Harbor District in 1994. The property
contains soil requiring remediation of environmentally hazardous materials. The remediation is
required only on the portion of the land that the Department chooses to develop. To the extent that
such remediation is necessary, the Department’s liability is mitigated by provisions in the purchase
agreement that make Union Pacific Resource Company (UPRC), the seller, responsible for a portion
of the remediation costs. UPRC was acquired by Anadarko Petroleum Co. (APC) who assumed this
liability in accordance with the original purchase agreement. APC’s responsibility is limited to a
period not to exceed 15 years and a maximum amount of $112,500,000 according to the following
table:
Remediation cost
APC
First $50 million
Second $50 million
Third $50 million
Fourth $50 million
All additional costs
Maximum liability
Allocation
Department
$
50,000,000
25,000,000
12,500,000
25,000,000
—
$
112,500,000
—
25,000,000
37,500,000
25,000,000
100%
Currently, the Department has developed 131 acres and plans to develop 160 additional acres. It is
anticipated that remediation costs will exceed the first layer of the allocation.
Additionally, the Department is required to clean up the sediments of an area known as Installation
Restoration Site 7 (IR Site 7). The Department has recognized liabilities, for fiscal years 2008 and
2007, in the amounts of $76,869,429 and $47,700,000, respectively, including long-term and
45
(Continued)
THE HARBOR DEPARTMENT OF THE CITY OF LONG BEACH
Notes to Financial Statements
September 30, 2008 and 2007
short-term obligations. The liability for fiscal year 2007 pertains to the Pier A West remediation; the
liability for fiscal year 2008 is divided $57,246,082 for Pier A West and $19,623,347 for IR Site 7.
Environmental Remediation Obligation – Short-term roll forward schedule
Balance,
October 1,
2007
Description
Pier A West
IR Site 7
Reductions
$
9,600,000
—
56,581,138
3,830,666
9,600,000
—
56,581,138
3,830,666
$
9,600,000
60,411,804
9,600,000
60,411,804
Reductions
Balance,
September 30,
2007
—
9,600,000
Balance,
October 1,
2006
Pier A West
Additions
Balance,
September 30,
2008
$
—
Additions
9,600,000
Environmental Remediation Obligation – Long-term roll forward schedule
Balance,
Balance,
October 1,
September 30,
Description
2007
Additions
Reductions
2008
Pier A West
IR Site 7
$ 38,100,000
—
664,944
15,792,681
38,100,000
—
$ 38,100,000
16,457,625
38,100,000
16,457,625
Reductions
Balance,
September 30,
2007
—
38,100,000
Balance,
October 1,
2006
Pier A West
$
—
Additions
38,100,000
664,944
15,792,681
(13) Transfers to the City of Long Beach
The City Council, by authority of City Charter Chapter XII, Section 1209 (c)(4), and with the approval of
the Board of Harbor Commissioners, adopted a resolution to transfer 10% of the Department’s net income
for fiscal years 2008 and 2007 to the City’s Tidelands Operating Fund: $16,059,464 and $15,399,535,
respectively. This amount is reported as part of the Due to City of Long Beach account in the
accompanying statements of net assets and as a nonoperating expense in the statements of revenues,
expenses, and changes in fund net assets.
(14) Environmental Mitigation Credits
The Department disbursed $39,375,000 in fiscal year 1997 to secure environmental mitigation credits. An
agreement between the Department, the Port of Los Angeles, and several federal and state regulatory
agencies provided for the Department’s purchase of land located within the wetlands restoration project at
the Bolsa Chica Wetlands in Orange County, California. The land was transferred to the state in return for
environmental mitigation credits to allow for the construction of up to 267 acres of landfill in the outer
46
(Continued)
THE HARBOR DEPARTMENT OF THE CITY OF LONG BEACH
Notes to Financial Statements
September 30, 2008 and 2007
harbor area. During fiscal year 2006, the Department acquired $11,400,000 of available environmental
mitigation credits. No acquisitions or utilization of credits occurred during fiscal years 2008 and 2007.
The cost incurred in the acquisition of the land has been classified as a noncurrent asset. As of
September 30, 2008, the Department has completed landfills that required the utilization of $6,492,525 of
the available credits. The balance of environmental mitigation costs will be adjusted in the future as landfill
credits are used for port development. The balance of the Environmental Mitigation Credits was
$44,278,068 at September 30, 2008 and 2007.
(15) Net Assets
Net Assets is the difference between total assets and total liabilities. Increases or decreases in net assets
may indicate improvement or deterioration of the Department’s financial condition. The Department does
not intend to liquidate capital assets to fund ongoing operations. Restricted assets are subject to external
restrictions such as construction of capital assets, matching funding requirements for federally funded
projects, repayment of long-term debt, and fulfillment of contractual obligations with third parties.
Unrestricted net assets are available to fund the Department’s continuing operations. As of September 30,
2008 and 2007, the Department held net assets as follows:
2008
Invested in capital assets, net of related debt
Restricted for capital projects:
City of Long Beach RDA – Westside
Environmental mitigation credits (note 14)
Restricted for debt service (note 8)
Restricted – third-party obligations – non-related entity debt
service contingency and matching contribution (note 12)
Total restricted
Unrestricted:
Contributed capital – outside sources
Contributed capital – other City funds
Other unrestricted
Total unrestricted
Total net assets
47
2007
$ 1,335,522,370
1,162,931,088
—
44,278,068
102,046,032
4,818,586
44,278,068
103,807,881
184,184,312
143,870,930
330,508,412
296,775,465
30,427,546
27,749,166
579,372,721
30,427,546
13,253,752
639,352,642
637,549,433
683,033,940
$ 2,303,580,215
2,142,740,493


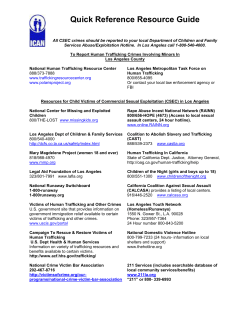

© Copyright 2026