
SECURITIES AND EXCHANGE COMMISSION SEC FORM 17 – A
SECURITIES AND EXCHANGE COMMISSION
SEC FORM 17 – A
ANNUAL REPORT PURSUANT TO SECTION 17 OF THE SECURITIES REGULATION CODE AND
CORPORATION CODE OF THE PHILIPPINES
1.
For the Calendar year ended December 31, 2005.
2.
SEC Identification Number 15393 3. BIR Tax Identification No. 321-000-463-069
4.
Exact name of registrant as specified in its charter: HOUSE OF INVESTMENTS, INC.
5.
Makati City, Philippines
Province, Country or other jurisdiction
of incorporation or organization
7.
3rd Floor, Grepalife Building, 219 Sen. Gil J. Puyat Avenue, Makati City
Address of principal office
8.
+63 (2) 8159636
Issuer’s telephone number, including area code
9.
Not Applicable
Former name, or former address, if changed.
10.
Securities registered pursuant to Sections 8 and 12 of the Code, or Section 4 and 8
Title of Each Class
6.
/____/ (SEC Use Only)
Industry Classification Code:
Number of Shares of Common Stock
Outstanding and Amount of Debt Outstanding
Common Stock, P1.50 par value
Preferred Stock, P0.40 par value
Amount of debt as of December 31, 2005
11.
1200
Postal Code
602,040,413 shares of common stock
2,244,920,598 shares of preferred stock
P8.55 Billion
Are any or all of these securities listed on the Stock Exchange.
Yes (X)
No ( )
Only the common stock is listed on the Philippine Stock Exchange
12.
Check whether the registrant:
(a) has filled all reports required to be filed by Section 17 of the SRC and SRC Rule 17.1
thereunder or Section 11 of the RSA and RSA 11(a)-1 thereunder, and Sections 26 and 141 of
the Corporation Code of the Philippines during the preceding 12 months (or for such shorter
period that the registrant was required to file such reports):
Yes (X)
No ( )
(b) has been subject to such filing requirements for the past 90 days.
Yes (X)
No ( )
13.
Aggregate market value of the voting stock held by non-affiliates: P240.94 million
(P217.38 million for common and P23.56 million for preferred)
TABLE OF CONTENTS
Page
PART I - BUSINESS AND GENERAL INFORMATION
Item 1
Item 2
Item 3
Item 4
Business ............................................................................................ .
Properties .......................................................................................…
Legal Proceedings .........................................................................…
Submission of Matters to a Vote of Security Holders ..............……
4
21
24
25
PART II - OPERATIONAL AND FINANCIAL INFORMATION
Item 5
Item 6
Item 7
Item 8
Market for Issuer’s Common Equity and Related Stockholder Matters 25
Management’s Discussion and Analysis or Plan of Operation………. 28
Financial Statements………………………………………………….. 37
Information on Independent Accountant and other Related Matters .. 38
PART III - CONTROL AND COMPENSATION INFORMATION
Item 9
Item 10
Item 11
Item 12
Directors and Executive Officers of the Issuer………………….
Executive Compensation………………………………………..
Security Ownership of Certain Beneficial Owners and Management
Certain Relationships and Related Transactions………………..
38
43
43
45
PART IV - CORPORATE GOVERNANCE
Item 13 Corporate Governance……………………………………………
46
PART V - EXHIBITS AND SCHEDULES
Item 14 Exhibits and Reports on SEC Form 17-C…………………………
46
3
PART I - BUSINESS AND GENERAL INFORMATION
“A”
Item 1. Business
(1) Business Development
HOUSE OF INVESTMENTS, INC. (HI)
HI was incorporated in 1959 as an investment bank, the first such bank to be organized in the country.
However, since investment banking had yet to be developed, HI decided to create its own investments and
then shifted to intra-preneurial activities.
Throughout its history, HI has successfully acquired, organized, invested and divested in various corporate
institutions and industries while focusing its corporate goal of contributing to the economic development of
the country and to provide employment while at the same time fostering a corporate culture of integrity and
excellence. At present, HI has sixteen direct subsidiaries and affiliated companies both listed and unlisted
with the Philippine Stock Exchange, Inc. (PSE). These companies which continue to be diversified in
nature and are organized into four main groups: information technology and education, construction and
infrastructure, consumer finance, and car dealership.
The merger of the car dealership and five other subsidiaries in 2002 was one of the strategic steps
undertaken by the Management to cope up with the economic crisis and business challenges. The merger
resulted in HI’s complete turnaround in 2003.
Year 2003
Amidst another year of adversity and perplexity marked by the social, political, and economic crises,
corporate downturn and challenges, the successive years of losses have been reversed significantly with HI
posting a net income of P48.2 million (as restated) for 2003 vis-à-vis the net loss of P67.2 million (as
restated) in 2002. The main drivers of the turnaround are improved profitability of most of its investments
and the robust growth in the income from its car dealership operations alongside with improved dividend
receipts, decline in interest and financing charges and HI’s continuous implementation of cost-effective
management.
The car dealership operations posted a remarkable growth in 2003 caused by the effect of the excise tax law
on the motor vehicle industry. The Honda and Isuzu divisions contributed P108 million and P37 million,
respectively, to HI’s bottom line. Together with Honda Cars Kalookan Inc., a 55% subsidiary, the total
contribution of the car dealership businesses totaled P163 million.
HI’s equity in net earnings (losses) of subsidiaries and associates, however, was reversed from P24.8
million earnings in 2002 to P28.3 million losses in 2003 on account of continued losses from its
construction subsidiary EEI Corporation (EEI). EEI’s losses have weighed on HI for the past three years
now and have managed to erode the profits earned from the Company’s investments in the areas of IT &
Education, Consumer Finance, and other services.
Year 2004
HI and its subsidiaries continued to make significant recovery as the construction and infrastructure group
showed signs of improved financial performance. The information and technology group contributed
significantly with a P396 million in net income in 2004 from P365 million in 2003. In July, the
stockholders approved the reduction of the par value of common stock from P2.00 per share to P1.50 per
share. The reduction in par value resulted in wiping out HI’s P167 million deficit in its audited retained
earnings as of December 31, 2003.
HI continued to streamline its investments in order to be more efficient and cost-effective. In October 12,
2004, HI swapped its investment in Pandacan Properties, Inc. in exchange for a 7% interest in Mapua
Institute of Technology’s, an iPeople subsidiary, preferred stock. In December, HI reduced its stake
holdings with First Malayan Leasing and Finance Corporation (Malayan Leasing) from a 51.71% interest to
45.11%. It sold its 7% share in Malayan Leasing to a RCBC Trust Fund. HI’s market price ended the year
at P0.71 versus the 2003 closing price of P0.50.
4
Year 2005
The overall performance for the HI and its subsidiaries declined in 2005 as the Group’s financials adopted
the new Philippine Accounting Standards (PAS). The impact of the new PAS resulted in the recognition of
HI’s preferred shares as a financial liability and recognized the related dividends as interest expense for the
period. Interest expense charged to operations from preferred shares amounted to P104 million. The new
accounting standards’ adoption and the decline in the contribution of the information technology and
education group resulted in the decline of HI’s net income from P274 million (restated) to P116 million.
For the past three years, the Company has continued its positive performance. Its construction and
infrastructure group’s performance has also showed signs of improved financial performance. From a net
income of P3 million in 2004, the construction and infrastructure group’s net income has risen to P62M in
2005. The information, technology and education group continues to lead all segments in terms of net
income although its net income declined from P396 million in 2004 to P273 million in 2005 due to declines
in school and related operations.
The Honda Cars Group Division with dealerships located in Quezon City, Manila, Fairview, and Marikina
ended 2005 with total revenues of P1.7 billion. This amount was 13% lower than 2004 revenue of P2.0
billion.
The revenue performance was adversely impacted by a drop in unit sales (from 2,173 down to 1,885). This
performance mirrored the total performance of Honda as an institutional brand where total unit sales
declined by 7% from 10,550 units in 2004 down to 9,797 in 2005.
The major impact was felt by the 17% reduction for the year in CRV sales as competitive brands released
new and sporty versions of Asian Utility Vehicles (AUV) and Sports Utility Vehicles (SUV). Despite the
upgrading of the Honda City and Jazz models, the manufacturer did not have available new units for sale
for the first two months of 2005.
Toyota continued to dominate the local car industry. Toyota introduced both the Innova (an AUV) and the
Fortuner (an SUV). These product introductions ate into the prospective sales of the Honda CRV.
Nonetheless, in the passenger car segment, Honda continued to enjoy a 22% market share.
Other areas of the operation showed good results. Parts and service sales grew by 22% because of an
active telemarketing program which increased unit intake despite the decline in unit sales.
Honda QC carefully held down operating expenses to P208 million and achieved a P14 million decline in
2005. Interest expense hurt the operation as P18 million was spent for 2005. Poor unit sales resulted in
continued high inventories thus high carrying costs.
As a result, the Honda Cars Group Division’s net income summed to P13 million compared to 2004 net
income of P2 million.
Honda Cars Group Division looks forward to a better year in 2006. The Division’s aggressive anticipation
hinges on the expected launch of the all new Civic, which it believes might result in a 40% growth in unit
sales from 2005.
Honda Cars Group Division is confident that with the great showing of the new Civic world-wide, its
aggressive 2006 operations will have a strong chance for success.
The Honda Cars Group Division continued to achieve excellence in the area of parts and services. For the
fourth successive year, the YGC Honda Group has been awarded Dealer Parts and Dealer Service for the
Year in 2005.
The Isuzu Group Division of the HI is composed of the two dealerships located in Paz Guazon St, Paco,
Otis, Manila and along Commonwealth Avenue in Quezon City. Isuzu sells commercial vehicles like the
Alterra SUV, the popular AUV’s like the Highlander Crosswind, D-Max Pick-ups and the N-Series trucks.
5
For the year ended December 31, 2005, the Isuzu Group Division generated revenues of P1.1 billion, a
slight decrease of 2.85% from 2004. Operating expenses were held to P68 million, a 7.23% decrease from
last year. Net income increased by 43% to P4.44 million in 2005.
Total demand for automobiles increased by 10% in 2005 to 97,063 units. Out of this total, commercial
vehicles outsold the passenger car market with 61,432 units versus 35,631 units. Commercial vehicles
maintained their market share of 63% in 2005. This was mainly due to the new variants and continued
strong sales and demand of AUVs.
Isuzu sold a total of 9,644 units for 2005. It ranked fourth over-all with a 10% market share of total sales
following industry leader Toyota, Mitsubishi, and Honda.
2006 will be a very challenging and difficult year as the market becomes more competitive with new
models and packages. A shift will most like favor the passenger car market as various new models and mix
will flood the market.
SIGNIFICANT SUBSIDIARIES
EEI Corporation (EEI)
EEI was established on April 17, 1931 as Engineering Equipment and Supply Company, Inc. EEI was
established principally as a trading establishment with exclusive distributorship in the Philippines for
manufacturers of industrial equipment, including tools, materials, and machines used by the local gold
mining industry.
EEI then diversified its operations into steel fabrication, steel production, and installation of airconditioning and refrigeration plants. In the 1970’s, EEI began its operations in the Middle East, which
contributed a large part of EEI’s construction revenues.
EEI has been awarded with two major certificates for quality conformance by international accreditation
bodies. The steel fabrication facility in Batangas, together with corresponding support facilities and
resources, were duly accredited in 1996 with systems that conform to ISO 9002 standards. Also in 1996,
American Society of Mechanical Engineers (ASME) authorized EEI to use the ASME stamp of quality
conformance in the fabrication of pressure vessels, pressure piping power boilers, and power boiler
assemblies. This made EEI the first Philippine Construction Company to have achieved an ISO 9002
accreditation. In 1998, this accreditation was extended to its entire construction business, including its field
prospects and support services.
EEI sustained management initiatives through organization rightsizing and re-focusing of its core
construction business to provide the foundation for its eventual recovery. First, EEI enhanced its customer
focus, emphasizing on the changing and more demanding needs and requirements of the market.
Consequently, EEI transformed its value position as a total solutions provider. EEI expanded its customer
base to include the institutional market such as universities, hospitals, and local government, which are
growing at a faster rate than the national economy. Second, consistent with being customer-driven, EEI is
gearing towards service excellence. It reinforced the business processes to always ensure the world-class
caliber of operations and systems. A key initiative has been the ISO 9002 certification, which was
successfully obtained. EEI is the only construction company to have been awarded this prestigious
recognition in design and engineering in the country. Third, EEI adopted the global best practice standards
to ensure that it can efficiently compete in the price-sensitive, yet highly competitive market in terms of
project capacity, processes, and execution.
EEI has faithfully contributed to the economic development of the country through the quality products it
has sold and the countless structures and facilities it has built through eight decades.
6
Year 2003
The continued slump in the domestic construction industry severely affected the overall financial
performance of EEI in 2003. The construction business further contracted in 2003 by 5.9 percent. The
negative performance is largely due to the reduction in public investments in construction. The
government significantly reduced its expenditures on capital outlays to contain budget deficit. Investments
in private construction on the other hand, managed to grow but it was not enough to compensate the drop in
public sector construction. The growth in private construction is due to the strong demand in housing and
trade establishments but there were no new capacity expansions of key manufacturing industries, which is a
niche market of EEI.
Major contracts meanwhile were completed and turned over to the principals during the year. Among the
projects that were completed in 2003 include Pacific Mall of Landco, The New Jollibee Commissary,
Unilab Warehouse/Distribution Center, and the EDSA Central Crossing Redevelopment project for
Greenfield Development Corporation.
Despite the very intense competition and unfavorable outlook in the construction industry, EEI managed to
obtain the following projects in the domestic market: NAIA 3 Expressway and related road project – Phase
I contract package II Skyway interchange ramps 1 and 4 for DPWH; general construction works for the
Esperanza Residences projects of Ayala Land, Inc.; construction packages for SMC PET plants in Davao
and Pampanga; total work packages for the construction of GA Tower of Globe Asiatique Realty; various
construction work packages for Intel Phil.; steel gates for KAMANAVA and Bohol irrigation projects of
Kurimoto, Ltd.; civil, equipment installation, electrical, and instrumentation works for Petron Bataan
Refinery LVN/GOHT; mechanical and installation works for Purefoods – Hormel, Inc.; piping,
mechanical, brick lining works for Rio Tuba nickel plant in Palawan for JGC Philippines, and offsite
automation project of Petron Bataan Refinery for UHDE.
On September 15, 2003, the SEC approved EEI’s plan of quasi-reorganization eliminating the accumulated
deficit as of December 31, 2002 amounting to P145.94 million by applying a portion of EEI’s revaluation
increment in land of the same amount. In January 2004, the SEC approved EEI’s plan to undergo quasireorganization to wipe its deficit as of October 31, 2003 amounting to P586.70 million against the
remaining revaluation increment of P590.49 million. The quasi-reorganization was approved subject to the
following conditions: 1) That the remaining increment of P3.78 million set-up in the books of EEI after the
deficit shall have been offset, will not be used to wipe out losses that may be incurred in the future without
prior approval of the SEC. 2) That for purposes of dividend declaration, retained earnings of EEI shall be
restricted to the extent of the deficit wiped-out by the appraisal surplus. 3) That should EEI’s operation
improve as of the end of calendar year 2003, the amount of P586.70 million in whole or in part shall be
reverted to revaluation increment. On December 31, 2003, EEI reverted revaluation increment to retained
earnings amounting to P3.55 million.
Year 2004
The national economy grew moderately in 2004, in spite of monumental challenges in the political, peace
and order and international fronts. More significant than the numbers is the underlying mood of
determination among businessmen and entrepreneurs that the country will turn around from its woes,
notwithstanding security concerns and political uncertainties which have already been discounted in the
economic equation.
In particular, the construction sector turned in a strong recovery in 2004. It posted a significant growth of
8.9% from the slump of negative 2.6 percent in 2003, sustained by positive performance for all quarters
during the year.
The turn-around was fueled by gains in public construction in line with the Government’s pump-priming
initiative, as it registered 5.2% growth compared to the huge contraction of 15.5% a year ago. Increased
government expenditures by the national and local government resulted in the expansion of public sector
construction activity, notably in the areas of flood control, ports, road and bridges. However, a significant
part of new construction was financed from bilateral agencies, which favor contractors from the donor or
creditor countries.
7
On the other hand, private construction maintained its growth of 6.8%, practically the same level in 2003,
as investments in high-rise residential, commercial and mall property developments and private
infrastructure toll way projects continued throughout 2004. Unfortunately, the sector’s growth is not broadbased. Industrial construction continued to be in a slump, highlighted by the dearth in construction projects
in new manufacturing, petroleum, power and other industrial plants, as well as capacity upgrading by this
broad sector. It is in the industrial sector where EEI’s core construction expertise is most proven and
recognized.
The domestic construction market remained highly competitive in spite of the over-all industry growth.
EEI made headway in 2004 by winning high-rise property projects that partially compensated for the
continued weakness in our strong niche markets in the oil and gas, manufacturing, power and industrial
sectors. Yet, in spite of the absence of major capital projects, oil and gas companies continued to be our
valued customers as they availed of our services in their regular expansion programs and maintenance,
including tank fabrication and electro-mechanical works.
Projects awarded to EEI during the period in review includes:
• Serendra-District 1 (Section A) CPO2 general construction works for Ayala Land, Inc.;
• Veridian Tower for Centroville, Inc.;
• Fairways Tower CP2 main contract package for Phil Township, Inc.;
• various work packages for Intel Philippines under its SPGC (small projects general contractor)
program;
• structural fabrication and erection works for Petron Bataan Refinery with CTCI;
• fabrication and erection of methanol tank for JGC;
• fabrication and installation of new cone roof tank for Petron Bataan Refinery;
• fabrication of 500 cubic meters water tank for San Miguel Corporation;
• liquid facilities expansion for Procter and Gamble Philippines, Inc.;
• power system upgrade for Unilab;
• on-shore work for 1 x 24.95 TPH boiler installation for Nestle Philippines;
• MMICP-DPWH Phase 5 C5 Kalayaan Ave. (R4) interchange project;
• electromechanical erection works and river water intake system for the 210 MW Mindanao coal
fired power plant with KHI;
• fabrication and erection of Casecnan gates for China Geo;
• construction of main clubhouse for Ayala Greenfields;
• proposed chapel and shrine for Mirant Sual power plant of Mirant (Phils.) Foundation;
• fabrication of MMDA Footbridges for IL Alaine Trading and Construction Corp.;
• erection of towers at Poro Point for US Embassy;
• liquids facilities expansion and JUDO project of PGPI;
• covering of basketball court for Philip Morris Philippines Manufacturing, Inc.;
• additional works for Purefoods Hormel Meat Plant; and
• Cathodic protection upgrade for Malampaya – Foster Wheeler/Shell Philippines.
Overseas, EEI continues to be engaged in various construction works in countries in the Middle East and in
addition to Africa.
•
Consolidated contracts and orders valued at P2.62 billion were obtained during the year, compared
to P3.96 billion in 2003. Project orders backlog amounted to the equivalent of P3.01 billion as of
the end of the year, of which P1.74 billion are building contracts.
EEI Construction and Marine, Inc. registered revenues of P100 million in 2004, an improvement from the
P90 million in 2003. However, net earnings remained at nearly the same level of P2.25 million.
The major projects obtained or completed during the year included the fabrication of 190 units underground
tanks and 10 MB VCR tank for Petron; fabrication and erection of vertical cone roof tanks, installation of
8
interconnecting pipelines and pipe bridge and the construction of two service stations for Pilipinas Shell;
and fabrication of underground tanks for the new independent oil players.
EEI Power Corporation’s (EEI Power) main business is to build, rehabilitate and operate diesel, gas
turbine, steam power plant and other power generating plants. It has the capability to operate and maintain
private diesel power generating plants with a capacity of up to 100 MW.
EEI Power at present maintains and supplies power to Creative Die Cast Philippines through a 1 MW diesel
power plant on a build, operate, lease and transfer (BOLT) scheme arrangement. EEI Power has provided
quality, reliable and continuous supply of electricity to its client. It has entered into an Operation and
Management Agreement with Mariwasa Siam Ceramics Inc for the operation of 10 MW Power Plant and
with Tantuco Enterprise Inc for 1.2 MW Power Plant both heavy fuel fired diesel engine. EEI Power also
cater for the minor and major overhauling job as it entered into a service contract with San Miguel
Yamamura Asia Corp., San Miguel Mandaue and Farola Plant and Samsung Phils (SEMPHIL).
EEI Power continues to expand focusing on the target to niche in the market of power generation and
operation and management of power plants.
EEI Power recorded favorable financial results in 2004 in spite of intense competition. Revenue increased
79% to P47.8 million from the P26.7 million in 2003. Net income of P4.1 million was slightly higher than
the P4.0 million last year.
The top-line revenue growth resulted from the strategy to expand its operation and management (O & M)
service for private corporations. During the year, EEI Power forged an agreement with Tantuco Enterprises,
Inc. for a three-year contract for Operation and Management of the latter’s 1200 KW diesel power plant in
Lucena City. The project will start commercial operation in March 2005. Its Service and Service Sales
Group have obtained a service contract with San Miguel Yamamura Asia Corp., San Miguel Glass Plant in
Mandaue and Binondo plant and Samsung Phils. Inc. for the minor and major overhauling of their diesel
power plants.
The business outlook for EEI Power is positive. EEI Power is working on finalizing an agreement with
Creative Diecast Philippines, Corp. for upgrading of its 1MW to 1.8 MW power plant, an Operation and
Management contract with Mariwasa Siam Ceramics which will bring additional revenues for 2005. The
Service and Service Sales Group is finalizing the service contract with Nestle Phils. Inc.
In addition to O & M projects, the company is developing other business models such as Build, Operate,
Lease and Transfer (BOLT), Build, Own and Operate (BOO), project management and turnkey
construction projects.
EEI continues to expand focusing on the target markets of power generation and operation and
management of power plants.
EEI Realty Corporation was incorporated on May 1995 that allows EEI’s entry into real estate and property
development business. The creation of EEI Realty complements the construction business of EEI; ensuring
optimum use of the latter’s construction equipment for site development and civil works on EEI Realty’s
real estate properties.
The real estate market remained sluggish in the first half of the year, particularly during the months prior to
the May presidential elections, on account of political anxieties, security concerns and generally weak
economy. Competition also intensified, highlighted by the launching of residential and other property
projects within Mega Manila, including Laguna and Cavite.
EEI Realty recorded gross sales of P36.2 million, 51% down from last year. The market up-tick in the
second semester and sales bookings during this period were not sufficient to compensate for the laggard
first half. Below-expectation sales resulted in the company’s net loss of P24.1 million in 2004.
9
The Suburbia East project registered healthy sales of P35.4 million, equivalent to 26 house & lot packages
and lots sold and additional reservations kicking in during the second semester. Construction of different
units in Phase I was in full swing in 2004.
Site development works for Suburbia East Phase 2 commenced during the year at 10% completion. Sales
reservations registered were a robust 38 units by the end of the year.
The sales performance of Grosvenor Place, a low-cost residential joint venture project with Robinsons
Homes, Inc, ended in a contrasting note with marginal sales in 2004. By year-end, the pre-termination of
the joint venture arrangement was being negotiated to free our remaining 58 hectares in the Tanza, Cavite
property for alternative developments.
Meanwhile, the Ayala-Greenfield Development Corporation continued the development of the more than
11 hectares of EEI Realty’s land contribution for the joint venture in Ayala-Greenfield Estates in Calamba,
Laguna.
Equipment Engineers, Inc. engages in trading of industrial equipment and supplies in the Philippines. It
provides broad range of industrial plant equipment, replacement parts and supplies. It principally serves
the industrial and commercial sectors as distinguished from the consumer sector. It is considered one of the
largest domestic trading houses dealing with this type of merchandise. Equipment Engineers acts as
distributor of industrial and engineering products for over 50 international manufacturers, mostly on an
exclusive basis. It has maintained long-standing relationships with its suppliers, although distribution
arrangements are renewed annually. It is not, however, dependent on any particular supplier or product
line.
EEI’s machinery and systems solutions subsidiary – Equipment Engineers was able to rebound from
financial loss in 2003 to post a modest net income of P2.3 million in 2004. The improved performance
stemmed from the increase in revenues from P106 million in 2003 to P119 million in 2004 and EEI’s
aggressive cost management efforts, highlighted by the significant reduction of fixed expenses by 31%.
Consolidated net income after tax (inclusive of EE’s 40% equity share from EEI Power) amounted to P3.9
million.
EEI obtained orders for building management, power, instrumentation and security systems for Marina
Square Hotel, Globe Telecoms and Innove, Smart Communications, National Power Corporation, JG
Summit, J.D. BEC, EEI (parent company) and other companies. Specifically, it secured the contract for the
supply 500 kW generating sets for NPC – Small Power Utility Group (SPUG) worth a total of US$ 9.2
million.
Gulf Asia International Corporation (GAIC) was incorporated as a manpower services firm in the
Philippines for overseas construction jobs. Its clients are mainly overseas companies. EEI employs the
services of GAIC at market rates. GAIC has also successfully expanded its operations to become an
integrated provider of outsourced services to local companies and manpower maintenance provider through
its subsidiaries GAIC Professional Services, Inc. (GAPSI) and GAIC Manpower Services, Inc. (GAMSI),
respectively.
GAIC recorded another excellent year in 2004. Despite the substantial manpower reduction in the MAN
Libya project, consolidated gross revenues continued to grow, rising 25% from P86.5 million in 2003 to
P108.1 million during the year. Consolidated net income increased 30% from P8.3 million to P10.8 million.
Deployment of additional manpower to traditional clients in the Middle East, Malaysia and Singapore, the
acquisition of new contracts in Kazakhstan, Saudi Arabia and Central Africa, and the continued manpower
mobilization for EEI’s projects in the Middle East, Equatorial Guinea and Asian countries contributed to
the healthy performance.
Its domestic manpower services subsidiary GAIC Manpower Services, Inc. (GAMSI) continued to perform
creditably. GAMSI improved its net earnings to P4.5 million, accounting for 42% of GAIC earnings and
10
up 32% from last year’s P3.4 million. The growth reflects the acquisition of new outside maintenance
contracts during the year. The YGC remains the major customer of GAMSI.
Wholly owned GAIC Professional Services, Inc. (GAPSI), which specializes on providing outsourced
business process services in finance, accounting, payroll, money sorting, collection and data services,
realized a slight decrease in net earnings from P2.2 million in 2003 to P1.9 million in 2004.
Year 2005
The country posted GDP growth of below 6% in 2005. Although lower than expectations, the economic
growth would have been more robust had it not been dampened by the political disturbances, as well as the
escalating oil prices and rising inflation. The over-all positive prospects were reflected in the healthy
recovery in housing and property development, stable interest rates, higher corporate profits and the
appreciating Philippine peso.
Construction mirrored the intensity of the political developments. From 8% growth in the first quarter, the
sector decelerated to 4% in the second quarter and slipped to negative territory in the third quarter before
turning around to post a 7% jump in the fourth quarter.
Decreased public construction affected the sector, particularly in the second and third quarter due to the
overhang in the government’s fiscal position. Private sector construction likewise registered a decline but at
a lower pace as it took a breather with the completion of major high-rise residential and office buildings
and commercial mall property developments.
In a positive note, industrial construction has begun to revive, led by construction projects in mining and
new capacity upgrading projects in light manufacturing, heavy industry, petroleum and power.
EEI plans to sharpen their business focus, even during the extended period of slow economic activity, has
steadily but surely enhanced our business systems and processes and created a more effective organization.
EEI has maintained its business structure around its core competencies of electro-mechanical, building,
steel fabrication and horizontal construction. This focus has resulted in greater mastery of the unique
construction and project management methodologies inherent in each sector and a better understanding of
these market segments.
The streamlining of EEI’s business processes which it had painstakingly undertook during the difficult
years has resulted in EEI being enhanced cost-competitive. In whatever economic environment, the EEI
that is taking shape will be a viable, strong and competitive business corporation.
The biggest hurdle that EEI had to surmount was not just the prolonged construction market downturn – it
was the mistaken mindset in the superiority of its ways of doing things during the up-cycle. EEI had to
push aside old paradigms and core beliefs, and drove for an EEI that is learning and adapting organization –
lean, fast, agile and able to adopt the best practices and technologies within its core construction business.
With a more effective organization structure and streamlined systems and processes, coupled by better cost
profile, EEI is positioned to take advantage of the momentum established a few years ago and access the
opportunities in the market.
The road to economic resurgence has been long, but it appears to be gaining ground. In particular, the
domestic construction market has started to show greater vibrancy.
The property development sector continues to be robust, with several new landmark projects in the Makati,
Ortigas and Fort Bonifacio business districts. Housing, including high-rise residential condominiums, has
been the recipient of low and stable prevailing interest rates and rising demand.
Infrastructure projects have been constrained and delayed by financing issues and right-of-way and other
problems. But in the medium term, the mass rail transport systems, airports and seaports, bridges and
roadways earmarked for construction and upgrading will have to be put up as the country bids to modernize
its infrastructure and boost the economy.
11
Indications of recovery in the manufacturing and industrial sector have become evident, as food and
beverage corporations, cement companies and other consumer-dependent industrial firms have begun to put
on line capital expansion and upgrading activities.
Upgrading projects by the independent power producers and new power generation facilities are also
anticipated in the medium-term. EEI’s major role in the power sector projects in the 1990s will give it a
sure footing in this sector once new construction begins to take off in the coming years.
Political unrest and disturbances have once again taken center stage in early 2006. It is to the credit of the
professional leadership of the Armed Forces that it has shunned partisanship and maintained its respect for
constitutional and legal processes. The vast majority of the population has remained sober and calm amid
the agitation and confusion.
In a sense, the nation has grown to expect these disturbances every year. What is noteworthy is the
unmistakable shift, the turning point in the attitude and paradigm of the business sector and its sensing of
its role in the country. Private business will move ahead and will remain the engine of growth in this
country, even with the political distractions.
Likewise, the majority of law-abiding, peace-loving and productive members of society have aligned with
the business sector in the genuine quest to diligently and quietly work for the progress of the country and
the improvement in the welfare of the Filipino.
EEI has a stake in building a strong economy. The momentum has shifted, the tables are turning towards
recovery and take-off. After many years of re-tooling and re-engineering to be a competitive and efficient
industry player, EEI is ready to do its part in the expansion and modernization of Philippine business.
iPeople, inc.
iPeople, inc.(the Company), formerly known as Petrofields Exploration and Development Co., Inc.
(Petrofields), was organized and incorporated on July 27, 1989 by Benguet Corporation to engage in
petroleum and mineral exploration, development, and production. Petrofields operated as such until 1997
when the shareholders changed its name and primary purpose to that of a development and investment
management company while retaining oil exploration as one of its secondary purposes.
Its business interests include education and information technology through Mapua Institute of Technology
(MIT), Mapua Information Technology Center (MITc), Mapua Techserve, Inc. (Mapua Techserve), Pan
Pacific Computer Center, Incorporated (PPCCI), and People eServe Corporation (People eServe).
Established in 1925, MIT is a recognized leader in engineering and architecture education in the
Philippines. Beginning in December 1999, under the stewardship of the Yuchengco Group of Companies
(YGC), MIT has seen renewed vigor in its curricular, faculty, facilities and institutional development
programs.
In June 2000, barely six months after the transfer of ownership, MIT added the BS Computer Science
degree to its academic offerings. Within this year, a state-of-the-art electronic network connecting some
1,800 computers was set up – “at internet speed” to use an expression of that time.
In 2001 MIT added BS Information Technology and BS Information Management to its roster of program
offerings. It started to offer MS Geoinformatics and MS Environmental Engineering.
It created two wholly-owned subsidiaries: The Mapua Techserv, which is MIT’s arm for engineering
consultancy and testing services and the Mapua Information Technology. Center (MITc), which is the
vehicle for the two-year associate degree programs, short courses and various business ventures in
Information Technology (IT).
12
In 2002, MIT instituted the undergraduate programs in Materials Science and Engineering, Geological
Engineering and Geology. It was granted “Fully Deregulated Status” by the CHED. It established a
campus in Makati, which has become the home of all of its I.T. academic programs and of the MITc. In
this year, too, MIT successfully pioneered the adoption of the quarter system of education.
MITc is a wholly-owned subsidiary of MIT. Established in 2001, it is committed to the development of
intellectual capital through IT education, innovation and collaboration. The synergy of MITc’s Associate
Degree (AD) Program , Technology Oriented Program (TOP) and Business Resource Center (BRC) creates
an effective environment for the development of highly skilled IT professionals and the creation of cuttingedge IT applications and services.
The AD offers 2-year courses for college-level students, as well as professionals desirous of additional
credentials, in any of the following IT disciplines:
• Information Systems
• Management Systems Technology
•
Internet & Network Technology
•
Digital Arts and Design
Offerings are geared towards developing skills with high industry demand. Students can obtain industry
certifications in technologies like Java and Cisco. Students are assigned to reputable companies for their
on-the-job training to ensure hands-on application of the curriculum.
The TOP caters to professionals, fresh graduates or even students seeking to enhance their IT and business
competencies within a short timeframe. As with all MITc offerings, TOP courses are pursued in
cooperation with the best offerings in the industry.
People eServe is a wholly owned subsidiary of iPeople, Inc., incorporated last July 17, 2001 as an IT
company , and was reorganized in July 1, 2002 to venture into specific IT projects, which include providing
PC maintenance services, reselling IT equipment and marketing various products and services developed
by MIT. In 2004, People eServe focused on expanding its business in IT equipment maintenance and IT
equipment reselling.
In support of its expansion programs, People eServe filed for the increase of its authorized capital stock
from P1.00 million to P5.00 million in 2004. This was approved by the Securities and Exchange
Commission on December 21, 2004.
PPCCI was incorporated on May 15, 1970. PPCCI started as the EDP unit of Pan Malayan Management
and Investment Corp. It rendered IT services to Great Pacific Life Assurance Corp. (Grepalife), Malayan
Insurance, Industrial Finance Corp. and Diner’s Club. In 1970, this EDP unit spun off into an independent
company. For the past years, its paramount purpose is to provide IT support to Grepalife and Pacific Plans.
Year 2003
MIT instituted the BS Biotechnology program with double-degree and triple-degree options combining
Chemistry and Chemical Engineering. It also instituted the MS Computer Science program. The process
of ABET Certification of Substantial Equivalency was started with the application of the EE, ECE and CoE
programs for Certification. In this year MIT was granted “Fully Autonomous” status by the CHED.
Year 2004
MIT set up the San Lorenzo Ruiz School of Health Sciences in its Makati campus for the offering of the
B.S. Nursing program. The year saw three new undergraduate degree program offerings: BS Interior
Architecture Design, BS Project Construction Management and BS Engineering Management. New
graduate programs included MS Engineering Management, MS Materials Science and Engineering, and
MS Electronics and Communications Engineering. Joint BS-MS programs which shortened the residency
time of students were started: BS Chemical Engineering-MS Environmental Engineering; BS Chemical
Engineering and Chemistry-MS Environmental Engineering and BS Chemical Engineering and ChemistryMS Chemistry.
13
On December 14, 2004, the Board of Trustees (BOT) and the Stockholders amended the articles of
incorporation to include in MIT’s purposes in relation to the granting and offering of certificates, degrees,
diplomas and titles, including honorary ones, conformably with law and pertinent rules and regulations; and
the founding and maintaining of experimental stations, laboratories, science centers, research centers,
review centers, dormitories and restaurants, student residence halls, faculty housing, mess facilities and
such other structures and facilities as maybe necessary to carry out or aid in the accomplishment of the
educational vision, mission and objectives.
In 2004, the iPeople, inc. acquired 70% ownership of PPCCI through share swap with Grepalife effective
January 1, 2004. Upon acquisition, PPCCI’s purpose has been transformed to become the provider of
choice for consolidated IT services for the entire YGC as well as create its niche in the domestic market.
Year 2005
On February 08, 2005, the BOT and the Stockholders amended the articles of incorporation to change the
name of MIT to Malayan Colleges, Inc. (Operating under the name of Mapua Institute of Technology).
The amended articles of incorporation was approved by the Securities and Exchange Commission on
February 22, 2005.
By July 2006, MIT will begin offering BS Hotel and Restaurant Management. It will also open the doors
of the Malayan High School of Science in Pandacan, Manila. By 2007, it hopes to open the Malayan
Colleges Laguna.
First Malayan Leasing and Financing Corporation (Malayan Leasing)
Malayan Leasing (trade name) was incorporated and registered with the SEC on October 21, 1965
primarily to engage in general financing and investment businesses. Malayan Leasing has a Non-Bank
Quasi Bank (NBQB) license from the Bangko Sentral ng Pilipinas (BSP) which enables Malayan Leasing
to solicit money market placements as the main source of funds. Malayan Leasing’s Head Office is at 5F
Grepalife Building, Sen. Gil Puyat Avenue, Makati City is 45.11% owned by HI.
Year 2003
Malayan Leasing did fairly well in funding the growth of its assets. Diversification of funding sources
resulted in 8% savings in interest expense and 29% increase in interest income. Bills payable increased by
13% to P676.4 million with Money Tree placements accounting for 19%, CLF funded – 8%, regular
Money Market – 46%, and bank borrowings at 27%.
Malayan Leasing successfully complied with BIR’s requirement for the filing and payment of taxes via
internet using BIR’s E-filing and Land Bank’s E-payment program. Malayan Leasing, likewise, is
compliant with the mandate of the BSP for a business continuity plan to guard against unexpected events.
Month-end accruals of branches were automated while Head Office was still on the parallel run stage.
The Net Profit/Loss (NPL) ratio in 2003 improved to 11.7% due to aggressive collection and loan workout.
It also contributed P8.2 million in revenues from sale of acquired assets and collection of late payment
penalties.
Malayan Leasing’s branches booked a total of P81.7 million for a 102% improvement compared to the
previous year. This production volume resulted in 35% and 385 growth in branch portfolio and assets,
respectively. Branches contributed P7.1 million or 28% of net income in 2003.
A cash dividend of 10% was paid in 2003 to stockholders of record as of December 31, 2002.
Year 2004
Net income dropped by 59% from P25.3 million in 2003 to P10.6 million in 2004. Major factors, which
contributed to the decrease in net income include: (a) the higher cost of borrowings with the average 91day Treasury Bills rate moving from 6.03% in 2003 to 7.34% in 2004, (b) higher reserve requirements
imposed by the BSP from 16% in 2003 to 19% in 2004, and (c) additional P12 million loan loss
provisioning to increase reserves to P40 million. NPL ratio of Malayan Leasing stood at 7.4% as of
yearend of 2004, an improvement from the 8% ratio in 2003.
14
Operating expenses were at 35% of total revenues in 2004, which compared with the 18% registered in
2003. A staff redundancy program reduced headcount from 37 in 2003 to 29 in 2004.
Total assets amounted to P1.02 billion in 2004, down by 2% from P1.04 billion in 2003. The reduction in
assets was principally the result of a larger receivable run-off compared to the volume of booked loans and
leases. Malayan Leasing ended 2004 with a ROA of 1% and a ROE of 4%.
A 10% cash dividend amounting to P21.09 million was paid in 2004 to stockholders of record as of
December 2003.
Year 2005
Malayan Leasing’s net loss for the year was at P5.99 million from a net income of P10.19 million in 2004.
The loss was attributable to lower level of revenue bookings and related receivables, income adjustments
due to new accounting standards, lower levels of interest income on deposits, lower extra-ordinary income
arising from sale of acquired assets, and high level of non-performing loans.
Operating expenses increased are higher by 2.58% from the previous year due to documentary stamps and
brokers’ commissions incurred on the sale of an acquired asset.
Total assets by the end of 2005 were at P712.22 million. Receivables growth did not reach the expected
level due to stiff competition, political uncertainty, and rising cost and lower margins experienced by
medium-sized companies.
Effective borrowing cost in 2005 was 8.9%. While 91-day treasury bills rate improved, the large
withdrawals of YGC placements necessitated drawings from Malayan Leasing’s bank lines. These were
easily 3 to 4% higher than money market rates.
Honda Cars Kalookan, Inc. (HCKI)
HCKI was previously an investment of HCQC but by virtue of the merger of HCQC with HI last December
27, 2002, HCKI became a 55%-owned subsidiary of HI.
HCKI was incorporated and registered with the SEC on November 22, 1993 to engage principally in the
sale and distribution, service and repair of automobiles, parts, and accessories. HCKI currently holds office
at 598 Edsa Balintawak, Caloocan City.
Year 2003
Three new models were launched in the last quarter of 2003: the Completely Built Units (CBU) City units
from Thailand, the new Accord and the reintroduction of 5-seater Honda CRV 4X4. These car models are
part of Honda’s efforts to maintain its market share and improve its position against the leading
competitors.
On May 13, 2003 and July 22, 2003, HCKI declared P15.0 million cash dividends on each date.
Year 2004
The year 2004 was challenging for the auto industry in general and Honda in particular. The entry of
European and American car brands broadened consumer choices. In addition, car sticker prices
correspondingly adjusted with the revised tax scheme for Asian Utility Vehicles (AUVs), which shifted
demand to lower margin sedans. These types of vehicles usually require both fewer accessories and
collateral business. The competition also heated up with the introduction of a wide variety of competing
models and the repositioning of existing models into another category. Other brands seemed to be priced
more attractively than Honda cars.
Despite forecast revisions at the start of the second semester of 2004, HCKI missed its targeted sales
revenue by 2%. This is due to the weak sales in the last quarter of 2004. Net sales dropped to P1.3B in
2004 from P1.6 billion last year. Vehicle sales in 2004 were at P1.08 billion, down by 21% from 2003
15
while Parts Sales stood at P26.0 million shrinking by 16% against that of last year. Service revenues,
however, reached P138.8 million growing by 1% compared to that of the previous year. Total gross profit
of P110.9 million for 2004 is indicative of the weak sales for most part of the year was down 8% against
the revised 2004 budget and 25% below that of last year. Vehicle sales’ gross profit of P48.7 million was
14% below the revised budget owing to the slow sales in the last quarter, while the gross profit from parts
sales was down 3% against budget due to fewer units sold than anticipated. Service revenue gross profits
P56.7 million, while still 3% lower than budget contributed in absorbing the overheads.
Cost management of overheads yielded 5% savings in total operating expenses compared to budget. The
strict adherence to the agreed promo package and a tight watch on freebies helped the HCKI bring down its
promotion expenses by 9% against budget. Maximizing the available manpower and going over each
expense with the objective of bringing down cost not only enabled the HCKI to maintain last year’s level
but even resulted to a 3% savings against budget.
Collateral income posted was at P19 million. It surpassed the budget by 15% but was 15% lower than that
of last year. Although sales of new policies dropped by 20%, booking of renewal policies grew by 9% as
compared to budget, the commission from bank financing referrals exceeded budget by 5%, and the income
derived from sales of LTO services, rust proofing services and sales of pre-owned vehicles exceeded
budget by almost P2.3 million. HCKI’s net income for the year of P8.3 million missed the revised budget
by 10%.
Year 2005
2005 was a tough year for the Philippines. The implementation of the Expanded Value Added Tax
disrupted the buying patterns of car buyers. The volatility of fuel prices at the pump created by rising oil
prices slowed the demand for high-end sedans.
The competition introduced a wider variety of models increasing competition across all lines.
resulted in unit sales volume slipped by 8% compared to 2004.
This
Landev Corporation (Landev)
Landev was incorporated and registered with the SEC on May 04, 1995 primarily to engage in properties
and asset management, project development and consultancy. Landev is 100% owned by HI.
Year 2004
Since year 2001, Landev activities consisted of (a) overseeing the over-all operation of RCBC Realty
Corporation as owner’s representative and general managers for the RCBC Plaza, (b) consultant of
Malayan Insurance Co. involving the take-over of the ASB Malayan Condominium Project in Ortigas, (c)
project manager of MIT IT School Fit Out Works located at the old RCBC building in Buendia, and (d)
general manager of Grepaland low-cost housing project, Celestine 2 and 3 located in Cabuyao, Laguna.
In 2002, Landev acted as property manager for ETY, Y-Tower 1 and 2 buildings effective September 16,
2002 and provided executive project management assistance to Honda and Isuzu divisions of HI covering
various rehabilitation works on its buildings. Landev continued to manage the mentioned projects in 2003.
In addition, Landev has taken over the full property management of RCBC Plaza and MIT-Intramuros
campus.
Year 2005
Landev earned its revenues from the following activities:
• Real estate Management Services, which includes the disposition of ROPOAS’s and the outright
sale or lease of idle assets.
• Property and Facilities Management of several office buildings. This activity also includes
building lease administration.
• Project Management activities on construction and development projects of our customers.
Other operating income (such as income from car parks, billboard rentals, and others) contributed the
balance of Landev’s revenues.
16
In 2006, Landev will continue to provide the same services to its customers, and seek to expand its
customer base to a greater extent outside of the YGC.
In addition, the company will open a new security and risk management business. Management expects a
healthy increase in revenues for the forthcoming year.
HI or any of its subsidiaries or affiliates did not suffer any bankruptcy, receivership or of any similar
proceedings.
(2) Business of Issuer
HI is a management and holding company of the YGC. HI is a respected leader in project development
activities and joint ventures with internationally established companies, and controls and manages
companies in (1) construction and infrastructure (EEI Corp.), (2) consumer finance (Malayan Leasing),
Zamboanga Industrial Finance Corporation, (3) information technology and education (iPeople inc. which
owns 100% of Malayan Colleges, Inc., Mapua Information Technology Center, Inc., People eServe, and
Pan Pacific Computer Center, Incorporated and (4) other services, e.g. memorial park, strategic sourcing
and property management , (Manila Memorial Park Cemetery Inc., HI-Eisai Pharmaceutical, Inc., Landev
Corp., La Funeraria Sucat, Inc., among others). The merger with Honda Cars Quezon City, Inc., Isuzu
Manila, Inc., and other companies under the umbrella of HI gave rise to the adoption of the Company’s
secondary purpose - the car dealership. The merger was approved last December 27, 2002 with Resolution
No. 011.
The Car dealership division consisting of four (4) franchised dealers for Honda cars and two (2) franchised
dealers for Isuzu vehicles competes essentially in Metro Manila for sales and services of the said brands.
The primary competitor is the Ayala dealerships for both Honda and Isuzu vehicles.
The principal source of supply for sale (vehicles and parts) is the distributor/assembler, Honda Cars
Philippines, Inc. for the Honda brand and the Isuzu Philippines Corp. for the Isuzu brand. The supply for
both brands is governed by existing franchise agreements.
The car division is dependent on the franchise agreement. The agreements outline the authority of the
Company to sell the branded vehicles and its corresponding genuine parts and accessories as well as to
carry the brand trademarks.
HI’s car dealerships are required to secure Department of Trade and Industry (DTI) accreditation as a Class
“A”, Motor Shop and Service provider and Land and Transportation Office (LTO) accreditation as Dealer
of the branded vehicles. HI expects no difficulties or problems in securing the said accreditation.
No new products or services are in the planning stage that will require material amount of resources to be
spent by HI.
HI is not dependent upon any single buyer.
The Construction and Infrastructure segment, the Education and Information Technology segment and the
Car Divisions, all contribute more than 98% to sales or revenue of HI.
There has been no significant amount of money spent on governmental activities in the last three years.
HI (excluding subsidiaries) has 591 non-officers and 9 officers or a total manpower of 600 as of December
31, 2005 and is not subjected to any Collective Bargaining Agreements (CBA). At the end of 2006, it is
anticipated that the total number of employees would still be the same level.
EEI – EEI’s primary area of business is to provide large-scale construction services to both the domestic
and overseas markets. EEI is listed in the Philippine Stock Exchange, Inc (PSE). It was incorporated in
1935.
17
The basic strategy of EEI is to pursue leadership through multiple construction technology and undertaking
multiple projects across geographic markets. It aims to further expand its international market presence by
increasing manpower services where it has successfully established a niche market with its track record.
EEI’s objective is to increase the contribution of its overseas projects so that it can diversify its geographic
exposures and have steady revenue and profit flows in the future to compensate the slowdown in the
domestic market. EEI, to complement this, has programmed and increased its marketing efforts in the
Middle East. Overseas projects and dollar-denominated domestic projects provide additional advantages as
it has enabled EEI to hedge foreign exchange risks and record currency conversion gains.
EEI shall also continue its program of technology acquisition through strategic alliances. Partnerships with
local and international players allow EEI to widen the scope of its business and market.
In addition to the construction operations carried out by EEI, the activities of its subsidiaries and affiliates
augment and support the construction business. EEI’s subsidiaries and affiliates are mainly Filipino
companies incorporated in the Philippines.
In the domestic construction market, EEI acts as either sole or main contractor or, in the case of large-scale
projects in which an overseas company has been retained as the main contractor, as a sub-contractor. Its
construction activities include projects for infrastructure, marine facilities, and industrial plants (i.e.,
cement, oil refinery, power, chemical, food, and other manufacturing plants). Its services cover general
contracting and project management, civil and concreting works, structural works, mechanical and
equipment installation works, piping works, tank erection, electrical and instrumentation works, insulation
and fireproofing works, tank, vessel, and equipment fabrication works, and detailed engineering services.
Sub-contractors are employed by EEI to perform minor works, such as painting, roofing, and
waterproofing.
EEI had to focus on specific market niches that have remained on an expansion mode in the face of the
overall economic slowdown. It has managed to obtain new projects in infrastructure and the expansion and
rehabilitation projects of water operators in Metro Manila. It has also participated in the construction of
electronic plants and property development projects in the domestic scene.
Overseas, EEI is primarily a sub-contractor in providing manpower, and is also engaged in project
management and supervision, and secondarily, as a supplier of construction equipment and engineering
design services.
EEI is a pioneer Philippine contractor in the Middle East with an undisputed record of major projects in the
Kingdom of Saudi Arabia over the last 25 years. The projects reflect recognition of EEI’s globally
competitive construction expertise by international contractors.
While EEI intends to maintain a strong base in the domestic market in the coming years, it also intends to
expand its overseas operations, notably in Saudi Arabia and other gulf states.
EEI regards the following as its main competitors: DMCI, Makati Development Corporation, F.F. Cruz &
Company, Inc., Summa Kumagai, Leighton, and BF Corporation, which are also into building and
infrastructure as general contractors, similar to EEI. EEI attributes its position in the domestic market to its
established reputation, its broad range of industrial construction capabilities, quality of its construction
work, and the technical competence of its work force.
In the international construction markets, EEI faces stiff competition from Indian, Pakistani, Bangladesh,
Sri Lankan, Egyptian, Thai, and Indonesian construction companies, who also have the advantage of
relatively low labor costs for labor-intensive contracts. EEI considers its competitive advantage overseas in
its proven track record and in its skilled labor force.
EEI’s construction materials, which are principally cement, steel plates, steel bars, and occasionally
construction equipment and tools, are sourced locally. Imported materials and equipment include steel,
electrical and electronic equipment components, lighting fixtures and construction equipment. EEI is not
dependent on any one supplier.
18
EEI’s rank and file employees are affiliated to the EEI Progressive Workers Union (NAFLU). Established
in 1979, this labor union is the certified exclusive bargaining agent of the rank and file employees. Another
labor union, EEI Staff Supervisory Employee Union (APSO, TUCP), was established to become the
bargaining agent of the supervisory employees. EEI’s management has maintained good relations with its
employees, and has not experienced any strikes or work stoppages since 1977.
iPeople, inc. – iPeople was involved in oil exploration and production business. iPeople generated a
substantial portion of its revenues from the West Linapacan oilfield. However, due to the fact that it was
not financially viable, the oilfield was shut down. The high risk involved in oil exploration made the
Management decide to restructure iPeople. The capital restructuring was successfully carried out in 1999
by transferring all of its oil assets to PetroEnergy in exchange of the latter’s shares of stock.
Petrofields, now iPeople, acquired MCI on December 21, 1999. iPeople has drawn a general program,
which includes improvement of the academic program, institution of a comprehensive faculty development
program, advancement of Information Technology and upgrading of school facilities and construction of
new buildings.
iPeople venture into the New Economy as a holding company was underscored with the change of the
company name from Petrofields Corporation to iPeople. The new name reflects the intent to develop both
human resource and technology that provide profitable business opportunities in the Information Age. The
first strategic step along this new course was the acquisition of MCI.
iPeople has three subsidiaries namely: MCI, People eServe Corporation, and IEWorks, Inc. MCI is in the
field of education. People eServe is engaged in personal computer (PC) maintenance services and PC
reselling operations. IEWorks is engaged in business software development, internet application
development and IT staffing services. IEWorks’ shareholders and its board of directors approved the
dissolution of the company by shortening its corporate life effective October 31, 2002.
iPeople has no principal product, which contributes 10% or more to sales or revenues other than the
educational services of MCI.
The revenues of iPeople are predominantly denominated in Philippine Pesos.
First Malayan Leasing and Finance Corporation (Malayan Leasing) is a pioneer in the leasing and
financing industry in the Philippines. Malayan Leasing was incorporated in October 21, 1965. Malayan
Leasing became a subsidiary of the HI in November 1995. Malayan Leasing has a Non Banking Quasi
Banking (NBQB) license from the BSP, which enables Malayan Leasing to solicit money market
placements as the main source of funds.
Honda Cars Kalookan, Inc. (HCKI) is a 55%-owned subsidiary of HI by virtue of the merger last
December 27, 2002. HCKI is considered part of HI’s car dealerships together with the two divisions
(Honda and Isuzu). The primary competitor is the Ayala dealership.
The principal source of supply for sale of vehicles and parts is the distributor/assembler, Honda Cars
Philippines, Inc. The supply for the Honda brands is governed by an existing franchise agreement. The
agreement outlines the authority of HCKI to sell Honda vehicles and its corresponding genuine parts and
accessories as well as to carry the Honda trademark.
HCKI is required to secure a Department of Trade and Industry (DTI) accreditation as a Class “A” Motor
Shop and Service provider and a Land and Transportation Office (LTO) accreditation as a Dealer of the
Branded Vehicles. HCKI expects no difficulties or problems in securing the said accreditation.
Landev Corporation (Landev)
Landev, a wholly owned subsidiary of HI is currently into the following business transactions:
19
•
•
•
Property/Facilities Managers for RCBC Plaza, Mapua Campus (Intramuros and Makati),
Grepalife, RCBC Head Office, ETY, Y Tower 1 and 2, JAKA 6780 and JAKA 2
Asset Managers (including Marketing/Leasing) for selected Acquired Assets of RCBC (i.e.
Carpark Operations at RAMCAR Property), HI and its Subsidiaries and real estate assets of
PMMIC.
Project Managers for Malayan Plaza and Mapua High School and other fit-out and renovation
works at various Landev – managed buildings.
Landev will continue managing the properties of its existing YGC clients and expand the Property
Management Portfolio to include other YGC properties not yet under its care and external clients as well.
Landev is actively involved in Asset Disposition/ Leasing of RCBC Acquired Assets and at the same time
as broker for Malayan Plaza.
Major risk/s involved in each of the businesses of the company and its major subsidiaries
HI’s risk factors emanate from the risk factors of its car dealership operations and its major subsidiaries,
enumerated below.
1.
Car Dealership (includes HCKI)
The uncertainty of the imposition of legal/regulatory/political/taxation laws has proven to be a risk
factor for the businesses of HI, most especially on the Car Dealership business for the years 2003 and
2004. Regulatory concerns in the form of the imposition of the excise taxes have weighed heavily on
the Car Dealership divisions.
Since the vehicles are manufactured abroad, the Company is also exposed to foreign exchange risks.
Fluctuations in the foreign exchange affect the selling price of the vehicles, which has a direct impact
in HI’s financials.
The level of consumer spending has an impact on the demand for motor vehicles. GNP and GDP are
the main indicators that denote the level of consumer spending which are generally affected by market
risks and political risks.
2.
EEI Corporation
EEI is exposed to market risks that are directly related to the construction industry, in general. Any
change in the market’s perception of the industry and the whole economy affects the operations of EEI
with respect to selling price and its costs in doing business.
Interest rate risks also have an impact in EEI’s financials with its high debt levels.
Foreign exchange risks are factors that affect EEI in its importation of its equipment and in its projects
abroad.
Credit or counter-party risk is also a factor wherein EEI is exposed to with its dealings with its clients
here and abroad.
3.
iPeople, inc.
Capital availability refers to the insufficient or unavailable capital that the iPeople needs to fuel its
growth, execute its strategies, and generate financial returns.
As a listed company, iPeople also faces “Shareholder/Owner Risks” or the risk that pertains to the
decline in investors’ confidence which impairs the company’s ability to efficiently raise capital.
20
There is the risk with the partners involved with iPeople’s various subsidiaries. Possible risks involve
inefficient or ineffective alliances, partnering and other external relationships. Ventures into new
curriculums / technologies which can reduce investment returns is also a possibility. These risks
could affect iPeople’s ability to compete.
4.
First Malayan Leasing and Finance Corp. (Malayan Leasing)
One of the inherent risks for Malayan Leasing is interest rate risk due the nature of the business of the
company. Malayan Leasing’s operations and financials are sensitive to the fluctuation in the interest
rates, which have direct impacts on its costs and revenues.
Credit Risk is another risk classification that is part of the business of Malayan Leasing. As a lender,
Malayan Leasing exposes itself to the risk that its counter-party may default on its payments.
Regulatory concerns also weigh on Malayan Leasing since it is in a highly regulated industry. Any
adverse change in the regulations by the Bangko Sentral ng Pilipinas (BSP) may limit the growth
potential of Malayan Leasing.
In addition to the risks enumerated above, HI and its subsidiaries are also exposed to political risks in its
ventures abroad and simply by being entities doing business in the Philippines due to the nature of the
political landscape and history of the country.
Management of all the risks is effected by applying set procedures and controls and by continuously
monitoring and improving the risk management capabilities in business processes through: (1) risk-based
audits; (2) review risk management capabilities; and (3) operating performance standards.
Item 2. Properties
The office space occupied by HI belongs to an affiliate. As a holding company, HI does not utilize
significant amounts of office space. The Car Divisions, on the other hand, significantly use leased facilities
and real property to sell and service Honda and Isuzu vehicles. All showrooms situated in various areas in
Metro Manila have lease contracts with various lot owners.
On a consolidated basis, the 2005 total property, plant and equipment of HI was valued at P3.59 billion as
compared to P3.68 billion for 2004. Breakdown is as follows:
Buildings and improvements
Power plant
Machinery, tools and construction equipment
Transportation and service equipment
Furniture, fixtures, and office equipment
Library books
Land
Less: Accumulated Depreciation
Construction in progress
Total
2003
P 1,152,890,966
40,653,590
993,778,316
223,687,283
664,453,496
24,619,091
2,877,589,471
5,977,672,213
1,818,789,386
4,158,882,827
9,550,393
P 4,168,433,220
2004
P 1,202,193,208
40,653,590
905,794,624
239,237,689
674,512,768
23,863,991
2,872,825,305
5,959,081,175
1,929,319,050
4,029,762,125
5,235,627
P 4,034,997,752
2005
P 1,326,542,167
40,653,590
860,800,276
236,282,463
721,720,337
29,795,015
2,517,212,746
5,733,434,053
2,144,936,350
3,588,497,703
8,056,866
P 3,596,554,569
21
The following table provides summary information on HI and its subsidiaries’ land located in the areas
enumerated below as of December 31, 2005:
Acquisition
Date
Area
(sq. m.)
Type
HI
Boso Boso, Antipolo, Rizal
Baguio City
1993
1993
196,993
15,001
Manicuhan, Zamboanga City
Ipil, Zamboanga City
Quezon Ave., Quezon City
2002
2002
2002
35,905
57,347
4,604
Talayan, Quezon City
2002
2,700
Manggahan, Libis, Quezon City*
Aguila Lot, Batangas*
Aguila Lot, Batangas
Lemery, Batangas
1985
1988
1991
1993
1996
1997
1997
688
68,570
8,568
19,948
50,987
3,606
390,626
Office
Fabrication Plant
Fabrication Plant
Agricultural
Majada, Canlubang, Laguna
1998
29,483
Equipment yard
2005
2005
2005
138,216
102,633
133,371
EEI
Baguio City
Sta. Maria, Bauan, Batangas*
Minuyan, Norzagaray, Bulacan
San Jose, Sta. Maria, Bulacan
Minuyan, San Jose del Monte,
Bulacan
Agricultural
Residential
Agricultural
Agricultural
Lot with
Industrial bldg.
Lot with
warehouse
Residential
Fabrication Plant
Remarks
Mortgaged with
RCBC
Acquired thru merger
Acquired thru merger
Acquired thru merger
Mortgaged with
RCBC
Acquired thru merger
Mortgaged with
China Bank, Metro
Bank and RCBC
Mortgaged with BPI
Mortgaged with
RCBC
Industrial
Industrial
Industrial
22
Acquisition
Date
Area
(sq. m.)
Type
Remarks
EEI Subsidiaries
EEI – Philrock Division
Golden Haven Memorial Lots
EEI Marine
Bagong Ilog, Pasig
2003
505
1994
8,000
Fabrication
Plant
Mortgaged with
RCBC
EEI Realty
Marikina - Suburbia East
1999
72,593
Residential
Mortgaged with
RCBC
1995-96
1995
2003
179,381
727,936
6221
Residential
Residential
Residential
1999
17,997
School Campus
2001
8,371
School Campus
2002
3,624
School Campus
1983
9,509
Residential
Alfonso, Cavite
1998
1,500
Lian, Batangas
Mun. of Kabankalan, Negros
Tarlac, Tarlac
1978
1983
1999
58,192
4,410
10,000
Mapulang Lupa, Valenzuela City
2002
780
Residential /
Agricultural
Residential
Agricultural
Residential /
Agricultural
Commercial
Calamba, Laguna
Trece Martires, Cavite
Ayala - Greenfield
MIT
Intramuros, Manila
Sen. Gil Puyat Ave. Ext.,
Makati City
Paco, Manila City
MALAYAN LEASING
Antipolo, Rizal
Memorial lots
Mortgaged with
RCBC
Mortgaged with
RCBC
Previously
owned
by
Pandacan
Properties, Inc.
No right of way
occupied
by
squatters
With house and
swimming pool
No right of way
Vacant lot
Vacant lot
Apovel Subd., Barangay Bulua,
CDO
San Pablo City, Laguna
2003
241
Residential
Bldg. Occupied
by borrower
Still for resale
Vacant lot
With
house
occupied
by
borrower
With house
2003
648
Residential
Vacant lot
J. R. Torres Subdivision (beside
Bacolod Airport), Bacolod City
2004
250
Residential
Vacant lot
CDO
Taloc, Bago City
Pulilan Bulacan
2002
Various
2003
612 lots
2,155
1,165
Memorial lots
Residential
Residential
23
HI and its subsidiaries owned buildings on the following leased lots:
Kind
HI
2-storey building
2-storey building
2-storey building
2-storey building
2-storey building
HCKI
3-storey building.
1-storey building
Location
Area
(sq. m.)
Monthly
Rental
Exp. Date
Paco, Manila
Paco, Manila
Commonwealth
QC
Commonwealth
QC
Barangka,
Marikina
6,432
6,147
1,576
P437,059
417,693
215,282
09/20/2016
09/30/2016
03/15/2021
2,754
277,708
04/30/2010
1,650
163,326
06/15/2010
Edsa Kalookan
City
Eulogia Drive,
Quezon City
4,566
831,804
12/25/2018
3,198
95,940
11/10/2012
Certain properties, machinery, equipment and other fixed assets of HI and its subsidiaries are used to secure
its loans payable and long-term debt from various banks and other financial institutions. These consist
mainly of mortgages on various MIT, EEI, EEI Realty, EEI Power, FMLFC, and HI assets. For additional
details on HI and its subsidiaries’ loans payable and long-term debt and the corresponding encumbrances
on their assets, refer to Notes 14 (Loans Payable) and 15 (Long-term Debt) of the Notes to the Consolidated
Financial Statements.
The principal assets reflected in the consolidated balance sheets are registered mainly under HI’s main
subsidiaries: namely, those engaged in construction and infrastructure, consumer finance, information
technology and education, and car dealerships. As a holding company, HI’s indirect ownership of said
properties covers/applies only to the extent of, and is limited by the amount of holdings it has in these
subsidiaries.
Item 3. Legal Proceedings
In October 2001, Metro Pacific Corporation (MPC) filed a complaint for arbitration against SECC with the
Construction Industry Arbitration Commission. After presentation of evidence, both testimonial and
documentary, to support each other’s claims and counterclaims, the Arbitral Tribunal rendered a decision in
October 2002 awarding MPC liquidated damages against SECC in the amount of P617 million plus minor
claims amounting to P15 million for a total award of P632 million. SECC, on the other hand, was awarded
unpaid balance amounting to P525 million.
On April 26, 2006, MPC and SECC entered into a compromise settlement whereby the parties desired to
reach full and complete settlement of claims and counterclaims.
EEI has substantial claims against various parties in connection with completed projects. Majority of these
claims came from the EEI’s various claims for cost of variation orders, time extension, and loss and
expense due to prolongation and disturbance costs. Any recoveries from these claims will be reported as
income in the year when the realizability of the claims is determined to be virtually certain.
There are pending legal cases against EEI that are being contested by EEI and its legal counsels.
Management and its legal counsels believe that the final resolutions of these cases will not have a material
effect on the financial position and operating results of EEI.
24
MCI is facing various labor lawsuits and disputes. The lawsuits and disputes include case files by Faculty
Association of Mapua Institute of Technology (FAMIT) concerning the alleged violation of Collective
Bargaining Agreement provisions on the college faculty ranking system and high school salary rate
computation.
Management believes that the ultimate liability, if any, with respect to these lawsuits and disputes will not
materially affect the financial position and results of operations of MCI.
There are other suits and claims filed for or against certain subsidiaries. Management believes that these
suits and claims will ultimately be settled in the normal course of operations and will not adversely affect
the subsidiaries’ financial position and operating results.
Item 4. Submission of Matters to a Vote of Security Holders
The following are the proposed amendments of the By-Laws to be taken up in the Annual Stockholers
Meeting:
•
Amendments on Article Seven of the Company’s Articles of Incorporation
PART II – OPERATIONAL AND FINANCIAL INFORMATION
Item 5. Market for Issuer’s Common Equity and Related Stockholder Matters
(A) Market Price of and Dividends on Registrant's Common Equity and Related Stockholder Matters
(1) Market Information
The HI common stock is traded in the Philippine Stock Exchange.
High
Low
1.34
0.92
2.16
1.80
1.10
1.04
0.70
1.00
0.88
0.78
First Quarter
Second Quarter
Third Quarter
Fourth Quarter
0.50
0.41
0.75
0.71
0.30
0.30
0.34
0.60
First Quarter
Second Quarter
Third Quarter
Fourth Quarter
0.50
0.48
0.52
0.50
0.48
0.48
0.50
0.50
Stock Prices
2006
First Quarter
2005
First Quarter
Second Quarter
Third Quarter
Fourth Quarter
2004
2003
25
(2) Holders
The number of shareholders of record as of December 31, 2005 was 627 for common shares
and 79 for preferred shares. Common stock outstanding as of December 31, 2005 was
602,040,413 shares while 2,244,920,598 shares for preferred stocks.
Top 20 stockholders of common shares as of December 31, 2005:
Name
No. of Shares
Held
1
Pan Malayan Management & Investment
294,758,335
Corporation.
2
PCD Nominee Corp. (Filipino)
122,227,784
3
PCD Nominee Corporation (Non-Filipino)
41,474,005
4
Great Pacific Life Assurance Corp.
40,971,860
5
G.E. Antonino, Inc.
23,161,130
6
Malayan Insurance Co., Inc.
7,925,944
7
A.T. Yuchengco, Inc.
7,036,070
8
GDSK Development Corp.
5,064,840
9
Go Soc & Sons & Sy Gui Huat, Inc.
4,019,890
10
Isabel Caro Wilson
3,723,970
11
Y Realty Corporation
3,545,890
12
Malayan Securities Corp.
2,790,000
13
Kiat Bin Yu
2,510,000
14
Magnolia W. Antonino
2,315,450
15
Seafront Resources Corp.
2,224,000
16
Alberto M. Meer
2,217,030
17
M.J. Gonzalez & Associates, Inc.
2,173,120
18
David Sycip
1,799,660
19
Enrique T. Yuchengco, Inc.
1,211,360
20
Cheng Han Sui
1,055,000
TOTAL
572,205,338
Others
29,835,075
GRAND TOTAL COMMON STOCKS
602,040,413
% to Total
48.96%
20.30%
6.89%
6.81%
3.85%
1.32%
1.17%
0.84%
0.67%
0.62%
0.59%
0.46%
0.42%
0.38%
0.37%
0.37%
0.36%
0.30%
0.20%
0.18%
95.06%
4.96%
100.00%
26
Top 20 stockholders of preferred shares as of December 31, 2005
Name
No. of Shares Held
1.
Pan Malayan Management & Investment
1,012,062,489
Corp.
2.
Alfonso T. Yuchengco
982,763,820
3.
Enrique T. Yuchengco, Inc.
64,941,579
4.
Antonio Floirendo
50,719,582
5
Alfonso T. Yuchengco, Inc.
45,842,701
6
Eriberto H. Gomez
37,851,001
7
RCBC Trust 52-027
8,933,367
8
Leonardo Siguion-Reyna
4,999,740
9
RP Land Development Corp.
4,702,039
10
Carmelino P. Alvendia Jr.
3,455,718
11
RCBC Trust 53-004
2,242,545
12
Eloisa G. Tantunco
2,159,840
13
Isabel Caro Wilson
2,144,889
14
Rodolfo P. Del Rosario
1,924,020
15
Pedro Changco Jr.
1,522,133
16
Alfonso Yuchengco Fao E. Guido
1,261,698
17
Jaka Investment Corp.
1,160,762
18
RCBC Trust 53-110-3
1,066,137
19
RCBC Trust 75-187
624,968
20
Alexander A. Padilla
622,983
TOTAL
2,231,002,011
Others
13,918,587
GRAND TOTAL PREFERRED
STOCKS
2,244,920,598
(3)
% to Total
45.08%
43.78%
2.89%
2.26%
2.04%
1.69%
0.40%
0.22%
0.21%
0.15%
0.10%
0.10%
0.10%
0.09%
0.07%
0.06%
0.05%
0.05%
0.03%
0.03%
99.40%
0.60%
100.00%
Dividends
In accordance with the Corporation Code of the Philippines, HI intends to declare
dividends (either in cash or stock or both) in the future. Common and preferred
shareholders of HI are entitled to receive a proportionate share in cash dividends that may
be declared by the Board of Directors out of surplus profits derived from HI’s operations
after satisfying the cumulative interest of preferred shares. The same right exists with
respect to a stock dividend the declaration of which is subject to the approval of
stockholders representing at least two-thirds (2/3) of the outstanding shares entitled to
vote. The amount will depend on HI’s profits and its capital expenditure and investment
requirements at the relevant time.
A cash dividend amounting to P94.64 million was declared on December 7, 2005 payable
to preferred shareholders of record as of December 22, 2005. The dividend covered the
period October 2004 to December 2005. On March 30, 2006, a cash dividend of P13.11
million was approved during the Board of Directors meeting for stockholders of record
date April 21, 2006. The said cash dividend covered the period January to March 2006.
After satisfying the cumulative preferred interest, there are no restrictions that limit the
ability to pay dividends on common equity or that are likely to do so in the future. No
dividends are unpaid for preferred stockholders as of December 31, 2005.
(4) Recent Sales of Unregistered or Exempt Securities, Including Recent Issuance of Securities
Constituting an Exempt Transaction
There was no sale of unregistered securities and no recent issuance of securities in 2005.
27
(B)
Description of Registrant's Securities.
The first one third portion of the Company’s preferred shares are scheduled to be redeemed by
the end of 2005. A total of 382,139,874 preferred shares were redeemed by preferred
shareholders at P0.40 per share as of December 31, 2005. Payment for the redeemed shares to
shareholders was finalized in January 2006.
Item 6. Management’s Discussion and Analysis or Plan of Operation
The Company’s consolidated financial statements have been prepared in compliance with accounting
principles generally accepted in the Philippines (Philippines GAAP) as set forth in the Philippine Financial
Reporting Standards (PFRS) under the historical cost basis, except for land, which is carried at revalued
amounts and available for sale securities that have been measured at fair value. The accompanying
consolidated financial statements are presented in Philippine Pesos.
Consolidated Revenues (P’000)
Amounts of revenue, profitability, and identifiable assets attributable to operations for 2005, 2004, and
2003 follow:
Amount in 000’s
2005
Revenues
Net Income1
Total Assets
Stockholders’ Equity
P10,089,156
116,575
11,419,823
2,868,027
2004
(restated)
P9,402,375
274,316
11,267,644
3,816,694
2003
P10,778,058
48,262
10,860,127
2,130,769
Top Five Key Performance Indicators
Management uses the following indicators to evaluate the performance of HI:
1. Equity in Net Earnings of Investees – represents HI’s share in the undistributed earnings or losses of its
investees for each reporting period after the acquisition of said investments, net of amortization of
goodwill. Equity in net earnings (losses) of investees indicates the profitability of the investments and
the investees’ contribution to HI’s net income.
Computation:
Investees Net Income (Loss) x Investor’s Percentage Ownership less Goodwill Amortization
2. Earnings before Interest, Taxes, Depreciation and Amortization (EBITDA) – is calculated as net
income before minority interest, net interest expense, income tax expense, amortization and
depreciation. It is a tool to determine the ability of HI to generate cash from operations to cover
financial charges and income taxes. It is also a measure to evaluate HI’s ability to service its debts.
3. Current Ratio – is a measurement of liquidity, calculated by dividing total current assets by the total
current liabilities. It is an indicator of HI’s short-term debt paying ability. The higher the ratio, the
more liquid HI is.
4. Debt-to-Equity Ratio – gives an indication of how leveraged HI is. It compares assets provided by
creditors to assets provided by shareholders. It is determined by dividing total debt by stockholders’
equity
1
Attributable to equity holders of the parent
28
5. Return on Assets – measures the income earned by shareholders’ investment in the business by
dividing net income by the equity.
EQUITY IN NET EARNINGS OF INVESTEES
EBITDA
CURRENT RATIO
DEBT-TO-EQUITY RATIO
RETURN ON ASSETS
Dec. 31, 2005
153
1,047
0.82
2.98
1.02%
Dec. 31, 2004
285
1,246
0.78
1.95
2.43%
Dec. 31, 2003
(1)
798
0.77
3.42
0.44%
Note: Values in the above table are in Million Pesos except ratios.
Financial Overview
2005 vs. 2004 Results of Operations
Performance for 2005 declined from the previous year as new accounting standards were adopted. The
adoption resulted in significant adjustments such asset recoverability, reclassification of preferred
dividends to interest charges, and employee benefits recognition. The information and technology group
continued to contribute significantly with a P273 million in net income in 2005. Net income of the
information and technology group, however, declined by about P123 from 2004. The construction and
infrastructure group ended the year with a P62 million net income from a P3 million net income in 2004.
The Company’s preferred shares reclassified as a financial liability resulted in the increasing the Group’s
liability by about P803 million. At the same time, one third of the preferred shares were due to be
redeemed by the end of 2005. About 382 million preferred shares were eventually redeemed by the
shareholders after due notice. HI’s market price ended the year at P0.92 versus the 2004 closing price of
P0.71.
EEI
The generally buoyant construction market, marked by the recovery in the real estate and high-rise property
sector, led to positive operating results for the Company in 2005.
The Company obtained contracts and orders worth P3.43 billion in 2005, up from P3.08 billion in 2004.
EEI continued to capitalize on the high-rise property market with the acquisition of the high-end luxury St.
Francis high-rise condominium project and another construction package of Ayala Land’s Serendra
development in Fort Bonifacio. The Company also acquired various industrial projects from INCO, PNOC,
Hazama, Intel Phils., SMC Magnolia, San Miguel Yamamura, Sankyu-Pilkao and Unilab among others.
Major contracts completed and turned over to the project owners during the year included the One-Legaspi
Tower, the Globe Asiatique GA Tower, the Banko Sentral ng Pilipinas building project and the Malayan
Science High School building.
The Company is currently engaged in vertical construction activities in The Residences at Greenbelt and
Fairways Tower at Fort Bonifacio.
Consolidated revenues jumped 42% from P2.93 billion in 2004 to P4.17 billion during the year. Project
orders backlog totaled P3.01 billion as of December 31, 2005, by coincidence the same amount last year.
The Company gained strides from its cost-management program. Fixed expenses were significantly
reduced from P372.10 million in 2004 to P300.20 million in 2005. The drive to improve construction and
project management processes likewise yielded dividends with the realization of savings from project
expenses, thus increasing project gross margin by 3 to 5%, particularly in industrial, electro-mechanical and
shop fabrication projects.
The Company should have booked bigger positive earnings but the income was pulled down by the
implementation of new Philippine Accounting Standards (PAS) 32 and 39 for the year in review.
29
Non-recurring gains of P 39 million were likewise booked in 2005 on the sale of 100% of our equity in C &
E Corporation, an affiliate where the Company had a minority stake.
The Company has aggressively positioned itself in various construction projects. Among the projects
identified where the company will participate in 2006 project biddings are expansion plants of food and
beverage manufacturers, notably Nestle Philippines, San Miguel Purefoods and Ginebra San Miguel, and
industrial projects of JG Summit, Petron, LaFarge, JGC, PASAR, PNOC and KEPCO/Salcon Power. The
company will also participate in the major high-rise and commercial property development projects in the
pipeline, particularly Greenfield Development IT Center, the GA Tower 2, Philtown’s Metropolitan Tower
and Serendra Phase 2 Project.
MALAYAN LEASING
In 2005, Malayan Leasing registered net losses of P5.99 million, down from a net income of P 10.19
million in 2004. The factors that contributed to the negative bottom line included:
•
•
•
•
A drop in level of receivables from P 631.92 million in 2004 to P 486.73 million.
A deterioration in non-performing loan ratio from 7.4% in 2004 to 28.4%.
Higher operating expenses from litigation and documentary stamps.
Loan loss provisioning of P 24 million to increase reserves to P 60 million.
Total assets dropped by 25% from P952.03 million in 2004 to P712.22 million in 2005. The drop was
attributable to:
•
•
A higher loan run-off rate vs. new loan bookings.
A decline in acquired assets from P146 million in 2004 to P80 million in 2005.
Stockholders equity increased from P262.77 million in 2004 to P282.81 million in 2005 as a result of
payment of some subscription receivable.
iPEOPLE
Total cash dividends of P482.20 million was paid for the year 2005 that caused the decrease in retained
earnings from P1.00 billion in 2004 to P0.60 billion in 2005. Correspondingly, decreased total assets by
from P3.28 billion as of December 31, 2004 compared to P2.90 billion of December 31, 2005.
Total revenues amounted to P1.45 million and P1.35 billion for 2004 and 2005, respectively. The 6.70%
change in 2004 as compared to 2005 was contributed mainly by the decrease in revenues of school related
operations.
HONDA CARS KALOOKAN, INC. (HCKI)
Total net sales of P1.1 billion did not match 2004’s net sales of P1.3 billion.
Parts sales totaled P25 million and fell short from 2004 parts sales by 4%. However, service revenue
summed to P141 million and grew 2% compared to the previous year.
Consequently, gross profit added to P105 million, 5% below 2004.
Honda Cars Kalookan adopted strict cost control measures. Total operating expenses shrank by 2% from
last year, despite an inflation rate averaging well over 6%. Net income came in at P9.5 million.
LANDEV CORPORATION
In 2005, Landev generated total revenues of P34.1 million, a 5% increase over previous year revenue of
P32.7 million.
30
Net income dropped to P2.8 million from P4.6 million.
Cause for Material Changes from Period to Period of the Income Statement
Total revenues increased to P10.09 billion in 2005 from P9.40 billion in 2004. The 7.34% increase was
due to a 13% increase in the Group’s net sales of goods and services or about P946 million The
construction and infrastructure group’s revenues rose from about P2.9 billion in 2004 to about P4.4 billion
in 2005. This is on account of increased contracts and production orders during the year. Correspondingly,
related cost of sales and services increased by almost 13%. Interest and finance charges rose due to the
adoption of new accounting standards which required the Company’s preferred dividends to be treated as
interest charges. Other charges rose by 33% or P139 million due to the reclassification.
Cause for Material Changes from Period to Period of the Balance Sheet
Current Assets
Temporary Cash Investments increased by 29.40 % from P15.40 million in 2004 to P19.93 million in 2005
due to the available funds for placements exceeding three months.
Current portion of loans receivable declined by P77 million or 17% from the previous period as total loans
receivables from Malayan Leasing declined. Malayan Leasing had initiated a reduction of long outstanding
receivables by undergoing restructuring, sale, and discounting its loans receivables.
Accounts Receivables are higher at P1.80 billion as compared to the previous year’s P1.40 billion. The
increase of 28% was due to EEI’s higher level of receivables. EEI has experienced increased production
and contracts in 2005 than the previous year.
Contract Jobs in Progress increased to P957.05 million from last year’s P727.88 million mainly due to a
higher volume of contracts.
Available-for-sale securities-current portion amounting to P58.48 million was reclassified from the
Investment in Shares of Stock-Others account in 2004 due to the adoption of new accounting standards on
financial instruments.
Due from Related Parties decreased to P116.65 million in 2005 from P132.20 million in 2004 due to
intercompany payments to pay off working capital and share in general and administrative costs.
Land classified as held for sale amounting to P355 million was the result of EEI reclassifying their
Manggahan and Lemery properties to current assets. EEI intends to dispose these parcels of land by 2006.
Noncurrent Assets
Investment in associates amounting to P669 million in 2005 and in 2004 P642 million. The increase
between the intervening period was due to the share in the equity in net earnings of associates under the
equity method, net of disposals and dividends received.
Available-for-sale securities amounting to P452 million is a portion of the reclassification from Investments
in shares of stock – others in 2004 and Available-for-sale securities – current portion in 2005.
Property, plant, and equipment decreased to P3.60 billion from P4.03 billion or a decline of 11% was
mainly due to the reclassification to land classified as held for sale amounting to P355 million.
Loans receivable – net of current portion decreased to P136 million in 2005 from P174 million in 2004 or a
decline of 22%. This is related to the decrease in the Current portion of loans receivable account in the
current assets section.
31
Deferred income taxes increased from P114 million to P131 million due to the additional deferred tax
assets covering additional allowances for doubtful accounts, inventory obsolescence and other expenses
and provisions.
Goodwill decreased by 7.71% or P42.62 million due to additional provisions for impairment.
Other assets decreased to P190.56 million in 2005 from P340.45 million in 2004, or a 44.03% decrease.
This is mainly due to the decrease of Malayan Leasing’s assets held for sale from P133.35 million in 2004
to P77.41 million in 2005.
Liabilities
Accounts Payable and Accrued Expenses registered an 11.47% increase or P284.01 million in 2005
compared to 2004 level primarily due EEI’s increase in trade payables. Also included in this increase is the
declaration of dividends for preferred shares amounting to P94.64 million by HI’s Board of Directors. The
dividends covered the fourth quarter of 2004 and first to fourth quarters of 2005. Accrued interest
increased by P97.60 million from the previous year.
Current Portion of Long-Term Debt increased by P155.11 million or 46.31% from P334.91 million in 2004
to P490.02 million in 2005. Long-Term Debt decreased from P1.16 billion in 2004 to P875.16 million in
2005 or a decrease of 24.60%. On the aggregate, total long-term debt decreased by 8.72% or by P130.42
million. The aggregate decrease was mainly due to loans becoming due during the year.
Customers’ deposits increased by 61.50% or P150.15 million from P244.14 million in 2004 to P394.29
million in 2005 mainly due to EEI’s increasing number of production orders.
Convertible cumulative preferred shares amounting to P299.32 million in the current liabilities section and
P576.45 million in the non-current liabilities section pertain to the financial liability component of HI’s
preferred shares as required by PAS 39. The reclassification resulted in the decrease of the Company’s
capital stock by 44.57% from P1.80 billion in 2004 to P998.39 million in 2005.
Due to Related Parties increased by 21.87% or P5.00 million from P22.86 million in 2004 to P27.86
million in 2005 mainly due to accruals and bookings of inter-company liabilities.
Income Taxes Payable amounted to P10.08 million in 2005 lower by P10.18 million during the previous
year due to a lower taxable base for 2005.
Deferred income tax liabilities decreased by 18.40% or P15.63 million from P84.98 million in 2004
compared to P69.35 million in 2005. The decrease is due to the decline in EEI’s deferred tax liabilities
covering its revaluation increment in land from P67.71 million in 2004 to P59.45 million in 2005.
Stockholders’ Equity
Cumulative Translation Adjustment decreased by 30.28% or P9.06 million from P29.91 million in 2004 to
P20.86 million in 2005. This pertains to the share of the HI in the cumulative translation adjustment in
EEI.
Reserve for fluctuation in value of investments in noncurrent marketable equity securities was reclassified
to net accumulated unrealized loss in available-for-sale securities in compliance with PAS 32 and PAS 39.
The decrease from P108.81 million to P98.26 million was due to better market conditions prevailing at
balance sheet date.
32
Financial Condition
The consolidated balance sheets continues to improve from previous years as total assets increased to
P11.42 billion compared to the previous year of P11.27 billion. Current assets stood at P5.73 billion with
about P814.37 million in cash and other liquid investments.
•
Due to HI’s sound financial condition, there are no foreseeable trends or events which could have
material impact on its short-term or long-term liquidity.
•
Funding will be sourced from internally generated funds and borrowings.
•
There are no material commitments in capital expenditures other than those performed in the
ordinary of trade or business.
• There are no known trends, events or uncertainties that have had or that are reasonably expected to
have a material impact of the net sales, revenues or income from continuing operations.
• There are no significant elements of income arising from continuing operations.
• There is no material change from period to period in one or more line items of the financial
statements.
• There are no seasonal aspects that have a material effect on the financial condition or results of HI’s
operations.
In 2005, HI and its subsidiaries adopted the following relevant new and revised accounting standards:
•
•
•
•
•
•
•
•
•
•
PFRS 1, First Time Adoption of PFRS,
PFRS 3, Business Combinations
PFRS 5, Noncurent Assets Held for Sale and Discontinued Operations,
PAS 19, Employee Benefits
PAS 27, Consolidated and Separate Financial Statements
PAS 28, Investments in Associates
PAS 36, Impairment of Assets
PAS 32, Financial Instruments: Disclosure and Presentation
PAS 39, Financial Instruments: Recognition and Measurement
PAS 40, Investment Property
Adoption of the new accounting standards in 2005 resulted in restatement of prior year’s financial
statements. Additional disclosures required by the new accounting standards were included in the prior
year’s financial statements, where applicable.
2004 vs. 2003 Results of Operations
HI continued to improve in its performance in 2004. From a net income of P48.26 million (as restated) in
2003, net income jumped to P255.6 million by the end of 2004. The auto industry in general was greatly
affected by the entry of European and American car brands. The diverse consumer choices broadened
product availability. In addition, car sticker prices correspondingly adjusted with the revised tax scheme for
Asian Utility Vehicles (AUVs), which shifted demand to lower margin sedans. The revenue contributions
of the car divisions declined to P3.2 billion in 2004 from P4.7 billion in 2003. While gross margins for the
car divisions remained steady, their operating expenses decreased by only about P1.6 million. This resulted
in a 95% drop of division income from P134.7 million in 2003 to only P6.4 million in 2004.
Education and Information Technology made the most significant contributions with a P396.3 million in
net income
33
The Construction and Infrastructure Group improved their 2004 performance from a loss of P505.0 million
in 2003. It showed a P2.9 million net income.
EEI
EEI managed to post operating gains in spite of flat topline performance in view of the skewed recovery in
the construction market. Overall growth has not been favorable to EEI, which is positioned in the
industrial, power, oil and gas sectors.
In 2004, EEI posted consolidated revenues of P2.93 billion, practically the same as the P2.74 billion
recorded last year. Gross profit, however, improved dramatically from P17.47 million in 2003 to P410.2
million on the back of cost management and recovery efforts. Administrative and overhead expenses in
2004 is P363.84 million from P367.28 million in 2003 despite of the sustained rise in fuel and a new round
of wage increase during the year.
EEI recorded equity in earnings from affiliates, which the overseas joint venture company contributed and
other associate corporations, amounting to P245.7 million compared to the P37.6 million equity net losses
in 2003.
Thus, from the consolidated net loss before taxes of P505.08 million (as restated) in 2003, EEI ended 2004
with a positive consolidated net income of P2.9 million. Per share data shows an improvement to P0.0031
earnings per share in 2004 from a P0.5413 loss per share in 2003
MALAYAN LEASING
Malayan Leasing’s net income dropped to P10.4 million in 2004 from a high of P25.3 million in 2003.
The higher cost of borrowings, higher reserve requirements imposed by the BSP, and additional loan loss
provisioning to increase reserves contributed to the decrease in net income.
Operating expenses were at 35% of total revenues in 2004 compared with the 18% registered in 2003.
Malayan Leasing ended 2004 with a ROA of 1% and a ROE of 4%.
iPEOPLE
iPeople’s consolidated assets increased to P3.27 billion as of December 31, 2004, compared to P2.96
billion as of December 31, 2003. The movement came from the acquisition of two companies, Pan Pacific
Computer Center, Inc. with net assets of P3.01 million and Pandacan Properties, Inc. by MIT, a 93%
subsidiary, which resulted in the increase in land by P72.48 million. Furthermore, iPeoples’s policy to
record the land at revalued amount as an alternative recording allowed by the International Accounting
Standard 16 (IAS 16) reflected a revaluation increment of P15.06 million for the year.
iPeople provided an allowance for investment losses, which reduced its Investments account from P7.03
million in 2003 to P4.86 million in 2004.
iPeople reduced its outstanding loans. Current Loans Payable decreased from P447.27 million in 2003 to
P296.6 million while the Long Term Debts, net of current portion decreased from P799.22 million in 2003
to P778.59 million in 2004.
iPeople’s retained earnings increased to P1.02 billion as of December 31, 2004 from P0.79 billion on
December 31, 2003. The increase was due to the net income of P396.32 million in 2004, net of dividends
declared and paid amounting to P172.41 million, and adjustments on the effects of change in accounting
for income tax (SFAS 12/ IAS 12) on previous years amounting to P10.78 million.
Total revenues amounted to P1.36 billion, P1.32 billion, and P1.26 billion in 2004, 2003 and 2002,
respectively. The change in 2004 as compared to 2003 was contributed by the newly acquired company ,
the PPCCI.
34
Cost and Expenses amounted to P0.85 billion, P0.84 billion, and P0.91 billion for 2004, 2003 and 2002,
respectively. The implementation of cost reduction method of MIT executed in year 2003 is
conscientiously practiced. Thus, the increased from P37.14 million in 2003 to P40.35 million in 2004 on
cost of sales and increase in depreciation of P100.50 million in 2003 and P111.46 million in 2004 was
conveyed by the acquisition of the above mentioned newly acquired company.
Other Income (Charges) (net) amounting to (P57.66 million), (P68.67 million), and (P110.84 million) in
2004, 2003, and 2002, respectively, consists mainly of interest expense amounting to P138.15 million,
P135.47 million and P176.10 million, respectively, reduced by interest income of P77.55 million, P40.47
million and P31.26 million, respectively. The increase in the interest was due to the proper monitoring and
utilization of excess cash and cash equivalents. However, interest expense in 2002 showed a significantly
higher amount as compared to 2003 and 2004 because of higher interest rate in 2002 and payment of
principal loan in the succeeding years.
iPeople’s results of operations showed an income before income tax and minority interest of P454 million,
P410.31 million, and P235.00 million in 2004, 2003, and 2002, respectively. Because of the increase in its
income before income tax, the Company’s provision for income tax also increased to P49.53 million,
P45.36 million, and P29.45 million in 2004, 2003, and 2002, respectively. Consequently, iPeople’s net
income amounted to P205.55 million in 2002, P364.95 million in 2003, and P396.32 million net of
minority interest of P8.16 million in 2004.
HONDA CARS KALOOKAN, INC. (HCKI)
Despite forecast revisions at the start of the second semester of 2004, HCKI missed its targeted sales
revenue by 2%. This is due to the weak sales in the last quarter of 2004. Net sales dropped to P1.23
billion in 2004 from P1.6 billion last year. Vehicle sales in 2004 were at P1.09 billion, down by 21% from
2003 while Parts Sales stood at P26.0 million shrinking by 16% against that of last year. Service revenues,
however, reached P138.8 million growing by 1% compared to that of the previous year. Total gross profit
of P110.9 million for 2004, indicative of the weak sales for most part of the year, was down 8% against the
revised 2004 budget and 25% below that of last year. Vehicle sales’ gross profit of P48.7 million was 14%
below the revised budget owing to the slow sales in the last quarter, while the gross profit from parts sales
was down 3% against budget due to fewer units sold than anticipated. Service revenue gross profits of
P56.7 million, while still 3% lower than budget contributed in absorbing the overheads.
Cost management of overheads yielded 5% savings in total operating expenses compared to budget. The
strict adherence to the agreed promo package and a tight watch on freebies helped the HCKI bring down its
promotion expenses by 9% against budget. Maximizing the available manpower and going over each
expense with the objective of bringing down cost not only enabled the HCKI to maintain last year’s level
but even resulted to a 3% savings against budget.
Collateral income posted was at P19 million. It surpassed the budget by 15% but was 15% lower than that
of last year. Although sales of new policies dropped by 20%, booking of renewal policies grew by 9% as
compared to budget, the commission from bank financing referrals exceeded budget by 5%, and the income
derived from sales of LTO services, rust proofing services and sales of pre-owned vehicles exceeded
budget by almost P2.3 million. HCKI’s net income for the year of P8.3 million missed the revised budget
by 10%.
LANDEV CORPORATION
Landev posted P25.84 million in total revenues for the year 2004. This is a 37% increase over previous
year’s total revenues of P16.29 million.
Property and Project Management fees accounted for 69% of Landev’s total revenues, while other
operating income contributed 30% and the remaining 1% came from interest income.
35
Cause for Material Changes from Period to Period of the Income Statement
Revenues decreased to P9.23 billion in 2004 from P10.78 billion in 2003. The 14.41% decrease was due
to the decline in the volume sales of the car dealerships. Stiffer competition, introduction of newer car
models, and the entry of more car brands contributed significantly to the decline. Correspondingly, related
cost of sales and services declined. The continuous cost management of the HI and its subsidiaries saw a
decline in its operating expenses.
Cause for Material Changes from Period to Period of the Balance Sheet
Current Assets
Cash and Cash Equivalents amount to P838.93 million, 41% higher than the previous year’s P596.91
million on account of dividend declarations by investments and affiliates and well as receivable
collections.
Temporary Cash Investments decreased by 27.19 % from P21.16 million in 2003 to P15.41 million in 2004
due to the lower interest rates for placements exceeding three months.
Accounts Receivables are lower at P1.40 billion as compared to the previous year’s P1.71 billion. The
decrease of 18% was due to effective collection process as well as the decline in the car dealerships’
revenues.
Contract Jobs in Progress increased to P727.88 million from last year’s P301.47 million mainly due to a
higher volume of contracts.
Receivables from Related Parties decreased to P190.14 million in 2004 from P229.05 million in 2003 due
to intercompany payments to pay off working capital and share in general and administrative costs.
Land held for sale increase from P492.53 million to P548.64 million is due to the increase in the saleable
portion of the development projects undertaken by EEI Realty, on its own or with Greenfield and
Robinson’s Homes Incorporated.
Noncurrent Assets
Investments and advances account increased by 28.93% or from P1.21 billion to P0.94 billion was due to
the share in the equity in net earnings of associates under the equity method.
Land Held for Development decreased by 49.80% or P72.74 million mainly due to reclassification from
noncurrent assets to current assets.
Loans Receivables, net of current portion, decreased by 30.26% from P249.81 million in 2003 to P174.21
million in 2004 due to reclassification of receivables becoming due within the year and additional
allowance for probable losses.
Liabilities
Loans Payable decreased by P317.04 million or 9.72% from P3.26 billion in 2003 to P2.95 billion in 2004.
The decrease was mainly due to loan amortization payments.
Long-term Debt decreased by 14.77% or P265.28 million from P1.80 billion in 2002 to P1.53 billion in
2004 mainly due to direct payments.
Current Portion
Non-current Portion
Total
2004
P370.20 million
1,160.70
P1,530.90 million
2003
P305.78 million
1,490.40
P1,796.18 million
36
Accounts Payable and Accrued Expenses registered a 16.09% increase or P259.19 million in 2004
compared to 2003 level primarily due EEI’s P300 million increase in trade payables.
Income Taxes Payable amounted to P31.62 million in 2004 lower by P11.36 million during the previous
years as there was an increase in taxes withheld at source coupled with lower taxable income from the
business segments at the 32% corporate tax regime.
Due to Related Parties decreased by 21.84% or P6.39 million from P29.25 million in 2003 to P22.86
million in 2004 mainly due to payments of inter-company liabilities.
Unearned Tuition Fees increase 485.63% or P104.87 million from P21.59 million in 2003 compared to
P126.47 million in 2004. The increase is due to a timing difference of enrollment for the 3rd quarter of
school semester 2004-2005, which falls on the last week of December 2004 instead of the regular period of
1st week of January.
Deferred tax liabilities increased to P84.98 million from P59.16 million mainly due to the additional
revaluation increment in land owned by a subsidiary.
Stockholders’ Equity
Capital Stock decreased by 14.32% or P301.02 million due to the reduction in the par value of the
Company’s common stock in order to wipe out the audited deficit as of December 31, 2003 of P167.23
million. The said reduction resulted in the increase in the Additional Paid-in Capital account. An
additional increase of P2.98 million to in Paid-in Capital was also due to the effect of the unrealized gain
on the sale of HI’s Malayan Leasing’s interest to an affiliate.
Reserve for fluctuation in value of investments decreased by 11.13% or P13.63 million due to appreciation
of market values of HI’s marketable equity securities.
Cumulative Translation Adjustment increased by 148% or P17.9 million from P12.05 million in 2003 to
P29.9 million in 2004. This pertains to the share of the HI in the revaluation increment in property and
cumulative translation adjustment in EEI.
The Deficit of P167.23 million in 2003 was wiped out and a retained earnings of P261.59 million as of
December 31, 2004 was due to the approved reduction of HI’s common stock, the effectivity of new
accounting policies, declaration of dividends to preferred shares amounting to P17.98 million, and the
audited net income of P274.32 million.
Material Off-Balance Sheet Transactions, Arrangements, Obligations, and Other Relationships
No material off-balance sheet transactions, arrangements, obligations (including contingent obligations),
and other relationships with unconsolidated entities or other persons were created as of December 31, 2005.
Any commitments and contingencies by HI and its subsidiaries are disclosed in the Notes to Consolidated
Financial Statements under Note 26.
Item 7. Financial Statements
The audited financial statements as of December 31, 2005 are attached hereto. The Statement of
Management Responsibility and Schedules Required under Part IV of Rule 68 Schedules will be included
in this Annual Report Form 17-A.
37
Item 8. Information on Independent Accountant and other Related Matters
External Audit Fees and Services
The external audit fees and services covering the Parent Company only for the year 2005 and 2004 were as
follows:
Audit Fees
Audit-Related Fees
Tax Fees
All Other Fees
Year Ended
December 31, 2005
P 1,252,000
P 1,252,000
Year Ended
December 31, 2004
P 1,139,000
P 1,139,000
Audit fees covering the HI’s two subsidiaries, iPeople, inc. and EEI, are disclosed in their respective
reports.
Aside from the audit of HI’s Annual Financial Statements, HI has not engaged the professional services of
its external auditors, SyCip, Gorres, Velayo & Company (SGV & Co.), in any other matter.
Audit services provided by SGV & Co. have been pre-approved by the Audit Committee. The Audit
Committee has reviewed the extent and nature of these services to ensure that they are compatible with
maintaining the independence of the external auditor.
Changes in and Disagreements with Accountants on Accounting and Financial Disclosure
There is no disagreement with accountants on accounting and financial disclosure.
The external auditors of the Company is the accounting firm of Sycip Gorres Velayo & Co (SGV & Co).
The same accounting firm is being recommended for re-election at the scheduled annual meeting for almost
the same remuneration as in the previous year.
Representatives of SGV & Co for the current year and for the most recently completed calendar year are
expected to be presented at the Annual Stockholders’ Meeting. They will have the opportunity to make a
statement if they desire to do and are expected to be available to respond to appropriate questions.
PART III – CONTROL AND COMPENSATION INFORMATION
Item 9. Directors and Executive Officers of the Issuer (As of December 31, 2005)
HI’s Board of Directors (BOD) is composed of eleven (11) members elected by and from among the HI’s
stockholders. The Board is responsible for providing overall management and direction of HI. Board
meetings are held on a regular basis or as often as required to discuss HI’s operations, business strategy,
policies and other corporate matters. Write-ups below include positions currently held by the directors and
executive officers, as well as positions held during the past five years.
38
Board of Directors
Helen Y. Dee
Andrew Gonzalez FSC*
Francisco H. Licuanan II*
Rizalino S. Navarro
Roberto F. de Ocampo*
Teodoro Q. Pena*
Wilfrido E. Sanchez*
Susanne Y. Santos
Renato C. Valencia*
Isabel Caro Wilson*
Yvonne S. Yuchengco
Amb. Alfonso T. Yuchengco
* Independent Directors
Helen Y. Dee, 61, Filipino, has served as Chairperson of the Board of Directors, President, and CEO of HI,
since November 2001. She is also the Chairman/President of Hydee Management Resources, Inc.,
Grepalife Fixed Income Fund Corporation and, Grepalife Asset Management Corporation. Her other
significant positions include: Chairperson & CEO of Tameena Resources, Inc., Chairperson of Rizal
Commercial Banking Corporation, Landev Corporation, Manila Memorial Park Cemetery, Inc., HI-Eisai
Pharmaceutical, Inc., Mapua Information Technology Center, Inc., Universal Malayan Reinsurance
Corporation, Vice Chairperson of Zurich Insurance (Taipei) Ltd., Director of RCBC Savings Bank,
Philippine Long Distance Telephone Co., Petro Energy Resources Corporation, South Western Cement
Corporation, Seafront Resources Corporation, Malayan Insurance Co., Inc., MICO Equities, Inc., Ecozone
Development Corporation, Director and ExCom Member of Nippon Life Insurance Company of the
Philippines, Inc., President of Nth Millenium Foundation of the Philippines, Moira Management, Inc.,
Equitas Insurance Brokers, Inc., YGC Corporate Services, Inc., La Funeraria Paz, Inc., and Trustee of
Mapua Institutue of Technology and Philippine Harmonic Society, Inc., Board Member of Hermoza
Ecozone Development Corporation, Director and Vice Chairperson of Pan Malayan Management &
Investment Corporation
Francisco H. Licuanan II, 62, Filipino, was elected as an Independent Director last March 30, 2006 vice
Andrew Gonzalez. He is also the President and Chief Executive Officer of Innovative Property Solutions,
Inc.. His other significant position for the last five years include: Adviser, Subic-Clark Area Development
and Chairman, Subic Bay Metropolitan Authority (October 2004 to October 2005), Senior Adviser of
Ayala Land, Inc. (July to September 2004) and, President and Chief Executive Officer of Ayala Land, Inc.
(September 1988 to June 2004)
Rizalino S. Navarro, 67, Filipino, currently the Executive Vice Chairman of the Board and CEO of Rizal
Commercial Banking Corporation. He was the Chairman of the Board and CEO of the Company from Sept.
1997 to November 2001. He served as Secretary of Trade and Industry from 1992 to 1996 and as a member
of the Monetary Board from 1992 to 1997. He also serves as the Chairman of Clark Development
Corporation, EEI Corporation, Bankard Corporation, Philippine Fuji Xerox Corporation, Upline Food
Corporation, Seafront Resources Corporation, Trustee of Mapua Institute of Technology and AY
Foundation, and Director of Great Pacific Life Assurance Corporation, Malayan Insurance Co., Inc., YGC
Corporate Services, Inc., and Petro Energy Corporation.
Roberto F. de Ocampo, 60, Filipino, President of Asian Institute of Management from September 1999 to
present. He was the Secretary of Finance and Governor, Board of Governors of World Bank and Asian
Development Bank from February 1, 1994 to January 31, 1998. He was also the Chairman of APEC
Finance Ministers and Asean Finance Ministers from 1997 to 1998, Chairman of Land Bank of the
Philippines, Phil. Deposit Insurance Corp., Phil. Export & Foreign Loan Guarantee Corp., and Committee
on Privatization from February 1, 1994 to January 31, 1998.
Teodoro Q. Pena, 73, Filipino, was elected as Director of HI in July 15, 2005 vice Ms. Gloria L. Tan
Climaco. He also serves as Independent Director and Chairman of the Audit Committee of Rizal
Commerical Banking Corporation, RCBC Savings Bank, RCBC Capital Corporation, RCBC Securities
Corporation, and EEI Corporation. His other significant positions include: Independent Director of
Bankard, Inc., Director of Seafront Resources Corporation, Chairman of the Board of Pena Development
Company, Inc., Vice President of the Philippine Constitution Association, Regent of Palawan State
University, and Fellow of Institute of Corporate Directors.
39
Wilfrido E. Sanchez, 69, Filipino, Tax Counsel of Quiason, Makalintal, Barot, Torres and Ibarra Law
Office from 1994 to present. He is also the Director of EEI Corporation, Grepalife Asset Management
Corporation, Grepalife Fixed Income Fund Corporation, JVR Foundation, Inc., Kawasaki Motor
Corporation, Center for Leadership & Change, Inc., Adventure International Tours, Inc., Philippine
Educational Trust Plan, Inc., Transnational Plans, Inc., Dolphin Ship Management, Inc., Transnational
Diversified Group, Magellan Capital Holdings Corporation, Legenda International Resorts, Omico
Corporation, Amon Trading Corporation, and Universal Robina Corporation.
Susanne Y. Santos, 58, Filipino, is the Chairperson and Director of RCBC Savings Bank and Pan Malayan
Realty Corporation. She is also currently the Director and Member of the Executive Committee of RCBC.
A Vice Chairperson, Director, and Executive Committee Member of Great Pacific Life Assurance
Corporation, she also is the Director and President of GPL Holdings, Inc. and AY Foundation, Inc. She
presently serves as Director and Vice President of MICO Equities, Inc., Pan Malayan Management and
Investment Corporation, and Enrique T. Yuchengco, Inc. She serves as the Director of Manila Memorial
Park Cemetery, Inc. and Pan Malayan Travel and Tours, Inc.
Renato C. Valencia, 64, Filipino, was elected as an Independent Director of HI last March 17, 2005 vice
Mr. Leonardo B. Alejandrino. He is the Vice Chairman of Asia Pacific Network Holdings, Inc. and Habitat
for Humaity Foundation Philippines and Director of Bases Conversion Development Authority, Fort
Bonifacio Development Corporation, Malayan Insurance Co., Inc., Metropolitan Bank & Trust Co., Roxas
and Company, and Roxas Holdings, Inc. He is also the Chairman of iPeople, inc. and Member of the Civil
Aeronautics Board.
Isabel Caro Wilson, 75, Filipino, the Chairman of the Board of Business Machines Corporation, Rhine
Marketing Corporation, Rhine Plans, Metals Engineering Resources Corporation, Carson Corporation and
Carson Holding & Development Corporation. She is also the Senior Advisor for Spain and Portugal,
Philippine Chamber of Commerce and Industry and Director of the Philippine Spanish Business Council.
She served as Philippine Ambassador to Spain from May 1993 to November 1998.
Yvonne S. Yuchengco, 52, Filipino, is the President and Director of Malayan Insurance Company, Inc. and
MICO Equities, Inc.. She is also the Chairperson and President of RCBC Capital Corporation. She is the
Chairperson and Director of Tokio Marine Malayan Insurance Co. and the Philippine Integrated
Advertising Agency, Inc.. She also serves as the Director of Pan Malayan Realty Corporation, Malayan
Insurance (UK), Malayan Insurance (HK), Malayan International Insurance Corporation, Manila Memorial
Park, Inc., La Funeraria Paz, Inc., Nippon Life Philippines, Inc., Mapua Institute of Technology, La
Funeraria Paz Sucat, Inc., iPeople, inc., Petro Energy Resources Corporation, Seafront Resources
Corporation, Universal Malayan Reinsurance Corporation, and Malayan High School of Science, Inc.. Her
other affiliations, among others, include: Treasurer and Director of Pan Malayan Management and
Investment Corporation and Honda Cars Kalookan, President of PIA/Phil-Asia Assistance Foundation, Inc.,
Assistant Treasurer of Enrique T. Yuchengco, Inc., Senior Executive Vice President and Director of Great
Pacific Life Assurance Corporation, Advisory Board Member of Rizal Commercial Banking Corporation,
and Member of the Board of Trustees of AY Foundation, Inc..
Amb. Alfonso T. Yuchengco, 83, Filipino, was an Ex-officio Director of HI in 2004. He was elected as
HI’s Director in September 7, 2005 vice Mr. Carlos G. Dominguez. He is also an Honorary Chairman of
Rizal Commercial Banking Corporation, the MICO Group, Philippine Ballet Theatre. He serves as the
Chairman and CEO of Pan Malayan Management and Investment Corporation, Chairman of the Board of
AY Foundation, Inc., Yuchengco Center, Inc., Bantayog ng mga Bayani, Bayanihan Foundation, Master of
Business Administration(MBA) – Juris Doctor (JD) dual degree program of De La Salle University
Professional Schools, Inc., Graduate School of Business and Far Eastern University Institute of Law,
Enrique T. Yuchengco, Inc., GPL Holdings, Inc., Honda Cars Kalookan, Inc., MICO Equities, Inc., Nippon
Life of the Philippines, Inc., RCBC Land, Inc., YGC Corporate Services, Inc., Member of the Advisory
Board of Waseda Institute of Asia Pacific Studies, Ritsumeikan Asia Pacific University, University of
Alabama, Culverhouse College of Commerce and Business Administration, and Philippines-Japan
Economic Cooperation Committee, Chairman of the Advisory Board of Corporate Governance Institute of
the Philippines, Confederation of Asia-Pacific Chambers of Commerce and Industries (CACCI), Chairman
and Member of the Board of Governors Conferred Chairman Emeritus of the Philippine Ambassadors
Foundation, Vice Chairman of the Board of Judges of the Mother Teresa Awards, Member and Honors
40
Committee of International Insurance Society (IIS), Director of Philippines-Japan Society, Incorporated
and Great Pacific Life Assurance Corporation, Member of the Board of Trustees of McLaren School of
Business, University of San Francisco, USA, Member of the Board of Overseers of the Columbia
University, Business School, New York, USA, Member of the Board of Governors of Pacific Forum, and
Member of the Board of Trustees of University of St. La Salle Affiliate College, Roxas City. His past
positions for the last five years include: Chairman of the Board of the Yuchengco Group of Companies
(1998 to 2001), Chairman of the Board of Rizal Commercial Banking Corporation (1998 to June 2001 and
June 2004 to June 2005), Honorary Chairman of the Board of Great Pacific Life Assurance Corporation
(1998 to 2001), Chairman of GPL Holdings, Inc. (1992 to 2001), YGC Corporate Services, Inc. (1999 to
2001), Asian Bankers Association (2003 to 2004), Vice Chairman of the Board of Bantayog ng mga Bayani
(1998 to 2005), Chairman of the Board of Trustees of Mapua Institute of Technology (1999 to September
2001), and Member of the Board of Trustees of The Asia Society, New York (1995 to 2002).
Resignation of Directors
To date, no director has resigned or declined to stand for re-election for the Board of Directors due to any
disagreement with the Corporation relative to the Corporation’s operations, policies and practices.
Management Committee
Members / Key Officers
Helen Y. Dee*
Perry Y. Uy
Porfirio S. de Guzman, Jr.
Germaine C. Gochioco
Alfonso S. Yuchengco, Jr.
Jose Ma. G. Castillo III
Cecille V. Huidem
Alexander Anthony G. Galang
Luis H. Dado
Damito D. Magpantay
Samuel V. Torres**
Guia Margarita Y. Santos**
Position
Chief Executive Officer
Executive Vice President
Senior Vice President
Senior Vice President – HRD / Legal
Vice President
Senior Vice President - Finance
Treasurer
Vice-President – Human Resources
Vice-President
Assistant Vice-President
Assistant Vice-President
Corporate Secretary
Corporate Secretary
&
Age
Citizenship
61
60
67
41
54
62
Filipino
Filipino
Filipino
Filipino
Filipino
Filipino
47
44
46
34
41
35
Filipino
Filipino
Filipino
Filipino
Filipino
Filipino
* Member of the Board
** Appointed by the Board on March 30, 2006 vice Guia Margarita Y. Santos who resigned effective February 16, 2006.
For the past seven (7) years, Mr. Perry Y. Uy, Mr. Porfirio S. de Guzman, Jr., Mr. Alfonso S. Yuchengco,
Jr., and Mr. Jose Ma. G. Castillo III have been officers of HI and have held the positions indicated opposite
their respective names. Ms. Germaine C. Gochioco became Senior Vice-President HR/ Legal last July
2002 and Ms. Cecille V. Huidem become Vice-President Human Resources effective September 01, 2003.
On December 1, 2004, Mr. Alexander Anthony G. Galang was appointed as Vice President of HI.
Luis H. Dado, 46, Filipino, is an Assistant Vice President in HI and currently seconded to MCI as head of
the Human Resources and Legal. His other past affiliations, among others, include: Regional Director of
Human Resources, FilBarcelo Hotels and Properties Management Corporation, Founding Partner of
Cayetano Sebastian Ata Dado and Cruz Law Office, Associate of Bautista Picazo Buyco Tan and Fider
Law Offices, Administration Manager of Dyno Nobel Philippines, Inc., Legal Counsel of Pepsi-Cola
Products Philippines, Inc., Legal Office of Social Security System, and Managing Partner of CASELAW.
Damito D. Magpantay, 34, Filipino, is an Assistant Vice President of HI starting September 2005 and
currently seconded to MCI as its Controller. He also served as Finance Manager in Lyceum of the
Philippines (September 2003 to September 2005), Finance and Administration Manager of Isuzu
Automotive Dealership, Inc. (April 2002 to September 2003), and Manager (Corporate Loans and Stocks
Administration Investment Administration Department of Philamlife (October 1995 to April 2002)
Samuel V. Torres, 41, Filipino, is the Corporate Secretary effective March 30, 2006 replacing Guia
Margarita Y. Santos and currently the General Counsel / Corporate Secretary of Pan Malayan Management
41
& Investment Corporation. His other present positions include: Corporate Secretary of iPeople, inc,,
Bankard, Inc., Pacific Plans, Inc., E. T. Yuchengco, Inc., First Malayan Leasing and Finance Corporation,
GPL Cebu Tower Office Condominium Corporation, GSA Air Travel, Inc., RCBC Capital Corporation,
RCBC Forex Brokers Corporation, RCBC Realty Corporation, RCBC Securities, Inc., Assistant Corporate
Secretary of First Nationwide Assurance Corporation, Malayan Insurance Co., Inc., Malayan Reinsurance
Corporation, Malayan Zurich Insurance Corporation, MICO Equities, Inc., and Tokio Marine Malayan
Insurance Corporation, and International Counsel, South Pacific for Federal Express Corporation (March
2000 to October 2001)
The Directors of HI are elected at the annual stockholders’ meeting to hold office until the next succeeding
annual meeting or until their respective successors have been elected and qualified.
Officers are appointed or elected annually by the Board of Directors at its first meeting following the
Annual Meeting of Stockholders, each to hold office until the corresponding meeting of the Board of
Directors in the next year or until a successor shall have been elected, appointed or shall have qualified.
The Company is not aware of (a) any bankruptcy petition filed by or against any business of which any of
its director or executive officers was a general partner or executive officer either at the time of bankruptcy
or within two (2) years prior to that time except the petition for rehabilitation filed with Makati Regional
Trial Court by Pacific Plans Inc. where Ms. Yvonne S. Yuchengco and Mr. Porfirio S. de Guzman, Jr.
served as its former Senior Executive Vice President and Vice President Treasurer and the petition for
rehabilitation filed with the General Santos City Regional Trial Court by T’boli Agro Industrial
Development, Inc. where Mr. Jose Mari G. Castillo III was its former Treasurer, (b) any conviction by final
judgment of any director or senior executive in a criminal proceeding domestic or foreign or being subject
to a pending criminal proceeding domestic or foreign, of any director, executive officer or person
nominated to be a director, (c) any director or senior executive being subject to any order, judgment or
decree not subsequently reversed suspended or vacated of any court of competent jurisdiction, domestic or
foreign permanently or temporarily enjoining barring, suspending or otherwise limiting such directors’ or
executive officer’s involvement in any type of business securities, commodities or banking activities, (d)
any executive officer or director found by a domestic or foreign court of competent jurisdiction, the
Commission or other foreign body or a domestic or foreign Exchange or other organized trading market or
self-regulatory organization to have violated a securities or commodities law or regulation and the
judgment has not been reversed, suspended, or vacated.
Family relations - Messrs. Helen Y. Dee, Alfonso S. Yuchengco, Jr., Ms. Yvonne S. Yuchengco and Ms.
Susanne Y. Santos are siblings. Atty. Guia Margarita S. Qua is the daughter of Director Susanne Y. Santos.
SIGNIFICANT EMPLOYEE
There is no person who is not an executive officer that is expected by the issuer to make a significant
contribution to the business.
42
Item 10. Executive Compensation
Information as to the aggregate compensation paid or accrued during the last two fiscal years and to be paid
in the ensuing fiscal year to the Company’s Chief Executive Officer and other officers follows:
Summary of Annual Compensation Table (In Million Pesos)
NAME
Total
Compensation
of Chief
Executive
Officer and
Senior
Executive
Officers2
YEAR
2006*
All other
officers and
directors as a
group unnamed
TOTAL
SALARY
P15.3
BONUS
-
OTHERS
-
TOTAL
P15.3
-
14.2
2005
14.2
2004
14.2
0.6
-
14.8
2006*
P8.62
-
-
P8.62
2005
7.70
-
7.70
2004
6.91
0.3
-
7.21
2006*
P23.92
-
-
P23.92
2005
21.90
-
-
21.90
2004
21.11
0.90
-
22.01
*Estimated Compensation of Directors and Executive Officers for the ensuing year
The table identifies executive officers in terms of salaries and their corresponding aggregate compensation
from 2004 to 2005 and projected salaries for 2006. It also states the aggregate compensation of all officers
and directors as a group.
The independent members of the Board of Directors are entitled to P25,000 per diem for attendance in any
regular and special meeting.
There are no other arrangements pursuant to which any director of HI was compensated, or is to be
compensated, directly or indirectly, other than those stated on the above table during HI’s last completed
fiscal year and the ensuing year for any service provided as an executive officer or member of the Board of
Directors.
Item 11. Security Ownership of Certain Beneficial Owners and Management
a.) Security Ownership of Certain Record and Beneficial Owners
As of March 31, 2006, HI knows of no one who beneficially owns in excess of 5% of HI’s common and
preferred stocks, except as set forth in the table below:
1.
Common Stock
2
The Chief Executive Officer and Senior Executive Officers are as follows: Helen Y. Dee, Perry Y. Uy, Porfirio S. de Guzman, Jr.,
Germaine C. Gochioco, Gene C. de Jesus, and Jose Ma. G. Castillo III
43
Title of
Class
Common
Common
Common
Common
Name of Record of
Beneficial
Owner/Relationship
Pan Malayan
Management &
Investment Corp. –
Affiliate
48th Flr, RCBC Plaza,
6819 Ayala Ave., Makati
City
PCD Nominee Corp. –
None
G/F MSE Bldg., 6767
Ayala Ave., Makati City
PCD Nominee Corp. –
None G/F MSE Bldg.,
6767 Ayala Ave., Makati
City
Great Pacific Life Ass.
Corp. - Affiliate
Grepalife Bldg., 221 Sen.
Puyat Ave., Makati
Name of
Beneficial
Owner
Record of
Beneficial
Ownership (PHP)
Percent
Citizen
ship
Filipino
294,758,335 “r”
48.96%
Filipino
*122,391,144 “r”
20.33%
NonFilipino
*41,474,005”r”
6.89%
Filipino
39,383,860 “r"
6.54%
*As of March 31, 2006 No Philippine Central Depository, Inc. (PCD) participant owns more than
5% of outstanding shares of HI
2.
Preferred Stock
Title of Class
Preferred
Name of Record of
Beneficial
Owner/Relationship
Alfonso T.
Yuchengco #29 Tamarind Road
Forbes Park, Makati
City
Pan Malayan
Management &
Investment Corp. –
Affilate
48th Flr RCBC Plaza,
6819 Ayabla Ave.,
Makati City
Name of
Beneficial
Owner
Citizenship
Record of Beneficial
Ownership (PHP)
982,763,820 “r”
Percent
52.76%
Filipino
674,708,326 “r”
36.22%
Filipino
44
b.) Security Ownership of Management: Securities beneficially owned by the directors and nominees
other than qualifying shares as of March 31, 2006 as per records of its stock transfer agent, Rizal
Commercial Banking Corp. (RCBC):
Directors/Nominees
Francisco H. Licuanan II**
Director
Rizalino S. Navarro
Director
Roberto F. de Ocampo
Director
Teodoro Q. Pena
Director
Wilfrido E. Sanchez
Director
Susanne Y. Santos
Director
Renato C. Valencia*
Director
Isabel Caro Wilson
Director
Amb. Alfonso T. Yuchengco***
Yvonne S. Yuchengco
Director
TOTAL COMMON
TOTAL PREFERRED
* Elected on March 17, 2005
** Elected on March 30, 2006
*** Elected on September 5, 2005
Officers
Helen Y. Dee
Chairperson/CEO/Director/President
Perry Y. Uy
Executive Vice-President
Porfirio S. de Guzman, Jr.
Senior Vice President
Alfonso S. Yuchengco, Jr.
Vice President
Jose Ma. G. Castillo III
Senior Vice President-Finance/ Treasurer
TOTAL COMMON
TOTAL PREFERRED
Title of Class
Common
Nature of
Ownership
Record
No. of
Shares
500
Percentage
Common
Record
5
0.0000
Common
Record
5
0.0000
Common
Record
500
0.0001
Common
Record
5
0.0000
Common
Preferred
Common
Indirect
Record
Record
424,450
282
1,000
0.0705
0.0000
0.0002
Common
Preferred
Common
Preferred
Common
Preferred
Record
Record
Record
Record
Record
Record
3,723,970
1,429,926
508,590
982,763,820
90,210
188
4,749,235
984,194,216
0.6285
0.0008
0.0845
52.76
0.0150
0.0000
0.7889
52.8347
Title of Class
Nature of
Ownership
Common
Common
Preferred
Record
Record
Record
1,125,345
10
181
0.1869
0.0000
0.0000
Common
Common
Preferred
Record
Record
Record
5,000
90,210
19
0.0008
0.0150
0.0000
Common
Record
10,000
1,230,565
200
0.0017
0.2044
0.000
No. of
Shares
0.0001
Percentage
Item 12. Certain Relationships and Related Transactions
There is no director, executive officer, nominee for director, beneficial holder, or family members involved
in any business transaction of HI.
In the normal conduct of business, aside from transactions disclosed in audited financial statements Note 14
(Loans Payable) and Note 15 (Long-term Debt), other transactions with certain affiliates include share in
general and administrative expenses and cash advances.
The year ended balances with respect to related parties included in the financial statements, are as follows:
45
2005
Due from related parties (net of doubtful
accounts of P242,922,572 in 2005 and P314,812,634 in
2004)
Payables to related parties
Loans payable - Related Party Bank
Long-term debt – Related Party Bank
P
=116,653,914
27,861,305
1,254,129,163
953,357,935
2004
P
=132,200,074
22,866,598
952,449,853
1,236,343,410
Interest rate for loans payable to a related party bank ranges from 10% to 15% and 9% to 15% in 2005 and
2004, respectively. Interest rate on long-term debt to a related party bank ranges from 11% to 15% in 2005
and 10% to 16% in 2004.
PART IV - CORPORATE GOVERNANCE
Item 13. Corporate Governance
House of Investments, Inc. has adopted the Manual on Corporate Governance. HI ensures and maintains
the compliance of the Board of Directors, top management and staff by establishing systems and measures
such as observance of Code of Ethics, Financial and Manpower Audit, providing seminars and conferences
to comply with all relevant laws, regulations and codes of ethics for business practices. HI maintains its
system of checks and balances.
HI has complied with the appropriate self-rating assessments and performance evaluation to determine and
measure the compliance with Company’s Manual on Good Governance.
There is no deviation from the Manual on Good Governance.
The Company continuously monitors all relevant PSE and SEC Circulars on Corporate Governance that
maybe used to improve its Manual for Corporate Governance.
PART V - EXHIBITS AND SCHEDULES
Item 14. Exhibits and Reports on SEC Form 17-C
SUMMARY OF SEC FORM 17-C
July 15, 2005
•
•
•
•
•
•
Acceptance of the resignation of Ms. Gloria Tan Climaco effective April 26, 2005
Approval of the declaration and payment of a P37.34 million cash dividend. Dividend covers
the 4th quarter of 2003 and 1st quarter of 2004. Record date is August 5, 2005 and payment
date is August 31, 2005.
Election of the Board of Directors of the Company for 2005-2006
Reappointment of SGV & Co. as external auditors for the fiscal year ending 2005.
Organizational meeting electing the officers of HI and the appointment as Chairmen/members
of the various committees
Notice by fax from Mr. Carlos G. Dominguez, an independent director, of his unavailability
to stand for re-election as director of HI. However, he was re-elected as independent director
of HI at its annual stockholders’ meeting held July 15, 2005 and his fax message came after
the adjournment of the said meeting. His replacement will be made after duly elected.
46
September 7, 2005
•
•
•
Resignation of Mr. Carlos G. Dominguez as Director and member of the Compensation
Committee
Election of Amb. Alfonso T. Yuchengco as Director and Mr. Renato C. Valencia as member
of the Compensation Committee vice Mr. Dominguez
Approval of the declaration and payment of a P42.18 million cash dividend to the
stockholders of HI-preferred shares. Record date is on October 5, 2005 and payment date is
October 31, 2005.
November 17, 2005
•
Inform of the demise of Atty. Rosula P. Lawenko, Asst. Corporate Secretary of HI, on
November 16, 2005. Her replacement will be made as soon as the Board of Directors
appoints one.
December 1, 2005
•
Commencement of the delivery of the notice to all the Preferred Stockholders of the Company
regarding the redemption of 1/3 of the outstanding preferred shares of stock at a price of
P0.40 per share plus any unpaid dividends subject to a put option by the holders.
December 7, 2005
•
•
Approval of the declaration and payment of P94.64 million cash dividends to the
stockholders of HI-preferred shares. Record date is December 22 and payment date is on
January 19, 2006.
Approval of the appointment of Atty. Samuel V. Torres as Assistant Corporate Secretary of
HI vice Atty. Rosula P. Lawenko.
January 30, 2006
•
Informed the demise of Bro. Andrew A. Gonzalez, FSC, a member of the Board of Directors
on January 29, 2005
February 6, 2006
•
Resignation of Atty. Guia Y. Santos as Corporate Secretary effective February 15, 2006. Her
replacement will be made as soon as the Board of Directors appoints one.
March 22, 2006
•
Informed of the results of the recently concluded redemption exercise of up to 1/3 of the
outstanding preferred shares preferred shares of stock which is subject to a put option by the
holders. Thirty eight preferred stockholders exercised their rights to have up to 1/3 of their
outstanding preferred shares redeemed by the Company. The total number of preferred shares
redeemed is 382,139,874 shares.
47
HOUSE OF INVESTMENTS, INC.
INDEX TO FINANCIAL STATEMENTS AND SUPPLEMENTARY SCHEDULES
FORM 11-A, Item 7
December 31, 2005
Page No.
FINANCIAL STATEMENTS
Statement of Management’s Responsibility for Financial Statements ............................…….
Report of Independent Public Accountants ......................................................................…...
Balance Sheets as of December 31, 2004 and 2003 ................................................................
Statements of Income and Retained Earnings for the Years Ended December 31, 2004, 2003
and 2002……………………………………………………………………………
Statements of Cash Flows for the Years Ended December 31, 2004, 2003 and 2002………..
Notes to Financial Statements ........................................................................................….....
SUPPLEMENTARY SCHEDULES
Report of Independent Public Accountants on Supplementary Schedules
A.
Marketable Securities - (Current Marketable Equity Securities and Other ShortTerm Cash Investments) ...................................................................………..
A.1
Short-term Cash Investments
B.
Amounts of Receivable from Directors, Officers, Employees, Related Parties, and
Principal Stockholders (Other than Affiliates) ...................……………….….
C.
Non-Current Marketable Equity Securities, Other Long-Term Investments, and
Other Investments ................................................................……..
C.1
Non-Current Marketable Equity Securities ………………………………………..
D.
Indebtedness of Unconsolidated Subsidiaries and Affiliates..........................……..
E.
Property, Plant and Equipment ..........................................................................…..
F.
Accumulated Depreciation ..................................................................................…
G.
Intangible Assets and Other Assets ...................................................................…..
H.
Long-Term Debt .....................................................................................................
H.1
Loans Payable………………………………………………………………………..
H.1-A Bank Loans…………………………………………………………………………...
I.
Indebtedness to Affiliates and Related Parties (Long-Term Loans from Related
Companies) .....................................................................................………….
J.
Guarantees of Securities of Other Issuers ..........................................................…..
K.
Capital Stock ............................................................................................................
50
51
*
52
53
*
*
*
55
56
58
59
*
*
61
* These schedules, which are required by Part IV(e) of RSA Rule 48, have been omitted because they are
either not required, not applicable or the information required to be presented is included in HI’s
consolidated financial statements or the notes to consolidated financial statements.
49
SGV & CO
SyCip Gorres Velayo & Co.
6760 Ayala Avenue
1226 Makati City
Philippines
Phone: (632) 891-0307
Fax:
(632) 819-0872
www.sgv.com.ph
BOA/PRC Reg. No. 0001
SEC Accreditation No. 0012-F
Report of Independent Auditors
The Stockholders and the Board of Directors
House of Investments, Inc.
3rd Floor, Grepalife Building
219 Sen. Gil J. Puyat Avenue
Makati City
We have audited the accompanying consolidated balance sheets of House of Investments, Inc. and
Subsidiaries as of December 31, 2005 and 2004, and the related consolidated statements of income,
changes in stockholders’ equity and cash flows for the years then ended. These financial statements are the
responsibility of the Company’s management. Our responsibility is to express an opinion on these
financial statements based on our audits.
We conducted our audits in accordance with auditing standards generally accepted in the Philippines.
Those standards require that we plan and perform the audit to obtain reasonable assurance about whether
the financial statements are free of material misstatement. An audit includes examining, on a test basis,
evidence supporting the amounts and disclosures in the financial statements. An audit also includes
assessing the accounting principles used and significant estimates made by management, as well as
evaluating the overall financial statement presentation. We believe that our audits provide a reasonable
basis for our opinion.
In our opinion, the consolidated financial statements referred to above present fairly, in all material
respects, the consolidated financial position of House of Investments, Inc. and Subsidiaries as of
December 31, 2005 and 2004, and the results of their operations and their cash flows for years then ended
in conformity with accounting principles generally accepted in the Philippines.
SYCIP GORRES VELAYO & CO.
Medel T. Nera
Partner
CPA Certificate No. 31835
SEC Accreditation No. 0089-A
Tax Identification No. 113-423-143
PTR No. 4181254, January 2, 2006, Makati City
March 30, 2006
SGV & Co is a member practice of Ernst & Young Global
*SGVMC107821*
HOUSE OF INVESTMENTS, INC. AND SUBSIDIARIES
CONSOLIDATED BALANCE SHEETS
December 31
2004
(As restated Note 2)
2005
ASSETS
Current Assets
Cash and cash equivalents (Notes 4 and 33)
Temporary cash investments (Note 33)
Current portion of loans receivable (Notes 5 and 33)
Accounts receivable - net (Notes 6, 14 and 33)
Contract jobs in progress
Inventories (Note 7 and 15)
Available for sale securities - current portion (Notes 8 and 33)
Due from related parties (Notes 17 and 33)
Prepaid expenses and other current assets
Land classified as held for sale (Notes 10 and 14)
Total Current Assets
Noncurrent Assets
Investment in associates (Notes 9 and 14)
Available-for-sale securities - net (Notes 8, 14 and 33)
Other investments in shares of stock - net (Notes 8 and 14)
Property, plant and equipment - net (Notes 10, 14 and 15)
At cost
At revalued amounts
Loans receivable - net of current portion (Notes 5 and 33)
Deferred income tax (Note 24)
Goodwill (Note 11)
Other noncurrent assets - net (Note 12)
Total Noncurrent Assets
LIABILITIES AND STOCKHOLDERS’ EQUITY
Current Liabilities
Loans payable (Notes 14, 17 and 33)
Accounts payable and accrued expenses (Notes 13 and 33)
Current portion of long-term debt (Notes 15, 17, and 33)
Customers’ deposit
Current portion of due to preferred stockholders (Note 28)
Unearned tuition fees
Due to related parties (Notes 17 and 33)
Income tax payable
Total Current Liabilities
(Forward)
P
=814,365,671
19,931,992
381,793,030
1,794,753,094
957,045,981
998,313,704
58,484,354
116,653,914
237,472,379
5,378,814,119
355,185,100
5,733,999,219
=838,932,399
P
15,403,652
458,310,592
1,398,410,995
727,881,904
1,038,383,997
–
132,200,074
231,183,417
4,840,707,030
−
4,840,707,030
668,816,357
452,326,357
–
642,211,750
–
567,857,577
1,162,172,447
1,078,914,364
2,872,825,305
2,517,640,205
174,212,256
136,251,856
114,275,837
131,007,899
552,927,242
510,303,242
340,454,914
190,563,974
6,426,937,328
5,685,824,254
=11,267,644,358
P
=11,419,823,473 P
P
=2,924,683,749
2,759,859,491
490,024,520
394,289,332
299,322,746
124,709,918
27,861,305
10,084,879
7,030,835,940
=2,980,780,000
P
2,475,845,598
334,913,384
244,143,927
–
126,465,050
22,861,598
20,264,905
6,205,274,462
*SGVMC107821*
-2December 31
2004
(As restated –
Note 2)
2005
Noncurrent Liabilities
Long-term debt - net of current portion (Notes 15, 17 and 33)
Deferred income tax (Note 24)
Due to preferred stockholders (Note 28)
Total Noncurrent Liabilities
Total Liabilities
Stockholders’ Equity
Attributable to equity holders of parent company
Capital stock (Note 28)
Additional paid-in capital
Revaluation increment in property (Note 10)
Cumulative translation adjustment
Net accumulated unrealized loss on available-for-sale
securities (Note 8)
Reserve for fluctuation in value of investments
in noncurrent marketable equity securities (Note 8)
Retained earnings
Minority interest
Total Stockholders’ Equity
875,158,737
69,350,229
576,451,865
1,520,960,831
8,551,796,771
1,160,692,973
84,983,073
–
1,245,676,046
7,450,950,508
998,388,152
137,294,403
255,846,991
20,856,943
1,801,028,858
137,294,403
266,672,839
29,914,847
(98,261,406)
−
−
(108,805,541)
261,586,749
192,169,322
2,387,692,155
1,506,294,405
1,429,001,695
1,361,732,297
3,816,693,850
2,868,026,702
=11,267,644,358
P
=11,419,823,473 P
See accompanying Notes to Consolidated Financial Statements.
*SGVMC107821*
HOUSE OF INVESTMENTS, INC. AND SUBSIDIARIES
CONSOLIDATED STATEMENTS OF INCOME
Years Ended December 31
2004
(As restated −
Note 2)
2005
REVENUES
Net sales of goods and services
School and related operations
Equity in net earnings of associates (Note 9)
Dividends
Commission income
Interest and discounts
Miscellaneous
COSTS AND EXPENSES
Cost of sales and services (Note 18)
General and administrative (Note 21)
Interest and finance charges (Notes 14,15, and 17)
INCOME BEFORE INCOME TAX
PROVISION FOR INCOME TAX (Note 24)
NET INCOME
Attributable to:
Equity holders of the parent
Minority interest
EARNINGS PER SHARE ATTRIBUTABLE TO
EQUITY HOLDERS OF THE PARENT - BASIC
(Note 25)
P
=8,290,483,196
1,194,789,024
152,630,865
99,033,067
18,879,033
68,254,139
265,087,003
10,089,156,327
=7,344,187,060
P
1,295,825,536
284,591,127
101,412,293
35,095,402
175,856,273
165,406,660
9,402,374,351
7,516,438,864
1,688,956,554
630,814,005
9,836,209,423
6,643,532,762
1,650,964,121
599,474,272
8,893,971,155
252,946,904
508,403,196
18,710,739
104,085,284
P
=234,236,165
=404,317,912
P
P
=116,575,442
117,660,723
P
=234,236,165
=274,316,481
P
130,001,431
=404,317,912
P
P
=0.0971
=0.175
P
See accompanying Notes to Consolidated Financial Statements.
*SGVMC107821*
HOUSE OF INVESTMENTS, INC. AND SUBSIDIARIES
CONSOLIDATED STATEMENTS OF CHANGES IN STOCKHOLDERS’ EQUITY
For the Year Ended December 31, 2005
Attributable to Parent Company
Preferred
Stock
(Note 28)
Balances as of December 31, 2004
As previously reported
Effect of changes in accounting for:
Employee benefits (Note 2)
Goodwill (Note 2)
As restated
Effect of change in accounting for financial
instruments (Notes 2 and 28)
Common Stock
(Note 28)
Additional
Paid-in
Capital
Revaluation
Increment in
Property
Reserve for
Fluctuation of
Investments in
Noncurrent
Cumulative
Marketable
Translation Equity Securities
(Note 8)
Adjustment
Net
Accumulated
Unrealized
Loss in
Available-forSale Securities
(Note 8)
=897,968,239
P
=903,060,619
P
=137,294,403
P
=266,672,839
P
=29,914,847
P
(P
=108,805,541)
P
=–
−
−
897,968,239
−
−
903,060,619
−
−
137,294,403
−
−
266,672,839
−
−
29,914,847
−
−
(108,805,541)
−
−
–
Dividends received from subsidiaries
(802,640,706)
95,327,533
−
−
−
−
−
−
−
903,060,619
−
−
−
−
−
−
−
137,294,403
−
−
−
−
−
−
−
266,672,839
−
−
−
(10,825,848)
(10,825,848)
−
−
29,914,847
−
−
(9,057,904)
−
(9,057,904)
−
108,805,541
−
−
−
−
−
−
−
Balances as of December 31, 2005
P
=95,327,533
P
=903,060,619
P
=137,294,403
P
=−
Net income for the year
Net unrealized gain for the year
Translation adjustment for the year
Impact of change in tax rates (Note 24)
P
=255,846,991
P
=20,856,943
Retained
Earnings
Total
Minority
Interest
Total
=288,011,303
P
=
P2,414,116,709
=1,467,990,738
P
=
P3,882,107,447
(37,221,365)
10,796,811
261,586,749
(37,221,365)
10,796,811
2,387,692,155
(38,989,043)
−
1,429,001,695
(76,210,408)
10,796,811
3,816,693,850
(108,805,541)
(108,805,541)
–
10,544,135
−
−
10,544,135
−
(185,992,869)
75,593,880
116,575,442
−
−
−
116,575,442
−
(988,633,575)
1,399,058,580
116,575,442
10,544,135
(9,057,904)
(10,825,848)
107,235,825
−
(7,637,359)
1,421,364,336
117,660,723
−
(17,054,751)
−
100,605,972
(160,238,011)
(996,270,934)
2,820,422,916
234,236,165
10,544,135
(26,112,655)
(10,825,848)
207,841,797
(160,238,011)
(P
=98,261,406)
P
=192,169,322
P
=1,506,294,405
P
=1,361,732,297
P
=2,868,026,702
See accompanying Notes to Consolidated Financial Statements.
*SGVMC107821*
HOUSE OF INVESTMENTS, INC. AND SUBSIDIARIES
CONSOLIDATED STATEMENTS OF CHANGES IN STOCKHOLDERS’ EQUITY
For the Year Ended December 31, 2004
Attributable to Parent Company
Preferred
Stock
(Note 28)
Balances as of December 31, 2003
As previously reported
Effect of change in accounting for employee
benefits (Note 2)
As restated
Net income
As previously reported
Effect of change in accounting for:
Employee benefits (Note 2)
Goodwill (Note 2)
As restated
Recovery of value of investment in shares
of stock for the year
Additional revaluation increment in property for the
year
Translation adjustment for the year
Sale of First Malayan Leasing and
Finance Corporation (Note 30)
Reduction in par value (Note 31)
Elimination of deficit (Note 31)
Total
Dividends to preferred shareholders (Note 32)
Dividends received from subsidiaries
Balances as of December 31, 2004
Common Stock
(Note 28)
Additional
Paid-in
Capital
Revaluation
Increment in
Property
Reserve for
Fluctuation of
Investments in
Noncurrent
Cumulative
Marketable
Translation Equity Securities
Adjustment
(Note 8)
Net
Accumulated
Unrealized
Loss in
Available-forSale Securities
(Note 8)
Retained
Earnings
Total
Minority
Interest
Total
=2,130,768,671
P
=1,392,492,839
P
=3,523,261,510
P
=897,968,239
P
=1,204,080,826
P
=525,620
P
=255,395,275
P
=12,053,088
P
(P
=122,435,173)
=–
P
(P
=116,819,204)
–
897,968,239
–
1,204,080,826
–
525,620
–
255,395,275
–
12,053,088
–
(122,435,173)
–
–
(45,161,587)
(161,980,791)
(45,161,587)
2,085,607,084
(49,038,045)
1,343,454,794
(94,199,632)
3,429,061,878
–
–
–
–
–
–
–
255,579,448
255,579,448
119,952,429
375,531,877
–
–
–
–
–
–
–
–
–
–
–
–
–
–
–
–
–
–
–
–
–
7,940,222
10,796,811
274,316,481
7,940,222
10,796,811
274,316,481
10,049,002
–
130,001,431
17,989,224
10,796,811
404,317,912
–
–
–
–
–
13,629,632
–
–
13,629,632
–
13,629,632
–
–
–
–
–
–
–
–
–
11,277,564
–
11,277,564
–
17,861,759
17,861,759
–
–
13,629,632
–
–
–
–
–
274,316,481
11,277,564
17,861,759
317,085,436
4,919,736
25,458,381
160,379,548
16,197,300
43,320,140
477,464,984
–
–
–
–
–
–
P
=266,672,839
–
–
–
–
–
–
P
=29,914,847
–
–
–
–
–
P
=897,968,239
–
(301,020,207)
–
(301,020,207)
–
–
P
=903,060,619
2,976,596
301,020,207
(167,228,020)
136,768,783
–
–
P
=137,294,403
–
–
–
–
–
–
(P
=108,805,541)
–
–
–
–
–
–
P
=–
–
–
167,228,020
167,228,020
(17,976,961)
–
P
=261,586,749
2,976,596
–
–
2,976,596
(17,976,961)
–
P
=2,387,692,155
–
–
–
–
–
(74,832,647)
P
=1,429,001,695
2,976,596
–
–
2,976,596
(17,976,961)
(74,832,647)
P
=3,816,693,850
See accompanying Notes to Consolidated Financial Statements.
*SGVMC107821*
HOUSE OF INVESTMENTS, INC. AND SUBSIDIARIES
CONSOLIDATED STATEMENTS OF CASH FLOWS
Years Ended December 31
2004
(As restated Note 2)
2005
CASH FLOWS FROM OPERATING ACTIVITIES
Income before income tax
Adjustments for:
Interest and finance charges
Depreciation and amortization (Notes 10 and 22)
Provision for probable losses, doubtful accounts, inventory
obsolescence and others
Provision for impairment of goodwill (Notes 11 and 21)
Equity in net earnings of associates (Note 9)
Interest income and discounts
Operating income before changes in operating assets
and liabilities
Changes in operating assets and liabilities:
Decrease (increase) in:
Accounts receivable
Loans receivable
Inventories
Contract jobs in progress
Prepaid expenses and other current assets
Increase (decrease) in:
Accounts payable and accrued expenses
Customers’ deposit
Unearned tuition fees
Net cash generated from operations
Interest received
Interest and finance charges paid
Income tax paid
Net cash provided by operating activities
CASH FLOWS FROM INVESTING ACTIVITIES
Reductions in (additions to):
Due from related parties
Investments in associates
Available for sale securities
Temporary cash investments
Property, plant and equipment
Other noncurrent assets
Dividends received (Note 9)
Cash received from acquired company
Net cash provided by (used in) investing activities
(forward)
P
=252,946,904
=508,403,196
P
630,814,005
280,847,708
599,474,272
267,900,064
46,564,380
42,624,000
(152,630,865)
(68,254,139)
89,797,189
44,800,138
(284,591,127)
(175,856,273)
1,032,911,993
1,049,927,459
(386,376,992)
80,066,271
37,882,711
(229,164,077)
(6,288,962)
302,528,151
66,835,178
36,006,936
(426,410,242)
(80,577,010)
284,013,893
150,145,405
(1,755,132)
961,435,110
68,254,139
(779,633,210)
(80,743,602)
169,312,437
258,126,540
244,143,927
104,870,488
1,555,451,427
231,420,894
(606,750,396)
(79,657,319)
1,100,464,606
15,546,160
71,268,419
67,591,001
(4,528,340)
(197,589,625)
149,890,940
45,699,935
−
147,878,490
(63,932,309)
(26,735,794)
105,936,943
5,752,447
(107,525,499)
(130,089,525)
21,894,929
226,157
(194,472,651)
*SGVMC107821*
-2-
Years Ended December 31
2004
(As restated –
Note 2)
2005
CASH FLOWS FROM FINANCING ACTIVITIES
Payments of:
Loans payable
Long-term debt
Increase (decrease) in due to related parties
Cash dividends paid to minority shareholders
Net cash used in financing activities
(P
=56,096,251)
(130,423,100)
4,999,707
(160,238,011)
(341,757,655)
(P
=317,035,787)
(265,277,459)
(6,820,722)
(74,832,647)
(663,966,615)
NET INCREASE (DECREASE) IN CASH AND
CASH EQUIVALENTS
(24,566,728)
242,025,340
CASH AND CASH EQUIVALENTS AT
BEGINNING OF YEAR
838,932,399
596,907,059
CASH AND CASH EQUIVALENTS AT
END OF YEAR
P
=814,365,671
=838,932,399
P
See accompanying Notes to Consolidated Financial Statements.
*SGVMC107821*
HOUSE OF INVESTMENTS, INC. AND SUBSIDIARIES
NOTES TO CONSOLIDATED FINANCIAL STATEMENTS
1. Corporate Information
House of Investments, Inc. (the Company or Parent Company) is a stock corporation incorporated
under the laws of the Republic of the Philippines. The Company is an investment and
management company. Its primary business is to purchase, hold and sell equity or debt securities
issued by individuals, associations, public or private corporations for the purpose of deriving
income through dividends or disposals of such investments. One of the Company’s secondary
purposes is car dealership. The principal activities of the Company and its subsidiaries (the
Group) are described in Note 27. The Company’s subsidiaries and associates are mainly Filipino
companies incorporated in the Philippines, except for EEI BVI, which was incorporated in the
British Virgin Islands, Clear Jewel Investments, Ltd., which was incorporated in Equatorial New
Guinea, and Al Rushaid Construction Corporation, which was incorporated in the Kingdom of
Saudi Arabia. The Group is a member of the Yuchengco Group of Companies (YGC).
The registered office address of the Company is 3rd Floor, Grepalife Building, 219 Sen. Gil J.
Puyat Avenue, Makati City.
The accompanying consolidated financial statements were approved and authorized for issue by
the Board of Directors (BOD) on March 30, 2006.
2. Summary of Significant Accounting Policies
Basis of Financial Statements Preparation
The accompanying consolidated financial statements of the Group have been prepared in
compliance with accounting principles generally accepted in the Philippines (Philippine GAAP) as
set forth in Philippine Financial Reporting Standards (PFRS). These are the Group’s first annual
consolidated financial statements prepared in compliance with PFRS.
Prior to adoption of PFRS, the Group prepared its consolidated financial statements until
December 31, 2004 in compliance with previous GAAP.
The Group applied PFRS 1, First-time Adoption of PFRS, in preparing its consolidated financial
statements with January 1, 2004 as the date of transition. The Group’s PFRS adoption date is
January 1, 2005. The Group applied the accounting policies set forth below to all the years
presented, except those relating to financial instruments. An explanation of how the transition to
PFRS has affected the reported financial position, financial performance and cash flows of the
Group is provided below.
The Group’s financial statements are prepared under the historical cost basis, except for land,
which is carried at revalued amounts and available for sale securities that have been measured at
fair value. The accompanying consolidated financial statements are presented in Philippine Peso.
*SGVMC107821*
-2-
Explanation of Transition to PFRS
As stated in the preceding paragraphs, the accompanying consolidated financial statements are the
Group’s first annual consolidated financial statements prepared in compliance with PFRS. The
transition to PFRS resulted in certain changes to the Group’s previous accounting policies. The
comparative figures for 2004 were restated to reflect the changes in accounting policies discussed
below resulting from transition to PFRS, except those relating to financial instruments. The Group
has made use of the optional exemption available under PFRS 1, and as allowed by the Securities
and Exchange Commission of the Philippines (SEC), to apply Philippine Accounting Standards
(PAS) 32, Financial Instruments: Disclosure and Presentation and PAS 39, Financial
Instruments: Recognition and Measurement, to financial instruments outstanding as of January 1,
2005. The adjustments required for differences between the previous GAAP and PAS 32 and 39
are determined and recognized directly against deficit as of January 1, 2005.
New Accounting Standards
·
PFRS 3, Business Combination, resulted in the cessation of the amortization of goodwill and
requires an annual test for goodwill impairment. Any resulting negative goodwill after
performing a reassessment is credited to income. Moreover, pooling of interests in accounting
for business combination is no longer permitted.
The adoption of this accounting standard resulted in the reversal of the amortization of
goodwill and recognition of provision for impairment losses on goodwill in 2004 which,
correspondingly, increased goodwill and retained earnings by P
=10.8 million as of
December 31, 2004 and net income by P
=10.8 million in 2004.
·
PFRS 5, Noncurrent Assets Held for Sale and Discontinued Operations, specifies the
accounting for assets held for sale and the presentation and disclosure requirements for
discontinued operations. Under this standard, qualifying noncurrent assets or disposal groups
held for sale shall be carried at fair value less cost to sell if this amount is lower than its
carrying amount. The entity shall not depreciate (or amortize) noncurrent assets (or disposal
groups) while classified as held for sale. Any gain or loss on the remeasurement of a
noncurrent asset (or disposal group) classified as held for sale shall be included in the
consolidated statement of income.
The adoption of this standard resulted in the reclassification of land in 2005 (previously
classified as property, plant and equipment) amounting to P
=355.2 million to land classified as
held for sale. The land is carried at revalued amount which is lower than the fair value less
cost to sell.
·
PAS 19, Employee Benefits, prescribes the accounting and disclosures by employers for
employee benefits (including short-term employee benefits, post-employment benefits, other
long-term employee benefits and termination benefits). For post-employment benefits
classified as defined benefit plans, the standard requires: (a) the use of the projected unit credit
method to measure an entity’s obligations and costs; (b) an entity to determine the present
value of defined benefit obligations and the fair value of any plan assets with sufficient
regularity; and (c) the recognition of a specific portion of net cumulative actuarial gains and
losses when the net cumulative amount exceeds 10% of the greater of the present value of the
defined benefit obligation or 10% of the fair value of the plan assets, but also permits the
immediate recognition of these actuarial gains and losses.
*SGVMC107821*
-3-
The adoption of this accounting standard resulted in:
· An increase in net income by P
=7.9 million in 2004;
· A decrease in retained earnings by P
=37.2 million and P
=45.2 million as of
December 31, 2004 and January 1, 2004, respectively;
· An increase in accrued retirement liability by P
=91.4 million and P
=106.2 million as of
December 31, 2004 and January 1, 2004, respectively;
· An increase in retirement assets by P
=15.2 million and P
=12.0 million as of
December 31, 2004 and January 1, 2004, respectively; and
· A decrease in minority interest by P
=39.0 million and P
=49.0 million as of
December 31, 2004 and January 1, 2004, respectively;
·
PAS 32 covers the disclosure and presentation of all financial instruments. This standard
requires more comprehensive disclosures about the Group’s financial instruments, whether
recognized or unrecognized in the consolidated financial statements. In accordance with this
standard, new disclosures were included in the consolidated financial statements, where
applicable. This standard also requires financial instruments to be classified as liabilities or
equity in accordance with their substance and not their legal form.
·
PAS 39 establishes the accounting and reporting standards for recognizing and measuring the
Group’s financial assets and financial liabilities. PAS 39 also covers the accounting for
derivative instruments. The standard has expanded the definition of a derivative instrument to
include derivatives (derivative-like provisions) embedded in non-derivative contracts. Under
PAS 39, in determining whether a financial asset is impaired, reference is made to quoted
market rates; in the absence of such quoted market rates, the discounted cash flow method is
to be used.
The adoption of PAS 32 and PAS 39 resulted in:
a) The reclassification of the debt component of the preferred shares to financial liability.
As discussed in Note 28 to the consolidated financial statements, the Company issued
preferred shares that are redeemable and convertible to common shares of the Company at
the option of the preferred shareholders. Under PAS 32, the redeemable convertible
preferred shares qualify as a financial liability and should be accounted for as part of the
Company’s liabilities at amortized cost. The Company computed the fair value of the
liability component using the prevailing market rate for an equivalent non-redeemable
bond at the time of the issuance of the redeemable preferred shares. The resulting amount
represents the component of the preferred shares that exhibits characteristics of a financial
liability and should be carried as part of the liabilities at amortized cost until redemption
(or conversion since the preferred shares were also issued with a conversion option).
Accordingly, the Company reclassified the financial liability component of these preferred
shares amounting to about P
=802.6 million as of January 1, 2005 from stockholders’ equity
to liabilities.
The remaining amount in the preferred shares under its stockholders’ equity amounting to
=95.3 million represents the equity component of the preferred shares. This includes the
P
embedded conversion option.
*SGVMC107821*
-4-
As of January 1, 2005, the Company’s accumulated dividends declared on the financial
liability component of the preferred shares amounted to P
=18.0 million; while the accretion
of the unamortized discount as well as the cumulative dividends accruing on the preferred
stock from the time of issuance up to January 1, 2005 amounted to P
=196.6 million. The
difference representing the unrecorded accumulated interest expense on the financial
liability component of the preferred shares amounting to about P
=178.6 million as of
January 1, 2005 was charged to the beginning balance of its retained earnings as of that
date.
Likewise, the accretion as well as the cumulative dividends accruing on these preferred
shares amounting to P
=104 million in 2005 was recognized as part of interest expense for
the year.
b) Remeasurement of long-term receivables at amortized cost using the effective interest rate
method.
c) Reclassification of the other investments in shares of stock to available-for-sale securities
and the valuation reserve to net accumulated unrealized loss in available-for-sale
securities in the stockholders’ equity account.
·
PAS 40, Investment Property, prescribes the accounting treatment for investment property and
related disclosure requirements. This standard permits the entity to choose either the fair
value model or cost model in accounting for investment property. Fair value model requires
an investment property to be measured at fair value with fair value changes recognized
directly in the consolidated statements of income. Cost model requires that an investment
property should be measured at depreciated cost less any accumulated impairment losses. The
Group adopted the cost model in accounting for its investment property.
The effect of adopting this standard resulted in the reclassification, with no change in carrying
amount, of land classified under property, plant and equipment and real and other properties
owned or acquired carried at cost amounting to P
=100.2 million and P
=156.1 million as of
December 31, 2005 and 2004, respectively, into investment property.
The increasing (decreasing) effects of the transition to PFRS follow:
December 31, 2004 and January 1, 2005
Financial effects
of:
PAS 19
PFRS 3
December 31, 2004
PAS 32 and 39
January 1, 2005
Current
asset
=−
P
−
−
877,750
877,750
=877,750
P
Noncurrent
assets
=15,186,151
P
10,796,811
25,982,962
Current
liabilities
=
P91,396,559
−
91,396,559
(15,152,576) 136,272,469
(15,152,576) 136,272,469
=10,830,386 =
P
P227,669,028
Preferred
stock
=−
P
−
−
Minority
interest
(P
=38,989,043)
−
(38,989,043)
844,060,019 (802,640,706)
844,060,019 (802,640,706)
=844,060,019 (P
P
=802,640,706)
(7,637,359)
(7,637,359)
(P
=46,626,402)
Noncurrent
liabilities
=−
P
−
−
Retained
earnings
(P
=37,221,365)
10,796,811
(26,424,554)
2004
Net income
=7,940,222
P
10,796,811
18,737,033
(185,992,869)
−
(185,992,869)
−
(P
=212,417,423) P
=18,737,033
*SGVMC107821*
-5-
January 1, 2004
Financial effects
of:
PAS 19
Noncurrent
Assets
=12,019,317
P
Current liabilities
P
=106,218,949
January 1, 2004
Retained earnings
(P
=45,161,587)
Minority interest
=49,038,045
P
The reconciliation of the effects of transition to PFRS as they apply to the Group’s stockholders’
equity as of December 31, 2004 and January 1, 2004 are shown below:
Stockholders’ equity
As previously reported
Financial effect of:
PAS 19
Retained earnings
Minority interest
PFRS 3
December 31,
2004
=3,882,107,447
P
January 1,
2004
P
=3,523,261,510
(37,221,365)
(45,161,587)
(38,989,043)
(49,038,045)
10,796,811
−
=3,816,693,850 P
P
=3,429,061,878
Net income in 2004
As previously reported
Financial effects of:
PAS 19
PFRS 3
=375,531,877
P
17,989,224
10,796,811
=404,317,912
P
The Group also adopted the following new and revised accounting standards in 2005:
·
·
·
·
·
·
·
·
·
·
·
·
·
PAS 1, Presentation of Financial Statements
PAS 2, Inventories
PFRS 2, Share-Based Payments
PAS 8, Accounting Policies, Changes in Accounting Estimates and Errors
PAS 10, Events After the Balance Sheet Date
PAS 16, Property, Plant and Equipment
PAS 17, Leases
PAS 21, The Effects of Changes in Foreign Exchange Rates
PAS 24, Related Party Disclosures
PAS 27, Consolidated and Separate Financial Statements
PAS 28, Investments in Associates
PAS 31, Interests in Joint Ventures
PAS 33, Earnings Per Share
The adoption of the foregoing new and revised accounting standards did not have a significant
impact on the consolidated financial statements. Required disclosures were included in the
consolidated financial statements where appropriate.
*SGVMC107821*
-6-
There were no options granted after November 7, 2002. Likewise, there were no options that had
not vested as of January 1, 2004. Correspondingly, as allowed by PFRS 2, Share-Based
Payments, the Group did not apply PFRS 2 as options were granted before these dates.
The Group did not early adopt the revised disclosure requirements of the following standards and
amendments that have been approved but are not yet effective:
·
PFRS 7, Financial Instruments: Disclosures, will be included in the Group’s consolidated
financial statements when it adopts the standard in 2007.
·
PFRS 6, Exploration for and Evaluation of Mineral Resources. Disclosures will be included
in the Group’s financial statements when it adopts the standard in 2006.
·
Amendments to PAS 19, Employee Benefits - Actuarial Gains and Losses, Group Plans and
Disclosures, will be included in the Group’s consolidated financial statements when the
amendments are adopted in 2006.
Accounting Policies
Basis of Consolidation and Investments in Subsidiaries
The consolidated financial statements include the accounts of the Company and the following
subsidiaries:
Subsidiaries
Landev Corporation
Investment Managers, Inc.
Zambowood Realty and Development Corporation
Zamboanga Carriers, Inc.
iPeople, inc. (iPeople) and subsidiaries
Honda Cars Kalookan, Inc. (HCKI)
EEI Corporation (EEI) and subsidiaries
Zamboanga Industrial Finance Corporation (ZIFC)1
First Malayan Leasing and Finance Corporation (FMLFC)1
1
Percentage of Ownership
2004
2005
100.00
100.00
100.00
100.00
100.00
100.00
100.00
100.00
67.34
67.34
55.00
55.00
51.00
51.00
50.00
50.00
45.11
45.11
The Company has majority of the members of the Board of Directors of ZIFC and FMLFC.
*SGVMC107821*
-7-
iPeople’s percentage of ownership in the shares of its subsidiaries follows:
Subsidiaries
Malayan Colleges, Inc. (MCI) formerly Mapua
Institute of Technology and Subsidiaries:
Mapua Information Technology Center (MITC)
Mapua Techserv, Inc.
San Lorenzo Ruiz Institute of Health Services, Inc.
(SLRHSI)
Malayan High School of Sciences, Inc (MHSSI)
(formerly Pandacan Properties, Inc.)
Malayan Colleges Laguna, Inc. led by Mapua
School of Engineering
People eServe Corporation
Pan Pacific Computer Center, Inc.
IEWorks, Inc. (IEWI)
Percentage of Ownership
2004
2005
100
100
100
100
100
100
100
100
100
100
100
100
70
51
−
100
70
51
EEI’s percentage of ownership of its subsidiaries follows:
Subsidiaries
EEI (BVI) Limited (EEI BVI) and subsidiary
Clear Jewel Investments, Ltd.
EEI Construction and Marine Corporation
(EEI Marine)
EEI Power Corporation (EEI Power)
EEI Realty Corporation (EEI Realty)
Equipment Engineers, Inc.
Gulf Asia International Corporation and
subsidiaries (GAIC)
GAIC Manpower Services, Inc.
GAIC Professional Services, Inc.
Philrock Construction and Services, Inc.
Philmark Inc.
Bagumbayan Equipment & Industrial Products, Inc.
(formerly Plant Design and Management
Corporation)
Percentage of Ownership
2004
2005
100
100
100
100
100
100
100
100
100
100
100
100
100
100
100
100
100
100
100
100
100
100
100
100
Control is normally evidenced when the Company owns, either directly or indirectly, more than
50% of the voting rights of an investee’s capital stock. ZIFC and FMLFC were consolidated since
the Company has the power to govern the financial and operating policies through representation
by the majority members of the Board of Directors.
Subsidiaries are fully consolidated from the date of acquisition, being the date on which the Group
obtains control, and continue to be consolidated until the date that such control ceases.
*SGVMC107821*
-8-
Consolidated financial statements are prepared using uniform accounting policies for like
transactions and other events in similar circumstances. Intercompany balances and transactions
are eliminated in the consolidated financial statements.
Cash and Cash Equivalents
Cash includes cash on hand and in banks. Cash equivalents are short-term, highly liquid
investments that are readily convertible to known amounts of cash with original maturities of three
months or less and that are subject to an insignificant risk of change in value.
Investments in Associates and Joint Ventures
Investments in associates and joint ventures are accounted for under the equity method of
accounting. Under this method, the cost of investment is increased or decreased by the equity in
the associates’ net earnings or losses since the dates of acquisitions and reduced by dividends
received. Unrealized intercompany profits are eliminated up to the extent of the proportionate
share thereof.
Investments in associates and joint ventures accounted for under the equity method are as follows:
Associates and Joint Ventures
EEI-E.E. Black, Ltd., A Joint Venture
ECW Joint Venture Inc.
Hi-Eisai Pharmaceutical, Inc.1
Al Rushaid Construction Corporation (ARCC)
SAEI-EEI Construction Corporation (SECC)
La Funeraria Paz Sucat, Inc. (LFPSI)
T’boli Agro-Industrial Development, Inc.
Manila Memorial Park Cemetery, Inc. (MMPC)
Lo-oc Limestone Development Corporation (LLDC)2
South Western Cement Corporation (SWCC)2
C & E Corporation3
Percentage of Ownership
2004
2005
60.00
60.00
50.00
50.00
50.00
50.00
49.00
49.00
40.00
40.00
30.00
30.00
28.47
28.47
25.98
25.98
25.00
25.00
13.21
13.21
25.00
–
1
In 2004, the Company and Eisai Co., Ltd. agreed to have an equal number of Board of Directors at all times. Likewise
the Company sold its 0.1% shares in Hi-Eisai to Eisai Co., Ltd. Correspondingly, in 2004, investment in Hi-Eisai was
accounted for under equity method.
2
The Company has more than 20% effective interest in SWCC since LLDC (in which the Company has 25% interest)
has more than 50% interest in SWCC.
3
In 2005, EEI sold its interest in C & E Corporation.
*SGVMC107821*
-9-
Financial Instruments
Accounting Policies Effective January 1, 2005
Investments and Other Financial Assets
Financial assets within the scope of PAS 39 are classified as either (a) financial assets at fair value
through profit or loss, (b) loans and receivables, (c) held-to-maturity investments, and
(d) available-for-sale securities, as appropriate. When these are recognized initially, financial
assets are measured at fair value, plus, in the case of investments not at fair value through profit or
loss, directly attributable transaction costs. The Group determines the classification of its financial
assets at initial recognition and, where allowed and appropriate, reevaluates this designation at
each financial year-end.
Financial assets at fair value through profit or loss (FVPL)
Financial assets held for trading are classified as financial assets at fair value through profit or loss.
Financial assets are classified as held for trading if they are acquired for the purpose of selling in
the near term. Gains or losses on investments held for trading are recognized in the consolidated
statements of income. The Group has no financial assets at FVPL as of December 31, 2005.
Loans and receivables
Loans and receivables are non-derivative financial assets with fixed or determinable payments that
are not quoted in an active market. Such assets are carried at amortized cost using the effective
interest method. Gains and losses are recognized in income when the loans and receivables are
derecognized or impaired, as well as through the amortization process.
The Group’s loans and receivables principally include trade receivables, contracts receivables,
retention receivables, and advances to suppliers and contractor.
Held-to-Maturity (HTM) Investments
These represent quoted non-derivative financial resources with fixed or determinable payments
and fixed maturities for which the Group’s management has the positive intention and ability to
hold to maturity. The Group has no HTM investments as of December 31, 2005.
Available-for-sale (AFS) securities
Available-for-sale securities are those non-derivative financial assets that are designated as
available-for-sale or are not classified in any of the three other categories. After initial
recognition, available-for-sale securities are measured at fair value with gains or losses being
recognized as a separate component of the stockholders’ equity until the investment is
derecognized or until the investment is determined to be impaired at which time the cumulative
gain or loss previously reported in the stockholders’ equity is included in the consolidated
statements of income. If the fair market value of the unquoted equity instruments under AFS
cannot be reliably measured, the financial asset is carried at cost less allowance for impairment
loss, if any. AFS securities which are expected to be sold within twelve months from the balance
sheet date are classified under current assets. Otherwise, these are classified as noncurrent assets.
AFS includes securities previously classified as other investments in shares of stock.
*SGVMC107821*
- 10 -
Due to Preferred Stockholders
This represents the debt component of the redeemable convertible preferred stock of the Company.
As discussed in Note 28, the preferred shares can be redeemed at the option of the holder. Under
PAS 32, this financial instrument qualifies as a financial liability. Due to preferred stockholders is
carried at amortized cost and classified as part of the Group’s liabilities. Accordingly, the
cumulative dividends on the preferred stock dividends are treated as interest expense in the
consolidated statements of income. The computed discount at the time of issuance is amortized
and recognized as interest expense over the term of the preferred stock based on the effective
interest rate method.
Derecognition of Financial Assets and Liabilities
Financial assets
A financial asset (or, where applicable a part of a financial asset or part of a group of similar
financial assets) is derecognized where a) the rights to receive cash flows from the asset have
expired; b) the Group retains the right to receive cash flows from the asset, but has assumed an
obligation to pay them in full without material delay to a third party under a pass-through
arrangement; or c) the Group has transferred its rights to receive cash flows from the asset and
either (i) has transferred substantially all the risks and rewards of the asset, or (ii) has neither
transferred nor retained substantially all the risks and rewards of the asset, but has transferred
control of the asset.
Where the Group has transferred its rights to receive cash flows from an asset and has neither
transferred nor retained substantially all the risks and rewards of the asset nor transferred control
of the asset, the asset is recognized to the extent of the Group’s continuing involvement in the
asset. Continuing involvement that takes the form of a guarantee over the transferred asset is
measured at the lower of the original carrying amount of the asset and the maximum amount of
consideration that the Group could be required to repay.
Financial liabilities
A financial liability is derecognized when the obligation under the liability is discharged or
cancelled or expires.
Where an existing financial liability is replaced by another from the same lender on substantially
different terms, or the terms of an existing liability are substantially modified, such an exchange or
modification is treated as a derecognition of the original liability and the recognition of a new
liability, and the difference in the respective carrying amount is recognized in income.
Offsetting
Financial assets and financial liabilities are only offset and the net amount is reported in the
consolidated balance sheet when there is a legally enforceable right to set off the recognized
amounts and the Group intends to either settle on a net basis, or to realize the asset and the liability
simultaneously.
Impairment of Financial Assets
The Group assesses at each balance sheet date whether a financial asset or group of financial
assets is impaired.
*SGVMC107821*
- 11 -
Assets carried at amortized cost
If there is objective evidence that an impairment loss on loans and receivables carried at amortized
cost has been incurred, the amount of the loss is measured as the difference between the asset’s
carrying amount and the present value of estimated future cash flows (excluding future credit
losses that have not been incurred) discounted at the financial asset’s original effective interest rate
(that is, the effective interest rate computed at initial recognition). The carrying amount of the
asset shall be reduced either directly or through use of an allowance account. The amount of the
loss shall be recognized in the consolidated statements of income.
If, in a subsequent period, the amount of the impairment loss decreases and the decrease can be
related objectively to an event occurring after the impairment was recognized, the previously
recognized impairment loss is reversed. Any subsequent reversal of an impairment loss is
recognized in the consolidated statements of income, to the extent that the carrying value of the
asset does not exceed its amortized cost at the reversal date.
Assets carried at cost
If there is objective evidence that an impairment loss on an unquoted equity instrument that is not
carried at fair value cannot be reliably measured, the amount of the loss is measured as the
difference between the asset’s carrying amount and the present value of estimated future cash
flows discounted at the current market rate of return for a similar financial asset.
Available-For-Sale Securities (AFS)
If an available-for-sale securities is impaired, an amount comprising the difference between its
cost (net of any principal payment and amortization) and its current fair value, less any impairment
loss previously recognized in income, is transferred from the stockholders’ equity to the
consolidated statements of income. Reversals in respect of equity instruments classified as
available-for-sale securities are not recognized in income. Reversals of impairment losses on debt
instruments are reversed through income, if the increase in fair value of the instrument can be
objectively related to an event occurring after the impairment loss was recognized in consolidated
statements of income.
Accounting Policies Prior to January 1, 2005
Marketable securities
Investments in marketable securities classified as current are stated at the lower of the aggregate
cost or market value, determined at balance sheet dates. The amount by which aggregate cost
exceeds market value is accounted for as a valuation allowance. Changes in the valuation
allowance are included in income. Realized gains and losses from the sale of current marketable
securities are also included in income.
Investments in marketable securities classified as noncurrent are carried at the lower of aggregate
cost or market value. The excess of cost over market value of noncurrent marketable securities is
charged to “Reserve for fluctuation in value of investment in noncurrent marketable equity
securities” account shown under the stockholders’ equity section of the consolidated balance
sheets.
*SGVMC107821*
- 12 -
Receivables from Customers and Allowance for Probable Losses
Receivables from customers are stated at the outstanding principal balance reduced by allowance
for probable losses.
Allowance for probable losses is established for estimated losses on receivables from clients and
foreclosed collaterals. Allowance for probable losses is established on estimated losses based on
periodic examination and evaluation by management of existing risks and affecting the assets and
collections and loss experience of the Group. Bad debts are written off when identified.
Other investments
Other investments in shares of stock are carried at cost less allowance for permanent decline in
value of investments.
Preferred shares
Preferred shares are stated at par value and presented under the capital stock account in the
consolidated balance sheet.
Long-term Receivables
Long-term receivables are stated at face value, less any allowance for doubtful accounts, if any.
Inventories
Inventories are valued at the lower of cost or net realizable value (NRV). Cost of inventories is
generally determined primarily using the moving-average method, except for certain parts and
supplies, which are accounted for using the first-in, first-out method and for automotive units
which is accounted for using the specific identification method. NRV is the selling price in the
ordinary course of business, less the estimated costs of completion of inventories and the
estimated costs necessary to sell.
Land Classified as Held for Sale
Land classified as held for sale is stated at the lower of carrying value or fair market value less
cost to sell.
Other Assets Classified as Held for Sale
Other assets held for sale is stated at the lower of carrying value or fair market value less cost to
sell.
Property, Plant and Equipment
Property, plant and equipment are stated at cost, less accumulated depreciation, amortization and
impairment loss, if any, except for land which is carried at revalued amount.
Depreciation is computed using the straight-line method over the following average estimated
useful lives:
Buildings and improvements
Power plant
Machinery, tools and construction equipment
Transportation and service equipment
Furniture, fixtures and office equipment
Library books
10 - 20 years
15 years
5 - 10 years
4 - 5 years
2 - 10 years
5 years
*SGVMC107821*
- 13 -
Amortization of leasehold improvements is computed over the estimated useful life of the
improvement or term of the lease, whichever is shorter.
The useful life and depreciation method are reviewed periodically to ensure that the period and
method of depreciation are consistent with the expected pattern of economic benefits from items
of property and equipment.
Minor repairs and maintenance costs are charged to consolidated statements of income as
incurred; significant renewals and betterments are capitalized. When assets are retired or
otherwise disposed of the cost, appraisal increase and related accumulated depreciation and
amortization are removed from the accounts and any resulting gains or losses are reflected in the
consolidated statements of income.
Construction in progress represents property, plant and equipment under construction and is stated
at cost. This includes cost of construction, plant and equipment and other direct costs.
Construction in progress is not depreciated until such time that the relevant assets are completed
and put into operational use.
Investment properties
Investment properties are measured at cost, including transaction costs. The carrying amount
includes the cost of replacing part of an existing investment property at the time that cost is
incurred if the recognition criteria are met.
Investment properties are derecognized when either they have been disposed of or when the
investment property is permanently withdrawn from use and no future economic benefit is
expected from its disposal. Any gains or losses on the retirement or disposal of an investment
property are recognized in the consolidated statements of income in the year of retirement or
disposal.
Impairment of Non-Financial Assets
The Group assesses at each balance sheet date whether there is an indication that an asset may be
impaired. If any such indication exists, or when annual impairment testing for an asset is
required, the Group makes an estimate of the asset’s recoverable amount. An assets’ recoverable
amount is the higher of an asset’s or cash-generating unit’s fair value less costs to sell and its
value in use and is determined for an individual asset, unless the asset does not generate cash
inflows that are largely independent of those from other assets or groups of assets. Where the
carrying amount of an asset exceeds its recoverable amount, the asset is considered impaired and
is written down to its recoverable amount. In assessing value in use, the estimated future cash
flows are discounted to their present value using pre-tax discount rate that reflects current market
assessment of the time value of money and the risks specific to the asset. Impairment losses are
recognized in the consolidated statements of income in those expense categories consistent with
the function of the impaired asset.
An assessment is made at each balance sheet date as to whether there is any indication that
previously recognized impairment losses may no longer exist or may have decreased. If such
indication exists, the recoverable amount is estimated. A previously recognized impairment loss is
reversed only if there has been a change in the estimates used to determine the asset’s recoverable
*SGVMC107821*
- 14 -
amount since the last impairment loss was recognized. If that is the case, the carrying amount of
the asset is increased to its recoverable amount. That increased amount cannot exceed the carrying
amount that would have been determined, net of depreciation, had no impairment loss been
recognized for the asset in prior years. Such reversal is recognized in income.
Borrowing Costs
Borrowing costs are generally expensed as incurred. Borrowing costs are capitalized if they are
directly attributable to the development of a qualifying asset. Capitalization of borrowing costs
commences when the activities to prepare the asset are in progress and expenditures and
borrowing costs are being incurred. Borrowing costs are capitalized until the assets are ready for
their intended use. If the resulting carrying amount of the asset exceeds its recoverable amount, an
impairment loss is recorded. Borrowing costs include interest charges and other costs incurred in
connection with the borrowing of funds.
Revenue and Cost Recognition
Revenue is recognized to the extent that it is probable that the economic benefits will flow to the
Group and the revenue can be reliably measured. The following specific recognition criteria must
also be met before revenue is recognized:
Construction contracts
Revenues from construction contracts are recognized using the percentage of completion method
of accounting. Under this method, revenues are generally measured on the basis of estimated
completion of the physical proportion of the contract work. Revenues from labor supply contracts
with project management and supervision are recognized on the basis of man-hours spent.
Contract costs include all direct materials, labor costs and indirect costs related to contract
performance. Provisions for estimated losses on uncompleted contracts are recognized
immediately when it is probable that the total contract costs will exceed the total contract
revenues. The amount of such loss is determined irrespective of: (a) whether or not work has
commenced on the contract, (b) the stage of completion of contract work; or (c) the amount of
profits expected to arise on other contracts. Changes in contract performance, contract conditions,
and estimated profitability, including those arising from penalty provisions and final contract
settlements, which may result in revisions to estimated costs and gross margins, are recognized in
the year in which the changes are determined.
The contract jobs in progress account represents contract costs and estimated gross margin on
uncompleted contracts for billing. Contract retentions are included in the contracts receivable
account, which is shown as part of the receivables account in the consolidated balance sheets.
Merchandise sales
Revenue from merchandise sales is normally recognized when the buyer accepts delivery and
when installation and inspection are complete. However, revenue is recognized immediately upon
the buyer’s acceptance of delivery when the installation process is simple in nature.
Service and commission income
Service and commission income are recognized as the related services are rendered.
*SGVMC107821*
- 15 -
Real estate sales
Sales of developed lots and residential units, where there are material obligations under the sales
contracts to provide improvements after the property is sold, are accounted for under the
percentage of completion method. Under this method, the gain on sale is recognized as the related
obligations are fulfilled. Cost of developed lots and residential units sold before the completion of
the development is determined on the basis of the actual development costs incurred plus
estimated development costs to complete the project.
Income on sale of raw parcels of land with no future obligation to develop the property is based on
the difference between the selling price and actual cost of the property.
Interest income
Interest income is recognized as revenue as interest accrues.
Revenues from school operations are recognized over the corresponding school term. Unearned
revenues are shown as unearned tuition fees in the consolidated balance sheets.
Rent income is accounted on a straight-line basis over the lease term.
Management, service and consultancy fees are recognized as services are rendered.
Dividend income is recognized when the Group’s right to receive the payment is established.
Goodwill
Goodwill acquired in a business combination is initially measured at cost being the excess of the
cost of the business combination over the Group’s interest in the net fair value of the identifiable
assets, liabilities and contingent liabilities. Goodwill is measured at cost less any accumulated
impairment losses. Goodwill is reviewed for impairment, annually or more frequently if events or
changes in circumstances indicate that the carrying value may be impaired.
Impairment is determined by assessing the recoverable amount of the cash-generating unit (group
of cash generating units), to which the goodwill relates. Where the recoverable amount of the
cash-generating unit (group of cash-generating units) is less than the carrying amount, an
impairment loss is recognized.
Foreign Currency Translation
The consolidated financial statements are presented in Philippine Peso, which is the Company’s
functional and presentation currency. Each entity in the Group determines its own functional
currency and items included in the consolidated financial statements of each entity are measured
using that functional currency. Transactions in foreign currencies are initially recorded in the
functional currency rate at the date of the transaction. Monetary assets and liabilities denominated
in foreign currencies are retranslated at the functional currency closing rate at the balance sheet
date. All differences are taken to income. Non-monetary items that are measured in terms of
historical cost in foreign currency are translated using the exchange rates as at the dates of initial
transactions. Non-monetary items measured at fair value in a foreign currency are translated using
the exchange rates at the date when the fair value was determined.
*SGVMC107821*
- 16 -
The functional currency of EEI-BVI and Clear Jewel, foreign subsidiaries, is the United States
Dollar. As at reporting date, the assets and liabilities of these subsidiaries are translated into the
presentation currency of the Group (the Philippine Peso) at the exchange rate at the balance sheet
date and the consolidated statements of income are translated at weighted average exchange rates
for the year. The exchange differences arising on the translation are taken directly to a separate
component of stockholders’ equity. On disposal of a foreign entity, the deferred cumulative
amount recognized in stockholders’ equity relating to that particular foreign operation is
recognized in the consolidated statements of income.
Retirement Cost
The Group’s retirement expense is actuarially determined using the projected unit credit method.
Under this method, the current service cost is the present value of retirement benefits payable in
the future with respect to services rendered in the current period.
The accrued retirement liability recognized in the consolidated balance sheet is the present value
of benefits payable in the future with respect to services rendered to date and unrecognized
actuarial gains and losses reduced by the fair value of plan assets out of which the obligation are to
be settled directly.
Actuarial gains and losses are recognized as income or expense when the net cumulative
unrecognized actuarial gains and losses of the plan at the end of the previous reporting year
exceeded 10% of the higher of the defined benefit obligation and the fair value of plan assets at
that date. These actuarial gains and losses are recognized over the expected average remaining
working lives of the employees participating in the plan.
Income Tax
Deferred income tax is provided using the balance sheet liability method on temporary differences
at the balance sheet date between the tax bases of assets and liabilities and their carrying amounts
for financial reporting purposes.
Deferred income tax liabilities are recognized for all taxable temporary differences, including
asset revaluations. Deferred income tax assets are recognized for all deductible temporary
differences, carryforward of unused tax credits from excess minimum corporate income tax
(MCIT) and net operating loss carryover (NOLCO), to the extent that it is probable that taxable
profit will be available against which the deductible temporary differences and carryforward of
unused MCIT and NOLCO can be utilized.
Deferred tax liabilities are not provided on non-taxable temporary differences associated with
investments in domestic subsidiaries, associates, and interests in joint ventures. With respect to
investments in foreign subsidiaries, associates and interest in joints ventures, deferred tax
liabilities are recognized except where the timing of the reversal of the temporary differences can
be controlled and it is probable that the temporary differences will not reverse in the foreseeable
future.
*SGVMC107821*
- 17 -
The carrying amount of deferred income tax assets is reviewed at each balance sheet date and
reduced to the extent that it is no longer probable that sufficient taxable profit will be available to
allow all or part of the deferred income tax asset to be used. Unrecognized deferred income tax
assets are reassessed at each balance sheet date and are recognized to the extent that it has become
probable that future taxable profit will be available to allow the deferred tax assets to be
recovered.
Deferred income tax assets and liabilities are measured at the tax rates that are expected to apply
in the year when the asset is realized or the liability is settled, based on tax rates (and tax laws)
that have been enacted or substantively enacted at the balance sheet date.
Deferred income tax relating to items directly recorded in the stockholders’ equity is recognized in
the stockholders’ equity and not in the consolidated statements of income.
Deferred tax assets and deferred tax liabilities are offset, if a legally enforceable right exists to set
off current tax assets against current tax liabilities and deferred taxes relate to the same entity and
the same taxation authority.
Leases
Finance leases, which transfer to the Group substantially all the risks and benefits incidental to
ownership of the leased item, are capitalized at the inception of the lease at the fair value of the
leased property or, if lower, at the present value of the minimum lease payments. Lease payments
are apportioned between the finance charges and reduction of the lease liability so as to achieve a
constant rate of interest on the remaining balance of the liability. Finance charges are charged
directly against income.
Operating lease payments are recognized as an expense in the consolidated statements of income
on a straight-line basis over the lease term.
Earnings Per Share
Basic earnings per share attributable to equity holders of the Parent Company is computed based
on weighted average number of issued and outstanding common shares after giving retroactive
effect for any stock dividends. There are no dilutive potential common shares that would require
disclosure of diluted earnings per share in the consolidated financial statements.
Provisions
Provisions are recognized when (a) the Group has a present obligation (legal or constructive) as a
result of a past event, (b) it is probable that an outflow of resources embodying economic benefits
will be required to settle the obligation and (c) a reliable estimate can be made of the amount of
the obligation.
Contingencies
Contingent liabilities are not recognized in the consolidated financial statements. They are
disclosed unless the possibility of an outflow of resources embodying economic benefits is
remote. A contingent asset is not recognized in the consolidated financial statements but disclosed
when an inflow of economic benefits is probable.
*SGVMC107821*
- 18 -
Stock Option Plan
No benefit expense are recognized relative to stock options granted. When options are exercised,
these are treated as capital stock issuances. The stock option plan is exempt from PFRS 2.
Subsequent Events
Post year-end events that provide additional information about the Group’s situation at the balance
sheet date (adjusting events) are reflected in the consolidated financial statements. Post year-end
events that are not adjusting events are disclosed in the notes when material.
3. Significant Accounting Judgments and Estimates
The preparation of the consolidated financial statements in compliance with PFRS requires the
Group to make estimates and assumptions that affect the reported amounts of assets, liabilities,
income and expenses and disclosure of contingent assets and contingent liabilities. Future events
may occur which can cause the assumptions used in arriving at those estimates to change. The
effects of any changes in estimates will be reflected in the consolidated financial statements as
they become reasonably determinable.
Estimates and judgments are continually evaluated and are based on historical experience and
other factors, including expectations of future events that are believed to be reasonable under the
circumstances.
PAS 1, which was adopted by the Group effective January 1, 2005, requires disclosures about key
sources of estimation and judgments management has made in the process of applying accounting
policies. The following presents a summary of these significant accounting judgments and
estimates:
Estimating allowance for doubtful accounts
The Group maintains an allowance for doubtful accounts at a level considered adequate to provide
for potential uncollectible receivables. The level of this allowance is evaluated by management on
the basis of factors that affect the collectibility of the accounts. These factors include, but are not
limited to, the length of the Group’s relationship with the customer, the customer’s payment
behavior and known market factors. The Group reviews the age and status of receivables, and
identifies accounts that are to be provided with allowances on a continuous basis.
The amount of timing and recorded expenses for any period would differ if the Group made
different judgments or utilized different estimates. An increase in the allowance for doubtful
accounts would increase recorded operating expenses and decrease current assets.
Allowance for doubtful accounts amounted to P
=263.4 million and P
=273.4 million in 2004 and
2005, respectively (Note 6).
*SGVMC107821*
- 19 -
Estimating useful lives of property and equipment
The Group estimated the useful lives of its property, plant and equipment based on the period over
which the assets are expected to be available for use. The Group reviews annually the estimated
useful lives of property, plant and equipment based on the factors that include asset utilization,
internal technical evaluation, technological changes, environmental and anticipated use of the
assets tempered by related industry benchmark information. It is possible that future results of
operations could be materially affected by changes in these estimates brought about by changes in
the factors mentioned. A reduction in the estimated useful lives of property, plant and equipment
would increase the recorded depreciation and amortization expense and decrease noncurrent
assets.
As of December 31, 2005 and 2004, the net book value of the depreciable property, plant and
equipment amounted to P
=1.1 billion and P
=1.2 billion, respectively (see Note 10).
Asset impairment
The Group assesses impairment on assets whenever events or changes in circumstances indicate
that the carrying amount of an asset may not be recoverable. The factors that the Group considers
important which could trigger an impairment review include the following:
· Significant underperformance relative to expected historical or projected future operating
results;
· Significant changes in the manner of use of the acquired assets or the strategy for overall
business; and
· Significant negative industry or economic trends.
An impairment loss is recognized whenever the carrying amount of an asset exceeds its
recoverable amount. The recoverable amount is the higher of an asset’s net selling price and value
in use. The net selling price is the amount obtainable from the sale of an asset in an arm’s length
transaction while value in use is the present value of estimated future cash flows expected to arise
from the continuing use of an asset and from its disposal at the end of its useful life. Recoverable
amounts are estimated for individual assets or, if it is not possible, for the cash-generating unit to
which the asset belongs.
In determining the present value of estimated future cash flows expected to be generated from the
continued use of the assets, the Group is required to make estimates and assumptions that can
materially affect the consolidated financial statements.
Retirement benefits
The determination of the obligation and cost of retirement benefits is dependent on the selection of
certain assumptions used by actuaries in calculating such amounts. Those assumptions include,
among others, discount rates, expected returns on plan assets and salary increase rates. In
accordance with PAS 19, actual results that differ from the Group’s assumptions are accumulated
and amortized over future periods and therefore, generally affect the recognized expense and
recorded obligation in such future periods. While the Group believes that the assumptions are
reasonable and appropriate, significant differences in the actual experience or significant changes
in the assumptions may materially affect the pension and other retirement obligations.
Unrecognized actuarial losses amounted to P
=39.3 million and P
=5.1 million as of
December 31 2005 and 2004, respectively (Note 23).
*SGVMC107821*
- 20 -
Deferred income tax assets
The Group reviews the carrying amounts of deferred income taxes at each balance sheet date and
reduces deferred income tax assets to the extent that it is no longer probable that sufficient taxable
profit will be available to allow all or part of the deferred income tax assets to be utilized.
However, there is no absolute assurance that each legal entity in the Group will generate sufficient
taxable profit to allow all or part of its deferred income tax assets to be utilized. Deferred income
tax assets recognized amounted to P
=131.0 million and P
=114.3 million in 2005 and 2004,
respectively (Note 24).
Contingencies
The Group is currently involved in various proceedings. The estimate of the probable costs for the
resolution of these claims has been developed in consultation with outside counsel handling the
Group’s defense in these matters and is based upon an analysis of potential results. The Group
currently does not believe that these proceedings will have a material adverse effect on its
financial position. It is possible, however, that future results of operations could be materially
affected by changes in the estimates or in the effectiveness of the strategies relating to these
proceedings (see Note 26).
4. Cash and Cash Equivalents
This account consists of:
Cash on hand and in banks
Short-term investments
2005
P
=737,405,079
76,960,592
P
=814,365,671
2004
=533,752,608
P
305,179,791
=838,932,399
P
Cash in banks earns interest at the respective bank deposit rates. Short-term investments are made
for varying periods of up to three months depending on the immediate cash requirements of the
Group and earn interest at the respective short-term investment rates.
5. Loans Receivable
Loans receivable consist of:
Gross receivables
Less allowance for probable losses
Less noncurrent portion
Current portion
2005
P
=579,592,381
61,547,495
518,044,886
136,251,856
P
=381,793,030
2004
=659,658,652
P
27,135,804
632,522,848
174,212,256
=458,310,592
P
*SGVMC107821*
- 21 -
Loans receivable include the following receivables of FMLFC, a subsidiary engaged in leasing
and financing:
Receivables financed
Time loans
Lease contracts receivable
Restructured loans
Accrued interest receivable
Unearned discount and interest
Less allowance for probable losses
2005
P
=278,671,909
158,146,880
71,858,732
42,284,245
550,961,766
6,556,756
(2,937,697)
554,580,825
61,296,235
P
=493,284,590
2004
=277,889,849
P
198,109,039
118,882,001
64,965,655
659,846,544
11,579,731
(1,156,831)
670,269,444
26,768,614
=643,500,830
P
Receivables financed are due in monthly or quarterly installments extending up to 36 months. The
account includes various salary loans of teachers and employees of the Department of Education,
Culture and Sports (DECS) purchased from a life insurance company with outstanding balance of
=4.7 million. The account also includes a receivable amounting to P
P
=24.4 million and P
=25.0 million
as of December 31, 2005 and 2004, respectively, from a borrower with good credit standing and
updated principal and interest payments up to January 2005 who defaulted on its February 2005
amortization. The account was provided in full as of December 31, 2005 due to uncertainty of
collection.
This account also includes restructured salary loans of DECS teachers and employees with
outstanding balance of P
=17.7 million and P
=27.6 million as of December 31, 2005 and 2004,
respectively, consisting of approximately 3,136 individual loan accounts.
On December 31, 2005, FMLFC agreed to a full and complete settlement of approximately 891
accounts with the insurance company for a sum of P
=9.9 million. The amount is payable in 24
monthly installments, inclusive of principal and interest at 12% per annum.
Time loan principals are collectible in full at maturity date while interests are due monthly or at
maturity. The term of the loan ranges from one to twelve months.
Lease contracts receivable pertain to the cost of the leased equipment, net of its estimated residual
value of P
=50.9 million and P
=70.2 million as of December 31, 2005 and 2004, respectively. Upon
delivery of the leased equipment, the lessee is required to make a deposit which serves as guaranty
for the performance of the obligations under the lease contract. The deposit is refundable to the
lessee upon the expiration of the lease provided the lessee returns the unit leased. Deposits on
lease contracts as of December 31, 2005 and 2004 amount to P
=51.0 million and P
=71.2 million,
respectively. These deposits, net of residual value of leased equipment are included in Accrued
expenses and other liabilities. The term of the lease ranges from 24 to 60 months.
Loans, whose principal terms and conditions have been modified in accordance with a
restructuring agreement setting forth a new plan of payment or a schedule of payment on a
periodic basis, are reclassified as restructured loans.
*SGVMC107821*
- 22 -
In 2004, FMLFC foreclosed and attached real estate asset (included under other noncurrent assets
as assets held for sale) to cover restructured loans with a total of P
=37.3 million. Appraised value of
these foreclosed and attached properties as of December 20, 2004 is P
=51.9 million.
Also, in 2004, restructured loans include a P
=7.4 million interbank loan to Urban Bank, Inc. which
merged with Export and Industry Bank (Export Bank). As contained in their memorandum of
agreement dated May 15, 2001 the balance shall be due on the following dates plus interest of 7%
per annum payable quarterly:
September 14, 2005
September 14, 2006
September 14, 2007
=2,213,055
P
2,213,055
2,950,739
On July 13, 2005, FMLFC’s Board of Directors approved the sale of the above receivables at a
discount rate of 10% to Export Bank. Total loss on discounting amounted to P
=0.8 million.
Nonperforming accounts amount to P
=159.4 million and P
=49.9 million as of December 31, 2005
and 2004, respectively.
Details of receivables from customers of FMLFC are as follows:
a) As to concentration of credit by industry/economic sector
Services
Manufacturing
Trading/commercial
Financial institutions
Consumption
Others
2005
P
=216,166,884
103,376,365
67,506,454
52,921,305
61,791,497
49,199,261
P
=550,961,766
2004
=322,095,910
P
111,121,737
84,278,787
45,874,594
76,747,034
19,728,482
=659,846,544
P
b) As to secured and unsecured and type of security for secured loans
Secured loans
Chattel mortgage
Real estate mortgage
Others
Unsecured loans
2005
2004
P
=349,052,418
69,118,036
90,525,626
508,696,080
42,265,686
P
=550,961,766
=381,760,303
P
81,919,759
145,103,415
608,783,477
51,063,067
=659,846,544
P
Other collaterals pertain to automobiles and equipment under leasing agreements.
*SGVMC107821*
- 23 -
c) As to maturity
Short-term
Long-term
Maturing within one year
Maturing one year to five years
2005
P
=302,203,572
2004
=335,447,939
P
120,802,077
127,956,117
248,758,194
P
=550,961,766
157,547,173
166,851,432
324,398,605
=659,846,544
P
The changes in allowance for probable losses at December 31 follow:
Balance at beginning of year
Effect of change in accounting policy on
financial instruments
Provision for probable losses
Transfer from assets held for sale
Accounts written off
Balance at end of year
2005
P
=26,768,614
2004
=18,154,770
P
(877,750)
25,172,531
10,307,976
(75,136)
P
=61,296,235
–
11,863,000
–
(3,249,156)
=26,768,614
P
In the ordinary course of business, FMLFC has loan transactions with its directors, officers,
stockholders and related interest (DOSRI). The BSP regulations limits the aggregate loans to
DOSRI and the level at which such loans must be secured. As of December 31, 2005 and 2004,
FMLFC was in full compliance with the BSP regulations on DOSRI loans.
Details of FMLFC’s DOSRI loans are as follows:
Outstanding DOSRI loans
% to total outstanding receivables
% to total outstanding DOSRI loans
Unsecured DOSRI loans
Past due DOSRI loans
Non-performing DOSRI loans
2005
P
=72,450,840
13.15 %
2004
=48,289,192
P
7.32%
–
15.83 %
15.83 %
–
–
–
2005
2004
P
=1,902,958,829
155,252,522
2,058,211,351
263,458,257
P
=1,794,753,094
=1,235,785,383
P
436,048,976
1,671,834,359
273,423,364
=1,398,410,995
P
6. Accounts Receivable
This account consists of:
Trade receivables (including retention receivable
of P
=286,327,901 in 2005 and P
=179,749,891 in
2004)
Other receivables
Less allowance for doubtful accounts
*SGVMC107821*
- 24 -
7. Inventories
This account consists of:
Land - at cost
Merchandise - at NRV
Construction materials - at cost
Spare parts and supplies- at NRV
2005
P
=589,148,360
393,895,750
10,789,404
4,480,190
P
=998,313,704
2004
=621,972,525
P
403,066,150
13,345,322
−
=1,038,383,997
P
Land included in inventories relates to real estate development projects being undertaken by EEI
Realty, either on its own or other parties, as follows:
Suburbia East
Robinson’s Homes, Incorporated (RHI)
Ayala Greenfield Development Corporation
(Greenfield)
2005
P
=283,171,992
217,061,244
2004
=315,996,157
P
217,061,244
88,915,124
P
=589,148,360
88,915,124
=621,972,525
P
a. The amended Memorandum of Agreement dated April 19, 1999 between EEI Realty and
Greenfield provides for the following:
i.
Sale of nine parcels of land with a total area of 133,550 square meters by EEI Realty to
Greenfield. Payment terms include the turnover of certain developed lots from the nine
parcels of land. In 2003, eleven developed lots valued at P
=48.2 million were transferred to
EEI Realty as part of this arrangement.
ii. Contribution of parcels of land with a total area of 111,906 square meters by EEI Realty,
as its participating interest, in a joint venture project with Greenfield. Under the terms of
the agreement, EEI Realty’s net landowner’s interest shall be in the form of developed
lots for the residential component and golf club shares for the golf course component, and
shall be allocated at 30% for EEI Realty and 70% for Greenfield.
b. On April 24, 1998, EEI Realty entered into a joint venture (JV) agreement with RHI to
contribute certain parcels of land to the JV for development by RHI into a residential
subdivision. Under the JV agreement, the share of EEI Realty and RHI on the saleable lots
shall be 40% and 60%, respectively.
EEI Realty granted RHI the exclusive right to construct housing units on EEI Realty’s share of
the saleable lots from the JV project and construction of the housing units shall be solely for
RHI’s account. EEI Realty also granted RHI the exclusive marketing rights over its share of
the saleable lots from the JV project. EEI Realty shall reimburse RHI for marketing and
administration expense of 10% of the lot selling price deductible from EEI Realty’s share on
every lot sold.
*SGVMC107821*
- 25 -
In consideration of EEI Realty’s entering into the JV Agreement, RHI granted EEI Realty
=50.0 million as non-interest bearing cash advance. The cash advance shall be liquidated
P
using the proceeds from sale of the lots allocated to EEI Realty. In 2000, the JV started
selling developed lots, the proceeds of which were deducted from the cash advance. As of
December 31, 2005 and 2004, the outstanding balance of the cash advance, which is shown as
part of Accounts payable and accrued expenses in the consolidated balance sheets, amounted
to P
=38.9 million.
On July 11, 2005, EEI Realty and RHI mutually agreed to reduce the JV area from
72.79 hectares to 12.89 hectares. The share of EEI Realty and RHI on the saleable lots shall be
25% and 75%, respectively, starting May 1, 2005. As of December 31, 2005, the JV area is
still being managed by RHI, while the remaining area has been turned over to EEI Realty.
c. EEI Realty has an ongoing project in Suburbia East, Marikina. The master plan for the 98,009
square meters property project was completed and the development permit application for the
subdivision plan was approved on September 14, 2000 by the city government of Marikina.
On May 2, 2002 the Housing and Land Use Regulatory Board issued a Certificate of
Registration and License to Sell to EEI Realty for the sale of saleable lots/units with lots in
Suburbia East Phase I. Phase I development work has been completed.
8. Available-for-Sale Securities
Available-for-sale securities in 2005 consist of:
Quoted shares
Unquoted shares
Less accumulated impairment losses
Less current portion
2005
P
=132,436,113
476,636,004
609,072,117
98,261,406
510,810,711
58,484,354
P
=452,326,357
2004
=123,812,585
P
552,850,533
676,663,118
108,805,541
567,857,577
–
=567,857,577
P
In 2004, investments in securities were classified under other investments in shares of stock
account.
*SGVMC107821*
- 26 -
9. Investments in Associates
The details of investments accounted for under the equity method are as follows:
2005
Acquisition cost:
Balance at beginning of year
Acquisitions during the year
Disposals during the year
Balance at end of year
Accumulated equity in net earnings (losses):
Balance at beginning of year
Equity in net earnings for the year
Disposals during the year
Dividends received
Balance at end of year
Equity in cumulative translation adjustment
2004
P
=425,658,614
–
(15,386,363)
410,272,251
=398,922,820
P
26,735,794
–
425,658,614
186,638,289
152,630,865
(55,882,056)
(45,699,935)
237,687,163
20,856,943
P
=668,816,357
(76,057,909)
284,591,127
–
(21,894,929)
186,638,289
29,914,847
=642,211,750
P
Summarized financial information of significant associates are as follows:
Total Assets
Total Liabilities
Associates
2004
2004
2005
2005
MMPC
P2,356,414,419 P
=1,834,511,121
P
= 2,378,375,568 =
=1,905,090,135 P
ARCC
670,838,499 1,228,721,938
404,806,094 1,115,602,420
SECC
314,044,729
721,609,235
287,454,038
734,507,504
C&E
225,258,982
33,137,025
–
–
Net Income (Loss)
2004
2005
=147,221,016
P
P
=117,675,585
294,423,976
150,970,980
(3,308,955)
(39,518,542)
36,052,683
–
10. Property, Plant and Equipment
In 2005, the rollforward analysis of this account follows:
2005
Machinery,
Furniture,
Tools and Transportation
Buildings and
Improvements
Power Plant
Fixtures,
Construction
and Service
and Office
Library
Construction
Equipment
Equipment
Equipment
Books
in Progress
Total
Cost
At beginning of year
Additions
Disposals/retirements
At end of year
Accumulated Depreciation
and Amortization
At beginning of year
Depreciation and
amortization (Note 22)
Disposals/retirements
At end of year
Net Book Value at Cost
=1,202,193,208
P
=40,653,590 P
P
=905,794,624 P
=239,237,689 P
=674,512,768
=5,235,627 P
P
=3,091,491,497
-
15,249,319
8,895,719
(3,547,752)
-
(60,243,667)
(11,850,945)
1,326,542,167
40,653,590
860,800,276,
236,282,463
721,720,337
29,795,015
8,056,866 3,223,850,714
608,079,002
25,183,181
703,917,720
167,295,241
412,820,542
12,023,364
- 1,929,319,050
57,619,845
2,730,072
57,621,372
17,332,857
127,771,911
17,771,651
-
280,847,708
(49,177)
-
(53,529,502)
(6,737,272)
-
-
(65,230,408)
665,649,670
27,913,253
708,009,590
177,890,826
=660,892,497
P
=12,740,337 P
P
=152,790,686
52,199,929
=23,863,991
P
127,896,711
(4,992,360)
(4,914,457)
5,951,737
2,821,239
213,014,654
(20,713)
-
(80,655,437)
535,677,996
29,795,015
- 2,144,936,350
=58,391,637 P
P
=186,042,341
=P
=8,056,866 P
P
=1,078,914,364
*SGVMC107821*
- 27 -
Land at Revalued Amount
Balance at beginning of year
Reclassification to land classified as held for sale
=2,872,825,305
P
355,185,100
P
= 2,517,640,205
2004
Buildings and
Improvements
Power Plant
Machinery,
Tools and
Construction
Equipment
=1,152,890,966
P
=40,653,590
P
=993,778,316
P
=223,687,283
P
=664,453,496
P
=24,619,091
P
=9,550,393
P
49,982,893
–
12,295,166
31,679,040
73,582,920
5,022,856
9,146,422
–
(100,278,858)
(16,128,634)
(63,523,648)
(5,777,956)
Transportation
and Service
Equipment
Furniture,
Fixtures,
and Office
Equipment
Library
Books
Construction
in Progress
Total
=3,109,633,135
P
Cost
At beginning of year
Additions
Disposals/retirements
At end of year
(680,651)
(13,461,188)
181,709,297
(199,850,935)
1,202,193,208
40,653,590
905,794,624
239,237,689
674,512,768
23,863,991
5,235,627
3,091,491,497
519,414,961
22,453,110
710,421,085
162,567,841
390,279,486
13,652,903
–
1,818,789,386
89,191,854
2,730,071
73,470,408
16,671,188
81,688,126
4,148,417
–
267,900,064
(79,973,773)
(11,943,788)
(59,147,070)
(5,777,956)
–
(157,370,400)
Accumulated Depreciation
and Amortization
At beginning of year
Depreciation and
amortization (Note 22)
Disposals/retirements
At end of year
Net Book Value at Cost
(527,813)
–
608,079,002
25,183,181
703,917,720
167,295,241
412,820,542
12,023,364
–
1,929,319,050
P
= 594,114,206
P
= 15,470,409
P
= 201,876,904
P
= 71,942,448
P
= 261,692,226
P
= 11,840,627
P
= 5,235,627
P
= 1,162,172,447
In 2004, the rollforward analysis of this account follows:
Land at Revalued Amount
At beginning of year
=2,854,828,305
P
Additional revaluation
17,997,000
At end of year
=2,872,825,305
P
Land at cost amounted to P
=2,065,085,773 in 2005 and P
=2,141,155,576 in 2004.
In 2005, EEI decided to dispose certain parcels of land, mainly in Mangahan and Lemery
locations. Management believes that the disposal of these parcels of land is expected to be
completed in 2006. As of March 30, 2006, the negotiations for the sale of these properties are still
in progress.
Correspondingly, the Group reclassified these parcels of land from property, plant and equipment
to land classified as held for sale.
11. Goodwill
This account consists of:
Balance at beginning of year
Less provision for impairment (Note 21)
Balance at end of year
2005
P
=552,927,242
42,624,000
P
=510,303,242
2004
(As restated)
=597,727,380
P
44,800,138
=552,927,242
P
*SGVMC107821*
- 28 -
12. Other Noncurrent Assets
Other assets consist of:
Investment properties (net of allowance for
impairment losses of P
=3,912,298 in 2005 and
=12,900,021 in 2004)
P
Others (Note 23)
2005
2004
(As restated)
P
=100,252,616
90,311,358
P
=190,563,974
=156,112,958
P
184,341,956
=340,454,914
P
2005
P
=2,597,605,628
113,586,881
44,871,280
3,795,702
P
=2,759,859,491
2004
(As restated)
=2,371,210,307
P
15,984,809
56,757,579
31,892,903
=2,475,845,598
P
2005
P
=2,784,370,978
140,312,771
P
=2,924,683,749
2004
=2,547,977,556
P
432,802,444
=2,980,780,000
P
13. Accounts Payable and Accrued Expenses
This account consists of:
Accounts payable and accrued expenses (Note 23)
Accrued interest payable (Note 32)
Subscriptions payable
Others
14. Loans Payable
This account consists of:
Loans payable
Money market placements
Money market placements pertain to short-term borrowings from private firms and individuals
with annual interest rates ranging from 6% to 9% in 2005 and 5% to 10.36% in 2004.
Loans payable substantially consist of unsecured loans obtained from local banks and an associate
with annual interest rates ranging from 11% to 15% and 10% to 15% for 2005 and 2004,
respectively. Loans amounting to P
=247.0 million and P
=188.0 million in 2005 and 2004,
respectively, are secured by an assignment of various lease contract receivables and receivables
financed amounting to P
=240.0 million and P
=55.2 million in 2005 and 2004, respectively.
*SGVMC107821*
- 29 -
As of December 31, 2005, secured bank loans are collateralized by EEI’s construction contracts
and mortgages on certain property and equipment with a net book value of P
=312.0 million, land
classified as held for sale with carrying value of P
=355.0 million and receivables amounting to
=437.0 million (including retention receivables amounting to P
P
=241.0 million).
Certain loans from an associate are secured by the Company’s investment in this associate
amounting to P
=207.3 million in 2005 and 2004.
15. Long-term Debt
This pertains to long-term debt of the following companies:
MCI
Peso-denominated bank loans with interest
of 11% in 2005 and 2004 payable in
accelerating amounts up to July 31, 2019
EEI
Peso-denominated bank loans payable in
quarterly installments from 2003 to 2007
with interest ranging from 8.4% to 15% in
2005 and 9.03% to 15% in 2004
EEI Realty
Peso-denominated bank loan payable semiannually starting January 2004 with annual
interest rate at 11.25%
Peso-denominated bank loan payable in 60 equal
monthly installments starting January 2003
with annual interest at 10.25%
EEI Power
Euro-denominated bank loans
Commercial loan - payable in 12 semiannual installments up to May 2007
with interest at EURIBOR plus 1.2%
Credit facility - payable in six equal semiannual installments up to January 2005
with interest at CIRR of 6.5%
2005
2004
P
=778,593,750
=799,218,750
P
168,501,514
391,696,762
86,857,143
130,285,715
−
10,677,150
49,967,991
101,504,501
−
49,967,991
6,469,241
107,973,742
(Forward)
*SGVMC107821*
- 30 -
2005
FMLFC
Peso-denominated bank loans with interest
ranging from 7.26% to 9.95% in 2005 and
6.67% to 9.77% in 2004
The Company
Peso-denominated bank loans payable in
quarterly installments from 2003 to 2007
with interest ranging from 8% to 15% in
2005 and 9% to 15% in 2004.
Less current portion of long-term debt
2004
281,262,859
=38,104,238
P
−
1,365,183,257
490,024,520
P
=875,158,737
17,650,000
1,495,606,357
334,913,384
=1,160,692,973
P
MCI
As collateral, MCI transferred and conveyed by way of first Mortgage in favor of the related bank
and its successors and assigned all its rights and interest in a parcel of land and the improvements,
as well as other improvements that may be constructed or installed on the improvements.
EEI
The peso-denominated loans as of December 31, 2005 are collateralized by a mortgage on a real
estate property with book value of P
=784 million and a chattel mortgage on certain machinery and
construction equipment with aggregate net book values of P
=36 million. The loan agreements
provide for certain restrictions with respect to, among others, disposal of properties given as
collateral, guaranty of any debt, and maintenance of certain financial ratios.
EEI Realty
The bank loans are secured by a real estate mortgage on nine parcels of land (classified as part of
inventories) with aggregate book value of P
=283.2 million as of December 31, 2005.
EEI Power
The Euro-denominated bank loans amounting to Euro 795,061 and Euro 1,409,557 as of
December 31, 2005 and 2004, respectively, which were used to finance the acquisition of two 5.2
megawatt diesel generator sets, are secured by a first demand guarantee with a local bank.
The Company
This loan is secured by a registered real estate mortgage on a certain parcel of land owned by the
Company with carrying value as of December 31, 2004 amounting to P
=171.1 million. The loan
agreements contain covenants regarding merger and consolidation, maintenance of certain
financial ratios, incurrence of additional long-term debt or guarantees, creation of property
encumbrances, and disposal of a substantial portion of the Company’s assets.
The agreements covering all of the above long-term debt provide certain restrictions with respect
to, among others, usage of loan proceeds, disposal of properties given as collateral, guaranty of
any debt, change in ownership or management set-up, dividend declaration, merger or
consolidation and maintenance of certain financial ratios.
The Group substantially complied with these restrictions and requirements.
*SGVMC107821*
- 31 -
16. EEI’s Stock Option Plan
The EEI’s stock option plan, as amended (Amended Plan), sets aside 44.4 million common shares
for stock options available to regular employees, officers, and directors of EEI.
Under the Amended Plan, the option price should be equal to the net book value of EEI’s common
stock but not less than 80% of the average market price quoted in the Philippine Stock Exchange
(PSE) for five trading days immediately preceding the grant, but in no case less than the par value.
The option price should be paid over a period of five years in 120 equal semi-monthly
installments. Shares acquired under the Amended Plan are subject to a holding period of one year.
Options granted prior to the amendment will continue to be administered under the terms of the
Original Plan. Under the Original Plan, the option price should be paid at the time of exercise and
should be equal to the net book value of EEI’s common stock but not less than 80% of the average
market price quoted in the PSE for five trading days immediately preceding the grant, but in no
case less than the par value. Options under the Amended Plan are nontransferable and a certain
percentage may be exercised after the grant date as follows: 20% after six months, 40% after
twelve months, 60% after eighteen months, 80% after twenty-four months, and 100% after thirty
months.
A summary of the plan options is shown below.
Number of Shares
Options granted under:
Original Plan
Amended Plan
Options exercised under:
Original Plan
Amended Plan
Options unexercised at end of year
20,271,858
14,985,369
35,257,227
18,969,491
10,235,328
29,204,819
6,052,408
There were no EEI options exercised in 2005 and 2004.
17. Related Party Transactions
Parties are considered to be related if one party has the ability, directly or indirectly, to control the
other party or exercise significant influence over the other party in making financial and operating
decisions. Parties are also considered to be related if they are subject to common control or
common significant influence. Related parties may be individuals or corporate entities.
Aside from transactions disclosed in Note 14 (Loans Payable) and Note 15 (Long-term Debt),
other transactions with related parties include share in general and administrative expenses and
cash advances.
*SGVMC107821*
- 32 -
The year-end balances with respect to related parties included in the consolidated financial
statements, are as follows:
Due from related parties (net of allowance for
doubtful accounts of P
=242,922,572 in 2005 and
=314,812,634 in 2004)
P
Due to related parties
Loans payable - related bank
Long-term debt - related bank
2005
2004
P
=116,653,914
27,861,305
1,254,129,163
953,357,935
=132,200,074
P
22,861,598
952,449,853
1,236,343,410
Interest rate on loans payable to a related party bank ranges from 10% to 15% and 9% to 15% in
2005 and 2004, respectively. Interest rate on long-term debt to a related bank ranges from 11% to
15% in 2005 and 10% to 16% in 2004, respectively.
On December 29, 2003, EEI BVI and A1 Rushaid Investment Corporation, stockholders of
ARCC, an associate, agreed to provide a term loan to ARCC in the amount of Saudi Riyals (SR)
15 million, to be divided in the proportion of the stockholders’ equity in ARCC. For this purpose,
the outstanding liabilities of ARCC to the stockholders and their subsidiaries, associates and
affiliates were to be converted into a term loan. The stockholders will provide the remaining
balance, if any, to ARCC. As agreed, the term loan would not be recalled until the financial
position of ARCC has improved and the Board of Directors of ARCC has determined the
repayment schedule of the term loan. The term loan shall bear no interest.
Accordingly, in 2004, EEI and GAIC, for valuable consideration, assigned to EEI BVI their
receivables from ARCC amounting to US$0.5 million and US$1.3 million, respectively. EEI BVI
converted the total amount of US$1.8 million (P
=17.2 million and P
=101.1 million as of
December 31, 2005 and 2004, respectively) to a term loan to ARCC after assuming the
receivables.
The remuneration of directors and other members of key management are as follows:
Compensation and short-term benefits
Post-employment benefits
2005
P
=14,254,714
1,272,029
P
=15,526,743
2004
=14,220,441
P
1,296,109
=15,516,550
P
2005
P
=3,591,253,698
3,499,959,120
373,195,081
52,030,965
P
=7,516,438,864
2004
=4,267,622,450
P
2,097,239,382
252,330,508
26,340,422
=6,643,532,762
P
18. Cost of Sales and Services
This account consists of:
Cost of merchandise sold (Note 20)
Cost of construction contracts (Note 19)
Cost of services
Cost of real estate sold
*SGVMC107821*
- 33 -
19. Cost of Construction Contracts
This account consists of:
Materials
Labor (Note 23)
Depreciation and amortization (Note 22)
Equipment costs and others
2004
2005
1,080,999,985
1,214,708,137
58,572,652
1,145,678,346
P
=3,499,959,120
=755,724,588
P
645,713,705
85,152,897
610,648,192
=2,097,239,382
P
2005
P
=3,580,010,900
3,169,563
2,730,072
5,343,163
P
=3,591,253,698
2004
=4,188,638,942
P
20,852,592
20,075,718
38,055,198
=4,267,622,450
P
20. Cost of Merchandise Sold
This account consists of:
Inventories
Personnel expenses (Note 23)
Depreciation and amortization (Note 22)
Others
21. General and Administrative Expenses
Operating expenses consists mainly of the following general and administrative expenses:
Personnel expenses (Note 23)
Depreciation and amortization (Note 22)
Rent, light and water
Taxes and licenses
Professional fees
Student related expenses
Provisions for probable losses
Provision for impairment of goodwill
Transportation and traveling
Entertainment, amusement and recreation
Repairs and maintenance
Advertising and promotions
Office expenses
Miscellaneous
2005
P
=730,298,113
201,725,762
144,678,610
58,047,807
53,636,412
48,561,986
46,564,380
42,624,000
30,490,174
27,900,266
20,740,059
13,805,217
18,469,346
251,414,422
P
=1,688,956,554
2004
=723,652,522
P
158,262,496
142,474,523
52,817,853
45,210,247
51,376,746
89,797,189
44,800,138
32,018,887
23,530,464
18,052,194
11,585,106
20,759,876
236,625,880
=1,650,964,121
P
*SGVMC107821*
- 34 -
22. Depreciation and Amortization
This account consists of depreciation and amortization included in:
Cost of construction contracts (Note 19)
Cost of services
Cost of merchandise sold (Note 20)
Operating expenses (Note 21)
2005
P
=58,572,652
17,819,222
2,730,072
201,725,762
P
=280,847,708
2004
=85,152,897
P
4,408,953
20,075,718
158,262,496
=267,900,064
P
23. Retirement Plan
The Group has a funded, noncontributory retirement plans (the Plans) for all of its regular
employees. The Plans provide for normal, early retirement, death and disability benefits.
The principal actuarial assumptions used in determining retirement expense are as follows:
2005
14%
8%-10%
8%-10%
Discount rate
Expected rate of return on assets
Future salary increases
2004
10%
8%
5%-10%
The movements in the present value of defined obligation follow:
Balance at beginning of year
Interest expense on obligations
Current service cost
Benefits paid
Actuarial losses
Balance at end of year
2005
P
=320,808,137
46,301,301
20,930,039
(25,798,519)
34,771,210
P
=397,012,168
2004
=283,682,127
P
35,136,228
20,132,293
(22,315,648)
4,173,137
=320,808,137
P
2005
P
=149,085,251
14,644,193
23,665,268
(25,798,519)
(629,988)
160,966,205
(6,325,631)
P
=154,640,574
2004
=126,775,070
P
12,413,295
31,237,387
(22,315,648)
975,147
149,085,251
(6,084,347)
=143,000,904
P
The movement in the fair value of plan asset follows:
Fair value of plan assets at beginning of year
Expected return on plan assets
Contributions
Benefits paid
Actuarial gains (losses)
Allowance for asset ceiling adjustment
Fair value of plan assets at end of year
*SGVMC107821*
- 35 -
Amount of retirement liability recognized in the consolidated balance sheets follows:
Present value of defined benefit obligation
Fair value of plan assets
Unrecognized actuarial losses
Net retirement liability
Retirement asset (classified under other
noncurrent assets)
Retirement liability (classified under accrued
expenses)
2005
P
=397,012,168
154,640,574
242,371,594
39,289,506
203,082,088
2004
=320,808,137
P
143,000,904
177,807,233
5,148,284
172,658,949
19,108,487
16,823,813
P
=222,190,575
=189,482,762
P
Movements in accumulated unrecognized actuarial losses are as follows:
At beginning of year
Actuarial loss during the year
At end of year
2005
P
=5,148,284
34,141,222
P
=39,289,506
2004
=−
P
5,148,284
=5,148,284
P
The net retirement expense recognized by the Group (included in personnel expense in the
consolidated statements of income) are as follows:
Current service cost
Interest cost
Expected return on plan assets
Ceiling test adjustment
2005
P
=20,930,039
46,301,301
(14,644,193)
668,508
P
=53,255,655
2004
=20,132,294
P
35,136,228
(12,413,295)
2,020,862
=44,876,089
P
The overall expected rate of return on plan assets is determined based on the market prices
prevailing on that date applicable to the period over which the obligation is to be settled.
The actual return on the plan assets amounted to P
=14.0 million and P
=13.4 million in 2005 and
2004, respectively.
*SGVMC107821*
- 36 -
24. Income Taxes
The significant components of deferred tax assets and liabilities are as follows:
Deferred tax assets on:
NOLCO
Allowance for doubtful accounts, inventory
obsolescence and other expenses
Accrued retirement benefits – net
Operating lease differential
Accrued rent
MCIT
Other provisions
Unrealized foreign exchange loss (gain)
Revaluation increment in land
Capitalized interest
Deferred tax liabilities on:
Revaluation increment in land
Capitalized interest
Accrued expenses
MCIT
Allowance for doubtful accounts
Accrued retirement expense
Unrealized foreign exchange gain
Unrealized gross profit
Other provisions
2005
2004
P
=118,689,502
=135,322,575
P
145,936,925
52,091,990
38,280,295
21,198,130
12,048,723
375,161
139,036
(257,751,863)
–
P
=131,007,899
112,621,994
35,122,712
57,965,625
−
9,692,739
301,491
(186,003)
(235,658,846)
(906,450)
=114,275,837
P
P
=59,454,223
24,603,236
(5,794,183)
(1,036,461)
(821,313)
(893,698)
–
–
(6,161,575)
P
=69,350,229
=67,706,202
P
29,244,915
−
(794,370)
(1,349,483)
(737,113)
1,958,379
(5,471,987)
(5,573,470)
=84,983,073
P
The Company did not recognize the deferred tax assets attributable to the tax effect of NOLCO,
MCIT and other temporary differences as follows:
NOLCO
MCIT
Unrealized foreign currency exchange gain
Accrued retirement expense
Unamortized past service cost
Allowance for doubtful accounts and inventory
obsolescence and other expenses
Others
2005
P
=185,483,268
29,195,757
19,576,832
13,777,750
9,751,176
2004
=212,324,664
P
24,785,730
21,589,593
14,360,348
10,004,841
–
2,627,671
P
=260,412,454
125,954,852
3,876,642
=412,896,670
P
*SGVMC107821*
- 37 -
Provision for income tax consists of:
2005
P
=70,563,576
(51,852,837)
P
=18,710,739
Current
Deferred
2004
=90,343,303
P
13,741,981
=104,085,284
P
The details of NOLCO and MCIT as of December 31, 2005 are as follows:
Taxable Year Incurred
2005
2004
2003
NOLCO
=465,202,603
P
326,463,228
77,399,227
=869,065,058
P
MCIT
=14,774,625
P
10,548,756
16,957,560
=42,280,941
P
Expiry Year
2008
2007
2006
MCI and MITC are educational institutions, which are subject to a lower tax rate of 10%.
In 2005, NOLCO amounting to =
P237.35 million and MCIT amounting to P
=38.95 million have
expired.
The reconciliation of the income tax computed at the statutory tax rate to the provision for income
tax shown in the consolidated statements of income follows:
Income before income tax
Add (deduct) reconciling items:
Movement of deferred tax assets not recognized
Equity in net earnings
Income subject to lower tax rate and others
2005
32.50%
2004
32.00%
19.15
(61.34)
17.09
7.40%
11.82
(59.20)
35.85
20.47%
On October 18, 2005, the Supreme Court has rendered its final decision declaring the validity of
Republic Act No. 9337 (new EVAT Law) which included, among others, (a) provisions for the
increase in corporate income tax rate from 32% to 35% effective November 1, 2005 and later on
reducing the rate to 30% effective January 1, 2009 and (b) the change in allowable deduction for
interest expense from 38% to 42% effective November 1, 2005 and 33% beginning
January 1, 2009.
*SGVMC107821*
- 38 -
25. Earnings Per Share
Basic earnings per share amounts attributable to equity holders of the Parent Company are
computed as follows:
2005
Net income attributable to equity holders of
parent company
Less earnings applicable to preferred shares
Net income applicable to common shares
Divided by the number of common shares
Earnings per share
P
=116,575,442
58,122,913
58,452,529
602,040,413
P
=0.0971
2004
(As restated)
=274,316,481
P
169,046,654
105,269,827
602,040,413
=0.175
P
The assumed exercise of the convertible preferred shares (see Note 28) is anti-dilutive.
Accordingly, no diluted earnings per share are presented in the consolidated statements of income.
26. Commitments and Contingencies
Significant commitments of the Company and its subsidiaries include the following:
A. Surety Arrangement and Guarantees
a. EEI is a corporate guarantor of credit facilities in favor of AlBank AlSaudi AlFransi for
the account of its associate, ARCC, for its Saudi Arabia construction projects up to the
extent of EEI’s ownership in ARCC.
On February 18, 2004, EEI executed a Deed of Guaranty and Indemnity to AlBank
AlSaudi AlFransi for the credit facilities granted to ARCC amounting to SR59.2 million.
This guarantee superseded the Deed of Guaranty and Indemnity dated November 7, 2002.
On February 5, 2005 EEI executed a Deed of Guaranty and Indemnity to AlBank AlSaudi
AlFransi for the credit facilities granted to ARCC amounting to SR27.9 million. This
guarantee superseded the Deed of Guaranty and Indemnity dated February 18, 2004.
b. EEI is contingently liable for guarantees arising in the ordinary course of business,
including performance, surety and warranty bonds for various construction projects
amounting to P
=1.3 billion as of December 31, 2005.
B. Sale and Construction of Power Stations
EEI Power sells its one-megawatt bunker C fuel power station for a period of 15 years until
2009, renewable every five years thereafter. The buyer, at its option, may also buy the power
station commencing at the end of the fifth year at a price to be agreed upon by both parties.
*SGVMC107821*
- 39 -
C. Standby Letters of Credit
EEI has outstanding irrevocable domestic standby letters of credit amounting to P
=49.0 million
in 2005 and P
=87.0 million in 2004 from local banks which are used for bidding and as
guarantee for the downpayments received from its ongoing construction projects.
D. Contingencies
a. In October 2001, Metro Pacific Corporation (MPC) filed a complaint for arbitration
against SECC with the Construction Industry Arbitration Commission. After presentation
of evidence, both testimonial and documentary, to support each other’s claims and
counterclaims, the Arbitral Tribunal rendered a decision in October 2002 awarding MPC
liquidated damages against SECC in the amount of P
=617.0 million plus minor claims
amounting to P
=15.0 million for a total award of P
=632.0 million. SECC, on the other hand,
was awarded unpaid balance amounting to P
=525.0 million.
On April 26, 2005, MPC and SECC entered in to a compromise settlement whereby the
parties desired to reach full and complete settlement of claims and counterclaims.
b. EEI has substantial claims against various parties in connection with completed projects.
Majority of these claims came from EEI’s various claims for cost of variation orders, time
extension, and loss and expense due to prolongation and disturbance costs. Any
recoveries from these claims will be reported as income in the year when the realizability
of the claims is determined to be virtually certain.
c. There are pending legal cases against EEI that are being contested by EEI and its legal
counsels. Management and its legal counsels believe that the final resolutions of these
cases will not have a material effect on the financial position and operating results of EEI.
d. MCI is facing various labor lawsuits and disputes. These matters include a case filed by
the Faculty Association of Mapua Institute of Technology concerning the alleged violation
of Collective Bargaining Agreement provisions on the college faculty ranking system and
high school salary rate computation.
As allowed under Philippine GAAP, certain information are not presented as they may
impact the outcome of the case.
Management believes that the ultimate liability, if any, with respect to these lawsuits and
disputes will not materially affect the financial position and results of operations of MCI.
e. There are other lawsuits and claims filed for or against certain subsidiaries. Management
believes that these lawsuits and claims will ultimately be settled in the normal course of
operations and will not adversely affect the Group’s financial position and operating
results.
*SGVMC107821*
- 40 -
27. Business Segment Information
The Group’s operating businesses are organized and managed separately according to the nature
of the products and services provided, with each segment representing a strategic business unit
that offers different products and serves different markets.
Segment financial information is reported on the basis that it is used internally for evaluating
segment performance and allocating resources to segments.
The Group derives its revenues from the following reportable segments:
Construction and Infrastructure - mainly consists of revenues from EEI Corporation and
Subsidiaries as a general contractor and trader of construction equipment and parts. The
subsidiaries of EEI are mainly involved in the provision for manpower services, construction,
trading of equipment, power generation, steel fabrication, real estate and others.
Consumer Finance - represents the general financing and investment business of FMLFC and
ZIFC.
Information Technology and Education - primarily consists of revenues from iPeople, and
subsidiaries (including MCI) in education, consulting, development, installation and maintenance
of information technology systems.
Car Dealership - represent automotive dealerships of the Company.
Other Services - represent support services which cannot be directly identified with any of the
reportable segments mentioned above. These include sale of pharmaceutical products, trading of
consumer goods and rendering various services to the consumers.
Segment assets and liabilities exclude current and deferred income tax assets and liabilities.
(Amounts in Millions)
Construction and
Infrastructure
2004
2005
Revenues
Domestic
Foreign
=3,819
P
552
4,371
=2,443
P
490
2,933
Consumer Finance
2004
2005
=111
P
–
111
=134
P
–
134
Information
Technology and
Education
2004
2005
=1,348
P
–
1,348
=1,362
P
–
1,362
Car Dealership
2004
2005
=4,085
P
–
4,085
=4,380
P
–
4,380
(Forward)
*SGVMC107821*
- 41 -
Net Income (Loss)
Other Information
Segment assets
Deferred tax assets
Net segment assets
Segment liabilities
Income tax payable
Deferred liabilities
Net segment liabilities
Investment in associates
Equity in net earnings
of associates
Cash flows arising from:
Operating activities
Investing activities
Financing activities
Capital expenditures
Construction and
Infrastructure
2004
(As
2005 restated)
3
62
5,486
(38)
5,448
4,200
(3)
(28)
4,169
218
4,991
(40)
4,951
3,625
(3)
(23)
3,599
219
113
246
(32)
110
(42)
(24)
180
24
(198)
(46)
Consumer Finance
2004
(As
2005 restated)
10
(6)
712
(21)
691
429
–
–
429
–
–
225
(1)
128
–
1,020
(13)
1,007
759
(3)
–
756
–
–
427
(18)
(82)
(18)
Other Services
2004
(As
2005 restated)
Revenues
Domestic
Foreign
P
=435
–
435
220
=1,278
P
–
1,278
269
Information
Technology and
Education
2004
(As
2005 restated)
396
273
2,884
–
2,884
1,456
(6)
(58)
1,392
–
–
447
40
(345)
(170)
3,269
(1)
3,268
1,566
(14)
(62)
1,490
–
–
671
(50)
(346)
(102)
Elimination
2004
(As
2005 restated)
Car Dealership
2004
(As
2005 restated)
14
29
1,181
(24)
1,157
667
(1)
–
666
–
1,080
(22)
1,058
657
(1)
–
656
–
–
–
(9)
(2)
–
(3)
34
(4)
(29)
(20)
Consolidation
2004
(As
2005 restated)
(P
=261)
–
(261)
(344)
(P
=685)
–
(685)
(288)
P
=9,537
552
10,089
234
=8,912
P
490
9,402
404
Net Income (Loss)
Other Information
Segment assets
Deferred tax assets
Net segment assets
3,205
(44)
3,161
6,093
(40)
6,053
(2,048)
(4)
(2,052)
(5,184)
2
(5,182)
11,420
(131)
11,289
11,268
(114)
11,154
Segment liabilities
Income tax payable
Deferred tax liabilities
Net segment liabilities
2,309
–
–
2,309
3,461
(7)
–
3,454
(509)
–
17
(492)
(2,618)
8
–
(2,610)
8,552
(10)
(69)
8,473
7,450
(20)
(85)
7,345
Investment in associates
Equity in net earnings
of associates
Cash flows arising from:
Operating activities
Investing activities
Financing activities
Capital expenditures
450
396
–
–
668
642
40
39
–
–
153
285
(372)
488
(83)
(9)
(27)
173
(150)
(2)
169
147
(342)
(198)
1,100
(194)
(664)
(108)
(90)
(488)
−
8
(185)
(319)
386
80
*SGVMC107821*
- 42 -
28. Capital Stock
The details of capital stock are as follows:
Preferred stock - P
=0.40 par value
Authorized
Issued
Common stock - P
=1.50 par value
Authorized
Issued
2,500,000,000 shares
2,244,920,598 shares
1,250,000,000 shares
602,040,413 shares
The features of preferred shares are as follows:
· Entitled to cumulative dividends at average 91-day treasury bill rate plus two percent
payable quarterly
· Fully participating as to dividends distribution
· Convertible into common shares of stock at the option of the holder from the date of issue
at the conversion rate of five preferred shares to one common share or a price of P
=2.00 per
common share, subject to adjustments
· Redeemable five years from the date of issue at a price of P
=0.40 per share plus any unpaid
dividends subject to a put option by the holders to have the same redeemed by the
Company as follows:
a. 1/3 of Preferred shares held after three years from the date of issue
b. 1/3 of Preferred shares held after four years from the date of issue
c. 1/3 of Preferred shares held after five years from the date of issue
· The Company shall provide for a sinking fund. Preferred shareholders shall have voting
rights and shall have preference as to assets upon dissolution of the Company over
common shareholders.
In light of the foregoing, the redeemable convertible preferred shares qualify as a financial liability
as defined under PAS 32. At the option of the holders, the Group is contractually obligated to
deliver cash in exchange for the instrument within a period of five years from the date of issuance.
Accordingly, the preferred shares are treated as a financial liability and measured at amortized
cost.
As of January 1, 2005, as allowed under PAS 32, the Group reclassified preferred stock amounting
to about P
=803 million representing the debt component of the preferred shares classified as due to
preferred stockholders.
*SGVMC107821*
- 43 -
The remaining amount in the preferred shares under its stockholders’ equity amounting to P95.3
million represents the equity component of the preferred shares. This includes the embedded
conversion option.
As of March 30, 2006, the Company redeemed a total of 382,139,874 preferred shares at P
=0.40 per
share.
29. Lease Agreements
The Group leases parcels of land where their respective sales office, administrative and warehouse
buildings were constructed and are currently located. The lease terms cover lease periods of
between 10 years to 20 years with escalation rates ranging from 5% to 12.5%.
Future minimum rental payments under the aforementioned lease agreements follow:
Within one year
After one year but not more than five years
After more than five years
Amount
=34,619,058
P
179,074,617
299,193,894
=512,887,569
P
30. Sale of FMLFC
On December 29, 2004, the Company sold 27,853,484 shares in FMLFC to its related bank’s
retirement trust fund for P
=33.2 million. Correspondingly, the Company’s share in FMLFC is
reduced by 6.60% as of December 31, 2004.
On March 17, 2005, the BOD approved the sale of its remaining shares in FMLFC to its related
bank, subject to the approval of Bangko Sentral ng Pilipinas. However, the sale transaction did
not push through.
31. Quasi-Reorganization
On September 20, 2004, the Securities and Exchange Commission approved the Company’s plan
for quasi-reorganization which resulted in:
a. a decrease in the authorized capital stock of P
=3.5 billion to P
=2.9 billion;
b. a reduction of the par value of the common shares from P
=2.00 per share to P
=1.50 per share to
create additional paid in capital of P
=301.0 million; and
c. an elimination of the accumulated deficit as of December 31, 2003 amounting to
=167.2 million by applying a portion of the Company’s additional paid in capital in 2004.
P
*SGVMC107821*
- 44 -
32. Cash Dividends
The Board of Directors declared cash dividends as follows:
December 7, 2005, P
=0.042 per share cash
dividend to stockholders of preferred shares
as of December 22, 2005, payable on or
before January 19, 2006. The cash dividend
covered the fourth quarter of 2004 and
first to fourth quarters of 2005.
September 7, 2005, P
=0.018 per share cash dividend
to stockholders of preferred shares as of
October 5, 2005, payable on or before
October 31, 2005. The cash dividend covered
the second and third quarters of 2004.
July 15, 2005, P
=0.016 per share cash dividend to
stockholders of preferred shares as of August 5,
2005, payable on or before August 31, 2005.
The cash dividend covered the fourth quarter
of 2003 and first quarter of 2004.
March 17, 2005, P
=0.016 per share cash dividend to
stockholders of preferred shares as of
December 31, 2004, payable on May 5, 2005.
The cash dividend covered the second and third
quarters of 2003.
December 1, 2004, P
=0.008 per share cash dividend,
payable on January 13, 2005, to stockholders of
cumulative, convertible, participating and
redeemable preferred shares of record as of
December 16, 2004. The cash dividend covered
the period from December 27, 2002 to
March 31, 2003.
2005
2004
P
=94,643,881
=−
P
42,181,791
−
37,337,183
−
35,569,570
−
−
P
=209,732,425
17,976,961
=17,976,961
P
As discussed in Note 28, since the preferred shares are considered as a financial liability, the
accruing dividends are recorded as part of interest expense.
33. Financial Instruments
Financial Risk Management Objectives and Policies
The Group’s principal financial instruments comprise of cash and cash equivalents, available-forsale securities, bank loans and long-term debt. The main purpose of these financial instruments is
to raise finances for the Group’s operations. The Group has various other financial assets and
liabilities such as trade receivables and trade payables, which arise directly from its operations.
*SGVMC107821*
- 45 -
The main risks arising from the Group’s financial instruments are interest risk, liquidity risk,
credit risk, and foreign currency risk. The BOD reviews and agrees on the policies for managing
these risks, summarized as follows:
Liquidity Risk
Short-term funding is obtained to finance cash requirements for operations. Credit lines are
obtained from BOD-designated banks at amounts based on financial forecasts approved by BOD.
Foreign Currency Risk
Currency risk is the potential decline in the value of the financial instruments due to exchange rate
fluctuations. Exposure to currency risk arises mainly when receivables and payables are
denominated in a currency other than the Group’s functional currency or will be denominated in
such a currency in the planned course of business.
Foreign currency risk is monitored and analyzed systematically and is managed centrally by the
central finance department. The Group’s policy is to maintain foreign currency exposure within
existing regulations, and within acceptable risk limits. The Group believes in ensuring that its
foreign currency is at all times within limits prescribed for companies which are engaged in the
same types of businesses.
As of December 31, 2005 and 2004, the foreign currency-denominated financial liabilities relate to
long-term debt due to Credit Lyonnais amounting to Euro 795,061 and Euro 1,409,557 which is
equivalent to P
=50.0 million and P
=108.0 million, respectively.
Interest Rate Risk
The Group’s exposure to market risk for changes in interest rates relates primarily to the Group’s
short-term and long-term obligations.
The following table sets out the carrying amount (in thousands), by maturity, of the Group’s
financial instruments that are exposed to interest rate risk:
TOTAL
Below
1 Year
1-2 Years
2-3 Years
3-4 Years
4-5
Years
Over
5 Years
In Php
Liabilities:
Loans payable
Interest rate
P2,924,683,749
=
11% to 14.25%
=–
P
–
=–
P
–
=–
P
–
=–
P
–
=–
P
–
=2,924,683,749
P
–
Long-term debt
Interest rate
490,024,520
7% - 15%
875,158,737
7% - 15%
–
–
–
–
1,365,183,257
299,322,746
91-day T-bill
rate plus 2%
576,451,865
91-day T-bill
rate plus 2%
–
–
–
–
875,774,611
–
=3,714,031,015
P
=
P1,451,610,602
=–
P
=–
P
=–
P
=–
P
=5,165,641,617
P
Convertible cumulative
preferred shares
Interest rate
Total
*SGVMC107821*
- 46 -
In order to effectively manage its interest rate risk and its financing costs, the Group closely
monitors the movements of interest rates, as well as, economic factors affecting the trends of these
movements. In certain cases, depending on its assessment of future movements of interest rates,
the Group would pre-terminate its debt and obtain a new loan facility which provides for either
floating or fixed interest rates. This is intended to minimize its financing costs.
Credit risk
The Group’s exposure to credit risk on its receivables relates primarily to the inability of the
debtors to pay and fully settle the unpaid balance of receivables owed to the Group. The Group
manages its credit risk in accordance with its credit risk policies which requires the evaluation of
the creditworthiness of the debtors. The Group’s exposure to credit risk on its other receivables
from debtors and related parties is managed through close account monitoring and setting limits.
The table below presents a comparison by category of carrying amounts and estimated fair values
of all of the Group’s financial instruments as of December 31, 2005:
Carrying Value
Financial Assets
Current financial assets:
Cash and cash equivalents
Temporary cash investments
Loans receivable (carrying value includes
noncurrent portion amounting to
=136,251,856)
P
Accounts receivable - net
Due from related parties
Noncurrent financial assets:
Available-for-sale securities (carrying value
includes current portion of AFS securities
amounting to =
P58,484,354)
Total financial assets
Financial Liabilities
Current financial liabilities:
Loans payable
Accounts payable and accrued expenses
Due to related parties
Noncurrent financial liabilities:
Due to preferred stockholders (carrying value
includes current portion amounting to
=299,322,746)
P
Long-term debt (carrying value includes current
portion amounting to P
=490,024,520)
Total financial liabilities
Fair Value
=814,365,671
P
19,931,992
=814,365,671
P
19,931,992
518,044,886
1,794,753,094
116,653,914
518,044,886
1,794,753,094
116,653,914
510,810,711
=3,774,560,268
P
510,810,711
=3,774,560,268
P
=2,924,683,749
P
2,759,859,491
27,861,305
=2,924,683,749
P
2,759,859,491
27,861,305
875,774,611
875,774,611
1,365,183,257
=7,953,362,413
P
1,413,308,316
=8,001,487,472
P
Current assets and liabilities
Due to the short-term nature of the current assets and liabilities, the carrying values of these
accounts were assessed to approximate their fair values.
*SGVMC107821*
- 47 -
Available-for-sale securities
The fair values of quoted equity securities are based on quoted market prices. In the absence of a
reliable basis of determining fair values, unquoted equity securities are carried at cost net of
impairment provision.
Long-term debt
For variable rate loans that reprise every three months, the carrying value approximates the fair
value because of recent and regular repricing based on current market rates.
For fixed rate loans, the fair value is estimated as the present value of all future cash flows
discounted using the applicable rates for similar loans.
Due to preferred stockholders
Interest on due to preferred shareholders reprises every three months, the carrying value
approximates the fair value.
34. Subsequent Events
On March 30, 2006, the BOD declared P
=13.10 million or P
=0.00704 per share cash dividend to
stockholders of preferred shares as of April 21, 2006, payable on May 18, 2006. The cash
dividend covered the first quarter of 2006.
*SGVMC107821*
HOUSE OF INVESTMENTS, INC.
SCHEDULE A - MARKETABLE SECURITIES - (CURRENT MARKETABLE SECURITIES EQUITY
SECURITIES AND OTHER SHORT-TERM CASH INVESTMENTS)
FOR THE YEAR ENDED DECEMBER 31, 2005
2005
Cash
P
Short-term investments
Cash and Cash Equivalents Available for Current Operations
737,405,079
2004
533,752,608
P
76,960,592
P
814,365,671
305,179,791
838,932,399
P
50
HOUSE OF INVESTMENTS, INC.
SHEDULE A.1 - SHORT TERM CASH INVESTMENTS
FOR THE YEAR ENDED DECEMBER 31, 2005
Name of issuing Entity and Association of Each
Principal
Balance as of
Value as of
Issued Temporary Cash Investments
Amount
December 31, 2005
December 31, 2005
HOUSE OF INVESTMENTS, INC. - PARENT
Rizal Commercial Banking Corporation
Total
P
19,931,992
P
19,931,992
P
P
19,931,992
19,931,992
51
HOUSE OF INVESTMENTS, INC.
SCHEDULE C - MARKETABLE EQUITY SECURITIES, OTHER LONG-TERM INVESTMENTS IN STOCKS AND OTHER
INVESTMENTS
FOR THE YEAR ENDED DECEMBER 31, 2005
Amount Shown in the
Balance Sheet
Description
Associates - Under Equity Method
Available-for-sale securities:
Quoted shares
Unquoted shares
Less accumulated impairment losses
P
P
132,436,113
476,636,004
609,072,117
98,261,406
668,816,357
510,810,711
P
1,179,627,068
52
HOUSE OF INVESTMENTS, INC.
SCHEDULE C.1 - MARKETABLE; EQUITY SECURITIES
FOR THE YEAR ENDED DECEMBER 31, 2005
Number of Shares or
Name of Issuing Entity and Description of Each
Principal Amount of Bonds
Amount Shown in the
Issue
and Notes
Balance Sheet
HOUSE OF INVESTMENTS, INC. - PARENT
A. Traded Securities
Alaska Milk Corp.
15,000
P
61,000
Alsons Cement Corp.
75,000
540,000
Benguet Corporation - A
2,848,637
94,053,053
Benpres Holdings Corp.
154
590
Cebu Holdings
15,625
25,000
Cent. Azuc. Don Pedro/Roxas Holdings
141,268
374,400
Empire East Holdings
28,200
193,500
Equitable Banking Corp.
1,150
113,300
Filinvest Land, Inc.
17,750
Holcim Philippines, Inc.
30,000
110,000
Lorenzo Shipping
50,000
298,000
PCI Leasing & Finance, Inc.
15,000
69,500
PLDT
6,334
75,750
Piltel
10,000
200,000
Seafront Petroleum - A (Resources)
4,697,639
23,698,279
Solid Group, Inc.
340,000
1,989,000
Vitarich
10,000
105,200
B. Golf and Country Club Shares
Alabang Country Club
1
Celebrity Sports Club
1
Orchard Golf Club - C
1
1,150,000
Sta. Elena Golf Club
1
600,000
C. Other Investments
Menzi Industries
50,000
Pasig Investments
53,000
Value Based on Market
Quotations at Balance
Sheet Date
P
51,000
53,250
19,655,595
166
16,563
180,823
11,562
66,125
24,495
126,000
68,000
15,300
66,507
33,500
1,832,079
166,600
2,600
120,000
430,000
1,300,000
53
HOUSE OF INVESTMENTS, INC.
SCHEDULE C.1 - MARKETABLE; EQUITY SECURITIES
FOR THE YEAR ENDED DECEMBER 31, 2005
Number of Shares or
Principal Amount of Bonds
Name of Issuing Entity and Description of Each
Amount Shown in the
Issue
and Notes
Balance Sheet
Integrated Properties
53,013
8,301,761
123,812,585
EEI CORPORATION AND SUBSIDIARIES
EEI CORPORATION - PARENT
Philippine Long Distance Telephone Co.
23,592
874,700
Valle Verde Country Club
1
130,000
Pilipino Telephone Company
150
4,500
Tagaytay Highland Int'l Golf Club
1
400,000
Manila Southwood Golf & Country Club
2
1,657,700
Meralco
627,510
Sta. Elena Golf Club Share (from Fort Bonifacio)
1,098,998
EEI Construction and Marine Corporation
Forest Hills Investment - C share
1
250,000
EEI Power Corporation
Royal Golf Shares
1
652,000
EEI Realty Corporation
Meralco
134,637
1,346,370
GAIC and subsidiaries
Club Filipino
1
472,500
Philimark, Inc.
PLDT Shares - Preferred
925
9,250
Equipment Engineers, Inc.
Orchards Golf Club - C Share
2
1,100,000
159,313
8,623,528
Total
8,461,074
132,436,113
Less : Allowance
98,261,406
P
8,301,757
P
34,174,707
Value Based on Market
Quotations at Balance
Sheet Date
24,220,165
259,512
100,000
525
750,000
1,440,000
1,300,000
200,000
700,000
1,346,370
140,000
9,713
860,000
7,106,120
31,326,285
P
31,326,285
54
HOUSE OF INVESTMENTS, INC.
SCHEDULE G - INTANGIBLE ASSETS - OTHER ASSETS
FOR THE YEAR ENDED DECEMBER 31, 2005
Deductions
Beginning
Balance
Description
Goodwill
P
552,927,242
P
552,927,242
Charged to
Costs
and Expenses
Additions
At Cost
-
-
P
42,624,000
P
42,624,000
Other ChangesAdditions
(Deductions)
Charged to
Other
Accounts
-
P
-
-
P
-
Ending
Balance
P
510,303,242
P
510,303,242
55
HOUSE OF INVESTMENTS, INC.
SCHEDULE H - LONG TERM DEBT
FOR THE YEAR ENDED DECEMBER 31, 2005
Name of Issuing Entity and Association
of Each Issue
Long Term
Debt
Long Term - net
of
Current Portion
Current
Portion
Collateral
iPEOPLE,iNC. AND SUBSIDIARIES
Mapua Institute of Technology, Inc.
Rizal Commercial Banking Corporation
778,593,750
P
20,625,000
P
757,968,750
Land and other improvements
EEI AND SUBSIDIARIES
EEI Corporation
Rizal Commercial Banking Corporation
87,907,040
87,907,040
-
Building and improvement at Manggahan & Sta. Maria,
Bauan, Batangas and chattel mortgage of construction
machinery and equipment
Metropolitan Bank and Trust Company
7,000,000
7,000,000
-
Building and improvement at Manggahan & Sta. Maria,
Bauan, Batangas
33,923,421
16,961,711
16,961,710
750,000
750,000
-
21,754,167
15,779,164
5,975,003
14,640,348
14,640,348
-
Equitable-PCI Bank
Global Bank
China Banking Corporation
Insular Bank
(Forward)
Various equipment
Building and improvement at Manggahan and Sta. Maria,
Bauan Batangas.
Building and improvement at Manggahan & Sta. Maria,
Bauan, Batangas
Unsecured
56
Long Term
Debt
Name of Issuing Entity and Association
of Each Issue
EEI Realty
Rizal Commercial Banking Corporation
Current
Portion
86,857,143
Long-Term (Net
of Current
Portion)
Collateral
43,428,573
43,428,570
Mortgage of 9 parcels of land in Parang, Marikina
49,967,991
33,311,997
16,655,994
First demand guarantee with RCBC
305,326,648
222,305,371
83,021,277
EEI Power Corp.
Credit Lyonnais (CL) Paris
FIRST MALAYAN LEASING &
FINANCE CORPORATION
Land Bank of the Philippines
TOTAL
281,262,859
P
1,365,183,257
247,094,149
P
490,024,520
34,168,710
P
clean
875,158,737
57
HOUSE OF INVESTMENTS, INC.
SCHEDULE H.1 - LOANS PAYABLE
FOR THE YEAR ENDED DECEMBER 31, 2005
Name of Issuing Entity and Association
Principal
Balance as of
of Each Issue
Amount
December 31, 2005
Bank Loans
Other Loans
P
Money Market Placements
3,024,570,320
64,967,077
3,089,537,397
P
140,312,771
P
3,229,850,168
2,719,403,901
64,967,077
2,784,370,978
140,312,771
P
2,924,683,749
58
HOUSE OF INVESTMENTS, INC.
SCHEDULE H.1-A - BANK LOANS
FOR THE YEAR ENDED DECEMBER 31, 2005
Name of Issuing Entity and Association
of Each Issue
HOUSE OFINVESTMENTS, INC
House of Investments, Inc.-Home
Banco de Oro
Bank of the Philippine Island
China Banking Corporation
China Trust
Eastwest Bank
Metropolitan Bank and Trust Company
Philtrust Bank
Rizal Commercial Banking Corporation
House of Investments-Isuzu Branch
RCBC Capital
RCBC Corporate
House of Investments-Honda Cars Group Branch
RCBC
HONDA CARS KALOOKAN
Bank of the Philippine Island
Equitable-PCI Bank
IBank
IPEOPLE, INC. AND SUBSIDIARIES
Malayan Colleges, Inc.
East West Bank-Notes
Principal
Amount
P
84,750,000
147,954,173
100,000,000
18,250,000
100,000,000
53,000,000
300,000,000
559,200,000
Balance as of
December 31, 2005
P
78,250,000
146,659,944
6,250,000
100,000,000
43,000,000
300,000,000
258,800,000
Asset Pledged/Security
unsecured
various shares of stocks
unsecured
unsecured
unsecured
shares of stocks
unsecured
various receivables
unsecured
99,211,711
20,000,000
96,768,850
20,000,000
162,894,746
1,645,260,630
162,894,746
1,212,623,540
15,000,000
30,000,000
10,000,000
55,000,000
15,000,000
30,000,000
10,000,000
55,000,000
unsecured
unsecured
unsecured
150,000,000
146,330,000
unsecured
land and building, vehicle and inventories
59
HOUSE OF INVESTMENTS, INC.
SCHEDULE H.1-A - BANK LOANS
FOR THE YEAR ENDED DECEMBER 31, 2005
Name of Issuing Entity and Association
of Each Issue
People eServe Corporation
Principal
Amount
Balance as of
December 31, 2005
Asset Pledged/Security
270,000
150,270,000
206,344
146,536,344
412,125,000
412,125,000
10,400,000
26,950,050
6,400,000
26,950,050
439,575,000
364,575,000
International Exchange Bank
Land Bank of the Philippines
20,000,000
27,470,000
16,500,000
27,470,000
Eastwest Banking Corporation
146,330,000
146,330,000
Building and improvement at Manggahan
and Sta. Maria, Bauan Batangas.
Secured by Retention Receivables and
Assignment of properties at Lemery,
Batangas and Ayala Greenfield
unsecured
Secured by Golden Haven Memorial Lots
and 4 lots in Bauan, Batangas
unsecured
125,000,000
88,704,327
Accounts receivable
Retention receivable
EEI CORPORATION AND SUBSIDIARIES
EEI Corporation
Rizal Commercial Banking Corporation
United Coconut Planters Bank
China Banking Corporation
BPI-FEBTC
Accounts Receivable Purchased (with recourse)
Rizal Comercial Banking Corporation
RCBC Capital
EEI Construction and Marine, Inc.
BPI - Far East bank
EEI Realty Corporation
Rizal Commercial Banking Corporation
TOTAL
P
5,000,000
5,000,000
86,189,640
86,189,640
1,174,039,690
3,024,570,320
P
chattel mortgage on various construction
materials
Retention receivable
unsecured
Mortgage on nine parcels of land in
Parang, Marikina
1,305,244,017
2,719,403,901
60
HOUSE OF INVESTMENTS, INC.
SCHEDULE K - CAPITAL STOCK
FOR THE YEAR ENDED DECEMBER 31, 2005
Title of
Issue
Number of
Shares
Authorized
Number of
Shares Issued
and
Outstanding
Number of Shares
Reserved for Options,
Warrants,
Conversions, and
Other Rights
Affiliates
Number of Shares Held By
Directors,
Officers and
Employees
Others
Preferred
Stock
2,500,000,000
2,244,920,598
1,141,677,523
984,194,416
119,048,659
Common
Stock
1,250,000,000
602,040,413
360,463,459
4,749,235
236,827,719
61


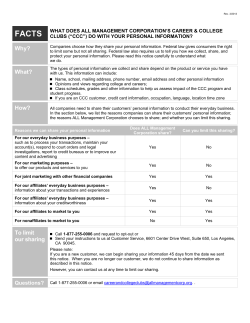


© Copyright 2026