
COVER SHEET
COVER SHEET
I
N
T
E
I
N
C
.
G R
A
T
E
D
M
I
C
R O
-
E
L
E
C
T
R O N
L
A G U
9
4
4
1
I
C
S
,
9
(Company's Full Name)
N O R
T
H
S
C
I
E
N
T
H
N O
P
A R
K
,
E
C
C
E
B
I
A
V
E
.
N
A N
,
,
L
A G U
N
N
A
A
(Business Address: No. Street City / Town / Province)
1
2
ATTY. SHEILA MARIE U. TAN
908-3468
Contact Person
Company Telephone Number
3
1
SEC FORM 17-Q
FORM TYPE
Month
Day
Fiscal Year
Month
Day
Annual Meeting
Secondary License Type, if Applicable
C
F
D
Amended Articles Number/Section
Dept. Requiring this Doc.
Total Amount of Borrowings
Domestic
Total No. Of Stockholders
To be accomplished by SEC Personnel concerned
File Number
LCU
Document I.D.
Cashier
STAMPS
Remarks = pls. Use black ink for scanning purposes
Foreign
SEC Number:
File Number:
94419
INTEGRATED MICRO-ELECTRONICS, INC.
______________________________________________________
(Company’s Full Name)
33/F Tower One, Ayala Triangle, Ayala Avenue, Makati City
______________________________________________________
(Company Address)
(632) 756-6840
______________________________________________________
(Telephone Number)
June 30, 2012
______________________________________________________
(Quarter Ending)
SEC Form 17-Q Quarterly Report
______________________________________________________
(Form Type)
SECURITIES AND EXCHANGE COMMISSION
SEC FORM 17-Q
QUARTERLY REPORT PURSUANT TO SECTION 17 OF THE SECURITIES
REGULATION CODE AND SRC RULE 17(2)(b) THEREUNDER
1. For the quarterly period ended: June 30, 2012
2. Commission Identification No.: 94419
3. BIR Tax Identification No.: 000-409-747-000
4. Exact name of issuer as specified in its charter: INTEGRATED MICRO-ELECTRONICS, INC.
5. Province, country or other jurisdiction of incorporation or organization: PHILIPPINES
6. Industry Classification Code:
(SEC Use Only)
7. Address of issuer's principal office: 33/F Tower One, Ayala Triangle, Ayala Avenue, Makati City
Postal Code: 1226
8. Issuer's telephone number, including area code: (632) 756-6840
9. Former name, former address and former fiscal year: Not applicable
10. Securities registered pursuant to Sections 8 and 12 of the Code, or Sections 4 and 8 of the RSA:
Title of Each Class
Common *
Number of Shares Issued and Outstanding
1,434,078,088
* Net of 15,892,109 treasury shares;
11. Are any or all of the securities listed on a Stock Exchange? Yes [ x ]
No [ ]
A total of 1,350,476,697 common shares are listed with the Philippine Stock Exchange as of June
30, 2012.
12. Indicate by check mark whether the registrant:
(a) has filed all reports required to be filed by Section 17 of the Code and SRC Rule 17
thereunder or Sections 11 of the RSA and RSA Rule 11(a)-1 thereunder, and Sections 26
and 141 of the Corporation Code of the Philippines, during the preceding twelve (12)
months (or for such shorter period the registrant was required to file such reports): Yes [x]
No [ ]
(b) has been subject to such filing requirements for the past ninety (90) days: Yes [ x ] No [ ]
1
PART I--FINANCIAL INFORMATION
Item 1. Financial Statements.
INTEGRATED MICRO-ELECTRONICS, INC. AND SUBSIDIARIES
UNAUDITED INTERIM CONSOLIDATED BALANCE SHEET
AS OF JUNE 30, 2012
(With Comparative Audited Figures as of December 31, 2011)
(In thousand dollars)
ASSETS
Current Assets
Cash and cash equivalents (Note 4)
Loans and receivables - net (Note 5)
Inventories (Note 6)
Derivative assets (Note 16)
Other current assets
Total Current Assets
Noncurrent Assets
Property, plant and equipment - net (Note 7)
Goodwill
Intangible assets (Note 8)
Pension asset
Available-for-sale financial assets
Noncurrent receivables
Deferred income tax assets
Other noncurrent assets
Total Noncurrent Assets
LIABILITIES AND EQUITY
Current Liabilities
Accounts payable and accrued expenses (Note 9)
Trust receipts and loans payable (Note 11)
Income tax payable
Provisions (Note 10)
Derivative liabilities
Total Current Liabilities
Noncurrent Liabilities
Long-term debt (Note 12)
Deferred income tax liabilities
Deferred revenue
Pension liability
Accrued rent
Obligation under finance lease
Other long-term employee benefits
Total Noncurrent Liabilities
Total Liabilities
(Forward)
(Unaudited)
June 30, 2012
(Audited)
Dec 31, 2011
$43,928
154,734
84,286
2,975
7,257
293,180
$54,069
133,677
80,402
2,799
8,855
279,802
91,928
54,355
6,541
2,807
458
142
577
1,706
158,514
$451,694
97,506
54,355
7,333
2,807
414
214
744
1,518
164,891
$444,693
$148,347
35,635
857
1,114
–
185,953
$143,993
39,009
1,687
249
34
184,972
64,625
4,420
2,217
1,267
951
342
231
74,053
260,006
60,398
4,810
2,304
1,329
914
613
231
70,599
255,571
2
(Unaudited)
June 30, 2012
Equity
Equity attributable to equity holders of the
Parent Company
Capital stock - common
Capital stock - preferred
Subscribed capital stock
Additional paid-in capital
Subscriptions receivable
Retained earnings:
Appropriated for expansion
Unappropriated
Treasury stock
Reserve for fluctuation on available-for-sale financial assets
Cumulative translation adjustments
Other reserves
Equity attributable to noncontrolling interests in consolidated
subsidiaries
Total Equity
(Audited)
Dec 31, 2011
$24,935
26,601
6,504
58,915
(10,114)
$24,932
26,601
6,507
59,085
(10,395)
30,661
62,779
(1,012)
138
(3,993)
171
195,585
30,661
59,671
(1,012)
144
(6,043)
171
190,322
(3,897)
191,688
(1,200)
189,122
$451,694
$444,693
See accompanying Notes to Unaudited Interim Condensed Consolidated Financial Statements.
3
INTEGRATED MICRO-ELECTRONICS, INC. AND SUBSIDIARIES
UNAUDITED INTERIM CONSOLIDATED STATEMENTS OF COMPREHENSIVE
INCOME
FOR THE SIX MONTHS ENDED JUNE 30, 2012 AND 2011
(In thousand dollars, except Earnings per Share)
Unaudited 2012
Jan to
Apr to
Jun
Jun
REVENUES FROM SALES AND
SERVICES (Note 14)
Unaudited 2011
Apr to
Jan to
Jun
Jun
$173,689
$325,651
$139,509
$262,471
158,519
300,252
128,668
241,945
15,170
25,399
10,841
20,526
(12,064)
(22,186)
(9,660)
(20,065)
OTHERS - Net
Interest and bank charges
Interest income
Foreign exchange gains (losses)
Miscellaneous
(830)
130
(987)
598
(1,731)
255
(249)
610
(274)
47
671
229
(544)
134
1,698
946
INCOME BEFORE INCOME TAX
2,017
2,098
1,854
2,695
(1,160)
(1,687)
(1,338)
(2,059)
857
411
516
636
(9)
(6)
10
26
$848
$405
$526
$662
$2,254
(1,397)
$857
$3,108
(2,697)
$411
$761
(245)
$516
$1,138
(502)
$636
$2,245
(1,397)
$848
$3,102
(2,697)
$405
$771
(245)
$526
$1,164
(502)
$662
COST OF GOODS SOLD AND SERVICES
GROSS PROFIT
OPERATING EXPENSES
PROVISION FOR INCOME TAX
NET INCOME
OTHER COMPREHENSIVE INCOME
Fair value changes on available-for-sale financial
assets
TOTAL COMPREHENSIVE INCOME
Net Income Attributable to:
Equity holders of the Parent Company
Noncontrolling interests
Total Comprehensive Income Attributable to:
Equity holders of the Parent Company
Noncontrolling interests
Earnings (Loss) per Share
Basic and Diluted (Note 13)
$0.0011
($0.0001)
See accompanying Notes to Unaudited Interim Condensed Consolidated Financial Statements.
4
INTEGRATED MICRO-ELECTRONICS, INC. AND SUBSIDIARIES
UNAUDITED INTERIM CONSOLIDATED STATEMENTS OF CHANGES IN EQUITY
FOR THE SIX MONTHS ENDED JUNE 30, 2012 AND 2011 (in thousand dollars)
Attributable to Equity Holders of the Parent Company
Subscriptions
Receivable
($10,395)
Retained
Earnings
Appropriated
for Expansion
$30,661
Retained
Earnings
Unappropriated
$59,671
84
(254)
58,915
254
27
(10,114)
30,661
59,671
(1,012)
144
-
-
-
-
3,108
-
-
$6,504
$58,915
($10,114)
$30,661
3,108
$62,779
($1,012)
Capital
Stock Common
$24,932
Capital Stock
-Preferred
$26,601
Subscribed
Capital Stock
$6,507
Additional
Paid-in Capital
$59,085
3
24,935
26,601
(3)
6,504
Net income (loss)
Other comprehensive income (loss)
-
-
Total comprehensive income (loss)
Balances at June 30, 2012
$24,935
$26,601
Balances at January 1, 2012
Shares issued during the year
Cost of share-based payments
Net reversal of accretion
Collection on subscriptions
Dividends
Translation adjustments
Reserve for
Fluctuation on
Treasury Available-for-Sale
Stock Financial Assets
($1,012)
$144
Cumulative
Translation
Adjustments
($6,043)
Other
Reserves
$171
(6)
2,050
(3,993)
-
(6)
$138
($3,993)
Attributable to
Noncontrolling
Interest
($1,200)
Total
$189,122
171
-
(1,200)
84
27
2,050
191,283
(2,697)
-
411
(6)
$171
(2,697)
($3,897)
405
$191,688
Attributable to Equity Holders of the Parent Company
Capital
StockCommon
Capital Stock
-Preferred
Subscribed
Capital Stock
Additional
Paid-in Capital
Subscriptions
Receivable
Retained
Earnings
Appropriated
for Expansion
Retained
Earnings
Unappropriated
Balances at January 1, 2011
Shares issued during the period
Cost of share-based payments
Collection on subscriptions
Accretion of subscription receivable
Dividends
Reversal of appropriated retained earnings
$24,894
34
24,928
$26,601
26,601
$1,902
(34)
1,868
$34,647
348
328
35,323
($11,412)
167
(328)
(11,573)
$60,661
(20,000)
40,661
$32,727
(3,855)
20,000
48,872
($1,013)
(1,013)
$112
112
$171
171
$1,554
(20)
1,534
$170,844
348
167
(3,875)
167,484
Net income (loss)
Other comprehensive income
Total comprehensive income (loss)
Balances at June 30, 2011
$24,928
$26,601
$1,868
$35,323
($11,573)
$40,661
1,138
1,138
$50,010
($1,013)
26
26
$138
$171
(502)
(502)
$1,032
636
26
662
$168,146
Reserve for
Fluctuation on
Treasury Available-for-Sale
Stock
Financial Assets
Attributable to
Other Noncontrolling
Interest
Reserves
Total
See accompanying Notes to Unaudited Condensed Consolidated Financial Statements.
5
INTEGRATED MICRO-ELECTRONICS, INC. AND SUBSIDIARIES
UNAUDITED INTERIM CONSOLIDATED STATEMENTS OF CASH FLOWS
FOR THE SIX MONTHS ENDED JUNE 30, 2012 AND 2011
(In thousand dollars)
Unaudited
June 30, 2012
June 30, 2011
CASH FLOWS FROM OPERATING ACTIVITIES
Income before income tax
Adjustments for:
Depreciation of property, plant and equipment (Note 7)
Interest expense
Provision for restructuring (Note 10)
Unrealized foreign exchange losses (gains)
Amortization of intangible assets (Note 8)
Provision for inventory obsolescence (Note 6)
Provision for doubtful accounts
Cost of share-based payments
Interest income
Gains on derivatives (Note 16)
Gain on sale of property, plant and equipment
Operating income before working capital changes
Changes in operating assets and liabilities:
Decrease (increase) in:
Loans and receivables
Inventories
Other current assets
Noncurrent receivables
Net pension asset
Increase (decrease) in:
Accounts payable and accrued expenses
Provisions (Note 10)
Deferred revenue
Accrued rent-noncurrent
Pension liability
Net cash generated from (used in) operations
Interest received
Interest paid
Income tax paid
Net cash provided by (used in) operating activities
(Forward)
$2,098
12,097
1,731
1,662
1,191
1,099
574
237
84
(255)
(210)
(71)
20,237
$2,695
10,504
544
(122)
221
65
3
348
(134)
(977)
(87)
13,060
(21,133)
(4,477)
1,598
72
–
(14,362)
(3,222)
(2,094)
(198)
157
3,877
(797)
(87)
37
(62)
(735)
185
(1,421)
(2,740)
(4,711)
12,947
–
(128)
29
–
6,189
134
(530)
(2,666)
3,127
6
Unaudited
June 30, 2012
June 30, 2011
CASH FLOWS FROM INVESTING ACTIVITIES
Proceeds from sale of property, plant and equipment
Acquisition of:
Property, plant and equipment (Note 7)
Intangible assets (Note 8)
Increase in other noncurrent assets
Settlement of derivatives
Net cash used in investing activities
CASH FLOWS FROM FINANCING ACTIVITIES
Availment of loans
Payments of:
Loans payable
Long-term debt
Obligation under finance lease
Dividends paid to Parent Company
Dividends paid to minority
Collections of subscriptions receivable
Net cash provided by (used in) financing activities
NET FOREIGN EXCHANGE DIFFERENCE IN CASH
AND CASH EQUIVALENTS
NET DECREASE IN CASH AND CASH EQUIVALENTS
CASH AND CASH EQUIVALENTS AT JANUARY 1
CASH AND CASH EQUIVALENTS AT JUNE 30
$2,348
$1,121
(9,153)
(307)
(156)
–
(7,268)
(4,665)
(152)
(55)
755
(2,996)
11,732
1,461
(8,374)
–
(271)
(1,268)
–
27
1,846
(453)
(4,000)
(103)
(2,631)
(20)
167
(5,579)
(8)
41
(10,141)
(5,410)
54,069
38,135
$43,928
$32,728
See accompanying Notes to Unaudited Interim Condensed Consolidated Financial Statements.
7
INTEGRATED MICROELECTRONICS, INC. AND SUBSIDIARIES
NOTES TO UNAUDITED INTERIM CONDENSED CONSOLIDATED FINANCIAL
STATEMENTS
1. Basis of Financial Statement Preparation
The accompanying unaudited interim condensed consolidated financial statements have been
prepared in accordance with the Philippine Accounting Standard (PAS) 34 (Amended), Interim
Financial Reporting. Accordingly, the unaudited interim condensed consolidated financial
statements do not include all of the information and disclosures required in the
December 31, 2011 annual audited consolidated financial statements, and should be read in
conjunction with the Group’s annual consolidated financial statements as of and for the year
ended December 31, 2011.
The preparation of the financial statements in compliance with Philippine Financial Reporting
Standards (PFRS) requires management to make estimates and assumptions that affect the
amounts reported in the financial statements and accompanying notes. The estimates and
assumptions used in the accompanying unaudited interim condensed consolidated financial
statements are based upon management’s evaluation of relevant facts and circumstances as
of the date of the unaudited interim condensed consolidated financial statements. Actual
results could differ from such estimates.
The unaudited interim condensed consolidated financial statements include the accounts of
Integrated Micro-Electronics, Inc. (herein referred to as the “Parent Company”) and its
subsidiaries collectively referred to as the “Group”.
The unaudited interim condensed consolidated financial statements are presented in US
dollar ($), and all values are rounded to the nearest thousands except when otherwise
indicated.
The accompanying unaudited interim condensed consolidated financial statements were
approved and authorized for release by the Audit Committee on August 7, 2012.
2.
Basis of Consolidation
The accompanying unaudited interim condensed consolidated financial statements include the
accounts of the Parent Company and the following subsidiaries:
IMI USA
IMI Japan
IMI Singapore
IMI International Regional Operating
Headquarter (“IMI ROHQ”)
Percentage of Ownership
2012
2011
100.00%
100.00%
100.00%
100.00%
100.00%
100.00%
100.00%
100.00%
Country of
Incorporation
USA
Japan
Singapore
Philippines
Functional
Currency
USD
USD
USD
USD
(Forward)
8
Percentage of Ownership
2011
2010
Speedy-Tech Electronics Ltd.
and Subsidiaries
(“STEL and Subsidiaries”)
Speedy-Tech Technologies
Pte. Ltd. (“STTS”)
Speedy-Tech Electronics (HK)
Limited (“STHK”)
Speedy-Tech (Philippines), Inc.
(“STPHIL”)
Shenzhen Speedy-Tech
Electronics Co., Ltd.
(“SZSTE”)
Speedy-Tech Electronics, Inc.
Speedy-Tech Electronics (Jiaxing)
Co., Ltd. (“STJX”)
Speedy-Tech Electronics
(Chong Qing) Co. Ltd.
(“STCQ”)
IMI (Chengdu) Ltd.
Monarch
Cooperatief
EPIQ EA
Microenergia OOD
EPIQ CZ
EPIQ MX
EPIQ Manufactura
S.A.P.I de C.V.
IMI France
Psi
PSi Laguna*
PSiTech Realty, Inc.*
Pacsem Realty, Inc.*
Country of
Incorporation
Functional
Currency
100.00%
100.00%
Singapore
USD
100.00%
100.00%
Hong Kong
USD
100.00%
100.00%
Philippines
USD
99.48%
100.00%
99.48%
100.00%
China
USA
USD
USD
100.00%
100.00%
China
USD
100.00%
100.00%
100.00%
100.00%
100.00%
70.00%
100.00%
100.00%
100.00%
China
100.00%
China
−
Hong Kong
−
Netherlands
−
Bulgaria
−
Bulgaria
− Czech Republic
−
Mexico
100.00%
100.00%
55.78%
55.78%
22.31%
35.70%
−
−
55.78%
55.78%
22.31%
35.70%
Mexico
France
Philippines
Philippines
Philippines
Philippines
USD
USD
USD
Euro
Bulgarian Lev
Bulgarian Lev
Czech Koruna
Mexican Peso
Mexican Peso
Euro
USD
USD
USD
USD
* The percentage pertains to ownership of the Parent Company
A subsidiary is consolidated from the date on which control is transferred to the Group and
ceases to be consolidated from the date on which control is transferred out of the Group. The
financial statements of the subsidiaries are prepared for the same reporting period as the
Parent Company, using uniform accounting policies for like transactions and other events in
similar circumstances. All significant intercompany balances and transactions, including
intercompany profits and unrealized profits and losses, are eliminated in consolidation.
Noncontrolling interests represent the portion of profit or loss and net assets in subsidiaries
not held by the Group and are presented separately in the consolidated statement of
comprehensive income and within equity in the consolidated balance sheet, separately from
the equity holders of the Parent Company.
Losses within a subsidiary are attributed to the noncontrolling interest even if such results in a
deficit balance. A change in the ownership interest of a subsidiary, without a loss of control, is
accounted for as an equity transaction. If the Group loses control over a subsidiary, it:
• Derecognizes the assets (including goodwill) and liabilities of the subsidiary
• Derecognizes the carrying amount of any noncontrolling interest
• Derecognizes the cumulative translation differences recorded in equity
• Recognizes the fair value of the consideration received
• Recognizes the fair value of any investment retained
9
•
•
Recognizes any surplus or deficit in profit or loss
Reclassifies the parent’s share of components previously recognized in other
comprehensive income to profit or loss or retained earnings, as appropriate.
3. Changes in Accounting Policies and Disclosures
The accounting policies adopted in the preparation of the unaudited interim condensed
consolidated financial statements are consistent with those followed in the preparation of the
Group’s annual consolidated financial statements as of and for the year ended December 31,
2011 except for the adoption of the following new and amended standards and interpretations
as of January 1, 2012. Except as otherwise indicated, the adoption of the new and amended
Standards and Interpretations did not have a significant impact on the Group’s unaudited
interim condensed consolidated financial statements.
•
PFRS 7, Financial Instruments: Disclosures – Enhanced Derecognition Disclosure
Requirements
This amendment requires additional disclosures about financial assets that have been
transferred but not derecognized to enable the users of the Group’s financial statements to
understand the relationship with those assets that have not been derecognized and their
associated liabilities. In addition, the amendment requires disclosures about continuing
involvement in derecognized assets to enable the users to evaluate the nature of and the
risks associated with the entity’s continuing involvement in those derecognized assets.
•
PAS 1, Financial Statement Presentation – Presentation of Items of Other
Comprehensive Income (OCI)
The amendments to PAS 1 change the grouping of items presented in OCI. Items that
could be reclassified (or “recycled”) to profit or loss at a future point in time (for example,
upon derecognition or settlement) would be presented separately from items that will
never be reclassified.
•
PAS 12, Income Taxes (Amendment) – Deferred Taxes: Recovery of Underlying Assets
The amendment clarified the determination of deferred tax on investment property
measured at fair value. The amendment introduces a rebuttable presumption that
deferred tax on investment properties measured using the fair value model under PAS 40
should be determined on the basis that its carrying amount will be recovered through sale.
Furthermore, it introduces the requirement that deferred tax on nondepreciable assets
measured using the revaluation model in PAS 16 always be measured on a sale basis of
the asset.
Future Changes in Accounting Policies
The Group will adopt the standards, interpretations and amendments enumerated below when
these become effective. Except as otherwise stated, the Group does not expect the adoption
of these new and amended PFRS and Philippine Interpretations to have significant impact on
the Group’s unaudited interim condensed consolidated financial statements.
10
Effective in 2013
• PFRS 7, Financial instruments: Disclosures – Offsetting Financial Assets and Financial
Liabilities (retrospectively applied for annual periods beginning on or after January 1,
2013)
These amendments require an entity to disclose information about rights of set-off and
related arrangements (such as collateral agreements). The new disclosures are required
for all recognized financial instruments that are set off in accordance with PAS 32. These
disclosures also apply to recognized financial instruments that are subject to an
enforceable master netting arrangement or ‘similar agreement’, irrespective of whether
they are set-off in accordance with PAS 32. The amendments require entities to disclose,
in a tabular format unless another format is more appropriate, the following minimum
quantitative information. This is presented separately for financial assets and financial
liabilities recognized at the end of the reporting period:
a) The gross amounts of those recognized financial assets and recognized financial
liabilities;
b) The amounts that are set off in accordance with the criteria in PAS 32 when
determining the net amounts presented in the statement of financial position;
c) The net amounts presented in the statement of financial position;
d) The amounts subject to an enforceable master netting arrangement or similar
agreement that are not otherwise included in (b) above, including:
i. Amounts related to recognized financial instruments that do not meet some or all of
the offsetting criteria in PAS 32; and
ii. Amounts related to financial collateral (including cash collateral); and
e) The net amount after deducting the amounts in (d) from the amounts in (c) above.
•
PFRS 10, Consolidated Financial Statements (effective for annual periods beginning on
or after January 1, 2013)
PFRS 10 replaces the portion of PAS 27, Consolidated and Separate Financial
Statements that address the accounting for consolidated financial statements. It also
includes the issues raised in SIC-12 Consolidated – Special Purpose Entities.
PFRS 10 establishes a single control model that applies to all entities including special
purpose entities. The changes introduced by PFRS 10 will require management to
exercise significant judgment to determine which entities are controlled, and therefore, are
required to be consolidated by a parent, compared with the requirements that were in PAS
27.
•
PFRS 11, Joint Arrangements (effective for annual periods beginning on or after January
1, 2013)
This standard replaces PAS 31, Interest on Joint Ventures and SIC-13 Jointly-controlled
Entities - Non-monetary Contributions by Venturers. The standard removes the option to
account for jointly controlled entities (JCEs) using proportionate consolidated. Instead,
JCEs that meet the definition of a joint control must be accounted for using the equity
method.
•
PFRS 12, Disclosure of Interests in Other Entities (effective for annual periods beginning
on or after January 1, 2013)
This standard includes all disclosures that were previously in PAS 27 related to the
consolidated financial statements, as well as all the disclosures that were previously
included in PAS 31 and PAS 28. These disclosures relate to an entity’s interests in
11
subsidiaries, joint arrangements, associates and structured entities. A number of new
disclosures are also required.
•
PFRS 13, Fair Value Measurement (effective for annual periods beginning on or after
January 1, 2013)
This standard establishes a single source of guidance under PFRS for all fair value
measurements. The standard does not change when an entity is required to use fair
value, but rather provides guidance on how to measure fair value under PFRS when fair
value is required or permitted.
•
PAS 19, Employee Benefits (Amendment) (effective for annual periods beginning on or
after January 1, 2013)
The amendments focus on the following key areas: the elimination of the option to defer
the recognition of gains and losses resulting from defined benefit plans (the corridor
approach); the elimination of options for the presentation of gains and losses relating to
those plans; and the improvement of disclosure requirements that will better show the
characteristics of defined benefit plans and the risks arising from those plans. The
amendments to the recognition, presentation and disclosure requirements will ensure that
the financial statements provide investors and other users with a clear picture of an
entity’s commitments resulting from defined benefit plans.
•
PAS 27, Separate Financial Statements (as revised in 2011) (effective for annual periods
beginning on or before January 1, 2013)
As a consequence of the new PFRS 10 and PFRS 12, what remains of PAS 27 is limited
to accounting for subsidiaries, jointly controlled entities and associates in separate
financial statements.
•
PAS 28, Investments in Associates and Joint Ventures (as revised in 2011) (effective for
annual periods beginning on or after January 1, 2013)
As a consequence of the new PFRS 11 and PFRS 12, PAS 28 has been remained PAS
28, Investment in Associates and Joint Ventures. The standard describes the application
of the equity method to investments in joint ventures in addition to associates.
Effective in 2014
• PAS 32, Financial Instruments: Presentation – Offsetting Financial Assets and Financial
liabilities (retrospectively applied for annual periods beginning on or after January 1, 2014)
These amendments to PAS 32 clarify the meaning of “currently has a legally enforceable
right to set-off” and also clarify the application of the PAS 32 offsetting criteria to
settlement systems (such as central clearing house systems) which apply gross
settlement mechanisms that are not simultaneous.
Effective in 2015
• PFRS 9, Financial Instruments: Classification and Measurement (effective for annual
periods beginning on or after January 1, 2015)
PFRS 9, as issued in 2010, reflects the first phase of the IASBs work on the replacement
of PAS 39 and applies to classification and measurement of financial assets and financial
liabilities as defined in PAS 39. In subsequent phases, the IASB will address hedge
accounting and impairment of financial assets. The completion of this project is expected
over the course of 2011 or in the first half of 2012. The adoption of the first phase of
PFRS 9 will have an effect on the classification and measurement of the Group’s financial
assets, but will potentially have no impact on classification and measurement of financial
12
liabilities. The Group has decided not to early adopt for its 2012 financial reporting, thus,
has not conducted a quantification of full impact of this Standard. The Group, however,
will quantify the effect in conjunction with the other phases, when issued, to present a
more comprehensive picture.
•
Philippine Interpretation IFRIC 15, Agreement for Construction of Real Estate (effective for
annual periods beginning on or after January 1, 2015)
This Interpretation covers accounting for revenue and associated expenses by entities that
undertake the construction of real estate directly or through subcontractors. The
Interpretation requires that revenue on construction of real estate be recognized only upon
completion, except when such contract qualifies as construction contract to be accounted
for under PAS 11, Construction Contracts, or involves rendering of services in which case
revenue is recognized based on stage of completion. Contracts involving provision of
services with the construction materials and where the risks and reward of ownership are
transferred to the buyer on a continuous basis will also be accounted for based on stage
of completion.
Revenue Recognition
Revenue is recognized to the extent that it is probable that the economic benefits will flow to
the Group and the revenue can be reliably measured. The Group is acting as a principal in all
of its revenue arrangements. The following specific recognition criteria must also be met
before revenue is recognized:
Sale of goods
Revenue from sale of goods is recognized when goods are shipped or goods are received by
the customer depending on the corresponding agreement with the customers, title and risk of
ownership have passed, the price to the buyer is fixed or determinable and recoverability is
reasonably assured.
Rendering of services
Revenue from sale of services is recognized when the related services to complete the
required units have been rendered.
Interest
Interest income is recognized as it accrues using the effective interest rate method.
Dividends
Dividend income is recorded when the right of payment has been established.
Miscellaneous income
Miscellaneous income is recognized as the Group earns the right over it.
Cash and Cash Equivalents
Cash includes cash on hand and in banks. Cash equivalents are short-term, highly liquid
investments that are readily convertible to known amounts of cash with original maturities of
three (3) months or less and that are subject to an insignificant risk of change in value.
Financial Instruments
Financial instruments within the scope of PAS 39 are classified as: (1) financial assets and
liabilities at fair value through profit or loss (FVPL); (2) loans and receivables; (3) held-tomaturity (HTM) investments; (4) AFS financial assets; and (5) other financial liabilities. The
13
classification depends on the purpose for which the instruments were acquired and whether
they are quoted in an active market. Management determines the classification of its
investments at initial recognition and, where allowed and appropriate, re-evaluates this
designation at every reporting date.
Financial instruments are recognized in the consolidated balance sheet when the Group
becomes a party to the contractual provisions of the instrument. In the case of a regular way
purchase or sale of financial assets, recognition and derecognition, as applicable, are done
using trade date accounting. The Group follows the trade date accounting where an asset to
be received and liability to be paid are recognized on the trade date and the derecognition of
an asset that is sold and the recognition of a receivable from the buyer are likewise
recognized on the trade date.
The subsequent measurement bases for financial instruments depend on its classification.
The financial instruments of the Group as of June 30, 2012 and December 31, 2011 consist of
loans and receivables, financial asset at FVPL, AFS financial assets, financial liability at FVPL
and other financial liabilities.
Determination of fair value
The fair value for a financial instrument traded in an active market at the reporting date is
based on its quoted market price or dealer price quotation (bid price for long positions and ask
price for short positions), without any deduction for transaction costs. When current bid and
ask prices are not available, the price of the most recent transaction provides evidence of the
current fair value as long as there has not been a significant change in economic
circumstances since the time of the transaction.
For all other financial instruments not listed in an active market, the fair value is determined by
using appropriate valuation methodologies. Valuation methodologies include net present
value techniques, comparison to similar instruments for which market observable prices exist,
option pricing models, and other relevant valuation models.
Day 1 profit
Where the transaction price in a non-active market is different from the fair value from other
observable current market transactions in the same instrument or based on a valuation
technique whose variables include only data from an observable market, the Group
recognizes the difference between the transaction price and fair value (a Day 1 profit) in the
consolidated statement of comprehensive income unless it qualifies for recognition as some
other type of asset or liability.
In cases where use is made of data which is not observable, the difference between the
transaction price and model value is only recognized in the consolidated statement of
comprehensive income when the inputs become observable or when the instrument is
derecognized. For each transaction, the Group determines the appropriate method of
recognizing the ‘Day 1’ profit amount.
Financial assets or financial liabilities at FVPL
Financial assets or financial liabilities at FVPL include derivatives, financial instruments held
for trading and financial instruments designated upon initial recognition as at FVPL.
14
Financial instruments are classified as held for trading if they are entered into for the purpose
of short-term profit-taking.
Derivatives, including separated embedded derivatives, are accounted for as financial assets
or liability at FVPL unless they are designated as effective hedging instruments or a financial
guarantee contract. Where a contract contains one or more embedded derivatives, the hybrid
contract may be designated as financial asset or liability at FVPL, except where the
embedded derivative does not significantly modify the cash flows or it is clear that separation
of the embedded derivative is prohibited.
Financial instruments may be designated at initial recognition as financial asset or liability at
FVPL if any of the following criteria are met: (1) the designation eliminates or significantly
reduces the inconsistent treatment that would otherwise arise from measuring the instrument
or recognizing gains or losses on a different basis; or (2) the instrument is part of a group of
financial instruments which are managed and their performance evaluated on a fair value
basis, in accordance with a documented risk management strategy; or (3) the financial
instrument contains an embedded derivative that would need to be separately recorded.
Financial instruments at FVPL are subsequently carried at fair value. Changes in fair value of
such assets or liabilities are accounted for in the consolidated statement of comprehensive
income.
The Group uses currency forwards to hedge its risks associated with foreign currency
fluctuations. Such are accounted for as nonhedge derivatives.
An embedded derivative is separated from the host contract and accounted for as a derivative
if all of the following conditions are met: (a) the economic characteristics and risks of the
embedded derivative are not closely related to the economic characteristics of the host
contract; (b) a separate instrument with the same terms as the embedded derivative would
meet the definition of a derivative; and (c) the hybrid or combined instrument is not recognized
at FVPL. The Group assesses whether an embedded derivative is required to be separated
from the host contract when the Group first becomes party to the contract. Reassessment of
embedded derivatives is only done when there are changes in the contract that significantly
modifies the contractual cash flows.
Loans and receivables
Loans and receivables are nonderivative financial assets with fixed or determinable payments
that are not quoted in an active market other than those that the Group intends to sell in the
short term or that it has designated as at FVPL. After initial measurement, loans and
receivables are subsequently carried at amortized cost using the effective interest rate method
less any allowance for impairment. Amortized cost is calculated taking into account any
discount or premium on the acquisition and includes fees that are an integral part of the
effective interest rate and transaction costs. Gains and losses are recognized in the
consolidated statement of comprehensive income when the loans and receivables are
derecognized or impaired, as well as through the amortization process. Loans and
receivables are classified as current assets when the Group expects to realize or collect the
asset within twelve months from balance sheet date. Otherwise, these are classified as
noncurrent assets.
15
This accounting policy relates primarily to the Group’s cash and cash equivalents, loans and
receivables, noncurrent receivables and miscellaneous deposits.
AFS financial assets
AFS financial assets are those which are designated as such or do not qualify to be classified
or designated as at FVPL, loans and receivables or HTM investments. They are purchased
and held indefinitely, and may be sold in response to liquidity requirements or changes in
market conditions. AFS financial assets are classified as current assets if management
intends to sell these financial assets within 12 months from financial reporting. Otherwise,
these are classified as noncurrent assets.
After initial measurement, AFS financial assets are subsequently measured at fair value.
Dividends earned on holding AFS financial assets are recognized in the consolidated
statement of comprehensive income as dividend income when the right to receive payment
has been established. The unrealized gains and losses arising from the fair valuation of AFS
financial assets are reported under other comprehensive income. The losses arising from
impairment of such investments are recognized as impairment losses in profit or loss. When
the security is disposed of, the cumulative gain or loss previously recognized under other
comprehensive income is recognized as realized gains or losses in profit or loss.
When the fair value of AFS equity instruments cannot be measured reliably because of lack of
reliable estimates of future cash flows and discount rates necessary to calculate the fair value
of unquoted equity instruments, these investments are carried at cost, less any allowance for
impairment losses.
This accounting policy pertains to the Group’s investments in club shares.
Other financial liabilities
All loans and borrowings are initially recognized at the fair value of the consideration received
less directly attributable transaction costs. After initial recognition, interest-bearing loans and
borrowings are measured at amortized cost using the effective interest rate method. Gains
and losses are recognized in the consolidated statement of comprehensive income when the
liabilities are derecognized as well as through the amortization process. Financial liabilities
are classified as current liabilities if maturity is within 12 months from financial reporting.
Otherwise, these are classified as noncurrent liabilities.
This accounting policy relates primarily to the Group’s accounts payable and accrued
expenses (excluding customers’ deposits, statutory payables and taxes payable), trust
receipts and loans payable, lease liability and long-term debt.
Offsetting
Financial assets and financial liabilities are offset and the net amount reported in the
consolidated balance sheet if, and only if, there is a currently enforceable legal right to offset
the recognized amounts and there is an intention to settle on a net basis, or to realize the
asset and settle the liability simultaneously.
16
Impairment of Financial Assets
The Group assesses at each reporting date whether a financial asset or group of financial
assets is impaired.
A financial asset or a group of financial assets is deemed to be impaired if, and only if, there is
objective evidence of impairment as a result of one or more events that has occurred after the
initial recognition of the asset (an incurred loss event) and that loss event (or events) has an
impact on the estimated future cash flows of the financial asset or the group of financial assets
that can be reliably estimated. Evidence of impairment may include indications that the
borrower or a group of borrowers is experiencing significant financial difficulty, default or
delinquency in interest or principal payments, the probability that they will enter bankruptcy or
other financial reorganization and where observable data indicate that there is a measurable
decrease in the estimated future cash flows, such as changes in arrears or economic
conditions that correlate with defaults.
Loans and receivables
The Group first assesses whether objective evidence of impairment exists individually for
financial assets that are individually significant. If it is determined that no objective evidence
of impairment exists for an individually assessed financial asset, whether significant or not, the
asset is included in a group of financial assets with similar credit risk characteristics and that
group of financial assets is collectively assessed for impairment. Those characteristics are
relevant to the estimation of future cash flows for groups of such assets by being indicative of
the debtors’ ability to pay all amounts due according to the contractual terms of the assets
being evaluated. Assets that are individually assessed for impairment and for which an
impairment loss is, or continues to be recognized, are not included in a collective assessment
for impairment.
If there is objective evidence that an impairment loss on loans and receivables carried at
amortized cost has been incurred, the amount of the loss is measured as the difference
between the asset’s carrying amount and the present value of estimated future cash flows
(excluding future expected credit losses that have not been incurred) discounted at the
financial asset’s original effective interest rate (i.e., the effective interest rate computed at
initial recognition). The carrying amount of the asset is reduced through the use of an
allowance account and the amount of the loss is charged to profit or loss. Receivables,
together with the associated allowance accounts, are written off when there is no realistic
prospect of future recovery. If, in a subsequent period, the amount of the impairment loss
decreases and the decrease can be related objectively to an event occurring after the
impairment was recognized, the previously recognized impairment loss is reversed to the
extent that the carrying value of the asset does not exceed its amortized cost at the reversal
date. Any subsequent reversal of an impairment loss is recognized in profit or loss.
For the purpose of a collective evaluation of impairment, financial assets are grouped on the
basis of such credit risk characteristics as payment history and past-due status. Future cash
flows in a group of financial assets that are collectively evaluated for impairment are estimated
on the basis of historical loss experience for assets with credit risk characteristics similar to
those in the group. Historical loss experience is adjusted on the basis of current observable
data to reflect the effects of current conditions that did not affect the period on which the
historical loss experience is based and to remove the effects of conditions in the historical
period that do not exist currently. The methodology and assumptions used for estimating
future cash flows are reviewed regularly by the Group to reduce any differences between loss
estimates and actual loss experience.
17
AFS financial assets
For the Group’s equity investments classified as AFS financial assets, impairment indicators
would include a significant or prolonged decline in the fair value of the investments below its
cost. Where there is evidence of impairment, the cumulative loss - measured as the
difference between the acquisition cost and the current fair value, less any impairment loss on
that financial asset previously charged to income - is removed from other comprehensive
income and recognized in profit or loss. Impairment losses on equity investments are not
reversed through profit or loss. Increases in fair value after impairment are recognized directly
in other comprehensive income.
Derecognition of Financial Assets and Financial Liabilities
Financial asset
A financial asset (or, where applicable, a part of a financial asset or part of a group of similar
financial assets) is derecognized when:
• the right to receive cash flows from the asset have expired;
• the Group retains the right to receive cash flows from the asset, but has assumed an
obligation to pay them in full without material delay to a third party under a ‘pass-through’
arrangement; or
• the Group has transferred its right to receive cash flows from the asset and either: (a) has
transferred substantially all the risks and rewards of the asset; or (b) has neither
transferred nor retained substantially all the risks and rewards of the asset, but has
transferred control of the asset.
Where the Group has transferred its right to receive cash flows from an asset and has neither
transferred nor retained substantially all the risks and rewards of the asset nor transferred
control of the asset, the asset is recognized to the extent of the Group’s continuing
involvement in the asset.
Financial liability
A financial liability is derecognized when the obligation under the liability expires, or is
discharged or cancelled. Where an existing financial liability is replaced by another from the
same lender on substantially different terms, or the terms of an existing liability are
substantially modified, such an exchange or modification is treated as a derecognition of the
original liability and the recognition of a new liability, and the difference in the respective
carrying amounts is recognized in the consolidated statement of comprehensive income.
Inventories
Inventories are valued at the lower of cost or net realizable value (NRV). Cost is determined
using the moving average method for raw materials and supplies. For finished goods and
work-in-process, cost includes direct materials, direct labor and a proportion of manufacturing
overhead costs based on normal operating capacity determined using the moving average
method. NRV is the estimated selling price in the ordinary course of business, less the
estimated costs of completion and costs necessary to make the sale. In the event that NRV is
lower than cost, the decline shall be recognized as an expense in the consolidated statement
of comprehensive income.
Business Combination and Goodwill
Business combinations from January 1, 2010
Business combinations are accounted for using the acquisition method. The cost of an
acquisition is measured as the aggregate of the consideration transferred, measured at
acquisition date fair value, and the amount of any noncontrolling interest in the acquiree. For
18
each business combination, the acquirer measures the noncontrolling interest in the acquiree
either at fair value or at the proportionate share of the acquiree’s identifiable net assets.
Acquisition costs incurred are expensed and included in administrative expenses.
When the Group acquires a business, it assesses the financial assets and liabilities assumed
for appropriate classification and designation in accordance with the contractual terms,
economic circumstances and pertinent conditions as at the acquisition date. This includes the
separation of embedded derivatives in host contracts by the acquiree.
If the business combination is achieved in stages, the acquisition date fair value of the
acquirer’s previously held equity interest in the acquiree is remeasured to fair value at the
acquisition date through profit or loss.
Any contingent consideration to be transferred by the acquirer will be recognized at fair value
at the acquisition date. Subsequent changes to the fair value of the contingent consideration
which is deemed to be an asset or liability will be recognized in accordance with PAS 39 either
in profit or loss or as a change to other comprehensive income. If the contingent
consideration is classified as equity, it should not be remeasured until it is finally settled within
equity.
Goodwill is initially measured at cost, being the excess of the aggregate of the consideration
transferred and the amount recognized for non controlling interest over the net identifiable
assets acquired and liabilities assumed. If this consideration is lower than the fair value of the
net assets of the subsidiary acquired, the difference is recognized in profit or loss.
Following initial recognition, goodwill is measured at cost less any accumulated impairment
loss. Goodwill is reviewed for impairment, annually or more frequently if events or changes in
circumstances indicate that the carrying value may be impaired. For the purpose of impairment
testing, goodwill acquired in a business combination is, from the acquisition date, allocated to
each of the Group’s cash-generating units (CGUs), or groups of CGUs, that are expected to
benefit from the synergies of the combination, irrespective of whether other assets or liabilities
of the Group are assigned to those units or groups of units. Each unit or group of units to which
the goodwill is allocated should:
•
•
represent the lowest level within the Group at which the goodwill is monitored for internal
management purposes; and
not be larger than an operating segment determined in accordance with PFRS 8.
Impairment is determined by assessing the recoverable amount of the CGU (or group of
CGUs), to which the goodwill relates. Where the recoverable amount of the CGU (or group of
CGUs) is less than the carrying amount, an impairment loss is recognized. Where goodwill
forms part of a CGU (or group of CGUs) and part of the operation within that unit is disposed of,
the goodwill associated with the operation disposed of is included in the carrying amount of the
operation when determining the gain or loss on disposal of the operation. Goodwill disposed of
in these circumstances is measured based on the relative values of the operation disposed of
and the portion of the CGU retained. If the acquirer’s interest in the net fair value of the
identifiable assets, liabilities and contingent liabilities exceeds the cost of the business
combination, the acquirer shall recognize immediately in the consolidated statement of
comprehensive income any excess remaining after reassessment.
19
Business combinations prior to January 1, 2010
In comparison to the above-mentioned requirements, the following differences applied:
Business combinations were accounted for using the purchase method. Transaction costs
directly attributable to the acquisition formed part of the acquisition costs. The noncontrolling
interest (formerly known as minority interest) was measured at the proportionate share of the
acquiree’s identifiable net assets.
Business combinations achieved in stages were accounted for as separate steps. Any
additional acquired share of interest did not affect previously recognised goodwill.
When the Group acquired a business, embedded derivatives separated from the host contract
by the acquiree were not reassessed on acquisition unless the business combination resulted
in a change in the terms of the contract that significantly modified the cash flows that
otherwise would have been required under the contract.
Contingent consideration was recognized if, and only if, the Group had a present obligation,
the economic outflow was more likely than not and a reliable estimate was determinable.
Subsequent adjustments to the contingent consideration were recognized as part of goodwill.
Goodwill acquired in a business combination is initially measured at cost, being the excess of
the cost of the business combination over the Group’s interest in the net fair value of the
identifiable assets, liabilities and contingent liabilities of the acquired entity at the date of
acquisition.
Property, Plant and Equipment
Property, plant and equipment are carried at cost, net of accumulated depreciation and
amortization and any impairment loss.
The cost of projects in progress include costs of construction of plant and equipment and
machinery items installed and any other cost directly attributable to bringing the asset to its
intended use. Projects in progress are not depreciated and amortized until such time as the
relevant assets are completed and put into operational use.
The initial cost of property, plant and equipment consists of its purchase price and any directly
attributable cost of bringing the asset to its working condition and location for its intended use.
Expenditures incurred after the fixed assets have been put into operation, such as repairs and
maintenance and overhaul costs, are normally charged against operations income in the
period in which the costs are incurred. In situations where it can be clearly demonstrated that
the expenditures have resulted in an increase in the future economic benefits expected to be
obtained from the use of an item of property, plant and equipment beyond its originally
assessed standard of performance, the expenditures are capitalized as additional costs of
property, plant and equipment. Upon retirement or sale, the cost of the asset disposed and
the related accumulated depreciation or amortization are removed from the accounts and any
resulting gain or loss is included in the consolidated statement of comprehensive income.
20
Depreciation and amortization are computed on a straight-line basis over the estimated useful
lives (EUL) of the respective assets as follows:
The EUL of property, plant and equipment are as follow:
Buildings
Building improvements
Machinery and facilities equipment
Furniture, fixtures and office equipment
Transportation equipment
Tools and instruments
Years
25 - 30
5
7 - 10
3-5
3-5
2-5
Leasehold improvements are amortized over the shorter of the related lease terms or their
EUL of 5 years.
The EUL of property, plant and equipment are reviewed annually based on expected asset
utilization as anchored on business plans and strategies that also consider expected future
technological developments and market behavior to ensure that the period of depreciation and
amortization is consistent with the expected pattern of economic benefits from items of
property, plant and equipment. Adjustments to the EUL are accounted for prospectively.
Borrowing Costs
Borrowing costs directly attributable to the acquisition, construction or production of an asset
that necessarily takes a substantial period of time to get ready for its intended use or sale are
capitalized as part of the cost of the respective assets. All other borrowing costs are
expensed in the period they occur. Borrowing costs consist of interest and other costs that an
entity incurs in connection with the borrowing of funds.
Investments in Subsidiaries
Investments in subsidiaries in the Parent Company's separate financial statements are
accounted for under cost method of accounting. Dividends received are reported as dividend
income when the right to receive the payment is established.
Intangible Assets
Intangible assets acquired separately are measured on initial recognition at cost. The cost of
intangible assets acquired in a business combination is the fair value as of the date of
acquisition. Following initial recognition, intangible assets are carried at cost less any
accumulated amortization and any accumulated impairment loss. The EUL of intangible
assets with finite life are assessed at the individual asset level. Intangible assets with finite life
are amortized over their EUL using the straight line method. The amortization periods and
method of amortization for intangible assets with finite useful lives are reviewed annually or
earlier when an indicator of impairment exists.
The EUL of intangible assets are as follows:
Customer relationships
Unpatented technology
Computer software
Years
5
5
3
21
Intangible assets with indefinite useful lives are not amortized, but are tested for impairment
annually, either individually or at the cash generating unit level. The assessment of indefinite
life is reviewed annually to determine whether the indefinite life continues to be supportable. If
not, the change in useful life from indefinite to finite is made on a prospective basis.
A gain or loss arising from derecognition of an intangible asset is measured as the difference
between the net disposal proceeds and the carrying amount of the asset and is recognized in
the consolidated statement of comprehensive income when the asset is derecognized.
Impairment of Nonfinancial Assets
An assessment is made at the reporting date to determine whether there is any indication that
an asset may be impaired, or whether there is any indication that an impairment loss
previously recognized for an asset in prior periods may no longer exist or may have
decreased. If any such indication exists or when annual impairment testing for an asset is
required, the Group makes an estimate of the asset’s recoverable amount. The recoverable
amount of an asset is the greater of its net selling price and value in use. Where the carrying
value of an asset exceeds its estimated recoverable amount, the asset or CGU to which the
asset belongs is written down to its recoverable amount. An impairment loss is charged
against operations in the period in which it arises.
Property, plant and equipment and intangible assets
A previously recognized impairment loss is reversed only if there has been a change in
estimate used to determine the recoverable amount of an asset, however, not to an amount
higher than the carrying amount that would have been determined (net of any accumulated
depreciation and amortization for property, plant and equipment and intangible assets) had no
impairment loss been recognized for the asset in prior periods. A reversal of an impairment
loss is credited to current operations. After such reversal, the depreciation and amortization
charge is adjusted in future periods to allocate the asset’s revised carrying amount, less any
residual value, on a systematic basis over its remaining useful life.
Goodwill
Impairment losses relating to goodwill cannot be reversed in the future.
Income Tax
Current tax
Current tax assets and liabilities for the current and prior periods are measured at the amount
expected to be recovered from or paid to the tax authority. The tax rates and tax laws used to
compute the amount are those that are enacted or substantively enacted as at end of the
reporting period.
Deferred tax
Deferred tax is provided, using the liability method, on all temporary differences at the end of
the reporting period between the tax bases of assets and liabilities and their carrying amounts
for financial reporting purposes.
Deferred tax liabilities are recognized for all taxable temporary differences. Deferred tax
assets are recognized for all deductible temporary differences, carryforward of unused tax
credits and unused tax losses, to the extent that it is probable that taxable income will be
available against which the deductible temporary differences and carryforward of unused tax
credits and unused tax losses can be utilized, except:
22
•
•
Where the deferred tax asset relating to the deductible temporary differences arises from
the initial recognition of an asset or liability in a transaction that is not a business
combination and, at the time of the transaction, affects neither the accounting income nor
taxable income or loss; and
In respect of taxable temporary differences associated with investments in subsidiaries,
associates and interests in joint ventures, deferred tax assets are recognized only to the
extent that it is probable that the temporary differences will reverse in the foreseeable
future and taxable income will be available against which the temporary differences can be
utilized.
The carrying amount of deferred tax assets is reviewed at the end of the reporting period and
reduced to the extent that it is no longer probable that sufficient taxable income will be
available to allow all or part of the deferred tax assets to be utilized.
Deferred tax assets and liabilities are measured at the tax rate that is expected to apply to the
period when the asset is realized or the liability is settled, based on tax rates (and tax laws)
that have been enacted or substantively enacted as of the reporting date.
Income tax relating to items recognized in other comprehensive income is recognized in the
consolidated statement of comprehensive income under other comprehensive income.
Deferred tax assets and deferred tax liabilities are offset if a legally enforceable right exists to
set off current tax assets against current tax liabilities and the deferred taxes relate to the
same taxable entity and the same taxation authority.
For periods where an ITH is in effect, no deferred taxes are recognized in the consolidated
financial statements as the ITH status of the Group neither results in a deductible temporary
difference or temporary taxable difference. However, for temporary differences that are
expected to reverse beyond the ITH, deferred taxes are recognized.
Equity
Capital stock is measured at par value for all shares issued and outstanding. When the
shares are sold at premium, the difference between the proceeds at the par value is credited
to “Additional paid-in capital” account. Direct costs incurred related to equity issuance, such
as underwriting, accounting and legal fees, printing costs and taxes are charged to “Additional
paid-in capital” account. If additional paid-in capital is not sufficient, the excess is charged
against retained earnings. When the Group issues more than one class of stock, a separate
account is maintained for each class of stock and the number of shares issued.
Subscriptions receivable pertains to the uncollected portion of the subscribed shares.
Retained earnings represent net accumulated earnings of the Group less dividends declared.
Appropriated retained earnings are set aside for future expansion.
23
Treasury stock is recorded at cost and is presented as a deduction from equity. When the
shares are retired, the capital stock account is reduced by its par value and the excess of cost
over par value upon retirement is debited to additional paid-in capital to the extent of the
specific or average additional paid-in capital when the shares were issued and to retained
earnings for the remaining balance.
Foreign Currency Transactions
The functional and presentation currency of the Parent Company and its subsidiaries (except
for EPIQ EA, EPIQ CZ, EPIQ MX, IMI France, and Cooperatief) is the U.S. Dollar. Each entity
in the Group determines its own functional currency and items included in the financial
statements of each entity are measured using that functional currency. Transactions in
foreign currencies are initially recorded in the functional currency rate ruling at the date of the
transaction. Monetary assets and liabilities denominated in foreign currencies are retranslated
at the functional currency rate of exchange ruling at the reporting date. All differences are
taken to the consolidated statement of comprehensive income. Nonmonetary items that are
measured in terms of historical cost in a foreign currency are translated using the exchange
rate as at the date of initial transaction. Nonmonetary items measured at fair value in a foreign
currency are translated using the exchange rate at the date when the fair value was
determined.
The functional currencies of EPIQ EA, EPIQ CZ, and EPIQ MX, are the Bulgarian Lev (BGN),
Czech Koruna (CZK) and Mexican Peso (MXN), respectively. The functional currency of IMI
France and Cooperatief is the Euro (€). These subsidiaries mostly use their local currencies
for their daily transactions. As at the reporting date, the assets and liabilities of these
subsidiaries are translated into the presentation currency of the Group at the rate of exchange
ruling at the reporting date and their profit and loss accounts are translated at the weighted
average exchange rates for the year. The exchange differences arising on the translation are
recognized in the consolidated statement of comprehensive income and reported as a
separate component of equity. On disposal of a foreign entity, the deferred cumulative amount
recognized in the consolidated statement of comprehensive income relating to that particular
foreign operation shall be recognized in profit or loss.
Pensions and Other Employee Benefits
Defined contribution plans
The Parent Company’s subsidiaries in Singapore, PRC and Hong Kong participate in their
respective national pension schemes which are considered as defined contribution plans. A
defined contribution plan is a pension plan under which the subsidiary pays fixed
contributions. The subsidiary has no legal or constructive obligations to pay further
contributions if the fund does not hold sufficient assets to pay all the employees the benefits
relating to employee service in the current and prior periods. The required contributions to the
national pension schemes are recognized as pension cost as accrued.
Singapore
The subsidiaries incorporated and operating in Singapore make contributions to the Central
Provident Fund scheme in Singapore, a defined contribution pension scheme. Contributions
to national pension schemes are recognized as an expense in the period in which the related
service is performed.
24
PRC
The subsidiaries incorporated and operating in PRC are required to provide certain staff
pension benefits to their employees under existing PRC regulations. Pension contributions
are provided at rates stipulated by PRC regulations and are contributed to a pension fund
managed by government agencies, which are responsible for administering these amounts for
the subsidiaries’ employees.
Hong Kong
The subsidiary in Hong Kong participates in the defined Provident Fund. The subsidiary and
its employees make monthly contributions to the scheme at 5% of the employees’ earnings as
defined under the Mandatory Provident Fund legislation. The contributions of the subsidiary
and the employees are subject to a cap of HK$1,000 per month and thereafter, contributions
are voluntary.
EPIQ CZ
EPIQ CZ, under its Collective Agreement, is committed to pay contributions to life and pension
insurance of its loyal employees. This is done on a monthly basis as part of payroll expenses
and only over the employment period. EPIQ CZ is not obliged to any other payments if
employment terminates.
Defined benefit plans
The Parent Company, PSi and EPIQ EA maintain separate defined benefit plans covering
substantially all of their employees. The plans of the Parent Company and PSi are funded,
noncontributory pension plans administered by their respective Boards of Trustees, while that
of EPIQ EA is unfunded and noncontributory. Pension cost is actuarially determined using the
projected unit credit method. This method reflects services rendered by employees up to the
date of valuation and incorporates assumptions concerning employees’ projected salaries.
Actuarial valuations are conducted with sufficient regularity, with the option to accelerate when
significant changes to underlying assumptions occur. Pension cost includes current service
cost, interest cost, expected return on any plan assets, actuarial gains and losses, past
service cost and the effect of any curtailment or settlement.
A portion of the actuarial gains and losses is recognized as income or expense if the
cumulative unrecognized actuarial gains and losses at the end of the previous reporting period
exceeded the greater of 10% of the present value of the defined benefit obligation or 10% of
the fair value of the plan assets. These gains and losses are recognized over the expected
average remaining working lives of the employees participating in the plan.
Past service costs, if any, are recognized immediately in the consolidated statement of
comprehensive income, unless the changes to the pension plan are conditional on the
employees remaining in service for a specified period of time (the vesting period). In this
case, the past-service costs are amortized on a straight-line basis over the vesting period.
The net pension asset recognized in respect of the defined benefit pension plan is the lower
of: (a) the fair value of the plan assets less the present value of the defined benefit obligation
at the reporting date, together with adjustments for unrecognized actuarial gains or losses and
past service costs that shall be recognized in later periods; or (b) the total of any cumulative
unrecognized net actuarial loss and past service cost and the present value of any economic
benefit available in the form of refunds from the plan or reductions in future contributions to
the plan. If there is no minimum funding requirement, an entity shall determine the economic
benefit available as a reduction in future contributions as the lower of: (a) the surplus in the
plan; and (b) the present value of the future service cost to the entity, excluding any part of the
25
future cost that will be borne by employees, for each year over the shorter of the expected life
of the plan and the expected life of the entity.
The defined benefit obligation is calculated annually by independent actuaries using the
projected unit credit method. The present value of the defined benefit obligation is determined
by discounting the estimated future cash outflows using risk-free interest rates of government
bonds that have terms to maturity approximating the terms of the related pension liability or
applying a single weighted average discount rate that reflects the estimated timing and
amount of benefit payments.
Employee leave entitlement
Employee entitlements to annual leave are recognized as a liability when they accrue to
employees. A provision is made for the estimated liability for leave as a result of services
rendered by employees up to the reporting date.
Share-based Payment Transactions
Certain employees (including directors) of the Group receive remuneration in the form of
share-based payment transactions, whereby employees render services in exchange for
shares or rights over shares (“equity-settled transactions”).
The Group has an employee stock ownership plan (ESOWN) which allows the grantees to
purchase the Parent Company’s shares at a discounted price. The Group recognizes the
difference between the market price at the time of subscription and the subscription price as
employee benefit expense over the holding period.
Earnings Per Share
Basic earnings per share (EPS) is computed by dividing net income attributable to common
equity holders by the weighted average number of common shares outstanding and adjusted
to give retroactive effect to any stock dividends declared during the period. Diluted EPS is
computed by dividing net income attributable to common equity holders by the weighted
average number of common shares outstanding plus the weighted average number of
common shares that would be issued on conversion of all the dilutive potential common
shares. The calculation of diluted earnings per share does not assume conversion, exercise
or other issue of potential common shares that would have an antidilutive effect on earnings
per share.
Leases
The determination of whether an arrangement is, or contains a lease, is based on the
substance of the arrangement and requires an assessment of whether the fulfillment of the
arrangement is dependent on the use of a specific asset or assets and the arrangement
conveys a right to use the asset. A reassessment is made after inception of the lease only if
one of the following applies:
a. There is a change in contractual terms, other than a renewal or extension of the
arrangement;
b. A renewal option is exercised or extension granted, unless that term of the renewal or
extension was initially included in the lease term;
c. There is a change in the determination of whether fulfillment is dependent on a specified
asset; or
d. There is a substantial change to the asset.
26
Where a reassessment is made, lease accounting shall commence or cease from the date
when the change in circumstances gave rise to the reassessment for scenarios a, c or d
above, and at the date of renewal or extension period for scenario b.
Finance leases, which transfer to the Group substantially all the risks and benefits incidental
to ownership of the leased item, are capitalized at the inception of the lease at the fair value of
the leased property or, if lower, at the present value of the minimum lease payments and
included in the “Property, plant and equipment” account with the corresponding liability to the
lessor included in the “Accounts payable and accrued expenses” account for the current
portion and “Obligation under finance lease - noncurrent” account for the noncurrent portion in
the consolidated balance sheet. Lease payments are apportioned between the finance
charges and reduction of the lease liability so as to achieve a constant rate of interest on the
remaining balance of the liability. Finance charges are charged directly as “Interest expense”
in the consolidated statement of comprehensive income.
Leases where the lessor does not transfer substantially all the risks and benefits of ownership
of the assets are classified as operating leases. Operating lease payments are recognized as
expense in the consolidated statement of comprehensive income on a straight-line basis over
the lease term.
Expenses
Expenses of the Group include cost of goods sold, cost of services, and operating expenses.
Cost of goods sold and services pertain to the direct expenses incurred by the Group related
to the products and services offered. Operating expenses pertain to the general and
administrative expenses. Cost of goods sold and services are recognized when the related
goods are sold and when services are rendered. Operating expenses are recognized when
incurred except for rent expense which is computed on a straight line basis over the lease
term.
Provisions
Provisions are recognized only when the following conditions are met: (a) there exists a
present obligation (legal or constructive) as a result of a past event; (b) it is probable (i.e.,
more likely than not) that an outflow of resources embodying economic benefits will be
required to settle the obligation; and (c) a reliable estimate can be made of the amount of the
obligation. Provisions are reviewed at each balance sheet date and adjusted to reflect the
current best estimate. If it is no longer probable that an outflow of resources embodying
economic benefits will be required to settle the obligation, the provision is reversed.
Contingencies
Contingent liabilities are not recognized in the consolidated financial statements. These are
disclosed unless the possibility of an outflow of resources embodying economic benefits is
remote. A contingent asset is not recognized in the consolidated financial statements but
disclosed when an inflow of economic benefits is probable. Where the Group expects some
or all of a provision to be reimbursed, for example an insurance claim, the reimbursement is
recognized as a separate asset but only when the reimbursement is virtually certain.
27
Events after the Reporting Period
Post year-end events that provide additional information about the Group’s position at the end
of the reporting period (adjusting events) are reflected in the consolidated financial
statements. Post year-end events that are non-adjusting events are disclosed in the
consolidated financial statements when material.
4. Cash and Cash Equivalents
Cash on hand and in banks
Short-term deposits
June 30, December 31,
2012
2011
(Unaudited)
(Audited)
(In thousands)
$36,990
$36,507
17,562
6,938
$43,928
$54,069
Cash in banks earns interest at the respective bank deposit rates. Short-term deposits are
made for varying periods of up to three (3) months and earn interest at the respective shortterm deposit rates.
5. Loans and Receivables
Trade
Nontrade
Receivable from insurance
Receivables from employees
Due from related parties (Note 15)
Others
Less allowance for doubtful accounts
June 30,
December 31,
2012
2011
(Unaudited)
(Audited)
(In thousands)
$149,196
$127,744
3,103
4,293
1,230
1,230
617
1,811
173
211
4,055
1,791
158,374
137,080
3,640
3,403
$154,734
$133,677
Trade
Trade receivables arise from manufacturing and other related services for electronic products
and components and have credit terms ranging from 30 to 60 days from invoice date.
Nontrade
Nontrade receivables represent billings to customers for production and test equipment and all
other charges agreed with the customers in carrying out business operations. These
receivables have credit terms ranging from 30 to 60 days from invoice date.
28
Receivable from insurance
Insurance claims for damages to equipment and inventories caused by a fire incident in the
Parent Company’s plant in Cebu, Philippines in May 2009 amounted to $1.23 million as of
June 30, 2012 and December 31, 2011, respectively.
6. Inventories
Provision for inventory obsolescence recognized for the six-month period ended June 30,
2012 and 2011 amounted to $0.57 million and $0.07 million, respectively.
7. Property, Plant and Equipment
June 30, 2012 (Unaudited)
In thousands
Buildings
and
Improvements
Machinery
and
Facilities
Equipment
Furniture,
Fixtures and
Office
Equipment
Transportation
Tools and
Instruments
Construction
in Progress
Total
$219,898
Cost
$70,940
$128,579
$14,338
$1,284
$2,943
$1,814
Additions
557
6,107
338
186
382
1,583
9,153
Disposals
(6)
(5,306)
(18)
(222)
(1)
–
(5,553)
–
1,666
–
–
–
(1,666)
–
At January 1, 2012
Reclassifications
Foreign currency exchange
difference
(132)
(357)
141
110
–
(119)
(357)
71,359
130,689
14,799
1,358
3,324
1,612
223,141
At January 1, 2012
Depreciation and
amortization
34,269
73,322
10,747
430
2,122
–
120,890
1,625
9,088
917
240
227
–
12,097
Disposals
At June 30, 2012
Accumulated impairment
loss
Net book value as of
June 30, 2012
(7)
35,887
(3,189)
79,221
(12)
11,652
(67)
603
(1)
2,348
–
–
(3,276)
129,711
737
753
12
–
–
–
1,502
$34,735
$50,713
$3,135
$755
$978
$1,612
$91,928
Buildings
and
Improvements
Machinery
and
Facilities
Equipment
Furniture,
Fixtures and
Office
Equipment
Transportation
Construction
in Progress
Total
$51,326
$119,640
$13,911
$972
$2,724
$96
$188,669
2,666
9,486
1,032
288
229
1,129
14,830
At June 30, 2012
Accumulated depreciation
and amortization
December 31, 2011
In thousands
Tools and
Instruments
Cost
At January 1, 2011
Additions
Additions through business
combination
Disposals
Reclassifications
Foreign currency exchange
difference
At December 31, 2011
(Forward)
19,050
18,796
187
319
–
811
39,163
(445)
(17,395)
(689)
(270)
(10)
–
(18,809)
7
89
–
–
–
(96)
–
(1,664)
(2,037)
(103)
(25)
–
(126)
(3,955)
70,940
128,579
14,338
1,284
2,943
1,814
219,898
29
Buildings
and
Improvements
Machinery
and
Facilities
Equipment
Furniture,
Fixtures and
Office
Equipment
Transportation
$31,519
$69,966
$9,110
$238
Depreciation and amortization
2,985
18,463
2,308
Disposals
At December 31, 2011
Accumulated impairment loss
Net book value as of
December 31, 2011
(235)
34,269
737
(15,107)
73,322
753
$35,934
$54,504
In thousands
Tools and
Instruments
Construction
in Progress
Total
$1,710
$–
$112,543
439
420
–
24,615
(671)
10,747
12
(247)
430
–
(8)
2,122
–
–
–
–
(16,268)
120,890
1,502
$3,579
$854
$821
$1,814
$97,506
Accumulated depreciation
and amortization
At January 1, 2011
Depreciation and amortization expense included in cost of goods sold and services for the six
months ended June 30, 2012 and 2011 amounted to $9.19 million and $9.16 million,
respectively. Depreciation and amortization expense included in operating expenses for the
six months ended June 30, 2012 and 2011 amounted to $2.91 million and $1.34 million,
respectively.
8. Intangible Assets
During the three months ended June 30, 2012 and 2011, the Parent Company acquired
additional computer software amounting to $0.31 million and $0.15 million, respectively.
Amortization of intangible assets for the six months ended June 30, 2012 and 2011 amounted
to $1.1 million and $0.22 million, respectively.
9. Accounts Payable and Accrued Expenses
Trade payables
Accrued expenses
Accrued payroll
Nontrade payables
Dividends payable
Accrued interest payable
Employee-related payables
Taxes payable
Customers’ deposits
Obligation under finance lease - current
Deferred revenue - current
Due to related parties (Note 15)
Others
June 30,
December 31,
2011
2012
(Unaudited)
(Audited)
(In thousands)
$105,516
$99,199
26,507
26,757
4,798
4,538
4,401
4,701
1,453
2,538
986
676
647
679
544
486
460
1,234
442
802
261
261
47
37
2,285
2,085
$148,347
$143,993
30
Accounts payable and accrued expenses are non interest-bearing and are normally settled on
15 to 60-day terms.
Accrued expenses consist mainly of accruals for light and water, taxes, repairs and
maintenance, professional fees, transportation and travel, subcontractual costs, security,
insurance and representation.
10. Provisions
In 2011, IMI Singapore announced restructuring of operations and recognized provision for
restructuring of $0.25 million as of December 31, 2011. In 2012, IMI Singapore recognized
additional provision of $0.74 million and paid out $0.63 million during the first half of 2012.
PSi also recorded provision of $0.92 million and paid $0.17 million during the first half of 2012.
The balance of the provision for restructuring as of June 30, 2012 will be paid in phases within
the second half of the year.
At January 1
Provisions
Payment
At June 30
June 30, December 31,
2012
2011
(Unaudited)
(Audited)
(In thousands)
$249
$–
1,662
832
(797)
(583)
$1,114
$249
11. Trust Receipts and Loans Payable
Parent Company
EPIQ EA
PSi
STEL
June 30, December 31,
2011
2012
(Unaudited)
(Audited)
(In thousands)
$15,000
$16,460
10,090
11,066
9,201
10,168
1,344
1,315
$35,635
$39,009
Parent Company
During the first half of 2012, the 92-day term loan amounting to EUR5.00 million with a fixed
rate of 2.09% was settled and the Parent Company obtained a five-year loan from another
bank (see Note 12). In addition, the Parent Company obtained a 90-day loan amounting to
$3.00 million in subject to fixed interest rate of 1.27% and a 60-day loan amounting to $2.00
million subject to fixed interest rate of 1.30% during the first quarter of 2012.
31
As of December 31, 2011, the Parent Company has two (2) 90-day term loans amounting to
$5.00 million each, and subject to fixed interest rate of 1.10% and a 92-day term loan
amounting to 5.00 million euro with a fixed interest rate of 2.09%.
EPIQ EA
UniCredit Bulbank
BNP Paribas
June 30, December 31,
2011
2012
(Audited)
(Unaudited)
(In thousands)
$8,793
$10,352
1,297
714
$10,090
$11,066
The loans from UniCredit Bulbank and BNP Paribas are from existing revolving credit facilities
with terms of one year and six months, respectively. The loans bear interest based on 1month EURIBOR plus 3.00% and 3-month EURIBOR plus 2.50%, respectively.
The credit facility with UniCredit Bulbank is subject to the following collaterals:
• First ranking pledge on materials, ready made and unfinished production at balance sheet
value, minimum of €10,000;
• first ranking pledge on receivables from a certain customer; and
• notary signed Strong Letter of Patronage from the Parent Company.
The Parent Company also provided a Soft Letter of Comfort to the creditor.
The credit facility with BNP Paribas is subject to the following collaterals:
• First rank pledge on receivables from selected customers of EPIQ EA, subject to prefinancing in the amount of 125% of the utilized portion of the facility but not more than
€2,125,000; and
• first rank pledge on goods of EPIQ EA in the amount of 125% of the utilized portion of the
facility but not more than €2,125,000.
PSI
PSi has short-term loans from the following banks:
Metropolitan Bank & Trust Co. (MBTC)
PVB
June 30, December 31,
2011
2012
(Audited)
(Unaudited)
(In thousands)
$9,201
$9,248
–
920
$9,201
$10,168
32
MBTC
PSi has an unsecured Omnibus Line Credit Facility of $10.00 million granted on November
24, 2010, which includes 30 to 360 days Promissory Notes (maybe denominated in USD or
Philippine peso [PHP]), Letter of Credit/Trust Receipt (LC/TR) Line, Export Packing Credit
Line, FX Forward Cover, and Foreign Bills Line and Domestic Bill Purchase Line, subject to
interest rates ranging from 2.75 % to 2.85% in 2012 and 2.27% to 2.85% in 2011.
As of June 30, 2012 and December 31, 2011, the outstanding trust receipts payable
amounted to $0.5 million and $1.75 million. The facility will expire on October 30, 2012.
PVB
In 2010, PSi had a Revolving Promissory Note Line (RPNL) of $3.00 million, including the
availability of Letters of Credit (LC)/Trust Receipts (TR) up to $1.50 million. This short-term
credit facility, which expired in April 2011, is secured by trade receivables from certain
customers and MTI on machinery and equipment. This was renewed on April 20, 2011,
through an Omnibus Line Facility of $5.00 million, which includes unsecured RPNL of $3.00
million, which may be available for LC, and 5-year term loan of $2.00 million secured by the
MTI on machineries and equipment. PSi has not yet availed of the 5-year term loan as of
June 30, 2012 and December 31, 2011, hence the MPC of PVB is temporarily not effective.
The interest rates in 2011 ranged from 2.36% to 2.71%, respectively. There are no
outstanding liabilities under this credit line as of June 30, 2012.
STEL
The loans of STEL are clean loans from various Singapore banks from existing revolving
credit facilities and bear interest rates ranging from 3.40% to 3.50% and 3.35% to 3.45% as of
June 30, 2012 and December 31, 2012, respectively, and have maturities of 30 to 240 days
from the date of issue with renewal options.
12. Long-Term Debt
Parent Company
Cooperatief
June 30, December 31,
2012
2011
(Unaudited)
(Audited)
(In thousands)
$46,732
$40,000
17,893
20,398
$64,625
$60,398
In October 2011, the Parent Company obtained a five-year clean loan from a Philippine bank
amounting to $40.0 million payable in a single balloon payment at the end of the loan term.
The Parent Company may, at its option, prepay the loan in part or in full, together with the
accrued interest without penalty. Interest on the loan is payable quarterly and re-priced
quarterly at the rate of 3-month LIBOR plus margin of 0.80%.
On February 29, 2012, the Parent Company applied with a local bank a 5-year loan in the
amount of EUR5.00 million payable at the end of the loan term. The Parent Company may, at
its option, prepay the loan in part or in full, together with accrued interest thereon without
penalty, if made on an interest payment date, subject to certain conditions. Interest is payable
semi-annually at the rate of 6-month LIBOR plus 1.50% spread per annum.
33
Cooperatief’s long-term debt relates to the acquisition of EPIQ shares and receivables of
EPIQ NV from the EPIQ subsidiaries. This is subject to interest rate of 1.599% plus 1.5%.
Below is the amortization schedule:
Due dates
2013
2014
2015
2016
2017
2018
Total
Amount in USD
Amounts in Euro
(in thousands)
€2,000
$2,511
2,000
2,511
2,000
2,511
2,000
2,511
2,000
2,511
4,249
5,338
€14,249
$17,893
13. Earnings (Loss) per Share
The following table presents information necessary to calculate earnings (loss) per share on
net income attributable to equity holders of the Parent Company.
Net income
Less dividends on preferred stock
Weighted average number of common
shares Outstanding
Basic and Diluted
June 30,
June 30,
2012
2011
(Unaudited)
(Unaudited)
(In thousands)
$3,108
$1,138
(1,246)
(1,232)
$1,862
($94)
1,634,078
$0.0011
1,428,090
($0.0001)
As of June 30, 2012 and December 31, 2011, the Parent Company has no dilutive potential
common shares.
14. Segment Information
Management monitors operating results per geographical area (with the Philippine operations
further subdivided into the Parent Company and PSi) for the purpose of making decisions
about resource allocation and performance assessment. It evaluates the segment
performance based on gross revenue, gross profit, operating income, interest income and net
income before and after tax.
No operating segments have been aggregated to form a reportable segment.
Intersegment revenue is generally recorded at values that approximate third-party selling
prices.
34
The following tables present revenue and profit information regarding the Group’s
geographical segments for the six months ended June 30, 2012 and 2011 (in thousands):
2012
Philippines
Parent
Company
Revenue
Third party
Inter-segment
Total revenue
Segment gross profit (loss)
Segment operating income
(loss)
Segment interest income
Segment interest expense
Segment profit (loss) before
income tax
Segment provision for
income tax
Segment profit (loss)
Segment profit (loss)
attributable to equity
holders of the Parent
$79,456
53
$79,509
$7,451
PSi
Singapore/
China
Europe/
Mexico
USA
$25,014
–
$25,014
($1,596)
$134,898
1,826
$136,724
$13,251
$85,697
–
$85,697
$8,227
$203
1,469
$1,672
$1,243
Consolidation
and
Japan Eliminations
$383
448
$831
$533
$–
(3,796)
($3,796)
($3,710)
Total
$325,651
–
$325,651
$25,399
$1,417
$203
($591)
($5,630)
$2
($187)
$3,840
$49
($36)
$3,303
$1
($915)
$176
$–
($1)
$107
$–
($1)
$1,222
($6,116)
$4,113
$2,603
$175
$101
$–
$2,098
(388)
$834
–
($6,116)
(1,045)
$3,068
(254)
$2,349
–
$175
–
$101
–
$–
(1,687)
$411
$834
($3,411)
$3,064
$2,345
$175
$101
$–
$3,108
$–
$–
($–)
$3,213
$255
($1,731)
2011
Revenue
Third party
Inter-segment
Total revenue
Segment gross profit
Segment operating income (loss)
Philippines
Parent
Company
PSi
$76,935
–
$76,935
Consolidation and
Japan
Eliminations
Singapore
USA
$41,616
–
$41,616
$143,315
2,233
$145,548
$130
1,356
$1,486
$475
416
$891
$–
(4,005)
($4,005)
$262,471
–
$262,471
$6,915
$3,155
$12,855
$1,121
$485
($4,005)
$20,526
($2,813)
($693)
$3,859
$23
$85
$–
$1
$33
$–
$–
$–
$134
Total
$461
Segment interest income
$100
Segment interest expense
($242)
($210)
($90)
($1)
($1)
$–
($544)
Segment profit (loss) before income tax
Segment provision for income tax
Segment profit (loss)
($1,498)
(190)
($1,688)
($1,017)
(113)
($1,130)
$5,096
(1,756)
$3,340
$22
–
$22
$92
–
$92
$–
–
$–
$2,695
(2,059)
$636
Segment profit (loss) attributable to
equity holders of the Parent
($1,688)
($630)
$3,342
$22
$92
$–
$1,138
For the six months ended June 30, 2012, the operating income (loss) and profit (loss) before
and after tax for each operating segment includes net profit from inter-segment revenues
aggregating to $3.8 million and inter-segment cost of sales and operating expenses
aggregating to $0.09 million and $3.71 million, respectively.
For the six months ended June 30, 2011, the operating income (loss) and profit (loss) before
and after tax for each operating segment includes net profit from inter-segment revenues
aggregating to $4.00 million and inter-segment cost of sales and operating expenses
aggregating to $2.2 million and $1.80 million, respectively.
35
The following table presents segment assets of the Group’s geographical segments as of
June 30, 2012 and December 31, 2011 (in thousands):
Philippines
Parent
Company
PSi
$250,764
$25,246
$245,451
$28,860
Singapore/
China
Europe/
Mexico
$214,414
$118,455
$3,039
$929
$113,565
$2,822
$889
USA
Japan
Eliminations
Total
Segment assets
June 30, 2012 (Unaudited)
($161,153)
$451,694
Segment assets
December 31, 2011 (Audited)
$207,482
($154,376)
$444,693
Segment assets as of June 30, 2012 do not include investments in subsidiaries amounting to
$129.63 million and inter-segment loans and receivables amounting to $39.0 million which are
eliminated on consolidation.
Segment assets as of December 31, 2011 do not include investments in subsidiaries
amounting to $129.53 million and inter-segment loans and receivables amounting to $32.21
million which are eliminated on consolidation.
Goodwill arising from the acquisition of PSi and EPIQ CZ amounting to $7.48 million (net of
impairment loss of $2.72 million) and $0.65 million are recognized at consolidated level as of
June 30, 2012 and December 31, 2011.
The following table presents revenues from external customers and noncurrent assets
(in thousands):
Europe
USA
Philippines
Asia
Australia
Japan
Revenues from
External Customers
June 30,
June 30,
2011
2012
(Unaudited)
(Unaudited)
$159,374
$126,601
94,276
60,533
32,554
37,153
33,439
30,832
5,372
–
3,243
4,745
$262,471
$325,651
Noncurrent Assets
June 30, December31,
2012
2011
(Unaudited)
(Audited)
$40,288
$40,892
1,206
1,200
44,437
45,367
66,875
71,657
–
–
18
78
$152,824
$159,194
Revenues are attributed to countries on the basis of the customer’s location. For the six
months ended June 30, 2012, one customer from Europe segment accounts for $33.7 million
or 10% of the Group’s total revenues.
Noncurrent assets, which include property, plant and equipment, goodwill, and intangible
assets, are disclosed according to their physical location.
36
The following table presents revenues per product type (in thousands):
June 30, 2011
(Unaudited)
$26,822
54,959
49,262
55,746
46,196
16,198
12,142
1,146
$262,471
June 30, 2012
(Unaudited)
$97,793
59,947
52,795
51,071
29,642
16,912
11,613
5,878
$325,651
Automotive
Telecom
Industrial
Consumer
Multiple Market
Computer Peripherals
Medical
Others
Total
15. Related Party Transactions
Parties are considered to be related if one party has the ability, directly or indirectly, to control
the other party or exercise significant influence over the other party in making financial and
operating decisions. Parties are also considered to be related if they are subject to common
control or common significant influence. Related parties may be individuals or corporate
entities.
In the ordinary course of business, the Group transacts with its related parties. The
transactions and balances of accounts with related parties follow (in thousands):
Related Party
Bank of the Philippine
Islands (BPI)
Relationship Nature of Transaction
Affiliate
AG Counselors
Corporation (AGCC) Affiliate
Technopark Land, Inc.
(TLI)
Affiliate
Innove
Communications,
Inc. (ICI)
Affiliate
Balance Sheets
June 30, December
2012
31, 2011
(Unaudited)
(Audited)
Statements of Comprehensive
Income
June 30, 2012
(Unaudited)
June 30, 2011
(Unaudited)
1,031
163
28
0
–
–
$3,754
202
33
1
–
–
–
–
–
–
–
19
$–
–
49
–
158
5
–
–
34
38
Nontrade receivable
10
9
–
–
Nontrade Payable
Postal and communication
Building rental
15
–
–
0
–
–
–
56
23
106
92
14
4
3
–
–
Cash and cash equivalents
Nontrade receivable
Nontrade payable
Derivative asset
Gains on derivatives
Interest income
Professional fees
Globe Telecom, Inc.
(GTI)
Affiliate
Nontrade payable
37
Related Party
Ayala Land, Inc.
Relationship Nature of Transaction
Postal and communication
Nontrade receivable
Affiliate
Nontrade Receivable
Balance Sheets
–
–
–
–
–
–
Statements of Comprehensive
Income
32
45
–
–
–
3
a. As of June 30, 2012, the Parent Company has savings and current accounts and shortterm deposits with BPI amounting to $1.03 million and $nil, respectively. As of December
31, 2011, the Parent Company has savings and current accounts and short-term deposits
with BPI amounting to $0.41 million and $3.34 million, respectively. Total interest income
earned from investments with BPI amounted to $0.02 million and $0.005 million for the
three months ended June 30, 2012 and 2011, respectively.
b. As of June 30, 2012 and December 31, 2011, nontrade receivables from BPI pertain to
retirement and separation pay advanced by the Parent Company but is reimbursable from
the trust fund with BPI.
c. The Parent Company has outstanding housing and automobile financing loans from BPI
amounting to $0.03 million as of June 30, 2012 and December 31, 2011, included in
“Employee-related payables” under “Accounts payable and accrued expenses”. The
outstanding housing and automobile financing loans arise from the differences in the
timing of remittances by the Parent Company to BPI and the period of withholding from
employee salaries and wages.
d. The Parent Company has outstanding short-term foreign currency forwards with BPI
amounting to $0.001 million as of December 31, 2011, respectively.
e.
As of June 30, 2012 and December 31, 2011, certain plan assets of the Parent Company
under its retirement fund with BPI are invested with its related parties.
f.
The Parent Company engages AGCC, an affiliate, for corporate secretarial services
subject to a monthly fee of P
= 40,000.
g.
The Parent Company has nontrade receivable from TLI, an affiliate, amounting to $0.01
miilion and $0.009 million as of June 30, 2012 and December 31, 2011, respectively,
which pertains to advances by the Parent Company for various expenses incurred by TLI,
primarily on real property taxes and corporate secretarial services.
h.
As of June 30, 2012 and December 31, 2011, the Parent Company’s accounts payable to
GTI, an affiliate, amounted to $0.004 million and $0.003 million for the purchase of
Blackberry software and billings for cellphone charges and WiFi connections. These are
due and demandable. Related expense for the six months ended June 30, 2012 and 2011
amounted to $0.03 million and $0.05 million, respectively.
38
16. Financial Risk Management Objectives and Policies
The Group’s principal financial instruments, composed of trust receipts and loans payable,
long-term debt and other financial liabilities, were issued primarily to raise financing for the
Group’s operations. The Group has various financial instruments such as cash and cash
equivalents, loans and receivables and accounts payable and accrued expenses which arise
directly from its operations.
The main purpose of the Group’s financial instruments is to fund its operational and capital
expenditures. The main risks arising from the Group’s financial instruments are interest rate
risk, liquidity risk, credit risk and foreign currency risk. The Group also enters into currency
forwards to manage the currency risk arising from its operations and financial instruments.
The Group’s risk management policies are summarized below:
Interest rate risk
The Group’s exposure to market risk for changes in interest rates relates primarily to its longterm debt obligations with floating interest rates. The Group’s policy is to manage its interest
cost using a mix of fixed and variable rate debt.
The following table demonstrates the sensitivity to a reasonably possible change in interest
rates, with all other variables held constant, of the Group’s income before income tax (through
the impact on floating rate borrowings) as of June 30, 2012 and December 31, 2011. There is
no other impact on the Group’s equity other than those already affecting income (in
thousands):
Increase/decrease in basis points
+100
-100
Effect on profit before tax
2011
2012
($467)
($400)
467
400
Liquidity risk
Liquidity or funding risk is the risk that an entity will encounter difficulty in raising funds to meet
commitments associated with financial instruments. The Group’s exposure to liquidity risk
relates primarily to its short and long-term obligations. The Group seeks to manage its
liquidity profile to be able to finance its capital expenditures and operations. The Group
maintains a level of cash and cash equivalents deemed sufficient to finance operations. As
part of its liquidity risk management, the Group regularly evaluates its projected and actual
cash flows. To cover financing requirements, the Group intends to use internally-generated
funds and loan facilities with local and foreign banks. Surplus funds are placed with reputable
banks.
Credit risk
Credit risk is the risk that the Group’s counterparties to its financial assets will fail to discharge
their contractual obligations. The Group’s major credit risk exposure relates primarily to its
holdings of cash and cash equivalents and short-term investments and receivables from
customers and other third parties. Credit risk management involves dealing with institutions
for which credit limits have been established. The treasury policy sets credit limits for each
counterparty. The Group trades only with recognized, creditworthy third parties. The Group
39
has a well-defined credit policy and established credit procedures. The Group extends credit
to its customers consistent with sound credit practices and industry standards. The Group
deals only with reputable, competent and reliable customers who pass the Group’s credit
standards. The credit evaluation reflects the customer’s overall credit strength based on key
financial and credit characteristics such as financial stability, operations, focus market and
trade references. All customers who wish to trade on credit terms are subject to credit
verification procedures. In addition, receivable balances are monitored on an ongoing basis
with the result that the Group’s exposure to bad debts is not significant.
The Group’s maximum exposure to credit risk for the components of the consolidated balance
sheets as at June 30, 2012 and December 31, 2011 are the carrying amounts except for cash
and cash equivalents. The Group's maximum exposure for cash and cash equivalents
excludes the carrying amount of cash on hand.
The Group has 28% and 36% of trade receivables relating to three (3) major customers as of
June 30, 2012 and December 31, 2011, respectively.
As of June 30, 2012 and December 31, 2011, the aging analysis of trade receivables follows:
June 30, 2012
(Unaudited)
December 31, 2011
(Audited)
Total
Neither
past due
nor
impaired
Past due but not impaired
<30 days 30-60 days 60-90 days 90-120 days
$149,196
$129,641
$12,333
$2,318
$1,118
$929
$699
$2,158
$127,744
$105,979
$11,233
$3,841
$1,213
$624
$2,737
$2,117
>120 days
Specifically
Impaired
Foreign currency risk
The Group’s foreign exchange risk results primarily from movements of the U.S. Dollar against
other currencies. As a result of significant operating expenses in Philippine Peso, the Group’s
consolidated statements of comprehensive income can be affected significantly by
movements in the U.S. Dollar versus the Philippine Peso. In 2012 and 2011, the Group
entered into currency forward contracts and structured currency options, respectively, to
hedge its risks associated with foreign currency fluctuations.
The Group also has transactional currency exposures. Such exposure arises from sales or
purchases denominated in other than the Group’s functional currency.
The Group manages its foreign exchange exposure risk by matching, as far as possible,
receipts and payments in each individual currency. Foreign currency is converted into the
relevant domestic currency as and when the management deems necessary. The unhedged
exposure is reviewed and monitored closely on an ongoing basis and management will
consider to hedge any material exposure where appropriate.
40
Information on the Group’s foreign currency-denominated monetary assets and liabilities and
their U.S. Dollar equivalent follows:
Philippine Peso (P
=)
June 30, 2012
(Unaudited)
Cash and cash equivalents
Loans and receivables
Miscellaneous deposits
Accounts payable and accrued
expenses
Other current liabilities
Other noncurrent liabilities
Net foreign currency-denominated
liabilities
In U.S.
Dollar
$1,326
1,108
1,190
In
Philippine
Peso
P
= 55,864
46,654
50,120
December 31, 2011
(Audited)
In U.S. In Philippine
Dollar
Peso
$3,156
P
= 138,586
682
29,971
1,136
49,899
(21,365)
(2,449)
(257)
(899,964)
(103,163)
(10,817)
(18,685)
(345)
(2,227)
(820,602)
(15,190)
(97,807)
($20,447)
(P
= 861,306)
($16,283)
(P
= 715,143)
Singapore Dollar (SGD)
June 30, 2012
(Unaudited)
Cash and cash equivalents
Accounts payable and accrued
expenses
Other current liabilities
Loans payable
Net foreign currency-denominated
liabilities
In U.S. Dollar
$329
December 31, 2011
(Audited)
In
Singapore
Dollar
SGD418
In U.S. In Singapore
Dollar
Dollar
SGD1,534
$1,182
(1,091)
(999)
(1,344)
(1,387)
(1,270)
(1,709)
(1,063)
(977)
(1,258)
(1,380)
(1,268)
(1,632)
($3,105)
(SGD3,948)
($2,116)
(SGD2,746)
Euro (€)
June 30, 2012
(Unaudited)
Cash and cash equivalents
Loans and receivables
Accounts payable and accrued
expenses
Other current liabilities
Other liabilities
Loans payable
Long-term debt
Net foreign currency-denominated
liabilities
December 31, 2011
(Audited)
In U.S. Dollar
$3,742
25,153
In Euro
€2,980
20,030
In U.S.
Dollar
$4,571
22,226
In Euro
€3,533
17,176
(12,257)
(6,094)
(711)
(10,090)
(24,625)
(9,761)
(4,852)
(566)
(8,034)
(19,249)
(13,819)
(32,332)
(243)
(17,526)
(20,398)
(10,679)
(24,986)
(188)
(13,544)
(14,249)
($24,882)
(€19,453)
($57,521)
(€42,937)
41
Japanese Yen (¥)
Cash and cash equivalents
Loans and receivables
Miscellaneous deposits
Accounts payable and accrued
expenses
Other current liabilities
Net foreign currency-denominated
liabilities
June 30, 2012
(Unaudited)
In Japanese
In U.S. Dollar
Yen
$791
¥62,955
1,528
121,616
48
3,827
December 31, 2011
(Audited)
In U.S. In Japanese
Dollar
Yen
$318
¥24,801
1,771
137,928
30
2,392
(5,556)
(40)
(442,372)
(3,154)
(6,104)
(40)
(475,424)
(3,189)
($3,230)
(¥257,127)
($4,025)
(¥313,492)
Renminbi (RMB)
June 30, 2012
(Unaudited)
Cash and cash equivalents
Loans and receivables
Accounts payable and accrued
expenses
Other current liabilities
Net foreign currency-denominated
assets
In U.S. Dollar
$7,611
47,547
(34,526)
$20,632
In Renminbi
RMB48,136
300,723
(218,366)
RMB130,493
December 31, 2011
(Audited)
In U.S.
Dollar In Renminbi
$6,725 RMB42,513
43,024
271,961
(29,529)
(5)
(186,654)
(37)
$20,215 RMB127,783
Hong Kong Dollar (HKD)
Cash and cash equivalents
Loans and receivables
Accounts payable and accrued
expenses
Net foreign currency-denominated
assets
June 30, 2012
(Unaudited)
In Hong Kong
Dollar
In U.S. Dollar
$56
HKD435
758
5,881
(572)
$243
December 31, 2011
(Audited)
In U.S. In Hong Kong
Dollar
Dollar
$43
HKD335
517
4,020
(4,435)
(417)
HKD1,881
$143
(3,243)
HKD1,112
Thai Baht (THB)
Loans and receivables - net
Net foreign currency-denominated
assets
June 30, 2012
(Unaudited)
In U.S.
Dollar
In Thai Baht
$1
THB34
$1
THB34
December 31, 2011
(Audited)
In U.S.
Dollar
In Thai Baht
$1
THB25
$1
THB25
42
Bulgarian Lev (BGN)
Cash and cash equivalents
Loans and receivables
Accounts payable and accrued expenses
Net foreign currency-denominated
liabilities
June 30, 2012
(Unaudited)
In U.S. In Bulgarian
Lev
Dollar
$234
BGN364
2,571
4,003
(3,449)
(5,370)
($645) (BGN1,004)
December 31, 2011
(Audited)
In U.S. In Bulgarian
Dollar
Lev
$68
BGN99
1,523
2,233
(1,620)
(2,375)
($29)
(BGN43)
Czech Koruna (CZK)
Cash and cash equivalents
Loans and receivables
Accounts payable and accrued expenses
Other current liabilities
Net foreign currency-denominated
liabilities
June 30, 2012
(Unaudited)
In U.S.
In Czech
Dollar
Koruna
$3
CZK59
123
2,515
(860)
(17,525)
(257)
(5,233)
December 31, 2011
(Audited)
In U.S.
In Czech
Dollar
Koruna
$3
CZK61
55
1,063
(1,061)
(20,420)
(217)
(4,172)
($990) (CZK20,183)
($1,220) (CZK23,468)
June 30, 2012
(Unaudited)
In U.S. In Mexican
Dollar
Peso
$392 MXN5,284
18
249
-
December 31, 2011
(Audited)
In U.S. In Mexican
Dollar
Peso
$162
MXN2,266
(1,651)
(23,136)
Mexican Peso (MXN)
Cash and cash equivalents
Loans and receivables
Accounts payable and accrued expenses
Net foreign currency-denominated
liabilities
($411) (MXN5,533)
($1,489) (MXN20,870)
Sensitivity analysis
The following table demonstrates sensitivity to a reasonably possible change in the U.S.
Dollar exchange rate, with all other variables held constant, of the Group’s income before
income tax (due to changes in the fair value of monetary assets and liabilities) as of June 30,
2012 and December 31, 2011. The reasonably possible change was computed based on one
year average historical movement of exchange rates between U.S Dollar and other
currencies.
There is no other impact on the Group’s equity other than those already affecting income.
The increase in U.S. Dollar rate as against other currencies demonstrates weaker functional
currency while the decrease represents stronger U.S. Dollar value.
43
June 30, 2012 (Unaudited)
Currency
PHP
SGD
EUR
JPY
RMB
HKD
THB
BGN
CZK
MXN
Increase/decrease
in U.S. Dollar rate
+1%
-1%
+1%
-1%
+2%
-2%
+1%
-1%
+1%
-1%
+1%
-1%
+1%
-1%
+1%
-1%
+1%
-1%
+2%
-2%
Effect on
profit before tax
(in thousands)
(135)
135
(21)
21
1,261
(1,261)
(33)
33
239
(239)
2
(2)
(11)
11
(12)
12
(28)
28
(6)
6
December 31, 2011 (Audited)
Currency
PHP
SGD
EUR
JPY
RMB
HKD
GBP
BGN
CZK
MXN
Increase/decrease
in U.S. Dollar rate
1%
-1%
1%
-1%
1%
-1%
1%
-1%
1%
-1%
1%
-1%
1%
-1%
1%
-1%
2%
-2%
3%
-3%
Effect on profit
before tax
(189)
189
(21)
21
(1,462)
1,462
(21)
21
166
(166)
1
(1)
(2)
2
(1)
1
(24)
24
(42)
42
44
Derivatives
The net changes in fair value of currency forwards and options amounting to $0.21 million and
$0.98 million for six months period ended June 30, 2012 and 2011, respectively, are
recognized in the consolidated statements of comprehensive income under “Foreign
exchange gains (losses).
Capital management
The primary objective of the Group’s capital management is to ensure that it maintains a
strong credit rating and healthy capital ratios in order to support its business and maximize
shareholder value.
No changes were made in the objectives, policies and processes during the period ended
June 30, 2012 and December 31, 2011.
The Group is not subject to externally imposed capital requirements.
The Group monitors capital using a gearing ratio of debt to equity and net debt to equity. The
Group considers bank borrowings in the determination of debt, which consist of trust receipts
and loans payable and long-term debt. Net debt is equivalent to the total bank borrowings
less cash and cash equivalents.
Trust receipts and loans payable
Long-term debt
Total debt
Less cash and cash equivalents
Net debt
Equity attributable to equity holders of the
Parent Company
Debt to equity ratio
Net debt to equity ratio
June 30, 2012
(Unaudited)
$35,635
46,732
82,367
(43,928)
$38,439
$195,585
42%
20%
December 31,
2011
(Audited)
$39,009
40,000
79,009
(54,069)
$24,940
$190,322
42%
13%
45
Item 2. Management's Discussion and Analysis of Financial Condition and Results of
Operations.
MANAGEMENT’S DISCUSSION AND ANALYSIS OF FINANCIAL CONDITION AND RESULTS
OF OPERATIONS
Results of Operations
Financial Highlights
For the quarters ended
30 June
2012
2011
(in US$ thousands,
except Basic EPS)
Revenues from Sales and Services
325,651
262,471
Cost of Goods Sold and Services
300,252
241,945
25,399
20,526
Gross Profit
Net Income Attributable to Equity holders
3,108
1,138
EBITDAi
16,244
13,232
Basic Earnings per Share (EPS)
0.0011
(0.0001)
Revenues from Sales and Services
The Company generated consolidated revenues of US$325.7 million, a 24% growth year over
year for the six months ended June 30, 2012. The company’s operations in China and Singapore
contributed US$134.9 million in combined revenues, or a drop of 6% year-on-year due primarily to
reduced volume in a telecommunication infrastructure program and delay in the production of new
models for an industrial electronics program. IMI’s Philippine operations recorded US$79.5
million revenues, a 3 percent year-on-year growth because of strong programs in the computing
and consumer segments. IMI’s subsidiaries in Europe and Mexico contributed US$85.7 million
revenues in the first half of 2012, while PSi Technologies recorded US$25.0 million in revenues.
On the overall, the automotive segment continues to dominate the Company’s market comprising
30% of consolidated revenues for the first half of 2012. The Company also has robust sales
pipeline for the telecommunications, consumer and industrial segments. Europe remains to be
the biggest market of the company’s products, comprising 49% of global sales, followed by North
America.
i
EBITDA = EBITDA represents net operating income after adding depreciation and amortization, cost of share-based payments
and foreign exchange gains/losses. EBITDA and EBITDA Margin are not measures of performance under PFRS and investors
should not consider EBITDA, EBITDA Margin or EBIT in isolation or as alternatives to net income as an indicator of our
operating performance or to cash flows, or any other measure of performance under PFRS. Because there are various EBITDA
calculation methods, our presentation of these measures may not be comparable to similarly titled measures used by other
companies.
46
Cost of Goods Sold and Services
Cost of Goods Sold and Services remains at par at 92% for the six months period ended June 30,
2012, same as last year’s. Direct material cost ratio is slightly higher this year at 63% of revenues
as against last year’s 61% due to increase in turnkey businesses while direct labor and variable
overhead cost ratios are lower compared to last year.
Gross Profit and Gross Profit Margin
The Company’s operations generated gross profit of US$25.4 million, an increase of 24% yearon-year, same percentage increase with the revenue levels. GP margin is at par at 8%.
Operating Expenses
The Company’s operating expenses went up by $2.1 million or 11% with reference to the increase
in volumes, but as a percentage of revenues, the Company managed to reduce operating
expenses by 1% due to cost reduction initiatives and reversals of some excess accruals.
Net Income
The Company posted US$3.1 million in net income for the first half of 2012, or a 173% year-onyear growth due to the Company’s business expansion in Europe and Mexico, increased
business from the Philippine operations and reduced operating expenses.
EBITDA
EBITDA increase by 23%, from last year’s US$13.2 million to US$16.2 million, mainly from
increase in operating income by $2.8 million.
Liquidity and Capital Resources
The Company maintains financial stability with a cash balance of US$43.9 million as of June 30,
2012. Current ratio and debt-to-equity ratio remains healthy at 1:6:1 and 0.4:1, respectively. The
strong balance sheet shields the Company against volatilities in the operating environment and
positions the Company in a manner that would seize growth opportunities.
The Company’s strong financial position continues to ensure that its financial flexibility can sustain
its ongoing strategic initiatives and meet both operating requirements and debt payment
obligations. The Company ensures that its operations continue to generate adequate operating
cash flows to meet its liquidity requirements. Moreover, it has sufficient credit facilities to support
its working capital requirements and finance its growth agenda.
47
Key performance indicators of the Company
The table below sets forth the comparative performance indicators of the Company:
As of end
30 Jun 2012
31 Dec 2011
Performance indicators
Liquidity:
Current ratio
1.6x
1.5x
0.42x
0.42x
Solvency:
Debt-to-equity ratio
For the quarters ended
30 Jun
2012
2011
Operating efficiency:
Revenue growth
24%
39%
5%
5%
Profitability:
ii
EBITDA margin
In the above:
(i) There are no known trends, events or uncertainties that will result in the Company’s liquidity
increasing or decreasing in a material way.
(ii) There were no events that will trigger direct or contingent financial obligation that is material to
the Company, including any default or acceleration of an obligation.
(iii) Likewise, there were no material off-balance sheet transactions, arrangements, obligations
(including contingent obligations), and other relationships of the Company with unconsolidated
entities or other persons created during the reporting period.
(iv) There are no seasonal aspects that may have a material effect on the financial condition of
the Company.
ii
EBITDA Margin = EBITDA divided by revenues from sales and services where EBITDA represents net operating income after
adding depreciation and amortization, cost of share-based payments. EBITDA and EBITDA Margin are not measures of
performance under PFRS and investors should not consider EBITDA, EBITDA Margin or EBIT in isolation or as alternatives to
net income as an indicator of our operating performance or to cash flows, or any other measure of performance under PFRS.
Because there are various EBITDA calculation methods, our presentation of these measures may not be comparable to similarly
titled measures used by other companies.
48
Causes for any material changes
(Increase or decrease of 5% or more in the financial statements)
Income Statement items
(Quarter ended 30 June 2012 versus 30 June 2011)
24% growth in Revenues from Sales and Services ($262.5M to $325.7M)
Increase in revenues was mainly due to revenue contribution of Europe and Mexico entities
acquired in July 2011 amounting to US$85.7 million for the first half of 2012 and increase in
revenues of the Philippine operations by 3%.
24% increase in Cost of Goods Sold and Services ( $241.9M to $300.3M)
The increase in Cost of Goods Sold and Services was driven by increase in direct material cost
resulting from conversion to quasi-turnkey of some major customers in China and business
expansion in Europe and Mexico, majority of which are turnkey businesses.
11% increase in Operating Expenses ($20.1M to $22.2M)
The increase is with reference to higher revenues contributed by the newly acquired entities in
Europe and Mexico. Increase in operating expenses contributed by the Europe group amounted
to $4.9M, $1.3 million from China entities while the Philippine operations showed reduction of
$3.7 miilion due to reversals of prior year excess accruals and provisions and cost reduction
initiatives.
150% decrease in net finance and other income ($2.2M to -$1.1M)
The decrease is mainly attributable to mark-to-market gains on derivatives recognized in the first
half of 2011 amounting to US$0.6 million, increase in interest expense on short and long-term
debt by US$1.2 million (bulk of which pertains to interest expense on long term debt related to
acquisition of EPIQ entities) and decrease in foreign exchange gains by US$1.9 million.
173% increase in net income attributable to equity holders of the Parent Company ($1.1M to
$3.1M)
On account of higher revenues and reduced operating expenses resulting to higher operating
income by 597%.
437% increase in net loss attributable to Noncontrolling Interest (-$0.5M to -$2.7M)
Due to higher net loss of PSi Technologies, Inc, a 56% owned subsidiary of the Company, by
501% due to soft demand.
Balance Sheet items
(30 June 2012 versus 31 December 2011)
19% decrease in Cash and cash equivalents ($54.1M to $43.9M)
The decrease was mainly driven by increase in working capital and additional capital
expenditures from the newly acquired entities.
16% increase in Loans and Receivables ($133.7M to $154.7M)
Increase is attributable to 17% increase in trade receivables on account of 24% increase in
revenues.
49
5% increase in Inventories ($80.4M to $84.3M)
Increase in inventories levels of EPIQ (particularly in Mexico) and China (due to increasing
turnkey projects) by $5.1 million.
6% increase in Derivative assets ($2.8M to $3.0M)
Increase represents simple forward contracts.
18% decrease in Other Current Assets ($8.9M to $7.3M)
The increase was largely due decrease in tax credits of IMI Mexico.
6% decrease in Property, Plant and Equipment ($97.5M to $91.9M)
Mainly attributable to depreciation expense amounting to $12.1 million and disposals of assets
with net book value of $2.3 million. Capital expenditures for the six-month period ended June 30,
2012 amounted to $9.2 million.
11% decrease in Intangible Asset ($7.3K to $6.5M)
Pertains mainly to amortization expense for six months amounting to US$1.1 million.
11% increase in Available for Sale financial assets ($0.4M to $0.5M)
Represents investments in club shares.
34% decrease in Noncurrent Receivables ($0.2M to $0.1M)
Represents advances to customers for equipment purchased by the Company that are
reimbursable from the former.
22% decrease in Deferred tax assets ($0.7M to $0.6M)
Decrease in deferred tax asset from China entity.
12% increase in Other noncurrent asset ($1.5M to $1.7M)
Increase can be attributed to project development costs in relation to new projects which are
subsequently amortized.
9% decrease in Trust receipts and loans payable ($39.0M to $35.6M)
Arising mainly from decrease in short-term loans of IMI Philippines by US$1.5 million, decrease in
notes payable of Europe and China by $0.9 million and trust receipts and loans payable of PSi by
$1.0 million.
49% decrease in Income tax payable ($1.7M to $0.9M)
Mainly from payment of taxes of China subsidiaries
347% increase in Provisions ($0.2M to $1.1M)
Increase represents restructuring provisions for PSi and Singapore amounting to $0.9 million and
$0.7 million, respectively. Actual pay-outs for the first half of 2012 amounted to $0.8 million.
7% increase in Long-term debt ($60.4 to $64.6)
Increase mainly represents €5 million loan from a bank of IMI Philippines equivalent to US$6.7
million.
8% decrease in Deferred tax liabilities ($4.8M to $4.4M)
Due to amortization of deferred tax liabilities in China.
50
44% decrease in Obligation under finance lease ($0.6M to $0.3M)
Represents decrease in obligation under finance lease entered into by Europe entities related to
its machinery and production equipment.
34% increase in Cumulative translation adjustments ($6.0M to $4.0M)
Arising from translation of accounts of newly acquired entities in Europe and Mexico denominated
in their respective local currencies to the Parent Company’s functional currency. Movement is
attributable to appreciation of the subsidiaries local currencies against US$.
225% decrease in Minority interests in a consolidated subsidiary (-$1.2M to $-3.5M)
Due to share in net loss of PSi Technologies, Inc. of which IMI owns 56%.
51
PART II--OTHER INFORMATION
1. Integrated Micro-Electronics, Inc. reported $3.1 million net income for the first six months
of 2012, a year-on-year growth of 173%.
2. At the Regular Annual Stockholders’ meeting held on April 13, 2012 the stockholders
considered and approved the following:
• Election of the following Board of Directors for the ensuing year:
Jaime Augusto Zobel de Ayala
Fernando Zobel de Ayala
Delfin C. Gonzalez, Jr.
Delfin L. Lazaro
Arthur R. Tan
Diosdado P. Banatao (Independent Director)
Jose Ignacio A. Carlos
Alelie T. Funcell (Independent Director)
Hiroshi Nishimura (Independent Director)
John Eric T. Francia
Rafael Ma. C. Romualdez
• Appointment of Sycip, Gorres, Velayo & Co. as the external auditors of the Company
for the ensuing year.
3. In the Organizational meeting held immediately after the Regular Annual Stockholders’
meeting, the Board of Directors elected the following:
• Board Committees and Memberships:
Executive Committee
Delfin L. Lazaro – Chairman
Rafael Ma. C. Romualdez – Vice Chairman
Arthur R. Tan – Member
Audit Committee
Hiroshi Nishimura – Chairman
Rafael Ma. C. Romualdez – Member
Jaime P. Villegas – Member
Nomination Committee
Jaime Augusto Zobel de Ayala – Chairman
Jose Ignacio A. Carlos – Member
Alelie T. Funcell – Member
Compensation Committee
Fernando Zobel de Ayala – Chairman
Delfin L. Lazaro – Member
Rafael Ma. C. Romualdez – Member
52
Finance Committee
Delfin C. Gonzalez – Chairman
John Eric T. Francia – Member
Rafael Ma. C. Romualdez – Member
• Officers:
Jaime Augusto Zobel de Ayala
Arthur R. Tan
Jerome S. Tan
Sheila Marie U. Taniii
Christian Gerard P. Castilloiv
Linardo Z. Lopez
-
Shong Cheng Yeh
Gilles Bernard
Andrew C. Carreon
-
Jeremy Cowx
Michael R. Hansson
-
Lucrecio B. Mendoza
-
Mary Ann S. Natividad
-
Timothy P. Patterson
-
Melita R. Tomelden
-
Reynaldo N. Torda
-
Monina S. Lasala
Rafael Nestor V. Mantaring
Jaime G. Sanchez
Olaf Gresens
Joselito B. Bantatua
Fernandel I. Evangelista
Dominador P. Leonida III
-
Geronimo B. Magsombol
Jawaharlal K. Milanes
Anthony Raymond P. Rodriguez
Mario Bernardo N. Santos
-
Chairman of the Board
President & Chief Executive Officer
Chief Financial Officer
Corporate Secretary
Assistant Corporate Secretary
Senior Managing Director, Global Materials &
Supply Chain
Senior Managing Director – COO Asia
Managing Director, Europe Operations
Managing Director, Chief Information Officer and
COO of PSi Technologies, Inc.
Managing Director, Sales Director
Managing Director, Chief Technology Architect for
Test and Systems Development
Managing Director, Head of Test & Systems
Development and Value Engineering
Managing Director – Global Head of Key Accounts
Management
Managing Director – USA and Global Head of
Advanced Manufacturing Engineering
Managing Director, Global Head of Quality and
Reliability
Managing Director – Head of Operations of PSi
Technologies, Inc.
Vice President, Global Head of Human Resources
Vice President, Head of Design and Development
Vice President, Deputy CFO and Group Controller
Global Head of Sales and Marketing
AVP, General Manager - Jiaxing
AVP, Energy Solutions
AVP, Deputy Head of Test and Development
System
AVP, Plant Engineering Head
AVP, General Manager of Laguna 1
AVP, Head of Treasury and Credit
AVP, General Manager of Laguna 2
iii
Elected as Corporate Secretary, in place of Solomon M. Hermosura, at the Board meeting held on June 7, 2011.
Elected as Assistant Corporate Secretary, in place of Ma. Carlota Christina G. Laiño-Santiago, at the Board meeting
held on June 7, 2011.
iv
53
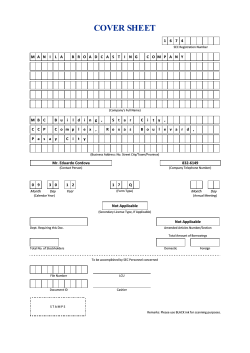


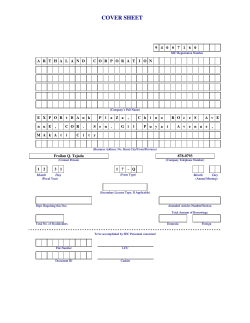

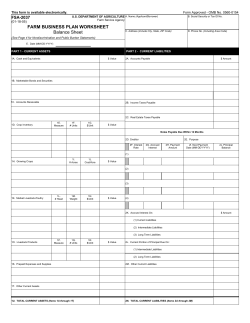
© Copyright 2026