
COVER SHEET
COVER SHEET A 1 9 9 6 1 1 5 9 3 S.E.C. Registration Number M A N I L A W A T E R C O M P A N Y I N C (Company’s Full Name) 4 8 9 K A T I Q U E Z O N P U N A N C I T Y R O A D M E T R O B A L A R A M A N I 1 1 0 5 L A (Business Address: No. Street City / Town / Province) Atty. JHOEL P. RAQUEDAN 981-8129 Contact Person 1 2 Company Telephone Number SEC Form 20-Definitive Information Sheet S T O C K 3 1 Month Day Fiscal Year FORM TYPE 0 4 Any Month Day Annual Meeting Secondary License Type, If Applicable A1996-11593 Dept. Requiring this Doc. Amended Articles Number/Section Total Amount of Borrowings Total No. of Stockholders Domestic Foreign ---------------------------------------------------------------------------------------------------------------------------------------------------------------------------- To be accomplished by SEC Personnel concerned File Number ____________________________________ LCU Document I.D. ____________________________________ Cashier STAMPS Remarks = pls. use black ink for scanning purposes PROXY The undersigned stockholder of MANILA WATER COMPANY, INC. (the “Company”) hereby appoints __________________________ or in his absence, the Chairman of the meeting, as attorney and proxy, with power of substitution, to present and vote all shares registered in his/her/its name as proxy of the undersigned stockholder, at the Annual Meeting of Stockholders of the Company on April 11, 2011 and at any of the adjournments thereof for the purpose of acting on the following matters: 1. Election of Directors Vote for all nominees listed below Fernando Zobel de Ayala Jaime Augusto Zobel de Ayala Gerardo C. Ablaza Jr. Antonino T. Aquino Delfin L. Lazaro John Eric T. Francia Keiichi Asai Simon Gardiner Ricardo Nicanor N. Jacinto Jose L. Cuisia Jr. (Independent) Oscar S. Reyes (Independent) 4. Ratification of all acts and resolutions of the Board of Directors, Executive Committee, Management Committees and officers. Yes No Abstain 5. Increase in the compensation of directors. Yes No Abstain 6. Election of Sycip Gorres Velayo & Co. as independent auditors. Yes No Abstain 7. vote for the nominees At their discretion, the proxies named above are authorized to vote upon such other matters as may properly come before the meeting. Yes No __________________ __________________ __________________ __________________ ____________________________________ PRINTED NAME OF STOCKHOLDER Withhold authority for all nominees listed above Withhold authority to listed below: _________________ _________________ _________________ _________________ 2. 3. Approval of minutes of previous meetings. Yes No Abstain Approval of annual report statements. Yes No Abstain and financial ____________________________________ SIGNATURE OF STOCKHOLDER/AUTHORIZED SIGNATORY ____________________________________ DATE THIS PROXY SHOULD BE RECEIVED BY THE CORPORATE SECRETARY ON OR BEFORE MARCH 31, 2011, THE DEADLINE FOR SUBMISSION OF PROXIES. THIS PROXY, WHEN PROPERLY EXECUTED, WILL BE VOTED IN THE MANNER AS DIRECTED HEREIN BY THE STOCKHOLDER(S). IF NO DIRECTION IS MADE, THIS PROXY WILL BE VOTED “FOR” THE ELECTION OF ALL NOMINEES AND FOR THE APPROVAL OF THE MATTERS STATED ABOVE AND FOR SUCH OTHER MATTERS AS MAY PROPERLY COME BEFORE THE MEETING IN THE MANNER DESCRIBED IN THE INFORMATION STATEMENT AND/OR AS RECOMMENDED BY MANAGEMENT OR THE BOARD OF DIRECTORS. A STOCKHOLDER GIVING A PROXY HAS THE POWER TO REVOKE IT AT ANY TIME BEFORE THE RIGHT GRANTED IS EXERCISED. A PROXY IS ALSO CONSIDERED REVOKED IF THE STOCKHOLDER ATTENDS THE MEETING IN PERSON AND EXPRESSED HIS INTENTION TO VOTE IN PERSON. SECURITIES AND EXCHANGE COMMISSION SEC FORM 20-IS Information Statement of Manila Water Company, Inc. (the “Company” or “Manila Water”) Pursuant to Section 20 of the Securities Regulation Code (the “Code” or “SRC”) 1. Check the appropriate box: [ ] Preliminary Information Statement [ x ] Definitive Information Statement 2. Name of registrant as specified in its charter: MANILA WATER COMPANY, INC. 3. Province, country or other jurisdiction of incorporation or organization: Republic of the Philippines 4. SEC Identification Number: A 1996-11593 5. BIR Tax Identification Code: 005-038-428 6. Address of principal office: MWSS Administration Building, 489 Katipunan Road Balara, Quezon City, Metro Manila, Philippines 1105 7. Registrant’s telephone number: (02) 9818129 8. Date, time and place of the meeting of security holders: Date: Time: Place: 9. April 11, 2011 9:00 A.M. Grand Ballroom, Hotel Intercontinental Manila, Makati City, Philippines Approximate date on which the Information Statement is first to be sent or given to security holders: March 18, 2011 1 10. Securities registered pursuant to Sections 8 and 12 of the Securities Regulation Code (SRC): a. Shares of Stock Common Shares, par value P1.00 each – 2,032,826,4761 b. Debt Securities Fixed Rate Bonds – P4,000,000,000.00 The Company has no other registered securities either in the form of shares, debt or otherwise. 11. Are any of registrant's securities listed in a stock exchange? Yes __x_____ No _______ 2,009,902,966 Common Shares, par value P1.00 per share, are listed in the Philippine Stock Exchange. 1 2,009,902,966 Outstanding Common Shares 22,923,510 Shares Under the Stock Ownership Plans 2,032,826,476 2 INFORMATION REQUIRED IN INFORMATION STATEMENT Date, time and place of meeting of security holders: Date : April 11, 2011 Time : 9:00 A.M. Place : Grand Ballroom, Hotel Intercontinental, Makati City Record Date The record date for the purpose of determining stockholders entitled to notice of, and to vote at, the meeting is February 16, 2011 (the “Record Date”). Mailing address of principal office of the registrant: MWSS Administration Building, 489 Katipunan Road, 1105 Balara, Quezon City, Philippines Approximate date on which the Information Statement is first to be sent or given to security holders: March 18, 2011 WE ARE NOT ASKING YOU FOR A PROXY AND YOU ARE REQUESTED NOT TO SEND US A PROXY. Right of Appraisal There are no matters to be acted upon with respect to which a dissenting stockholder may exercise appraisal rights under Section 81 of the Corporation Code. Interest of Certain Persons in or Opposition to Matters to be Acted Upon No director, officer, or nominee for election as director or associate of any of the foregoing has any substantial interest in any matter to be acted upon, other than election to office. No director has informed the Company that he intends to oppose any action to be taken at the meeting. Voting Securities and Principal Holders Thereof (a) As of January 31, 2011, the number of outstanding voting shares is as follows: Common Shares: 2,009,902,966 Participating Preferred Shares: 4,000,000,000 Number of votes to which each share is entitled: One (1) vote 3 (b) Stockholders entitled to vote: Only stockholders of record as of the Record Date are entitled to vote at the meeting. (c) Manner of voting in the election of directors: Section 7 Article 2 of the Company’s By-Laws (the “By-Laws”) provides: “The directors of the Corporation shall be elected by majority vote at the annual meeting of the stockholders at which a quorum is present. At each election for directors, every stockholder shall have the right to vote, in person or by proxy, the number of shares owned by him for as many persons as there are directors to be elected, or to cumulate his votes by giving one candidate as many votes as the number of such directors multiplied by the number of his shares shall equal, or by distributing such votes at the same principle among any number of candidates.” (d) Security Ownership of Certain Record and Beneficial Owners and Management (i) Title of class Security Ownership of Record and Beneficial Owners of more than 5% as of January 31, 2011: Name and address of record owner Name of beneficial owner (and relationship with issuer) (and relationship with record owner) Citizenship No of shares held Percent of class Common Ayala Corporation 34F Tower One, Ayala Triangle, Ayala Ave, Makati City (Principal shareholder) Ayala Corporation (The same as the record owner) Filipino 651,912,996 32.07% Common Mitsubishi Corporation 6-3, Marunouchi 2-chome, Chiyoda-ku, Tokyo 10086, Japan (Not related) Mitsubishi Corporation (The same as the record owner) Japanese 168,999,999 Common PCD Nominee Corporation G/F MSE Bldg. Ayala Ave., Makati City (Not related) International Finance Corporation Multilateral 122,779,350 6.04% Common PCD Nominee Corporation G/F MSE Bldg. Ayala Ave., Makati City (Not related) First State Investment Management (UK) Limited, First State Investment International Limited, and First State Investment (Hong Kong) Limited ** Multilateral 197,438,900 9.71% 8.31% 4 Preferred (ii) Philwater Holdings Company, Inc. MWSS Admin. Bldg., 489 Katipunan Rd., 1105 Balara, QC (Principal owner) Philwater Holdings Company, Inc. (The same as the record owner) Filipino 3,999,999,997 99.99% Security Ownership of Directors and Management as of January 31, 2011:2 Amount and Nature of Beneficial Ownership Title of Class Name of Beneficial Owner Common Common Fernando Zobel de Ayala Jaime Augusto Zobel de Ayala Filipino Filipino Common Common Common Gerardo C. Ablaza Jr. Delfin L. Lazaro Antonino T. Aquino Filipino Filipino Filipino Preferred Preferred Common Common Common John Eric T. Francia Thomas Keevil Keiichi Asai Jose L. Cuisia Jr. Oscar S. Reyes Filipino British Japanese Filipino Filipino Common Common Solomon M. Hermosura Geodino V. Carpio Filipino Filipino Common Common Common Luis Juan B. Oreta Virgilio C. Rivera, Jr. Ruel T. Maranan Filipino Filipino Filipino All Directors and Officers as a group Percent of Class Citizenship 1 (direct) 200,001 (direct and indirect) 1 (direct) 1 (direct) 200,001 (direct and indirect) 1 (direct) 1 (direct) 1 (direct) 1 (direct) 330,001 (direct and indirect) 100 (indirect) 275,000 (direct and indirect) 23,300 (direct) 150,000 (direct) 150,000 (direct and indirect) 1,328,410 0.00000002% 0.00331521% 0.00000002% 0.00000002% 0.00331521% 0.00000002% 0.00000002% 0.00000002% 0.00000002% 0.00547009% 0.00000166% 0.00455839% 0.00038622% 0.00248640% 0.00248640% 0.02201970% None of the members of the Company’s board of directors (the “Board”) and management owns 2.0% or more of the outstanding capital stock of the Company. (e) The Company knows of no person holding more than 5% of common shares under a voting trust or similar agreement. (f) No change in control of the Company has occurred since the beginning of its last fiscal year. 2 The securities owned consist of common shares. Excluded are previously disclosed common shares acquired by the officers through the registrant’s Employee Stock Ownership Plan. (See section titled “Warrants and Options Outstanding”) 5 (iii) Security Ownership of Nominees for Election to the Board of Directors Title of Class Amount and Nature of Beneficial Ownership Common Name of Beneficial Owner Ricardo Nicanor N. Jacinto Preferred Simon Gardiner Citizenship Filipino British Percent of Class 48,000 (direct and indirect) 1 (direct) 0.00079565% 0.00000002% Directors and Executive Officers The Company’s Articles of Incorporation (the “Articles”) provides for 11 members of the Board. The following are the incumbent members of the Board: Fernando Zobel de Ayala Jaime Augusto Zobel de Ayala Gerardo C. Ablaza Jr. Antonino T. Aquino John Eric T. Francia Thomas Keevil Delfin L. Lazaro Keiichi Asai Jose L. Cuisia Jr. (Independent Director) Oscar S. Reyes (Independent Director) All of the incumbent directors, except Thomas Keevil, have been nominated to the Board for election at the stockholders’ meeting. Messrs. Ricardo Nicanor N. Jacinto and Simon Gardiner were also nominated as directors of the company for election at the stockholders’ meeting. Messrs. Jose L. Cuisia Jr. and Oscar S. Reyes were nominated as independent directors by Jennifer S. Gutierez, a stockholder of the Company. Jennifer S. Gutierez has no business or professional relationship with Messrs. Cuisia and Reyes. The By-Laws of the Company was amended on June 21, 2005 incorporating the provisions of SRC Rule 38, as amended (Requirements on Nomination and Election of Independent Directors) and compliance therewith has been made.3 The nominees for Independent Directors have all the qualifications and none of the disqualifications of an Independent Director. The directors elected at the meeting shall hold office upon their election for one year and until their successors are elected and qualified. The Company’s key executive officers as of January 31, 2011 are as follows: Name Gerardo C. Ablaza Jr. Luis Juan B. Oreta Virgilio C. Rivera Jr. Ruel T. Maranan Geodino V. Carpio Position President Chief Finance Officer and Treasurer Group Director, Regulation & Corporate Development Group Director, Corporate Resources Group Director, Operations 3 The Nomination Committee is composed of the following: Jose L. Cuisia Jr. (Chairman), Jaime Augusto Zobel de Ayala, John Eric T. Francia and Oscar S. Reyes (independent director). 6 A summary of the qualifications of the incumbent directors, nominees for directors for election at the stockholders’ meeting, and incumbent officers is set forth in Annex A. Attendance of Directors in Board Meetings4 Below is the record of attendance of the directors in 2010: Directors Fernando Zobel de Ayala Jaime Augusto Zobel de Ayala Gerardo C. Ablaza, Jr. Antonino T. Aquino Delfin L. Lazaro John Eric T. Francia Jose Rene D. Almendras6 Takeaki Yamashita7 Keiichi Asai8 Charles Thomas Cornish9 Thomas Keevil Jose L. Cuisia Jr. Oscar S. Reyes No. of Meetings Attended/Held5 4/5 4/5 4/5 3/5 5/5 4/5 2/2 3/3 1/1 1/3 2/2 5/5 5/5 % Present 80% 80% 80% 60% 100% 80% 100% 100% 100% 33% 100% 100% 100% Significant Employees The Company considers its entire work force as significant employees. Everyone is expected to work together as a team to achieve the Company’s goals and objectives. Family Relationships The Company’s Chairman, Fernando Zobel de Ayala, is the brother of director Jaime Augusto Zobel de Ayala. Involvement in Certain Legal Proceedings In the past five years, up to January 31, 2011, there is no bankruptcy petition, conviction by final judgment, order, judgment or decree or any violation of a Securities or any relevant law involving any director, any nominee for election as director or executive officer of the Company that occurred that is material to an evaluation of the ability or integrity of the director, nominee for election as director or executive officer of the Company. 4 A copy of the Corporate Secretary’s Sworn Certification on the attendance of the Board of Directors countersigned by the Chairman was submitted to the SEC on January 27, 2011. 5 In 2010 and during the incumbency of the director. 6 Mr. Almendras resigned on June 30, 2010 7 Mr. Yamashita died on September 10, 2010 8 Mr. Asai was elected on November 25, 2010 9 Mr. Cornish resigned on October 4, 2010 7 Certain Relationships and Related Transactions The Company entered into a technical services agreement with United Utilities B.V., an affiliate of United Utilities Pacific Holdings B.V., for technical services necessary for the operation of the Company. The Company also contracted with Ayala Corporation for administrative, technical and support services in relation to human resources, treasury, accounting, capital works, corporate services and regulatory affairs and administrative management of the Company. The Company further entered into a Capital Works Program Agreement with Water Capital Works Inc., a company owned by Ayala Corporation, United Utilities Pacific Holdings B.V., and BPI Capital Corporation, for services relating to the capital works program of the Company. No other transaction was undertaken by the Company in which any director or executive officer was involved or had a direct or indirect material interest. No Resignation of Directors Arising from Disagreement Since the annual stockholders’ meeting of the Company on April 12, 2010, no director has resigned or declined to stand for re-election due to any disagreement with the Company relative to its operations, policies and practices. Compensation of Directors and Executive Officers The aggregate compensation paid or accrued during the last two fiscal years and the ensuing fiscal year to the Company’s Chief Executive Officer and the most highly compensated officers and all other officers as a group is as follows: Annual Compensation in P millions Name Gerardo C. Ablaza Jr. Luis Juan B. Oreta Virgilio C. Rivera Jr. Frank Beaumont10 Ruel T. Maranan Geodino V. Carpio Frederick E. Reyes Loida S. Diño Roberto L. Licup Atty. Rene T. Tale Abelardo P. Basilio Tom Mattison Ma. Victoria P. Sugapong 10 Principal Position Year Salary Bonus Other Annual Compensation CEO / President CFO & Treasurer Group Director - Regulation & Corporate Development Technical Adviser Group Director - Corporate Resources Group Director - Operations Director - Human Resources Director – Regulatory Development Director – Special Projects Director - Corporate Services Director - East Zone Business Operations Director – Operation Support Services Director – Enterprise Risk Management Mr. Beaumont resigned on December 31, 2010. 8 Above-named officers as a group: 2009 2010 Estimated 2011 74.5 94.6 84.1 9.0 12.4 13.9 33.2 23.1 24.0 All other officers as a group unnamed: 2009 2010 Estimated 2011 264.1 300.7 327.8 78.3 77.1 81.7 97.2 90.5 97.7 The Company has no standard arrangement or any other arrangements or compensatory plan or arrangement with regard to the remuneration of its existing directors and officers aside from the compensation received herein stated. Directors’ Compensation The By-Laws provides that by resolution of the Board, each director shall receive a reasonable per diem for his attendance at each meeting of the Board. As compensation, the Board shall receive and allocate an amount of not more than 10% of the net income before income tax of the Company during the preceding year. Such compensation shall be determined and apportioned among the directors in such manner as the Board may deem proper, subject to approval of stockholders representing at least a majority of the outstanding capital stock. On October 28, 2004, the stockholders of the Company owning more than 80% of shares in each class of shares entitled to vote confirmed the directors’ remuneration which the Board approved at its meeting on July 26, 2004, as follows: For each director - P200,000.00 for each quarterly and annual meeting, a portion of which to be allocated as fixed remuneration and the balance as attendance fee based on Board meetings actually attended; For each Board Committee member - P20,000.00 per Committee meeting actually attended. Aside from the above, the Board has adopted no other resolution relating to directors’ remuneration. However, the Board will hold a special meeting prior to the Annual Stockholders’ Meeting to discuss, among others, the increase in directors’ compensation. Any resolution approved in that special meeting for the increase in directors’ compensation shall be submitted to the stockholders for approval in the Annual Stockholders’ Meeting. Warrants and Options Outstanding As of January 31, 2011, 36.672 million subscriptions are outstanding under the Company’s Employee Stock Ownership Plan (ESOWN) which was approved by the Securities and Exchange Commission on January 31, 2006. The subscriptions include those for shares covered by options that were granted in 2005 under the Company’s Executive Stock Option Plan (ExSOP) and converted to subscriptions under the ESOWN. As a result of the conversion of options under the ExSOP to subscriptions under the ESOWN, the Company will no longer grant options under the ExSOP. There were disclosures on grants to senior officers under the ESOWN in 2005, 2006, 2007, 2008 and 2009. 9 The number of employees and officers of the Company who are eligible to participate in the ESOWN is approximately 340. Independent Public Accountants The principal accountants and external auditors of the Company is the accounting firm of SyCip, Gorres, Velayo and Company (SGV and Co.). The same accounting firm is being recommended for re-election at the meeting, for a remuneration of P1.655 million, exclusive of VAT and out-of-pocket expenses. The agreement with SGV and Co. covers the annual audit of the Company. Representatives of SGV and Co. for the current year and for the most recently completed fiscal year are expected to be present at the meeting. They will have the opportunity to make a statement if they desire to do so and are expected to be available to respond to appropriate questions. Pursuant to SRC Rule 68, paragraph 3 (b) (iv), the Company has engaged SGV and Co. as external auditor. Ms. Jessie D. Cabaluna has been the partner in charge effective 2010. Changes in and Disagreements with Accountants on Accounting and Financial Disclosure SGV and Co. has been the principal accountant and external auditor of the Company since 1997 and continues to perform the same services for the Company up to the present date. There are no disagreements with SGV and Co. on accounting and financial disclosures. External Audit Fees Services: Audit of Financial Statements All Other Fees (Tax Advice re MTSP, Peso Bond, Enterprise Risk Mgmt. and other projects) (Audit and Audit-Related Fees) 2010 2009 1,575,000.00 1,500,000.00 4,548,246.08 6,123,246.08 3,051,028.80 4,551,028.80 The Company’s Audit and Governance Committee11 reviews and approves the scope of audit work of the external auditor and the amount of audit fees for a given year. The amount will then be presented for approval by the stockholders in the annual meeting. The scope of and payment of services rendered by the external auditor other than the audit of financial statements are also subject to review and approval by the Audit and Governance Committee. Financial and Other Information The audited financial statements as of December 31, 2010, Management’s Discussion and Analysis, Market Price of Shares and Dividends and other data related to the Company’s financial information are attached as Annex “B”. The schedules required under Part IV (c) of Rule 68 will be included in the Annual Report (Form 17-A). 11 The Audit and Governance Committee is composed of the following: Oscar S. Reyes (Chairman), Jose L. Cuisia Jr. (independent director), Keiichi Asai, and Delfin C. Gonzalez Jr.. 10 Legal Proceedings There are no material legal proceedings in the past five years to which the Company is a party or of which any of its material properties are subject in any court or administrative agency of the Government. But the Company would like to mention the following cases: Antonio Baltazar vs. Hon. Oscar Garcia, et al., OMB Case No. C-A-05-0205-E and OMB Case No. C-A05-0208-E, Ombudsman Criminal complaints were filed with the Office of the Ombudsman against members of the Board of Trustees of the Metropolitan Waterworks and Sewerage System (MWSS) and the MWSS Regulatory Office and the presidents of the Company and Maynilad Water Services, Inc. (“Maynilad”), for violation of Republic Act No. 3019 and for “conduct prejudicial to the best interests of the service.” The complaint arose from the water rate increases which became effective on January 1, 2005. The Company filed the Counter-Affidavit of its President in 2005. In a Decision dated April 30, 2009, the Ombudsman dismissed OMB Case No. C-A-05-0208-E. In a resolution of even date, the Ombudsman also dismissed OMB Case No. C-A-05-0205-E. The complainant moved for the reconsideration of the Decision and Resolution, which were timely opposed in behalf of the President of the Company. The Motion for Reconsideration was denied in an Order dated October 21, 2009. Thereafter, the complainant filed with the Office of the Ombudsman a Petition for Review assailing the Decision dated April 30, 2009 and Order dated October 21, 2009. No resolution has yet been issued with regard to the Petition for Review. Manila Water Company, Inc. and Maynilad Water Services, Inc. vs. Hon. Borbe, et al., CBAA Case No. L-69 Central Board of Assessment Appeals (“Central Board”) This is an appeal from the denial by the Local Board of Assessment Appeals of Bulacan Province (the “Local Board”) of the Company’s (and Maynilad’s) appeal from the Notice of Assessment and Notice of Demand for Payment of Real Property Tax in the amount of P357,110,945 made by the Municipal Assessor of Norzagaray, Bulacan. The Company is being assessed for half of the amount. In a letter dated April 3, 2008, the Municipal Treasurer of Norzagaray and the Provincial Treasurer of the Province of Bulacan, informed both MWSS concessionaires (Company and Maynilad) that their total real property tax accountabilities have reached P648,777,944.60 as of December 31, 2007. This amount, if paid by the concessionaires, will ultimately be charged to the customers as part of the water tariff rate. The concessionaires (and the MWSS, which intervened as a party in the case) are thus contesting the legality of the tax on a number of grounds, including the fact that the properties subject of the assessment are owned by the MWSS. MWSS is both a government-owned and controlled corporation and an instrumentality of the National Government that is exempt from taxation under the Local Government Code. The Central Board conducted a hearing on June 25, 2009. At that hearing, parties were given the opportunity and time to exchange pleadings on a motion for reconsideration filed by the Municipality to have the case remanded to and heard by the Local Board, rather than by the Central Board. In an Order dated August 4, 2010, the Central Board denied the motion for reconsideration and continued with the case. The case is now on pre-trial. 11 Herminio dela Peña, et al. vs. Manila Water Company, Inc., NLRC NCR (South) Case No. 30-02-007230/NLRC CA No. 025614-2000/ CA G.R. SP No.67134/ SC-G.R. No. 158255, Supreme Court This case stemmed from a complaint for illegal dismissal filed before the National Labor Relations Commission (NLRC) by a group of contractual collectors belonging to the Associated Collectors Group, Inc. (ACGI). ACGI’s collection service was engaged by the Company in November 1997 up to February 1999. Complainants claim that they are regular employees of the Company and were illegally dismissed when the Company terminated its service contract with ACGI. The Labor Arbiter ruled in favor of the complainants and awarded separation pay amounting to P222,500.00. Upon appeal by the Company, the decision of the Labor Arbiter was reversed by the NLRC. Subsequently, the complainants appealed to the Court of Appeals who ruled in their favor. The decision of the Court of Appeals was subsequently sustained by the Supreme Court. However, the Supreme Court deleted the award of moral and exemplary damages amounting to P10,000.00 per complainant. Upon the finality of the decision of the Supreme Court and the subsequent remanding of the case to the Labor Arbiter, the latter granted complainants’ Motion to Approve Computation of Complainants’ Backwages and to Issue Writ of Execution. The Labor Arbiter directed the Company to reinstate complainants and to pay them their backwages in the amount of P19,576,500.00. The Company appealed the order of the Labor Arbiter. Subsequently, the NLRC granted the appeal of the Company. The complainants elevated the case to the Court of Appeals via a Petition for Certiorari but their petition was denied. Consequently, on August 11, 2008, the complainants filed a Petition for Review with the Supreme Court which was timely opposed by the Company. The petition was denied by the Supreme Court in a Decision dated July 20, 2009. Complainants sought a reconsideration of the said Decision which was also denied in a Resolution dated December 15, 2009. Complainants thereafter filed a second motion for reconsideration. In a Resolution dated February 24, 2010, the Supreme Court denied the second motion for reconsideration. Manila Water Company, Inc. vs. The Regional Director, Environmental Management Bureau-National Capital Region, et al., CA-G.R. No. 112023(DENR-PAB Case No. NCR-00794-09) This case arose from a complaint filed by OIC Regional Director Roberto D. Sheen of the Environmental Management Bureau-National Capital Region (EMB-NCR) before the Pollution Adjudication Board (PAB) against the Company, Maynilad and the MWSS for alleged violation of R.A. No. 9275, particularly the five-year deadline imposed in Section 8 thereof for connecting the existing sewage line found in all subdivisions, condominiums, commercial centers, hotels, sports and recreational facilities, hospitals, market places, public buildings, industrial complex and other similar establishments including households, to an available sewerage system. Two (2) similar complaints against Maynilad and MWSS were consolidated with this case. On April 22, 2009, the PAB through DENR Secretary and Chair Jose L. Atienza, Jr., issued a Notice of Violation finding that the Company, Maynilad and MWSS have committed the aforesaid violation of R.A. 9275. Subsequently, a Technical Conference was scheduled on May 5, 2009. In the said Technical Conference, the Company, MWSS and Maynilad explained to the PAB their respective positionsand it was established that DENR has a great role to play to compel people to connect to existing sewer lines and those that are yet to be established by the Company and Maynilad. 12 In addition to the explanations made by the Company during the Technical Conference, the Company together with MWSS and Maynilad, wrote a letter dated May 25, 2009 and addressed to the respondent Secretary where they outlined their position on the matter. In response to the May 25, 2009 letter, the OIC, Regional Director for NCR, the Regional Director of Region IV-A and the Regional Director of EMB Region III submitted their respective Comments. The Company thereafter submitted its letter dated July 13, 2009 to the public respondent PAB where it detailed its compliance with the provisions of the Clean Water Act and reiterated its position that the continuing compliance should be within the context of the Company’s Concession Agreement with MWSS. Despite the explanations of the Company, the PAB issued the challenged Order dated October 7, 2009 which found the Company, Maynilad and MWSS to have violated R.A. 9275. The Company filed its Motion for Reconsideration dated October 22, 2009 which the PAB denied in an Order dated December 2, 2009. Hence, the Company filed its Petition for Review dated December 21, 2009 with the Court of Appeals. The Company thereafter filed an amended Petition for Review dated January 25, 2010. Per CA Resolution dated October 6, 2010, the petition is now deemed submitted for decision. Amendment of By-Laws The Board will hold a special meeting on April 11, 2011 immediately prior to the Annual Stockholders’ Meeting, to discuss, among others, the amendment to the by-laws, in particular, Section 10, Article V of the By-Laws for reducing the limit on the total yearly compensation of directors from 10% of net income before income tax during the preceding year and the delegation to the Board of the authority to fix directors compensation and Section 4, Article II of the By-Laws, for the inclusion of electronic transmission as a method of delivering notices and other communications to stockholders. Action with Respect to Reports The approval of the stockholders for the following will be taken: Minutes of the Stockholders’ Meeting (“Minutes”) on April 12, 2010 The approval or disapproval of the Minutes will constitute merely an approval or disapproval of the correctness of the Minutes but not an approval or disapproval of any of the matters referred to in the Minutes. The Minutes cover the following matters: i) ii) iii) iv) v) Annual report to the stockholders; Approval of audited financial statements; Ratification of all acts of the Board of Directors, Executive and Management Committees, and officers; Election of members of the Board; and Election of external auditors. The Company’s audited financial statements as of December 31, 2010. 13 Annex “A” Incumbent Directors All of the incumbent directors, except Thomas Keevil, have been nominated to the Board for election at the stockholders’ meeting. Fernando Zobel de Ayala, Chairman of the Board and Executive Committee, Filipino, 51 years old. Director of the Company since May 15, 1997. He also holds the following positions: President and Chief Operating Officer of Ayala Corporation; Chairman of Ayala Land Inc., Alabang Commercial Corp., and Ayala DBS Holdings, Inc.; Vice Chairman of Azalea Technology Investments, Inc.; Co-Vice Chairman of Ayala Foundation, Inc. and Mermac, Inc.; Board Member of Integrated Micro-Electronics, Inc., Globe Telecom, Inc., Bank of the Philippine Islands, Asiacom Philippines, Inc., Ayala International Pte, Ltd., AC International Finance Ltd., and Ayala Hotels, Inc.; Member of the Asia Society, World Economic Forum, INSEAD East Asia Council, and the World Presidents’ Organization; Director of the Board of Habitat for Humanity International and Chairman of the Habitat for Humanity’s Asia-Pacific Steering Committee; Trustee, International Council of Shopping Centers; Member of the Board of Directors of Caritas Manila, Kapit Bisig para sa Ilog Pasig Advisory Board, Pilipinas Shell Corporation and Pilipinas Shell Foundation. Mr. Fernando Zobel de Ayala graduated with a B.A. in Liberal Arts degree from Harvard College in 1982. He also holds a Certificate of International Management at INSEAD, France. Jaime Augusto Zobel de Ayala, Filipino, 52 years old. Director of the Company since May 15, 1997. He also holds the following positions: Chairman and CEO of Ayala Corporation; Chairman of Globe Telecom, Inc., Bank of the Philippine Islands, and Integrated Micro-Electronics Inc.; Vice Chairman of Ayala Land, Inc.; Co-Vice Chairman of Mermac, Inc., and the Ayala Foundation; Director of BPI PHILAM Life Assurance Corp., Alabang Commercial Corporation, Ayala International Pte, Ltd., and Ayala Hotels, Inc.; Member of the Mitsubishi Corporation International Advisory Committee, JP Morgan International Council, and Toshiba International Advisory Group; Philippine Representative to the Asia Pacific Economic Council; Chairman of Harvard Business School Asia-Pacific Advisory Board; Vice Chairman of the Asia Business Council; Member of Harvard University Asia Center Advisory Committee; Member of the Board of Trustees of the Eisenhower Fellowships, the Singapore Management University and Asian Institute of Management; Member of The Asia Society, the International Business Council of the World Economic Forum; Chairman of the World Wildlife Fund Philippine Advisory Council; Vice Chairman of The Asia Society Philippines Foundation, Inc., Co-Vice Chair of the Makati Business Club; and Member of the Board of Trustees of the Children’s Hour Philippines, Inc. He graduated with B.A. in Economics (Cum Laude) degree from Harvard College in 1981 and obtained an MBA from the Harvard Graduate School of Business in 1987. Gerardo C. Ablaza Jr., Filipino, 57 years old. Director of the Company since November 26, 2009 and became the president on June 30, 2010. Mr. Ablaza is a Senior Managing Director of Ayala Corporation and a member of the Ayala Group management committee, a post he has held since 1998. Mr. Ablaza holds the following positions: Co-Vice Chairman of Globe Telecom, Inc.; board director of Bank of the Philippine Islands, BPI Family Savings Bank, BPI Card Finance Corporation, Azalea International Venture Partners Limited, Asiacom Philippines, Inc., LiveIT Investment Ltd., BPI Globe BanKO Inc.; Chairman of AAA Water Corporation, Manila Water Asia Pacific Pte. Ltd, Manila Water South Asia Holdings Pte. Ltd. and Manila Water Total Solutions Corp.; Vice-Chairman of Laguna AAAWater Corporation and Jindal Manila Water Development Company Ltd.; Chairman & President of Manila Water International Solutions, Inc. and Northern Waterworks and Rivers of Cebu, Inc.; and President of MWC Foundation. He was appointed Chief Executive Officer of AC Capital from January 1 to June 30, 2010 with directorship position in Azalea Technology Investments, Inc., HRMall Holdings Limited, HR Mall Inc., Integreon, Inc., Affinity Express Holdings Limited, NewBridge International Investments 15 Ltd., Stream Global Services., RETC (Renewable Energy Test Center ), ACST Business Holdings, Inc., AG Holdings Limited (HK), Ayala Automotive Holdings Corporation, Ayala Aviation Corporation, Michigan Power, Inc., MPM Noodles Corporation, Purefoods International Investment Limited and Ayala Foundation Inc. as Trustee. He was President and CEO of Globe Telecom, Inc. from 1998 to April 2009. Mr. Ablaza was previously Vice-President and Country Business Manager for the Philippines and Guam of Citibank, N.A. for its Global Consumer Banking Business. Prior to this position, he was VicePresident for Consumer Banking of Citibank, N.A. Singapore. Attendant to his last position in Citibank, N.A., he was the bank’s representative to the board of directors of City Trust Banking Corporation and its various subsidiaries. Mr. Ablaza graduated summa cum laude from De La Salle University in 1974 with an AB degree major in Mathematics (Honors Program). In 2004, he was recognized by CNBC as the Asia Business Leader of the Year, making him the first Filipino CEO to win the award. In the same year, he was awarded by Telecom Asia as the Best Asian Telecom CEO. Antonino T. Aquino, Director, Filipino, 62 years old. Director of the Company since April 24, 1998. Mr. Aquino was elected president of Ayala Land, Inc. last April 1, 2009. He joined the Company as Group Director for Corporate Affairs and was later appointed President in January 1999. He has been with the Ayala Group in various capacities for the past 30 years and now holds the position of Senior Managing Director. He was President of the Ayala Property Management Corporation from 1990 to1998 and Senior Vice President of Ayala Land, Inc. from 1989 to 1998. He was also a Business Unit Manager at IBM Philippines, Inc. from 1968-1980. He is currently the Chairman of the Board of Trustees of the Hero Foundation. He also serves as a Member of the Board of various corporate social responsibility foundations such as Ayala Foundation, Manila Water Foundation, Habitat for Humanities Philippines, La Mesa Watershed Foundation and Makati Environment Foundation. Mr. Aquino completed the academic requirements for masteral degree in Business Management at the Ateneo Graduate School of Business and completed his Bachelor of Science, major in Management degree, at the Ateneo de Manila University. Delfin L. Lazaro, Filipino, 63 years old. Director of the Company since May 6, 2002. He also holds the following positions: Chairman of MPM Noodles Corp., Philwater Holdings Co., Inc.; Chairman of AYC Holdings Ltd. and Chairman and President of A.C.S.T. Business Holdings, Inc.; Director of Ayala Corporation, Ayala Land, Inc., Globe Telecom, Inc., Integrated Micro-Electronics, Inc., Ayala Automotive Holdings Corp., and AI North America. He was formerly President and CEO of Benguet Corporation and Secretary of the Department of Energy of the Philippine government. He was named Management Man of the Year in 1999 by the Management Association of the Philippines. He graduated with B.S. in Metallurgical Engineering degree from the University of the Philippines in 1967 and took his MBA (with Distinction) from Harvard Graduate School of Business in 1971. John Eric T. Francia, Filipino, 39 years old. Director of the Company since April 12, 2010. Mr. Francia is a Managing Director and a member of the Management Committee of Ayala Corporation since January 2009. Mr. Francia is the Head of Ayala's Corporate Strategy & Development Group, which is responsible for overseeing Ayala's portfolio strategy, driving new business development, and managing investor relations. He is also a director of Integrated Micro-Electronics, Inc., LiveIt Investments, Integreon, Michigan Power, and Chairman of PhilNewEnergy. Prior to joining Ayala, Mr. Francia led Global Business Planning and Operations at the Monitor Group, a strategy consulting firm based in Cambridge, MA. He spent 12 years in the management consulting sector both as a senior consultant and member of the management team. Prior to consulting, he spent a few years in the field of academe and media. Mr. Francia received his undergraduate degree in Humanities and Political Economy from the University of Asia & the Pacific, graduating Magna Cum Laude. He then completed his Masters Degree in Management Studies at the University of Cambridge in the UK, graduating with First Class Honors. 16 Thomas Keevil, British, 50 years old. Director of the Company since October 4, 2010. Mr. Keevil is the company secretary and general counsel of United Utilities Group Plc. From 2002 until 2007 he was company secretary and general counsel of Gallaher Group Plc and a board appointed member of Gallaher's corporate responsibility committee. As such, he was responsible for managing the corporate affairs, legal and security and brand protection departments and acting as secretary to the Plc board and its principal committees. Prior to that, he was a senior legal adviser for Gallaher from 2000 to 2002, having been appointed to that role following 16 years with international law firm Simmons & Simmons, where he was appointed a partner in May 1991. He is a Fellow of the Chartered Institute of Arbitrators, an accredited mediator, a member of the European advisory board of FM Global, an executive committee member of the UK General Counsel100 and was appointed a non-executive director of the UK Solicitors Regulation Authority with effect from 01 January 2010. Keiichi Asai, Japanese, 56 years old. Director of the Company since November 25, 2010. Mr. Asai is the Senior Vice President & Division COO of the Environmental & Water Business Division of Mitsubishi Corporation from April 2010. He was at Petro-Diamond Incorporated (New York) from 1988 to 1994, where he engaged in trading and marketing petroleum products in the United States, Canada, and South American Countries. Then he experienced MC Liaison Office in India for 3 years where he was in charge of trading in Indian petroleum market. From 2001 until 2008, he was appointed as the General Manager of two business units in petroleum business division where he was responsible for international and domestic trading operations. From 2008 until 2009, he was appointed as the General Manager in Energy Business Group CEO Office where he was in charge of the management of whole energy businesses. Mr. Keiichi Asai graduated with Bachelor of Economics from the University of Tokyo in 1978. Oscar S. Reyes, Filipino, 62 years old. Director of the Company since February 3, 2005. He has been a Director of the Bank of the Philippine Islands since April 2003. Among his other positions are: Chairman of MRL Gold Phils., Inc. and Link Edge, Inc.; Member of the Board of Philippine Long Distance Telephone Company, Pepsi Cola Products Philippines Inc., and First Philippine Electric Corporation. Prior to this post, he has served the Shell Group of Companies in the Philippines in various capacities, including Country Chairman and concurrently President of Pilipinas Shell Petroleum Corporation and Managing Director of Shell Philippines Exploration B.V. He is a Member of the Board of Trustees of Pilipinas Shell Foundation, Inc., SGV Foundation, and El Nido Foundation, Inc. He finished his B.A. degree major in Economics (Cum Laude) at the Ateneo de Manila University in 1965. He also finished post-graduate studies in Waterloo University and Harvard Business School, among other schools abroad. Jose L. Cuisia Jr., Filipino, 67 years old. Director of the Company since April 12, 2010. He is presently the Vice Chairman of the Philippine American Life and General Insurance Company. At present, he also holds the following positions: Chairman of BPI Philam Life Assurance Co., Philam Foundation, Tower Club, Inc. and The Covenant Car Company, Inc.; Vice-Chairman of SM Prime Holdings; Director of Holcim Philippines, Inc., PHINMA Corporation, Bauang Private Power Corporation, Union Galvasteel Corporation, ICCP Holdings, Beacon Property Ventures and Genesis Hotels & Resorts Management, Inc. Before becoming Philamlife’s President and CEO, Mr. Cuisia served the Philippine Government as Governor of the Philippine Central Bank and Chairman of its Monetary Board from 1990-1993. He was also appointed Commissioner, representative of the Employer’s Group, for the Social Security System (SSS) last September 2010, but recently resigned last December 2010. Mr. Cuisia was also Governor for the Philippines to the International Monetary Fund and Alternate Governor to the World Bank. Prior to service in the Central Bank, he was Administrator and CEO of the Philippine Social Security System from 1986- 1990. Mr. Cuisia is active in educational institutions, being Chairman of the Board of Trustees/ Board of Governors of the Asian Institute of Management, a previous Trustee of the University of Asia & the Pacific and Chairman of De La Salle University Board of Trustees. He is the CV Starr Chairman of Corporate Governance for the Asian Institute of Management. Mr. Cuisia graduated from De 17 La Salle University with AB-BSC degrees (Magna Cum Laude) and earned an MBA degree from The Wharton School, University of Pennsylvania in 1970 as a University Scholar. Other nominees to the Board for Election as Director Ricardo Nicanor N. Jacinto, Filipino, 50 years old, has served as a Managing Director of Ayala Corporation since May 2000 and has served as Managing Director and CEO of Habitat for Humanity Philippines Inc. since January 2010. He is the President of Nicanor P. Jacinto, Jr., Foundation and a Director of Technopark Land, Inc., Children’s Hour Philippines, Inc., Socialized Housing Finance Corporation and Ayala Greenfield Estates Homeowners’ Association, Inc. He completed his Masters in Business Administration at the Harvard University in 1986. Simon Gardiner, British, 43 years old, is Head of Legal at United Utilities Group PLC, which he joined in 2002. He has a master’s degree from Cambridge University and is a qualified UK solicitor. He has extensive experience in the UK regulated utility sector and internationally. He is a director of United Utilities International and AS Tallinna Vesi, the licensed water undertaker for the Estonian capital and a member of the advisory board to the Faculty of Law at Liverpool John Moores University. Prior to joining United Utilities, he was a legal counsel for the UK based multi-national engineering group, GKN and an associate at the law firm, Osborne Clarke. Corporate Secretary Solomon M. Hermosura, Corporate Secretary, Filipino, 48 years old. Corporate Secretary of the Company since April 3, 2006. He has been a Managing Director of Ayala Corporation since 1999. He also holds the following positions: General Counsel, Compliance Officer and Assistant Corporate Secretary of Ayala Corporation since 2009; Corporate Secretary of Globe Telecom Inc., Integrated Micro-Electronics, Inc., Ayala Foundation, Inc., Philwater Holdings Company, Inc. and a number of other companies in the Ayala group; Assistant Corporate Secretary of Ayala Land Inc.; and a member of the Board of Directors of a number of companies in the Ayala group. He earned his Bachelor of Laws degree from San Beda College in 1986 and placed third in the 1986 Bar Examination. Incumbent Executive Officers Gerardo C. Ablaza Jr., President. Please see biography above under “Directors”. Luis Juan B. Oreta, Chief Finance Officer and Treasurer, Filipino, 54 years old. Mr. Oreta joined the company in January 1, 2009. Prior to his appointment, Mr. Oreta was Managing Director of Ayala Corporation - Strategic Planning Group from March 1997 to 2008 and was interim CFO of Integrated Microelectronics, Inc. until December 31, 2008. He is a Director of Michigan Holdings, Inc., Technopark Land, Inc., and Darong Agricultural Development Corporation. He has also served the Bank of the Philippine Islands in various capacities from October 1983 to March 1997, where his last position was as Vice President of BPI Capital Corporation. He graduated from the University of the Philippines with a Bachelor of Science degree in Business Economics and has a Master in Business Administration degree from Rutgers University, Graduate School of Management. Virgilio C. Rivera, Jr. - Group Director, Regulation and Corporate Development , Filipino, 49 years old. Mr. Rivera has been with the Ayala Group for more than 20 years and held appointments with Ayala Corporation under various capacities including Managing Director, Manager of the Strategic Planning 18 Group, and Head of Strategic Planning of Integrated Microelectronics, Inc. Mr. Rivera is responsible for shaping public policy, formulating regulatory strategies, mitigation of regulatory risk, regulatory compliance and stakeholder relations. Mr. Rivera led two successful price reviews in 2003 and 2008, negotiated the amendment of the concession contract which resulted in the 15-year extension of the contract period, and secured a favorable ruling on cost of capital through international arbitration. His achievements has earned him the distinction as a valuable resource person in international conferences on infrastructure privatization, regulation and PPP initiatives sponsored by World Bank, ADB, JICA, IWA, academic institutions (e.g., TERI, Stanford University) and host national governments in emerging countries. Mr. Rivera is also the President of Laguna Water and Boracay Island Water, two newly-formed subsidiaries of Manila Water. Concurrently, Mr. Rivera is a Managing Director of Ayala Corporation, one of the Philippines’ oldest and largest conglomerates. Mr. Rivera also acted as Chairman of the Management's negotiating panel for the 2006 and 2008 Collective Bargaining Agreement (CBA). Mr. Rivera is currently member of the Global Utility Steering Committee of the International Water Association. Mr. Rivera holds two university degrees in Economics and Behavioral Science from University of Sto. Tomas. He also completed a graduate level course work on M.S. Economics from De La Salle University. Ruel T. Maranan - Group Director, Corporate Resources Group, Filipino, 48 years old. Mr. Maranan joined Manila Water in January 2004 as the Group Director for Human Resources and Corporate Services. His role has since expanded into leading Manila Water’s Corporate Resources Group, which also includes Corporate Communications, Land Acquisition and Right-of-Way, and Information and Communications Technology. Before joining the Company, he was the Division Head for Strategic Staffing and Employee Relations at Globe Telecom. He served as Chairman of the Ayala Multi-Purpose Cooperative and as Vice President of the People Management Association of the Philippines (PMAP). In addition to his professional concerns, he devotes time to community and nation building, being the battalion commander of the 503rd Water Battalion and holding the rank of lieutenant colonel. Mr. Maranan earned his AB Social Sciences degree from the Ateneo de Manila University and his law degree from the University of Santo Tomas. He has also completed the Harvard Leadership Management Program. Geodino V. Carpio, Group Director, Operations Group, Filipino, 50 years old. Mr. Carpio joined the Company in 1997 as Chief Information Officer before moving to Project Delivery as Group Director in 2004. Prior to joining the Company, Mr. Carpio was the Vice President for Information Technology for the Marsman Group of Companies. Mr. Carpio developed his experience mostly from his 12 years with Andersen Consulting where his last position was as Senior Manager, performing a key role in the firm’s logistics practice. His functional experience includes logistics, customer service, banking, accounting, and three-dimensional computer animation and development over varied architectures from legacy systems to multi-platform client/server. He holds a B.S. in Physics Teaching degree (Cum Laude) from the Philippine Normal College in consortium with De La Salle University under the National Science Development Board Scholarship Grant and attended a Software Engineering Course under the Scholarship Grant from the Center for International Cooperation for Computerization in Tokyo, Japan in 1986. He was appointed Group Director for Operations in August 2010. 19 Annex “B” MANAGEMENT REPORT I. Management’s Discussion and Analysis of Financial Condition and Results of Operations Description of Business Manila Water Company is a Philippine company which is involved in providing water, sewerage and sanitation services. The Company has been a concessionaire of the Metropolitan Waterworks and Sewerage System (MWSS) since 1997. It currently serves a total estimated population of over 6 million people in the East Zone, which encompasses 23 cities and municipalities, including Makati, Mandaluyong, San Juan, Taguig, Pateros, Marikina, Pasig, most of Quezon City and Rizal Province, as well as some parts of Manila. Under the Concession Agreement (CA) entered into on February 21, 1997 with MWSS, the Company was granted the exclusive right to service the East Zone as an agent and contractor of MWSS, to manage, operate, repair, decommission and refurbish the facilities, including the right to bill and collect for water and sewerage services in the East Zone. On October 19, 2009, the Company’s application for the 15-year extension of the CA was acknowledged and approved by the Department of Finance following the special authority granted by the Office of the President. With the CA extension, the term of the concession was extended for another 15 years until year 2037. Under the said agreement, the Company is entitled to recover the operating and capital expenditures, business taxes, concession fee payments and other eligible costs, and to earn a reasonable rate of return on these expenditures for the remaining term of the concession or until 2037. Manila Water has also expanded its services outside of the East Zone of Metro Manila. In July 2008, the Company won a contract for leakage reduction in Ho Chi Minh City, Vietnam. Through new joint venture companies, Manila Water acquired two (2) new concessions outside of the East Zone located in Laguna and Boracay island. Key Operational Performance Indicators (Manila Water East Zone) As of December 31 Household Connections (‘000) Water Connections (‘000) Sewer Connections (‘000) Billed Volume (in million cubic meters) Non Revenue Water (water losses) Ratio 24-hour Availability Staff per 1000 connections Water Quality Compliance Households served thru Desludging Services (‘000) 2010 1,158 814 68.9 409.8 11.0% 99% 1.4 100% 242 2009 1,086 720* 50.8 396.0 15.8% 99% 1.5 100% 291 2008 1,032 684 46.6 387.3 19.6% 99% 1.5 100% 188 * Data adjusted due to the completion of the data clean-up of more than 16,000 accounts. 20 Key Financial Highlights As of December 31 (In Million Pesos) Revenues Operating costs Earnings before interest, taxes, depreciation and amortization (EBITDA) Net income Earnings per share Total assets Total cash reserves* Long-term debt Stockholders’ equity 2010 2009 2008 11,013 3,530 7,483 9,533 2,730 6,803 8,913 2,505 6,408 3,987 1.85 48,621 5,808 14,134 19,978 3,231 1.31 43,758 9,729 14,361 16,971 2,788 1.13 36,368 8, 908 13,352 14,458 * Including cash and cash equivalents, short-term cash investments and available-for-sale financial assets Result of Operations (2010 vs. 2009) Operational Performance The Company continued to exceed last year’s levels of performance in terms of operations, particularly network efficiency. One of its key accomplishments was the continued reduction in its level of systems losses, as measured by its non-revenue water (NRW) ratio. NRW was further reduced by 4.8 percentage points to 11% by the end of 2010. The Company’s NRW level is comparably better than many of its regional counterparts. Because of the reduction in NRW, the Company was able to maintain its level of service to its customers despite reduced raw water supply allocation in the 2nd quarter of 2010 due to the El Niño phenomenon. The total volume of water delivered to customers in 2010 reached 409.8 million cubic meters (mcm), reflecting a 3.5% year-on-year growth. The increase was brought about by the 93,811 additional new service connections for 2010, coming largely from the expansion areas in Rizal province. Total water service connections at 813,942 increased by 13% from last year, serving 1,157,807 households. In terms of water availability, approximately 99% of the Company’s customers connected to the network enjoyed 24-hour water availability. Since 1998, the company’s water quality has surpassed the Philippine National Standards for Drinking Water, which is based on the World Health Organization’s water quality guidelines. The Company collects regular samples on a monthly basis for bacteriological examination of treated surface water and ground water resources. Water quality testing of water and wastewater samples is performed by the Company’s ISO accredited laboratory. The Company started the implementation of its wastewater masterplan which will increase sewer coverage within the East Zone. The plan also includes the construction of newer treatment plants which will treat wastewater outflows before discharge to the three major rivers – Marikina River, Pasig River and San Juan River located in its concession. Sanitation and sewerage projects were intensified resulting in a total of 56,466 septic tanks desludged, which benefited 242,046 households. The total number of sewer connections, including households connected to existing combined sewer drainage lines, also increased to 68,910 in 2010 higher by 36% versus last year. The Company also continued to be 100% compliant with regulatory standards and parameters for wastewater effluent. 21 Capital expenditures for year 2010 reached P9.6 billion. Capital investment projects were directed towards ensuring reliability of water supply, expansion of water and wastewater services and development of new water sources. A significant portion of the expenditures was spent on wastewater projects, which included the construction of septage treatment plants, the development of sewerage infrastructure and the laying of new sewer lines. The Company continued its efforts to grow the business by opening new concessions outside the East Zone. Building on the acquisition of a concession in Laguna, a new joint venture company with the Philippine Tourism Authority (PTA) was established in Boracay island to provide water and wastewater services in the area. In addition to existing operations in Vietnam, the Company continues to strive for a dominant position in the Asian region by continuing to develop partnerships with key regional partners. Financial Performance The Company continued its strong performance as it ended the year with a consolidated net income of P3,987 million, 23% better than last year’s P3,231 million. This growth was attributable to higher consolidated revenues, the decrease in depreciation expense due to the approval of the CA extension and the change in depreciation policy. Provision for bad debts also decreased as collection efficiency remained stable. Consolidated return on equity was computed at 20%, while net income margin was approximately 36%. Total revenues closed at P11,013 million for the period ending December 2010, posting a 16% year-onyear growth. This increase was driven by the 3.5% growth in billed volume and 10% increase in average tariff. Core revenues (composed of water, environmental and sewer revenue) amounted to P10,781 million, 14% higher than last year. The Company recognized around P75 million of revenues from its venture in Vietnam, and about P224 million of revenues from its operations in Laguna and Boracay. Operating expenses (before depreciation and amortization) amounted to P3,530 million in 2010, compared to last year’s P2,730 million. Approximately 31% of the Company’s operating expenses was spent on manpower costs, while 18% was spent on power costs. These two major expense items accounted for about 49% of the Company’s operating expenses. Depreciation and amortization cost decreased by 25% from last year despite higher capex disbursement for 2010 due to the approval of the CA extension. Earnings before interest, taxes, depreciation and amortization (“EBITDA”) amounted to P7,483 million in 2010, 10% higher than last year due to operation efficiency gains despite water and wastewater expansion. Interest income amounted to P288 million in 2010, coming from investments in money market instruments. Interest expense amounted to P1,188 million in 2010, 46% higher than last year due to additional loan drawdowns. The Company’s financial position remained solid as total assets grew by 11%, reaching P48,621 million as of December 31, 2010. The P4,863 million growth in total assets was due primarily to additional capital investments in major water and wastewater system projects and the capitalization of additional regulatory costs as a result of the CA extension. By the end of 2010, total cash reserves (including short term cash investments and investments in marketable securities held as available-for-sale financial assets) amounted to P5,808 million. Average days in receivables improved to 16 days as collection efficiency was maintained at 100% for year 2010. The improvement in days’ receivables turnover was a result of the Company’s aggressive collection strategies, alongside the initiative to make bill payments more convenient to customers. Current ratio remained healthy at 1.09. 22 Long-term debt in 2010 increased to P14,134 million. As of end of 2010, around 47% of the Company’s total long term debts was denominated in Philippine pesos, while the rest was denominated in US dollars and Japanese yen. The Company has the right to recover foreign currency losses resulting from its foreign denominated loans used to finance its capital investments in the East Zone. Approximately 72% of the Company’s direct borrowings are fixed rate loans. Net bank debt-to-equity was computed at 0.42 times. Net cash provided by operating activities totaled P5,929 million in 2010. This partly financed the Company’s capital investments and concession obligations of P9,614 million. The Company also settled maturing loans and interest of P1,929 million and paid dividends of P1,191 million. Other fund sources came from loan availments, interest income, and proceeds of matured investments. Material Changes (Increase or decrease of 5% or more in the financial statements) Income Statement Items (End 2010 vs. End 2009) CONSOLIDATED REVENUE Water/Environmental revenue – 15% increase This was due to the 3.54% increase in water sales volume and the 10% increase in average tariff. Environmental charge also increased from 12% to 16% of water revenue. Sewer Revenue – 14% decrease This was due to the decrease in sewer charges from 35% to 20% of tariff charge for residential and semi business customers and from 40 to 35% for commercial and industrial customers as a result of the rationalization of the sewer and environmental charges. Revenue from Management Contracts – 216% increase The increase represents progress billings for work accomplished for leakage reduction and district monitoring area formation under the Company’s contract in Vietnam. Other Income – 135% increase This pertains to the proceeds from sale of maintenance materials to Vietnam. CONSOLIDATED OPERATING COSTS AND EXPENSES Depreciation and amortization – 25% decrease The decrease was due to the Concession Agreement extension. Amortization was spread over the life of the Concession (from 2022 to 2037) instead of the remaining useful life of the asset whichever is lower. Salaries, wages and employee benefits – 7% increase The increase was due to the annual salary adjustments, other employee benefits, performance based incentives and rewards, and training costs. Power, light and water – 30% increase The increase is due to the additional consumption for new water and wastewater facilities. Total consumption increased by 6.1 million kwh or 8% while effective cost/kwh increased by P1.04 from P6.02 last year. 23 Provision for probable losses – 2,558% increase This pertains to the provision for real estate taxes for certain structures and facilities operated by both concessionaires in Bulacan and Quezon City. The case is now on pre-trial with the Central Board of Assessment Appeals. Management, technical and professional fees – 9% increase The increase was due to adjustment in cost related to inflation. administrative and support fee for Boracay and Laguna. This account also includes the Repairs and Maintenance – 50% increase The increase was due to the preventive maintenance for the upkeep of existing facilities and structures. Collection fees – 11% increase The increase was due to additional billed service connections.. Taxes and licenses – 18% increase The increase was due to the additional business taxes and permits paid on account of higher revenue base. Business meetings and representation – 6% increase The increase was due to the increase in activities in support of the various business expansion programs of the Company. Cost associated from contracts outside east zone – 100% increase This pertains to the cost of materials sold to subsidiaries in Laguna and Boracay. Wastewater cost – 17% decrease The decrease was due to lower volume of desludged waste from septic tanks. The desludging activity was accelerated in 2008-2009. Transportation and travel – 42% increase The increase was due to expansion of the Company’s service coverage further east and outside the concession area. Occupancy cost – 22% increase The increase was due to the additional services required for new facilities like janitorial and security services. The account also includes building rentals. Insurance – 22% increase The increase was due to new facilities commissioned during the year. Advertising – 6% increase The increase was due to the activities launched for information, education and communication to create public awareness of the Company’s various programs. Regulatory cost – 86% decrease Regulatory cost was no longer treated as period cost per IFRIC12. The present value of the annual funding of the Regulatory Office was booked as Service Concession Asset. Only the CPI adjustment was charged to operations. 24 Other expenses – 169% increase The increase was due to additional overhead cost as supplies, communication and miscellaneous expenses. OTHER INCOME (EXPENSES) Foreign currency differentials/foreign exchange gains(losses) – 65% decrease The decrease was due to the strengthening of the peso versus the US dollar. The US dollar weakened by 5%. Interest income – 20% decrease The decrease was due to lower interest rates in addition to the mostly short term tenors of the investments. Amortization of deferred credits – 50% decrease The decrease was due to the refund of a significant portion of meter deposits. Interest expense – 46% increase The increase was due to the additional loan drawdowns and the accretion of transaction costs. Mark to market gain(loss) on derivatives – 171% decrease This pertains to the gain on the call option on the P4 Billion peso bond as a result of the increase of interest rates in the market. Equity share in net loss of joint venture – 100% increase This represents equity share in net loss of Jindal Manila Water Development. Gain (loss) on disposal of property and equipment – 15,743% increase This pertains to the adjustments made as a result of the clean-up of the receivables and book value of vehicles covered by the company’s car plan. Reverse of accruals – 100% increase This pertains to the reversal of prior years of supplier’s claims, as a result of the clean-up of payables. Provision for income tax – 24% increase Income tax provision increased due to higher taxable income. Consolidated Balance Sheet Items (End 2010 vs. End 2009) Cash and cash equivalents/Short term cash investments – 49% decrease The decrease was due to higher disbursements for capital expenditures. Receivables - net – 5% decrease The decrease was due to the improvement in collection efficiency. Materials and supplies – 45% increase This pertains to the maintenance materials inventory of subsidiaries. Other current assets – 61% increase The increase was due to the advance payments made to contractors to facilitate early project completion. The amount is being recouped from the contractor’s progress billings. 25 Property, plant and equipment – 64% increase The increase was due to the re-classification of equipment previously included in service concession asset. Service concession asset – 25% increase The increase pertains to the cost of projects completed and capitalized during the year. Available for sale financial assets – 6% decrease The decrease was due to the termination of matured investments to finance the capex disbursements. Deferred tax asset – 11% increase The increase was due to the adjustments on tax amortization related to concession loans. Investment in joint venture – 100% increase This pertains to the investment in Jindal Manila Water Development, a joint venture company established to serve as a vehicle for the development of water, wastewater and environmental services in India. Other non-current assets – 6% decrease The decrease was due to lower forex differentials as a result of the strength of the peso versus the US dollar. Accounts and other payables– 13% increase The increase was due to the higher volume of claims received during the year. Service concession obligation - current – 27% decrease The decrease was due to the payment of matured loans. Income tax payable – 11% increase The increase was due to higher taxable income. Payable to related parties – 18% decrease The decrease was due to the payment of accrued expenses recognized e in 2009 related to technical and administrative services agreement. Current portion of long term debt – 11% increase The increase was due to reclassification to current liabilities, portions of loans payable in one year. Service concession obligation – noncurrent – 12% increase This pertains to the drawdowns in 2010 for wastewater (MTSP) and Umiray Project. Pension liabilities – 15% increase The increase was due to the additional provision for the retirement fund based on latest actuarial study. Provision for real property taxes – 207% increase The increase was due to provision for real estate tax based on the notice of delinquency for properties in Bulacan and other municipalities. Other noncurrent liabilities – 51% increase This covers the amount deducted from contractor’s claims. Retention period is one year. 26 Subscription receivable – 7% decrease The decrease was due to the collection of subscription on common shares. Common stock options outstanding – 46% increase The increase was due to the adjustments of prior year’s entries on paid in capital. Retained earnings – 26% increase The increase pertains to the net income for the year net of dividends declared. Unrealized gain on available for sale financial asset – 176% increase The increase was due to the gain on the effective yield on debt securities (bonds & preferred shares) and other investment accounts. Cumulative translation adjustment – 100% increase This is the result of the exchange rate difference arising on the translation of Balance Sheet and Income Statement accounts of a subsidiary, Manila Water Asia Pacific Pte. Ltd. Non-controlling interest – 6% increase This represents the minority share in BIWC (20%) and LAWC (30%) in net income. Result of Operations (2009 vs. 2008) Operational Performance Over the past 12 years, the Company has improved the delivery of basic water services to its customers within the East Zone by uplifting the quality of its network and services to world class standards. With these efforts, the Company managed to maintain its service level to its customers despite its aggressive expansion and the impact of natural calamities such as the effect of Typhoon Ondoy last September 2009. Seventy-eight barangays in the East Zone were severely affected particularly Cainta, San Mateo, Pasig, Taytay, Marikina, Antipolo, Angono, Binangonan and some portions of Quezon City. Services to the majority of the affected customers were restored only after three days of round-the-clock operations. As a result of the Company’s improved level of service throughout the year, the Public Assessment of Water Services (PAWS) survey conducted by the MWSS Regulatory Office gave the Company an overall 100% “Very Good” rating from the customer’s evaluation. Another significant accomplishment for the year was the reduction in its level of system losses, as measured by its non-revenue water ratio (“NRW”). NRW was further reduced by 3.8 percentage points to 15.8% by the end of 2009, from 19.6% in 2008. This was attained largely through more efficient management of the network flows and pressure, as the water saved from the NRW reduction efforts was re-channeled towards the expansion areas in the Rizal province. At this current NRW level, Manila Water compares favorably with the water systems of its regional counterparts. The Company’s operational performance displayed positive results as water sales volume was sustained despite the challenges brought about by the global economic slowdown and the impact of the recent calamities. The volume of water sales for the year reached 396 million cubic meters (“mcm”), an increase of 2% or 8 mcm as compared to last year’s level of 387 mcm. The increase was brought about by new service connections that reached 52,410 for 2009, which largely came from the expansion areas in the Rizal towns. The Company served a total of 1,086,296 households through 736,305 water service connections as of December 31, 2009, as compared to last year’s level of 1,031,895 households and 683,894 water service connections. 27 With respect to water availability, approximately 99% of the Company’s customers, who are currently connected to the network, enjoy 24-hour water availability at a level of quality that exceeds the national standards for water quality. The Company has consistently complied with the Philippine National Standards for Drinking Water (PNSDW), and thus, has provided potable drinking water to its customers. Through the Company’s ISO accredited laboratory together with its technical capability, Manila Water has consistently delivered valid test results acceptable to regulating offices such as the Department of Health. As part of the 2008 Rate Rebasing and CA renewal commitment with MWSS, Manila Water focused on the implementation of its wastewater masterplan which increased sewer coverage within the East Zone. This entailed the construction of various sewerage and septage treatment facilities and the laying of new separate and combined drainage sewer lines. The total number of sewer connections increased to 50,800 in 2009. Sanitation services were also intensified which resulted in a total of 65,355 septic tanks desludged and benefited 291,469 households. In addition, the Company has remained 100% compliant with regulatory standards and parameters for wastewater effluent. The Company’s capital expenditures commitment for the year 2009 includes the implementation of major water system projects involving construction of facilities such as treatment plants, pumping stations, reservoirs and transmission pipelines. As a result, capital expenditures and concession fee payments for 2009 reached P5.3 billion. Aside from its wastewater expansion, the other capital investment projects were geared towards improving water services, ensuring the reliability of water supply, reducing water losses, maintaining water quality, implementing sustainable development programs and expansion projects in growth areas, in the Taguig and Rizal province. Significant developments were also realized in the Company’s key projects outside the East Zone. During the year, the Company was able to acquire concessions for two new businesses, Laguna Water Company (“LWC”) and Boracay Island Water Corporation (“BIWC”). LWC, a joint venture company with the Provincial Government of Laguna, has a 25-year water service concession for the municipalities of Cabuyao, Biñan and the City of Sta. Rosa. On the other hand, BIWC, a joint venture company between Philippine Tourism Authority, has a 25-year water and wastewater service concession for Boracay Island. Financial Performance The Company’s solid operational performance resulted in favorable financial results during the year. It posted a net income of P3,231 million for 2009, a 16% improvement compared to P2,788 million last year. The figure was also higher than plan for the year, as a result of lower effective income tax rates and lower depreciation expense resulting from the approval of the CA renewal. The aforementioned factors, together with the effective management of operating costs, sustained its net income growth. Total revenues for the year ended December 31, 2009 increased by P620 million or 7% to P9,533 million from P8,913 million in 2008. The increase in revenues is due to the 2% growth in water sales volume and the CPI increase in tariff implemented beginning February 2009. Core revenues (composed of water, environmental and sewer revenues) amounted to P9,442 million, 7% higher than the 2008 level. The Company registered around P24 million of revenues from its business outside of the East Zone, coming largely from its venture in Ho Chi Minh City, Vietnam. For the first time, the Company recognized around P20 million as its share in the water revenue from its Laguna venture. Total cost and expenses (before depreciation and amortization) amounted to P2,730 million in 2009, compared to P2,505 million in 2008. As a result of various cost management programs, the Company 28 realized significant savings in manpower, power and maintenance costs, effectively increasing its overall cost efficiency. These initiatives include the rehabilitation of the Company’s existing facilities, construction of new reservoirs, the laying of new pipes and application of new systems, processes and technologies. As a result, increase in operating cost was managed despite the expansion in water and wastewater services. Earnings before interests, taxes, depreciation and amortization (“EBITDA”) was recorded at P6,803 million in 2009, 6% higher than the 2008 level while EBITDA margin was maintained at 71% as a result of cost efficiency gains. Interest income amounted to P362 million in 2009, coming from investments in money market instruments. Interest expenses amounted to P812 million in 2009, 18% higher than the previous year’s levels, given the full year impact of the P4.0 billion bonds issued in late 2008. Total assets as of December 31, 2009 grew by P7,390 million to P43,758 million from the December 2008 level of P36,368 million. Growth in total assets was driven by the capital investments which focused on water and wastewater expansion and the capitalization of additional regulatory cost as a result of the CA renewal. Collection efficiency averaged 100% and accounts receivable days improved to 18. The improved collection performance was a result of the Company’s aggressive collection strategies, alongside the initiative to make bill payments more convenient to customers. By the end of 2009, total cash reserves (including short term cash investments and investments in marketable securities held as available-for-sale financial assets) amounted to P9,729 million. This was the result of improved collection efficiency and P2.1 billion proceeds from loan drawdowns. This cash balance is intended to finance the Company’s P10 billion capital investments in 2010. Current ratio for 2009 was computed at 1.69 times. Long-term debt in 2009 increased to P14,361 million. This includes the P4.0 billion peso bond and additional availments from loan facilities. As of end of 2009, around 47% of the Company’s total long term debts were denominated in Philippine currency, while the rest were denominated in either US dollars or Japanese yen. The Company has the right to recover foreign currency losses resulting from its foreign denominated loans that were used to finance its capital investments in the East Zone. Approximately 70% of the Company’s direct borrowings were fixed rate loans. Net bank debt-to-equity ratio was computed at 0.27 times. As of December 31, 2009, net cash flows from operating activities totaled P5,867 million. A total of P5,331 million was used to finance the Company’s capital investments and concession obligations. A total of P2,140 million in loan proceeds were received in 2009, while the Company also paid P720 million in maturing loan amortizations and interest payments. The Company also declared cash dividends amounting to P969 million, 9% higher than the prior year’s cash dividend payments. Material Changes (Increase or decrease of 5% or more in the financial statements) Income Statement Items (End-2009 vs. End-2008) Consolidated Revenues Water / Environmental revenues – 7% increase This was the combined effect of the 2% growth in water sales volume and the 6% increase in average tariff as a result of the CPI driven tariff increase implemented in February 2009. 29 Revenue from management contracts – 43% increase This was due to the 2009 progress billing corresponding to the formation of the several District Meter Areas under the Company’s Performance Based Leakage Reduction contract in Ho Chi Minh, Vietnam. Other income – 18% decrease This was due to the recognition of Meralco refund in 2008 on bills covering the period 1994-2003. Consolidated Operating costs and expenses Salaries, wages & employee benefits – 10% increase This was due to annual increases in basic pay, other employees’ benefits, performance based incentives and rewards. In addition, 41 new employees were hired during the year. Power, light and water – 8% increase This was due to additional consumption for new water and wastewater facilities. Total consumption increased by 6.5 million kwh or 9%, while effective cost per kilowatt hour (kwh) decreased by P0.16 or 3% compared with last year. Repairs and maintenance – 78% increase This was due to the increased maintenance cost because of the additional water and wastewater facilities commissioned during the year. Major repairs were also done on facilities affected by typhoons. Wastewater costs – 23% increase This was due to the 10% increase in unit cost per cubic meter desludged based on contract plus the 1% increase in volume of sludge materials. The cost also includes cost for disposal of biosolids and regular grit removal to keep the equipment and facilities in good working condition. Business meetings and representation – 28% increase This was due to the increase in activities in support of the various business expansion programs of the Company. Regulatory costs – 21% increase This was due to the annual CPI rate adjustment of Regulatory fees payable to MWSS as provided under the Concession Agreement. Taxes and licenses – 54% increase This was due to increase in local business taxes as a result of higher revenue base and real property taxes. Provision for probable losses– 87% decrease This was due to improvement in collection efficiency from 99% in 2008 to 100% which reduced the bad debts provision for the year. Occupancy – 46% increase This was due to increase in number and rate adjustments of security guards deployed in various facilities. Water treatment chemicals – 25% increase This was a result of additional requirements in chemicals due to the effect of typhoon “Ondoy”. Transportation and travel – 7% increase This was due to the assignment of more field personnel to attend to customer's concerns and monitor various expansion projects. 30 Insurance – 9% increase This was due to the increase in the value of insured assets. Advertising – 13% decrease This was a result of lower advertising expenses due to various public awareness campaign already conducted on various programs such as environmental and other expansion projects. Premium on performance bond – 21% increase This was due to the posting of additional performance bonds as required in the bidding procedures and acquisition for new projects. Others – 24% decrease This was due to lower litigation cost and other overhead expenses. Other Income (Expenses) Interest income – 77% increase This was due to additional placements in money market investments as a result of improved collection. Amortization of deferred credits – 86% decrease This was due to the refund of meter deposit to the customers starting 2008. Interest expense – 18% increase This was due to additional drawdown from the Manila Third Sewerage Project facility. Mark-to-market gain (loss) on derivatives – 308% decrease This was due to the decline in the fair market value of the embedded call option related to the P4 billion peso bonds. Consolidated Balance Sheet Items (End-2009 vs. End-2008) Current assets Short-term cash investments – 11% increase This was due to additional placements in short term money market. Receivables – 14% decrease This was due to improved collection efficiency and lower provision for bad debts. Materials and supplies – 1235% increase This was due to additional acquisitions of materials for the projects outside the East Zone. Other current assets – 33% increase This was due to increase in mobilization cost and materials issued in advance to contractors for various projects. Non-current assets Property and equipment – 36% increase This was due to additional capitalization of completed projects. 31 Service concession assets – 26% increase This was due to the capitalization of additional regulatory costs as a result of the Concession Agreement Renewal which extends the concession period from 2022 to 2037. Deferred income tax assets – 13% increase This was due to recognition of deferred tax assets related to service concession assets. Available-for-sale financial assets – 27% increase This was due to additional placements in securities. Other noncurrent assets – 13% decrease This was due to the decline in the bond call option value and FCDA adjustment. Current liabilities Accounts and other payables – 9% increase This was due to additional obligations to suppliers and contractors as a result of expansion activities. Current portion of long-term debt – 133% increase This was due to the payment of the current portion of Manila Third Sewerage Project and European Investment Bank loans. Current portion of service concession obligation – 94% increase This was due to increase in regulatory fee as a result of the approval of the Concession Agreement Renewal. Income tax payable – 48% decrease This was due to reversal of deferred tax item recognized in 2008. Noncurrent Liabilities Service concession obligation - net of current portion – 83% increase This was due to increase in regulatory fee as a result of the approval of the Concession Agreement Renewal. Customers’ guaranty and other deposits – 25% increase This was due to payment of guaranty deposits of new customers. Pension liabilities – 76% increase This was due to additional allocation for retirement fund as a result of an updated actuarial computation. Deferred credits – 25% increase This represents advances from principal for Performance-Based Leakage Reduction contract in Ho Chi Minh Vietnam. Stockholders’ equity Subscription receivable – 26% increase This was due to additional grant in 2009. 32 Common stock options outstanding – 197% increase This was due to the additional approval and issuances of Employee Stock Ownership Plan. Retained earnings – 25% This represents net income for the year net of dividends declared. Unrealized gain on available-for-sale – 688% increase This was mainly due to the increase in market value of available-for-sale financial assets. Risks Disclosure Socio-political and Regulatory Risk Manila Water, being a water utility under concession from the Metropolitan Waterworks and Sewerage System (MWSS), operates in a highly-regulated business environment. The Company has to obtain all necessary regulatory approvals in order to implement its projects. Possible challenges by other government entities in new business initiatives have to be properly managed. Failure of the Company to address regulatory uncertainty and recognize adverse conditions brought about by political and social forces within the areas it operates in may restrict market opportunities, hamper and devalue investments and negatively affect returns on existing assets. The Company must ensure that all service obligations under the Concession Agreement and that all rate rebasing targets are met. Failure to meet obligations, requirements and terms called for by the Concession Agreement with MWSS may result to payment of fines/penalties, claw back in tariff rates, damage in reputation, and termination of the Concession Agreement. Capital Investment Risk The Company is bound under the Concession Agreement to comply with certain service obligations and is required to meet numerous performance and business efficiency targets. Achieving these performance targets will require substantial capital investment in expansion and service improvement projects. Failure to properly plan, manage, execute and monitor projects may lead to increase in project life cycle and project costs. Disbursements in connection with capital investment projects must not only yield acceptable returns, but must be aligned with the regulatory plan. Water Supply Risk Water distribution, which is the heart of Manila Water’s operations, is primarily dependent on the availability and sustainability of water supply. Failure to ensure adequacy and security of its water supply by developing alternative water sources and failure maintain the reliability water supply facilities will lead to water shortage and below standard water releases to the distribution network. Incidents and Natural Events Environmental disasters such as earthquakes, floods and typhoons could result in significant losses as water, wastewater, offices and other facilities may be severely damaged which could ultimately lead to extended water service interruptions could result in significant losses to the Company. Natural events, such as prolonged drought, and other incidents affecting water supply facilities could result in water supply shortage, which would limit the ability of the Company to meet customer demand for potable water. 33 New Business Risk The Company continues to expand to other provinces in the Philippines and to neighboring Asian countries. It now operates in new territories which have business environments totally different from that of the East Zone concession area. Opportunities for providing services other than its core competencies are now being explored more extensively. The Company must be able to establish appropriate structures that would allow for the effective integration of its new businesses. Failure to form synergistic alliances and to effectively manage relationship with partners may result in service failures and damage to the Company’s reputation. Talent Management Risk The expansion initiatives of the Company also translate to an increased demand for a competent workforce readily available for deployment to its prospective new businesses. Failure to create and implement a strategic and integrated talent management program that attracts, identifies, assesses, develops and retains key talents could adversely affect the Company’s ability to meet current and future business needs and expansion objectives. The Company must also maintain the right mix and number of talents necessary to sustain its operations within and outside the East Zone. Failure to determine and maintain the right manpower size will decrease efficiency and productivity. Management of Risks Enterprise Risk Management Manila Water has embarked on an Enterprise Risk Management (“ERM”) program to effectively manage risks through a standard and informed decision-making mechanism and by employing a common risk culture and language understood by every individual within the organization. The Risk Management Department (“RMD”) headed by the Chief Risk Officer (“CRO”), acts as specialists and consultants on matters relating to ERM and is responsible for coordinating the various ERM initiatives across the organization. As ERM is an enterprise-wide endeavor, a risk management oversight structure was formed which defined the place and role of each employee in the ERM process. The Board of Directors, supported by the Audit and Governance Committee, performs an oversight role of the ERM initiative. The Risk Management Executive Committee (RMEC) is at the forefront of this initiative and oversees the implementation of the ERM program. It is composed of the President, the CRO and the Group Directors for Corporate Resources, Finance, Project Delivery, Operations, and Regulatory Compliance as well as the Director for East Zone Business Operations. The President is the comprehensive risk executive and leads the process of managing the risks while the CRO champions the ERM framework across the entire organization. The Company uses a risk-based approach to planning and has institutionalized a holistic and unified planning process. Top management first defines the overall business strategy and direction for the organization. The strategic plan is then broken down into specific, short term action and plans at the functional unit level. Detailed execution plans are then formulated and individual employee targets are set. 34 Managing Top Corporate Risks The Company ensures that all requirements of regulatory bodies are complied with. Internal compliance targets like water and wastewater effluent quality are purposely set higher than regulatory standards. These performance metrics are regularly monitored and reported to the RMEC and the Audit and Governance Committee of the Board of Directors. To maintain the excellent relationship with its Regulators, the Company conducts regular huddles to update them on various company matters. The Company ensures that the Regulators are on a “first-toknow” basis with regard to significant corporate developments and supports the various advocacies which are consistent with Manila Water’s goals and objectives. The Company also ensures that they are educated on Company’s operations through regular site visits and invitations to events, workshops and capacity-enhancing local and international fora. To ensure the timely and quality execution of projects, the Company strengthened its project management team with the hiring of additional project managers and the engagement of project management consultants. Management of big-ticket water and wastewater projects will be further enhanced with the designation of quality surveyors as site officers. These specialists are oriented and trained accordingly to enhance their roles as project owners and are made fully-accountable for the success of the projects assigned to them. The Company continues to strengthen the project screening system to ensure the technical viability and profitability of every project. Project challenging guidelines have been developed to ensure that all projects are appropriately assessed and evaluated from a technical, financial, and regulatory perspective. The Company continues to expand its pool of quality contractors to accommodate the additional project workload as mandated by the Regulator’s capital expenditure requirements. The Company has developed a comprehensive vendor management program with the end in view of developing sustainable partnership with the best contractors and vendors within and outside the Philippines. Operational risks continue to be effectively addressed by the Company’s Business Continuity and Incident Management and Response Teams. Mobile treatment plants, additional water tankers and other such water distribution facilities in case of incidents and emergencies have been acquired and are strategically distributed within the concession area for ease of use and access when needed. Improvements in information and communication technology management and infrastructure have been made to mitigate the impact of incidents in the Company’s operations. In addition to its strong Business Continuity Plan, Manila Water recognizes the impact of climate change in its current and future operations and has drawn-up a Climate Change Adaptation Plan. This enhances the Company’s readiness to respond to possible effects of climate change and take advantage of the resulting opportunities. Manila Water encounters challenges in water supply such as dry spells and changes in water flow patterns and quality. The Company has prepared for the El Niño phenomenon in 2010 with its Drought Management Plan to ensure continuous water service. Non-revenue water projects are being fast-tracked to curb physical and commercial losses and recover water which can be re-allocated to areas with higher demand. Supply and pressure management measures are also being undertaken in order to maintain the 24/7 water delivery service to its more than six million customers. To augment water supply, standby deep wells are being activated, supplementary water sources such as those in reservoirs are being identified and La Mesa Dam operations are being optimized. New water sources that will produce additional supply in the medium term (one to two years) are also currently being developed. This is part 35 of the Water Supply Master Plan that the company has developed to ensure the reliability and adequacy of water supply and mitigate the risks brought about by climate change. Manila Water has developed a new business master plan that provides a long-term growth roadmap. To support this masterplan, the company continues to enhance its business development capability with the formulation of a more comprehensive risk-based project viability screening criteria and scorecard. This becomes critical as Manila Water accelerates its business development efforts domestically and internationally. The Company continues to strengthen its workforce by implementing an integrated talent management program to attract, develop and retain talents to meet current and future business needs and objectives. Training programs on areas such as general management, non-revenue reduction, finance, and project management have been developed in partnership with top business schools in the country and internationally-recognized experts and consultants. Contractual Obligations and Commercial Commitments The following table summarizes the Company’s significant contractual obligations and commercial commitments that affect the Company’s liquidity as of December 31, 2010: Contractual Obligations: Long-term debt, including current portion Domestic Foreign Concession Fees Capital Expenditure Commitments Total Contractual Obligations 2011 (Peso millions) Payments due by period 2012-2013 2014-2015 Total 27.0 1,059.72 2,473.0 1,012.0 0 1,177.5 2,500.0 3,249.22 743.0 3,074.0 4,676.00 8,493.0 14,564.0 21,016.0 22,661.0 58,241.0 16,393.7 27,575.0 28,514.5 72,483.2 Under the CA, the Company is required to post a performance bond, bank guarantee or other security acceptable to MWSS amounting to US$60 million in favor of MWSS as a bond for the full and prompt performance of the Company’s obligation under the CA. A new standby letter of credit (in compliance with the 2011 performance bond) was issued by China Banking Corporation for the full amount of US$60 million prior to the expiry of the 2010 performance bond in December 31, 2010. There are no known trends, events or uncertainties that may have a material effect on sales, significant elements of income or loss from continuing operations and seasonal aspects that may have a material effect on the financial statements. II. Market Price of and Dividends on the registrant’s Common Equity On March 18, 2005, the company was listed in the Philippine Stock Exchange and its listed shares have since been actively traded therein. The high and low sale prices for each quarter that the Company’s shares have been listed are as follows: 36 1st Qtr 2nd Qtr 3rd Qtr 4th Qtr HIGH / LOW PRICE 2010 2009 High Low High Low 15.75 14.75 19.25 16.00 16.75 14.75 18.50 17.50 19.12 16.25 18.25 15.75 19.70 18.16 16.75 11.25 The price information as of the close of the latest practicable trading date, March 3, 2011, is 17.38. Dividends Subject to the preferential dividend rights of the participating preferred shares (“PPS”), each holder of a share of stock is entitled to such dividends as may be declared in accordance with the Company’s dividend policy. Under the Company’s cash dividend policy, common shares shall be entitled to annual cash dividends equivalent to 35% of the prior year’s net income, payable semi-annually in May and October. The Company’s Board may change the cash dividend policy at any time. The Company’s Board is authorized to declare cash dividends. A cash dividend declaration does not require any further approval from the stockholders. A stock dividend declaration requires the further approval of stockholders representing not less than two-thirds (2/3) of the Company’s outstanding capital stock. The Corporation Code defines the term “outstanding capital stock” to mean the “total shares of stock issued”, regardless of nomenclature, classification or voting rights, except treasury shares. Such stockholders’ approval may be given at a general or special meeting duly called for the purpose. Dividends may be declared only from unrestricted retained earnings. Some of the Company’s loan agreements carry covenants that restrict declaration of payments of dividends under certain circumstances, such as in the event of default or if payment would cause an event of default, if certain financial ratios are not met or if payment would cause them not to be met, requiring revenues of the Company to be applied toward certain expenses prior to the payment of dividends, and other circumstances. Within the last two years, the Company has declared the following dividends: Date Amount Nature of Dividends Declared (P thousands) Nov-10 40,000 10% cash dividends to PPS Jul-10 92,000 P0.023 cash dividends to PPS Jul-10 409,965 Apr-10 92,000 Apr-10 408,431 Dec-09 40,000 10% cash dividends to PPS Oct-09 80,000 P0.02 cash dividends to PPS Oct-09 406,181 Apr-09 80,000 Apr-09 404,621 P0.23 cash dividends to common shares P0.023 cash dividends to PPS P0.23 cash dividends to common shares P0.20 cash dividends to common shares P0.02 cash dividends to PPS P0.20 cash dividends to common shares 37 Holders There are approximately 948 holders of common shares of the Company as of the latest practicable date January 31, 2011. The following are the top 20 holders of the common shares of the Company as of January 31, 2011: Rank 1 2 3 4 5 6 7 8 9 10 11 12 13 14 15 16 17 18 19 20 Stockholder Name PCD Nominee Corporation (Filipino and Non-Filipino*) Ayala Corporation Mitsubishi Corporation ESOWN Administrator 2005 ** ESOWN Administration 2006 ** ESOWN Administration 2009 ** ESOWN Administration 2008 ** Ruel T. Maranan (As MWCI ESOP Administrator) Ernesto O. Chua Chiaco and/or Margaret Sy Chua Chiaco ESOWN Administrator 2007 ** Ernesto Chua Chiaco Genevieve Sy Chuachiaco Lozano A. Tan Margaret Sy Chua Chiaco Ernesson Sy Chua Chiaco Magdaleno B. Albarracin and/or Trinidad Albarracin Foresight Realty & Development Corporation Constantino Chua and/or Willington and/or George Wy Chua Alfredo Henares Administrator 2006 Esown II No. of Common Shares 1,144,203,289 651,912,996 168,999,999 13,110,000 8,245,001 7,629,025 6,154,483 4,644,924 2,240,000 1,464,999 1,200,000 1,031,500 800,000 720,000 709,000 705,000 618,000 500,000 400,000 398,499 Percentage (of Common Shares) 56.286% 32.069% 8.314% 0.645% 0.406% 0.375% 0.303% 0.228% 0.110% 0.072% 0.059% 0.051% 0.039% 0.035% 0.035% 0.035% 0.030% 0.025% 0.020% 0.020% * PCD Nominee Corporation includes the shares of International Finance Corporation and First State Investment Management. ** This includes shares granted under the ESOWN. Philwater Holdings Company, Inc. owns 3,999,999,997 preferred shares of the Company. The three preferred shares are nominee shares of John Eric T. Francia, Thomas Keevil and Simon Gardiner. Recent Sale of Unregistered Securities Date Security Sold No. of Shares Purchaser Consideration Feb. 1999 Common Shares 104,443,965 ESOP Shareholders P1.00 par April 2004 RPS 310,344,828 Ayala P1.00 par April 2004 RPS 68,965,517 BPI Capital P1.00 par April 2004 RPS 120,689,655 United Utilities P1.00 par Aug. 2004 Common Shares 176,400,000 IFC P4.75 per share 38 The foregoing table sets out details of the issuance of new shares from 1999 up to December 31, 2004. Under existing regulations, the original issuance, an issuance to existing shareholders, and issuance pursuant to a private placement are exempt from the registration requirement for the sale of securities. On June 11, 2001, the SEC approved the exemption from registration of the proposed issuance of 120 million common shares to the Company’s qualified employees pursuant to the ESOP under Section 10.2 of the Securities Regulation Code. For its grant of 23.6 million shares under the Executive SOP, Manila Water sought the SEC’s confirmation that such issuance is exempt from the registration requirements of the Securities Regulation Code. In a resolution dated March 3, 2005, the SEC granted Manila Water’s application for confirmation. On January 31, 2006, the SEC approved the registration exemption of the Company’s proposed issuance of 25 million common shares under its ESOWN Plan. III. Compliance with Leading Practices on Corporate Governance Manila Water’s corporate governance practices are anchored on its Corporate Governance Manual (the “Manual”), which supplements the Articles of Incorporation and By-Laws of the Company. The Manual was first adopted on May 3, 2004 pursuant to SEC Memorandum Circular No. 2, Series of 2002. It was first amended in November 2007 and was later amended in April 2010 to comply with the SEC Memorandum Circular No. 6, Series of 2009. There has been no deviation from the Manual since its adoption. In a certification submitted to the SEC on January 13, 2011, the Company’s Compliance Officer, Luis Juan B. Oreta, stated that Manila Water adopted in the Manual the leading practices and principles on good corporate governance and the Company has fully complied with all the requirements of the Manual for the year 2010, including the requirements in relation to the board of directors, board committees, officers and stockholders’ rights and interests. The revised Manual strengthened protection to shareholders, particularly the minority, through the inclusion of additional provisions on transparency on business operations; communication of important information from management to the Board and from the Board to the shareholders; disclosures on and evaluation of directors’ and management’s performance; qualifications and disqualifications of directors; participation of independent directors in all meetings of the Board; and full and consistent compliance with financial, legal and regulatory requirements. Manila Water also enhanced its website and annual reports in line with its thrust of transparency of information and prompt and complete disclosure of all material facts relating to its business. To better focus on improving corporate governance across the organization, Manila Water has reorganized its Compliance and Governance Section and formed a Corporate Governance Office (the “Office”). The Office formulates and implements initiatives and policies on corporate governance. It reports to the Audit and Governance Committee which performs oversight functions over Manila Water’s corporate governance system. Manila Water continues to implement its established corporate governance practices. Among these is the Insider Trading Policy, which prohibits directors, officers and confidential employees from trading in Manila Water shares within a certain period before and after the release of material information to the public. In addition, another policy that has been in continuous effect is the policy on acceptance of 39 corporate entertainment/gifts. This policy prohibits all officers and employees from accepting corporate entertainment/gifts from suppliers, contractors and other business partners, which can be viewed as influencing the manner on which an officer or employee may discharge his duties. The Company’s guidelines specifying conflict of interest situations involving all employees and their relatives up to the fourth degree of consanguinity and/or affinity, including common law relationships, have been strengthened. All such existing contracts/arrangements by employees and their relatives were required to be terminated immediately and correspondingly reported to the line manager and the Office of the Compliance Officer, as required under the Code. Any exception to the guidelines must be approved by the President and the Audit Committee. Other policies of the Company that has been in continuous and effective implementation are the: (i) policy on reporting of fraudulent or dishonest acts and (ii) internal control systems which includes the Company’s Capital Expenditures and Investments Committee that oversees bidding systems and grants approvals for capital expenditures. As the Company continues to embark on expansion projects locally and internationally, the Company saw a need to create a Risk Management Department (RMD) to be in charge of identifying major risks in the company’s business operations and development projects. The Company launched the Enterprise Risk Management (ERM) Project, taking the existing risk management process to a higher level and developing a common risk language and framework that is easily understandable. The ERM is a way of managing risk and uncertainty in the new economy. It aligns the Company’s strategy, processes, people, technology and knowledge to meet its risk management purpose and achieve its objectives. The Company aims to make ERM a way of life where managing risks becomes the responsibility of everyone in the organization with end view of increasing shareholder value and enhancing the already effective risk management programs of the Company. The Chief Risk Officer (CRO) was appointed to head the RMD and champion the ERM Framework across the entire organization. As a validation of its corporate governance initiatives, the Company was cited again by the Corporate Governance Asia in its Annual Recognition Awards as one of the best in Corporate Governance in the Philippines. Furthermore, the Company again received its second Gold Award from the Institute of Corporate Directors (ICD) in its Corporate Governance Scorecard Project. For the fourth straight year, Manila Water has been recognized by the ICD as one of the Philippine’s best in Corporate Governance practices. These citations affirm the Company’s commitment to observing the highest standards of corporate governance and motivate the Company to further improve its current platform of governance. IV. Sustainable Development Projects Manila Water takes pride in the fact that it embodies what genuine CSR is – that social, environmental and economic objectives are perfectly aligned with business goals and integrated in day-to-day operations. As such, it is recognized as one of the CSR leaders and pioneers in the Philippines. Water Supply Provision to the Urban Poor Manila Water sees the importance of making potable water available to everyone, especially the urban poor, as it is a basic human right. The ‘Tubig Para Sa Barangay’ (“TPSB”) or Water for the Community program was set up in 1998 to help build communities by way of improving the quality of their life. 40 Through the TPSB program, around 1.7 million people now enjoy 24-hour supply of clean, safe-to-drink and affordable water, as well as improved overall health and sanitation conditions. Manila Water also undertakes ‘Lingap’ programs to improve water supply and sanitation facilities in public service institutions such as schools, hospitals, city jails, markets and orphanages which serve largely poor families. The Company has rehabilitated the water reticulation system and installed wash facilities and drinking fountains in over 300 institutions. Water Education Manila Water’s ‘Lakbayan’ or Water Trail program aims to promote stakeholder awareness on the value of water and the need for wise use of water and proper wastewater management. For better understanding and deeper appreciation of the intricacies of treating and delivering potable water and wastewater services, stakeholders are exposed to the entire water cycle – from the raw water source, the treatment process and distribution, up to the wastewater treatment process. As of 2010, more than 500 groups composed of around 18,000 individuals from communities, local and national government offices, schools, non-government organizations, private companies and other special groups have participated in the ‘Lakbayan’ program. Environmental Protection Manila Water has taken a more active stance in protecting the environment. In fact, the Company has embedded important environmental initiatives in every level of the water supply cycle to ensure sustainability and reliability of services to customers. After ratifying a formal Climate Change Policy in late 2007, Manila Water began quantifying its baseline carbon footprint and monitoring its impact on the environment as basis for improving its environmental performance. The Company also intensified its sewerage programs by building sewer systems that link to the existing municipal drainage network and wastewater treatment facilities to alleviate pollution in Metro Manila’s major river systems. Lastly, in response to the challenges posed by climate change, Manila Water has been implementing climate adaptation and mitigation programs which include climate proofing facilities and reforestation activities. Upon the written request of the stockholders, the Company undertakes to furnish said stockholders with a copy of SEC Form 17-A free of charge. Any written request for a copy of SEC Form 17-A shall be addressed to the following: Manila Water Company, Inc. MWSS Administration Building, 489 Katipunan Road, 1105 Balara, Quezon City, Philippines Attention: Luis Juan B. Oreta Compliance Officer 41 NATURE AND SCOPE OF BUSINESS Manila Water Company, Inc. (the “Company”) is a Philippine company holding exclusive rights to provide water delivery and sewerage and sanitation services under the terms of a 25-year Concession Agreement to more than six million people in the East Zone (the “East Zone”), comprising a broad range of residential, commercial and industrial customers. Under the terms of the Concession Agreement entered into on February 21, 1997 (the “Concession Agreement”) with the Metropolitan Waterworks and Sewerage System (“MWSS”), a government-owned and controlled corporation, the Company was granted exclusive rights to service the East Zone as an agent and contractor of MWSS. Under the Concession Agreement, MWSS granted the Company the use of MWSS’s land and operational fixed assets and the exclusive right, as agent of MWSS, to produce and treat raw water, distribute and market water, and collect, transport, treat, dispose and eventually re-utilize wastewater, including reusable industrial effluent discharged by the sewerage system for the East Zone. On October 19, 2009, the Company’s application for the 15-year extension of the Concession Agreement was acknowledged and approved by the Department of Finance following the special authority granted by the Office of the President. With the extension, the Concession Agreement was extended for 15 years or up to 2037. The Company is entitled to recover its operating, capital maintenance and investment expenditures, business taxes, and Concession Fee payments, and to earn a rate of return on these expenditures for the remaining term of the Concession or until 2037. The East Zone encompasses 23 cities and municipalities that include major business districts and residential areas in the eastern part of Metro Manila and the adjacent Rizal Province. As of December 31, 2010, the Company supplied 466.9 million cubic meters of water through approximately 1,157,807 household connections. The Company also manages and operates the sewerage system that covers a portion of its service area, as well as provides sanitation services (including desludging of septic tanks) to its customers in the East Zone. Manila Water continues to grow the business by expanding its operations outside of east zone. Through joint venture partnerships, the Company has acquired new concessions to provide water and wastewater services to certain areas in Laguna and to operate, manage and expand existing facilities in Boracay. The Company has also entered a contract for leakage reduction in Vietnam. These opportunities for new business development are seen to help establish the company’s mark in the region and intensify its presence in the field of water and wastewater services. 42 SyCip Go rres Velayo & Co. 6760 Ayala Avenue 1226 Makati City Philippines Phone: (632) 891 0307 Fax: (632) 819 0872 www.sgv.com.ph BOA/PRC Reg. No. 0001 SEC Accreditation No. 0012-FR-2 INDEPENDENT AUDITORS’ REPORT The Stockholders and the Board of Directors Manila Water Company, Inc. MWSS Building, Katipunan Road Balara, Quezon City We have audited the accompanying consolidated financial statements of Manila Water Company, Inc. and Subsidiaries, which comprise the consolidated statements of financial position as at December 31, 2010 and 2009, and the consolidated statements of comprehensive income, consolidated statements of changes in equity and consolidated statements of cash flows for each of the three years in the period ended December 31, 2010, and a summary of significant accounting policies and other explanatory information. Management’s Responsibility for the Consolidated Financial Statements Management is responsible for the preparation and fair presentation of these consolidated financial statements in accordance with Philippine Financial Reporting Standards and for such internal control as management determines is necessary to enable the preparation and fair presentation of financial statements that are free from material misstatement, whether due to fraud or error. Auditors’ Responsibility Our responsibility is to express an opinion on these consolidated financial statements based on our audits. We conducted our audits in accordance with Philippine Standards on Auditing. Those standards require that we comply with ethical requirements and plan and perform the audit to obtain reasonable assurance whether the financial statements are free from material misstatement. An audit involves performing procedures to obtain audit evidence about the amounts and disclosures in the financial statements. The procedures selected depend on the auditors’ judgment, including the assessment of the risks of material misstatement of the financial statements, whether due to fraud or error. In making those risk assessments, the auditors consider internal control relevant to the entity’s preparation and fair presentation of the financial statements in order to design audit procedures that are appropriate in the circumstances, but not for the purpose of expressing an opinion on the effectiveness of the entity’s internal control. An audit also includes evaluating the appropriateness of accounting policies used and the reasonableness of accounting estimates made by management, as well as evaluating the overall presentation of the financial statements. We believe that the audit evidence we have obtained is sufficient and appropriate to provide a basis for our audit opinion. *SGVMC115490* A member firm of Ernst & Young Global Limited MANILA WATER COMPANY, INC. AND SUBSIDIARIES CONSOLIDATED STATEMENTS OF FINANCIAL POSITION December 31 2009 2010 ASSETS Current Assets Cash and cash equivalents (Notes 5, 27 and 28) Short-term cash investments (Notes 5, 27 and 28) Receivables - net (Notes 6, 22, 27 and 28) Materials and supplies - at cost (Notes 4 and 7) Other current assets - net (Notes 4 and 8) Total Current Assets Noncurrent Assets Property and equipment - net (Notes 4 and 9) Service concession assets - net (Notes 1, 4 and 10) Available-for-sale financial assets (Notes 11, 22, 27 and 28) Deferred tax assets - net (Note 19) Investment in joint venture (Note 12) Other noncurrent assets (Notes 4, 13 and 28) Total Noncurrent Assets P =2,412,912,264 1,546,339,222 482,167,844 55,823,998 1,402,320,273 5,899,563,601 =4,037,840,706 P 3,724,421,813 508,871,992 38,434,722 868,364,086 9,177,933,319 1,973,297,808 37,459,957,906 1,848,906,109 411,120,686 5,594,615 1,022,247,141 42,721,124,265 P =48,620,687,866 1,205,317,790 29,946,479,486 1,967,127,526 371,050,184 – 1,090,498,897 34,580,473,883 =43,758,407,202 P P =3,147,896,362 =2,778,902,721 P 1,174,649,296 794,473,159 213,695,320 91,167,384 5,421,881,521 1,060,783,617 1,081,580,082 191,725,176 111,467,535 5,224,459,131 12,959,221,421 13,300,366,623 7,162,115,857 231,369,344 622,150,307 2,245,972,983 23,220,829,912 28,642,711,433 6,368,081,712 201,418,504 202,439,983 1,490,915,007 21,563,221,829 26,787,680,960 LIABILITIES AND EQUITY Current Liabilities Accounts and other payables (Notes 4, 14, 27 and 28) Current portion of: Long-term debt (Notes 15, 27 and 28) Service concession obligation (Notes 10 and 28) Income tax payable (Notes 4 and 19) Payables to related parties (Notes 22, 27 and 28) Total Current Liabilities Noncurrent Liabilities Long-term debt - net of current portion (Notes 15, 27 and 27) Service concession obligation - net of current portion (Notes 1, 10 and 28) Pension liabilities (Notes 4 and 16) Provision for real property taxes (Note 30) Other noncurrent liabilities (Note 17) Total Noncurrent Liabilities Total Liabilities (Forward) *SGVMC115490* -2December 31 2009 2010 Equity Attributable to equity holders of Manila Water Company, Inc. Capital stock (Note 20) Common stock Preferred stock Additional paid-in capital Subscriptions receivable Total paid-up capital Common stock options outstanding (Note 20) Retained earnings Appropriated for capital expenditures (Note 20) Unappropriated Unrealized gain on available-for-sale financial assets (Notes 11 and 28) Cumulative translation adjustment (Note 2) Treasury shares - at cost (Notes 1 and 20) Noncontrolling interests (Notes 1 and 4) Total Equity P =2,032,597,818 900,000,000 2,932,597,818 3,513,056,977 (127,073,513) 6,318,581,282 32,274,862 =2,030,677,818 P 900,000,000 2,930,677,818 3,451,156,783 (136,053,636) 6,245,780,965 22,109,614 7,000,000,000 6,816,792,179 13,816,792,179 7,000,000,000 3,996,463,265 10,996,463,265 52,548,379 144,929,822 – 2,650,312 17,316,902,223 20,315,228,457 (500,000,000) (500,000,000) 16,816,902,223 19,815,228,457 153,824,019 162,747,976 16,970,726,242 19,977,976,433 P43,758,407,202 P =48,620,687,866 = See accompanying Notes to Consolidated Financial Statements. *SGVMC115490* MANILA WATER COMPANY, INC. AND SUBSIDIARIES CONSOLIDATED STATEMENTS OF COMPREHENSIVE INCOME 2010 REVENUE Water (Note 22) East Zone Outside East Zone Environmental charges (Note 22) Sewer (Note 22) East Zone Outside East Zone Revenue from management contracts (Note 23) Other income (Note 18) COSTS AND EXPENSES Depreciation and amortization (Notes 9 and 10) Salaries, wages and employee benefits (Notes 16, 20 and 22) Power, light and water Provision for probable losses (Notes 6,8 and 30) Management, technical and professional fees (Note 22) Repairs and maintenance Collection fees Taxes and licenses Business meetings and representation Cost associated from contracts outside east zone Wastewater costs Transportation and travel Occupancy costs (Note 25) Water treatment chemicals Insurance Postage, telephone and supplies Advertising Regulatory costs (Notes 1 and 22) Premium on performance bond (Note 29) Other expenses INCOME BEFORE OTHER INCOME (EXPENSES) OTHER INCOME (EXPENSES) Revenue from rehabilitation works Cost of rehabilitation works Foreign currency differentials (Note 1) Foreign exchange gains (losses) Interest income (Notes 11 and 18) Amortization of deferred credits (Note 17) Interest expense (Notes 15 and 18) Mark-to-market gain (loss) on derivatives (Notes 13 and 27) Equity share in net loss of joint venture (Note 12) Gain (loss) on disposal of property and equipment Reversal of accruals INCOME BEFORE INCOME TAX PROVISION FOR INCOME TAX (Note 19) NET INCOME OTHER COMPREHENSIVE INCOME Unrealized gain on available-for-sale financial assets (Note 11) Cumulative translation adjustment (Note 2) TOTAL COMPREHENSIVE INCOME Years Ended December 31 2009 2008 P =8,856,588,547 185,284,621 1,399,482,783 =8,044,609,483 P 19,992,737 980,168,610 =7,540,086,522 P – 889,922,526 313,828,128 25,601,603 74,910,083 157,689,739 11,013,385,504 396,848,889 – 23,709,284 67,228,294 9,532,557,297 384,836,308 – 16,523,679 82,209,696 8,913,578,731 1,471,895,682 1,091,554,397 626,575,245 384,563,471 278,394,974 228,647,338 114,220,170 112,399,070 106,628,536 106,280,409 86,788,481 85,744,619 84,072,991 64,930,556 36,403,569 28,218,484 16,261,843 13,456,580 8,316,000 56,978,798 5,002,331,213 6,011,054,291 1,956,339,628 1,024,639,562 482,434,061 14,467,432 255,132,073 152,896,910 103,117,802 95,211,129 100,160,652 – 104,613,326 60,212,698 68,855,092 67,264,658 29,891,360 27,551,847 15,408,136 98,278,386 8,637,216 21,215,486 4,686,327,454 4,846,229,843 1,890,509,326 934,554,765 447,934,228 115,719,486 250,810,129 86,101,941 99,293,367 61,844,785 78,444,510 – 84,983,177 56,263,761 47,002,897 53,804,074 27,478,356 27,105,710 17,654,899 81,035,813 7,137,869 27,896,066 4,395,575,159 4,518,003,572 7,034,342,878 (7,024,816,548) (22,356,653) (9,758,180) 288,006,062 14,717,961 (1,188,454,244) 70,795,501 (1,538,567) (7,050,915) 69,117,660 (776,995,045) 5,234,059,246 1,246,589,396 3,987,469,850 4,173,327,870 (4,171,750,859) (361,884,765) 269,451,776 361,970,533 29,337,629 (811,520,800) (99,586,433) – (44,504) – (610,699,553) 4,235,530,290 1,005,011,154 3,230,519,136 3,051,228,506 (3,051,228,506) 1,424,380,822 (1,452,035,855) 204,888,655 202,903,685 (689,266,684) 47,847,293 – 11,364 – (261,270,720) 4,256,732,852 1,468,665,210 2,788,067,642 92,381,443 2,650,312 P =4,082,501,605 45,878,236 – =3,276,397,372 P 1,959,975 – =2,790,027,617 P (Forward) *SGVMC115490* -2- 2010 Net Income Attributable to: Equity holders of Manila Water Company, Inc. Noncontrolling interests (Notes 1 and 4) Total Comprehensive Income Attributable to: Equity holders of Manila Water Company, Inc. Noncontrolling interests (Notes 1 and 4) Earnings Per Share (Note 21) Basic Diluted Years Ended December 31 2009 2008 P = 3,978,545,893 8,923,957 P = 3,987,469,850 =3,231,413,126 P (893,990) =3,230,519,136 P =2,788,020,190 P 47,452 =2,788,067,642 P P = 4,073,577,648 8,923,957 P = 4,082,501,605 =3,277,291,362 P (893,990) =3,276,397,372 P =2,789,980,165 P 47,452 =2,790,027,617 P P = 1.85 P = 1.85 P1.31 = =1.31 P P1.13 = =1.13 P See accompanying Notes to Consolidated Financial Statements. *SGVMC115490* MANILA WATER COMPANY, INC. AND SUBSIDIARIES CONSOLIDATED STATEMENTS OF CHANGES IN EQUITY 2010 Years Ended December 31 2009 2008 ATTRIBUTABLE TO EQUITY HOLDERS OF MANILA WATER COMPANY, INC. CAPITAL STOCK (Note 20) Common stock - P =1 par value Authorized - 3,100,000,000 shares Issued and outstanding - 2,005,443,965 shares Subscribed common stock - 27,153,853 shares in 2010, 25,233,853 shares in 2009 and 17,434,828 shares in 2008 Balance at beginning of year Additions during the year Balance at end of year Preferred stock - P =0.10 par value, 10% cumulative, voting participating, nonredeemable and nonconvertible Authorized, issued and outstanding - 4,000,000,000 shares Preferred stock - P =1 par value, 8% cumulative, nonvoting, nonparticipating, nonconvertible, redeemable at the Company’s option Authorized and issued - 500,000,000 shares ADDITIONAL PAID-IN CAPITAL Balance at beginning of year Additions during the year Balance at end of year SUBSCRIPTIONS RECEIVABLE Balance at beginning of year Additions during the year Collections during the year Balance at end of year COMMON STOCK OPTIONS OUTSTANDING (Note 20) Balance at beginning of year Granted Exercised Balance at end of year RETAINED EARNINGS (Note 20) Appropriated for capital expenditures: Balance at beginning of year Additional appropriations during the year Balance at end of year Unappropriated: Balance at beginning of year Net income Appropriation for capital expenditures Dividends declared Balance at end of year P =2,005,443,965 =2,005,443,965 P =2,005,443,965 P 25,233,853 1,920,000 27,153,853 17,434,828 7,799,025 25,233,853 12,741,345 4,693,483 17,434,828 400,000,000 400,000,000 400,000,000 500,000,000 900,000,000 2,932,597,818 500,000,000 900,000,000 2,930,677,818 500,000,000 900,000,000 2,922,878,793 3,451,156,783 61,900,194 3,513,056,977 3,345,448,824 105,707,959 3,451,156,783 3,234,454,456 110,994,368 3,345,448,824 (136,053,636) (26,725,512) 35,705,635 (127,073,513) (108,260,650) (39,553,904) 11,760,918 (136,053,636) (55,940,286) (58,702,416) 6,382,052 (108,260,650) 22,109,614 47,311,112 (37,145,864) 32,274,862 7,445,858 75,493,303 (60,829,547) 22,109,614 7,969,056 42,479,726 (43,002,924) 7,445,858 7,000,000,000 – 7,000,000,000 4,000,000,000 3,000,000,000 7,000,000,000 2,000,000,000 2,000,000,000 4,000,000,000 3,996,463,265 3,978,545,893 – (1,158,216,979) 6,816,792,179 13,816,792,179 4,775,852,924 3,231,413,126 (3,000,000,000) (1,010,802,785) 3,996,463,265 10,996,463,265 4,873,451,623 2,788,020,190 (2,000,000,000) (885,618,889) 4,775,852,924 8,775,852,924 (Forward) *SGVMC115490* -2- 2010 UNREALIZED GAIN ON AVAILABLE-FOR-SALE FINANCIAL ASSETS (Note 11) Balance at beginning of year Other comprehensive income Balance at end of year CUMULATIVE TRANSLATION ADJUSTMENT (Note 2) Balance at beginning of year Other comprehensive income Balance at end of year TREASURY SHARES - At cost (Note 20) Balance at beginning of year Issuance of treasury shares Balance at end of year NONCONTROLLING INTERESTS (Notes 1 and 4) Balance at beginning of year Additions from business combinations Net income (loss) Balance at end of year Years Ended December 31 2009 2008 P =52,548,379 92,381,443 144,929,822 P6,670,143 = 45,878,236 52,548,379 P4,710,168 = 1,959,975 6,670,143 – 2,650,312 2,650,312 – – – – – – (500,000,000) – (500,000,000) 19,815,228,457 153,824,019 – 8,923,957 162,747,976 P =19,977,976,433 (500,000,000) – (500,000,000) 16,816,902,223 (503,760,751) 3,760,751 (500,000,000) 14,450,035,892 7,550,184 – 147,167,825 7,502,732 (893,990) 47,452 153,824,019 7,550,184 =16,970,726,242 P P =14,457,586,076 See accompanying Notes to Consolidated Financial Statements. *SGVMC115490* MANILA WATER COMPANY, INC. AND SUBSIDIARIES CONSOLIDATED STATEMENTS OF CASH FLOWS 2010 CASH FLOWS FROM OPERATING ACTIVITIES Income before income tax Adjustments for: Depreciation and amortization (Notes 9 and 10) Interest expense (Notes 15 and 18) Share-based payments (Note 20) Equity share in net loss of joint venture Loss on early retirement of loans (Note 15) Loss (gain) on disposal of property and equipment Interest income (Note 18) Operating income before changes in operating assets and liabilities Changes in operating assets and liabilities Decrease (increase) in: Receivables Materials and supplies Other current assets Increase (decrease) in: Accounts and other payables Payables to related parties Net cash generated from operations Income taxes paid Net cash provided by operating activities CASH FLOWS FROM INVESTING ACTIVITIES Interest received Additions to: Service concession assets Property and equipment (Note 9) Proceeds from sale of property and equipment Acquisition through business combination of a subsidiary - net of cash acquired (Note 4) Investment in joint venture (Note 12) Decrease (increase) in: Short-term cash investments Available-for-sale financial assets Other noncurrent assets Increase in other noncurrent liabilities Net cash used in investing activities CASH FLOWS FROM FINANCING ACTIVITIES Increase in noncontrolling interests of consolidated subsidiaries (Note 4) Long-term debt (Note 15): Availments Payments Service concession obligation: Payments Payments of dividends (Note 20) Collection of subscriptions receivable Interest paid Net cash provided by (used in) financing activities NET INCREASE (DECREASE) IN CASH AND CASH EQUIVALENTS CASH AND CASH EQUIVALENTS AT BEGINNING OF YEAR CASH AND CASH EQUIVALENTS AT END OF YEAR (Note 5) P =5,234,059,246 Years Ended December 31 2009 =4,235,530,290 P 2008 =4,256,732,852 P 1,471,895,682 1,188,454,244 47,311,112 1,538,567 – 7,050,915 (288,006,062) 1,956,339,628 811,520,800 75,493,303 – – 44,504 (361,970,533) 1,890,509,326 689,266,684 42,479,726 – 8,893,450 (11,364) (204,888,655) 7,662,303,704 6,716,957,992 6,682,982,019 1,377,739 (17,389,276) (533,956,187) 83,554,408 (34,887,704) (216,226,552) (176,500,885) 38,455,293 142,774,105 101,825,250 (20,300,151) 7,193,861,079 (1,264,689,754) 5,929,171,325 442,153,701 1,297,077 6,992,848,922 (1,227,693,768) 5,765,155,154 510,664,082 (15,255,975) 7,183,118,639 (951,272,350) 6,231,846,289 313,332,471 371,182,281 (7,686,328,708) (1,062,934,005) 951,017 (4,507,166,262) (443,362,599) 131,181 – (7,133,182) (169,272,606) – 2,178,082,591 210,602,860 181,235,101 1,171,252,864 (4,700,938,991) (356,414,808) (369,932,911) (85,732,624) 380,621,356 (5,179,946,992) – 60,000,000 159,840,130 (3,494,068,555) (331,931,602) 387,348 – – (1,980,096,301) (951,680,424) (997,529,820) 90,574,767 (7,504,504,457) – 626,677,526 (1,078,571,064) 2,140,278,024 (720,218,235) 6,703,740,073 (1,274,679,901) (396,185,536) (1,190,588,813) 35,654,453 (850,147,342) (2,853,160,776) (380,761,898) (969,151,630) 24,884,451 (691,478,568) (536,447,856) (463,282,801) (885,694,826) 24,125,314 (379,090,138) 3,725,117,721 (1,624,928,442) 48,760,306 2,452,459,553 4,037,840,706 3,989,080,400 1,536,620,847 P =2,412,912,264 =4,037,840,706 P =3,989,080,400 P See accompanying Notes to Consolidated Financial Statements. *SGVMC115490* MANILA WATER COMPANY, INC. AND SUBSIDIARIES NOTES TO CONSOLIDATED FINANCIAL STATEMENTS 1. Corporate Information Manila Water Company, Inc. (MWC or the Parent Company) was incorporated on January 6, 1997 and started commercial operations on January 1, 2000. It became a publicly listed company via an initial public offering on March 18, 2005. The Parent Company is a subsidiary of Ayala Corporation (AC). AC is a publicly listed company which is 52.11% owned by Mermac, Inc., 10.82% owned by Mitsubishi Corporation and the rest by the public. The Parent Company and Subsidiaries (collectively referred to as the Group) are involved in providing water, sewerage and sanitation, distribution services, pipeworks and management services. The Parent Company’s principal place of business is MWSS Building, Katipunan Road, Balara, Quezon City. On May 31, 2004, International Finance Corporation (IFC) became one of the principal shareholders of the Parent Company. AC held part of its shares in the Parent Company through MWC Holdings, Inc. (MWCHI) until MWCHI was merged into the Parent Company on October 12, 2004. On December 23, 2004, AC and United Utilities Pacific Holdings, BV(UU) assigned and transferred their participating preferred shares in the Parent Company comprising of 2.0 billion and 1.33 billion shares, respectively, to Philwater Holdings Company, Inc. (Philwater) in exchange for its 333.33 million common shares. Philwater is a special purpose company, 60.0% owned by AC and 40.0% owned by UU. The Parent Company was a joint venture among AC, UU, a subsidiary of United Utilities PLC and Mitsubishi Corporation until it became a subsidiary of AC in 2010. On November 2009, AC and UU entered into share sale and purchase agreement for the sale of UU’s interest in 81,934,917 common shares of MWC to AC. Also on this date, UU and Philwater entered into a share sale and purchase agreement for the sale of UU’s interest in 666.67 million participating preferred shares of MWC to Philwater. These sale and purchase agreements were completed in March 2010. As of December 31, 2010 and 2009, Philwater owns 4.0 billion and 3.33 billion participating preferred shares, respectively, of the Parent Company. AC’s share in the common stock of the Parent Company, after the sale from UU is 646,728,001 and still maintains its 60% share in Philwater which holds the whole 4.0 billion preferred shares of the Parent Company. These considerations constituted AC to treat the Parent Company as a subsidiary. *SGVMC115490* -2The consolidated financial statements comprise the financial statements of the Parent Company and the following wholly and majority owned subsidiaries: Manila Water International Solutions, Inc Manila Water Total Solutions, Corp. Manila Water Asia Pacific, Pte. Ltd. (MWAP) Manila Water South Asia Holdings, Pte. Ltd. (MWSAH) AAA Water Corporation (AWC) Laguna AAA Water Corporation (LAWC) Northern Waterworks and Rivers Cebu, Inc. (NWRC) Boracay Island Water Company, Inc. (BIWC) Effective Percentages of Ownership 2009 2010 100% 100% 100 100 – 100 100 100 70 90 80 – 100 70 90 80 In April 2010, the Parent Company incorporated MWAP, whose principal activity is to carry on the business of investment holding, and to undertake and to transact all kinds of investment business. In May 2010, MWAP incorporated MWSAH which was established for the same purpose as MWAP. MWAP and MWSAH were incorporated in Singapore. Parent Company’s Concession Agreement with Metropolitan Waterworks and Sewerage System (MWSS) On February 21, 1997, the Parent Company entered into a concession agreement (the Agreement) with MWSS, a government corporation organized and existing pursuant to Republic Act (RA) No. 6234, as amended, with respect to the MWSS East Zone (East Zone). The Agreement sets forth the rights and obligations of the Parent Company throughout the 25-year concession period. The MWSS Regulatory Office (MWSS-RO) monitors and reviews the performance of each of the Concessionaires - the Parent Company and Maynilad Water Services, Inc. (Maynilad), the West Zone Concessionaire. Under the Agreement, MWSS grants the Parent Company (as contractor to perform certain functions and as agent for the exercise of certain rights and powers under RA No. 6234) the sole right to manage, operate, repair, decommission, and refurbish all fixed and movable assets (except certain retained assets) required to provide water delivery and sewerage services in the East Zone for a period of 25 years commencing on August 1, 1997 (the Commencement Date) to May 6, 2022 (the Expiration Date) or the early termination date as the case may be. While the Parent Company has the right to manage, operate, repair and refurbish specified MWSS facilities in the East Zone, legal title to these assets remains with MWSS. The legal title to all fixed assets contributed to the existing MWSS system by the Parent Company during the Concession remains with the Parent Company until the Expiration Date (or an early termination date) at which time all rights, titles and interest in such assets will automatically vest in MWSS. On Commencement Date, the Parent Company officially took over the operations of the East Zone. Rehabilitation work for the service area commenced immediately thereafter. As provided in the Parent Company’s project plans, operational commercial capacity will be attained upon substantial completion of the rehabilitation work. Under the Agreement, the Parent Company is entitled to the following rate adjustments: a. Annual standard rate adjustment to compensate for increases in the consumer price index (CPI); *SGVMC115490* -3b. Extraordinary price adjustment (EPA) to account for the financial consequences of the occurrence of certain unforeseen events stipulated in the Agreement; and c. Foreign Currency Differential Adjustment (FCDA) to recover foreign exchange losses including accruals and carrying costs thereof arising from MWSS loans and any Concessionaire loans used for capital expenditures and concession fee payments, in accordance with the provisions set forth in Amendment No. 1 of the Agreement dated October 12, 2001 (see Notes 2, 10 and 15). These rate adjustments are subject to a rate adjustment limit which is equivalent to the sum of CPI published in the Philippines, EPA and Rebasing Convergence Adjustment as defined in the Agreement. The Agreement also provides a general rate setting policy for rates chargeable by the Parent Company for water and sewerage services as follows: 1. For the period through the second Rate Rebasing date (January 1, 2008), the maximum rates chargeable by the Parent Company (subject to interim adjustments) are set out in the Agreement; and 2. From and after the second Rate Rebasing date, the rates for water and sewerage services shall be set at a level that will permit the Parent Company to recover, over the 25-year term of the concession, its investment including operating, capital maintenance and investment incurred, Philippine business taxes and payments corresponding to debt service on the MWSS loans and the Parent Company’s loans incurred to finance such expenditures, and to earn a rate of return equal to the appropriate discount rate (ADR) on these expenditures for the remaining term of the concession. The maximum rates chargeable for such water and sewerage services shall be subject to general adjustment at five-year intervals commencing on the second Rate Rebasing date, provided that the MWSS-RO may exercise its discretion to make a general adjustment of such rates. The Parent Company submitted a Business Plan which included proposed expenditures on (1) a Reliability Investment Plan which will focus on service level sustainability, earthquake and natural calamity contingency and Angat reliability, and (2) an Expansion Investment Plan which includes the development of new water sources, network expansion and implementation of the MWSS wastewater masterplan. These investments amount to an estimated P =187 billion to be spent over a 15-year period, for both capital and operating expenditures. On December 14, 2007, MWSS passed Resolution No. 2007-278 adopting and approving the MWSS-RO’s resolutions that contain the final evaluation and determination of the Parent Company’s Rate Rebasing Proposal. Under the said resolution, the MWSS approved a one-time tariff adjustment of 75.07% over the basic tariff. However, in order to temper the increases in favor of the customers, the tariff adjustments are to be implemented on a staggered basis over a five year period, but adjusted for the net present value impact. The said staggered implementation is premised on certain conditions, such as the adoption of additional performance targets and other conditions such as rationalization of sewerage and environmental charges, re-classification of some government institutions, among others. As of December 31, 2010, the Parent Company has complied with all these targets and conditions. The first of a series of annual adjustments were implemented on January 1, 2008 amounting to an increase of = P5.00 per cubic meter based on the all-in weighted average tariff. *SGVMC115490* -4On April 16, 2009, the MWSS Board of Trustees passed Resolution No. 2009-072 approving the fifteen year extension of the Agreement (the Extension) from May 7, 2022 to May 6, 2037. This resolution was confirmed by the Department of Finance (by authority from the office of the President of the Republic of the Philippines) on October 19, 2009. The significant commitments under the Extension follow: a. To mitigate tariff increases such that there will be reduction of the balance of the approved 2008 rebased tariff by 66%, zero increase of the rebased tariff in 2009 and a P =1 increase for years 2010 to 2016 , subject to CPI and FCDA adjustments. b. To increase the share in the current operating budget support to MWSS by 100% as part of the concession fees starting 2009. c. To increase the total investments from the approved P =187 billion for the periods 2008 to 2022 to = P450 billion for 2008 to 2037. As a result of the increase in the annual regulatory cost, service concession assets and service concession obligations as of October 19, 2009 increased by P =3.36 billion and = P3.17 billion, respectively (see Note 10). Also, with the approval of the Extension, the recovery period for the Parent Company’s investment is now extended to another 15 years from 2022 to 2037. In March 2010, MWSS entered into a loan agreement with The Export-Import Bank of China to finance the Angat Water Utilization and Aqueduct Improvement Project Phase II (the Project). Total loan facility amounted to $116,602,000 with maturity of 20 years including 5 years grace period. Interest rate is 3% per annum. MWSS then entered into a Memorandum of Agreement with the Parent Company and Maynilad for the Parent Company and Maynilad to shoulder equally the repayment of the loan with such repayment to be part of the concession fees. LAWC’s Concession Agreement with the Province of Laguna (POL) On April 9, 2002, LAWC entered into a concession agreement (as amended on March 31, 2004) with POL, a local government unit organized and existing under Philippine Laws. Under the terms of the concession agreement, POL grants LAWC (as contractor and as agent for the exercise of certain rights in Laguna) the sole and exclusive right and discretion during the concession period to manage, occupy, operate, repair, maintain, decommission and refurbish the identified facilities required to provide water services to specific areas for an operational period of 25 years. While LAWC has the right to manage, occupy, operate, repair, maintain, decommission and refurbish specified POL facilities, legal title to these assets shall still remain with POL. Legal title to all assets procured by LAWC in the performance of its obligations under the agreement shall remain with LAWC and shall not pass to POL. LAWC will also have exclusive rights to provide water services in the service areas specified in the concession agreement. Concession fees set forth in the concession agreement shall be computed as a percentage of revenue from water services (see Note 10). *SGVMC115490* -5Seventy percent (70%) of the concession fees shall be applied against the advances of LAWC to POL. The remaining 30% of the concession fees shall be payable annually 30 days after the submission of the audited financial statements by LAWC, starting on the first operational period, which will begin upon the expiration of the transition period. LAWC started its operational period on January 1, 2010. BIWC’s Concession Agreement with Tourism Infrastructure and Enterprise Zone Authority (TIEZA) On December 17, 2009, BIWC entered into a Concession Agreement with TIEZA, formerly Philippine Tourism Authority (PTA) for a period of 25 years, with commencement date on January 1, 2010 and renewable at any time prior to expiration for another 25 years, without a necessity of bidding. As part of the agreement, BIWC advanced concession fees to TIEZA amounting to =60.00 million, which will be applied as payment of, and shall be offset against the annual P concession fees payable to TIEZA equivalent to 5% of the annual gross revenue of BIWC. Under its concession agreement, BIWC is entitled to the following rate adjustments: a. Annual standard rate adjustment to compensate for increases in the consumer CPI; b. EPA to account for the financial consequences of the occurrence of certain unforeseen events stipulated in the Agreement; and c. FCDA to recover foreign exchange losses including accruals and carrying costs thereof arising from TIEZA loans and any loans used for capital expenditures and concession fee payments. These rate adjustments are subject to a rate adjustment limit which is equivalent to the sum of CPI published in the Philippines, EPA and Rebasing Convergence adjustment as defined in BIWC’s concession agreement. The rate rebasing date is set every 5 years starting January 1, 2011. Hence, the first rate rebasing period shall commence on January 1, 2010 and end on December 31, 2010, and in the case of subsequent rate rebasing periods, the period commencing on the last rate rebasing date and ending on December 31 of the fifth year thereafter. Also part of the concession agreement, BIWC assumed certain property and equipment of Boracay Water Sewerage System (BWSS), as well as BWSS service concession obligations for the Japan International Cooperation Agency (JICA) loan and regulatory costs. As a result of the above terms of the concession agreement, BIWC recognized a total of =986.86 million service concession assets. It includes the JICA loan assumed by the Company, P regulatory costs, construction costs for the improvement and expansion of the water and wastewater facilities, and the advanced concession fees. Approval for the Release of the Consolidated Financial Statements The Parent Company’s Board of Directors (BOD) delegated to the Parent Company’s Audit and Governance Committee the authority to approve the issuance of the December 31, 2010 consolidated financial statements. The Audit and Governance Committee approved and authorized the issuance of the accompanying consolidated financial statements on February 14, 2011. *SGVMC115490* -6- 2. Summary of Significant Accounting Policies Basis of Preparation The consolidated financial statements of the Group have been prepared using the historical cost basis, except for available-for-sale (AFS) financial assets and derivative financial instruments that have been measured at fair value. The Group’s presentation and functional currency is the Philippine Peso (P =). Amounts are rounded off to the nearest peso, except otherwise stated. Statement of Compliance The consolidated financial statements of the Group have been prepared in compliance with Philippine Financial Reporting Standards (PFRS). Basis of Consolidation The consolidated financial statements include the financial statements of the Parent Company and its Subsidiaries. The financial statements of the subsidiaries are prepared for the same reporting period as the Parent Company. The consolidated financial statements are prepared using uniform accounting policies for like transactions and other events in similar circumstances. All significant intercompany transactions and balances, including intercompany profits and unrealized profits and losses, are eliminated during the consolidation process. Subsidiaries are consolidated from the date of acquisition, being the date on which the Group obtains control, and continue to be consolidated until the date that such control ceases. Noncontrolling interests (NCI) represent the portion of profit or loss and net assets in subsidiaries not wholly owned and are presented separately in the consolidated statement of comprehensive income and consolidated statement of changes in equity and within the equity section in the consolidated statement of financial position, separately from the Group’s equity. Transactions with NCI are handled in the same way as transactions with external parties. Changes in Accounting Policies and Disclosures The accounting policies adopted are consistent with those of the previous financial year except for the following new and amended PFRS and Philippine Interpretations which were adopted as of January 1, 2010. Unless otherwise indicated, the adoption of the following new and amended PFRS and Philippine Interpretations did not have a significant impact on the Group’s consolidated financial statements. · Revised PFRS 3, Business Combinations and PAS 27, Consolidated and Separate Financial Statements The revised PFRS 3 introduces a number of changes in the accounting for business combinations occurring after becoming effective. Changes affect the valuation of NCI, the accounting for transaction costs, the initial recognition and subsequent measurement of a contingent consideration and business combinations achieved in stages. These changes will impact the amount of goodwill recognized, the reported results in the period that an acquisition occurs and future reported results. The amended PAS 27 requires that a change in the ownership interest of a subsidiary (without loss of control) is accounted for as a transaction with owners in their capacity as owners. Therefore, such transactions will no longer give rise to goodwill, nor will it give rise to a gain or loss. Furthermore, the amended Standard changes the accounting for losses incurred by the *SGVMC115490* -7subsidiary as well as the loss of control of a subsidiary. The changes by the revised PFRS 3 and amended PAS 27 affect acquisitions or loss of control of subsidiaries and transactions with NCI after January 1, 2010. · Philippine Interpretation IFRIC 17, Distributions of Noncash Assets to Owners This Philippine Interpretation is effective for annual periods beginning on or after July 1, 2009 with early application permitted. It provides guidance on how to account for noncash distributions to owners. The Philippine Interpretation clarifies when to recognize a liability, how to measure it and the associated assets, and when to derecognize the asset and liability. · Amendments to PFRS 2, Share-based Payment: Group Cash-settled Transactions The amendments clarify the scope and the accounting for group cash-settled share-based payment transactions in the separate or individual financial statements of the entity receiving the goods or services when that entity has no obligation to settle the share-based payment transaction. It did not have an impact on the financial position or performance of the Group. · Amendment to PAS 39, Financial Instruments: Recognition and Measurement - Eligible Hedged Items The amendment clarifies that an entity is permitted to designate a portion of the fair value changes or cash flow variability of a financial instrument as a hedged item. This also covers the designation of inflation as a hedged risk or portion in particular situations. The Group has concluded that the amendment will have no impact on the financial position or performance of the Group, as the Group has not entered into any such hedges. Improvements to PFRS The omnibus amendments to PFRSs released in April 2009 were issued primarily with a view to removing inconsistencies and clarifying wordings. There are separate transitional provisions for each Standard. The adoption of these amended Standards did not have any significant impact on the consolidated financial statements, unless otherwise indicated. · PFRS 2, Share-based Payment This amendment clarifies that the contribution of a business on formation of a joint venture and combinations under common control are not within the scope of PFRS 2 even though they are out of scope of PFRS 3. · PFRS 5, Noncurrent Assets Held for Sale and Discontinued Operations This amendment clarifies that the disclosures required in respect of noncurrent assets and disposal groups classified as held for sale or discontinued operations are only those set out in PFRS 5. The disclosure requirements of other PFRSs only apply if specifically required for such noncurrent assets or discontinued operations. · PFRS 8, Operating Segments This amendment clarifies that segment assets and liabilities need only be reported when those assets and liabilities are included in measures that are used by the chief operating decision maker. · PAS 1, Presentation of Financial Statements This amendment clarifies that the terms of a liability that could result, at anytime, in its settlement by the issuance of equity instruments at the option of the counterparty do not affect its classification. *SGVMC115490* -8· · PAS 7, Statement of Cash Flows This amendment explicitly states that only expenditure that results in a recognized asset can be classified as a cash flow from investing activities. PAS 17, Leases This amendment removes the specific guidance on classifying land as a lease. Prior to the amendment, leases of land were classified as operating leases. The Amendment now requires that leases of land are classified as either ‘finance’ or ‘operating’ in accordance with the general principles of PAS 17. · PAS 34, Interim Financial Reporting This amendment provides guidance to illustrate how to apply disclosure principles in PAS 34 and add disclosure requirements around: a) The circumstances likely to affect fair values of financial instruments and their classification; b) Transfers of financial instruments between different levels of the fair value hierarchy; c) Changes in classification of financial assets; and d) Changes in contingent liabilities and assets. · PAS 36, Impairment of Assets This amendment clarifies that the largest unit permitted for allocating goodwill, acquired in a business combination, is the operating segment as defined in PFRS 8 before aggregation for reporting purposes. · PAS 38, Intangible Assets This amendment clarifies that if an intangible asset acquired in a business combination is identifiable only with another intangible asset, the acquirer may recognize the group of intangible assets as a single asset provided the individual assets have similar useful lives. It also clarifies that the valuation techniques presented for determining the fair value of intangible assets acquired in a business combination that are not traded in active markets are only examples and are not restrictive on the methods that can be used. · PAS 39, Financial Instruments: Recognition and Measurement This amendment clarifies: (a) a prepayment option is considered closely related to the host contract when the exercise price of a prepayment option reimburses the lender up to the approximate present value of lost interest for the remaining term of the host contract; (b) the scope exemption for contracts between an acquirer and a vendor in a business combination to buy or sell an acquiree at a future date applies only to binding forward contracts, and not derivative contracts where further actions by either party are still to be taken, and (c) gains or losses on cash flow hedges of a forecast transaction that subsequently results in the recognition of a financial instrument or on cash flow hedges of recognized financial instruments should be reclassified in the period that the hedged forecast cash flows affect profit or loss. · Philippine Interpretation IFRIC 9, Reassessment of Embedded Derivatives This Philippine Interpretation clarifies that it does not apply to possible reassessment, at the date of acquisition, to embedded derivatives in contracts acquired in a combination between entities or businesses under common control or the formation of a joint venture. *SGVMC115490* -9· Philippine Interpretation IFRIC 16, Hedges of a Net Investment in a Foreign Operation This Philippine Interpretation states that, in a hedge of a net investment in a foreign operation, qualifying hedging instruments may be held by any entity or entities within the group, including the foreign operation itself, as long as the designation, documentation and effectiveness requirements of PAS 39 that relate to a net investment hedge are satisfied. Future Changes in Accounting Policies The Group has not applied the following PFRS and Philippine Interpretations which are not yet effective for the year ended December 31, 2010. Except as otherwise indicated, the Group does not expect the adoption of these new and amended PFRS and Philippine Interpretations to have significant impact on its consolidated financial statements. Effective in 2011 · Revised PAS 24, Related Party Disclosures The revised Standard is effective for annual periods beginning on or after January 1, 2011. It clarifies the definition of a related party to simplify the identification of such relationships and to eliminate inconsistencies in its application. The revised Standard introduces a partial exemption of disclosure requirements for government-related entities. The Group does not expect any impact on its financial position or performance. Early adoption is permitted for either the partial exemption for government-related entities or for the entire Standard. · Amendment to PAS 32, Classification of Rights Issues The amendment to PAS 32 is effective for annual periods beginning on or after February 1, 2010. It amended the definition of a financial liability in order to classify rights issues (and certain options or warrants) as equity instruments in cases where such rights are given pro rata to all of the existing owners of the same class of an entity’s nonderivative equity instruments, or to acquire a fixed number of the entity’s own equity instruments for a fixed amount in any currency. This amendment will have no impact on the consolidated financial statements. The Standard is effective for mandatory adoption on January 1, 2013. Earlier application is permitted for financial statements beginning on or after January 1, 2010. · Amendments to Philippine Interpretation IFRIC 14, Prepayments of a Minimum Funding Requirement Philippine Interpretation IFRIC 14, which is itself an interpretation of PAS 19, The Limit on a Defined Benefit Asset, Minimum Funding Requirements and their Interaction, applies in the limited circumstances when an entity is subject to minimum funding requirements and makes an early payment of contributions to cover those requirements. The amendment provides guidance on assessing the recoverable amount of a net pension asset. The amendment permits an entity to treat the prepayment of a minimum funding requirement as an asset. The amendment is effective for annual periods beginning on or after January 1, 2011, with early adoption permitted. · Philippine Interpretation IFRIC 19, Extinguishing Financial Liabilities with Equity Instruments This Philippine Interpretation provides guidance on how to account for the extinguishment of a financial liability by the issue of equity instruments. These transactions are often referred to as debt for equity swaps. The interpretation clarifies the requirements of PFRSs when an entity renegotiates the terms of a financial liability with its creditor and the creditor agrees to accept the entity’s shares or other equity instruments to settle the financial liability fully or partially. It clarifies that (a) the entity’s equity instruments issued to a creditor are part of the *SGVMC115490* - 10 consideration paid to extinguish the financial liability, (b) the equity instruments issued are measured at their fair value. If their fair value cannot be reliably measured, the equity instruments should be measured to reflect the fair value of the financial liability extinguished, and (c) the difference between the carrying amount of the financial liability extinguished and the initial measurement amount of the equity instruments issued is included in the entity’s profit or loss for the period. This Philippine Interpretation is effective for annual periods beginning on or after July 1, 2010, with earlier application permitted. Effective in 2012 · Philippine Interpretation IFRIC 15, Agreements for the Construction of Real Estate This Philippine Interpretation covers accounting for revenue and associated expenses by entities that undertake the construction of real estate directly or through subcontractors. This Philippine Interpretation requires that revenue on construction of real estate be recognized only upon completion, except when such contract qualifies as construction contract to be accounted for under PAS 11, Construction Contracts, or involves rendering of services, in which case revenue is recognized based on stage of completion. Contracts involving provision of services with the construction materials and where the risks and rewards of ownership are transferred to the buyer on a continuous basis, will also be accounted for based on stage of completion. · Amendment to PAS 12, Income Taxes - Deferred Tax: Recovery of Underlying Assets This amendment provides a practical solution to the problem of assessing whether recovery of an asset will be through use or sale. It introduces a presumption that recovery of the carrying amount of an asset will, normally, be through sale. Effective in 2013 · PFRS 9, Financial Instruments: Classification and Measurement The Standard introduces new requirements on the classification and measurement of financial assets. It uses a single approach to determine whether a financial asset is measured at amortized cost or fair value, replacing the many different rules in PAS 39. The approach in the new Standard is based on how an entity manages its financial instruments (its business model) and the contractual cash flow characteristics of the financial assets. Improvements to PFRS The omnibus amendments to PFRSs issued in May 2010 were issued primarily with a view to removing inconsistencies and clarifying wordings. The amendments are effective for annual periods beginning January 1, 2011, except as otherwise stated. The Group has not yet adopted the following amendments and anticipates that these changes will have no material effects on the consolidated financial statements. · PFRS 3, Business Combinations (Revised) This amendment clarifies that the Amendments to PFRS 7, Financial Instruments: Disclosures, PAS 32, Financial Instruments: Presentation and PAS 39, Financial Instruments: Recognition and Measurement, that eliminate the exemption for contingent consideration, do not apply to contingent consideration that arose from business combinations whose acquisition dates precede the application of PFRS 3 (as revised in 2008). *SGVMC115490* - 11 It also limits the scope of the measurement choices that only the components of NCI that are present ownership interests that entitle their holders to a proportionate share of the entity’s net assets, in the event of liquidation, shall be measured either: at fair value or at the present ownership instruments’ proportionate share of the acquiree’s identifiable net assets. Other components of NCI are measured at their acquisition date fair value, unless another measurement basis is required by another PFRS. The Amendment also requires an entity (in a business combination) to account for the replacement of the acquiree’s share-based payment transactions (whether obliged or voluntarily), i.e., split between consideration and post combination expenses. However, if the entity replaces the acquiree’s awards that expire as a consequence of the business combination, these are recognised as post-combination expenses. It further specifies the accounting for share-based payment transactions that the acquirer does not exchange for its own awards: if vested - they are part of NCI and measured at their marked-based measure; if unvested - they are measured at marketbased value as if granted at acquisition date, and allocated between NCI and post-combination expense. · PFRS 7, Financial Instruments: Disclosures This amendment emphasises the interaction between quantitative and qualitative disclosures and the nature and extent of risks associated with financial instruments. Amendments to quantitative and credit risk disclosures are as follows: a) Clarify that only financial assets whose carrying amount does not reflect the maximum exposure to credit risk need to provide further disclosure of the amount that represents the maximum exposure to such risk. b) Requires, for all financial assets, disclosure of the financial effect of collateral held as security and other credit enhancements regarding the amount that best represents the maximum exposure to credit risk (e.g., a description of the extent to which collateral mitigates credit risk). c) Remove disclosure of the collateral held as security, other credit enhancements and an estimate of their fair value for financial assets that are past due but not impaired, and financial assets that are individually determined to be impaired. d) Remove the requirement to specifically disclose financial assets renegotiated to avoid becoming past due or impaired. e) Clarify that the additional disclosure required for financial assets obtained by taking possession of collateral or other credit enhancements are only applicable to assets still held at the reporting date. · PAS 1, Presentation of Financial Statements This amendment clarifies that an entity will present an analysis of other comprehensive income for each component of equity, either in the statement of changes in equity or in the notes to the financial statements. · PAS 27, Consolidated and Separate Financial Statements This amendment clarifies that the consequential amendments from PAS 27 made to PAS 21, The Effect of Changes in Foreign Exchange Rates, PAS 28, Investments in Associates and PAS 31, Interests in Joint Ventures apply prospectively for annual periods beginning on or after July 1, 2009 or earlier when PAS 27 is applied earlier. *SGVMC115490* - 12 · Philippine Interpretation IFRIC 13, Customer Loyalty Programmes This amendment clarifies that when the fair value of award credits is measured based on the value of the awards for which they could be redeemed, the amount of discounts or incentives otherwise granted to customers not participating in the award credit scheme, is to be taken into account. Cash and Cash Equivalents Cash includes cash on hand and in banks. Cash equivalents are short-term, highly liquid investments that are readily convertible to known amounts of cash with original maturities of three months or less from dates of acquisition and that are subject to an insignificant risk of change in value. Other short-term cash placements are classified as short-term cash investments. Short-term Cash Investments Short term cash investments are short-term placements with maturities of more than three months but less than one year from the date of acquisition. These earn interest at the respective short-term investment rates. Financial Assets and Financial Liabilities Date of recognition The Group recognizes a financial asset or a financial liability on the consolidated statement of financial position when it becomes a party to the contractual provisions of the instrument. Purchases or sales of financial assets that require delivery of assets within the time frame established by regulation or convention in the marketplace are recognized on the settlement date. Derivative instruments are recognized on trade date basis. Initial recognition of financial instruments All financial assets are initially recognized at fair value. Except for financial assets at fair value through profit or loss (FVPL), the initial measurement of financial assets includes transaction costs. The Group classifies its financial assets in the following categories: financial assets at FVPL, held-to-maturity (HTM) investments, AFS financial assets, and loans and receivables. The Group classifies its financial liabilities as financial liabilities at FVPL and other financial liabilities. The classification depends on the purpose for which the investments were acquired and whether these are quoted in an active market. Management determines the classification of its investments at initial recognition and, where allowed and appropriate, re-evaluates such designation at every reporting date. Financial instruments are classified as liability or equity in accordance with the substance of the contractual arrangement. Interest, dividends, gains and losses relating to a financial instrument or a component that is a financial liability, are reported as expense or income. Distributions to holders of financial instruments classified as equity are charged directly to equity, net of any related income tax benefits. Determination of fair value The fair value for financial instruments traded in active markets at the financial reporting date is based on its quoted market price or dealer price quotations (bid price for long positions and ask price for short positions), without any deduction for transaction costs. When current bid and ask prices are not available, the price of the most recent transaction provides evidence of the current fair value as long as there has not been a significant change in economic circumstances since the time of the transaction. *SGVMC115490* - 13 For all other financial instruments not listed in an active market, the fair value is determined by using appropriate valuation methodologies. Valuation methodologies include net present value techniques, comparison to similar instruments for which market observable prices exist, option pricing models, and other relevant valuation models. The Group uses the following hierarchy for determining and disclosing the fair value of financial instruments by valuation technique: · Level 1: quoted (unadjusted) prices in active markets for identical assets or liabilities · Level 2: other techniques for which all inputs which have a significant effect on the recorded fair value are observable, either directly or indirectly · Level 3: techniques which use inputs which have a significant effect on the recorded fair value that are not based on observable market data. Day 1 profit For transactions other than those related to customers’ guaranty and other deposits, where the transaction price in a non-active market is different from the fair value from other observable current market transactions in the same instruments or based on a valuation technique whose variables include only data from observable market, the Group recognizes the difference between the transaction price and fair value (a ‘Day 1’ profit) in the consolidated statement of comprehensive income under “Other income” unless it qualifies for recognition as some other type of asset. In cases where use is made of data which is not observable, the difference between the transaction price and model value is only recognized in the consolidated statement of comprehensive income when the inputs become observable or when the instrument is derecognized. For each transaction, the Group determines the appropriate method of recognizing the ‘Day 1’ profit amount. Financial assets at FVPL Financial assets at FVPL include financial assets held for trading and financial assets designated upon initial recognition as at FVPL. Financial assets are classified as held for trading if they are acquired for the purpose of selling in the near term. Derivatives, including separated embedded derivatives, are also classified as held for trading unless they are designated as effective hedging instruments or a financial guarantee contract. Gains or losses on investments held for trading are recognized in profit or loss. Financial assets may be designated at initial recognition as at FVPL if the following criteria are met: · The designation eliminates or significantly reduces the inconsistent treatment that would otherwise arise from measuring the assets or recognizing gains or losses on a different basis; or · The assets are part of a group of financial assets which are managed and its performance evaluated on a fair value basis, in accordance with a documented risk management or investment strategy; or · The financial instrument contains an embedded derivative, unless the embedded derivative does not significantly modify the cash flows or it is clear, with little or no analysis, that it would not be separately recorded. The Group’s financial asset classified as FVPL consists of a derivative asset on the Group’s call option on the = P4.0 billion bonds that the Parent Company issued in 2008 (see Note 13). *SGVMC115490* - 14 Embedded derivatives An embedded derivative is separated from the host contract and accounted for as a derivative if all of the following conditions are met: a) the economic characteristics and risks of the embedded derivative are not closely related to the economic characteristics and risks of the host contract; b) a separate instrument with the same terms as the embedded derivative would meet the definition of a derivative; and c) the hybrid or combined instrument is not recognized at FVPL. Embedded derivatives are measured at fair value with fair value changes being reported through profit or loss, and are carried as assets when the fair value is positive and as liabilities when the fair value is negative. Subsequent reassessment is prohibited unless there is a change in the terms of the contract that significantly modifies the cash flows that otherwise would be required under the contract, in which case reassessment is required. The Group determines whether a modification in the cash flows is significant by considering the extent to which the expected future cash flows associated with the embedded derivative, the host contract, or both have changed and whether the change is significant relative to the previously expected cash flows from the contract. The Group has certain derivatives that are embedded in the host financial (such as long-term debt) and nonfinancial (such as purchase orders) contracts. As of December 31, 2010 and 2009, the Group has recognized the value of the embedded call option in one of its long-term debt (see Notes 13 and 27). HTM investments HTM investments are quoted nonderivative financial assets with fixed or determinable payments and fixed maturities for which the Group’s management has the positive intention and ability to hold to maturity. Where the Group sells other than an insignificant amount of HTM investments, the entire category would be tainted and reclassified as AFS financial assets. After initial measurement, these investments are measured at amortized cost using the effective interest rate method, less impairment in value. Amortized cost is calculated by taking into account any discount or premium on acquisition and fees that are an integral part of the effective interest rate. The amortization is included in “Interest income” account in the consolidated statement of comprehensive income. Gains and losses are recognized in income when the HTM investments are derecognized or impaired, as well as through the amortization process. As of December 31, 2010 and 2009, no financial assets have been classified as HTM investments. Loans and receivables Loans and receivables are financial assets with fixed or determinable payments and fixed maturities that are not quoted in an active market. These are not entered into with the intention of immediate or short-term resale and are not designated as AFS financial assets or financial assets at FVPL. These are included in current assets if maturity is within 12 months from the reporting date; otherwise, these are classified as noncurrent assets. This accounting policy relates to the consolidated statement of financial position captions “Cash and cash equivalents”, “Short-term cash investments”, and “Receivables”. After initial measurement, loans and receivables are subsequently measured at amortized cost using the effective interest rate method, less allowance for impairment. Amortized cost is calculated by taking into account any discount or premium on acquisition and fees that are an integral part of the effective interest rate. The amortization is included in “Interest income” in the consolidated statement of comprehensive income. The losses arising from impairment of such *SGVMC115490* - 15 loans and receivables are recognized in “Provision for probable losses” in the consolidated statement of comprehensive income. AFS financial assets AFS financial assets are those which are designated as such or do not qualify to be classified as financial assets at FVPL, HTM investments or loans and receivables. These are purchased and held indefinitely, and may be sold in response to liquidity requirements or changes in market conditions. These include equity investments, money market papers and other debt instruments. After initial measurement, AFS financial assets are subsequently measured at fair value. The effective yield component of AFS debt securities, as well as the impact of restatement on foreign currency-denominated AFS debt securities, is reported in earnings. The unrealized gains and losses arising from the fair valuation of AFS financial assets are excluded net of tax from net income and are reported as “Unrealized gain on AFS financial assets” under other comprehensive income. When the investment is disposed of, the cumulative gain or loss previously recognized under other comprehensive income is recognized as “Other income” in profit and loss. Where the Group holds more than one investment in the same security, these are deemed to be disposed of on a firstin first-out basis. Interest earned on holding AFS financial assets are reported as interest income using the effective interest rate. Dividends earned on holding AFS financial assets are recognized under the “Other income” account when the right of the payment has been established. The losses arising from impairment of such investments are recognized as provisions for impairment losses in profit and loss. Fair value of AFS financial assets which cannot be measured reliably because of lack of reliable estimates of future cash flows and discount rates necessary to calculate the fair value of unquoted equity instruments, are carried at cost. The Group’s AFS financial assets are presented as noncurrent in the consolidated statements of financial position. The details of the Group’s AFS financial assets are disclosed in Note 11. Other financial liabilities This category pertains to financial liabilities that are not held for trading or not designated as at FVPL upon the inception of the liability. Other financial liabilities include short-term and longterm debts. All loans and borrowings are initially recognized at the fair value of the consideration received less directly attributable transaction costs. After initial recognition, short-term and long-term debts are subsequently measured at amortized cost using the effective interest rate method. Gains and losses are recognized under the “Other income” and “Other expenses” accounts in the consolidated statement of comprehensive income when the liabilities are derecognized or impaired, as well as through the amortization process under the “Interest expense” account. Customers’ Guaranty and Other Deposits Customers’ guaranty and other deposits are initially measured at fair value. After initial recognition, these deposits are subsequently measured at amortized cost using the effective interest rate method. Amortization of customers’ guaranty and other deposits are included under “Interest expense” in the consolidated statement of comprehensive income. The difference between the cash received and its fair value is recognized as “Deferred credits”. Deferred credits are amortized over the remaining concession period using the effective interest rate method. *SGVMC115490* - 16 Derecognition of Financial Assets and Liabilities Financial assets A financial asset (or, where applicable, a part of a financial asset or part of a group of financial assets) is derecognized where: 1. the rights to receive cash flows from the asset have expired; 2. the Group retains the right to receive cash flows from the asset, but has assumed an obligation to pay them in full without material delay to a third party under a “pass-through” arrangement; or, 3. the Group has transferred its rights to receive cash flows from the asset and either (a) has transferred substantially all the risks and rewards of the asset, or (b) has neither transferred nor retained the risks and rewards of the asset but has transferred the control of the asset. Where the Group has transferred its rights to receive cash flows from an asset or has entered into a pass-through arrangement, and has neither transferred nor retained substantially all the risks and rewards of the asset nor transferred control of the asset, the asset is recognized to the extent of the Group’s continuing involvement in the asset. Continuing involvement that takes the form of a guarantee over the transferred asset is measured at the lower of the original carrying amount of the asset and the maximum amount of consideration that the Group could be required to repay. Financial liabilities A financial liability is derecognized when the obligation under the liability is discharged or cancelled or has expired. Where an existing financial liability is replaced by another financial liability from the same lender on substantially different terms, or the terms of an existing liability are substantially modified, such an exchange or modification is treated as a derecognition of the original liability and the recognition of a new liability, and the difference in the respective carrying amounts is recognized in profit or loss. Impairment of Financial Assets The Group assesses at each financial reporting date whether there is objective evidence that a financial asset or group of financial assets is impaired. A financial asset or a group of financial assets is deemed to be impaired if, and only if, there is objective evidence of impairment as a result of one or more events that has occurred after the initial recognition of the asset (an incurred ‘loss event’) and that loss event (or events) has an impact on the estimated future cash flows of the financial asset or the group of financial assets that can be reliably estimated. Objective evidence of impairment may include indications that the borrower or a group of borrowers is experiencing significant financial difficulty, default or delinquency in interest or principal payments, the probability that they will enter bankruptcy or other financial or other financial reorganization and where observable data indicate that there is a measurable decrease in the estimated future cash flows, such as changes in arrears or economic condition that correlate with default. For the Group’s receivables from customers, evidence of impairment may also include noncollection of the Group’s receivables, which remain unpaid after 30 days from bill generation. The Group shall provide the customer with not less than seven days’ prior written notice before any disconnection. Loans and receivables For loans and receivables carried at amortized cost, the Group first assesses whether objective evidence of impairment exists individually for financial assets that are individually significant, or collectively for financial assets that are not individually significant. If the Group determines that no objective evidence of impairment exists for an individually assessed financial asset, whether significant or not, it includes the asset in a group of financial assets with similar credit risk characteristics and collectively assessed for impairment. Those characteristics are relevant to the estimation of future cash flows for groups of such assets by being indicative of the debtors’ ability *SGVMC115490* - 17 to pay all amounts due according to the contractual terms of the assets being evaluated. Assets that are individually assessed for impairment and for which an impairment loss is, or continues to be recognized, are not included in a collective assessment for impairment. If there is objective evidence that an impairment loss has been incurred, the amount of the loss is measured as the difference between the asset’s carrying amount and the present value of the estimated future cash flows (excluding future credit losses that have not been incurred). The carrying amount of the asset is reduced through use of an allowance account and the amount of loss is charged to profit or loss. Interest income continues to be recognized based on the original effective interest rate of the asset. Receivables, together with the associated allowance accounts, are written off when there is no realistic prospect of future recovery. If, in a subsequent year, the amount of the estimated impairment loss decreases because of an event occurring after the impairment was recognized, the previously recognized impairment loss is reversed. Any subsequent reversal of an impairment loss is recognized in profit or loss, to the extent that the carrying value of the asset does not exceed its amortized cost at the reversal date. For the purpose of a collective evaluation of impairment, financial assets are grouped on the basis of such credit risk characteristics as industry, customer type, customer location, past-due status and term. Future cash flows in a group of financial assets that are collectively evaluated for impairment are estimated on the basis of historical loss experience for assets with credit risk characteristics similar to those in the group. Historical loss experience is adjusted on the basis of current observable data to reflect the effects of current conditions that did not affect the period on which the historical loss experience is based and to remove the effects of conditions in the historical period that do not exist currently. The methodology and assumptions used for estimating future cash flows are reviewed regularly by the Group to reduce any differences between loss estimates and actual loss experience. AFS financial assets For AFS financial assets, the Group assesses at each financial reporting date whether there is objective evidence that a financial asset or group of financial assets is impaired. In the case of equity investments classified as AFS financial assets, this would include a significant or prolonged decline in the fair value of the investments below their costs. Where there is evidence of impairment, the cumulative loss - measured as the difference between the acquisition cost and the current fair value, less any impairment loss on that financial asset previously recognized in the consolidated statement of comprehensive income - is removed from other comprehensive income and recognized in profit and loss. Impairment losses on equity investments are not reversed through profit and loss. Increases in fair value after impairment are recognized directly in other comprehensive income. In the case of debt instruments classified as AFS financial assets, impairment is assessed based on the same criteria as financial assets carried at amortized cost. Future interest income is based on the reduced carrying amount and is accrued based on the rate of interest used to discount future cash flows for the purpose of measuring impairment loss. Such accrual is recorded as part of “Interest income” in the consolidated statement of comprehensive income. If, in subsequent year, the fair value of a debt instrument increased and the increase can be objectively related to an event occurring after the impairment loss was recognized in profit and loss, the impairment loss is reversed through profit and loss. *SGVMC115490* - 18 Offsetting Financial Instruments Financial assets and financial liabilities are offset and the net amount reported in the consolidated statement of financial position if, and only if, there is a currently enforceable legal right to offset the recognized amounts and there is an intention to settle on a net basis, or to realize the asset and settle the liability simultaneously. Materials and Supplies Materials and supplies are valued at the lower of cost or net realizable value (fair value less costs to sell). Cost is determined using the moving average method. Property and Equipment Property and equipment, except land, are stated at cost less accumulated depreciation and amortization and any impairment in value. Land is stated at cost less any impairment in value. The initial cost of property and equipment comprises its purchase price, including import duties, taxes and any directly attributable costs of bringing the property and equipment to its working condition and location for its intended use, including capitalized borrowing costs incurred during the construction period. Expenditures incurred after the property and equipment have been put into operation, such as repairs and maintenance, are normally charged to operations in the period in which the costs are incurred. In situations where it can be clearly demonstrated that the expenditures have resulted in an increase in the future economic benefits expected to be obtained from the use of an item of property and equipment beyond its originally assessed standard of performance, the expenditures are capitalized as additional cost of the related property and equipment. Depreciation and amortization of property and equipment commences once the property and equipment are available for use and are calculated on a straight-line basis over the estimated useful lives (EUL) of the property and equipment as follows: Office furniture and equipment Transportation equipment 3 to 5 years 5 years Leasehold improvements are amortized over the EUL of the improvements or the term of the lease, whichever is shorter. Technical equipment are amortized over the EUL or the term of the related management contract, whichever is shorter. The EUL and depreciation and amortization method are reviewed periodically to ensure that the period and method of depreciation and amortization are consistent with the expected pattern of economic benefits from items of property and equipment. When property and equipment is retired or otherwise disposed of, the cost and the related accumulated depreciation and amortization and accumulated impairment, if any, are removed from the accounts and any resulting gain or loss is credited to or charged against current operations. Service Concession Assets and Obligations The Group accounts for its concession arrangements with MWSS, POL and TIEZA under the Intangible Asset model as it receives the right (license) to charge users of public service. Under the Group’s concession agreements, the Group is granted the sole and exclusive right and discretion during the concession period to manage, occupy, operate, repair, maintain, decommission and refurbish the identified facilities required to provide water services. The legal title to these assets shall remain with MWSS, POL and TIEZA at the end of the concession period. *SGVMC115490* - 19 The “Service concession assets” (SCA) pertain to the fair value of the service concession obligations at drawdown date and construction costs related to the rehabilitation works performed by the Group. The SCA are amortized using the straight-line method over the life of the concession. In addition, the Parent Company recognizes and measures revenue from rehabilitation works in accordance with PAS 11 and PAS 18 for the services it performs. Investment in Joint Venture The Group has an interest in a joint venture which is a jointly controlled entity, whereby the venturers have a contractual arrangement that establishes joint control over the economic activities of the entity. The agreement requires unanimous agreement for financial and operating decisions among the venturers. The Group recognizes its interest in the joint venture using the equity method. Under the equity method, the investment in joint venture is initially recognized at cost and the carrying amount is increased or decreased to recognize the venturer’s share of the profit or loss of the joint venture after the date of acquisition. The venturer’s share of the profit or loss of the joint venture is recognized in the venturer’s profit or loss. Impairment of Nonfinancial Assets An assessment is made at each financial reporting date to determine whether there is any indication of impairment of any long-lived assets, or whether there is any indication that an impairment loss previously recognized for an asset in prior years may no longer exist or may have decreased. If any such indication exists, the asset’s recoverable amount is estimated. An asset’s recoverable amount is calculated as the higher of the asset’s value in use or its net selling price. In assessing value in use, the estimated future cash flows are discounted to their present value using a pre-tax discount rate that reflects current market assessments of the time value of money and the risks specific to the asset. An impairment loss is recognized only if the carrying amount of an asset exceeds its recoverable amount. An impairment loss is charged to operations in the year in which it arises. A previously recognized impairment loss is reversed only if there has been a change in any of the estimates used to determine the recoverable amount of an asset, however, not to an amount higher than the carrying amount that would have been determined (net of any accumulated depreciation and amortization), had no impairment loss been recognized for the asset in prior years. A reversal of an impairment loss is credited to current operations. Leases The determination of whether an arrangement is, or contains a lease, is based on the substance of the arrangement at inception date of whether the fulfillment of the arrangement is dependent on the use of a specific asset or assets or the arrangement conveys a right to use the asset. A reassessment is made after the inception of the lease only if one of the following applies: (a) There is a change in contractual terms, other than a renewal of or extension of the arrangement; (b) A renewal option is exercised or extension granted, unless the term of the renewal or extension was initially included in the lease term; (c) There is a change in the determination of whether fulfillment is dependent on a specified asset; or (d) There is a substantial change to the asset. *SGVMC115490* - 20 Where reassessment is made, lease accounting shall commence or cease from the date when the change in circumstances gave rise to the reassessment scenarios (a), (c) or (d) and at the date of renewal or extension period for scenario (b). A lease where the lessor retains substantially all the risks and benefits of ownership of the asset is classified as an operating lease. Revenue Recognition Water and sewer revenue are recognized when the related water and sewerage services are rendered. Water and sewerage are billed every month according to the bill cycles of the customers. As a result of bill cycle cut-off, monthly service revenue earned but not yet billed at end of the month are estimated and accrued. These estimates are based on historical consumption of the customers. Sixteen percent of the water revenue are recognized as environmental charges with the rationalization of the sewerage and environmental charges as approved in the 2007 rate rebasing. Interest income is recognized as it accrues, taking into account the effective yield of the assets. Revenue from rehabilitation works is recognized and measured by the Group in accordance with PAS 11 and PAS 18 for the services it performs. Costs related to rehabilitation works is recorded as part of SCA. When the Group provides construction or upgrade services, the consideration received or receivable is recognized at its fair value. The Group accounts for revenue and costs relating to operation services in accordance with PAS 18. Revenue from pipeworks and management contracts are recognized using the percentage of completion method of accounting, measured principally on the basis of the physical proportion of the contract work to the estimated completion of a project. Consultancy fees are recognized when the related services are rendered. Other customer related fees such as reconnection and disconnection fees are recognized when these services have been rendered. The Group assesses its revenue arrangements against specific criteria in order to determine if it is acting as principal or agent. The Group has concluded that it is acting as a principal in all of its revenue arrangements. Foreign Currency-Denominated Transactions Foreign exchange differentials arising from foreign currency transactions are credited or charged to operations. As approved by the MWSS Board of Trustees (BOT) under Amendment No. 1 of the Concession Agreement, the following will be recovered through billings to customers: a. Restatement of foreign currency-denominated loans; b. Excess of actual Concession Fee payment over the amounts of Concession Fees translated using the base exchange rate assumed in the business plan approved every rate rebasing exercise. The current base exchange rate is = P44.00:US$1.00 based on the last rate rebasing exercise effective on January 1, 2008. c. Excess of actual interest payment translated at exchange spot rate on settlement date over the amount of interest translated at drawdown rate; and d. Excess of actual payment of other financing charges relating to foreign currency-denominated loans translated at exchange spot rate on settlement date over the amount of other financing charges translated at drawdown rate. *SGVMC115490* - 21 The functional and presentation currency of the Parent Company and its Philippine subsidiaries is the Philippine Peso (P =). Each entity in the Group determines its own functional currency and items included in the separate financial statements of each entity are measured using that functional currency. Transactions in foreign currencies are initially recorded in the functional currency rate ruling at the date of the transaction. Monetary assets and liabilities denominated in foreign currencies are retranslated at the functional currency rate of exchange ruling at the reporting date. All differences are taken to profit or loss with the exception of differences on foreign currency borrowings that provide a hedge against a net investment in a foreign entity. These are recognized in other comprehensive income until the disposal of the net investment, at which time they are recognized in profit or loss. Tax charges and credits attributable to exchange differences on those borrowings are also dealt with in equity. Nonmonetary items that are measured in terms of historical cost in a foreign currency are translated using the exchange rate as at the date of initial transaction. Nonmonetary items measured at fair value in a foreign currency are translated using the exchange rate at the date when the fair value was determined. The functional currency of MWAP and MWSAH is Singapore Dollar (SGD). As at the reporting date, the assets and liabilities of these subsidiaries are translated into the presentation currency of the Group at the rate of exchange ruling at the reporting date and their statement of comprehensive income accounts are translated at the weighted average exchange rates for the year. The exchange differences arising on the translation are recognized in other comprehensive income and reported as a separate component of equity. On disposal of a foreign entity, the deferred cumulative amount recognized in other comprehensive income relating to that particular foreign operation shall be recognized in profit or loss. In view of the automatic reimbursement mechanism, the Parent Company recognizes deferred FCDA (included as part of “Other noncurrent assets” or “Accounts and other payables” in the statement of financial position) for both the realized and unrealized foreign exchange gains and losses. Other water revenue-FCDA is credited (debited) upon recovery (refund) of realized foreign exchange losses (gains). The write-off or reversal of the deferred FCDA pertaining to concession fees will be made upon determination of the rebased foreign exchange rate, which is assumed in the business plan approved by MWSS-RO during the latest Rate Rebasing exercise, unless indication of impairment of the deferred FCDA would be evident at an earlier date. Borrowing Costs Borrowing costs that are directly attributable to the acquisition, development, improvement and construction of fixed assets (including costs incurred in connection with rehabilitation works) that are recorded as SCA are capitalized as part of the cost of fixed assets. All other borrowing costs are expensed in the period they occur. The Group uses the general borrowings approach when capitalizing borrowing costs wherein the amount of borrowing costs eligible for capitalization is determined by applying a capitalization rate to the expenditures on that asset. The capitalization of those borrowing costs commences when the activities to prepare the asset are in progress and expenditures and borrowing costs are being incurred. Capitalization of borrowing costs ceases when substantially all activities necessary in preparing the related assets for their intended use are complete. Borrowing costs include interest charges and other related financing charges incurred in connection with the borrowing of funds. Premiums and/or discounts on long-term debt are included in the “Long-term debt” account in the Group’s consolidated statement of financial position and are amortized using the effective interest rate method. *SGVMC115490* - 22 Retirement Cost Retirement cost is actuarially determined using the projected unit credit method. The projected unit credit method reflects the services rendered by the employees to the date of valuation and incorporates assumptions concerning employees’ projected salaries. Actuarial valuations are conducted with sufficient regularity, with option to accelerate when significant changes to underlying assumptions occur. Retirement cost includes current service cost, interest cost, actuarial gains and losses and the effect of any curtailment or settlement. The liability recognized by the Group in respect of the defined benefit pension plan is the present value of the defined benefit obligation at the financial reporting date together with adjustments for unrecognized actuarial gains or losses and past service costs that shall be recognized in later periods. The present value of the defined benefit obligation is determined by discounting the estimated future cash outflows using risk-free interest rates of government bonds that have terms to maturity approximating to the terms of the related pension liabilities or applying a single weighted average discount rate that reflects the estimated timing and amount of benefit payments. Actuarial gains and losses are recognized as income or expense when the net cumulative unrecognized actuarial gains and losses of the plan at the end of the previous reporting year exceeded 10% of the higher of the defined benefit obligation and the fair value of plan assets at that date. These actuarial gains and losses are recognized over the expected average remaining working lives of the employees participating in the plan. Share-Based Payment Certain employees and officers of the Group receive remuneration in the form of share-based payment, whereby they render services in exchange for shares or rights over shares (‘equitysettled transactions’) (see Note 20). The cost of equity-settled transactions with employees is measured by reference to the fair value at the date of grant. The fair value is determined by using the Black-Scholes model, further details of which are given in Note 20. The cost of equity-settled transactions is recognized in the consolidated statement of comprehensive income, together with a corresponding increase in equity, over the period in which the performance conditions are fulfilled, ending on the date on which the relevant employees become fully entitled to the award (‘vesting date’). The cumulative expense recognized for equity-settled transactions at each reporting date until the vesting date reflects the extent to which the vesting period has expired and the number of awards that, in the opinion of the directors of the Group at that date, will ultimately vest. No expense is recognized for awards that do not ultimately vest, except for awards where vesting is conditional upon a market condition, which are treated as vesting irrespective of whether or not the market condition is satisfied, provided that all other performance conditions are satisfied. Where the terms of an equity-settled award are modified, as a minimum, an expense is recognized as if the terms had not been modified. An additional expense is recognized for any increase in the value of the equity-settled award (measured at the date of modification). The total increase in value of the equity-settled award is amortized over the remaining vesting period. *SGVMC115490* - 23 Where an equity-settled award is cancelled, it is treated as if it had vested on the date of cancellation, and any expense not yet recognized for the award is recognized immediately. However, if a new award is substituted for the cancelled award, and designated as a replacement award on the date that it is granted, the cancelled and new awards are treated as if it were a modification of the original award, as described in the previous paragraph. The dilutive effect of outstanding options is reflected as additional share dilution in the computation of earnings per share (see Note 21). Treasury Stock Treasury stock is recorded at cost and is presented as a deduction from equity. When these shares are re-issued, the difference between the acquisition cost and the reissued price is charged/credited to additional paid-in capital. When the shares are retired, the capital stock account is reduced by its par value and the excess of cost over par value upon retirement is debited to additional paid-in capital to the extent of the specific or average additional paid-in capital when the shares were issued and to retained earnings for the remaining balance. Income Tax Current tax Current tax assets and liabilities for the current and prior periods are measured at the amount expected to be recovered from or paid to the taxation authorities. The tax rates and tax laws used to compute the amount are those that are enacted or substantively enacted as of the financial reporting date. Deferred tax Deferred tax is provided, using the liability method, for all temporary differences, with certain exceptions, at the financial reporting date between the tax bases of assets and liabilities and their carrying amounts for financial reporting purposes. Deferred tax liabilities are recognized for all taxable temporary differences with certain exceptions. Deferred tax assets are recognized for all deductible temporary differences to the extent that it is probable that taxable income will be available against which the deferred income tax assets can be used or when there are sufficient taxable temporary differences which are expected to reverse in the same period as the expected reversal of the deductible temporary differences. The carrying amount of deferred income tax assets is reviewed at each financial reporting date and reduced to the extent that it is no longer probable that sufficient taxable income will be available to allow all or part of the deferred tax assets to be utilized. Unrecognized deferred tax assets are reassessed at each financial reporting date and are recognized to the extent that it has become probable that future taxable income will allow all or part of the deferred tax assets to be recovered. Deferred tax assets and liabilities are measured at the tax rate that is expected to apply in the year when the asset is realized or the liability is settled, based on tax rates and tax laws that have been enacted or substantively enacted as of the financial reporting date. Deferred tax assets and liabilities are offset, if a legally enforceable right exists to set off current tax assets against current income tax liabilities and the deferred income taxes relate to the same taxable entity and the same taxation authority. *SGVMC115490* - 24 Value-Added Tax (VAT) Revenue, expenses and assets are recognized net of the amount of sales tax except: • Where the tax incurred on a purchase of assets or services is not recoverable from the tax authority, in which case the tax is recognized as part of the cost of acquisition of the asset or as part of the expense item as applicable; and, • Receivables and payables that are stated with the amount of tax included. The net amount of tax recoverable from, or payable to, the tax authority is included as part of receivables or payables in the consolidated statement of financial position Earnings Per Share (EPS) Basic EPS is computed by dividing net income applicable to common and participating preferred stock by the weighted average number of common and equivalent preferred shares outstanding during the year and adjusted to give retroactive effect to any stock dividends declared and changes to preferred share participation rate during the period. The participating preferred shares participate in the earnings at a rate of 1/10 of the dividends paid to a common share. Diluted EPS is computed by dividing earnings attributable to common and participating preferred shares by the weighted average number of common shares outstanding during the period, after giving retroactive effect of any stock dividends during the period and adjusted for the effect of dilutive options. Outstanding stock options will have a dilutive effect under the treasury stock method only when the average market price of the underlying common share during the period exceeds the exercise price of the option. Where the effects of the assumed exercise of all outstanding options have anti-dilutive effect, basic and diluted EPS are stated at the same amount. Assets Held in Trust Assets which are owned by MWSS, POL and TIEZA but are operated by the Group under the Group’s concession agreement are not reflected in the consolidated statement of financial position but are considered as Assets Held in Trust (see Note 25). Provisions A provision is recognized when the Group has: (a) a present obligation (legal or constructive) as a result of a past event; (b) it is probable (i.e. more likely than not) that an outflow of resources embodying economic benefits will be required to settle the obligation; and (c) a reliable estimate can be made of the amount of the obligation. If the effect of the time value of money is material, provisions are determined by discounting the expected future cash flows at a pre-tax rate that reflects current market assessment of the time value of money and, where appropriate, the risks specific to the liability. Where discounting is used, the increase in the provision due to the passage of time is recognized as an interest expense. Where the Group expects a provision to be reimbursed, the reimbursement is not recognized as a separate asset but only when the reimbursement is virtually certain. Provisions are reviewed at each financial reporting date and adjusted to reflect the current best estimate. Events After Financial Reporting Date Any post year-end event up to the date of the auditors’ report that provide additional information about the Group’s financial position at the financial reporting date (adjusting events) is reflected in the consolidated financial statements. Any post year-end event that is not an adjusting event is disclosed in the notes to the consolidated financial statements when material. *SGVMC115490* - 25 Contingencies Contingent liabilities are not recognized in the consolidated financial statements. These are disclosed unless the possibility of an outflow of resources embodying economic benefits is remote. Contingent assets are not recognized in the consolidated financial statements but disclosed when an inflow of economic benefits is probable. 3. Management’s Judgments and Use of Estimates The preparation of the accompanying consolidated financial statements in conformity with PFRS requires management to make estimates and assumptions that affect the amounts reported in the consolidated financial statements and accompanying notes. The estimates and assumptions used in the accompanying consolidated financial statements are based upon management’s evaluation of relevant facts and circumstances as of the date of the consolidated financial statements. Actual results could differ from such estimates. Management believes the following represent a summary of these significant estimates and judgments: Service concession arrangement In applying Philippine Interpretation IFRIC 12, the Group has made a judgment that its concession agreements qualify under the Intangible Asset model. Refer to the accounting policy on the Group’s SCA for the discussion of Intangible Asset model (see Note 2). Impairment of AFS financial assets The Group treats AFS financial assets as impaired when there has been a significant or prolonged decline in the fair value below the cost of these assets or where other objective evidence of impairment exists. The determination of what is ‘significant’ or ‘prolonged’ requires judgment. The Group treats ‘significant’ generally as 20% or more and ‘prolonged’ as greater than 6 months for quoted securities. In addition, the Group evaluates other factors, including the future cash flows and the discount factors of these securities. Redeemable preferred shares In 2007, the Group redeemed its outstanding redeemable preferred shares amounting to 200 million. These shares are treated as equity and are therefore presented under the “equity” section of the consolidated statement of financial position, as management concluded that these are not mandatorily redeemable since the redemption of the redeemable preferred shares is at the Group’s option. See Note 20 for the related balances. Investments in subsidiaries The Parent Company considers LAWC and BIWC as its subsidiaries because it exercises control over the said entities. Control is the power to govern the financial and operating policies of an entity so as to obtain benefits from its activities and is presumed to exist when, directly or indirectly, it holds more than half of the issued share capital, or controls more than half of the voting power, or exercises control over the operation and management of the entity (see Note 4). Operating Lease Commitments – Company as Lessee. The Group has determined, based on the evaluation of the terms and conditions of the arrangements, that the significant risks and rewards for properties leased from third parties are retained by the lessors and accordingly, accounts for these contracts as operating leases. *SGVMC115490* - 26 Contingencies The Group is currently involved in various legal proceedings. The estimate of the probable costs for the resolution of these claims has been developed in consultation with internal and outside counsels handling the defense in these matters and is based upon an analysis of potential results. The Group currently does not believe these proceedings will have a material adverse affect on the Group’s financial position. It is possible, however, that future results of operations could be materially affected by changes in the estimates or in the effectiveness of the strategies relating to these proceedings (see Note 30). Use of Estimates Key assumptions concerning the future and other sources of estimation uncertainty at the reporting date that have a significant risk of causing a material adjustment to the carrying amounts of assets and liabilities within the next financial year are discussed below. Revenue and cost recognition The Group’s revenue recognition policies require management to make use of estimates and assumptions that may affect the reported amounts of revenues and costs. The Group’s revenue from pipeworks and management contracts recognized based on the percentage of completion are measured principally on the basis of the estimated completion of a physical proportion of the contract work, and by reference to the actual costs incurred to date over the estimated total costs of the project. Estimating allowance for doubtful accounts The Group maintains allowance for doubtful accounts based on the results of the individual and collective assessments under PAS 39. Under the individual assessment, the Group is required to obtain the present value of estimated cash flows using the receivable’s original effective interest rate. Impairment loss is determined as the difference between the receivable’s carrying amount and the computed present value. Factors considered in individual assessment are payment history, past due status and term. The collective assessment would require the Group to group its receivables based on the credit risk characteristics (industry, customer type, customer location, past-due status and term) of the customers. Impairment loss is then determined based on historical loss experience of the receivables grouped per credit risk profile. Historical loss experience is adjusted on the basis of current observable data to reflect the effects of current conditions that did not affect the period on which the historical loss experience is based and to remove the effects of conditions in the historical period that do not exist currently. The methodology and assumptions used for the individual and collective assessments are based on management’s judgment and estimate. Therefore, the amount and timing of recorded expense for any period would differ depending on the judgments and estimates made for the year. See Note 6 for the related balances. Estimating useful lives of property and equipment The Group estimates the useful lives of its property and equipment based on the period over which the assets are expected to be available for use. The Group reviews annually the estimated useful lives of property and equipment based on factors that include asset utilization, internal technical evaluation, technological changes, environmental and anticipated use of the assets tempered by related industry benchmark information. It is possible that future results of operations could be materially affected by changes in the Group’s estimates brought about by changes in the factors mentioned. A reduction in the estimated useful lives of property and equipment would increase depreciation and amortization and decrease noncurrent assets. See Note 9 for the related balances. *SGVMC115490* - 27 Asset impairment The Group assesses the impairment of assets (property and equipment, SCA, other current assets and other noncurrent assets) whenever events or changes in circumstances indicate that the carrying amount of an asset may not be recoverable. The factors that the Group considers important which could trigger an impairment review include the following: · · · significant underperformance relative to expected historical or projected future operating results; significant changes in the manner of usage of the acquired assets or the strategy for the Group’s overall business; and significant negative industry or economic trends. As described in the accounting policy, the Group estimates the recoverable amount as the higher of the net selling price and value in use. In determining the present value of estimated future cash flows expected to be generated from the continued use of the assets, the Group is required to make estimates and assumptions regarding the expected future cash generation of the assets, discount rates to be applied and the expected period of benefits. See Notes 8, 9, 12 and 13 for the related balances. Deferred tax assets The Group reviews the carrying amounts of deferred income taxes at each financial reporting date and reduces deferred tax assets to the extent that it is no longer probable that sufficient taxable income will be available to allow all or part of the deferred tax assets to be utilized. However, there is no assurance that the Group will generate sufficient taxable income to allow all or part of the deferred tax assets to be utilized. Also, the Group does not recognize certain deferred taxes on deductible temporary differences where doubt exists as to the tax benefits they will bring in the future. See Note 19 for the related balances. Deferred FCDA and Deferred Credits Under Amendment No. 1 of the Agreement, the Group is entitled to recover (refund) foreign exchange losses (gains) arising from MWSS loans and any concessionaire loans. For the unrealized foreign exchange losses, the Group recognized deferred FCDA as an asset since this is a resource controlled by the Group as a result of past events and from which future economic benefits are expected to flow to the Group. Unrealized foreign exchange gains, however, which will be refunded to the customers, are presented as deferred credits. Share-based payments The expected life of the options is based on the expected exercise behavior of the stock option holders and is not necessarily indicative of the exercise patterns that may occur. The expected volatility is based on the average historical price volatility of several water utility companies within the Asian region which may be different from the expected volatility of the shares of stock of the Group. See Note 20 for the related balances. Pension and other retirement benefits The determination of the obligation and cost of pension and other retirement benefits is dependent on the selection of certain assumptions used by actuaries in calculating such amounts (see Note 16) which include, among others, discount rate, expected return on plan assets and salary increase rate. While the Group believes that the assumptions are reasonable and *SGVMC115490* - 28 appropriate, significant differences in actual experience or significant changes in assumptions materially affect retirement obligations. Fair value of financial instruments Where the fair values of financial assets and financial liabilities recorded in the consolidated statement of financial position or disclosed in the notes cannot be derived from active markets, they are determined using internal valuation techniques using generally accepted market valuation models. The inputs to these models are taken from observable markets where possible, but where this is not feasible, estimates are used in establishing fair values. These estimates may include considerations of liquidity, volatility, and correlation (see Note 27). Derivative asset on a bond’s call option was valued using the Black’s option pricing model. Valuation inputs such as discount rate were based on credit adjusted interest rates as of value date while interest rate volatility was computed based on historical rates or data (see Note 27). 4. Business Combinations AWC On July 24, 2009, the Parent Company entered into share purchase agreements, effective September 1, 2009, with Asia Water Limited and All Asia Development Corporation for 100% interest in AWC. AWC owns 70% of LAWC, while the remaining 30% is owned by POL. LAWC has a 25-year concession with the POL which commenced on January 1, 2008, for the provision of water supply to the city of Sta. Rosa and the municipalities of Biñan and Cabuyao in POL (see Note 1). The purchase price allocation has been prepared and the following is a summary of the fair values of the assets acquired and liabilities assumed as of the date of the acquisition: Assets Cash Receivables Materials and supplies Other current assets Property and equipment (Note 9) Service concession assets (Note 10) Other noncurrent assets Liabilities Accounts and other payables Income tax payable Pension liabilities (Note 16) Net assets Less noncontrolling interest Goodwill arising from acquisition Acquisition cost =10,274,263 P 8,500,607 667,949 2,358 2,292,774 282,482,865 802,689 305,023,505 33,604,608 2,867,659 1,836,544 38,308,811 266,714,694 87,167,825 179,546,869 – =179,546,869 P *SGVMC115490* - 29 Cash flows from acquisition follow: Net cash acquired with the subsidiary Cash paid Net cash outflow P10,274,263 = 179,546,869 =169,272,606 P From the date of acquisition up to December 31, 2009, AWC has contributed P =0.34 million loss to the net income of the Group. If the contribution had taken place at the beginning of the year, the net income for the Group would have increased by P =2.43 million and revenue would have increased by P =43.14 million. BIWC On April 21, 2009, the Parent Company entered into an agreement with TIEZA for the formation of BIWC, to exclusively operate and manage the water supply and wastewater facilities and the existing TIEZA drainage facilities in Boracay Island, Province of Aklan. BIWC was incorporated on December 7, 2009, in which the Group owns 80% and TIEZA owns 20% of BIWC’s total outstanding capital of P =300.00 million. On December 17, 2009, BIWC entered into a Concession Agreement with TIEZA for a period of 25 years, with commencement date on January 1, 2010 and renewable at any time prior to expiration for another 25 years, without the necessity of bidding. As part of the agreement, BIWC advanced concession fees to TIEZA amounting to =60.00 million, which will be applied as payment of, and shall be offset against the annual P concession fees payable to TIEZA equivalent to 5% of the annual gross revenue of BIWC, within a period of 10 years from the signing of the concession agreement or until fully paid (see Note 29). BIWC and LAWC are treated as subsidiaries because the Parent Company has the power to govern their financial and operating policies. 5. Cash and Cash Equivalents and Short-Term Cash Investments Cash and cash equivalents consists of: Cash on hand and in banks Cash equivalents 2010 P = 1,311,129,058 1,101,783,206 P = 2,412,912,264 2009 =1,198,748,489 P 2,839,092,217 =4,037,840,706 P Cash in banks earns interest at the respective bank deposit rates. Cash equivalents are highly liquid investments that are made for varying periods of up to three months depending on the immediate cash requirements of the Group, and earn interest at the respective short-term rates. Short-term cash investments pertain to the Group’s time deposits with maturities of more than three months up to one year and earn interest of up to 4.5% in 2010 and up to 11.5% in 2009. Interest income earned from cash in banks and short-term investments amounted to P =11.49 million and P =4.71 million for the years ended December 31, 2010 and 2009, respectively (see Note 18). *SGVMC115490* - 30 - 6. Receivables This account consists of receivables from: Customers (Note 22) Residential Commercial Semi-business Industrial Employees Receivable from Saigon Water Corporation (SAWACO) Interest from banks Others Less allowance for doubtful accounts 2010 2009 P =589,605,334 145,714,085 39,947,640 6,674,470 50,389,222 =656,788,230 P 178,804,293 49,168,679 17,311,841 59,720,050 47,699,550 21,767,660 93,924,819 995,722,780 (513,554,936) P =482,167,844 8,954,910 47,094,069 49,427,896 1,067,269,968 (558,397,976) =508,871,992 P The classes of the Group’s receivables from customers, collectible within 30 days from bill generation, are as follows: · · · · Residential - pertains to receivables arising from water and sewer services rendered to residential households. Commercial - pertains to receivables arising from water and sewer services rendered to commercial customers. Semi-business - pertains to receivables arising from water and sewer services rendered to small businesses. Industrial - pertains to receivables arising from water and sewer services rendered for industrial purposes, including manufacturers. Receivable from SAWACO pertains to the unpaid portion of the services rendered by the Group in relation to its management contract with SAWACO (see Note 23). Movements in the Group’s allowance for doubtful accounts follow: At January 1 Provision (recoveries) At December 31 Individual impairment Collective impairment At January 1 Recoveries At December 31 Individual impairment Collective impairment Residential = 333,324,184 P 30,141,681 = 363,465,865 P = 29,489,562 P 333,976,303 2010 Receivable from Customers Commercial Semi-Business Industrial = 175,898,906 P = 35,469,596 P P11,736,914 = (90,035,753) (9,218,756) (7,793,095) = 85,863,153 P = 26,250,840 P = 3,943,819 P = 24,431,877 P = 6,830,112 P =722,133 P 61,431,276 19,420,728 3,221,686 Other Receivables =1,968,376 P 32,062,883 =34,031,259 P =– P 34,031,259 Total = 558,397,976 P (44,843,040) = 513,554,936 P = 61,473,684 P 452,081,252 Residential =361,803,082 P (28,478,898) =333,324,184 P =245,933,143 P 87,391,041 2009 Receivable from Customers Commercial Semi-Business Industrial =193,217,960 P =38,195,048 P P12,696,521 = (17,319,054) (2,725,452) (959,607) =175,898,906 P =35,469,596 P =11,736,914 P =174,442,145 P =31,051,360 P =10,231,654 P 1,456,761 4,418,236 1,505,260 Other Receivables =7,119,476 P (5,151,100) =1,968,376 P =– P 1,968,376 Total =613,032,087 P (54,634,111) =558,397,976 P =461,658,302 P 96,739,674 *SGVMC115490* - 31 - 7. Materials and Supplies This account consists of: 2009 =33,596,832 P 2,928,841 834,384 802,002 272,663 =38,434,722 P 2010 P =41,147,219 14,148,703 456,562 71,514 Maintenance materials Water treatment chemicals Water meters Water connection supplies Other operations supplies – P =55,823,998 8. Other Current Assets This account consists of: Advances to contractors Input value-added tax Prepaid expenses Others Less allowance for impairment losses (Note 19) 2010 P = 1,289,466,824 110,181,664 61,053,446 28,054,422 1,488,756,356 (86,436,083) P = 1,402,320,273 2009 =668,010,059 P 194,627,240 45,331,680 29,496,650 937,465,629 (69,101,543) =868,364,086 P Value-added input tax is fully realizable and will be applied against future output tax. Advances to contractors are normally applied within a year against progress billings. Movements in the Group’s allowance for impairment losses on Advances to contractors follow: 2010 P =69,101,543 17,334,540 P =86,436,083 Balance at beginning of the year Provisions for the year Balance at end of the year 2009 =– P 69,101,543 =69,101,543 P 9. Property and Equipment The rollforward analysis of this account follows: 2010 Office Furniture and Equipment Cost At January 1 Additions Disposals At December 31 = 702,844,927 P 143,931,264 – 846,776,191 Transportation Equipment = 315,490,433 P 36,251,768 (22,542,337) 329,199,864 Land and Leasehold Improvements Plant and Technical Equipment P725,292,996 = 655,230,184 – 1,380,523,180 = 421,871,356 P 227,520,789 (42,522) 649,349,623 Total P2,165,499,712 = 1,062,934,005 (22,584,859) 3,205,848,858 (Forward) *SGVMC115490* - 32 - Office Furniture and Equipment Accumulated Depreciation and Amortization At January 1 Depreciation and amortization Disposals At December 31 Net Book Value at December 31 = 512,716,902 P 121,987,470 – 634,704,372 = 212,071,819 P Transportation Equipment = 155,104,563 P 60,780,041 (14,582,927) 201,301,677 = 127,898,187 P Land and Leasehold Improvements Plant and Technical Equipment P93,341,735 = 22,170,824 – 115,512,559 = 1,265,010,621 P = 199,018,722 P 82,013,720 – 281,032,442 = 368,317,181 P Total = 960,181,922 P 286,952,055 (14,582,927) 1,232,551,050 =1,973,297,808 P 2009 Cost At January 1 Additions Acquired through business combination (see Note 4) Transfers from SCA (Note 10) Disposals At December 31 Accumulated Depreciation and Amortization At January 1 Depreciation and amortization Transfers from SCA (Note 10) Disposals At December 31 Net Book Value at December 31 Office Furniture and Equipment Transportation Equipment Land and Leasehold Improvements Plant and Technical Equipment Total =568,294,396 P 133,700,132 =289,179,433 P 26,498,410 =447,189,522 P 278,102,635 =– P 5,061,422 =1,304,663,351 P 443,362,599 888,799 – (38,400) 702,844,927 1,403,136 – (1,590,546) 315,490,433 839 – – 725,292,996 – 416,809,934 – 421,871,356 2,292,774 416,809,934 (1,628,946) 2,165,499,712 406,922,108 105,833,194 – (38,400) 512,716,902 =190,128,025 P 100,456,300 56,063,124 – (1,414,861) 155,104,563 =160,385,870 P 74,387,213 18,954,522 – – 93,341,735 =631,951,261 P 870,653 198,148,069 – 199,018,722 =222,852,634 P 581,765,621 181,721,493 198,148,069 (1,453,261) 960,181,922 =1,205,317,790 P The Group reclassified certain assets from SCA to Property and Equipment (see Note 32). 10. Service Concession Assets and Obligations Service Concession Assets The movements in this account follow: Cost Balance at beginning of year Additions during the year (Note 1) Acquired through business combination (Note 4) Transfers to property and equipment (Note 9) Balance at end of year Accumulated Amortization Balance at beginning of year Amortization Transfers to property and equipment (Note 9) Balance at end of year Net Book Value 2010 2009 P = 38,511,793,144 8,698,422,047 =30,902,632,568 P 7,743,487,645 – – 47,210,215,191 282,482,865 (416,809,934) 38,511,793,144 8,565,313,658 1,184,943,627 – 9,750,257,285 P = 37,459,957,906 6,988,843,592 1,774,618,135 (198,148,069) 8,565,313,658 =29,946,479,486 P *SGVMC115490* - 33 SCA consist of the present value of total estimated concession fee payments, including regulatory maintenance cost, pursuant to the Group’s concession agreements and the costs of rehabilitation works incurred. Total interest and other borrowing costs capitalized as part of SCA amounted to P =207.90 million in 2010 and P =168.70 million in 2009. The capitalization rates used ranged from 3.73% to 6.03% in 2010 and 3.98% to 6.29% in 2009. In March 2010, the Parent Company entered into a MOA with MWSS for the repayment of the loan for the financing of the Project which resulted to additional SCA and SCO amounting to =249.43 million in 2010 (see Note 1). P In 2009, the Parent Company recognized additional concession fees pertaining to its share in the current operating budget of MWSS resulting from the extension of the life of the Agreement to 2037 (see Note 1), specifically the 100% increase in regulatory costs to be paid to MWSS. The Company remeasured the service concession obligation related to the additional regulatory costs using the present value of the revised cash flows starting 2010 until 2037. The increase in the service concession obligation resulting from the revised cash flows, which amounted to =3.36 billion, was capitalized as part of SCA. P POL Concession Fees Under LAWC’s concession agreement with POL, LAWC is required to pay concession fees to POL as percentage of water sales as follows: Operational Period Years 1 to 5 Years 6 to 10 Years 11 to 25 Percentage of Water Sales 4% 3% 2% Advance payment to POL was made for the said concession fees and 70% of the annual concession fees is applied against the said advances. The remaining thirty percent (30%) of the annual concession fees is expensed in the period they are incurred. BIWC Concession Fees The aggregate concession fee pursuant to the Agreement is equal to the sum of the following: a. Servicing the aggregate peso equivalent of all liabilities of BWSS as of commencement date; b. 5% of the monthly gross revenue of the Concessionaire, inclusive of all applicable taxes which are for the account of the Concessionaire. c. Payment of annual operating budget of the TIEZA Regulatory Office starting 2010. For 2010 and 2011, the amount shall not exceed = P15 million. For the year 2012 and beyond, the Concessionaire shall pay not more than P =20 million, subject to annual CPI adjustments. In addition, advanced payment of P =60 million was provided to TIEZA which shall be offset against the annual concession fees pertaining to the 5% annual gross revenue of BIWC, within a period of 10 years from the signing of the concession agreement or until fully paid. Any amount payable after application of the advanced payment will be expensed in the period this is incurred. *SGVMC115490* - 34 Service Concession Obligations MWSS Concession Fees The aggregate concession fees of the Parent Company pursuant to the Agreement is equal to the sum of the following: d. 10% of the aggregate peso equivalent due under any MWSS loan which has been disbursed prior to the Commencement Date, including MWSS loans for existing projects and the Umiray Angat Transbasin Project (UATP), on the prescribed payment date; e. 10% of the aggregate peso equivalent due under any MWSS loan designated for the UATP which has not been disbursed prior to the Commencement Date, on the prescribed payment date; f. 10% of the local component costs and cost overruns related to the UATP; g. 100% of the aggregate peso equivalent due under MWSS loans designated for existing projects, which have not been disbursed prior to the Commencement Date and have been either awarded to third party bidders or elected by the Parent Company for continuation; and h. 100% of the local component costs and cost overruns related to existing projects; and i. Parent Company’s share in the repayment of MWSS loan for the financing of the Project. The schedule of undiscounted future concession fee payments follows: Year 2011 2012 2013 2014 2015 2016 onwards In Original Currency Foreign Currency Denominated Loans Peso Loans/Project (Translated to US Dollars) Local Support $18,818,634 =410,714,907 P 11,309,620 415,714,907 11,838,464 415,714,907 12,593,816 415,714,907 7,349,499 415,714,907 84,659,903 8,690,013,043 $146,569,936 =10,763,587,578 P Total Peso Equivalent* =1,235,723,801 P 911,528,661 934,713,174 967,827,892 737,916,928 12,401,503,211 =17,189,213,667 P *Peso equivalent is translated using the closing rate as of December 31, 2010 amounting to P =43.84 to:US$1. Estimated concession fee payments on future concession projects, excluding the Parent Company’ share in current operating budget, related to the Extension (see Note 1) is still not determinable. It is only determinable upon loan drawdown of MWSS and their actual construction of the related concession projects. *SGVMC115490* - 35 - 11. Available-for-Sale Financial Assets This account consists of investments in: Quoted investments - at fair value (see Note 22) Debt Equity Investment Management Agreement (IMA) accounts Unquoted investments (see Note 22) Debt Investment in TRILITY Pty. LTD. Equity 2010 2009 P =160,060,157 162,000,000 =450,852,323 P 156,000,000 683,186,778 639,162,815 758,494,624 78,100,600 7,063,950 P =1,848,906,109 714,048,438 – 7,063,950 =1,967,127,526 P Quoted investments in debt securities consist mainly of government securities such as retail treasury bonds. These bonds earn interest ranging from 6% to 9% in 2010 and 6% to 11% in 2009 with various maturity dates of up to five years. Quoted investments in equities pertain to listed preferred shares of a shareholder (see Note 22). Quoted investments in IMA accounts pertain to the Group’s funds that are managed by certain banks, including an affiliate (see Note 22). Unquoted investments in equities include unlisted preferred shares in a public utility company which the Group will continue to carry as part of its operations and Investment in TRILITY is MWSAH’s 1% share in TRILITY. These investments are carried at cost less impairment, if any. Changes in this account are as follows: 2010 Balance at beginning of year Additions during the year Disposals during the year Amortization of discount Fair value adjustments At December 31 Quoted P =1,246,015,138 – (295,268,557) – 54,500,354 P =1,005,246,935 Unquoted Total P =721,112,388 P =1,967,127,526 78,100,600 78,100,600 – (295,268,557) 4,763,299 4,763,299 39,682,887 94,183,241 P =843,659,174 P =1,848,906,109 Quoted =1,069,035,212 P 210,000,000 (78,931,460) – 45,911,386 =1,246,015,138 P Unquoted Total P482,281,167 = = P1,551,316,379 241,922,051 451,922,051 (5,217,218) (84,148,678) 2,126,388 2,126,388 – 45,911,386 =721,112,388 P P =1,967,127,526 2009 Balance at beginning of year Additions during the year Disposals during the year Amortization of discount Fair value adjustments At December 31 *SGVMC115490* - 36 The rollforward analysis of unrealized gain on AFS financial assets for 2010 and 2009 follows: Balance at beginning of year Gain recognized in other comprehensive income Gain transferred from other comprehensive income and recognized in profit and loss included in interest income Balance at end of year 2010 P =52,548,379 94,183,241 2009 P6,670,143 = 45,911,386 (1,801,798) P =144,929,822 (33,150) =52,548,379 P 12. Investment in Joint Venture On February 5, 2010, the Parent Company entered into a Joint Venture Agreement (JVA) with Jindal Water Infrastructure Limited (JWIL). The JVA established the joint venture company Jindal Manila Water Development, Co. Ltd. (JMWD), to serve as a vehicle for the planning and development of water, wastewater and other environmental services in India. The financial information of JMWD as of and for the year ended December 31, 2010 follows: Total assets Total liabilities Revenue Net loss =14,231,638 P 695,055 – 3,077,133 The rollforward analysis of the investment in joint venture follows: =7,133,182 P Acquisition cost Accumulated equity in net loss Balance at beginning of the year Equity in net loss Balance at end of the year Net book value – (1,538,567) (1,538,567) =5,594,615 P The BOD of JMWD approved the development expense budget of the joint venture for the first three financial years amounting to US$1.9 million, 50% of which will be funded by the Parent Company. 13. Other Noncurrent Assets This account consists of: Deferred FCDA Derivative asset (Note 27) Advances to TIEZA (Notes 4 and 23) Miscellaneous 2010 P =725,872,976 229,613,149 2,792,904 63,968,112 P = 1,022,247,141 2009 =827,006,852 P 158,817,648 60,000,000 44,674,397 =1,090,498,897 P *SGVMC115490* - 37 Deferred FCDA refers to the unrecovered amounts from /or amounts for refund to customers for realized gains /losses from payments of foreign loans. This is the difference between the drawdown or rebased rate versus the closing rate at payment date. This account also covers the unrealized gains/losses from loan valuations, accrual of interest and accretion of transaction and related costs. Derivative asset pertains to the embedded call option on the = P4.0 billion bonds that gives the Parent Company the right to redeem all but not in part the outstanding bonds on the twelfth quarterly interest payment date (see Note 27). Advances to TIEZA pertains to the advance payment of concession fees to TIEZA by BIWC which will be applied as payment of, and shall be offset against the annual concession fees payable to TIEZA (see Note 4). The = P60 million advance payment was considered part of the concession assets in 2010 (see Note 10). 14. Accounts and Other Payables This account consists of: Trade payables Accrued expenses Salaries, wages and employee benefits Utilities Management and professional fees Collection fees Wastewater costs Repairs and maintenance Occupancy costs Other accrued expenses Contracts payable Interest payable Advances from SAWACO Dividends payable (Note 20) Note payable Meter deposits payable Others 2010 P = 1,994,518,543 2009 =1,606,005,112 P 299,811,711 88,374,914 67,801,467 44,645,354 41,673,965 36,498,631 24,064,757 66,043,823 207,993,092 173,596,057 48,880,995 11,393,764 – – 42,599,289 P = 3,147,896,362 289,675,169 80,777,987 55,079,696 43,431,615 40,540,926 28,748,758 20,967,378 45,568,028 199,246,683 217,104,950 62,219,480 43,765,598 5,000,000 2,193,323 38,578,018 =2,778,902,721 P Trade payables and accrued expenses are non-interest bearing and are normally settled on 15 to 60-day terms. Other payables are non-interest bearing and are normally settled within one year. Advances from SAWACO pertains to the advance payment made by SAWACO to the Parent Company to facilitate the start up and operating expenses related to the management contract entered with SAWACO (see Note 23). These are offset against the progress billings made by the Parent Company. Contracts payable pertain to unpaid contractors’ billings. These are normally settled on 15-to-60day terms. *SGVMC115490* - 38 Meter deposits payable pertain to payments made by the customers as deposits for the water meters provided by the Group. These are refunded to customers upon mandate from MWSS. As of December 31, 2010, all of these deposits were refunded to the customers. Short-term interest-bearing note amounting to = P5.00 million was originally availed by LAWC from a local bank on October 5, 2006 with an annual interest rate of 8.75%. This note was renewed annually from 2007-2009 and was paid in 2010. 15. Long-term Debt This account consists of: USD loans EIB loan Second IFC loan DEG loan DANIDA loan Yen loans First IFC loan EIB loan LBP loan Peso loans (see Note 27) =4.0 billion bonds P =2.0 billion loan P =1.5 billion loan P =500 million loan P Less current portion 2010 2009 P = 1,057,574,208 884,512,921 177,727,218 – =1,284,289,953 P 1,101,954,878 311,441,955 13,015,620 1,128,403,649 2,405,025,082 1,660,743,138 1,200,436,076 2,595,483,913 1,258,253,125 4,128,152,766 4,097,996,503 1,393,901,300 1,395,366,921 1,074,220,654 1,080,335,539 – 246,185,538 14,133,870,717 14,361,150,240 1,060,783,617 1,174,649,296 P13,300,366,623 = 12,959,221,421 = P Unamortized debt discounts and issuance costs (premiums) included in the following long-term debts as of December 31, 2010 and 2009 follow: Yen loans USD loans Peso loans 2010 P =169,656,826 91,804,054 (69,884,500) P =191,576,380 2009 =198,403,792 P 116,703,758 (96,274,720) =218,832,830 P The rollforward analysis of unamortized debt discounts and issuance costs (premiums) of longterm debt follows: Balance at beginning of the year Availments Amortization of transaction costs (Note 18) Balance at end of the year 2010 P =218,832,830 15,892,678 (43,149,128) P =191,576,380 2009 (P =13,963,669) 249,478,919 (16,682,420) =218,832,830 P *SGVMC115490* - 39 The EUR€2.22 million Euro loan (the “DANIDA loan”), executed on August 24, 2001, was drawn under the Danish International Development Agency (DANIDA) credit facility and is secured by an irrevocable standby letter of credit issued by a local bank. The noninterest-bearing loan is payable in US Dollars in 16 equal semi-annual consecutive installments starting on March 31, 2003. As of December 31, 2010, all outstanding balance for this loan has been settled. On July 1, 2002, the Parent Company entered into a loan agreement with Deutsche Investitionsund Entwicklungsgesellschaft mbH (DEG) to partially finance capital expenditures required to expand water supply and sanitation services and improve the existing facilities of the Parent Company. The loan was made available in US Dollars in the aggregate principal amount of US$20.00 million and is payable in 10 years, inclusive of the 3-year grace period. As of December 31, 2010 and 2009, outstanding loans amounted to US$4.07 million and US$6.79 million, respectively. On March 28, 2003, the Parent Company entered into a loan agreement with IFC (the “First IFC Loan”) to partially finance the Parent Company’s investment program from 2002-2005 to expand water supply and sanitation services, improvement on the existing facilities of the Parent Company, and concession fee payments. The First IFC Loan was made available in Japanese Yen in the aggregate principal amount of JPY¥3,591.60 million equivalent to US$30.00 million and shall be payable in 25 semi-annual installments, within 12 years starting on July 15, 2006. As of December 31, 2010 and 2009, outstanding loans amounted to JPY¥2,154.96 million and JPY¥2,442.29 million, respectively. On May 31, 2004, the Parent Company entered into a loan agreement with IFC (the “Second IFC Loan”) comprising of regular loan in the amount of up to US$20.00 million and a standby loan in the amount of up to US$10.00 million to finance the investment program from 2004 to 2007 to expand water supply and sanitation services, improvement of existing facilities of the Parent Company, and concession fee payments. This loan was subsequently amended on November 22, 2006, when the Parent Company executed the Amended and Restated Loan Agreement for the restructuring of the Second IFC Loan. The terms of the second loan were amended to a loan in the aggregate amount of up to US$30.00 million, no part of which shall consist of a standby loan. On December 12, 2008, the Parent Company has made a full drawdown on the said facility. As of December 31, 2010 and 2009, outstanding loans amounted to US$22.00 million and US$26.00 million, respectively. On October 20, 2005, the Parent Company entered into a Subsidiary Loan Agreement with Land Bank of the Philippines (LBP Loan) to finance the improvement of the sewerage and sanitation conditions in the East Zone. The loan has a term of 17 years, and was made available in Japanese Yen in the aggregate principal amount of JPYY6.59 billion payable via semi-annual installments after the five-year grace period. As of December 31, 2010 and 2009, outstanding loans amounted to JPYY3,125.37 million and JPYY2,516.42 million, respectively. On August 22, 2006, the Parent Company entered into a Credit Facility Agreement (the “P =2 billion Loan”) with five banks and four financial institutions to finance the capital expenditures of the Parent Company pursuant to the Concession Agreement. This 7-year term loan with an aggregate principal amount of P =2.0 billion consists of the following: · Tranche 1: 7-year term loan amounting to P =1.50 billion (the Tranche 1 Loan). Such loan shall be subject to a yearly amortization of P =10 million at the end of the 5th and 6th years, and bullet repayment of the balance at the end of the 7th year; and *SGVMC115490* - 40 · Tranche 2: 7-year term loan, with a Put Option at the end of the fifth (5th) year, amounting to =500.00 million (the Tranche 2 Loan). Such loan shall be subject to a bullet repayment at the P end of the 5th year if the lenders exercise their Put Option; If the Put Option is not exercised, the loan will be subject to a yearly amortization of = P10 million at the end of the 5th and 6th years, and bullet repayment of the balance at the end of the 7th year. On June 16, 2008, the Company prepaid a portion of the = P2 billion loan from one financial institution amounting to P =600.00 million. As of December 31, 2010 and 2009, the outstanding balance for this loan amounted to P =1.40 billion. On October 9, 2006, the Parent Company entered into a Credit Facility Agreement (the “P =1.5 billion Loan”) with three banks and a financial institution to finance the capital expenditures of the Parent Company pursuant to the Agreement. This 7-year term loan with an aggregate principal amount of P =1.5 billion consists of the following: · Tranche 1: 7-year term loan amounting to P =950.00 million (the Tranche 1 Loan). Such loan shall be subject to a yearly amortization of one percent (1%) of the Tranche 1 Loan at the end of the 5th and 6th years, and bullet repayment of the balance at the end of the 7th year; and · Tranche 2: 7-year term loan, with a Put Option at the end of the fifth (5th) year, amounting to =550.00 million (the Tranche 2 Loan). Such loan shall be subject to a bullet repayment at the P end of the 5th year if the lenders exercise their Put Option. If the Put Option is not exercised, the loan will be subject to a yearly amortization of one percent (1%) of the Tranche 2 Loan at the end of the 5th and 6th years, and bullet repayment of the balance at the end of the 7th year. On June 16, 2008, the Company prepaid a portion of the = P1.5 billion loan from a financial institution amounting to P =400.00 million. As of December 31, 2010 and 2009, the outstanding balance for this loan amounted to P =1.10 billion. On June 20, 2007, the Parent Company entered into a Finance Contract (the “EIB Loan”) with the European Investment Bank (EIB) to partially finance the capital expenditures of the Parent Company from 2007 to 2010, as specified under Schedule 1 of the Finance Contract. The loan, in the aggregate principal amount of EUR€60 million, having a term of 10 years, is subject to the Relevant Interbank Rate plus a spread to be determined by EIB, and may be drawn in either fixedrate or floating-rate tranches. The loan has two tranches as described below: · Sub-Credit A: In an amount of EUR€40 million to be disbursed in US Dollars or Japanese yen payable via semi-annual installments after the two and a half-year grace period. This loan tranche is guaranteed against all commercial risks by a consortium of international commercial banks composed of ING Bank, Development Bank of Singapore and SumitomoMitsui Banking Corporation under a Guaranty Facility Agreement; and · Sub-Credit B: In an amount of EUR€20 million to be disbursed in US Dollars, European Euro or Japanese Yen payable via semi-annual installments after the two and a half-year grace period. This loan tranche is guaranteed against all commercial risks by ING Bank under a Guaranty Facility Agreement. The outstanding balance of the EIB loan amounted to JPYY4,700.74 million and US$24.38 million in 2010 and JPYY5,423.93 and US$28.13 million in 2009. *SGVMC115490* - 41 On October 22, 2008, the Parent Company issued P =4.0 billion bonds (“the = P4.0 billion Bonds”) having a term of five years from the issue date with a fixed interest rate equivalent to 8.25% payable quarterly. Prior to maturity, the Parent Company may redeem in whole, and not in part only, the relevant outstanding bonds on the twelfth interest payment date. The amount payable to the bondholders in respect of such redemptions shall be calculated based on the principal amount of the bonds being redeemed, as the sum of 102% of the principal amount and accrued interest on the bonds on the optional redemption date. All these loan agreements provide for certain covenants which must be complied by the Parent Company, which include compliance with certain financial ratios such as the debt-to-equity and debt-service-coverage ratios. As of December 31, 2010 and 2009, the Parent Company was in compliance with all the loan covenants required by the creditors. Previously, all of these loans were secured by way of first ranking charge over all assigned interests, including the right to receive payments or other consideration under the Agreement, all receivables and bank accounts, interests over all fixed assets (subject to the limitations under the Agreement) and assignment of proceeds of insurance policies. The agreement for the signing of these rights and interests were signed with the lenders at various dates of the loan signing. On July 17, 2008, the Parent Company, together with all of its Lenders signed an Omnibus Amendment Agreement and Intercreditor Agreement and these agreements became effective on September 30, 2008. Prior to the execution of the Omnibus Amendment Agreement, the obligations of the Parent Company to pay amounts due and owing or committed to be repaid to the lenders under the existing facility agreements were secured by Assignments of Interests by Way of Security executed by the Parent Company in favor of a trustee acting on behalf of the lenders. The Assignments were also subject to the provisions of the Amended and Restated Intercreditor Agreement dated March 1, 2004 and its Amendatory Agreement dated December 15, 2005 executed by the Parent Company, the lenders and their appointed trustee. Under the Omnibus Amendment Agreement, the lenders effectively released the Parent Company from the assignment of its present and future fixed assets, receivables and present and future bank accounts, all the Project Documents (except for the Agreement, Technical Corrections Agreement and the Department of Finance Undertaking Letter), all insurance policies where the Parent Company is the beneficiary and performance bonds posted in its favor by contractors or suppliers. In consideration for the release of the assignment of the above-mentioned assets, the Parent Company agreed not to create, assume, incur, permit or suffer to exist, any mortgage, lien, pledge, security interest, charge, encumbrance or other preferential arrangement of any kind, upon or with respect to any of its properties or assets, whether now owned or hereafter acquired, or upon or with respect to any right to receive income, subject only to some legal exceptions. The lenders shall continue to enjoy their rights and privileges as Concessionaire Lenders (as defined under the Agreement), which include the right to appoint a qualified replacement operator and the right to receive payments and/or other consideration pursuant to the Agreement in case of a default of either the Parent Company or MWSS. Currently, all lenders of the Parent Company (including the bondholders) are considered Concessionaire Lenders and are on pari passu status with one another. *SGVMC115490* - 42 On September 7, 2010, LAWC entered into a loan agreement with two local banks for the financing of its construction, operation, maintenance and expansion of facilities in its servicing area. Pursuant to the loan agreement, the lenders have agreed to provide loans to LAWC up to =500 million, principal payments of which will be made in 30 consecutive equal quarterly P installments starting August 2013. First draw of the loan was made in November 2010 amounting to = P250 million. The carrying value of this loan as of December 31, 2010 amounted to =246 million. P On October 21, 2010, the Company entered into a term loan agreement amounting US$150 million to partially finance capital expenditures within the East Zone. The loan has a tenor of 10 years and is financed by a syndication of four banks- ING N.V Tokyo, Mizuho Corporate Bank, Ltd., The Bank of Tokyo-Mitsubishi UFJ Ltd. and Sumitomo Mitsui Banking Corporation insured by Nippon Export and Investment Insurance. As of December 31, 2010, no drawdown has been made on the said facility. 16. Retirement Plan The Group has a funded, noncontributory, tax-qualified defined benefit pension plan covering substantially all of its regular employees. The benefits are based on current salaries and years of service and compensation on the last year of employment. The components of retirement cost (included in “Salaries, wages and employee benefits”) in the consolidated statements of comprehensive income for the three years in the period ended December 31, 2010 follow: 2010 Current service cost Interest cost on benefit obligation Expected return on plan assets Actuarial losses Total pension expense Actual return on plan assets P48,953 = 44,564 (16,369) 7,827 =84,975 P =29,852 P 2009 2008 (In Thousand Pesos) =10,629 P =43,905 P 83,564 28,736 (9,281) (9,568) – 4,001 =84,912 P =67,074 P =27,439 P (P =12,730) The funded status and amounts recognized in the consolidated statements of financial position for the pension plan as of December 31, 2010 and 2009 follow: Benefit obligations Plan assets Deficiency Unrecognized actuarial losses Net pension liabilities 2009 2010 (In Thousand Pesos) =496,219 P P = 601,510 (155,845) (235,880) 340,374 365,630 (138,955) (134,261) =201,419 P P = 231,369 *SGVMC115490* - 43 Changes in the present value of the defined benefit obligation are as follows: Balance at beginning of year Current service cost Interest cost Benefits paid Addition through business combination (Note 4) Actuarial losses Balance at end of year 2009 2010 (In Thousand Pesos) =296,439 P P = 496,219 10,629 48,953 83,564 44,564 (28,902) (4,842) 1,837 – 132,652 16,616 =496,219 P P = 601,510 Changes in the fair values of plan assets are as follows: Balance at beginning of year Expected return Contributions Benefits paid Actuarial gains Balance at end of year 2009 2010 (In Thousand Pesos) =157,308 P P =155,845 9,281 16,369 – 55,025 (28,902) (4,842) 18,158 13,483 =155,845 P P =235,880 Changes in the net unrecognized actuarial losses are as follows: Balance at beginning of year Actuarial gains (losses) on: Obligation Plan assets Actuarial losses recognized Balance at end of year 2009 2010 (In Thousand Pesos) (P = 24,461) (P =138,955) (16,616) 13,483 7,827 (P =134,261) (132,652) 18,158 – (P =138,955) The Group expects to contribute P =80 million to its benefit pension plan in 2011. The allocation of the fair value of plan assets is as follows: Investments in: Fixed income instruments Equity securities Others 2010 2009 74.70% 25.47% (0.17%) 76.30% 23.63% 0.07% The overall expected rate of return on assets is determined based on the market prices prevailing on that date, applicable to the period over which the obligation is to be settled. *SGVMC115490* - 44 The assumptions used to determine pension benefits for the Group for the years ended December 31, 2010, 2009 and 2008 follow: 2010 7.25% 8.00% 9.00% Discount rate Salary increase rate Expected rate of return on plan assets 2009 8.75 to 11.09% 5.00 to 9.00% 8.50% 2008 28.17% 10.70% 5.90% The average expected future working lives of employees of the Group as of December 31, 2010 is 11 years. Amounts for the current and the previous periods are as follows: 2010 Defined benefit obligation Plan assets Deficiency Experience adjustments on plan liabilities Experience adjustments on plan assets =601,510 P (235,880) =365,630 P =12,626 P 13,483 2009 2008 (In Thousand Pesos) =496,219 P =296,439 P (155,845) (157,308) =340,374 P =139,131 P =211,743 P =13,858 P 18,158 (22,298) 2007 P348,321 = (137,878) =210,443 P =15,798 P 2,530 17. Other Noncurrent Liabilities Other noncurrent liabilities consist of: Customers’ guaranty and other deposits Deferred credits 2010 P = 1,998,418,919 247,554,064 P = 2,245,972,983 2009 =1,293,930,914 P 196,984,093 =1,490,915,007 P Customers’ guaranty and other deposits pertain to the deposits paid by the Group’s customers amounting to P =2.00 billion and P =1.29 billion as of December 31, 2010 and 2009, respectively. The rollforward analysis of the unamortized discounts of customers’ guaranty and other deposits follows: Balance at beginning of the year Addition Amortization of discount (see Note 18) Balance at end of the year 2010 P =196,984,093 65,287,932 (14,717,961) P =247,554,064 2009 =162,364,029 P 63,957,693 (29,337,629) =196,984,093 P *SGVMC115490* - 45 - 18. Interest Income, Interest Expense and Other Income Interest income consists of: Interest income on: Cash and cash equivalents, short-term cash investments and AFS financial assets Others 2010 2009 2008 =287,698,007 P 308,055 =288,006,062 P =359,917,512 P 2,053,021 =361,970,533 P =204,008,942 P 879,713 =204,888,655 P 2010 2009 2008 =546,528,372 P =368,829,048 P =535,621,669 P 598,776,744 426,009,332 140,447,032 43,149,128 =1,188,454,244 P 16,682,420 =811,520,800 P 13,197,983 =689,266,684 P 2010 P62,293,470 = 36,909,562 2009 =– P 17,968,594 2008 =– P 32,375,201 19,512,351 13,114,207 25,860,149 =157,689,739 P 14,684,272 – 34,575,428 =67,228,294 P 39,559,093 – 10,275,402 =82,209,696 P Interest expense consists of: Interest expense on: Amortization of service concession obligations and deposits Long-term debt: Coupon interest Amortization of debt discount, issuance costs and premium (see Note 15) Other income includes the following: Sale of inventories Reopening fee Septic sludge disposal and bacteriological water analysis Sale of scrap materials Miscellaneous 19. Income Tax Provision for income tax consists of: Current Deferred 2010 2009 2008 =1,286,659,898 = P P1,048,400,751 P =1,096,678,717 (40,070,502) (43,389,597) 371,986,493 =1,246,589,396 P P =1,005,011,154 = P1,468,665,210 The reconciliation of the statutory income tax rate to the effective income tax rate follows: Statutory income tax rate Tax effects of: Interest income subjected to final tax Nondeductible interest expense Change in unrecognized deferred tax Others - net Effective income tax rate 2010 30.00% 2009 30.00% 2008 35.00% (1.63) 0.65 (4.96) (0.24) 23.82% (2.56) 1.05 (0.87) (3.89) 23.73% (1.77) 0.93 – 0.34 34.50% *SGVMC115490* - 46 The components of the deferred income tax assets (liabilities) of the Group represent the deferred income tax effects of the following: Service concession obligation-net Capitalized borrowing cost Allowance for doubtful accounts (Note 6) Pension liabilities (Note 16) Unrealized foreign exchange losses NOLCO 2010 P =429,031,642 (21,945,013) 3,917,056 90,134 26,867 – P =411,120,686 2009 =392,208,319 P (22,752,552) – – 26,867 1,567,550 =371,050,184 P Revenue Regulations (RR) No. 16-2008 RR No. 16-2008 provided the implementing guidelines for Section 34 of RA No. 9504 on the use of the Optional Standard Deduction (OSD) for corporations. The OSD allowed shall be an amount not exceeding 40% of the gross income. This became effective on July 1, 2008 and was applied by the Parent Company for transactions for the period July to December 2008 and for the years ended December 31, 2009 and 2010. The OSD results in an effective tax rate of 18% for the years in which OSD is projected to be utilized. This rate was used in computing the deferred income taxes on the net service concession obligation and capitalized borrowing costs starting 2009 that are considered in determining gross income for income tax purposes. The availment of OSD affected the recognition of several deferred tax assets and liabilities, in which the related income and expenses are not considered in determining gross income for income tax purposes. The Parent Company forecasts that it will continue to avail of the OSD, such that the manner by which it will recover or settle the underlying assets and liabilities, for which the deferred tax assets to and liabilities were initially recognized, would not result to any future tax consequence under OSD. Details of the accounts for which no deferred taxes were recognized as of December 31, 2010 and 2009 follow: Allowance for doubtful accounts (Note 6) Pension liabilities Allowance for impairment losses (Note 8) Unamortized costs on financial assets Derivative asset on prepayment option (Note 13) Unamortized debt discounts and issuance costs of long-term debt (Note 15) 2010 P =513,554,936 231,369,344 86,436,083 1,188,263 (229,613,149) 2009 =558,397,976 P 246,278,168 69,101,543 36,470,138 (158,817,648) (191,576,380) P =411,359,097 (218,832,830) P532,597,347 = The net reduction in deferred tax assets of applying the 18% effective income tax rate to the recognized deferred taxes on net service obligation and capitalized borrowing costs, and the derecognition of the deferred taxes relating to the accounts with temporary differences which are not considered in determining gross income for income tax purposes, by the Parent Company amounted to = P376.34 million P =406.08 million as of December 31, 2010 and 2009, respectively. *SGVMC115490* - 47 In addition to the deferred tax assets and liabilities that have not been recognized as a consequence of the OSD availment, the Parent Company’s subsidiaries have other deductible temporary differences that are available for offset against future taxable income, for which no deferred tax assets have been recognized, as follows: 2010 P =36,728,879 NOLCO Pension liabilities – P =36,728,879 2009 =30,200,403 P 1,974,804 =32,175,207 P As of December 31, 2010 and 2009, the unrecognized deferred tax assets on the above temporary differences amounted to = P10.61 million and = P9.65 million, respectively. The movements of the Group’s NOLCO as of December 31, 2010, which are available for offset against future taxable income for the three succeeding years, follow: Year Incurred 2007 2008 2009 2010 Amount P469,743 = 20,822,891 14,132,936 7,218,777 =42,644,347 P Used/Expired =469,743 P 47,296 5,398,429 – =5,915,468 P Balance =– P 20,775,595 8,734,507 7,218,777 =36,728,879 P Expiry Year 2010 2011 2012 2013 RA No. 9337 RA No. 9337 was enacted into law amending various provisions in the existing 1997 National Internal Revenue Code. Among the reforms introduced by the said RA was the reduction in the regular corporate income tax rate from 35% to 30% beginning January 1, 2009. 20. Equity The Parent Company’s capital stock consists of: 2009 2010 Shares Common stock - P =1 per share Authorized Issued and subscribed Outstanding Preferred stock - P =0.10 par value, 10% cumulative, voting, participating, nonredeemable and nonconvertible Authorized, issued and outstanding 4,000,000,000 shares Preferred stock - P =1 par value, 8% cumulative, nonvoting, nonparticipating, nonconvertible, redeemable at the Parent Company’s option Authorized and issued 500,000,000 shares Shares Amount (In Thousands Except Per Share Figures) Amount P =3,100,000 2,032,598 2,032,598 P =3,100,000 2,032,598 2,032,598 P3,100,000 = 2,030,678 2,030,678 P3,100,000 = 2,030,678 2,030,678 4,000,000 400,000 4,000,000 400,000 500,000 500,000 500,000 500,000 *SGVMC115490* - 48 There was no movement in treasury shares in 2010 and 2009. The Agreement as discussed in Note 1 provides that unless waived in writing by the MWSS-RO, United Utilities PLC (the International Water Operator) and AC (the Sponsor) shall each own (directly or through a subsidiary who is at least 51% owned and controlled by United Utilities PLC or AC) at least 20% of the outstanding capital stock of the Parent Company until December 31, 2002 and at least 10% after the first Rate Rebasing (January 1, 2003) and throughout the concession period. In a letter from MWSS-RO addressed to the Parent Company dated October 19, 2004, MWSS-RO confirmed that the term “Outstanding capital stock” refers to the total issued shares of the Parent Company, voting or nonvoting, irrespective of par value, excluding treasury shares. The MWSS-RO further clarified that for purposes of the compliance with the Agreement, AC and United Utilities PLC will be owners of the Parent Company to be held by a joint venture company in proportion to their respective ownership of the outstanding capital stock of the said company. Preferred Shares The dividends for the P =0.10 par value and P =1 par value preferred shares are declared upon the sole discretion of the Parent Company’s BOD, based on retained earnings availability. Dividends The following table shows the cash dividends declared by the Parent Company’s BOD for the outstanding capital stock on the three years ended December 31, 2010: Declaration Date March 31, 2008 July 22, 2008 December 3, 2008 March 30, 2009 September 24, 2009 November 26, 2009 April 12, 2010 July 9, 2010 November 25, 2010 Record Date April 15, 2008 August 5, 2008 November 30, 2008 April 16, 2009 October 8, 2009 December 31, 2009 April 26, 2010 June 23, 2010 December 1, 2010 Amount Per Share Common Participating Redeemable Shares Preferred Shares Preferred Shares 0.175 0.0175 – 0.175 0.0175 – – 0.0100 – 0.200 0.0200 – 0.200 0.0200 – – 0.0100 – 0.230 0.0230 – 0.230 0.0230 – – 0.0100 – Payment Date April 25, 2008 September 2, 2008 December 23, 2008 May 8, 2009 October 30, 2009 January 4, 2010 May 19, 2010 August17, 2010 December 29, 2010 There are no dividends in arrears for the Parent Company’s participating preferred shares as of December 31, 2010. In accordance with SEC Memorandum Circular No. 11 issued in December 2008, the Parent Company’s retained earnings available for dividend declaration as of December 31, 2010 amounted to = P8.80 billion. Appropriation for capital expenditures On February 7, 2008, the Parent Company’s BOD approved the additional appropriation of a portion of its retained earnings amounting to P =2.0 billion for future expansion projects. On November 26, 2009, the Parent Company’s BOD approved the additional appropriation of a portion of its retained earnings amounting to P =3.0 billion for future expansion projects. *SGVMC115490* - 49 Executive Stock Option Plan (Executive SOP), Expanded Executive SOP and Employee Stock Ownership Plan (ESOWN) On February 26, 2004, the Parent Company’s BOD authorized the allocation of up to 20.0 million of the treasury shares for distribution from time to time as may be authorized by the Chairman of the Board (Chairman) as incentive and reward to deserving officers of the Parent Company with rank of Manager 2 and above, including senior officers seconded from any parent company, under the Executive SOP. On October 28, 2004, the Parent Company’s BOD approved the allocation of an additional 3.6 million shares for the Executive SOP, which will come from the Company’s unissued shares or common shares held in treasury. Accordingly, total allocation for the Executive SOP increased to 23.6 million shares. On the same date, the Parent Company’s BOD approved the allocation of 136.40 million common shares for the Expanded Executive SOP covering 96.40 million common shares and the ESOWN covering 40.00 million common shares. The common shares for the ESOWN and the Expanded Executive SOP will come from the Parent Company’s unissued common shares or common shares held in treasury. The common shares under the Expanded Executive SOP and ESOWN will be distributed from time to time as an incentive and reward to deserving Parent Company’s executives (Expanded Executive SOP) and employees (ESOWN) of the Parent Company as may be authorized by the Chairman. In March 2005, the Parent Company granted 23.6 million options under the Executive SOP with an exercise price of P =2.71 per share. To enjoy the rights provided for in the plan, the option holder should be with the Parent Company at the time the options vest. The vesting schedule of the options is as follows: Year 2006 2007 2008 Vesting Percentage 40% 30% 30% On November 15, 2005, the Parent Company’s BOD approved the allocation of 25.00 million common shares, consisting of unissued shares and/or undisposed treasury shares, for distribution from time to time as may be authorized by the Chairman, as an incentive and reward to deserving executives of the Parent Company with rank of Manager 1 and above, under the ESOWN. On February 2, 2006, the Parent Company’s BOD authorized the migration of the Executive SOP covering 23.6 million common shares to ESOWN by giving Executive SOP grantees a one-time opportunity to convert their Executive SOP allocation into an ESOWN subscription using the Executive SOP subscription price of P =2.71 per share. The ESOWN terms are described in the succeeding paragraphs. The migration resulted in the recognition of the additional fair value of the replacement options amounting to = P26.50 million. For the exercised options, the fair value was computed using the market price at the date of grant less the discounted strike price. *SGVMC115490* - 50 Details of the Parent Company’s grants under the ESOWN follow: Number of shares granted Number of unsubscribed shares Fair value of each option Weighted average share price Exercise price Expected volatility Dividend yield Risk-free interest rate Expected life of option April 30, 2009 9,241,025 1,442,000 =5.90 P =13.50 P =9.63 P 44.66% 2.92% 8.53% 4 years Grant Dates June 15, 2008 May 21, 2007 7,798,483 2,130,000 1,580,000 520,000 =10.65 P =9.85 P =18.00 P =12.00 P =15.13 P =8.08 P 25.64% 27.29% 1.96% 2.58% 6.93% 10.55% 4 years 7 years May 2, 2006 13,625,000 2,265,000 =4.59 P =6.50 P =5.47 P 24.65% 3.40% 11.30% 7 years There was no grant in 2010 and options exercised came from 2006 and 2009 grants. To enjoy the rights provided for in the ESOWN, the grantee should be with the Parent Company at the time the Holding Period expires. The Holding Period of the ESOWN shares follows: Year After one year from subscription date After two years from subscription date After three years from subscription date Holding Period 40% 30% 30% The ESOWN grantees are allowed to subscribe fully or partially to whatever allocation may have been granted to them. In case of initial partial subscriptions, the employees are still allowed to subscribe to the remaining unsubscribed shares granted to them provided that this would be made at the start of Year 5 from grant date up to the end of Year 6. Any additional subscription made by the employee (after the initial subscription) will be subjected to another 3-year holding period. Movements in the number of stock options outstanding under ESOWN are as follows: At January 1 Granted Exercised At December 31 2010 7,362,000 – (1,920,000) 5,442,000 Weighted average exercise price 9.63 – 6.45 2009 5,920,000 9,241,025 (7,799,025) 7,362,000 Weighted average exercise price 15.13 9.63 9.63 The fair value of equity-settled share options granted was estimated at the date of grant using the Black-Scholes option pricing model, taking into account the terms and conditions upon which the options were granted. Total expense arising from equity-settled share-based payment transactions amounted to = P47.3 million in 2010, = P75.49 million in 2009 and P =42.48 million in 2008. The expected life of the options is based on management’s estimate and is not necessarily indicative of exercise patterns that may occur. The expected volatility used for the 2007 and 2006 grants was based on the average historical price volatility of several water utility companies within the Asian region. For the 2009 grants, the Parent Company’s volatility was used as input in the valuation. The expected volatility reflects the assumption that the historical volatility is indicative of future trends, which may also not necessarily reflect the actual outcome. No other features of the options granted were incorporated into the measurement of fair value. *SGVMC115490* - 51 - 21. Earnings Per Share Earnings per share amounts attributable to equity holders of the Parent Company for the years ended December 31, 2010, 2009 and 2008 were computed as follows: Net income attributable to equity holders of the Parent Company Less dividends on preferred shares* Net income attributable to common shareholders for basic and diluted earnings per share Weighted average number of shares for basic earnings per share Dilutive shares arising from stock options Adjusted weighted average number of common stock for diluted earnings per share Basic earnings per share Diluted earnings per share 2009 2008 2010 (In Thousands, Except Per Share Figures) = 3,978,545 P 224,000 =3,231,413 P 569,792 =2,788,020 P 496,967 P3,754,545 = =2,661,621 P =2,291,053 P 2,031,318 2,136 2,028,078 2,455 2,019,834 2,885 2,033,454 = 1.85 P = 1.85 P 2,030,533 =1.31 P =1.31 P 2,022,719 =1.13 P =1.13 P *Including participating preferred shares’ participation in earnings. 22. Related Party Transactions In the normal course of business, the Group has transactions with related parties. The sales and investments made to related parties are made at normal market prices. Service agreements are based on rates agreed upon by the parties. Outstanding balances at year-end are unsecured and interest-free. There have been no guarantees provided or received for any related party receivables or payables. As of December 31, 2010 and 2009, the Group has not made any provision for probable losses relating to amounts owed by related parties. This assessment is undertaken each financial year by examining the financial position of the related party and the market in which the related party operates. Significant transactions with related parties follow: a. The Parent Company entered into management agreements with United Utilities B.V., an affiliate of United Utilities, a stockholder of Philwater, AC, a principal stockholder, and Water Capital Works, Inc. (WCWI), a joint venture Group formed by AC, United Utilities and BPI Capital. Under the agreements, AC, United Utilities and WCWI will provide technical and other knowledge, experience and skills as reasonably necessary for the development, administration and operation of the concession, for which the Parent Company shall pay to each one of them an annual base fee of US$1.00 million and adjusted for the effect of CPI, except for WCWI which has a base fee of 1% of the earned values of the project being supervised. As a result, certain key management positions are occupied by employees of these related parties. The agreements are for a period of ten (10) years until 2007 and are renewable for successive periods of five (5) years. The BOD, in its meeting on August 16, 2007, approved the renewal of the Technical Services Agreement with United Utilities, Administrative and Support Services Agreement with AC and Capital Works Agreement with WCWI for another five years up to 2012. Total management and professional fees charged to operations amounted to = P 222.58 million and =215.80 million in 2010 and 2009 respectively. Total outstanding payables amounted to P *SGVMC115490* - 52 P109.66 million and P = =121.19 million as of December 31, 2010 and 2009, respectively (see Note 14). b. The Group has investments in debt and equity securities of AC, and its subsidiaries and jointly controlled entities, which are included in the “AFS financial assets” section of the consolidated statements of financial position. The fair values of these investments are as follows: Debt Securities 2010 Shareholder: AC Affiliates: BPI Globe ALI 2009 Equity Securities 2010 2009 P =213,009,568 =200,000,000 P P =162,000,000 =156,000,000 P 135,071,772 104,181,283 98,236,780 337,489,835 P =550,499,403 130,000,000 100,000,000 90,000,000 320,000,000 =520,000,000 P – – – – P =162,000,000 – – – – =156,000,000 P In addition, the Parent Company has entered into an IMA with BPI, an affiliate, in 2008. As of December 31, 2010 and 2009, the fair values of the IMA account with BPI amounted to =344.37 million and P P =303.67 million, respectively. c. The following tables provide the total amount of all other transactions that have been entered into with the Parent Company’s shareholders and affiliates for the relevant financial year: Revenue from related parties: Shareholder: AC Affiliates: Ayala Land, Inc. (ALI) and Subsidiaries Bank of the Philippine Islands (BPI) and Subsidiaries Globe Telecom, Inc. (Globe) and Subsidiaries Honda Cars Makati, Inc. (HCMI) 2010 2009 2008 = 4,461,694 P =5,738,946 P =4,864,159 P 79,227,601 97,136,181 95,792,452 7,091,928 9,919,923 8,816,589 1,582,956 273,904 88,176,389 =92,638,083 P 2,080,734 324,601 109,461,439 =115,200,385 P 1,402,594 354,121 106,365,756 =111,229,915 P Revenue is mainly attributable to water and sewerage services rendered by the Group to its shareholder and affiliates. Purchases from related parties: Affiliates: ALI and Subsidiaries HCMI Globe and Subsidiaries BPI and Subsidiaries 2010 2009 2008 =467,830,563 P 20,299,156 6,252,713 – =494,382,432 P =1,775,033 P 6,250 9,757,459 4,126,258 =15,665,000 P =2,024,516 P – 18,156,028 4,413,720 =24,594,264 P *SGVMC115490* - 53 Purchases from ALI and subsidiaries pertain to acquisition of fixed assets while purchases from HCMI relates to acquisition of moveable fixed asset. Purchases from Globe pertains to telecommunication services and purchases from BPI relates to financing. Outstanding receivables from related parties as of December 31: Shareholder: AC Affiliates: ALI and Subsidiaries BPI and Subsidiaries Globe and Subsidiaries 2010 2009 P =81,174 =85,005 P 465,653 10,118 3,186 478,957 P = 560,131 106,749 9,823 2,911 119,483 =204,488 P Receivables are primarily composed of trade receivables for water and sewerage services rendered by the Group. Additional receivable from ALI and Subsidiaries consist of advances to contractors for the construction of fixed assets. d. On April 9, 2002, LAWC entered into a concession agreement (as amended on March 31, 2004) with POL, one of its shareholders. Concession fees paid to POL amounted to =0.81 million in 2010 and = P P0.24 million in 2009 (see Notes 1 and 29). e. On December 17, 2009, BIWC entered into a concession agreement with TIEZA, one of its shareholders, for a period of 25 years, with commencement date on January 1, 2010 and renewable at any time prior to expiration for another 25 years, without necessity of bidding. As of December 31, 2010 and 2009, BIWC has outstanding advances to TIEZA, amounting to =2.80 million and = P P60.00 million, respectively. The P =60.00 million advance payment was considered part of concession assets in 2010 (see Notes 4, 13 and 29). f. Compensation of key management personnel of the Group by benefit type follows: Short-term employee benefits Post-employment benefits Share-based payment (Note 20) 2010 P =287,173,392 9,973,320 4,253,069 P =301,399,781 2009 =268,650,001 P 7,200,081 3,129,956 =278,980,038 P 23. Management Contracts Vietnam Project On July 22, 2008, the Parent Company entered into a Performance-Based Leakage Reduction and Management Services Contract with SAWACO. The contract involves the following components: a. General requirements; b. District Metering Area establishment; c. Leakage reduction and management services; *SGVMC115490* - 54 d. System expansion work; d. Emergency and unforseen works; and e. Daywork schedule In 2010 and 2009, total revenue from the Vietnam Project amounted to = P72.82 million and =18.87 million, respectively. Total costs related to the Vietnam Project amounted to P =93.89 million and P P =47.95 million in 2010 and 2009, respectively. India Project On May 25, 2007, the Parent Company entered into a Secondment Agreement with Mahindra Water Utilities Limited relating to water management. Total revenue related to the India Project in 2010 and 2009 amounted to = P2.09 million and = P4.84 million, respectively, while the corresponding costs amounted to = P4.24 million and = P2.87 million in 2010 and 2009, respectively. Cebu Project Following the execution of the Memorandum of Understanding on January 29, 2009, the Governor of Cebu Province has accepted the unsolicited proposal of the consortium of the Parent Company and Stateland, Inc. for a joint venture or investment with the Provincial Government of Cebu for the development of a treated bulk water supply project in the province of Cebu. The parties are still negotiating on the specific terms and conditions of the joint venture or investment. The project aims to deliver in bulk to the province of Cebu treated surface water extracted from the Luyang River in the town of Carmen. 24. Significant Contracts with the West Zone Concessionaire In relation to the Agreement, the Group entered into the following contracts with Maynilad: a. Interconnection Agreement wherein the two Concessionaires shall form an unincorporated joint venture that will manage, operate, and maintain interconnection facilities. The terms of the agreement provide, among others, the cost and the volume of water to be transferred between zones. b. Joint Venture Arrangement that will operate, maintain, renew, and as appropriate, decommission common purpose facilities, and perform other functions pursuant to and in accordance with the provisions of the Agreement and perform such other functions relating to the concession (and the concession of the West Zone Concessionaire) as the Concessionaires may choose to delegate to the joint venture, subject to the approval of MWSS. c. In March 2010, MWSS entered into a loan agreement with The Export-Import Bank of China to finance the Angat Water Utilization and Aqueduct Improvement Project Phase II (the Project). Total loan facility is $116,602,000 with maturity of 20 years including 5 years grace period. Interest rate is 3% per annum. MWSS then entered into a Memorandum of Agreement with MWC and Maynilad for MWC and MWSI to shoulder equally the repayment of the loan, with such repayment to be part of the concession fees. *SGVMC115490* - 55 - 25. Assets Held in Trust MWSS The Parent Company is granted the right to operate, maintain in good working order, repair, decommission and refurbish the movable property required to provide the water and sewerage services under the Agreement. The legal title to all movable property in existence at the Commencement Date, however, shall be retained by MWSS and upon expiration of the useful life of any such movable property as may be determined by the Parent Company, such movable property shall be returned to MWSS in its then-current condition at no charge to MWSS or the Parent Company. The Agreement also provides for the Concessionaires to have equal access to MWSS facilities involved in the provision of water supply and sewerage services in both East and West Zones including, but not limited to, the MWSS management information system, billing system, telemetry system, central control room and central records. The net book value of the facilities transferred to the Parent Company on Commencement Date based on MWSS’ closing audit report amounted to = P4.60 billion with a sound value of = P10.40 billion. A re-appraisal of the MWSS facilities mentioned above as of December 31, 2004 was conducted by Cuervo Appraisers. The final appraisal report was submitted on November 2006 showing a total reproduction cost of = P27.0 billion with a sound value of = P17.2 billion. In 2009, the Parent Company engaged the services of Cuervo Appraisers to conduct a re-appraisal of the MWSS assets on record as of December 31, 2008. Total reproduction cost as of December 31, 2008 amounted to P =37.7 billion with a sound value of P =22.9 billion. MWSS’ corporate headquarters is made available to the Concessionaires starting August 1, 1997, subject to periodic renewal by mutual agreement of the parties. On October 27, 2006, the Parent Company has renewed the lease for 5 years, with expiry of October 27, 2011. Rent expense amounted to = P16.80 million, = P16.64 million and = P14.09 million in 2010, 2009 and 2008, respectively. These are included under “Occupancy costs” in the consolidated statements of comprehensive income. POL LAWC is granted the right to manage, occupy, operate, repair, maintain, decommission and refurbish the property required to provide water services under its concession agreement with POL. The legal title of all property in existence at the commencement date shall be retained by POL. Upon expiration of the useful life of any such property as may be determined by LAWC, such property shall be returned to POL in its then condition at no charge to POL or LAWC. TIEZA BIWC is granted the right to operate, maintain in good working order, repair, decommission and refurbish the movable property required to provide the water and sewerage services under the Agreement. The legal title to all movable property in existence at the commencement date, however, shall be retained by TIEZA and upon expiration of the useful life of any such movable property as may be determined by BIWC, such movable property shall be returned to TIEZA in its then-current condition at no charge to TIEZA or BIWC. The net book value of the facilities transferred to BIWC on commencement date based on TIEZA’s closing audit report amounted to = P618.29 million. *SGVMC115490* - 56 - 26. Segment Information Business segment information is reported on the basis that is used internally for evaluating segment performance and deciding how to allocate resources among operating segments. Accordingly, the segment information is reported based on the nature of service the Group is providing and its geographic location. The segments where the Group operate follow: · · · East Zone - manage, operate, repair, decommission, and refurbish all fixed and movable assets (except certain retained assets) required to provide water delivery services and sewerage services in the East Zone. Revenue from this business segment consists of water, environmental charges, sewer, income from septic sludge disposal and bacteriological water analysis and other miscellaneous income. Outside East Zone - manage, operate, repair, decommission, and refurbish all fixed and movable assets (except certain retained assets) required to provide water delivery services and sewerage services outside the East Zone. Revenue from this segment consists of water and other miscellaneous income. Management contracts - agreements related to improvements in the customers’ water systems. Revenue from management contracts comprises the revenue of this business segment. Details of the Group’s operating segments as of and for the years ended December 31, 2010 and 2009 are as follows: 2010 East Zone Revenue Sales to external customers Operating expenses Operating income (loss) Revenue from rehabilitation works Cost of rehabilitation works Interest income Interest expense Other income (expense) Income before income tax Provision for (benefit from) income tax Net income (loss) Other comprehensive income Unrealized gain on AFS financial assets Cumulative translation adjustment Total comprehensive income Net income attributable to: Equity holders of Manila Water Company, Inc. Noncontrolling interests Other information Segment assets, exclusive of deferred tax assets Deferred tax assets Segment liabilities Segment additions to property and equipment and SCA Depreciation and amortization Noncash expenses other than depreciation and amortization* Outside East Zone Management Contracts Consolidated = 10,724,162,655 P 4,742,660,889 5,981,501,766 6,756,517,894 (6,756,481,384) 282,522,009 (1,155,040,450) 121,771,455 5,230,791,290 1,257,676,956 3,973,114,334 P214,312,766 = 161,740,767 52,571,999 18,967,008 (9,477,188) 5,484,053 (33,413,794) (7,844,648) 26,287,430 (11,087,560) 37,374,990 = 74,910,083 = P P11,013,385,504 97,929,557 5,002,331,213 (23,019,474) 6,011,054,291 – 6,775,484,902 – (6,765,958,572) – 288,006,062 – (1,188,454,244) – 113,926,807 (23,019,474) 5,234,059,246 – 1,246,589,396 (23,019,474) 3,987,469,850 92,381,443 2,650,312 = 4,068,146,089 P – – =37,374,990 P – – (P =23,019,474) 92,381,443 2,650,312 = 4,082,501,605 P = 4,062,412,745 P – = 4,062,412,745 P =34,184,377 P 8,923,957 =43,108,334 P (P =23,019,474) – (P =23,019,474) = 4,073,577,658 P 8,923,957 = 4,082,501,605 P = 46,235,487,305 P 379,399,898 = 46,614,887,203 P = 27,584,887,087 P = 1,932,928,866 P 31,720,788 = 1,964,649,654 P = 1,057,824,346 P = 41,151,009 P – = 41,151,009 P =– P = 48,209,567,180 P 411,120,686 = 48,620,687,866 P = 28,642,711,433 P = 8,674,469,130 P P1,419,919,068 = = 1,086,293,963 P =50,177,196 P = 589,960 P = 1,799,418 P P9,761,353,053 = = 1,471,895,682 P =– P =5,733,345 P =– P = 5,733,345 P *SGVMC115490* - 57 2009 Outside East Zone East Zone Revenue Sales to external customers Operating expenses Operating income (loss) Revenue from rehabilitation works Cost of rehabilitation works Interest income Interest expense Other expense Income before income tax Provision for (benefit from) income tax Net income (loss) Net income attributable to: Equity holders of Manila Water Company, Inc. Noncontrolling interests Other information Segment assets, exclusive of deferred tax assets Deferred tax assets Management Contracts Consolidated =9,485,857,121 P 4,597,249,234 4,888,607,887 4,164,107,746 (4,164,107,746) 360,358,398 (811,310,124) (162,152,659) 4,275,503,502 1,006,147,668 =3,269,355,834 P P22,990,892 = 38,256,900 (15,266,008) 9,220,124 (7,643,113) 1,612,135 (210,676) (573,638) (12,861,176) (1,136,514) (P =11,724,662) =23,709,284 P 50,821,320 (27,112,036) – – – – – (27,112,036) – (P =27,112,036) =9,532,557,297 P 4,686,327,454 4,846,229,843 4,173,327,870 (4,171,750,859) 361,970,533 (811,520,800) (162,726,297) 4,235,530,290 1,005,011,154 =3,230,519,136 P =3,269,355,834 P – =3,269,355,834 P (P =10,830,672) (893,990) (P =11,724,662) (P =27,112,036) – (P =27,112,036) =3,231,413,126 P (893,990) =3,230,519,136 P =42,588,431,683 P 369,455,767 =42,957,887,450 P =26,669,881,180 P =725,292,275 P 1,594,417 =726,886,692 P =23,106,525 P =73,633,060 P – =73,633,060 P =94,693,256 P =43,387,357,018 P 371,050,184 =43,758,407,202 P =26,787,680,961 P P24,576,842 = =2,544,463 P =5,061,422 P =870,653 P P8,186,850,242 = =1,956,339,628 P =– P =– P =14,467,432 P Segment liabilities Segment additions to property and equipment and SCA =8,157,211,978 P Depreciation and amortization =1,952,924,512 P Noncash expenses other than depreciation and amortization* =14,467,432 P *Pertains to the amount of impairment loss recognized during the year Total revenue derived from India and Vietnam amounted to P =74.91 million and P =23.71 million in 2010 and 2009, respectively, and are included under the management contracts segment of the Group. The Group does not have a single customer contributing more than 10% of its total revenue. 27. Fair Value Measurement The following table summarizes the carrying amounts and fair values of the Group’s financial assets and liabilities as of December 31, 2010 and 2009: 2009 2010 Carrying Value Loans and receivables Cash and cash equivalents Short-term cash investments Trade and other receivables Customers Residential Commercial Semi-business Industrial Employees Interest from banks Others Fair Value Carrying Value (In Thousand Pesos) Fair value P2,412,912 = 1,546,339 P2,412,912 = 1,546,339 P4,037,841 = 3,724,422 P4,037,841 = 3,724,422 226,139 59,851 13,697 2,731 50,389 21,768 107,593, 4,441,419 226,139 59,851 13,697 2,731 50,389 21,768 107,593 4,441,419 323,464 2,905 13,699 5,575 59,720 47,094 56,415 8,271,135 323,464 2,905 13,699 5,575 59,720 47,094 56,415 8,271,135 (Forward) *SGVMC115490* - 58 2009 2010 Carrying Value AFS financial assets Quoted investments Unquoted investments FVPL financial assets Derivative assets Other financial liabilities Accounts and other payables Trade payables Accrued expenses Contracts payable Interest payable Notes payable Meter deposits payable Others Payables to related parties Long-term debt Customers’ guaranty and other deposits Service concession obligation Fair Value Carrying Value (In Thousand Pesos) Fair value =1,005,247 P 843,659 1,848,906 =1,005,247 P 843,659 1,848,906 =1,246,015 P 721,112 1,967,127 =1,246,015 P 721,112 1,967,127 229,613 =6,537,997 P 229,613 =6,519,938 P 158,818 =10,399,048 P 158,818 =10,399,048 P P =1,994,519 668,915 207,993 173,596 P =1,994,519 668,915 207,993 173,596 – – – – 53,993 91,167 14,133,871 1,998,419 7,956,589 P =27,279,062 53,993 91,167 15,260,263 1,964,648 8,299,826 P =28,714,920 =1,606,005 P 604,790 199,247 217,105 5,000 2,193 82,344 111,468 14,361,150 1,293,931 7,449,662 =25,932,895 P = 1,606,005 P 604,790 199,247 217,105 5,000 2,193 82,344 111,468 13,914,810 1,228,776 8,682,600 =26,654,338 P The methods and assumptions used by the Group in estimating the fair value of the financial instruments are: Cash and cash equivalents, short-term cash investments and trade and other receivables - Carrying amounts approximate fair values due to the relatively short-term maturities of these assets. AFS quoted debt securities - Fair values are based on quoted market prices. AFS unquoted equity securities - These are presented at carrying amounts (cost less allowance for impairment losses) since the fair values cannot be reasonably estimated due to the unpredictable nature of future cash flows and the lack of suitable methods of arriving at a reliable fair value. AFS unquoted debt and other securities - Fair values are based on the discounted value of future cash flows using the applicable rates for similar types of instruments. The discount rates used ranged from 1% to 7% in 2010 and 5% to 9% in 2009. Derivative assets - Fair value of call option was determined using Black’s option pricing model. Valuation inputs such as discount rates were based on credit adjusted interest rates ranging from 2% to 5% in 2010 and 6% to 8% in 2009 while interest rate volatility was computed based on historical rates or data. Accounts and other payables and payable to related parties - Carrying amounts approximate fair values due to the relatively short-term maturities of these payables. Customers’guaranty and other deposits and long-term debt - The fair values are estimated using the discounted cash flow methodology using the Group’s current incremental borrowing rates for similar borrowings with maturities consistent with those remaining for the liability being valued. The discount rates used for Peso-denominated loans was 1.99% to 7.27% in 2010 and 4.16% to 6.14% in 2009 while the discount rates used for foreign currency-denominated loans ranged from about 1.13% to 3.66% in 2010 and 0.17% to 4.54% in 2009. *SGVMC115490* - 59 Fair Value Hierarchy The Group held the following financial assets measured at fair value as of December 31: 2010 AFS financial assets Equity shares Debt IMA accounts Derivative assets Level 1 Level 2 P =162,000,000 160,060,157 683,186,778 – P =1,005,246,935 P =– 758,494,624 – – P =758,494,624 Level 1 Level 2 P156,000,000 = 450,852,323 639,162,815 – =1,246,015,138 P =– P 714,048,438 – – =714,048,438 P Level 3 Total P =– =162,000,000 P – 918,554,781 – 683,186,778 229,613,149 229,613,149 P =229,613,149 P =1,993,354,708 2009 Available-for-sale Equity shares Debt IMA accounts Derivative assets Level 3 Total P– = =156,000,000 P – 1,164,900,761 – 639,162,815 158,817,648 158,817,648 =158,817,648 = P P2,118,881,224 During the period ended December 31, 2010, there were no transfers between Level 1 and Level 2 fair value measurements and no transfers into and out of Level 3 fair value measurements. The only financial instrument of the Group that is classified under Level 3 in the fair value hierarchy is its derivative asset pertaining to the embedded call option bifurcated from the =4.0 Billion Bonds (Note 15). This was classified as such because of the use of credit spread as P input to its fair value calculation which was assessed by the Group as having a significant impact to its fair value. The movement in the fair value of the embedded derivative is shown as follows: 2010 At January 1, 2010 Mark-to-market gain recognized in profit and loss At December 31, 2010 P = 158,817,648 70,795,501 P = 229,613,149 2009 At January 1, 2009 Mark-to-market loss recognized in profit and loss At December 31, 2009 =258,404,081 P (99,586,433) =158,817,648 P To assess the impact of the credit spread used, the Group performed a sensitivity analysis on the fair value of the embedded derivative using an assumed increase/(decrease) in the credit spread, the results of which are shown below: 2010 2009 Changes in Basis Points (bps) +25 -25 +25 -25 Effect on Income before Income Tax (P =5,626,140) 6,925,387 (P =8,625,908) 9,004,004 *SGVMC115490* - 60 Embedded Derivatives Embedded Prepayment Options 1. P =2.0 Billion and = P1.5 Billion Loans The Group has two 7-year loans with an aggregate amount of P =3.5 billion (see Note 15) where it has the option to prepay the whole loan or any part of the loan. For each Tranche, the Group will pay the amount calculated as the greater of the present value of the remaining cash flows of the relevant Tranche discounted at the yield of the “comparable benchmark tenor” as shown on the Bloomberg MART1 page or one hundred percent (100%) of the principal amount of the relevant Tranche being prepaid. The prepayment option of the Group effectively has two components: a long call option and a short put option. The long call option entitles the Group to buy back the issued loan at the face amount while the short put option enables the counterparty bank to sell back the loan to the Group at the market price (present value of future cash flows discounted at prevailing market rates). The long call option has a strike price equal to the face amount. Most likely, the Group will exercise the long call option if the market value of the loan is higher than the face amount (in the money). However, if the market value of the loan is lower than the face amount (out of the money), the option will not be exercised. On the other hand, the put option enables the counterparty bank to demand payment based on the market value of the loan. Therefore, the strike price of the option is identified as the market value of the loan. Based on analysis, the put option is not the usual option availed to protect the holder from future decline of an asset’s market value. By setting the strike price at market value, the put option provides protection to the holder, as a writer of the call option, from possible losses resulting from the exercise of the call option. Based on the payoff analysis, the value of the long call and the short put options are offsetting resulting to net payoff of zero. Consequently, no value for the embedded derivatives is recognized. 2. P =4.0 Billion Bonds The Group has an embedded call option on the = P4.0 Billion Peso Bonds issued on October 22, 2008 (see Note 15). The embedded call option gives the Group the right to redeem all but not in part the outstanding bonds on the twelfth interest payment date. The amount payable to the bondholders in respect of such redemptions shall be calculated based on the principal amount of the bonds being redeemed, as the sum of 102% of the principal amount and accrued interest on the bonds on the optional redemption date. On issue date, the Group recognized separately the fair value of the embedded call option, resulting in recognition of a derivative asset and loan premium amounting to P =210.55 million. The embedded derivative is carried at FVPL while the loan premium is amortized at effective interest rate over the life of the loan. As of December 31, 2010 and 2009, the embedded option’s fair value is P =229.61 million and =158.82 million, respectively (see Note 13). The mark-to-market gain amounting to P =70.80 million in 2010 and the mark-to-market loss amounting to = P P99.59 million in 2009 were recognized in the consolidated statements of comprehensive income. *SGVMC115490* - 61 Embedded Put Option The lenders of the = P2.0 billion and P =1.5 billion loans (see Note 15) also have the option to require the Group to pay in full its respective portion of the Tranche 2 Loan (put option) at the end of the fifth year from the date of the Tranche 2 Loan’s initial disbursement. The option is considered clearly and closely related to the host contract because the strike price approximates the amortized cost. Therefore, the embedded derivative was not bifurcated. 28. Financial Risk Management Objectives and Policies The Group’s principal financial instruments comprise of cash and cash equivalents, short-term cash investments, AFS financial assets and long-term debt. The financial debt instruments were issued primarily to raise financing for the Group’s operations. The Group has various financial assets such as cash and cash equivalents, short-term cash investments, trade receivables and payables which arise directly from the conduct of its operations. The main purpose of the Group’s financial instruments is to fund its operations and capital expenditures. The main risks arising from the use of financial instruments are liquidity risk, foreign currency risk, interest rate risk, equity price rate risk and credit risk. The Parent Company’s BOD reviews and approves the policies for managing each of these risks. The Group monitors market price risk arising from all financial instruments and regularly report financial management activities and the results of these activities to the Parent Company’s BOD. The Group’s risk management policies are summarized below: Interest Rate Risk Interest rate risk is the risk that the fair value or future cash flows of a financial instrument will fluctuate because of changes in market interest rates. The Group’s exposure to interest rate risk relates primarily to its financial instruments with floating and/or fixed rates. Fixed rate financial instruments are subject to fair value interest rate risk while floating rate financial instruments are subject to cash flow interest rate risk. For cash flow interest rate risk, the Group’s policy is to manage its interest cost using a mix of fixed and variable rate debts. As of December 31, 2010 and 2009, approximately 72% and 74%, respectively, of the Group’s borrowings have fixed rates of interest. For fair value interest rate risk, the Group’s investment policy requires it to buy and hold AFS financial assets, unless the need to sell arises, and to reduce the duration gap between financial assets and financial liabilities to minimize interest rate risk. Securities are also marked-to-market monthly to reflect and account for both unrealized gains and losses. *SGVMC115490* - 62 The following tables show information about the nominal amount of the Group’s financial instruments that are exposed to cash flow and fair value interest rate risks which are presented by maturity profile. 2010 Cash equivalents and Shortterm cash investments Interest Rates (Range) 0.00% to 11.50% AFS Financial Assets Bonds Government Securities RTBN Interest Rates (Range) 6.25% to 8.50% FXTN Interest Rates (Range) 5.50% to 10.88% Corporate Bonds Interest Rates (Range) 4.90% to 8.80% Within 1 year 1-2 years More than 4 years Total = 2,648,122 P =– P =– P =– P =– P = 2,648,122 P 51,282 – 55,588 53,191 – 160,061 99,660 150,942 = 2,799,064 P 421,626 421,626 = 421,626 P 120,077 175,665 = 175,665 P 53,862 107,053 =107,053 P 141,370 141,370 = 141,370 P 836,595 996,656 = 3,644,778 P Within 1 year 1-2 years 2-3 years 3-4 years (In Thousands) More than 4 years Total =6,563,514 P =– P =– P =– P =– P =6,563,514 P 160,780 51,857 – 53,934 49,792 316,363 134,489 – – – – 134,489 – 295,269 =6,858,783 P 94,048 145,905 =145,905 P 400,000 400,000 =400,000 P 110,000 163,934 =163,934 P 110,000 159,792 =159,792 P 714,048 1,164,900 =7,728,414 P 2-3 years 3-4 years (In Thousands) 2009 Cash equivalents and Shortterm cash investments Interest Rates (Range) 0.00% to 11.50% AFS Financial Assets Bonds Government Securities RTBN Interest Rates (Range) 6.25% to 8.50% FXTN Interest Rates (Range) 5.50% to 10.88% Corporate Bonds Interest Rates (Range) 4.90% to 8.80% *SGVMC115490* - 63 - Within 1 year 1-2 years 2-3 years 3-4 years 4-5 years More than 5 years Total (In JPY) Total - Gross (In USD) Total - Gross (In PHP) $2,715,000 6.5 - 7.5% $1,357,500 – – – – – $4,072,500 = 178,538,400 P P2.0 Billion Loan Interest rate = 16,000,000 P 8.0 - 9.0% = 16,000,000 P = 1,368,000,000 P – – – – – = 1,400,000,000 P P1.5 Billion Loan Interest rate = 11,000,000 P 6.5 - 7.5% = 11,000,000 P = 1,078,000,000 P – – – – – = 1,100,000,000 P – 6.73% – =16,666,667 P = 33,333,333 P = 33,333,333 P = 166,666,667 P – – = 250,000,000 P EIB Loan - JPY Interest rate Y466,941,294 2.10 - 2.29% Y466,941,294 Y466,941,294 Y466,941,294 Y466,941,294 Y 700,411,938 Y 3,035,118,408 – = 1,631,072,632 P EIB Loan - USD Interest rate $3,750,000 5.08% $3,750,000 $3,750,000 $3,750,000 $3,750,000 $5,625,000 – $24,375,000 = 1,068,600,000 P IFC Loan - JPY Interest rate Y44,048,000 4.57% Y44,048,000 Y44,048,000 Y44,048,000 Y44,048,000 Y 110,120,000 Y 330,360,000 – = 177,535,464 P $2,000,000 4.57% $2,000,000 $2,000,000 $2,000,000 $2,000,000 $1,000,000 – $11,000,000 = 482,240,000 P – 8.25% – = 4,000,000,000 P – – – – – = 4,000,000,000 P Y271,946,332 Y271,946,332 Y271,946,332 Y271,946,332 Y1,765,638,053 Y3,125,369,713 – = 1,679,573,684 P 2010 Liabilities: Long-Term Debt Fixed Rate (exposed to fair value risk) DEG Loan Interest rate P500 Million Loan Interest rate IFC Loan – USD Interest rate Bonds Payable Interest rate Floating Rate (exposed to cash flow risk) LBP Loan Y271,946,332 Interest rate 6m Libor plus margin EIB Loan Interest rate Y256,250,000 6m Libor plus margin Y256,250,000 Y256,250,000 Y256,250,000 Y256,250,000 Y384,375,000 Y1,665,625,000 – = 895,106,875 P IFC Loan – JPY Interest rate Y243,280,000 6m Libor plus margin Y243,280,000 Y243,280,000 Y243,280,000 Y243,280,000 Y608,200,000 Y1,824,600,000 – = 980,540,040 P IFC Loan – USD Interest rate $2,000,000 6m Libor plus margin $2,000,000 $2,000,000 $2,000,000 $2,000,000 $1,000,000 – $11,000,000 = 482,240,000 P Y 9,981,073,121 $50,447,500 Interest on financial instruments classified as floating rate is repriced on a semi-annual basis. Interest on financial instruments classified as fixed rate is fixed until the maturity of the instrument. = 14,325,447,095 P *SGVMC115490* - 64 - Within 1 year 1-2 years 2-3 years 3-4 years 4-5 years More than 5 years Total (In JPY) Total - Gross (In USD) Total - Gross (In PHP) $2,714,500 6.5 - 7.5% $2,715,000 $1,357,500 – – – – $6,787,000 =313,559,400 P $287,268 0% – – – – – – $287,268 =13,271,765 P P2.0 Billion Loan Interest rate – 8.0 - 9.0% =16,000,000 P =16,000,000 P =1,368,000,000 P – – – – =1,400,000,000 P P1.5 Billion Loan Interest rate – 6.5 - 7.5% =11,000,000 P =11,000,000 P =1,078,000,000 P – – – – =1,100,000,000 P Y466,941,294 2.10 - 2.29% Y466,941,294 Y466,941,294 Y466,941,294 Y466,941,294 Y1,167,353,232 Y3,502,059,702 – =1,771,692,003 P $3,750,000 5.08% $3,750,000 $3,750,000 $3,750,000 $3,750,000 $9,375,000 – $28,125,000 =1,299,375,000 P IFC Loan - JPY Interest rate Y44,048,000 4.57% Y44,048,000 Y44,048,000 Y44,048,000 Y44,048,000 Y154,168,000 Y374,408,000 – =189,413,007 P IFC Loan - USD Interest rate $2,000,000 4.57% $2,000,000 $2,000,000 $2,000,000 $2,000,000 $3,000,000 – $13,000,000 =600,600,000 P – 8.25% – – =4,000,000,000 P – – – – =4,000,000,000 P Y104,934,545 6m Libor plus margin Y209,869,090 Y209,869,090 Y209,869,090 Y209,869,090 Y1,572,005,068 Y2,516,415,973 – =1,273,054,841 P EIB Loan Interest rate Y256,250,000 6m Libor plus margin Y256,250,000 Y256,250,000 Y256,250,000 Y256,250,000 Y640,625,000 Y1,921,875,000 – =972,276,563 P IFC Loan - JPY Interest rate Y243,280,000 6m Libor plus margin Y243,280,000 Y243,280,000 Y243,280,000 Y243,280,000 Y851,480,000 Y2,067,880,000 – =1,046,140,492 P IFC Loan - USD Interest rate $2,000,000 6m Libor plus margin $2,000,000 $2,000,000 $2,000,000 $2,000,000 $3,000,000 – $13,000,000 =600,600,000 P Y10,382,638,675 $61,199,268 Interest on financial instruments classified as floating rate is repriced on a semi-annual basis. Interest on financial instruments classified as fixed rate is fixed until the maturity of the instrument. DANIDA loan is a non-interest bearing loan, and is therefore not subject to interest rate risk. =14,579,983,071 P 2009 Liabilities: Long-Term Debt Fixed Rate (exposed to fair value risk) DEG Loan Interest rate DANIDA Loan Interest rate EIB Loan - JPY Interest rate EIB Loan - USD Interest rate Bonds Payable Interest rate Floating Rate (exposed to cash flow risk) LBP Loan Interest rate *SGVMC115490* - 65 The following tables demonstrate the sensitivity of the Group’s income before income tax and other comprehensive income, gross of tax, to a reasonably possible change in interest rates on December 31, 2010 and 2009, with all variables held constant (through the impact on cash equivalents, short-term cash investments, floating rate borrowings, derivative asset and AFS debt securities). 2010 Changes in Basis Points (bps) Floating rate borrowings +100 -100 Derivative asset on call option +100 -100 Available-for-sale debt securities +100 -100 Effect on Other Effect on Comprehensive Income before Income Income Tax (In thousands) (P = 59,127) – 59,127 – (44,816) 51,967 – – (32,312) 67,883 2009 Changes in Basis Points (bps) Floating rate borrowings +100 -100 Derivative asset on call option +100 -100 AFS debt securities +100 -100 Effect on Effect on Other Income before Comprehensive Income Tax Income (In thousands) (P =39,168) =– P 39,168 – (32,328) 38,375 – – – (1,366) 13,599 Foreign Exchange Risk The Group’s foreign exchange risk results primarily from movements of the Philippine Peso (PHP) against the United States Dollar (USD) and Japanese Yen (JPY). Majority of revenues are generated in PHP, and substantially all capital expenditures are also in PHP. Approximately 52% and 42% of debt as of December 31, 2010 and 2009, respectively, was denominated in foreign currency. Under Amendment 1 of the Agreement, however, the Group has a natural hedge on its foreign exchange risks on its loans and concession fee payments through a recovery mechanism in the tariff (see Note 1). *SGVMC115490* - 66 Information on the Group’s foreign currency-denominated monetary assets and liabilities and their Philippine Peso equivalents are as follows: December 31, 2010 Original Peso Currency Equivalent (Amounts in Thousands) Assets Cash and cash equivalents USD YEN Vietnamese Dong (VND) Liabilities Long-term debt YEN loan USD loan Service concession obligations YEN loan USD loan French Franc (FRF) loan December 31, 2009 Original Peso Currency Equivalent (Amounts in Thousands) $7,476 Y364 VND1,083,849 P =327,755 195 2,439 P =330,389 $2,199 Y720 VND2,159,365 =101,603 P 367 5,398 =107,368 P Y9,981,073 $50,448 P =5,389,779 2,211,640 Y9,990,459 $58,673 P5,095,134 = 2,710,702 Y740,731 Y57,142 FRF3,783 399,995 2,505,105 33,442 10,539,961 Y860,790 $66,375 FRF4,034 439,003 3,066,525 40,501 11,351,865 Net foreign currency-denominated liabilities =11,244,497 P P =10,209,572 The spot exchange rates used were P =43.84 to US$1, = P0.54 to JPY1, = P8.84 to FRF1 and P =0.0022 to VND1 in 2010 and P =46.20 to US$1, P =0.52 to JPY1, P =10.04 to FRF1 and = P.0025 to VND1 in 2009. The following table demonstrates the sensitivity to a reasonably possible change in foreign exchange rates, with all variables held constant, of the Group’s profit before tax (due to changes in the fair value of monetary assets and liabilities taking into account the effect of the natural hedge due to the FCDA recovery mechanism) as of December 31, 2010 and 2009: 2010 Dollar Yen Increase/Decrease in Effect on Profit Foreign Exchange Rates before Tax (Amounts in Thousands) = 1.00 P (P =7,476) (1.00) 7,476 0.02 (7) (0.02) 7 2009 Dollar Yen Increase/Decrease in Effect on Profit Foreign Exchange Rates before Tax (Amounts in Thousands) =1.00 P (P =2,199) (1.00) 2,199 0.02 (14) (0.02) 14 The Group does not expect any movement of the VND against the Philippine Peso to have a significant effect on the Group’s profit before tax. *SGVMC115490* - 67 Equity price risk The Company’s equity price risk exposure at year-end relates to financial assets whose values will fluctuate as a result of changes in market prices, principally, equity securities classified as AFS financial assets. Such investment securities are subject to price risk due to changes in market values of instruments arising either from factors specific to individual instruments or their issuers or factors affecting all instruments traded in the market. The Company’s investment policy requires it to manage such risks by setting and monitoring objectives and constraints on investments; diversification plan; limits on investment in each sector and market. The Company has certain direct strategic minority investments in publicly traded companies. These investments are classified as AFS financial assets. As of December 31, 2010 and 2009, the fair values of equity investments classified as AFS financial assets amounted to = P162,000,000 and P =156,000,000, respectively (see Note 11). The analysis below is performed for reasonably possible movements in the PSE index with all other variables held constant. The impact on equity (due to changes in fair value of equity securities classified as AFS financial assets) is arrived at using the change in variable and the specific adjusted beta of each share of stock the Company holds at the reporting date. Adjusted beta is the forecasted measure of the volatility of a security or a portfolio in comparison to the market as a whole. The impact on the Company’s equity already excludes the impact on transactions affecting profit or loss. December 31, 2010 Market Index PSE index Change in variable +28% -28% Impact on equity P = 136,080 (136,080) Change in variable +7% -7% Impact on equity =416,208 P (416,208) December 31, 2009 Market Index PSE index In 2010 and 2009, the change in variable was derived from the percentage changes of the composite PSE index for the past three years. Credit Risk The Group trades only with recognized, creditworthy third parties. It is the Group’s policy that except for connection fees and other highly meritorious cases, the Group does not offer credit terms to its customers. With respect to credit risk arising from the other financial assets of the Group, which comprise cash and cash equivalents, short-term cash investments and AFS financial assets, the Group’s exposure to credit risk arises from default of the counterparty, with a maximum exposure equal to the carrying amount of these instruments. The Group transacts only with institutions or banks which have demonstrated financial soundness for the past 5 years. *SGVMC115490* - 68 In respect of receivables from customers, credit risk is managed primarily through credit reviews and an analysis of receivables on a continuous basis. Customer payments are facilitated through various collection modes including the use of postdated checks and auto-debit arrangements. The Group has no significant concentrations of credit risk. The maximum exposure to credit risk for the components of the consolidated statements of financial position is equal to its carrying value. As of December 31, 2010 and 2009, the credit quality per class of the Group’s financial assets are as follows: 2010 Cash and cash equivalents* Short-term cash investments Receivables Customers Residential Commercial Semi-business Industrial Employees Interest from banks Receivable from SAWACO Others AFS financial assets Quoted Unquoted Total *Excludes cash on hand. Neither Past Due nor Impaired High Grade Standard P =2,406,787,031 P =– 1,546,339,222 – Past Due and Impaired P =– – Total P =2,406,787,031 1,546,339,222 139,318,327 11,907,332 1,680,083 943 – 21,767,660 47,699,550 59,893,560 86,821,142 47,943,600 12,016,717 2,729,708 50,389,222 – – 363,465,865 85,863,153 26,250,840 3,943,819 – – – 34,031,259 589,605,334 145,714,085 39,947,640 6,674,470 50,389,222 21,767,660 47,699,550 93,924,819 1,005,246,935 843,659,174 P =6,084,299,817 – – P =199,900,389 – – P =513,554,936 1,005,246,935 843,659,174 P =6,797,755,142 Neither Past Due nor Impaired High Grade Standard =4,034,634,263 P =– P 3,724,421,813 – Past Due and Impaired =– P – Total P4,034,634,263 = 3,724,421,813 2009 Cash and cash equivalents* Short-term cash investments Receivables Customers Residential Commercial Semi-business Industrial Employees Interest from banks Receivable from SAWACO Others AFS financial assets Quoted Unquoted Total *Excludes cash on hand. 263,823,038 – 8,643,687 4,550,294 – 47,094,069 8,954,910 47,459,520 59,641,008 2,905,387 5,055,396 1,024,633 59,720,050 – – – 333,324,184 175,898,906 35,469,596 11,736,914 – – – 1,968,376 656,788,230 178,804,293 49,168,679 17,311,841 59,720,050 47,094,069 8,954,910 49,427,896 1,246,015,138 721,112,388 =10,106,709,120 P – – =128,346,474 P – – =558,397,976 P 1,246,015,138 721,112,388 =10,793,453,570 P As of December 31, 2010 and 2009, the Group does not have financial assets that are past due but not impaired. *SGVMC115490* - 69 The credit quality of the financial assets was determined as follows: Cash and cash equivalents and short-term cash investments are placed in various banks. Material amounts are held by banks which belong to the top 5 banks in the country. The rest are held by local banks that have good reputation and low probability of insolvency. Management assesses the quality of these assets as high grade. Receivables - high grade pertains to receivables that are collectible within 7 days from bill delivery; standard pertains to receivables that are collectible from 11 to 30 days from bill delivery. AFS financial assets, which are assessed by management as high grade, are investments in debt and equity instruments in companies with good financial capacity and investments in debt securities issued by the government. Liquidity Risk The Group’s objective is to maintain a balance between continuity of funding and flexibility through the use of bank overdrafts, bank loans, debentures, preference shares, leases and hire purchase contracts. The Group’s policy is to maintain a level of cash that is sufficient to fund its monthly cash requirements, at least for the next four to six months. Capital expenditures are funded through long-term debt, while operating expenses and working capital requirements are sufficiently funded through cash collections. The Group’s financial assets used for liquidity management based on their maturities are as follows: 2010 Within 1 Year Assets: Cash and cash equivalents Short-term cash investments Receivables: Customers Employees Receivable from SAWACO Interest from banks Others AFS financial assets More than 1-5 years 5 years (In Thousands) Total - Gross (In PhP) P =2,412,912 1,546,339 P =– – P =– – P =2,412,912 1,546,339 781,942 50,389 47,700 21,768 93,925 152,503 P =5,107,478 – – – – – 767,433 P =767,433 – – – – – 933,662 P =933,662 781,942 50,389 47,700 21,768 93,925 1,853,598 P =6,808,573 More than 1-5 years 5 years (In Thousands) Total - Gross (In PhP) 2009 Within 1 Year Assets: Cash and cash equivalents Short-term cash investments Receivables: Customers Employees Receivable from SAWACO Interest from banks Others AFS financial assets P4,037,841 = 3,724,422 P– = – P– = – P4,037,841 = 3,724,422 902,073 59,720 8,954 47,094 49,428 304,752 =9,134,284 P – – – – – 970,528 =970,528 P – – – – – 860,489 =860,489 P 902,073 59,720 8,954 47,094 49,428 2,135,769 =10,965,301 P *SGVMC115490* - 70 The Group’s financial liabilities based on contractual undiscounted payments: 2010 Within 1 Year Liabilities: Accounts and other payables Payables to related parties Long-term debt* Service concession obligations Customers’ guaranty and other deposits More than 1-5 years 5 years (In Thousands) Total - Gross (In PhP) P =3,147,896 91,167 1,988,503 1,235,724 P =– – 12,529,493 3,551,987 P =– – 2,643,161 12,401,503 P =3,147,896 91,167 17,161,157 17,189,214 – P =6,463,290 – P =16,081,480 2,245,798 P =17,290,462 2,245,798 P =39,835,232 More than 1-5 years 5 years (In Thousands) Total - Gross (In PhP) *Includes contractual interest cash flows 2009 Within 1 Year Liabilities: Accounts and other payables Payables to related parties Long-term debt* Service concession obligations Customers’ guaranty and other deposits =2,778,903 P 111,468 1,895,759 1,031,550 P– = – 12,945,466 4,229,525 P– = – 3,182,475 10,069,743 =2,778,903 P 111,468 18,023,700 15,330,818 – =5,817,680 P – =17,174,991 P 1,476,797 =14,729,015 P 1,476,797 =37,721,686 P *Includes contractual interest cash flows Capital Management The primary objective of the Group’s capital management strategy is to ensure that it maintains a healthy capital structure, in order to maintain a strong credit standing while it maximizes shareholder value. The Group closely manages its capital structure vis-à-vis a certain target gearing ratio, which is net debt divided by total capital plus net debt. The Group’s target gearing ratio is 60%. This target is to be achieved over the next 5 years, by managing the Group’s level of borrowings and dividend payments to shareholders. For purposes of computing its net debt, the Group includes the outstanding balance of its longterm debt (including current portion), accounts and other payables, less cash and cash equivalents, short-term cash investments and AFS financial assets. To compute its total Capital, the Group uses the total equity (excluding the unrealized gain on AFS financial assets and the cumulative translation adjustment). Long-term debt Accounts and other payables Less cash and cash equivalents, short-term cash investments and AFS financial assets Net debt 2010 P = 14,133,870,717 3,147,896,362 17,281,767,079 2009 =14,361,150,240 P 2,778,902,721 17,140,052,961 5,808,157,595 11,473,609,484 9,729,390,045 7,410,662,916 (Forward) *SGVMC115490* - 71 - Equity Less: Unrealized gain on AFS financial assets Cumulative translation adjustment Total capital Capital and net debt Gearing ratio 2010 P = 19,815,228,457 144,929,822 2,650,312 19,667,648,323 P = 31,141,257,807 37% 2009 =16,816,902,223 P 52,548,379 – 16,764,353,844 =24,175,016,760 P 31% 29. Commitments Parent Company’s Concession Agreement The significant commitments of the Parent Company under the Agreement and Extension are as follows: a. To pay MWSS concession fees (see Note 10); b. To post a performance bond, bank guarantee or other security acceptable to MWSS amounting to US$70.00 million in favor of MWSS as a bond for the full and prompt performance of the Parent Company’s obligations under the Agreement. The aggregate amounts drawable in one or more installments under such performance bond during the Rate Rebasing Period to which it relates are set out below. Rate Rebasing Period First (August 1, 1997 - December 31, 2002) Second (January 1, 2003 - December 31, 2007) Third (January 1, 2008 - December 31, 2012) Fourth (January 1, 2013 - December 31, 2017) Fifth (January 1, 2018 - December 31, 2022) Sixth (January 1, 2013 - December 31, 2027) Seventh (January 1, 2028 - December 31, 2032) Eighth (January 1, 2033 - May 6, 2037) Aggregate amount drawable under performance bond (in US$ millions) US$70 70 60 60 50 50 50 50 Within 30 days from the commencement of each renewal date, the Parent Company shall cause the performance bond to be reinstated in the full amount set forth above as applicable for that year. Upon not less than 10-day written notice to the Parent Company, MWSS may make one or more drawings under the performance bond relating to a Rate Rebasing Period to cover amounts due to MWSS during that period; provided, however, that no such drawing shall be made in respect of any claim that has been submitted to the Appeals Panel for adjudication until the Appeals Panel has handed down its decision on the matter. In the event that any amount payable to MWSS by the Group is not paid when due, such amount shall accrue interest at a rate equal to that of a 364-day Treasury Bill for each day it remains unpaid; c. With the Extension, the Parent Company agreed to increase its annual share in MWSS operating budget by 100% from P =100 million to = P395 million, subject to annual CPI; *SGVMC115490* - 72 d. To meet certain specific commitments in respect of the provision of water and sewerage services in the East Zone, unless deferred by MWSS-RO due to unforeseen circumstances or modified as a result of rate rebasing exercise; e. To operate, maintain, renew and, as appropriate, decommission facilities in a manner consistent with the National Building Standards and best industrial practices so that, at all times, the water and sewerage system in the East Zone is capable of meeting the service obligations (as such obligations may be revised from time to time by the MWSS-RO following consultation with the Parent Company); f. To repair and correct, on a priority basis, any defect in the facilities that could adversely affect public health or welfare, or cause damage to persons or third party property; g. To ensure that at all times, the Parent Company has sufficient financial, material and personnel resources available to meet its obligations under the Agreement; and h. To ensure that no debt or liability that would mature after the life of the Agreement will be incurred unless with the approval of MWSS (see Note 1). Failure of the Parent Company to perform any of its obligations that is deemed material by MWSS-RO may cause the Agreement to be terminated. LAWC’s Concession Agreement The significant commitments of LAWC under its concession agreement with POL are as follows: a. To pay POL concession fees (see Note 10); b. To manage, occupy, operate, repair, maintain, decommission, and refurbish the transferred facilities; c. To design, construct and commission the new facilities during the cooperation period; d. To provide and manage the services; e. To bill and collect payment from the customer for all services; f. To extract raw water exclusively from all sources of Raw Water; and g. To negotiate in good faith with POL any amendment or supplement to the concession agreement to establish, operate and maintain wastewater facilities if doing such is financially and economically feasible. BIWC’s Concession Agreement The significant commitments of BIWC under its concession agreement with TIEZA are as follows: a. To meet certain specific commitments in respect of the provision of water and sewerage services in the service area, unless deferred by the TIEZA Regulatory Office (TIEZA-RO) due to unforeseen circumstances or modified as a result of rate rebasing exercise; *SGVMC115490* - 73 b. To pay concession fees, subject to the following provisions: i. Assumption of all liabilities of the BWSS as of Commencement Date and service such liabilities as they fall due. BWSS has jurisdiction, supervision and control over all waterworks and sewerage systems within the Boracay island prior to commencement date. The servicing of such liabilities shall be applied to the concession fees; ii. Payment of an amount equivalent to 5% of the monthly gross revenue of BIWC, inclusive of all applicable taxes. Such payments shall be subject to adjustment based on the gross revenue of BIWC as reflected in its separate financial statements; iii. Provision of the amount of the TIEZA BOD’s approved budget in 2010, payable in 4 installments at the first month of each quarter and not exceeding: Month January April July October iv. Maximum Amount =5,000,000 P 4,000,000 3,000,000 3,000,000 Provision of the annual operating budget of the TIEZA-RO, payable in 2 equal tranches in January and July and not exceeding: Year 2011 2012 2013 and beyond Maximum Amount =15,000,000 P 20,000,000 20,000,000, subject to annual CPI adjustments c. To establish, at Boracay Island, a TIEZA-RO building with staff house, the cost of which should be reasonable and prudent; d. To pay an incentive fee pegged at P =1.00 per tourist, local and foreign, entering the service area; e. To raise financing for the improvement and expansion of the BWSS water and wastewater facilities; f. To operate, maintain, repair, improve, renew and, as appropriate, decommission facilities, as well as to operate and maintain the drainage system upon its completion, in a manner consistent with the National Building Standards and best industrial practices so that, at all times, the water and sewerage system in the service area is capable of meeting the service obligations (as such obligations may be revised from time to time by the TIEZA-RO following consultation with BIWC); g. To repair and correct, on a priority basis, any defect in the facilities that could adversely affect public health or welfare, or cause damage to persons or third party property; and h. To ensure that at all times, BIWC has sufficient financial, material and personnel resources available to meet its obligations under the Agreement. *SGVMC115490* - 74 In addition, the Parent Company, as the main proponent of BIWC shall post a bank security in the amount of US$2.5 million to secure the Parent Company’s and BIWC’s performance of their respective obligations under the agreement. The amount of the performance security shall be reduced by MWC following the schedule below: Rate Rebasing Period First Second Third Fourth Fifth Amount of Performance Security (in US$ Millions) US$2.5 2.5 1.1 1.1 1.1 On or before the start of each year, BIWC shall cause the performance security to be reinstated in the full amount set forth as applicable for that year. Upon not less than 10 days written notice to BIWC, TIEZA may take one or more drawings under the performance security relating to a Rate Rebasing Period to cover amounts due to TIEZA during that period; provided, however, that no such drawing shall be made in respect of any claim that has been submitted to the Arbitration Panel for adjudication until the Arbitration Panel has handed its decision on the matter. In the event that any amount payable to TIEZA by BIWC is not paid when due, such amount shall accrue interest at a rate equal to that of a 364-day Treasury Bill for each day it remains unpaid. Failure of BIWC to perform any of its obligations that is deemed material by TIEZA-RO may cause the concession agreement to be terminated. Technical services agreement Simultaneous with the execution of BIWC’s concession agreement, BIWC and the Parent Company executed a Technical Services Agreement by which the Parent Company is being paid by BIWC a technical services fee equivalent to 4% of the annual gross revenue of BIWC, for rendering the following services to BIWC: a. Financial management, including billing and collection services, accounting methods and financial control devices; and b. Operations and project management, including facility operations and maintenance, and infrastructure project management. JVA with ALI In April 2010, the Parent Company and ALI entered into a JVA to establish a water utility services company which will manage and operate all water systems in Nuvali, as well as adjacent Ayala Land projects in Laguna. The Parent Company shall infuse P =82 million in cash and will be responsible for all external water systems and the operation and management of JV company. ALI shall infuse = P18 million cash and P =59 million “rights/lease” to internal and external water systems and will be responsible for all internal water systems. The joint venture company has not been established as of December 31, 2010. *SGVMC115490* - 75 - 30. Provisions and Contingencies On October 13, 2005, the Municipality of Norzagaray, Bulacan jointly assessed the Parent Company and Maynilad Water Services, Inc. (the “Concessionaires”) for real property taxes on certain common purpose facilities purportedly due from 1998 to 2005 amounting to =357.1 million. It is the position of the Concessionaires that these properties are owned by the P Republic of the Philippines and that the same are exempt from taxation. Total provisions for real property taxes arising from the property in Bulacan and other municipalities, based on the delinquency notice received, amounted to = P412,071,971 for the year 2010. The Group is contingently liable for lawsuits or claims filed by third parties (substantially laborrelated and civil cases) which are either pending decision by the courts or are under negotiation, the outcomes of which are not presently determinable. The Group has been advised by its internal and outside counsels that it is possible, but not probable, that the actions will succeed and accordingly, no provision for probable losses on these cases was recognized. 31. Notes to Cash Flow Statements The Group’s noncash investing activity in 2010 pertains to BIWC’s P =762 million additional SCA and SCO assumed from BWSS. It also includes the P =249 million additional concession loans under the MOA of the Parent Company and MWSS for the repayment of the loan for the financing of the Project. The Group’s noncash investing activities in 2009 pertain to the increase in SCA and SCO arising from the Extension amounting to = P3.36 billion and P =3.17 billion, respectively, and accrual of project costs amounting to = P 199 million and = P135 million for the years ended December 31, 2009 and 2008, respectively. 32. Reclassification of Accounts PAS 1, Presentation of Financial Statements, requires an entity to present a statement of financial position as at the beginning of the earliest period when it reclassifies items in its financial statements. The Group reclassified assets amounting to = P218.66 million as of December 31, 2009 from SCA to Property and Equipment. However, management believes that the presentation of a statement of financial position as at the beginning of the earliest period presented is no longer necessary since the amount of assets reclassified from SCA to Property and equipment is not material to the financial statements as it comprise only 0.45%, 0.73% and 18.1% of total assets, SCA and Property and equipment, respectively. The reclassification has no effect on profit and loss and equity since these items were depreciated over the estimated useful life of the assets and not over the term of the concession arrangement. The transfer was from one noncurrent asset to another. *SGVMC115490*


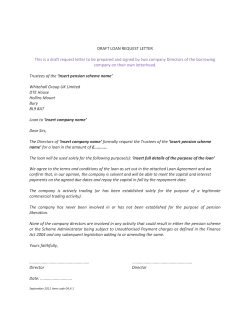

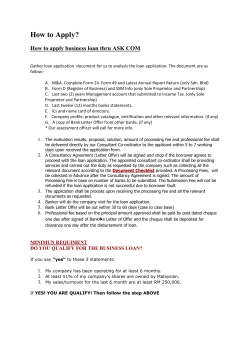


© Copyright 2026