
CITY OF SOLON CUYAHOGA COUNTY REGULAR AUDIT
CITY OF SOLON
CUYAHOGA COUNTY
REGULAR AUDIT
FOR THE YEAR ENDED DECEMBER 31, 2011
CITY OF SOLON
CUYAHOGA COUNTY
TABLE OF CONTENTS
TITLE
PAGE
Independent Accountants’ Report on Internal Control Over
Financial Reporting and on Compliance and Other Matters
Required by Government Auditing Standards ......................................................................................... 1
This page intentionally left blank.
INDEPENDENT ACCOUNTANTS’ REPORT ON INTERNAL CONTROL OVER
FINANCIAL REPORTING AND ON COMPLIANCE AND OTHER MATTERS
REQUIRED BY GOVERNMENT AUDITING STANDARDS
City of Solon
Cuyahoga County
34200 Bainbridge Road
Solon, Ohio 44139
To the Members of Council:
We have audited the financial statements of the governmental activities, business-type activities, each
major fund, and the aggregate remaining fund information of the City of Solon, Cuyahoga County, (the
City) as of and for the year ended December 31, 2011, which collectively comprise the City’s basic
financial statements and have issued our report thereon dated June 27, 2012. We conducted our audit in
accordance with auditing standards generally accepted in the United States of America and the standards
applicable to financial audits contained in the Comptroller General of the United States’ Government
Auditing Standards.
Internal Control Over Financial Reporting
In planning and performing our audit, we considered the City’s internal control over financial reporting as
a basis for designing our audit procedures for the purpose of expressing our opinions on the financial
statements, but not for the purpose of opining on the effectiveness of the City’s internal control over
financial reporting. Accordingly, we have not opined on the effectiveness of the City’s internal control
over financial reporting.
A deficiency in internal control exists when the design or operation of a control does not allow
management or employees, when performing their assigned functions, to prevent, or detect and timely
correct misstatements. A material weakness is a deficiency, or combination of internal control
deficiencies resulting in more than a reasonable possibility that a material misstatement of the City’s
financial statements will not be prevented, or detected and timely corrected.
Our consideration of internal control over financial reporting was for the limited purpose described in the
first paragraph of this section and was not designed to identify all deficiencies in internal control over
financial reporting that might be deficiencies, significant deficiencies or material weaknesses. We did not
identify any deficiencies in internal control over financial reporting that we consider material weaknesses,
as defined above.
Lausche Building, 615 Superior Ave., NW, Twelfth Floor, Cleveland, Ohio 44113‐1801 Phone: 216‐787‐3665 or 800‐626‐2297 Fax: 216‐787‐3361 www.ohioauditor.gov -1-
City of Solon
Cuyahoga County
Independent Accountants’ Report on Internal Control Over
Financial Reporting and on Compliance and Other Matters
Required by Government Auditing Standards
Page 2
Compliance and Other Matters
As part of reasonably assuring whether the City’s financial statements are free of material misstatement,
we tested its compliance with certain provisions of laws, regulations, contracts, and grant agreements,
noncompliance with which could directly and materially affect the determination of financial statement
amounts. However, providing an opinion on compliance with those provisions was not an objective of our
audit and accordingly, we do not express an opinion. The results of our tests disclosed no instances of
noncompliance or other matters we must report under Government Auditing Standards.
We did note certain matters not requiring inclusion in this report that we reported to the City’s
management in a separate letter dated June 27, 2012.
We intend this report solely for the information and use of management, the audit committee, City
Council, and others within the City. We intend it for no one other than these specified parties.
Dave Yost
Auditor of State
June 27, 2012
- 2-
City of Solon, Ohio
Comprehensive Annual Financial Report
For the Year Ended December 31, 2011
Prepared by the Department of
Finance
Dennis G. Kennedy, CPA
Director of Finance
City of Solon, Ohio
Comprehensive Annual Financial Report
For the Year Ended December 31, 2011
Table of Contents
Page
I.
Introductory Section
Title Page ....................................................................................................................................... i
Table of Contents .......................................................................................................................... ii
Letter of Transmittal ...................................................................................................................... v
Organizational Chart ..................................................................................................................... x
List of Principal Officials ............................................................................................................... xi
GFOA Certificate of Achievement ............................................................................................... xii
II.
Financial Section
Independent Accountants’ Report ................................................................................................. 1
Management’s Discussion and Analysis ....................................................................................... 3
Basic Financial Statements
Government-wide Financial Statements:
Statement of Net Assets ............................................................................................... 13
Statement of Activities ................................................................................................... 14
Fund Financial Statements:
Balance Sheet – Governmental Funds ......................................................................... 16
Statement of Revenues, Expenditures and Changes in
Fund Balances – Governmental Funds ...................................................................... 18
Statement of Revenues, Expenditures and Changes in Fund Balance
Budget (Non-GAAP Basis) and Actual - General Fund .......................................... 20
Statement of Fund Net Assets – Proprietary Funds ...................................................... 21
Statement of Revenues, Expenses and Changes in
Fund Net Assets – Proprietary Funds ........................................................................ 22
Statement of Cash Flows – Proprietary Funds ............................................................. 23
Statement of Fiduciary Assets and Liabilities– Agency Funds ...................................... 25
Notes to the Basic Financial Statements ............................................................................. 26
- ii -
Combining and Individual Fund Statements and Schedules
Combining Statements – Nonmajor Governmental Funds:
Fund Descriptions ......................................................................................................... 60
Combining Balance Sheet – Nonmajor Governmental Funds....................................... 62
Combining Statement of Revenues, Expenditures and Changes in
Fund Balances – Nonmajor Governmental Funds ..................................................... 63
Combining Balance Sheet – Nonmajor Special Revenue Funds .................................. 64
Combining Statement of Revenues, Expenditures and Changes in
Fund Balances – Nonmajor Special Revenue Funds ................................................ 66
Combining Balance Sheet – Nonmajor Capital Projects Funds .................................... 68
Combining Statement of Revenues, Expenditures and Changes in
Fund Balances – Nonmajor Capital Projects Funds .................................................. 69
Combining Statements – Fiduciary Funds:
Fund Descriptions ......................................................................................................... 70
Combining Statement of Changes in Assets and Liabilities – Agency Funds ............... 71
Individual Fund Schedules of Revenues, Expenditures/Expenses and Changes in
Fund Balances/Fund Equity – Budget (Non-GAAP Basis) and Actual:
Major Funds:
General Fund ................................................................................................................ 73
General Obligation Bond Retirement Fund ................................................................... 78
Infrastructure Fund ........................................................................................................ 79
Water Reclamation Fund .............................................................................................. 80
Grantwood Recreation Fund ......................................................................................... 81
Nonmajor Funds:
Street Construction, Maintenance and Repair Fund ..................................................... 82
State Highway Fund ...................................................................................................... 83
Police Pension Fund ..................................................................................................... 84
Fire Pension Fund ......................................................................................................... 85
Cable TV Fund .............................................................................................................. 86
Tree Planting Fund ........................................................................................................ 87
Recreation Fund ............................................................................................................ 88
Police Department Programs Fund ............................................................................... 90
Landfill Improvement Fund ............................................................................................ 91
Law Enforcement Trust Fund ........................................................................................ 92
NOPEC Grant Fund ...................................................................................................... 93
Donations Trust Fund .................................................................................................... 94
Street Lighting Fund ...................................................................................................... 95
Senior Services Fund .................................................................................................... 96
Economic Incentive Fund .............................................................................................. 97
Police Training Fund ..................................................................................................... 98
Police Bike Rodeo Fund ................................................................................................ 99
Police Transfer of Prisoners Fund ............................................................................... 100
- iii -
Community Improvement Corporation Fund ............................................................... 101
Safety and Service Equipment Fund ........................................................................... 102
Community Center Fund ............................................................................................. 103
Building Construction Fund ......................................................................................... 104
Old City Hall Renovations Fund .................................................................................. 105
General Capital Improvements Fund .......................................................................... 106
Workers’ Compensation Fund ..................................................................................... 107
III.
Statistical Section
Statistical Section Description .................................................................................................... S1
Net Assets by Component – Last Ten Years ............................................................................. S2
Changes in Net Assets – Last Nine Years ................................................................................. S4
Fund Balances, Governmental Funds – Last Ten Years ........................................................... S8
Changes in Fund Balances, Governmental Funds – Last Ten Years ...................................... S10
Income Tax Revenue Base and Collections – Last Ten Years ................................................ S12
Principal Income Taxpayers – Current Year and Nine Years Ago ........................................... S13
Ratio of Outstanding Debt to Total Personal Income and
Debt Per Capita – Last Ten Years……………………………………………………………….. S14
Ratio of General Obligation Bonded Debt to Estimated True Values of
Taxable Property and Bonded Debt Per Capita – Last Ten Years ....................................... S16
Computation of Direct and Overlapping Governmental Activities Debt .................................... S17
Ratio of Bonded Debt Outstanding and Legal Debt Margin – Last Ten Years ......................... S18
Principal Employers – 2010 and 2001...................................................................................... S20
Demographic and Economic Statistics – Last Ten Years ........................................................ S22
Full-Time City Government Employees by Function/Program Last Ten Years ..................................................................................................................... S24
Operating Indicators by Function/Program – Last Eight Years ................................................ S26
Capital Assets Statistics by Function/Program – Last Eight Years .......................................... S28
- iv -
The City of Solon
CITY HALL
34200 Bainbridge Road
Solon, OH 44139-2955
Phone: (440) 248-1155
Fax: (440) 349-6322
June 27, 2012
Residents of the City of Solon
Honorable Mayor Susan A. Drucker and
Members of Solon City Council:
It is my privilege to present to you the City of Solon’s (the City) Comprehensive Annual Financial
Report (CAFR). This report enables the City to comply with Ohio Administrative Code Section 1172-03 (B), which requires reporting on a Generally Accepted Accounting Principle (GAAP) basis,
and Ohio Revised Code Section 117.38 which requires the cities reporting on a GAAP basis to file
an annual unaudited report with the Auditor of State within 150 days of year end.
Management assumes full responsibility for the completeness and reliability of the information
contained in this report, based upon a comprehensive framework of internal control that it has
established for this purpose. Because the cost of internal control should not exceed anticipated
benefits, the objective is to provide reasonable, rather than absolute, assurance that the financial
statements are free of any material misstatements.
Under Ohio law, regular audits are required to be performed on all financial related operations of
the City. These audits may be done by either the State Auditor’s Office or, if the State Auditor
permits, an independent public accounting firm.
For the year 2011, the City of Solon was audited by the Auditor of State’s Office. Their unqualified
opinion is included in the financial section of this report.
Management’s discussion and analysis (MD&A) immediately follows the Independent Accountants’
report and provides a narrative introduction, overview, and analysis of the basic financial
statements. MD&A complement this letter of transmittal and should be read in conjunction with it.
REPORTING ENTITY
The City of Solon is located in the southeast corner of Cuyahoga County about 15 miles southeast
of downtown Cleveland. It was originally organized as a township around 1825, and became a
village in 1938. On November 2, 1954, the voters of Solon approved a charter. Then, in 1960,
Solon became a city.
-v-
The form of government established by the Charter is the Mayor/Council type. There are seven
City Council members; each is elected from a ward, for a term of four years. The Mayor’s term
is also four years. The Mayor appoints all department directors, some with the required
confirmation of City Council.
Pursuant to Governmental Accounting Standards Board Statement No. 14, the City of Solon has
included in this report all funds, agencies, boards and commissions for which the City is
financially accountable.
CITY SERVICES
The City of Solon provides a full range of services to its citizens. The police protection services
include patrol, investigations, jail facilities, drug resistance programs and safety schools. The
fire protection service includes regular safety inspections, emergency medical (paramedic)
services and fire safety education. In addition, the City has a very active service department
that provides free refuse, leaf and brush pickup, recycling, road maintenance and repair, storm
sewer maintenance and repair, two cemeteries and various other service department activities.
The Recreation Department sponsors a full range of activities from its headquarters in the City’s
new Community Center, as does the Senior Services Department from the Senior Center wing
of the new Community Center.
Solon has two enterprise operations. They are the Grantwood Recreation Park/Golf Course
and the Water Reclamation (formerly wastewater) funds. The operating expenses of both of
these activities have been, and continue to be, covered by user fees.
The administrative functions include planning and zoning, economic development, building
permits and inspection, engineering, human resources, financial and municipal income tax
administration.
In 2011, the City assumed responsibility for billing and collection of fees associated with
maintenance of the storm and sanitary sewer system for residents and businesses. This
function was previously performed by the City of Cleveland Division of Water. The City’s
intention in assuming primary responsibility for sewer service billing was to reduce outstanding
delinquencies and to improve the level of customer service for Solon constituents. This activity
is accounted for in the Water Reclamation Fund.
The Council is required to adopt a final annual budget by no later than the close of the fiscal
year. The annual budget serves as the foundation for the City of Solon’s financial planning and
control. The budget is prepared by fund, function and department (personal services and other).
Department heads may transfer resources with a department as they see fit. Transfers between
departments, however, need special approval from the governing council.
ECONOMIC CONDITION AND OUTLOOK
Based on our City income tax receipts, the local economy seems to continue on the path of
recovery from the recession that caused tax receipts to decline significantly in 2009. City income
tax receipts for 2011 were $38.7 million compared to $37.5 million in 2010 and $34.0 million in
2009. Through the first four monthly collections in 2012, it appears that total 2012 income tax
revenue is on track to meet the 2012 budgeted estimate of $38 million.
- vi -
The success of our economic development program and the attractiveness of our City and
services to members of the business community were rewarded in 2011 with the highest level of
municipal income tax collections in the City’s history. Our net income tax collections in 2011
were $38.7 million, an amount which is indicative of the financial strength of our business
community and their resilience to the crushing impact of the most recent recession and the
strong presence Solon maintains in Northeast Ohio as a leader in retail and industry.
In addition, there were 137 industrial building permits issued for additions or remodeling to
existing buildings for a total of $4.6 million in market value, 64 permits for retail and commercial
alterations with a value of $3.9 million.
Solon is still very active with economic development packages for industry. The most common
incentive agreement is the Job Creation Grant program. As of December 31, 2011, the City had
20 active agreements. Under this program, the company receives a grant from part of the
municipal withholding tax paid to the City on a newly created job. The City also has one active
enterprise zone agreement and one Community Reinvestment Area agreement.
Although the City has been growing rapidly since the 1960’s, there is still some land available
for new industry and business. The Planning Department estimates over 300 acres are
presently available for industrial development.
With respect to finances, the City has successfully negotiated through a very difficult economic
climate and has instituted strict budgetary controls that have allowed staff to continue to
maintain and expand services. Challenges the City has faced with respect to the continued
decline of funds we receive from the State and limited growth in property tax revenue due to the
strain on the current housing market, have been offset by belt tightening and improving the level
of investment in the City’s economic development program.
LONG-TERM FINANCIAL PLANNING
The City’s Administration and Council have a long established policy of maintaining a five year
plan for personnel and capital expenditures. It is updated by the administration and reviewed
every year by the Council Finance Committee during annual budget hearings.
Included in the five year plan is a schedule of infrastructure projects to be paid from the
Infrastructure Capital Improvement Fund. This fund receives one half of one percent of City
income tax as a result of a voter approved levy.
Capital expenditures for new buildings, vehicles and equipment are also included in the five
year plan. This enables a discussion on financing these items two or three years before they are
needed.
The City continues to use its reserve resources efficiently and effectively. In 2012, City leaders
will consider action to eliminate approximately $3.8 million in outstanding general obligation debt
through an allocation of cash reserves. Reduction of debt is conducive to a long-term position of
financial fortitude and helps maintain the City’s current outstanding bond rating.
- vii -
RELEVANT FINANCIAL POLICIES
The City has maintained a policy of balancing the budget with estimated current revenues for
several years. This policy has enabled the City to build-up its cash reserves in the past for
situations like the shortfall in income tax receipts experienced in 2009. In 2007, the City adopted
a “General Fund Cash Reserve Policy” listing the uses of cash reserves.
The City has also been able to maintain a plan to minimize its debt. During the past ten years,
$6 million in cash reserves were used to pay for the Service Garage expansion and $6 million
for part of the new Community Center. In 2007, $3 million in cash reserves were used to
redeem or call the outstanding bonds on the 1993 City Hall Bond issue eight years ahead of
schedule. In 2009, $1.3 million in cash reserves were used to redeem or call 2/3rds of the City’s
outstanding library construction bonds 6 years ahead of schedule. The bonds were extinguished
at par value and there was no gain or loss to be calculated. In 2010, the City redeemed $4.7
million in Bond Anticipation Notes issued for the construction of Fire Station No. 3 and the
reconstruction of Fire Station No. 2.
MAJOR INITIATIVES
The $14 million Bainbridge Road reconstruction project began in 2010 and the majority of the
scope of work was completed in 2011. This project is being funded with a stimulus grant
received by Cuyahoga County.
The City also was awarded a $6 million grant from the Northeast Ohio Areawide Coordinating
Agency (NOACA) to upgrade or replace all 46 traffic signals throughout Solon. Funds for this
project were provided from the NOACA congestion mitigation and air quality improvement
program.
In addition, work continued in 2011 on the $5.9 million anaerobic digester at the City’s Water
Reclamation Plant. The preliminary estimates on the project are $5.9 million, and an Ohio EPA
loan will be secured to pay for it. The loan will be repaid from sanitary sewer revenue. The City
received grant funding in excess of $211,000 from the Northeast Ohio Public Energy Council to
assist in completing the upgrade.
The City dedicates over $9 million annually to the upgrade, maintenance and improvement of
street and sewer infrastructure in an effort to provide Solon residents and business partners the
highest level of services possible.
The primary focus of the Administration and Council is to conduct operations as any successful
chief executive officer or board of directors runs their business. It is imperative that the
approach of Solon employees and elected officials remains centered on structured leadership
and management principles that are designed to increase the City’s efficiency as an entity and
to improve the stewardship and accountability to the community.
- viii -
City of Solon, Ohio
Principal Officials
December 31, 2011
Elected Officials
Susan A. Drucker ...................................................................................................................... Mayor
City Council
Richard A. Bell......................................................................................................................... Ward 1
Robert N. Pelunis .................................................................................................................... Ward 2
Toni M. Richmond ................................................................................................................... Ward 3
William D. Mooney .................................................................................................................. Ward 4
Nancy E. Meany ...................................................................................................................... Ward 5
Edward H. Kraus ................................................................................................ Ward 6 (Vice Mayor)
William I. Russo………………………………………………………………………………………..Ward 7
Carol J. McConoughey ........................................................................... Clerk of Council (appointed)
Appointed Officials
Thomas G. Lobe.......................................................................................................... Director of Law
Dennis G. Kennedy ............................................................................................... Director of Finance
Christopher P. Viland ................................................................................................... Chief of Police
William J. Shaw ........................................................................................... Chief of Fire and Rescue
Robert S. Frankland ............................................................................................ Director of Planning
Donald W. Holub .............................................................................................. Director of Recreation
Jill K. Frankel ............................................................................................ Director of Senior Services
John J. Busch ................................................................................................. Director of Engineering
Thomas G. Bandiera ............................................................................................. Director of Service
Charles E. Boshane ....................................................................................... Building Commissioner
Paul J. Solanics ................................................................................... Director of Water Reclamation
Thomas M. Cornhoff………………………………………………………..Director of Human Resources
Patricia A. Dawson……………………………………………………Director of Information Technology
- xi -
INDEPENDENT ACCOUNTANTS’ REPORT
City of Solon
Cuyahoga County
34200 Bainbridge Road
Solon, Ohio 44139
To the Members of Council:
We have audited the accompanying financial statements of the governmental activities, the business-type
activities, each major fund, and the aggregate remaining fund information of the City of Solon, Cuyahoga
County, Ohio (the City), as of and for the year ended December 31, 2011, which collectively comprise the
City’s basic financial statements as listed in the table of contents. These financial statements are the
responsibility of the City’s management. Our responsibility is to express opinions on these financial
statements based on our audit.
We conducted our audit in accordance with auditing standards generally accepted in the United States of
America and the standards applicable to financial audits contained in the Comptroller General of the
United States’ Government Auditing Standards. Those standards require that we plan and perform the
audit to reasonably assure whether the financial statements are free of material misstatement. An audit
includes examining, on a test basis, evidence supporting the amounts and disclosures in the financial
statements. An audit also includes assessing the accounting principles used and significant estimates
made by management, as well as evaluating the overall financial statement presentation. We believe our
audit provides a reasonable basis for our opinions.
In our opinion, the financial statements referred to above present fairly, in all material respects, the
respective financial position of the governmental activities, the business-type activities, each major fund,
and the aggregate remaining fund information of the City of Solon, Cuyahoga County, Ohio, as of
December 31, 2011, and the respective changes in financial position and where applicable, cash flows,
thereof and the budgetary comparison for the General Fund for the year then ended in conformity with
accounting principles generally accepted in the United States of America.
In accordance with Government Auditing Standards, we have also issued our report dated June 27, 2012,
on our consideration of the City’s internal control over financial reporting and our tests of its compliance
with certain provisions of laws, regulations, contracts and grant agreements and other matters. While we
did not opine on the internal control over financial reporting or on compliance, that report describes the
scope of our testing of internal control over financial reporting and compliance and the results of that
testing. That report is an integral part of an audit performed in accordance with Government Auditing
Standards. You should read it in conjunction with this report in assessing the results of our audit.
Lausche Building, 615 Superior Ave., NW, Twelfth Floor, Cleveland, Ohio 44113‐1801 Phone: 216‐787‐3665 or 800‐626‐2297 Fax: 216‐787‐3361 www.ohioauditor.gov -1-
City of Solon
Cuyahoga County
Independent Accountants’ Report
Page 2
Accounting principles generally accepted in the United States of America require this presentation to
include Management’s discussion and analysis, as listed in the table of contents, to supplement the basic
financial statements. Although this information is not part of the basic financial statements, the
Governmental Accounting Standards Board considers it essential for placing the basic financial
statements in an appropriate operational, economic, or historical context. We have applied certain limited
procedures to the required supplementary information in accordance with auditing standards generally
accepted in the United States of America, which consisted of inquiries of management about the methods
of preparing the information and comparing the information for consistency with management’s responses
to our inquiries, the basic financial statements, and other knowledge we obtained during our audit of the
basic financial statements. We do not express an opinion or provide any assurance on the information
because the limited procedures do not provide us with sufficient evidence to express an opinion or
provide any other assurance.
We conducted our audit to opine on the financial statements that collectively comprise the City’s basic
financial statements taken as a whole. The introductory section, the financial section’s combining
statements, individual fund statements and schedules, and the statistical section information provide
additional analysis and are not a required part of the basic financial statements. The financial section’s
combining statements, individual fund statements and schedules are management’s responsibility, and
were derived from and relate directly to the underlying accounting and other records used to prepare the
basic financial statements. These statements and schedules were subject to the auditing procedures we
applied to the basic financial statements. We also applied certain additional procedures, including
comparing and reconciling this information directly to the underlying accounting and other records used to
prepare the basic financial statements or to the basic financial statements themselves, in accordance with
auditing standards generally accepted in the United States of America. In our opinion, this information is
fairly stated in all material respects in relation to the basic financial statements taken as a whole. We did
not subject the introductory section and statistical section information to the auditing procedures applied
in the audit of the basic financial statements and, accordingly, we express no opinion or any other
assurance on them.
Dave Yost
Auditor of State
June 27, 2012
-2-
City of Solon, Ohio
Management’s Discussion and Analysis
For the Year Ended December 31, 2011
Unaudited
The discussion and analysis of the City of Solon’s financial performance provides an overall review
of the City’s financial activities for the year ended December 31, 2011. The intent of this discussion
and analysis is to look at the City’s financial performance as a whole. To obtain a more detailed
understanding, readers should also review the basic financial statements and the notes to the
basic financial statements.
Financial Highlights
Key Financial Highlights for 2011 are as follows:
-
The City’s net assets increased by over $5 million during 2011 due mainly to an increase in
municipal income tax collections and accounts receivable relating to sewer billings as well as to
an increase in net capital assets. This increase was partially offset by an increase in total
liabilities resulting from retainage and judgments payable on construction projects as well as
the issuance of OWDA loan debt for the Anaerobic Digester/Electrical Upgrade project.
-
The City’s capital assets increased by over $1 million. Most of the increase can be attributed to
infrastructure related projects such as the Carter/Cochran Intersection project, the Bainbridge
Road project and the Anaerobic Digester/Electrical Upgrade project. The increase in capital
assets was partially offset by annual depreciation.
-
The general fund had an increase in fund balance primarily due to an increase in withholding
income taxes.
-
General obligation debt decreased in 2011 due to annual debt service payments.
Overview of the Financial Statements
This discussion and analysis is intended to serve as an introduction to the City of Solon’s basic
financial statements. The City of Solon’s basic financial statements are comprised of these parts:
1.
2.
3.
4.
Management’s Discussion and Analysis
Government-Wide Financial Statements
Fund Financial Statements
Notes to the Basic Financial Statements
In addition, this report also contains other supplementary information:
1.
2.
3.
4.
Transmittal Letter
Combining Statements
Individual Fund Schedules
Statistical and Demographic Data
Government-Wide Financial Statements
The Government-Wide Financial Statements are designed to provide readers with a broad
overview of the City of Solon’s finances in a manner similar to private sector businesses. The
Statement of Net Assets and Statement of Activities provide information about the activities of the
whole City, presenting both an aggregate view of the City’s finances and a longer-term view of
those assets. Major fund financial statements provide the next level of detail. For governmental
-3-
City of Solon, Ohio
Management’s Discussion and Analysis
For the Year Ended December 31, 2011
Unaudited
funds, these statements tell how services were financed in the short term as well as what dollars
remain for future spending. The fund financial statements also look at the City’s most significant
funds with all non-major funds presented in total in one column.
The Statement of Net Assets presents information on all of the City of Solon’s assets and liabilities,
with the difference between the two reported as net assets. Over time, increases or decreases in
net assets may serve as a useful indicator of whether the financial position of the City of Solon is
improving or deteriorating.
The Statement of Activities presents information showing how the City’s net assets changed during
the recent fiscal year. All changes in net assets are reported as soon as the underlying event
giving rise to the change occurs, regardless of the timing of the cash flows. Thus, revenue and
expenses are reported in this statement for some items that will effect cash flows in future fiscal
periods (e.g. uncollected taxes and earned but unused vacation leave).
Both of the government-wide financial statements distinguish programs of the City of Solon that are
principally supported by taxes and intergovernmental revenues (governmental activities) from other
functions that are intended to recover all or significant portion of their costs through user fees and
charges (business-type activities). The governmental activities of the City of Solon include security
of persons and property, public health and welfare, leisure time activities, community environment,
basic utility services, transportation and general government. The business-type activities include
water reclamation and Grantwood recreation.
The government-wide financial statements can be found starting on page 13.
Fund Financial Statements
A fund is a grouping of related accounts that is used to maintain control over resources that have
been segregated for specific activities or objectives. The City of Solon, like all other state and local
governments, uses fund accounting to ensure and demonstrate compliance with legal
requirements. All of the funds of the City of Solon can be divided into three categories:
governmental, proprietary and fiduciary.
GOVERNMENTAL FUNDS – are used to account for essentially the same functions reported as
governmental activities in the government-wide financial statements. However, unlike the
government-wide financial statements, governmental funds’ financial statements focus on the near
term inflows and outflows of spendable resources, as well as on balances of spendable resources
available at the end of the fiscal year. Such information may be useful in evaluating a government’s
near term financing requirements.
Because the focus of governmental funds is narrower than that of the government-wide financial
statements, it is useful to compare the information presented for governmental funds with similar
information presented for governmental activities in the government-wide financial statements. By
doing so, readers may better understand the long term impact of the government’s near term
financing decisions. Both the governmental fund balance sheet and the governmental fund
statement of revenues, expenditures, and changes in fund balances provide a reconciliation to
facilitate this comparison between governmental funds and governmental activities.
-4-
City of Solon, Ohio
Management’s Discussion and Analysis
For the Year Ended December 31, 2011
Unaudited
The City of Solon maintains 27 individual governmental funds. Information is presented separately
in the governmental funds balance sheet and in the government funds statement of revenue,
expenditures, and changes in fund balances for the general fund, general obligation bond
retirement fund and the infrastructure capital projects fund, all of which are considered to be major
funds. Data from the other governmental funds are combined into single, aggregate presentation.
Individual fund data for each of these non-major government funds is provided in the form of
combining statements elsewhere in this report.
The City of Solon adopts an annual appropriated budget for each of its funds. A budget
comparison statement (non-GAAP basis) has been provided for each governmental and
proprietary fund to demonstrate budgetary compliance.
PROPRIETARY FUNDS – use the same basis of accounting as business-type activities. The City
of Solon has two enterprise operations and one internal service fund under the proprietary fund
classification. They are the water reclamation (wastewater) operation and Grantwood (golf course)
recreation and the internal service fund accounting for self-insured workers’ compensation claims.
Proprietary funds provide the same type of information as the government-wide financial
statements, only in more detail. The basic proprietary fund financial statements can be found on
pages 21 to 24.
FIDUCIARY FUNDS – are used to account for resources held for the benefit of parties outside the
government. Fiduciary funds are not reflected in the government-wide financial statements
because the resources of those funds are not available to support the City of Solon’s own
programs.
Notes to the Basic Financial Statements
The Notes to the Basic Financial Statements provide additional information that is essential for a
full understanding of the data provided in the government-wide and fund financial statements. The
City implemented GASB 54 in 2010. Please see the notes to the basic financial statements
concerning data reporting this change and the further clarification of fund balances. The notes to
the basic financial statements can be found on pages 26 to 58.
Other Information
In addition to the basic financial statements and accompanying notes, this report also presents
certain other information that the City believes readers will find useful. After the notes to the basic
financial statements, the combining statements referred to earlier in connection with non-major
funds are presented, as well as individual detailed budgetary comparisons for all non-major funds.
This information can be found starting on page 60.
Government-Wide Financial Analysis
The Statement of Net Assets and the Statement of Activities provide an overall view of the City of
Solon. These statements include all assets and liabilities using the accrual basis of accounting
similar to the accounting used by the private sector. The basis for this accounting takes into
account all of the current year’s revenues and expenses regardless of when the cash is received or
paid.
-5-
City of Solon, Ohio
Management’s Discussion and Analysis
For the Year Ended December 31, 2011
Unaudited
These two statements report the City’s net assets and the changes in those assets. The change in
assets is important because it indicates if the financial position of the City has improved or
diminished. However, in evaluating the overall position of the City, non-financial information such
as changes in the City’s tax base and the condition of City capital assets will also need to be
evaluated.
The Statement of Net Assets and the Statement of Activities are divided into the following
categories:
-
Assets
Liabilities
Net Assets
Program Expenses and Revenues
General Revenues
Net Assets Beginning and End of Year
The City of Solon as a Whole
The following provides a summary of the City’s net assets for the City as a whole for 2011
compared to 2010:
(Table 1)
Net Assets
Governmental Activities
2011
Business-Type Activities
2010
2011
2010
Total
2011
2010
Assets
Current and Other Assets
Capital Assets, Net
$51,328,128
121,672,262
$47,036,472
122,970,018
$7,664,894
65,140,173
$5,503,091
62,719,768
$58,993,022
186,812,435
$52,539,563
185,689,786
Total Assets
173,000,390
170,006,490
72,805,067
68,222,859
245,805,457
238,229,349
8,597,649
6,199,750
441,883
314,645
9,039,532
6,514,395
Liabilities
Current Liabilities
Long-term Liabilities
Due within one Year
Due in More
than one Year
2,695,063
3,152,406
1,920,251
1,776,133
4,615,314
4,928,539
15,355,462
17,048,278
10,778,204
8,848,330
26,133,666
25,896,608
Total Liabilities
26,648,174
26,400,434
13,140,338
10,939,108
39,788,512
37,339,542
116,112,789
117,330,135
52,758,649
52,548,182
168,871,438
169,878,317
6,925,143
7,219,254
2,813,897
13,281,133
5,006,205
7,642,496
3,019,958
10,607,262
0
0
0
6,906,080
0
0
0
4,735,569
6,925,143
7,219,254
2,813,897
20,187,213
5,006,205
7,642,496
3,019,958
15,342,831
$146,352,216
$143,606,056
$59,664,729
$57,283,751
$206,016,945
$200,889,807
Net Assets
Invested in Capital Assets,
Net of Related Debt
Restricted for:
Capital Projects
Debt Service
Other Purposes
Unrestricted
Total Net Assets
-6-
City of Solon, Ohio
Management’s Discussion and Analysis
For the Year Ended December 31, 2011
Unaudited
Total current and other assets for governmental activities increased due to an increase in cash and
cash equivalents. Net capital assets for governmental activities decreased due to annual
depreciation being charged. This decrease was partially offset by capital asset additions in all
categories except for land improvements. The increase in total liabilities was due to retainage
payable on various construction projects as well as judgments payable resulting from a
construction settlement with one of the City’s contractors. The increase in total liabilities was
largely offset by the continued pay-down of bonded debt, OWDA loans and OPWC loans.
Total assets for business-type activities increased due to an increase in charges for services
revenue relating to sewer billings as well as to an increase in net capital assets. The increase in
net capital assets was the result of additions to construction in progress for the anaerobic
digester/electrical upgrade project. Total liabilities for business-type activities increased due to the
issuance of an OWDA loan for the anaerobic digester/electrical upgrade project. This increase in
total liabilities was partially offset by the annual pay-down on debt for the City’s water reclamation
facility.
Further details of the changes in net assets between 2011 and 2010 can be observed in Table 2.
(Table 2)
Changes in Net Assets
Governmental Activities
2011
2010
Business -Type Activities
2011
Total
2010
2011
2010
Program Revenues
Charges for Services
Operating Grants and Contributions
Capital Grants and Assessments
Total Program Revenues
$4,882,608
$4,690,396
$8,749,095
$6,637,783
$13,631,703
$11,328,179
1,407,239
1,512,849
158,528
0
1,565,767
1,512,849
149,004
241,789
0
0
149,004
241,789
6,438,851
6,445,034
8,907,623
6,637,783
15,346,474
13,082,817
General Revenues
Property Taxes
4,166,146
4,197,089
0
0
4,166,146
4,197,089
Municipal Income Taxes
38,674,227
37,526,783
0
0
38,674,227
37,526,783
Grants and Entitlements
1,846,601
1,772,443
0
0
1,846,601
1,772,443
607,074
895,577
0
0
607,074
895,577
47,632
13,894
0
0
47,632
13,894
522,228
814,795
76,617
38,576
598,845
853,371
45,863,908
45,220,581
76,617
38,576
45,940,525
45,259,157
$52,302,759
$51,665,615
$8,984,240
$6,676,359
$61,286,999
$58,341,974
Investment Income
Gain on Sale of Capital Assets
Miscellaneous
Total General Revenues
Total Revenues
-7-
City of Solon, Ohio
Management’s Discussion and Analysis
For the Year Ended December 31, 2011
Unaudited
(Table 2)
Changes in Net Assets
Governmental Activities
2011
Total
Business -Type Activities
2010
2011
2010
2011
2010
Program Expenses
Security of Persons and Property
Police
Fire
Prosecutor
Public Health and Welfare
Leisure Time Activities
$8,501,513
$8,673,149
8,137,648
8,075,434
258,477
255,132
85,571
81,915
6,594,011
6,347,442
$0
$0
$8,501,513
$8,673,149
0
0
8,137,648
8,075,434
0
0
258,477
255,132
0
0
85,571
81,915
0
0
6,594,011
6,347,442
Community Environment
2,793,632
2,994,824
0
0
2,793,632
2,994,824
Basic Utility Services
2,668,113
2,758,637
0
0
2,668,113
2,758,637
14,847,835
10,227,176
0
0
14,847,835
10,227,176
5,426,644
4,592,923
0
0
5,426,644
4,592,923
533,090
641,829
0
0
533,090
641,829
Water Reclamation
0
0
5,265,324
5,910,432
5,265,324
5,910,432
Grantwood Recreation
0
0
1,048,003
927,306
1,048,003
927,306
49,846,534
44,648,461
6,313,327
6,837,738
56,159,861
51,486,199
2,456,225
7,017,154
2,670,913
5,127,138
6,855,775
214,075
0
0
Transportation
General Government
Interest and Fiscal Charges
Total Program Expenses
Excess (Deficiency) before
Transfers
Transfers
Change in Net Assets
Net Assets, Beginning of Year
Net Assets, End of Year
289,935
(214,075)
(289,935)
(161,379)
2,746,160
6,803,079
2,380,978
52,696
5,127,138
6,855,775
143,606,056
136,802,977
57,283,751
57,231,055
200,889,807
194,034,032
$146,352,216
$143,606,056
$59,664,729
$57,283,751
$206,016,945
$200,889,807
Governmental Activities
The funding for governmental activities comes from several different sources, the most significant
being municipal income tax. In addition, property tax, grants and entitlements and charges for
services provide revenue for governmental activities. Governmental revenues and transfers in
exceeded governmental expenses mainly due to the resurgence of City income tax receipts.
On the expense side, the largest program or function is security of persons and property. It is
composed of three parts; Police, Fire and Prosecutor. Fire and Prosecutor had normal increases
while Police had a slight decrease due to a reduction in the cost of personal services.
The next largest program or function is transportation. It includes the construction and
maintenance of streets, storm sewers and other related infrastructure. There was a significant
increase from 2010 because a much greater amount of infrastructure costs were expensed rather
than capitalized in 2011.
Leisure time activities had a slight increase between 2011 and 2010 because of higher operating
costs. General government increased between 2011 and 2010 due to higher personal service
costs including those paid from the City’s sick leave reserve.
-8-
City of Solon, Ohio
Management’s Discussion and Analysis
For the Year Ended December 31, 2011
Unaudited
Business-type Activities
The City has two business-type operations. They are the Water Reclamation Plant (wastewater)
and Grantwood (golf course) Recreation. The largest sources of revenue for both Water
Reclamation and Grantwood Recreation in 2011 were charges for services. On the expense side,
the largest expenses are for payroll and employee benefits for both operations.
Financial Analysis of the City’s Funds
Governmental Funds – provide near term inflows, outflows and balances of spendable resources.
This information is useful in evaluating the City’s financing requirements. In particular, unassigned
fund balances may serve as a useful measure of a government’s net resources available for
spending at the end of the year. Information about the City’s governmental funds begins on page
16. These funds are accounted for by using the modified accrual basis of accounting.
As of the end of 2011, the City of Solon’s governmental funds reported a positive combined ending
fund balance. The majority of the ending fund balance is unassigned. The remainder of the fund
balance is non-spendable, restricted, committed or assigned to indicate that it is not available for
new spending because it has been specifically marked for expenditures as designated by grant
agreements, City ordinances or intent of use.
The general fund is the main governmental and operating fund of the City. There was an overall
increase in the general fund’s fund balance between 2011 and 2010 mainly due to an increase in
withholding income taxes.
The general obligation bond retirement fund mainly receives property taxes and special
assessments which are restricted for the payment of debt service. Despite a decrease in
revenues, there was an overall increase in the general obligation bond retirement fund’s fund
balance between 2011 and 2010 due to transfers in.
The infrastructure fund is the largest capital improvement governmental fund of the City. It receives
one half of one percent of the City income tax (levy) to pay for new construction and repair of the
City’s infrastructure. There was an overall increase in the infrastructure fund’s fund balance
between 2011 and 2010 due to a significant decrease in capital expenditures.
Business-type Funds – report the City’s Water Reclamation (wastewater) operation and Grantwood
(golf course) Recreation on a full accrual basis. In 2011, the net assets for the Water Reclamation
facility increased due to an increase in charges for services and a decrease in operating
expenditures.
General Fund Budgeting Highlights
Solon’s largest budgeted fund is the general fund. Its expenditure budget (appropriations), along
with all other funds, is prepared according to the laws of the State of Ohio and is based on
accounting for certain transactions on a cash basis for receipts, expenditures and encumbrances.
Ohio Law limits appropriations for each fund to the estimated receipts plus the unencumbered cash
reserve (or carryover) from the prior year for that particular fund.
-9-
City of Solon, Ohio
Management’s Discussion and Analysis
For the Year Ended December 31, 2011
Unaudited
In 2011, the general fund’s actual revenue plus other financing sources exceeded the final
estimate. The general fund’s actual expenditures plus other financing uses were well under final
budget producing an overall positive variance.
Capital Assets
Governmental capital assets, net of depreciation, decreased due to annual depreciation. This
decrease was partially offset by current year capital asset additions. Business-type capital assets,
net of depreciation, increased as the result of additions to construction in progress for the
anaerobic digester/electrical upgrade project. For additional information on capital assets, please
see note 9 to the basic financial statements.
A five year capital plan, involving all assets and capital projects is maintained by the administration.
It is updated and reviewed by City Council every year.
(Table 3)
Capital Assets at December 31
(Net of Accumulated Depreciation)
Governmental
Activities
2011
Land
Construction in Progress
Land Improvements
Buildings
Furniture and Equipment
Vehicles
Infrastructure
Total Capital Assets
Business-Type
Activities
2010
2011
Total
2010
2011
2010
$10,537,043
4,664,262
1,239,771
39,260,172
2,329,861
4,438,795
59,202,358
$10,494,480
2,155,766
1,337,802
40,567,853
2,481,699
4,925,364
61,007,054
$3,120,877
4,229,355
8,771
15,801,329
959,480
145,376
40,874,985
$3,120,877
0
9,567
16,507,355
1,035,719
172,957
41,873,293
$13,657,920
8,893,617
1,248,542
55,061,501
3,289,341
4,584,171
100,077,343
$13,615,357
2,155,766
1,347,369
57,075,208
3,517,418
5,098,321
102,880,347
$121,672,262
$122,970,018
$65,140,173
$62,719,768
$186,812,435
$185,689,786
Outstanding Obligations
(Table 4)
Outstanding Obligations at Year End
Governmental
Activities
2011
General Obligation Bonds
Special Assessment Bonds
OWDA Loans
OPWC Loans
Compensated Absences
Solon City School District
Claims Payable
Total
Business -Type
Activities
2010
2011
2010
Total
2011
2010
$4,470,000
84,895
9,742,923
199,235
3,433,260
40,000
80,212
$5,620,000
167,497
10,519,826
259,883
3,474,833
40,000
118,645
$0
0
12,381,524
0
316,931
0
0
$0
0
10,171,586
0
452,877
0
0
$4,470,000
84,895
22,124,447
199,235
3,750,191
40,000
80,212
$5,620,000
167,497
20,691,412
259,883
3,927,710
40,000
118,645
$18,050,525
$20,200,684
$12,698,455
$10,624,463
$30,748,980
$30,825,147
- 10 -
City of Solon, Ohio
Management’s Discussion and Analysis
For the Year Ended December 31, 2011
Unaudited
General obligation bonds, Ohio Water Development Authority Loans and Ohio Public Works
Commission Loans comprise most of the outstanding obligations. In addition, outstanding
obligations include compensated absences (sick leave, vacation, etc.), obligations payable to the
Solon City School District and claims payable for 2011.
Governmental activities debt is serviced by property taxes and special assessments that are
credited to the bond retirement fund. Most of this debt was issued for the construction of new
buildings such as the new Community Center (2002) and for new infrastructure. Most of the
business-type debt is for the water reclamation utility and improvements made to the wastewater
plant. User fees are used to service that debt.
The compensated absence category represents the dollar value of accumulated but unused sick
leave and vacation time at year end. The liability represents amounts that will either be taken as
leave or paid out upon termination or retirement. For additional information, please see note 16 to
the basic financial statements.
Economic Factors and Current Financial Issues
In 2011, the level of growth the City experienced in income tax revenue continued from the
rebound realized in 2010. Income tax proceeds had declined in 2009 due to the impact of the
recession. Net tax collections in 2010 were $37.5 million – a significant increase over lower than
expected 2009 tax revenue of $34.0 million. The City’s 2011 income tax collections increased to
$38.7 million, an indication that both the general economic conditions and the state of the local
economy had improved dramatically since the revenue decline that impacted collections in 2009.
The general fund finished 2011 with an unassigned fund balance of $20,646,611. Maintaining a
significant unassigned balance in the general fund has been a priority for the City in its financial
planning. For 2011, the City had a favorable variance in its projected budget versus actual
amounts of approximately $2.4 million.
The City’s property values remain stable. In 2001, Solon surpassed the $1 billion mark in assessed
property value which is about 35 percent of market value. In 2011, the City issued 137 permits for
industrial alterations at a value of $4.6 million and 64 permits for retail and commercial alterations
with a value of $3.9 million. Solon continues to be a destination for new business development and
has successfully negotiated the crisis in the housing industry with minimal negligible effects.
The City continues to have an aggressive economic development program. As of year end, Solon
had the following economic incentive agreements:
1. One (1) Enterprise Zone Agreement that created 40 jobs and retained 17 jobs.
2. One (1) Community Reinvestment Area that created 1,152 jobs and retained 698 jobs.
3. Twenty (20) Job Creation Grant Agreements that expect to create 1,853 jobs and retained
853 jobs.
Debt management has always been a priority of the City of Solon’s elected officials. The City was
notified by Standard & Poors on May 19, 2008 that they upgraded Solon’s credit rating to AAA from
AA+. In April 2010, Moody’s recalibrated Solon’s rating from Aa1 to Aaa.
- 11 -
City of Solon, Ohio
Management’s Discussion and Analysis
For the Year Ended December 31, 2011
Unaudited
Requests for Information and Data
This financial report is designed to provide a general overview of the City of Solon’s finances for
everyone with an interest. Questions concerning any of the information and data presented in this
report, or requests for additional financial information, should be addressed to Dennis Kennedy,
Director of Finance, City of Solon, 34200 Bainbridge Road, Solon, Ohio 44139.
- 12 -
City of Solon, Ohio
Statement of Net Assets
December 31, 2011
Governmental
Activities
Business-Type
Activities
Assets
Equity in Pooled Cash and Cash Equivalents
Accounts Receivable
Accrued Interest Receivable
Intergovernmental Receivable
Municipal Income Taxes Receivable
Materials and Supplies Inventory
Prepaid Items
Property Taxes Receivable
Special Assessments Receivable
Nondepreciable Capital Assets
Depreciable Capital Assets, Net
$34,085,557
162,423
4,819
1,383,479
6,120,849
498,500
135,582
3,856,563
5,080,356
15,201,305
106,470,957
$5,526,744
1,949,986
0
0
0
188,164
0
0
0
7,350,232
57,789,941
$39,612,301
2,112,409
4,819
1,383,479
6,120,849
686,664
135,582
3,856,563
5,080,356
22,551,537
164,260,898
Total Assets
173,000,390
72,805,067
245,805,457
Total
Liabilities
Accounts Payable
Accrued Wages
Contracts Payable
Intergovernmental Payable
Retainage Payable
Matured Compensated Absences Payable
Accrued Interest Payable
Claims Payable
Judgments Payable
Deferred Revenue
Vacation Benefits Payable
Long-Term Liabilities:
Due Within One Year
Due In More Than One Year
315,348
351,474
777,220
687,766
1,183,176
109,735
147,887
253,657
773,788
3,662,808
334,790
52,288
26,205
0
90,695
0
0
223,854
0
0
0
48,841
367,636
377,679
777,220
778,461
1,183,176
109,735
371,741
253,657
773,788
3,662,808
383,631
2,695,063
15,355,462
1,920,251
10,778,204
4,615,314
26,133,666
Total Liabilities
26,648,174
13,140,338
39,788,512
116,112,789
52,758,649
168,871,438
6,925,143
7,219,254
1,070,267
641,520
1,102,110
13,281,133
0
0
0
0
0
6,906,080
6,925,143
7,219,254
1,070,267
641,520
1,102,110
20,187,213
$146,352,216
$59,664,729
$206,016,945
Net Assets
Invested in Capital Assets, Net of Related Debt
Restricted for:
Capital Projects
Debt Service
Street, Construction, Maintenance and Repair
Landfill Improvement
Other Purposes
Unrestricted
Total Net Assets
See accompanying notes to the basic financial statements
- 13 -
City of Solon, Ohio
Statement of Activities
For the Year Ended December 31, 2011
Program Revenues
Expenses
Charges for
Services
Operating Grants
and Contributions
Capital Grants
and Assessments
Governmental Activities:
Security of Persons and Property
Police
Fire
Prosecutor
Public Health and Welfare
Leisure Time Activities
Community Environment
Basic Utility Services
Transportation
General Government
Interest and Fiscal Charges
$8,501,513
8,137,648
258,477
85,571
6,594,011
2,793,632
2,668,113
14,847,835
5,426,644
533,090
$354,441
711,236
10,242
3,391
3,165,390
124,986
73,489
201,984
237,449
0
$116,426
136,456
0
0
110,095
8,939
0
1,032,386
2,937
0
$0
95,605
0
0
0
0
0
53,399
0
0
Total Governmental Activities
49,846,534
4,882,608
1,407,239
149,004
Business-Type Activities:
Water Reclamation
Grantwood Recreation
5,265,324
1,048,003
7,797,724
951,371
158,528
0
0
0
Total Business-Type Activities
6,313,327
8,749,095
158,528
0
$56,159,861
$13,631,703
$1,565,767
$149,004
Total
General Revenues
Property Taxes Levied for:
General Purposes
Debt Service
Police Pension
Fire Pension
Service and Safety Equipment
Municipal Income Taxes Levied for:
General Purposes
Infrastructure
General Capital Improvements
Grants and Entitlements not Restricted to Specific Programs
Investment Income
Gain on Sale of Capital Assets
Miscellaneous
Total General Revenues
Transfers
Total General Revenues and Transfers
Change in Net Assets
Net Assets Beginning of Year
Net Assets End of Year
See accompanying notes to the basic financial statements
- 14 -
Net (Expense) Revenue and Changes in Net Assets
Governmental
Activities
Business-Type
Activities
Total
($8,030,646)
(7,194,351)
(248,235)
(82,180)
(3,318,526)
(2,659,707)
(2,594,624)
(13,560,066)
(5,186,258)
(533,090)
$0
0
0
0
0
0
0
0
0
0
($8,030,646)
(7,194,351)
(248,235)
(82,180)
(3,318,526)
(2,659,707)
(2,594,624)
(13,560,066)
(5,186,258)
(533,090)
(43,407,683)
0
(43,407,683)
0
0
2,690,928
(96,632)
2,690,928
(96,632)
0
2,594,296
2,594,296
2,594,296
(40,813,387)
(43,407,683)
1,338,758
1,419,400
407,280
610,920
389,788
0
0
0
0
0
1,338,758
1,419,400
407,280
610,920
389,788
29,071,231
9,524,829
78,167
1,846,601
607,074
47,632
522,228
0
0
0
0
0
0
76,617
29,071,231
9,524,829
78,167
1,846,601
607,074
47,632
598,845
45,863,908
76,617
45,940,525
289,935
(289,935)
0
46,153,843
(213,318)
45,940,525
2,746,160
2,380,978
5,127,138
143,606,056
57,283,751
200,889,807
$146,352,216
$59,664,729
$206,016,945
- 15 -
City of Solon, Ohio
Balance Sheet
Governmental Funds
December 31, 2011
General
Obligation
Bond Retirement
Infrastructure
Other
Governmental
Funds
$20,319,669
$2,114,990
$3,962,825
$7,434,417
98,605
107,587
4,819
674,002
500,000
4,576,250
498,500
135,582
1,046,679
0
0
0
0
103,390
0
0
0
0
1,360,682
5,080,356
0
0
0
2,327
0
1,525,416
0
0
0
0
0
54,836
0
603,760
0
19,183
0
0
1,449,202
0
$27,961,693
$8,659,418
$5,490,568
$9,561,398
Liabilities
Accounts Payable
Accrued Wages
Contracts Payable
Intergovernmental Payable
Interfund Payable
Retainage Payable
Matured Compensated Absences Payable
Claims Payable
Judgments Payable
Deferred Revenue
$241,276
314,872
1,915
117,471
0
0
109,735
253,657
0
3,629,456
$0
0
0
0
0
0
0
0
0
6,544,428
$0
0
141,641
0
500,000
1,130,437
0
0
773,788
711,513
$74,072
36,602
633,264
570,295
0
52,739
0
0
0
1,952,582
Total Liabilities
4,668,382
6,544,428
3,257,379
3,319,554
Fund Balances
Nonspendable
Restricted
Committed
Assigned
Unassigned
732,687
377
1,003,676
909,960
20,646,611
0
2,114,990
0
0
0
0
2,233,189
0
0
0
0
5,229,008
1,012,836
0
0
Total Fund Balances
23,293,311
2,114,990
2,233,189
6,241,844
$27,961,693
$8,659,418
$5,490,568
$9,561,398
General
Assets
Equity in Pooled Cash and
Cash Equivalents
Restricted Assets:
Equity in Pooled Cash and
Cash Equivalents
Accounts Receivable
Accrued Interest Receivable
Intergovernmental Receivable
Interfund Receivable
Municipal Income Taxes Receivable
Materials and Supplies Inventory
Prepaid Items
Property Taxes Receivable
Special Assessments Receivable
Total Assets
Total Liabilities and Fund Balances
See accompanying notes to the basic financial statements
- 16 -
City of Solon, Ohio
Reconciliation of Total Governmental Fund Balances to
Net Assets of Governmental Activities
December 31, 2011
Total
Governmental
Funds
$33,831,901
98,605
162,423
4,819
1,383,479
500,000
6,120,849
498,500
135,582
3,856,563
5,080,356
$51,673,077
$315,348
351,474
776,820
687,766
500,000
1,183,176
109,735
253,657
773,788
12,837,979
Total Governmental Funds Balances
$33,883,334
Amounts reported for governmental activities in the
statement of net assets are different because
Capital assets used in governmental activities are not financial
resources and therefore are not reported in the funds.
121,672,262
Other long-term assets are not available to pay for currentperiod expenditures and therefore are deferred in the funds.
Property Taxes
193,755
Municipal Income Taxes
2,846,283
Intergovernmental
994,777
Special Assessments
5,080,356
Miscellaneous
60,000
Total
9,175,171
An internal service fund is used by management to charge the
costs of workers' compensation to individual funds. The assets
and liabilities of the internal service fund are included in
governmental activities in the statement of net assets.
Net Assets
74,439
Claims Payable
80,212
Total
154,651
In the statement of activities, interest is accrued on outstanding
bonds, whereas in governmental funds, an interest
expenditure is reported when due.
(147,887)
Vacation benefits payable is not expected to be paid with
expendable available financial resources and therefore
not reported in the funds.
(334,790)
17,789,743
732,687
9,577,564
2,016,512
909,960
20,646,611
33,883,334
Long-term liabilities, including bonds payable are not
due and payable in the current period and therefore
are not reported in the funds.
General Obligation Bonds
(4,470,000)
Special Assessment Bonds
(84,895)
OWDA Loan Payable
(9,742,923)
OPWC Loan Payable
(199,235)
Compensated Absences
(3,433,260)
Solon City School District
(40,000)
Claims Payable
(80,212)
$51,673,077
Total
(18,050,525)
Net Assets of Governmental Activities
- 17 -
$146,352,216
City of Solon, Ohio
Statement of Revenues, Expenditures and Changes in Fund Balances
Governmental Funds
For the Year Ended December 31, 2011
General
General
Obligation
Bond Retirement
Infrastructure
Other
Governmental
Funds
Revenues
Property Taxes
Municipal Income Taxes
Special Assessments
Intergovernmental
Investment Income
Fees, Licenses and Permits
Fines and Forfeitures
Rentals
Charges for Services
Contributions and Donations
Miscellaneous
$1,339,863
29,042,214
0
1,533,746
607,074
387,657
330,578
0
928,851
0
424,428
$1,426,210
0
722,102
356,297
0
3,489
0
0
0
0
0
$0
9,515,157
0
42,563
0
0
0
0
0
0
14,845
$1,409,404
78,085
0
1,436,720
0
331,262
67,331
31,134
2,812,306
98,588
82,955
Total Revenues
34,594,411
2,508,098
9,572,565
6,347,785
7,291,506
6,295,462
257,217
85,571
537,406
2,836,242
1,588,652
5,102,872
4,956,822
0
0
0
0
0
0
0
0
0
9,666
0
0
0
0
0
0
0
0
0
0
8,799,695
785,645
1,149,061
0
0
5,485,913
2,405
305,353
1,079,000
0
1,588,891
0
0
2,009,505
546,106
60,648
0
0
0
28,951,750
2,565,277
8,860,343
10,396,268
Expenditures
Current:
Security of Persons and Property
Police
Fire
Prosecutor
Public Health and Welfare
Leisure Time Activities
Community Environment
Basic Utility Services
Transportation
General Government
Capital Outlay
Debt Service:
Principal Retirement
Interest and Fiscal Charges
Total Expenditures
Excess of Revenues Over
(Under) Expenditures
5,642,661
(57,179)
Other Financing Sources (Uses)
Sale of Capital Assets
Transfers In
Transfers Out
41,610
0
(4,063,840)
0
371,317
0
0
0
0
24,852
3,992,458
0
Total Other Financing Sources (Uses)
(4,022,230)
371,317
0
4,017,310
1,620,431
314,138
712,222
21,672,880
1,800,852
1,520,967
6,273,017
$23,293,311
$2,114,990
$2,233,189
$6,241,844
Net Change in Fund Balances
Fund Balances Beginning of Year
Fund Balances End of Year
See accompanying notes to the basic financial statements
- 18 -
712,222
(4,048,483)
(31,173)
City of Solon, Ohio
Reconciliation of the Statement of Revenues, Expenditures and Changes
in Fund Balances of Governmental Funds to the Statement of Activities
For the Year Ended December 31, 2011
Total
Governmental
Funds
$4,175,477
38,635,456
722,102
3,369,326
607,074
722,408
397,909
31,134
3,741,157
98,588
522,228
53,022,859
8,077,151
7,444,523
257,217
85,571
6,023,319
2,838,647
1,894,005
6,181,872
4,966,488
10,388,586
2,070,153
546,106
50,773,638
2,249,221
66,462
4,363,775
(4,063,840)
366,397
2,615,618
31,267,716
$33,883,334
Net Change in Fund Balances - Total Governmental Funds
$2,615,618
Amounts reported for governmental activities in the
statement of activities are different because
Governmental funds report capital outlays as expenditures.
However, in the statement of activities, the cost of those
assets is allocated over their estimated useful lives as
depreciation expense. This is the amount by which
depreciation exceeded capital outlay in the current period.
Capital Outlay
4,771,468
Depreciation
(6,050,394)
Total
(1,278,926)
Governmental funds only report the disposal of capital assets to
the extent proceeds are received from the sale. In the
statement of activities, a gain or loss is reported for each
disposal.
(18,830)
Revenues in the statement of activities that do not provide
current financial resources are not reported as revenues
in the funds.
Property Taxes
(9,331)
Municipal Income Taxes
38,771
Intergovernmental
(75,906)
Special Assessments
(711,266)
Charges for Services
(10,000)
Total
(767,732)
Repayment of long-term debt is an expenditure in the
governmental funds, but the repayment reduces long-term
liabilities in the statement of net assets.
Some expenses reported in the statement of activities, such as
accrued interest do not require the use of current financial
resources and therefore are not reported as expenditures
in governmental funds.
2,070,153
13,016
Some expenses reported in the statement of activities do not
require the use of current financial resources and therefore
are not reported as expenditures in governmental funds.
Compensated Absences
41,573
Vacation Benefits Payable
(707)
Claims Payable
38,433
Total
79,299
The internal service funds used by management are not reported
in the City-wide statement of activities. Governmental fund
expenditures and related internal service fund revenues are
eliminated. The net revenue (expense) of the internal service
fund is allocated among the governmental activities.
Change in Net Assets
71,995
Claims Payable
(38,433)
Total
33,562
Change in Net Assets of Governmental Activities
- 19 -
$2,746,160
City of Solon, Ohio
Statement of Revenues, Expenditures and Changes
In Fund Balance - Budget (Non-GAAP Basis) and Actual
General Fund
For the Year Ended December 31, 2011
Budgeted Amounts
Original
Final
Actual
Variance with
Final Budget
Positive
(Negative)
Revenues
Property Taxes
Municipal Income Taxes
Intergovernmental
Investment Income
Fees, Licenses and Permits
Fines and Forfeitures
Charges for Services
Miscellaneous
$1,123,653
25,153,508
1,186,870
594,996
390,032
286,141
629,315
232,644
$1,292,534
29,844,638
1,331,770
675,800
443,000
325,000
655,500
269,889
$1,349,907
29,746,521
1,425,869
670,480
383,276
324,183
808,270
418,146
$57,373
(98,117)
94,099
(5,320)
(59,724)
(817)
152,770
148,257
Total Revenues
29,597,159
34,838,131
35,126,652
288,521
6,558,075
5,892,706
225,094
73,071
38,638
1,828,951
1,348,975
4,854,314
4,901,683
7,707,189
6,840,935
264,865
86,000
38,638
2,152,732
1,631,842
5,647,070
5,621,143
7,284,601
6,339,089
257,039
85,571
38,638
1,917,731
1,624,881
5,271,273
5,051,962
422,588
501,846
7,826
429
0
235,001
6,961
375,797
569,181
25,721,507
29,990,414
27,870,785
2,119,629
3,875,652
4,847,717
7,255,867
2,408,150
Other Financing Sources (Uses)
Sale of Capital Assets
Advances Out
Transfers In
Transfers Out
41,610
(500,000)
0
(5,208,250)
41,610
(500,000)
250
(5,431,250)
41,610
(500,000)
250
(5,420,217)
0
0
0
11,033
Total Other Financing Sources (Uses)
(5,666,640)
(5,889,390)
(5,878,357)
11,033
Net Change in Fund Balance
(1,790,988)
(1,041,673)
1,377,510
2,419,183
Fund Balance Beginning of Year
17,867,602
17,867,602
17,867,602
0
193,022
193,022
193,022
0
$16,269,636
$17,018,951
$19,438,134
$2,419,183
Expenditures
Current:
Security of Persons and Property
Police
Fire
Prosecutor
Public Health and Welfare
Leisure Time Activities
Community Environment
Basic Utility Services
Transportation
General Government
Total Expenditures
Excess of Revenues Over Expenditures
Prior Year Encumbrances Appropriated
Fund Balance End of Year
See accompanying notes to the basic financial statements
- 20 -
City of Solon, Ohio
Statement of Fund Net Assets
Proprietary Funds
December 31, 2011
Enterprise
Water
Reclamation
Assets
Current Assets:
Equity in Pooled Cash and Cash Equivalents
Materials and Supplies Inventory
Accounts Receivable
Grantwood
Recreation
Total
Internal
Service
$5,258,025
124,405
1,949,164
$268,719
63,759
822
$5,526,744
188,164
1,949,986
$155,051
0
0
7,331,594
333,300
7,664,894
155,051
Noncurrent Assets:
Nondepreciable Capital Assets
Depreciable Capital Assets, Net
4,968,068
57,185,025
2,382,164
604,916
7,350,232
57,789,941
0
0
Total Noncurrent Assets
62,153,093
2,987,080
65,140,173
0
Total Assets
69,484,687
3,320,380
72,805,067
155,051
Liabilities
Current Liabilities:
Accounts Payable
Accrued Wages
Contracts Payable
Intergovernmental Payable
Accrued Interest Payable
Compensated Absences Payable
Vacation Benefits Payable
OWDA Loans Payable
Claims Payable
48,084
19,784
0
86,527
223,854
43,768
34,486
1,769,211
0
4,204
6,421
0
4,168
0
107,272
14,355
0
0
52,288
26,205
0
90,695
223,854
151,040
48,841
1,769,211
0
0
0
400
0
0
0
0
0
60,159
Total Current Liabilities
2,225,714
136,420
2,362,134
60,559
Long-Term Liabilities:
Compensated Absences Payable
OWDA Loans Payable
Claims Payable
145,528
10,612,313
0
20,363
0
0
165,891
10,612,313
0
0
0
20,053
Total Long-Term Liabilities
10,757,841
20,363
10,778,204
20,053
Total Liabilities
12,983,555
156,783
13,140,338
80,612
Net Assets
Invested in Capital Assets, Net of Related Debt
Unrestricted
49,771,569
6,729,563
2,987,080
176,517
52,758,649
6,906,080
0
74,439
$56,501,132
$3,163,597
$59,664,729
$74,439
Total Current Assets
Total Net Assets
See accompanying notes to the basic financial statements
- 21 -
City of Solon, Ohio
Statement of Revenues,
Expenses and Changes in Fund Net Assets
Proprietary Funds
For the Year Ended December 31, 2011
Enterprise
Water
Reclamation
Operating Revenues
Charges for Services
Tap-In Fees
Rentals
Miscellaneous
Grantwood
Recreation
Total
Internal
Service
$7,719,948
77,776
0
59,942
$835,282
0
116,089
16,675
$8,555,230
77,776
116,089
76,617
$250,000
0
0
910
Total Operating Revenues
7,857,666
968,046
8,825,712
250,910
Operating Expenses
Personal Services
Materials and Supplies
Contractual Services
Depreciation
Claims
Change in Workers' Compensation Estimate
Other
1,653,130
418,030
843,563
1,766,978
0
0
197,198
582,931
151,484
138,673
57,822
0
0
117,093
2,236,061
569,514
982,236
1,824,800
0
0
314,291
0
0
143,895
0
118,888
(83,868)
0
Total Operating Expenses
4,878,899
1,048,003
5,926,902
178,915
Operating Income (Loss)
2,978,767
2,898,810
71,995
(79,957)
Non-Operating Revenues (Expenses)
Operating Grants
Interest and Fiscal Charges
158,528
(386,425)
0
0
158,528
(386,425)
0
0
Total Non-Operating Revenues (Expenses)
(227,897)
0
(227,897)
0
Income (Loss) before Transfers and
Capital Contributions
Capital Contributions
Transfers In
Transfers Out
Change in Net Assets
Net Assets Beginning of Year
Net Assets End of Year
2,750,870
10,000
66,410
(371,317)
2,455,963
(79,957)
0
4,972
0
(74,985)
2,670,913
10,000
71,382
(371,317)
71,995
0
0
2,380,978
71,995
54,045,169
3,238,582
57,283,751
2,444
$56,501,132
$3,163,597
$59,664,729
$74,439
See accompanying notes to the basic financial statements
- 22 -
City of Solon, Ohio
Statement of Cash Flows
Proprietary Funds
For the Year Ended December 31, 2011
Enterprise
Water
Reclamation
Grantwood
Recreation
Total
Internal
Service
Increase (Decrease) in Cash and Cash Equivalents
Cash Flows from Operating Activities
Cash Received from Customers
Cash Received from Tap-In Fees
Cash Received from Rentals
Cash Received from Interfund Services Provided
Cash Received from Other Sources and Donations
Cash Payments to Employees for Services and Benefits
Cash Payments for Goods and Services
Cash Payments for Claims
Cash Payments for Other Operating Expenses
Net Cash Provided by (Used for) Operating Activities
$6,189,448
77,776
0
0
55,543
(1,813,329)
(1,128,541)
0
(197,198)
3,183,699
$835,282
0
116,915
0
16,528
(580,074)
(342,523)
0
(123,415)
(77,287)
$7,024,730
77,776
116,915
0
72,071
(2,393,403)
(1,471,064)
0
(320,613)
$0
0
0
250,000
910
0
(148,230)
(73,453)
0
3,106,412
29,227
Cash Flows from Noncapital
Financing Activities
Operating Grants
Transfers In
Transfers Out
158,528
66,410
(371,317)
0
4,972
0
158,528
71,382
(371,317)
0
0
0
Net Cash Provided by (Used for) Noncapital
Financing Activities
(146,379)
4,972
(141,407)
0
Cash Flows from Capital and
Related Financing Activities
OWDA Loans Issued
Acquisition of Capital Assets
Principal Paid on OWDA Loans
Interest Paid on OWDA Loans
3,761,028
(4,229,355)
(1,551,090)
(325,115)
0
(5,850)
0
0
3,761,028
(4,235,205)
(1,551,090)
(325,115)
0
0
0
0
Net Cash Used for Capital and
Related Financing Activities
(2,344,532)
(5,850)
(2,350,382)
0
Net Increase (Decrease) in Cash
and Cash Equivalents
Cash and Cash Equivalents Beginning of Year
Cash and Cash Equivalents End of Year
692,788
(78,165)
614,623
29,227
4,565,237
346,884
4,912,121
125,824
$5,258,025
$268,719
$5,526,744
$155,051
(continued)
- 23 -
City of Solon, Ohio
Statement of Cash Flows
Proprietary Funds (continued)
For the Year Ended December 31, 2011
Business-type Activities
Water
Reclamation
Grantwood
Recreation
Total
Internal
Service
Reconciliation of Operating Income (Loss) to
Net Cash Provided by (Used for) Operating Activities
Operating Income (Loss)
Adjustments:
Depreciation
(Increase) Decrease in Assets:
Accounts Receivable
Materials and Supplies Inventory
Increase (Decrease) in Liabilities:
Accounts Payable
Accrued Wages
Contracts Payable
Claims Payable
Compensated Absences Payable
Vacation Benefits Payable
Intergovernmental Payable
Net Cash Provided by (Used for) Operating Activities
$2,978,767
($79,957)
$2,898,810
$71,995
1,766,978
57,822
1,824,800
0
(1,534,899)
32,104
679
(45,064)
(1,534,220)
(12,960)
0
0
33,646
(2,788)
0
0
(139,310)
(13,517)
62,718
(13,624)
1,031
0
0
3,364
(968)
(570)
20,022
(1,757)
0
0
(135,946)
(14,485)
62,148
$3,183,699
($77,287)
$3,106,412
Noncash Capital Financing Activities
During 2011, the infrastructure capital projects fund paid $10,000 respectively, to contractors directly on behalf of the
water reclamation enterprise fund. These amounts are included in capital contributions.
See accompanying notes to the basic financial statements
- 24 -
0
0
(4,335)
(38,433)
0
0
0
$29,227
City of Solon, Ohio
Statement of Fiduciary Assets and Liabilities
Agency Funds
December 31, 2011
Assets
Equity in Pooled Cash and Cash Equivalents
Cash and Cash Equivalents in Segregated Accounts
$1,057,967
41,614
Total Assets
$1,099,581
Liabilities
Intergovernmental Payable
Deposits Held and Due to Others
$41,614
1,057,967
Total Liabilities
$1,099,581
See accompanying notes to the basic financial statements
- 25 -
City of Solon, Ohio
Notes to the Basic Financial Statements
For the Year Ended December 31, 2011
Note 1 - Reporting Entity
The City of Solon (the City) is a home rule municipal corporation established under the laws of the
State of Ohio which operates under its own Charter. The current Charter, which provides for a
mayor-council form of government, was adopted November 2, 1954. The mayor is elected for a
four-year term and seven Council members are elected at large for four year staggered terms.
A reporting entity is comprised of the primary government, component units, and other organizations
that are included to ensure that the financial statements are not misleading. The primary
government of Solon consists of all funds, departments, boards and agencies that are not legally
separate from the City. For the City of Solon this includes the agencies and departments that
provide the following services: police and fire protection, emergency medical, parks and recreation,
planning, zoning, street maintenance and repair, a public golf course, sanitation system and general
administrative services.
Component units are legally separate organizations for which the City is financially accountable.
The City is financially accountable for an organization if the City appoints a voting majority of the
organization's governing board and (1) the City is able to significantly influence the programs or
services performed or provided by the organization; or (2) the City is legally entitled to or can
otherwise access the organization's resources; the City is legally obligated or has otherwise
assumed the responsibility to finance deficits of or provide financial support to, the organization; or
the City is obligated for the debt of the organization. Component units may also include
organizations for which the City approves the budget, the issuance of debt, or the levying of taxes.
The City has no component units.
The City participates in a shared risk pool and a jointly governed organization. These organizations
are the Northern Ohio Risk Management Association and the Northeast Ohio Public Energy Council.
These organizations are presented in Notes 14 and 15 to the basic financial statements.
The City’s management believes these financial statements present all activities for which the City is
financially accountable.
Note 2 - Summary of Significant Accounting Policies
The financial statements of the City have been prepared in conformity with generally accepted
accounting principles (GAAP) as applied to governmental units. The Governmental Accounting
Standards Board (GASB) is the accepted standard-setting body for establishing governmental
accounting and financial reporting principles. The City also applies Financial Accounting Standards
Board (FASB) Statements and Interpretations issued on or before November 30, 1989, to its
governmental and business-type activities and to its proprietary funds unless those pronouncements
conflict with or contradict GASB pronouncements. The City has elected not to apply FASB
Statements and Interpretations issued after November 30, 1989 to its business-type activities and to
its enterprise funds. The more significant of the City's accounting policies are described below.
Basis of Presentation
The City’s basic financial statements consist of government-wide statements, including a statement
of net assets and a statement of activities, and fund financial statements, which provide a more
detailed level of financial information.
- 26 -
City of Solon, Ohio
Notes to the Basic Financial Statements
For the Year Ended December 31, 2011
Government-wide Financial Statements The statement of net assets and the statement of
activities display information about the City as a whole. These statements include the financial
activities of the primary government, except for fiduciary funds. The activity of the internal service
fund is eliminated to avoid “doubling up” revenues and expenses. The statements distinguish
between those activities of the City that are governmental and those that are considered businesstype.
The statement of net assets presents the financial condition of the governmental and business-type
activities of the City at year-end. The statement of activities presents a comparison between direct
expenses and program revenues for each program or function of the City’s governmental activities
and for the business-type activities of the City. Direct expenses are those that are specifically
associated with a service, program or department and therefore clearly identifiable to a particular
function. Program revenues include charges paid by the recipient of the goods or services offered
by the program, grants and contributions that are restricted to meeting the operational or capital
requirements of a particular program and interest earned on grants that is required to be used to
support a particular program. Revenues which are not classified as program revenues are
presented as general revenues of the City, with certain limited exceptions. The comparison of direct
expenses with program revenues identifies the extent to which each governmental program or
business activity is self-financing or draws from the general revenues of the City.
Fund Financial Statements During the year, the City segregates transactions related to certain
City functions or activities in separate funds in order to aid financial management and to
demonstrate legal compliance. Fund financial statements are designed to present financial
information of the City at this more detailed level. The focus of governmental and enterprise fund
financial statements is on major funds. Each major fund is presented in a separate column.
Nonmajor funds are aggregated and presented in a single column. The internal service fund is
presented in a single column on the face of the proprietary fund statements. Fiduciary funds are
reported by type.
Fund Accounting
The City uses funds to maintain its financial records during the year. A fund is defined as a fiscal
and accounting entity with a self balancing set of accounts. There are three categories of funds:
governmental, proprietary and fiduciary.
Governmental Funds Governmental funds are those through which most governmental functions
are financed. Governmental fund reporting focuses on the sources, uses and balances of current
financial resources. Expendable assets are assigned to the various governmental funds according
to the purposes for which they may or must be used. Current liabilities are assigned to the fund from
which they will be paid. The difference between governmental fund assets and liabilities is reported
as fund balance. The following are the City's major governmental funds:
General Fund The general fund accounts for and reports all financial resources not
accounted for and reported in another fund. The general fund balance is available to the City
for any purpose provided it is expended or transferred according to the general laws of Ohio.
General Obligation Bond Retirement Fund The general obligation bond retirement fund
accounts for and reports property taxes, special assessments and other resources restricted
for the payment of principal and interest on general long-term debt, including related costs.
- 27 -
City of Solon, Ohio
Notes to the Basic Financial Statements
For the Year Ended December 31, 2011
Infrastructure Fund The infrastructure fund is used to account for and report one-fourth of
the City income tax revenues approved by the voters and restricted for paying the costs to
construct, reconstruct and maintain City-owned infrastructure.
The other governmental funds of the City account for grants and other resources whose use is
restricted, committed or assigned to a particular purpose.
Proprietary Funds Proprietary fund reporting focuses on the determination of operating income,
changes in net assets, financial position and cash flows. Proprietary funds are classified as either
enterprise or internal service.
Enterprise Funds - Enterprise funds may be used to account for any activity for which a fee
is charged to external users for goods or services. The following are the City’s major
enterprise funds:
Water Reclamation Fund The water reclamation fund accounts for the revenues
and expenses of the City owned wastewater system.
Grantwood Recreation Fund The grantwood recreation fund accounts for the
revenues and expenses of the City owned golf course.
Internal Service Funds Internal service funds account for the financing of services provided
by one department or agency to other departments or agencies of the City on a costreimbursement basis. The City’s internal service fund is a workers’ compensation fund that
accounts for workers’ compensation claims of the City employees.
Fiduciary Funds Fiduciary fund reporting focuses on net assets and changes in net assets. The
fiduciary fund category is split into four classifications: pension trust funds, investment trust funds,
private-purpose trust funds and agency funds. Trust funds are used to account for assets held by
the City under a trust agreement for individuals, private organizations, or other governments and are
therefore not available to support the City’s own programs. Agency funds are custodial in nature
(assets equal liabilities) and do not involve measurement of results of operations. The City only
utilizes the agency fund type. The agency funds are used to hold inspection deposits, distribute
traffic violation monies to other municipalities, provide scholarships for students in the DARE
program, collect other municipalities’ portion of sewer district legal case fees, and to distribute
income tax revenues to Bainbridge Township.
Measurement Focus
Government-wide Financial Statements The government-wide financial statements are prepared
using a flow of economic resources measurement focus. All assets and all liabilities associated with
the operation of the City are included on the Statement of Net Assets. The Statement of Activities
presents increases (e.g. revenues) and decreases (e.g. expenses) in total net assets.
Fund Financial Statements All governmental funds are accounted for using a flow of current
financial resources measurement focus. With this measurement focus, only current assets and
current liabilities generally are included on the balance sheet. The statement of revenues,
expenditures and changes in fund balances reports on the sources (i.e., revenues and other
financing sources) and uses (i.e., expenditures and other financing uses) of current financial
resources. This approach differs from the manner in which the governmental activities of the
- 28 -
City of Solon, Ohio
Notes to the Basic Financial Statements
For the Year Ended December 31, 2011
government-wide financial statements are prepared. Governmental fund financial statements
therefore include a reconciliation with brief explanations to better identify the relationship between
the government-wide statements and the statements for governmental funds.
Like the government-wide statements, all proprietary funds are accounted for on a flow of economic
resources measurement focus. All assets and all liabilities associated with the operation of these
funds are included on the statement of fund net assets. The statement of changes in fund net
assets presents increases (i.e., revenues) and decreases (i.e., expenses) in total net assets. The
statement of cash flows provides information about how the City finances and meets the cash flow
needs of its proprietary activities.
Basis of Accounting
Basis of accounting determines when transactions are recorded in the financial records and reported
on the financial statements. Government-wide financial statements and the statements presented
for the proprietary and fiduciary funds are prepared using the accrual basis of accounting.
Governmental funds use the modified accrual basis of accounting. Differences in the accrual and
modified accrual basis of accounting arise in the recognition of revenue, the recording of deferred
revenue and in the presentation of expenses versus expenditures.
Revenues - Exchange and Nonexchange Transactions Revenue resulting from exchange
transactions, in which each party gives and receives essentially equal value, is recorded on the
accrual basis when the exchange takes place. On a modified accrual basis, revenue is recorded in
the year in which the resources are measurable and become available. Available means that the
resources will be collected within the current year or are expected to be collected soon enough
thereafter to be used to pay liabilities of the current year. For the City, available means expected to
be received within thirty-one days of year-end.
Nonexchange transactions, in which the City receives value without directly giving equal value in
return, include income taxes, property taxes and grants, entitlements and donations. On an accrual
basis, revenue from income taxes is recognized in the year in which the income is earned. Revenue
from property taxes is recognized in the year for which the taxes are levied (See Note 7). Revenue
from grants, entitlements and donations is recognized in the year in which all eligibility requirements
have been satisfied. Eligibility requirements include timing requirements, which specify the year
when the resources are required to be used or the year when use is first permitted, matching
requirements, in which the City must provide local resources to be used for a specified purpose, and
expenditure requirements, in which the resources are provided to the City on a reimbursement
basis. On the modified accrual basis, revenue from nonexchange transactions must also be
available before it can be recognized.
Under the modified accrual basis, the following revenue sources are considered to be both
measurable and available at year-end: income tax, state-levied locally shared taxes (including
gasoline tax and motor vehicle license fees), fees, fines and forfeitures, interest and grants and
entitlements.
Deferred Revenue Deferred revenue arises when assets are recognized before revenue
recognition criteria have been satisfied.
- 29 -
City of Solon, Ohio
Notes to the Basic Financial Statements
For the Year Ended December 31, 2011
Property taxes for which there is an enforceable legal claim as of December 31, 2011, but which
were levied to finance year 2012 operations, have been recorded as deferred revenue. Grants and
entitlements received before the eligibility requirements are met are also recorded as deferred
revenue.
On governmental fund financial statements, receivables that will not be collected within the available
period have also been reported as deferred revenue.
Expenses/Expenditures On the accrual basis of accounting, expenses are recognized at the time
they are incurred.
The measurement focus of governmental fund accounting is on decreases in net financial resources
(expenditures) rather than expenses. Expenditures are generally recognized in the accounting
period in which the related fund liability is incurred, if measurable. Allocations of cost, such as
depreciation and amortization, are not recognized in governmental funds.
Cash and Cash Equivalents
To improve cash management, cash received by the City is pooled. Individual fund integrity is
maintained through City records. Interest in the pool is presented as "equity in pooled cash and
cash equivalents".
During 2011, investments were limited to STAR Ohio, repurchase agreements, federal national
mortgage association notes, federal home loan bank bonds and federal home loan mortgage
corporation notes.
Except for nonparticipating investment contracts, investments are reported at fair value which is
based on quoted market prices. Nonparticipating investment contracts such as repurchase
agreements and nonnegotiable certificates of deposit are reported at cost.
The City of Solon has invested in the State Treasury Asset Reserve of Ohio (STAR Ohio) during
2011. STAR Ohio is an investment pool managed by the State Treasurer’s Office which allows
governments within the State to pool their funds for investment purposes. STAR Ohio is not registered
with the SEC as an investment company, but does operate in a manner consistent with Rule 2a7 of
the Investment Company Act of 1940. Investments in STAR Ohio are valued at STAR Ohio’s net
asset value per share which is the price the investment could be sold at December 31, 2011.
Investment procedures are restricted by the provisions of the Ohio Revised Code. Interest revenue
credited to the general fund during 2011 amounted to $607,074, which includes $294,156 assigned
from other City funds.
Investments of the cash management pool and investments with original maturities of three months
or less at the time they are purchased by the City are presented on the financial statements as cash
equivalents.
Prepaid Items
Payments made to vendors for services that will benefit periods beyond December 31, 2011, are
recorded as prepaid items using the consumption method by recording a current asset for the
prepaid amount at the time of purchase and reflecting the expenditure/expense in the year in which
the services are consumed.
- 30 -
City of Solon, Ohio
Notes to the Basic Financial Statements
For the Year Ended December 31, 2011
Inventory
Inventories are presented at cost on a first-in, first-out basis and are expended/expensed when
used. Inventory consists of expendable supplies held for consumption.
Restricted Assets
Assets are reported as restricted when limitations on their use change in nature or normal
understanding of the availability of the asset. Such constraints are either externally imposed by
creditors, contributors, grantors, or laws of other governments or imposed by law through
constitutional provisions or enabling legislation. Restricted assets in the general fund represent
money set aside for unclaimed monies.
Capital Assets
General capital assets are capital assets which are associated with and generally arise from
governmental activities. They generally result from expenditures in the governmental funds.
General capital assets are reported in the governmental activities column of the government-wide
statement of net assets but are not reported in the fund financial statements. Capital assets utilized
by the proprietary funds are reported both in the business-type activities column of the governmentwide statement of net assets and in the respective funds.
All capital assets are capitalized at cost (or estimated historical cost) and updated for additions and
retirements during the year. The City was able to estimate the historical cost for the initial reporting
of infrastructure by backtrending (i.e., estimating the current replacement cost of the infrastructure to
be capitalized and using an appropriate price-level index to deflate the cost to the acquisition year or
estimated acquisition year). Donated capital assets are recorded at their fair market values as of the
date received. The City maintains a capitalization threshold of $5,000 with the exception of land as
land was included regardless of cost. Improvements are capitalized; the costs of normal
maintenance and repairs that do not add to the value of the asset or materially extend an asset’s life
are not. Interest incurred during the construction of proprietary fund capital assets is also
capitalized.
All capital assets are depreciated except for land and construction in progress. Improvements are
depreciated over the remaining useful lives of the related capital assets. Useful lives for
infrastructure were estimated based on the City’s historical records of necessary improvements and
replacement. Depreciation is computed using the straight-line method over the following useful
lives:
Description
Land Improvements
Buildings
Equipment and Furniture
Vehicles
Infrastructure
Governmental
Activities
Estimated Lives
Business Type
Activities
Estimated Lives
20 years
40 years
5-30 years
3-20 years
20 years
20 years
40 years
5-65 years
7-20 years
20 years
The City reports infrastructure consisting of roadways, sanitary and storm sewers, bridges and
culverts, waterlines, traffic signals and sidewalks and includes infrastructure acquired prior to
December 31, 1980.
- 31 -
City of Solon, Ohio
Notes to the Basic Financial Statements
For the Year Ended December 31, 2011
Interfund Balances
On fund financial statements, outstanding interfund loans and unpaid amounts for interfund services
are reported as “interfund receivables/payables”. Interfund balance amounts are eliminated in the
statement of net assets.
Compensated Absences
Vacation benefits are accrued as a liability as the benefits are earned if the employees' rights to
receive compensation are attributable to services already rendered and it is probable that the
employer will compensate the employees for the benefits through paid time off or some other
means. The City records a liability for all accumulated unused vacation time when earned for all
employees with more than one year of service. Since the City’s policy limits the accrual of vacation
time to the amount accrued in one year, the outstanding liability is recorded as “vacation benefits
payable” on the statement of net assets rather than as a long-term liability.
Sick leave benefits are accrued as a liability using the vesting method. The liability is based on the
sick leave accumulated at December 31 by those employees who are currently eligible to receive
termination payments and those employees for whom it is probable they will become eligible to
receive termination benefits in the future. The City records a liability for accumulated unused sick
leave for employees after ten years of service with the City.
The entire compensated absences liability is reported on the government-wide financial statements.
On the governmental fund financial statements, compensated absences are recognized as liabilities
and expenditures to the extent payments come due each period upon the occurrence of employee
resignations and retirements. These amounts are recorded in the account “matured compensated
absences payable” in the fund(s) from which the employees who have resigned or retired will be
paid.
Accrued Liabilities and Long-Term Obligations
All payables, accrued liabilities and long-term obligations are reported in the government-wide
financial statements and all payables, accrued liabilities and long-term obligations payable from
proprietary funds are reported on the proprietary fund financial statements.
In general, governmental fund payables and accrued liabilities that, once incurred, are paid in a
timely manner and in full from current financial resources, are reported as obligations of the funds.
However, claims and judgments, compensated absences and contractually required pension
contributions that will be paid from governmental funds are reported as a liability in the fund financial
statements only to the extent that they are due for payment during the current year. Bonds and
long-term loans are recognized as a liability on the governmental fund financial statements when
due.
Net Assets
Net assets represent the difference between assets and liabilities. Net assets invested in capital
assets, net of related debt consists of capital assets, net of accumulated depreciation, reduced by
the outstanding balances of any borrowing used for the acquisition, construction or improvement of
those assets. Net assets are reported as restricted when there are limitations imposed on their use
either through enabling legislation or through external restrictions imposed by creditors, grantors or
- 32 -
City of Solon, Ohio
Notes to the Basic Financial Statements
For the Year Ended December 31, 2011
laws or regulations of other governments. Net assets restricted for other purposes include
resources restricted for state highway maintenance and law enforcement.
The City applies restricted resources when an expense is incurred for purposes for which both
restricted and unrestricted net assets are available.
Fund Balance
Fund balance is divided into five classifications based primarily on the extent to which the City is
bound to observe constraints imposed upon the use of the resources in the governmental funds.
The classifications are as follows:
Nonspendable: The nonspendable fund balance category includes amounts that cannot be
spent because they are not in spendable form, or legally or contractually required to be
maintained intact. The “not in spendable form” criterion includes items that are not expected
to be converted to cash.
Restricted: Fund balance is reported as restricted when constraints placed on the use of
resources are either externally imposed by creditors (such as through debt covenants),
grantors, contributors, or laws or regulations of other governments or is imposed by law
through constitutional provisions or enabling legislation (City ordinances).
Enabling legislation authorizes the City to assess, levy, charge, or otherwise mandate
payment of resources (from external resource providers) and includes a legally enforceable
requirement that those resources be used only for the specific purposes stipulated in the
legislation. Legal enforceability means that the City can be compelled by an external partysuch as citizens, public interest groups, or the judiciary to use resources created by enabling
legislation only for the purposes specified by the legislation.
Committed: The committed fund balance classification includes amounts that can be used
only for the specific purposes imposed by a formal action (ordinance or resolution) of City
Council. Those committed amounts cannot be used for any other purpose unless City
Council removes or changes the specified use by taking the same type of action (ordinance
or resolution) it employed to previously commit those amounts. In contrast to fund balance
that is restricted by enabling legislation, committed fund balance classification may be
redeployed for other purposes with appropriate due process. Constraints imposed on the
use of committed amounts are imposed by City Council, separate from the authorization to
raise the underlying revenue; therefore, compliance with these constraints are not
considered to be legally enforceable. Committed fund balance also incorporates contractual
obligations to the extent that existing resources in the fund have been specifically committed
for use in satisfying those contractual requirements.
Assigned: Amounts in the assigned fund balance classification are intended to be used by
the City for specific purposes but do not meet the criteria to be classified as restricted or
committed. In governmental funds other than the general fund, assigned fund balance
represents the remaining amount that is not restricted or committed. In the general fund,
assigned amounts represent intended uses established by City Council or a City official
delegated that authority by City Charter or ordinance, or by State statute.
- 33 -
City of Solon, Ohio
Notes to the Basic Financial Statements
For the Year Ended December 31, 2011
Unassigned: Unassigned fund balance is the residual classification for the general fund and
includes all spendable amounts not contained in the other classifications. In other
governmental funds, the unassigned classification is used only to report a deficit balance
resulting from overspending for specific purposes for which amounts had been restricted,
committed, or assigned.
The City applies restricted resources first when expenditures are incurred for purposes for which
either restricted or unrestricted (committed, assigned, and unassigned) amounts are available.
Similarly, within unrestricted fund balance, committed amounts are reduced first, followed by
assigned, and then unassigned amounts when expenditures are incurred for purposes for which
amounts in any of the unrestricted fund balance classifications could be used.
Operating Revenues and Expenses
Operating revenues are those revenues that are generated directly from the primary activity of the
proprietary funds. For the City, these revenues are charges for services for water reclamation, the
Grantwood golf course and workers’ compensation program. Operating expenses are necessary
costs that have been incurred in order to provide the good or service that is the primary activity of
the fund. Any revenues and expenses not meeting the definitions of operating are reported as
nonoperating.
Contributions of Capital
Contributions of capital in proprietary fund financial statements arise from contributions of capital
assets from the infrastructure capital projects governmental fund.
Interfund Activity
Transfers between governmental and business-type activities on the government-wide statements
are reported in the same manner as general revenues. Transfers between governmental activities
are eliminated on the government-wide financial statements. Internal allocations of overhead
expenses from one function to another or within the same function are eliminated on the statement
of activities. Interfund payments for services provided and used are not eliminated.
Exchange transactions between funds are reported as revenues in the seller funds and as
expenditures/expenses in the purchaser funds. Flows of cash or goods from one fund to another
without a requirement for repayment are reported as interfund transfers. Interfund transfers are
reported as other financing sources/uses in governmental funds and after nonoperating
revenues/expenses in proprietary funds. Repayments from funds responsible for particular
expenditures/expenses to the funds that initially paid for them are not presented on the financial
statements.
Extraordinary and Special Items
Extraordinary items are transactions or events that are both unusual in nature and infrequent in
occurrence. Special items are transactions or events that are within the control of the City
Administration and that are either unusual in nature or infrequent in occurrence.
- 34 -
City of Solon, Ohio
Notes to the Basic Financial Statements
For the Year Ended December 31, 2011
Estimates
The preparation of the financial statements in conformity with generally accepted accounting
principles requires management to make estimates and assumptions that affect the amounts
reported in the financial statements and accompanying notes. Actual results may differ from those
estimates.
Budgetary Process
All funds, except agency funds, are legally required to be budgeted and appropriated. The major
documents prepared are the tax budget, the certificate of estimated resources, and the
appropriations resolution, all of which are prepared on the budgetary basis of accounting. The tax
budget demonstrates a need for existing or increased tax rates. The certificate of estimated
resources establishes a limit on the amount the City Council may appropriate. The appropriations
resolution is the City Council’s authorization to spend resources and sets annual limits on
expenditures plus encumbrances at the level of control selected by the City Council. The legal level
of control has been established by the Council at the personal services and other object level within
each department for all funds. For the personal service object level the Finance Director has been
authorized to allocate and maintain appropriations within each department. For the other object
level the Finance Director has been authorized to allocate appropriations within each department
and any object level which he maintains on his books, other than personal services. Budgetary
statements are presented beyond that legal level of control for informational purposes only.
The certificate of estimated resources may be amended during the year if projected increases or
decreases in revenue are identified by the Finance Director. The amounts reported as the original
and final budgeted amounts on the budgetary statements reflect the amounts on the certificate of
estimated resources when the original and final appropriations were enacted by Council.
The appropriation resolution is subject to amendment throughout the year with the restriction that
appropriations cannot exceed estimated resources. The amounts reported as the original budgeted
amounts reflect the first appropriation resolution for that fund that covered the entire year, including
amounts automatically carried forward from prior years. The amounts reported as the final budgeted
amounts represent the final appropriation amounts passed by the Council during the year.
Note 3 – Changes in Accounting Principles
For 2011, the City has implemented GASB Statement No. 59, “Financial Instruments Omnibus”.
GASB Statement No. 59 addresses significant practice issues that have arisen when accounting for
financial instruments by updating and improving existing standards regarding financial reporting of
certain financial instruments and external investment pools. The implementation of this statement
did not result in any change in the City’s financial statements.
- 35 -
City of Solon, Ohio
Notes to the Basic Financial Statements
For the Year Ended December 31, 2011
Note 4 – Fund Balances
Fund balance is classified as nonspendable, restricted, committed, assigned and/or unassigned
based primarily on the extent to which the City is bound to observe constraints imposed upon the
use of the resources in the government funds. The constraints placed on fund balance for the major
governmental funds and all other governmental funds are presented below:
Fund Balances
General
Obligation
Bond Retirement
General
Other
Governmental
Infrastructure
Funds
Total
Governmental
Funds
Nonspendable:
Prepaids
Inventory
Unclaimed Monies
$135,582
498,500
98,605
$0
0
0
$0
0
0
$0
0
0
$135,582
498,500
98,605
Total Nonspendable
732,687
0
0
0
732,687
377
0
0
0
377
0
0
0
0
0
0
0
0
0
0
0
0
2,114,990
0
0
0
0
0
0
0
2,233,189
830,940
274,720
154,347
282,210
641,520
0
3,045,271
830,940
274,720
154,347
282,210
641,520
2,114,990
5,278,460
377
2,114,990
2,233,189
5,229,008
9,577,564
998,468
0
0
0
0
5,208
0
0
0
0
0
0
0
0
0
0
0
0
0
325,956
250,956
366,619
69,305
0
998,468
325,956
250,956
366,619
69,305
5,208
1,003,676
0
0
1,012,836
2,016,512
Assigned to:
Senior Services
Economic Incentive
Compensated Absences
Other Purposes
111,183
198,385
327,400
272,992
0
0
0
0
0
0
0
0
0
0
0
0
111,183
198,385
327,400
272,992
Total Assigned
909,960
0
0
0
909,960
20,646,611
0
0
0
20,646,611
$23,293,311
$2,114,990
$2,233,189
$6,241,844
$33,883,334
Restricted for:
Street Lighting
Street and Highway Construction,
Maintenance and Repair
Police Pension
Fire Pension
Police Department
Landfill Improvement
Debt Service
Capital Improvements
Total Restricted
Committed to:
Emergency Medical Service
Cable TV
Tree Planting
Recreation
Police Department
Other Purposes
Total Committed
Unassigned
Total Fund Balances
- 36 -
City of Solon, Ohio
Notes to the Basic Financial Statements
For the Year Ended December 31, 2011
Note 5 - Budgetary Basis of Accounting
While reporting financial position, results of operations and changes in fund balance on the basis of
generally accepted accounting principles (GAAP basis), the budgetary basis as provided by law and
described above is based upon accounting for certain transactions on a basis of cash receipts,
disbursements, and encumbrances. The Statement of Revenues, Expenditures, and Changes in
Fund Balance - Budget (Non-GAAP Basis) and Actual - is presented for the general fund on the
budgetary basis to provide a meaningful comparison of actual results with the budget. The major
differences between the budget basis and the GAAP Basis (generally accepted accounting
principles) are:
a)
Revenues are recorded when received in cash (budget) as opposed to when susceptible
to accrual (GAAP).
b)
Expenditures are recorded when paid in cash (budget) as opposed to when the liability is
incurred (GAAP).
c)
Encumbrances are treated as expenditures (budget) rather than restricted, committed or
assigned fund balance (GAAP).
d)
Unreported cash represents amounts received but not included as revenue on the
budgetary statements, but which are reported on the operating statements prepared using
GAAP.
e)
Investments are reported at cost (budget) rather than fair value (GAAP).
f)
Advances Out are operating transactions (budget) as opposed to balance sheet
transactions (GAAP).
g)
Budgetary revenues and expenditures of the senior services, economic incentive, police
training, police bike rodeo and police transfer of prisoners funds are classified to the
general fund for GAAP reporting.
The following table summarizes the adjustments necessary to reconcile the GAAP basis statements
to the budgetary basis statements for the general fund.
- 37 -
City of Solon, Ohio
Notes to the Basic Financial Statements
For the Year Ended December 31, 2011
Net Change in Fund Balance
GAAP Basis
$1,620,431
Net Adjustment for Revenue Accruals
Beginning Fair Value Adjustment for Investments
Ending Fair Value Adjustment for Investments
Ending Unrecorded Cash
Net Adjustment for Expenditure Accruals
Advances Out
Excess of Revenues Over (Under) Expenditures
Senior Services
Economic Incentive
Police Training
Police Bike Rodeo
Police Transfer of Prisoners
Encumbrances
Budget Basis
2,084,407
350,143
(281,897)
(21)
(1,688,700)
(500,000)
(19,878)
40,302
10
250
133,123
(360,660)
$1,377,510
Note 6 - Deposits and Investments
The City has chosen to follow State statutes and classify monies held by the City into three
categories.
Active monies are public monies determined to be necessary to meet current demands upon the
City treasury. Active monies must be maintained either as cash in the City treasury, in commercial
accounts payable or withdrawable on demand, including negotiable order of withdrawal (NOW)
accounts, or in money market deposit accounts.
Inactive deposits are public deposits that Council has identified as not required for use within the
current five year period of designation of depositories. Inactive deposits must either be evidenced
by certificates of deposit maturing not later than the end of the current period of designation of
depositories, or by savings or deposit accounts including, but not limited to, passbook accounts.
Interim deposits are deposits of interim monies. Interim monies are those monies which are not
needed for immediate use but which will be needed before the end of the current period of
designation of depositories. Interim deposits must be evidenced by time certificates of deposit
maturing not more than one year from the date of deposit or by savings or deposit accounts
including passbook accounts.
Interim monies held by the City can be deposited or invested in the following securities:
1.
United States Treasury bills, bonds, notes, or any other obligation or security issued by
the United States Treasury, or any other obligation guaranteed as to principal and
interest by the United States;
2.
Bonds, notes, debentures, or any other obligations or securities issued by any federal
government agency or instrumentality, including, but not limited to, Federal National
- 38 -
City of Solon, Ohio
Notes to the Basic Financial Statements
For the Year Ended December 31, 2011
Mortgage Association, Federal Home Loan Bank, Federal Farm Credit Bank, Federal
Home Loan Mortgage Corporation, Government National Mortgage Association, and
Student Loan Marketing Association. All federal agency securities shall be direct
issuances of federal government agencies or instrumentalities;
3.
Written repurchase agreements in securities listed above;
4.
Bonds and other obligations of the State of Ohio;
5.
Time certificates of deposit or savings or deposit accounts including, but not limited to,
passbook accounts;
6.
No-load money market mutual funds consisting exclusively of obligations described in
division (1) or (2);
7.
The State Treasurer's investment pool (STAR Ohio); and
8.
Commercial paper and bankers’ acceptances if training requirements have been met.
Investments in stripped principal or interest obligations, reverse repurchase agreements and
derivatives are prohibited. The issuance of taxable notes for the purpose of arbitrage, the use of
leverage and short selling are also prohibited. Investments may only be made through specified
dealers and institutions.
Deposits
Custodial Credit Risk Custodial credit risk for deposits is the risk that in the event of bank failure,
the City will not be able to recover deposits or collateral securities that are in the possession of an
outside party. At year end, $11,953,458 of the City’s bank balance of $16,356,277 was exposed to
custodial credit risk because it was uninsured and uncollateralized. Although the securities were
held by the pledging financial institutions’ trust department and all statutory requirements for the
deposit of money had been followed, noncompliance with Federal requirements could potentially
subject the City to a successful claim by the FDIC.
The City has no deposit policy for custodial risk beyond the requirements of State statute. Ohio law
requires that deposits be either insured or be protected by eligible securities pledged to and
deposited either with the City or a qualified trustee by the financial institution as security for
repayment, or by a collateral pool of eligible securities deposited with a qualified trustee and pledged
to secure the repayment of all public monies deposited in the financial institution whose market
value at all times shall be at least one hundred five percent of the deposits being secured.
Investments
Investments are reported at fair value.
investments:
As of December 31, 2011, the City had the following
- 39 -
City of Solon, Ohio
Notes to the Basic Financial Statements
For the Year Ended December 31, 2011
Fair Value
STAR Ohio
Maturity
Standard
& Poor's
Rating
Percentage of
Total
Investments
$9,063
Average 57.0 Days
AAAm
N/A
390,000
Less than 30 Days
AAA
1.55%
Less than five years
AAA
75.87%
4,163,390
Less than three years
AAA
16.59%
1,504,490
Less than five years
AAA
5.99%
Repurchase Agreements backed by
Federal Home Loan Mortgage
Corporation Notes
Federal National Mortgage
Association Notes
Federal Home Loan Bank Bonds
19,044,553
Federal Home Loan Mortgage
Corporation Notes
Total
$25,111,496
Interest Rate Risk As a means of limiting its exposure to fair value losses caused by rising interest
rates, the City’s investment policy requires that operating funds be invested primarily in short-term
investments maturing within five years from the date of purchase and that the City’s investment
portfolio be structured so that securities mature to meet cash requirements for ongoing operations
and/or long-term debt payments. The stated intent of the policy is to avoid the need to sell securities
prior to maturity. Repurchase agreements are limited to 30 days and the market value of the
underlying securities must exceed the principal value of the agreement by at least 2 percent and be
marked to market daily.
Credit Risk Ohio law requires that STAR Ohio maintain the highest rating provided by at least one
nationally recognized standard rating service. The City has no investment policy that addresses
credit risk.
Concentration of Credit Risk. The City places no limit on the amount it may invest in any one
issuer.
Note 7 – Receivables
Receivables at December 31, 2011, consisted of municipal income taxes, property taxes, accounts
(billings for user charged services), special assessments, interest and intergovernmental receivables
arising from grants, entitlements and shared revenues.
No allowance for doubtful accounts has been recorded because uncollectible amounts are expected
to be insignificant. All receivables except property taxes and special assessments are expected to
be collected within one year. Property taxes, although ultimately collectible, include some portion of
delinquencies that will not be collected within one year.
Special assessments expected to be collected in more than one year amount to $4,465,019 in the
general obligation bond retirement fund. At December 31, 2011, the amount of delinquent special
assessments was $45,064.
- 40 -
City of Solon, Ohio
Notes to the Basic Financial Statements
For the Year Ended December 31, 2011
Property Taxes
Property taxes include amounts levied against all real and public utility property located in the City.
Property tax revenue received during 2011 for real and public utility property taxes represents
collections of 2010 taxes.
2011 real property taxes were levied after October 1, 2011, on the assessed value as of January 1,
2011, the lien date. Assessed values are established by State law at 35 percent of appraised
market value. 2011 real property taxes are collected in and intended to finance 2012.
Real property taxes are payable annually or semi-annually. If paid annually, payment is due
December 31; if paid semi-annually, the first payment is due December 31, with the remainder
payable by June 20. Under certain circumstances, State statute permits later payment dates to be
established.
Public utility tangible personal property currently is assessed at varying percentages of true value;
public utility real property is assessed at 35 percent of true value. 2011 public utility property taxes
which became a lien December 31, 2010, are levied after October 1, 2011, and are collected in 2012
with real property taxes.
The full tax rate for all City operations for the year ended December 31, 2011, was $3.90 per $1,000
of assessed value. The assessed values of real property and public utility tangible property upon
which 2011 property tax receipts were based are as follows:
Real Estate
Residential/Agricultural
Other Real Estate
Tangible Personal Property
Public Utility
$798,875,290
325,815,610
17,142,470
Total
$1,141,833,370
The County Treasurer collects property taxes on behalf of all taxing districts in the county, including
the City. The County Fiscal Officer periodically remits to the City its portion of the taxes collected.
Property taxes receivable represents real and public utility property taxes and outstanding
delinquencies which were measurable as of December 31, 2011, and for which there was an
enforceable legal claim. In the governmental funds, the entire receivable has been deferred since
current taxes were not levied to finance 2011 operations and the collection of delinquent taxes
during the available period is not subject to reasonable estimation. On the accrual basis, collectible
delinquent property taxes have been recorded as revenue while on the modified accrual basis the
revenue has been deferred.
- 41 -
City of Solon, Ohio
Notes to the Basic Financial Statements
For the Year Ended December 31, 2011
Income Tax
The City levies and collects an income tax of 2.0 percent on all income earned within the City as well
as on income of residents earned outside the City. In the latter case, the City allows a credit of 100
percent of the tax paid to another municipality, not to exceed the amount owed. Employers within
the City are required to withhold income tax on employee earnings and remit the tax to the City at
least monthly. Corporations and other individual taxpayers are also required to pay their estimated
tax at least quarterly and file a final return annually. In 2011, the general fund received seventy-five
percent of the proceeds and the infrastructure fund received twenty-five percent of the proceeds.
Intergovernmental Receivable
A summary of the principal items of intergovernmental receivables follows:
Governmental Activities
Local Government
Gasoline Tax
Estate Tax
Homestead and Rollback
Cents per Gallon
Auto Regulation
Personal Property Tax Reimbursement
Prisoner Housing
Bedford Municipal Court
Cuyahoga Arts & Culture
State of Ohio
Violations Bureau
City of Cleveland
Solon City Schools
Cuyahoga County
Total Intergovernmental Receivables
Amount
$328,040
262,347
233,990
202,794
131,778
106,786
43,856
26,722
22,628
9,229
5,006
4,855
2,327
2,075
1,046
$1,383,479
Note 8 - Contingencies
Grants
The City receives financial assistance from federal and state agencies in the form of grants. The
disbursement of funds received under these programs generally requires compliance with terms and
conditions specified in the grant agreements and are subject to audit by the grantor agencies. Any
disallowed claims resulting from such audits could become a liability of the general fund or any other
applicable funds. However, in the opinion of management, any such disallowed claims will not have
a material adverse effect on the overall financial position of the City at December 31, 2011.
- 42 -
City of Solon, Ohio
Notes to the Basic Financial Statements
For the Year Ended December 31, 2011
Litigation
The City of Solon is a party to legal proceedings. The City and Kenmore Construction had a dispute
over a construction contract which was brought to arbitration to be settled. On April 5, 2012,
Kenmore Construction was awarded a total of $1,429,131 to be paid by the City. Of the total
awarded amount, $655,343 consisted of the retainage balance on the contract and $773,788
consisted of the amount in dispute plus interest charges.
Note 9 - Capital Assets
Capital asset activity for the year ended December 31, 2011, was as follows:
Balance
12/31/10
Governmental Activities:
Capital Assets Not Being Depreciated
Land
Construction in progress
Additions
Reductions
Balance
12/31/11
$10,494,480
2,155,766
$42,563
2,824,953
$0
(316,457)
$10,537,043
4,664,262
12,650,246
2,867,516
(316,457)
15,201,305
Capital Assets Being Depreciated
Land improvements
Buildings
Equipment and Furniture
Vehicles
Infrastructure
2,046,340
55,832,072
6,330,444
11,728,948
117,921,879
0
101,603
316,439
425,292
1,377,075
0
0
(149,156)
(187,136)
(196,846)
2,046,340
55,933,675
6,497,727
11,967,104
119,102,108
Total Capital Assets Being Depreciated
193,859,683
2,220,409
(533,138)
195,546,954
Less Accumulated Depreciation
Land improvements
Buildings
Equipment and Furniture
Vehicles
Infrastructure
(708,538)
(15,264,219)
(3,848,745)
(6,803,584)
(56,914,825)
(98,031)
(1,409,284)
(468,277)
(893,031)
(3,181,771)
0
0
149,156
168,306
196,846
(806,569)
(16,673,503)
(4,167,866)
(7,528,309)
(59,899,750)
Total Accumulated Depreciation
(83,539,911)
(6,050,394) *
514,308
(89,075,997)
Capital Assets Being Depreciated, net
110,319,772
(3,829,985)
(18,830)
106,470,957
$122,970,018
($962,469)
($335,287)
$121,672,262
Total Capital Assets
Not Being Depreciated
Governmental Activities
Capital Assets, net
- 43 -
City of Solon, Ohio
Notes to the Basic Financial Statements
For the Year Ended December 31, 2011
Balance
12/31/10
Business Type Activities:
Capital Assets Not Being Depreciated
Land
Construction in progress
Additions
Reductions
Balance
12/31/11
$3,120,877
0
$0
4,229,355
$0
0
$3,120,877
4,229,355
3,120,877
4,229,355
0
7,350,232
Capital Assets Being Depreciated
Land Improvements
Buildings
Equipment and Furniture
Vehicles
Infrastructure
256,107
28,049,089
5,954,686
704,965
59,238,235
0
0
5,850
0
10,000
0
0
0
0
0
256,107
28,049,089
5,960,536
704,965
59,248,235
Total Capital Assets Being Depreciated
94,203,082
15,850
0
94,218,932
Total Capital Assets
Not Being Depreciated
Less Accumulated Depreciation
Land Improvements
Buildings
Equipment and Furniture
Vehicles
Infrastructure
(246,540)
(11,541,734)
(4,918,967)
(532,008)
(17,364,942)
(796)
(706,026)
(82,089)
(27,581)
(1,008,308)
0
0
0
0
0
(247,336)
(12,247,760)
(5,001,056)
(559,589)
(18,373,250)
Total Accumulated Depreciation
(34,604,191)
(1,824,800)
0
(36,428,991)
59,598,891
(1,808,950)
0
57,789,941
$62,719,768
$2,420,405
$0
$65,140,173
Capital Assets Being Depreciated, net
Business Type Activities
Capital Assets, net
* Depreciation expense was charged to governmental activities as follows:
Security of Persons and Property
Police
Fire
Leisure Time Activities
Community Environment
Transportation
Basic Utility Service
General Government
Total Depreciation Expense
- 44 -
$492,226
505,691
657,209
31,861
3,181,771
760,492
421,144
$6,050,394
City of Solon, Ohio
Notes to the Basic Financial Statements
For the Year Ended December 31, 2011
Note 10 - Risk Management
Property and Liability
The City is exposed to various risks of loss related to torts; theft of, damage to and destruction of
assets; errors and omissions; injuries to employees and natural disasters. In October 1989, the City
joined together with neighboring cities to form the Northern Ohio Risk Management Association
(NORMA), a not-for-profit corporation, for the purpose of obtaining property, liability and vehicle
insurance and providing for a formalized, jointly administered self insurance fund. The City pays an
annual premium to NORMA for its insurance coverage. The agreement of formation of NORMA
provides that NORMA will be self-sustaining through member premiums and will reinsure through
commercial companies for claims in excess of the limits described in the agreement. This coverage
is paid from the general fund. NORMA is a separate and independent entity governed by its own set
of by-laws and constitution. All assets and liabilities are the responsibility of NORMA. The program
is operated as a full indemnity program with no financial liability (other than monthly premiums) or
risk to the City. The City is not liable nor will it receive a cash balance of past claims upon departure
from the pool.
There has not been a significant reduction in coverage from the prior year and claims have not
exceeded coverage provided by NORMA in any of the last three years.
Workers’ Compensation
On July 3, 2007, the City was approved for self-insured status by the Bureau of Workers’
Compensation and began to administer its own workers’ compensation program (the program). The
City has established a workers’ compensation internal service fund to account for assets set aside
for claim settlements and related liabilities associated with the program. Liabilities of the fund are
reported when an employee injury has occurred, it is probable that a claim will be filed under the
program, and the amount of the claim can be reasonably estimated. The City utilizes the services of
Sedgwick Claims Management Services, the third party administrator, to review, process, and pay
employee claims. The City also maintains excess insurance coverage which would pay the portion
of claims that exceed $600,000 per occurrence for police officers, $500,000 per occurrence for fire
fighters and $400,000 per occurrence for all other employees.
The claims liability of $80,212 reported in the fund at December 31, 2011, is based on an estimate
provided by the third party administrator and the requirements of GASB statement No. 30 which
requires that a liability for unpaid claims costs, including estimates of costs relating to incurred but
not reported claims, be reported. The estimate was not affected by incremental claim adjustment
expenses and does not include other allocated or unallocated claim adjustment expenses. Changes
in the fund’s claims liability amount for 2010 and 2011 were:
Balance at
Beginning of Year
2010
2011
$10,270
118,645
Current
Year Claims
Claim
Payments
$155,846
118,888
$70,498
73,453
- 45 -
Change in
Workers'
Compensation
Estimate
$23,027
(83,868)
Balance at
End of Year
$118,645
80,212
City of Solon, Ohio
Notes to the Basic Financial Statements
For the Year Ended December 31, 2011
Employee Health Benefits
The City provides employee medical and prescription drug benefits through a partially self insured
program. The third party administrator, Medical Mutual of Ohio, reviews the claims which are then
paid by the City. The premiums are paid by the fund that pays the salary for the employee and the
costs are distributed on a pro rata basis based on the number of family and single plans in each
fund.
Medical claims within the network are subject to $225 single and $450 family deductible, and then
are covered 100 percent. Medical claims out of network are subject to $450 single and $900 family
deductible followed by 80/20 percent coinsurance for the next $1,000 single and $2,000 family, then
100 percent. Prescriptions are subject to a co-pay of $10 generic, $25 formulary, and $50 nonformulary. The City has stop loss coverage at $75,000 per family, per year, and a calculated
aggregate maximum for the 2011 plan year of $3,421,179.
The claims liability of $253,657 reported in the general fund at December 31, 2011 was estimated by
the third party administrator and is based on the requirements of Governmental Accounting
Standards Board Statement No. 30 which requires that a liability for unpaid claims costs, including
estimates of costs relating to incurred but not reported claims, be reported. The estimate was not
affected by incremental claim adjustment expenses and does not include other allocated or
unallocated claim adjustment expenses. Changes in the fund’s claims liability amount for 2010 and
2011 were:
Balance at
Beginning of Year
2010
2011
$295,908
178,574
Current
Year Claims
$3,143,598
3,051,861
Claim
Payments
$3,260,932
2,976,778
Balance at
End of Year
$178,574
253,657
Note 11 - Defined Benefit Pension Plans
Ohio Public Employees Retirement System
Plan Description – The City participates in the Ohio Public Employees Retirement System (OPERS).
OPERS administers three separate pension plans. The Traditional Pension Plan is a cost-sharing,
multiple-employer defined benefit pension plan. The Member-Directed Plan is a defined contribution
plan in which the member invests both member and employer contributions (employer contributions
vest over five years at 20 percent per year). Under the Member-Directed Plan, members
accumulate retirement assets equal to the value of the member and vested employer contributions
plus any investment earnings. The Combined Plan is a cost-sharing, multiple-employer defined
benefit pension plan. Under the Combined Plan, OPERS invests employer contributions to provide
a formula retirement benefit similar in nature to, but less than, the Traditional Pension Plan benefit.
Member contributions, the investment of which is self-directed by the members, accumulate
retirement assets in a manner similar to the Member-Directed Plan.
- 46 -
City of Solon, Ohio
Notes to the Basic Financial Statements
For the Year Ended December 31, 2011
OPERS provides retirement, disability, survivor and death benefits, and annual cost-of-living
adjustments to members of the Traditional Pension and Combined Plans. Members of the MemberDirected Plan do not qualify for ancillary benefits. Authority to establish and amend benefits is
provided by Chapter 145 of the Ohio Revised Code. OPERS issues a stand-alone financial report.
Interested parties may obtain a copy by visiting https://www.opers.org/investments/cafr.shtml, writing
to OPERS, 277 East Town Street, Columbus, Ohio 43215-4642, or by calling 614-222-5601 or 800222-7377.
Funding Policy – The Ohio Revised Code provides statutory authority for member and employer
contributions and currently limits the employer contribution to a rate not to exceed 14 percent of
covered payroll for state and local employer units and 18.1 percent of covered payroll for law
enforcement and public safety employer units. Member contribution rates, as set forth in the Ohio
Revised Code, are not to exceed 10 percent of covered payroll for members in State and local
divisions and 12 percent for law enforcement and public safety members. For the year ended
December 31, 2011, members in state and local divisions contributed 10 percent of covered payroll
while public safety and law enforcement members contributed 11.0 percent and 11.6 percent,
respectively. While members in the state and local divisions may participate in all three plans, law
enforcement and public safety divisions exist only within the Traditional Pension Plan. For 2011,
member and employer contribution rates were consistent across all three plans.
The City’s 2011 contribution rate was 14.0 percent, except for those plan members in law
enforcement or public safety, for whom the City’s contribution was 18.10 percent of covered payroll.
The portion of employer contributions used to fund pension benefits is net of post-employment
health care benefits. The portion of employer contribution allocated to health care for members in
the Traditional Plan was 4.00 percent for 2011. The portion of employer contributions allocated to
health care for members in the Combined Plan was 6.05 percent for 2011. Employer contribution
rates are actuarially determined.
The City’s required contributions for pension obligations to the Traditional Pension and Combined
Plans for the years ended December 31, 2011, 2010, and 2009 were $1,284,341, $1,181,581, and
$1,143,422, respectively. For 2011, 92.96 percent has been contributed with the balance being
reported as an intergovernmental payable. The full amount has been contributed for 2010 and
2009. Contributions to the Member-Directed Plan for 2011 were $62,770 made by the City and
$44,836 made by plan members.
Ohio Police and Fire Pension Fund
Plan Description – The City contributes to the Ohio Police and Fire Pension Fund (OP&F), a costsharing multiple-employer defined benefit pension plan. OP&F provides retirement and disability
benefits, annual cost-of-living adjustments, and death benefits to plan members and beneficiaries.
Benefit provisions are established by the Ohio State Legislature and are codified in Chapter 742 of
the Ohio Revised Code. OP&F issues a publicly available financial report that includes financial
information and required supplementary information for the plan. That report may be obtained by
writing to OP&F, 140 East Town Street, Columbus, Ohio 43215-5164.
Funding Policy – The Ohio Revised Code requires plan members to contribute 10.0 percent of their
annual covered salary, while employers are required to contribute 19.5 percent for police officers
and 24.0 percent for firefighters.
- 47 -
City of Solon, Ohio
Notes to the Basic Financial Statements
For the Year Ended December 31, 2011
The OP&F Pension Fund is authorized by the Ohio Revised Code to allocate a portion of the
employer contributions to retiree health care benefits. The portion of employer contributions used to
fund pension benefits was 12.75 percent of covered payroll for police officers and 17.25 percent of
covered payroll for firefighters. The City’s contributions to OP&F for police and firefighters pension
were $462,874 and $820,332 for the year ended December 31, 2011, $472,990 and $814,826 for
the year ended December 31, 2010, and $468,584 and $846,914 for the year ended December 31,
2009, respectively. For 2011, 72.26 percent for police and 72.60 percent for firefighters has been
contributed with the balance for both police and firefighters being report as an intergovernmental
payable. The full amount has been contributed for 2010 and 2009.
Note 12 - Postemployment Benefits
Ohio Public Employees Retirement System
Plan Description – Ohio Public Employees Retirement System (OPERS) administers three separate
pension plans: The Traditional Pension Plan—a cost-sharing, multiple-employer defined benefit
pension plan; the Member-Directed Plan—a defined contribution plan; and the Combined Plan—a
cost-sharing, multiple-employer defined benefit pension plan that has elements of both a defined
benefit and defined contribution plan.
OPERS maintains a cost-sharing multiple-employer defined benefit post-employment health care
plan for qualifying members of both the Traditional Pension and the Combined Plans. Members of
the Member-Directed Plan do not qualify for ancillary benefits, including post-employment health
care coverage. The plan includes a medical plan, prescription drug program and Medicare Part B
premium reimbursement.
In order to qualify for post-employment health care coverage, age-and-service retirees under the
Traditional Pension and Combined Plans must have 10 or more years of qualifying Ohio service
credit. Health care coverage for disability benefit recipients and qualified survivor benefit recipients
is available. The Ohio Revised Code permits, but does not mandate, OPERS to provide health care
benefits to its eligible members and beneficiaries. Authority to establish and amend benefits is
provided in Chapter 145 of the Ohio Revised Code.
Disclosures for the health care plan are presented separately in the OPERS financial report which
may be obtained by visiting https://www.opers.org/investments/cafr.shtml, writing to OPERS, 277
East Town Street, Columbus, Ohio 43215-4642, or by calling 614-222-5601 or 800-222-7377.
Funding Policy – The post-employment health care plan was established under, and is administrated
in accordance with, Internal Revenue Code 401(h). The Ohio Revised Code provides the statutory
authority requiring public employers to fund post-retirement health care through contributions to
OPERS. A portion of each employer’s contribution to OPERS is set aside for the funding of postretirement health care.
Employer contribution rates are expressed as a percentage of the covered payroll of active
members. In 2011, state and local employers contributed at a rate of 14.0 percent of covered
payroll, and public safety and law enforcement employers contributed at 18.10 percent. These are
the maximum employer contribution rates permitted by the Ohio Revised Code.
- 48 -
City of Solon, Ohio
Notes to the Basic Financial Statements
For the Year Ended December 31, 2011
Each year, the OPERS Retirement Board determines the portion of the employer contribution rate
that will be set aside for funding of post-employment health care benefits. The portion of employer
contributions allocated to health care for members in the Traditional Plan was 4.0 percent for 2011.
The portion of employer contributions allocated to health care for members in the Combined Plan
was 6.05 percent for 2011.
The OPERS Retirement Board is also authorized to establish rules for the payment of a portion of
the health care benefits provided, by the retiree or their surviving beneficiaries. Payment amounts
vary depending on the number of covered dependents and the coverage selected. Active members
do not make contributions to the post-employment health care plan.
The City’s contributions allocated to fund post-employment health care benefits for the years ended
December 31, 2011, 2010, and 2009 were $513,737, $673,612, and $826,782, respectively. For
2011, 92.96 percent has been contributed with the balance being reported as an intergovernmental
payable. The full amount has been contributed for 2010 and 2009.
The Health Care Preservation Plan (HCPP) adopted by the OPERS Retirement Board on
September 9, 2004, was effective January 1, 2007. Member and employer contribution rates
increased on January 1 of each year from 2006 to 2008. Rates for law enforcement and public
safety employers increased over a six year period beginning on January 1, 2006, with a final rate
increase on January 1, 2011. These rate increases allowed additional funds to be allocated to the
health care plan.
Ohio Police and Firemen Pension Fund
Plan Description – The City contributes to the Ohio Police and Fire Pension Fund (OP&F) sponsored
health care program, a cost-sharing multiple-employer defined post-employment health care plan
administered by OP&F. OP&F provides health care benefits including coverage for medical,
prescription drugs, dental, vision, Medicare Part B Premium and long-term care to retirees,
qualifying benefit recipients and their eligible dependents.
OP&F provides access to post-retirement health care coverage for any person who receives or is
eligible to receive a monthly service, disability, or survivor benefit check or is a spouse or eligible
dependent child of such person. The health care coverage provided by OP&F meets the definition
of an Other Post-Employment Benefit (OPEB) as described in GASB Statement No. 45.
The Ohio Revised Code allows, but does not mandate OP&F to provide OPEB benefits. Authority
for the OP&F Board of Trustees to provide health care coverage to eligible participants and to
establish and amend benefits is codified in Chapter 742 of the Ohio Revised Code.
OP&F issues a publicly available financial report that includes financial information and required
supplementary information for the plan. That report may be obtained by writing to OP&F, 140 East
Town Street, Columbus, Ohio 43215-5164.
Funding Policy – The Ohio Revised Code provides for contribution requirements of the participating
employers and of plan members to the OP&F defined benefit pension plan. Participating employers
are required by Ohio Revised Code to contribute to the pension plan at rates expressed as
percentages of the payroll of active pension plan members, currently, 19.5 percent and 24.0 percent
of covered payroll for police and fire employers, respectively. Active members do not make
contributions to the OPEB Plan.
- 49 -
City of Solon, Ohio
Notes to the Basic Financial Statements
For the Year Ended December 31, 2011
OP&F maintains funds for health care in two separate accounts. One for health care benefits under
an IRS Code Section 115 trust and one for Medicare Part B reimbursements administrated as an
Internal Revenue Code 401(h) account, both of which are within the defined benefit pension plan,
under the authority granted by the Ohio Revised Code to the OP&F Board of Trustees.
The Board of Trustees is authorized to allocate a portion of the total employer contributions made
into the pension plan to the Section 115 trust and the Section 401(h) account as the employer
contribution for retiree health care benefits. For the year ended December 31, 2011, the employer
contribution allocated to the health care plan was 6.75 percent of covered payroll. The amount of
employer contributions allocated to the health care plan each year is subject to the Trustees’ primary
responsibility to ensure that pension benefits are adequately funded and is limited by the provisions
of Sections 115 and 401(h).
The OP&F Board of Trustees also is authorized to establish requirements for contributions to the
health care plan by retirees and their eligible dependents, or their surviving beneficiaries. Payment
amounts vary depending on the number of covered dependents and the coverage selected.
The City’s contributions to OP&F which were allocated to fund post-employment health care benefits
for police and firefighters were $245,051 and $321,000 for the year ended December 31, 2011,
$250,406 and $318,845 for the year ended December 31, 2010, and $248,074 and $331,401 for the
year ended December 31, 2009. For 2011, 72.26 percent has been contributed for police and 72.60
percent has been contributed for firefighters with the balance for both police and firefighters being
report as an intergovernmental payable. The full amount has been contributed for 2010 and 2009
Note 13 – Compensated Absences
Vacation leave is earned at rates which vary depending upon length of service and standard work
week. Accumulated vacation leave must be taken within twelve months after credited or be forfeited
unless approved by the Mayor.
Sick leave is earned at the rate of 4.6 hours per eighty hours worked by each employee to a
maximum of 15 days or 120 hours per year. Each employee with the City hired prior to December
31, 1988, is paid for up to 120 days or a maximum of 960 hours in full and one day for every three
days of accumulated sick leave in excess of 120 days. Each employee with the City hired after
December 31, 1988, is paid for up to 45 days or a maximum of 360 hours in full and one day for
every four days of accumulated sick leave in excess of 45 days. This benefit is paid to an employee
upon retirement under a pension plan resulting from his public employment, or his estate upon
death.
Various departments allow compensation time to be earned on the same basis as overtime in lieu of
overtime. Compensation time is subject to the regulations of the Fair Labor Standards Act.
- 50 -
City of Solon, Ohio
Notes to the Basic Financial Statements
For the Year Ended December 31, 2011
Note 14 – Shared Risk Pool
The Northern Ohio Risk Management Association (NORMA) is a shared risk pool comprised of the
Cities of Bedford Heights, Eastlake, Highland Heights, Hudson, Maple Heights, Mayfield Heights,
Richmond Heights, Solon and South Euclid and the Village of Chagrin Falls. NORMA was formed to
enable its members to obtain property and liability insurance, including vehicles, and provide for a
formalized, jointly administered self-insurance fund. The members formed a not-for-profit corporation
known as NORMA, Inc. to administer the pool. NORMA is governed by a board of trustees that
consists of the Mayor from each of the participating members.
Each entity must remain a member for at least three years from the commencement date of October
1, 1987, with the exception of the Cities of Eastlake and Solon whose commencement date is
October 1, 1989, the City of Maple Heights, whose commencement date is October 1, 1993, and the
City of University Heights, whose commencement date is October 1, 2008. After the initial three
years, each City may extend its term in three-year increments.
Each member provides operating resources to NORMA based on actuarially determined rates. In
the event of losses, the first $2,500 of any valid claim will be paid by the member. The next
payment, a maximum of $100,000 per occurrence, will come from the self-insurance pool with any
excess paid from the specific stop-loss coverage carried by the pool. The self-insurance pool will
pay up to $750,000 per policy year before the aggregate stop-loss coverage takes over. If the
aggregate claims paid by the pool exceed the available resources, the pool may require the
members to make additional supplementary payments up to a maximum of the regular annual
payment.
In 2011, the City of Solon paid $285,166 in premiums from the general fund, which represents 16.65
percent of the total premiums paid by all members. Financial information can be obtained by
contacting the fiscal agent, the Finance Director at the City of Maple Heights, 5353 Lee Road, Maple
Heights, Ohio, 44137.
Note 15 – Jointly Governed Organization
The City is a member of The Northeast Ohio Public Energy Council (NOPEC).
NOPEC is a
regional council of governments formed under Chapter 167 of the Ohio Revised Code. NOPEC was
formed to serve as a vehicle for communities wishing to proceed jointly with an aggregation program
for the purchase of electricity. NOPEC is currently comprised of over 112 communities who have
been authorized by ballot to purchase electricity on behalf of their citizens. The intent of NOPEC is
to provide electricity at the lowest possible rates while at the same time insuring stability in prices by
entering into long-term contracts with suppliers to provide electricity to the citizens of its member
communities.
NOPEC is governed by a General Assembly made up of one representative from each member
community. The representatives on the governing board from each county then elect one person to
serve on the eight-member NOPEC Board of Directors. The Board oversees and manages the
operation of the aggregation program. The degree of control exercised by any participating
government is limited to its representation in the General Assembly and on the Board. The City of
Solon did not contribute to NOPEC during 2011. Financial information can be obtained by
contacting Joseph Migliorini, Board Chairman, 31320 Solon Road, Suite 20, Solon, Ohio 44139.
- 51 -
City of Solon, Ohio
Notes to the Basic Financial Statements
For the Year Ended December 31, 2011
Note 16 - Long-Term Obligations
The changes in long-term obligations during the year were as follows:
Balance
12/31/10
Additions
Reductions
Balance
12/31/11
Amounts Due
in One Year
Governmental Activities
General Obligation Bonds
1997 $3,700,000 - 5.70%
Library Building
2002 $12,235,000 - 3.00% to 4.60%
Community Center
$240,000
$0
($240,000)
$0
$0
5,380,000
0
(910,000)
4,470,000
670,000
Total General Obligation Bonds
5,620,000
0
(1,150,000)
4,470,000
670,000
167,497
0
(82,602)
84,895
84,895
517,794
0
(165,299)
352,495
172,483
487,294
0
(73,091)
414,203
76,163
4,138,872
0
(279,671)
3,859,201
283,741
5,375,866
0
(258,842)
5,117,024
267,586
10,519,826
0
(776,903)
9,742,923
799,973
214,265
0
(47,613)
166,652
47,615
45,618
0
(13,035)
32,583
13,033
259,883
0
(60,648)
199,235
60,648
Other Long-term Obligations
Compensated Absences
Solon City School District
Claims Payable
3,474,833
40,000
118,645
1,117,850
0
118,888
(1,159,423)
0
(157,321)
3,433,260
40,000
80,212
979,388
40,000
60,159
Total Other Long-term Obligations
3,633,478
1,236,738
(1,316,744)
3,553,472
1,079,547
$20,200,684
$1,236,738
($3,386,897)
$18,050,525
$2,695,063
Special Assessment Bonds
with Governmental Commitment
1992 $1,500,000 - 6.31%
County Issued Miles Sewer
OWDA Loans
1993 $5,894,814 - 4.30%
Northeast Pump
1997 $1,249,104 - 4.16%
Aurora/Liberty Sanitary Sewer
2004 $5,861,485 - 1.87%
Aurora Road West Draw
2006 $6,329,372 - 3.35%
Aurora East Sewer Project
Total OWDA Loans
OPWC Loans
1996 $952,295 - 0%
Solon Allotment
1999 $195,500 - 0%
Cochran Project
Total OPWC Loans
Total General Long-term Obligations
- 52 -
City of Solon, Ohio
Notes to the Basic Financial Statements
For the Year Ended December 31, 2011
Balance
12/31/10
Additions
Reductions
Balance
12/31/11
Amounts
Due in
One Year
Business-type Activities
OWDA Loans
1971 $509,646 - 6.25%
Treatment Plant Expansion
1993 $5,894,814 - 4.30%
Northeast Pump
1996 $18,763,183 - 3.04%
Treatment Plant Upgrade
and Expansion
1997 $401,178 - 3.54%
Treatment Plant Upgrade
and Expansion
2006 $4,406,906 - 3.15%
Trickling Filter Rehabilitation
2011 $5,096,690 - 3.15%
Anaerobic Digester
and Electrical Upgrade
$16,993
$0
($16,993)
$0
$0
715,048
0
(228,269)
486,779
238,190
5,869,887
0
(1,104,175)
4,765,712
1,137,997
132,669
0
(24,705)
107,964
25,587
3,436,989
0
(176,948)
3,260,041
182,565
0
3,761,028
3,761,028
184,872
10,171,586
3,761,028
(1,551,090)
12,381,524
1,769,211
Other Long-term Liabilities
Compensated Absences
452,877
70,355
(206,301)
316,931
151,040
Total Business-type Activities
$10,624,463
$3,831,383
($1,757,391)
$12,698,455
$1,920,251
Total OWDA Loans
0
In 1997, the City issued $3,700,000 in voted general obligation bonds for construction of the Solon
Branch Public Library. The bonds were issued for a twenty year period with a final maturity in 2016.
During 2009, the City called $1,390,000 of the amounts due in years 2012 through 2016. The bonds
did not have a call premium.
In 2002, the City issued $12,235,000 in unvoted general obligation bonds for construction of the
Community Center, Kruse Drive improvements and refunding of a 1992 general obligation bond
issue. The bonds were issued for a twenty year period with a final maturity in 2021.
In 1992, the City issued $1,500,000 in special assessment bonds for the installation of the Miles
Road Sanitary Sewer Project. The bonds were issued for a twenty year period with a final maturity
in 2012.
In 1993, the City received a $5,894,814 Ohio Water Development Authority loan for the installation
of the Creekside and Northeast Pump Stations and the Bainbridge and Liberty Roads Sanitary
Sewer Projects. The loan was issued for a twenty year period with a final maturity in 2013.
In 1997, the City received a $1,249,104 Ohio Water Development Authority loan for the installation
of the Aurora/Liberty Sanitary Sewer Project. The loan was issued for a twenty year period with a
final maturity in 2016.
In 2004, the City received a $5,861,485 Ohio Water Development Authority loan for the installation
of the Aurora Road West Draw Project. The loan was issued for a twenty year period with a final
maturity in 2024.
- 53 -
City of Solon, Ohio
Notes to the Basic Financial Statements
For the Year Ended December 31, 2011
In 2006, the City received a $6,329,372 Ohio Water Development Authority loan for improvements to
the Aurora East Sewer System. The loan was issued for a twenty year period with a final maturity in
2026.
In 1996, the City received a $952,295 Ohio Public Works Commission loan for the installation of the
Solon Boulevard, Baldwin/Huntington Sanitary Sewer Projects. The loan was issued for a twenty
year period with a final maturity in 2015.
In 1999, the City received a $195,500 Ohio Public Works Commission loan for the improvement of
the pavement and street signals at the Solon and Cochran intersection. The loan was issued for a
fifteen year period with a final maturity in 2014.
During 2008, the City assumed a loan initially between an independent contractor towards the Solon
City School District for nonpayment. The contractor has agreed to compensate the City over a ten
year period while the City repays the loan over a five year period. The remaining payments are due
in 2012.
In 1971, the City received a $509,646 Ohio Water Development Authority loan for the installation of
the Northeast Wastewater Treatment Plant. The loan was issued for a forty year period with a final
maturity in 2011.
In 1993, the City received a $5,894,814 Ohio Water Development Authority loan for the installation
of the Creekside and Northeast Pump Stations and the Bainbridge and Liberty Roads Sanitary
Sewer Projects. The loan was issued for a twenty year period with a final maturity in 2013.
In 1996, the City received a $18,763,183 Ohio Water Development Authority loan for the expansion
of the Central Wastewater Treatment Plant. The loan was issued for a twenty year period with a
final maturity in 2015.
In 1997, the City received a $401,178 Ohio Water Development Authority loan for the expansion of
the Central Wastewater Treatment Plant. The loan was issued for a nineteen year period with a final
maturity in 2015.
A line of credit has been established with the Ohio Water Development Authority in the amount of
$4,406,906 for the Trickling Filter Rehabilitation system; however, since this loan is not finalized, the
repayment schedule is not included in the schedule of debt service payments. The City has
received $3,879,364 in proceeds.
A line of credit has been established with the Ohio Water Development Authority in the amount of
$5,096,690 for the Anaerobic Digester and Electrical Upgrade project; however, since this loan is not
finalized, the repayment schedule is not included in the schedule of debt service payments. The
City has received $3,761,028 in proceeds.
General obligation bonds will be paid from the general bond retirement debt service fund with
property taxes. Special assessment bonds will be paid from the proceeds of special assessments
levied against benefited property owners. In the event that a property owner would fail to pay the
assessment, payment would be made by the City. The OWDA loans will be paid from the general
bond retirement debt service fund with property taxes and special assessments. The OPWC loans
will be paid from the infrastructure capital projects fund with income taxes.
- 54 -
City of Solon, Ohio
Notes to the Basic Financial Statements
For the Year Ended December 31, 2011
The OWDA enterprise fund loans are being paid from the water reclamation enterprise fund user
fees. In the event that the water reclamation enterprise fund would fail to pay the OWDA loans,
payment would be made by any general tax revenues collected in the general, bond retirement or
capital projects funds.
Compensated absences will be paid from the general fund, the recreation special revenue fund and
the water reclamation and Grantwood recreation enterprise funds.
The City's overall legal debt margin was $117,338,259 with an unvoted debt margin of $60,246,590
at December 31, 2011. Principal and interest requirements to retire long-term obligations
outstanding at December 31, 2011 are as follows:
Governmental Activities
General Obligation
Bonds
Principal
Interest
Special Assessment
Bonds
Principal
Interest
OWDA Loans
Principal
Interest
OPWC
Loans
Principal
2012
2013
2014
2015
2016
2017 - 2021
2022 - 2026
$670,000
350,000
365,000
380,000
400,000
2,305,000
0
$213,030
184,555
169,155
152,730
135,250
357,000
0
$84,895
0
0
0
0
0
0
$3,014
0
0
0
0
0
0
$799,973
823,871
660,730
678,116
696,038
3,260,113
2,824,082
$253,902
230,001
207,339
189,953
172,031
617,181
206,520
$60,648
60,648
54,132
23,807
0
0
0
Total
$4,470,000
$1,211,720
$84,895
$3,014
$9,742,923
$1,876,927
$199,235
Business-Type Activities
OWDA Loans
Principal
Interest
2012
2013
2014
2015
$1,401,774
1,447,945
1,236,228
1,274,508
$158,289
112,120
67,247
28,969
Total
$5,360,455
$366,625
Note 17 – Municipal Solid Waste Landfill
GASB No. 18, “Accounting for Municipal Solid Waste Landfill Closure and Postclosure Care Costs”
establishes standards of accounting and financial reporting for municipal solid waste landfill
(MSWLF) closure and postclosure care costs that are required to be incurred by federal, state or
local laws or regulations. The City of Solon is exempt from this standard since the operator of the
landfill is solely responsible for all costs, expenses and fees which may arise in connection with the
operation, closure and postclosure care and monitoring as required by the Ohio Environmental
Protection Agency regulations and permits of the Solon Landfill as it currently exists.
- 55 -
City of Solon, Ohio
Notes to the Basic Financial Statements
For the Year Ended December 31, 2011
Note 18 - Interfund Transactions
Interfund Transfers
Interfund transfers for the year ended December 31, 2011, consisted of the following:
Transfer From
Transfers To
General
Major Funds:
General Obligation Bond Retirement
Water Reclamation
Grantwood Recreation
Total
$0
66,410
4,972
$371,317
0
0
$371,317
66,410
4,972
71,382
3,992,458
371,317
0
442,699
3,992,458
$4,063,840
$371,317
$4,435,157
Total Major Funds
Other Governmental Funds
Total All Funds
Water
Reclamation
The general fund transfer to the water reclamation and the grantwood recreation enterprise funds
were to cover their respective shares of interest earnings per City ordinance. The general fund
transfer to the street construction, maintenance and repair and the state highway special revenue
funds were to cover their respective shares of interest earnings per City ordinance. The general
fund transfer to the police and fire pensions special revenue funds were because the 1.0 mills of
property tax received by those funds are not enough to meet the annual liability and payment to the
police and fire pension systems. The general fund transfer to the cable TV special revenue fund
was to cover the cable TV’s share of interest earnings per City ordinance. The general fund transfer
to the recreation special revenue fund is an annual subsidy to help keep program fees affordable to
participants. The general fund transfer to the landfill improvement special revenue fund was to
cover the landfill’s share of interest earnings per City ordinance. The general fund transfers to the
safety and service equipment and the general capital improvements capital projects funds was an
occasional subsidy for capital purchases. The water reclamation transfer to the bond retirement
fund was for the repayment of OWDA debt from OWDA Creekside project fees.
Interfund Balances
Interfund balances at December 31, 2011, consist of an interfund receivable in the general fund of
$500,000 and an interfund payable in the infrastructure capital projects fund of $500,000. The
advance was made to cover encumbered projects at year-end until the receipt of income tax monies.
Note 19 – Joint Economic Development District
In 2006, the City entered into a contract with neighboring Bainbridge Township to form the
Bainbridge-Solon Joint Economic Development District (JEDD). It is entirely located in Bainbridge
Township, and its primary purpose was to promote regional growth and economic development. In
December 2006, the JEDD Board levied a municipal income tax of two percent in the JEDD effective
January 1, 2007. The JEDD Board also contracted with the City of Solon to administer this income
tax.
- 56 -
City of Solon, Ohio
Notes to the Basic Financial Statements
For the Year Ended December 31, 2011
The JEDD agreement requires the City of Solon and Bainbridge Township share the income tax
receipts 50/50 after income tax administration costs and a five percent deduction for the JEDD’s
Maintenance and Improvement Fund for infrastructure related projects.
Note 20 – Contractual Commitments
The following table presents the City’s remaining balances on construction contracts at December
31, 2011. The City’s total amount remaining on construction contracts includes amounts for
contracts payable of $633,379 and retainage payable of $256,859 which are included in the City’s
construction in progress.
Vendor
A.W. Farrell & Son, Incorporated
Fabrizi Trucking and Paving
Mr. Excavator, Incorporated
Kenmore Construction
Fechko Excavating, Incorporated
Quality Control Inspection Incorporated
Wade Trim/Ohio, Incorporated
Treasurer Cuyahoga County
Trax Construction Company
R.E. Warner & Associates
Tri-Mor
Trax Construction Company
Crossroads Asphalt Recycling
T.C. Construction Company
Tri-Mor
Carron Asphalt
Cementech Incorporated
AAA Pipe Cleaning
Mark Haynes Construction
Camp Dresser & McKee Incorporated
Geo-Sci Laboratory, Incorporated
Tri-Mor
URS Corporation
Dura Mark Inc.
Big Trees Incorporated
Robert T. Park Ent. DBA
CT Consultants Incorporated
Pavement Technology, Incorporated
Forest City Land Group, Incorporated
Project Description
Service Dept Roof Replacement
Carter/Cochran Interesection
Briar Hill Dam
Pettibone Rd Project
Pepperwood Estates Project
Construction Inspection Services
Pepperwood Estates Project
Bainbridge Road Project
Sanitary & Storm Sewer Repairs
Cannon/Rt 91 Intersection
Annual Concrete Street Repair
Huntington Detention Basin
Annual Crack Sealing Program
Emergency Road Repairs
Kingswood Drive
Annual Asphalt Street Repair
Indepedence Court Project
Annual Sewer Grouting
S. Branch Sulfur Springs Restoration
Anaerobic Digester & Elec. Upgrade
Annual Materials Testing
Emergency Road Repairs
Citywide Traffic Signalization Project
Annual Street Striping
Bainbridge Road Project
Fire Alarm Installations
Anaerobic Digester & Elec. Upgrade
Carter/Cochran Interesection
Dorset Detention Basin
Total
Amount Remaining
on Contract
$1,410,000
736,590
675,934
655,343
276,579
248,379
160,747
130,289
88,120
84,626
77,040
72,324
71,301
55,529
49,303
47,419
41,840
40,409
39,518
36,248
33,363
32,537
30,637
20,608
16,244
8,565
6,410
5,342
4,937
$5,156,179
- 57 -
City of Solon, Ohio
Notes to the Basic Financial Statements
For the Year Ended December 31, 2011
Note 21 – Subsequent Events
On April 5, 2012, a construction contract dispute between the City of Solon and Kenmore
Construction was settled through arbitration. The contract in dispute involved construction costs on
the Pettibone Road project which was completed in 2010. The settlement decision was made
against the City and Kenmore Construction was awarded $1,429,131. The settlement amount
consisted of the retainage balance on the project, the additional amount in dispute and interest
penalty charges.
- 58 -
Combining and Individual Fund Statements and Schedules
- 59 -
Combining Statements – Nonmajor Governmental Funds
Nonmajor Special Revenue Funds
To account for and report the proceeds of specific revenue sources that are restricted or
committed to expenditures for specified purposes other than debt service or capital projects.
Street Construction, Maintenance and Repair Fund - to account for and report the portion of
the State gasoline tax and motor vehicle license fees that are restricted for maintenance of
streets within the City.
State Highway Fund - to account for and report that portion of the State gasoline tax and motor
vehicle registration fees that are restricted for maintenance of State highways within the City.
Police Pension Fund – to account for and report restricted property taxes levied for the
payment of the current liabilities for police disability and pension benefits.
Fire Pension Fund - to account for and report restricted property taxes levied for the payment
of the current liabilities for fire disability and pension benefits.
Cable TV Fund - to account for and report cable franchise fees committed to the Cable TV
Commission including a distribution of fifty percent to the Solon City Schools.
Tree Planting Fund – to account for and report deposits from developers committed to
purchasing and planting trees in the City.
Recreation Fund – to account for and report recreation activity charges and transfers
committed to operating the City park and recreation programs.
Police Department Programs Fund - to account for and report grants restricted to the Police
Department’s DARE Programs.
Landfill Improvement Fund – to account for and report fees restricted for reclamation of the
City-owned landfill.
Law Enforcement Trust Fund – to account for and report confiscation of money from law
enforcement activities restricted to expenditures to support the same law enforcement activities.
Northeast Ohio Public Energy Council (NOPEC) Grant Fund – to account for and report
grant monies restricted to energy conservation projects to reduce energy consumption.
Donations Trust Fund – to account for and report donations made to the Police Department
committed to the purchase of specific equipment.
Street Lighting Fund – to account for and report special assessments collected to pay the
costs of electricity for street lighting. This fund is currently inactive and is included with the
general fund for GAAP reporting because it does not have an ongoing revenue source.
Senior Services Fund – to account for and report the receipt of senior services activity fees
and transfers from the general fund to pay the cost of operating the senior services center and
related programs. This fund is included with the general fund for GAAP reporting because the
ordinance establishing the fund does not include a revenue source.
(continued)
- 60 -
Combining Statements – Nonmajor Governmental Funds (continued)
Nonmajor Special Revenue Funds (continued)
Economic Incentive Fund – to account for and report the receipt of grant money used to
support economic incentive/job creation programs. This fund is included with the general fund
for GAAP reporting because the ordinance establishing the fund does not include a revenue
source.
Police Training Fund - to account for and report the receipt of training fees collected to pay the
cost of providing police and corrections training. This fund is included with the general fund for
GAAP reporting because there is no restriction on these monies.
Police Bike Rodeo Fund - to account for and report contributions and donations from the
police bike rodeo to be used for police department events. This fund is included with the
general fund for GAAP reporting because there is no restriction on these monies.
Police Transfer of Prisoners Fund - to account for and report police transfer of prisoner fees
to be used for police department programs and expenses. This fund is included with the
general fund for GAAP reporting because there is no restriction on these monies.
Community Improvement Corporation Fund – to account for and report the revenues used
for industrial revenue bond administration. This fund is currently inactive and is included with
the general fund for GAAP reporting because there is no restriction on these monies.
Nonmajor Capital Projects Funds
Capital projects funds are used to account and report financial resources that are restricted,
committed or assigned to expenditure for capital outlays including the acquisition or construction
of major capital facilities and other capital assets, other than those by proprietary funds or for
assets that will be held in trust.
Safety and Service Equipment Fund – to account for and report the voter approved one half
mill property tax levy restricted to the purchase of police, fire and service department vehicles
and equipment.
Community Center Fund – to account for and report debt proceeds restricted to construction
of the new Community Center.
Building Construction Fund – to account for and report debt proceeds restricted to the
construction of various City buildings.
Old City Hall Renovations Fund – to account for and report grants restricted to renovating the
old Solon City Hall.
General Capital Improvements Fund – to account for and report income taxes from the City’s
Joint Economic Development District (JEDD) and recycling charges restricted to the purchase of
land, buildings, vehicles and equipment.
- 61 -
City of Solon, Ohio
Combining Balance Sheet
Nonmajor Governmental Funds
December 31, 2011
Nonmajor
Special
Revenue
Funds
Nonmajor
Capital
Projects
Funds
Assets
Equity in Pooled Cash and
Cash Equivalents
Accounts Receivable
Intergovernmental Receivable
Municipal Income Tax Receivable
Property Taxes Receivable
$3,722,098
54,836
579,167
0
1,046,678
$3,712,319
0
24,593
19,183
402,524
$7,434,417
54,836
603,760
19,183
1,449,202
Total Assets
$5,402,779
$4,158,619
$9,561,398
Liabilities and Fund Balances
Liabilities
Accounts Payable
Accrued Wages
Contracts Payable
Intergovernmental Payable
Retainage Payable
Deferred Revenue
$74,072
36,602
0
570,295
0
1,525,237
$0
0
633,264
0
52,739
427,345
$74,072
36,602
633,264
570,295
52,739
1,952,582
Total Liabilities
2,206,206
1,113,348
3,319,554
Fund Balances
Restricted
Committed
2,183,737
1,012,836
3,045,271
0
5,229,008
1,012,836
Total Fund Balances
3,196,573
3,045,271
6,241,844
$5,402,779
$4,158,619
$9,561,398
Total Liabilities and Fund Balances
- 62 -
Total
Nonmajor
Governmental
Funds
City of Solon, Ohio
Combining Statement of Revenues, Expenditures and Changes in Fund Balances
Nonmajor Governmental Funds
For the Year Ended December 31, 2011
Nonmajor
Special
Revenue
Funds
Revenues
Property Taxes
Municipal Income Taxes
Intergovernmental
Fees, Licenses and Permits
Fines and Forfeitures
Rentals
Charges for Services
Contributions and Donations
Miscellaneous
Nonmajor
Capital
Projects
Funds
Total
Nonmajor
Governmental
Funds
$1,019,306
0
1,337,276
331,262
67,331
31,134
2,784,566
98,588
63,033
$390,098
78,085
99,444
0
0
0
27,740
0
19,922
$1,409,404
78,085
1,436,720
331,262
67,331
31,134
2,812,306
98,588
82,955
Total Revenues
5,732,496
615,289
6,347,785
Expenditures
Current:
Security of Persons and Property
Police
Fire
Leisure Time Activities
Community Environment
Basic Utility Services
Transportation
Capital Outlay
785,645
1,149,061
5,485,913
2,405
305,353
1,079,000
0
0
0
0
0
0
0
1,588,891
785,645
1,149,061
5,485,913
2,405
305,353
1,079,000
1,588,891
Total Expenditures
8,807,377
1,588,891
10,396,268
Excess of Revenues Under Expenditures
(3,074,881)
(973,602)
(4,048,483)
Other Financing Sources
Sale of Capital Assets
Transfers In
0
2,732,835
24,852
1,259,623
24,852
3,992,458
Total Other Financing Sources
2,732,835
1,284,475
4,017,310
Net Change in Fund Balances
Fund Balances Beginning of Year
Fund Balances End of Year
(342,046)
310,873
(31,173)
3,538,619
2,734,398
6,273,017
$3,196,573
$3,045,271
$6,241,844
- 63 -
City of Solon, Ohio
Combining Balance Sheet
Nonmajor Special Revenue Funds
December 31, 2011
Street
Construction,
Maintenance
and Repair
Assets
Equity in Pooled Cash and
Cash Equivalents
Accounts Receivable
Intergovernmental Receivable
Property Taxes Receivable
State
Highway
Police
Pension
Fire
Pension
Cable
TV
$608,220
0
462,047
0
$135,686
0
38,864
0
$485,371
0
25,873
418,671
$486,427
0
38,809
628,007
$285,238
46,852
1,938
0
$1,070,267
$174,550
$929,915
$1,153,243
$334,028
Liabilities and Fund Balances
Liabilities
Accounts Payable
Accrued Wages
Intergovernmental Payable
Deferred Revenue
$0
0
0
381,541
$0
0
0
32,336
$0
0
210,651
444,544
$0
0
332,080
666,816
$8,072
0
0
0
Total Liabilities
381,541
32,336
655,195
998,896
8,072
Fund Balances
Restricted
Committed
688,726
0
142,214
0
274,720
0
154,347
0
0
325,956
Total Fund Balances
688,726
142,214
274,720
154,347
325,956
$1,070,267
$174,550
$929,915
$1,153,243
$334,028
Total Assets
Total Liabilities and Fund Balances
- 64 -
Recreation
$250,956
0
0
0
$454,070
7,934
9,229
0
$92,899
0
0
0
$665,812
0
1,046
0
$188,164
0
1,361
0
$69,255
50
0
0
$3,722,098
54,836
579,167
1,046,678
$250,956
$471,233
$92,899
$666,858
$189,525
$69,305
$5,402,779
$0
0
0
0
$40,662
36,388
27,564
0
$0
0
0
0
$25,338
0
0
0
$0
214
0
0
$0
0
0
0
$74,072
36,602
570,295
1,525,237
0
104,614
0
25,338
214
0
2,206,206
0
250,956
0
366,619
92,899
0
641,520
0
189,311
0
0
69,305
2,183,737
1,012,836
250,956
366,619
92,899
641,520
189,311
69,305
3,196,573
$250,956
$471,233
$92,899
$666,858
$189,525
$69,305
$5,402,779
Tree
Planting
Law
Landfill
Enforcement
Improvement
Trust
Total
Nonmajor
Special Revenue
Funds
Police
Department
Programs
- 65 -
Donations
Trust
City of Solon, Ohio
Combining Statement of Revenues, Expenditures and Changes in Fund Balances
Nonmajor Special Revenue Funds
For the Year Ended December 31, 2011
Street
Construction,
Maintenance
and Repair
State
Highway
Police
Pension
Fire
Pension
Cable
TV
Revenues
Property Taxes
Intergovernmental
Fees, Licenses and Permits
Fines and Forfeitures
Rentals
Charges for Services
Contributions and Donations
Miscellaneous
$0
983,211
0
0
0
0
0
0
$0
79,720
0
0
0
0
0
0
$407,722
91,538
0
0
0
0
0
0
$611,584
136,689
0
0
0
0
0
0
$0
0
321,407
0
0
0
0
16,476
Total Revenues
983,211
79,720
499,260
748,273
337,883
Expenditures
Current:
Security of Persons and Property
Police
Fire
Leisure Time Activities
Community Environment
Basic Utility Services
Transportation
0
0
0
0
0
1,005,000
0
0
0
0
0
74,000
710,844
0
0
0
0
0
0
1,144,587
0
0
0
0
0
0
525,319
0
0
0
Total Expenditures
1,005,000
74,000
710,844
1,144,587
525,319
Excess of Revenues Over
(Under) Expenditures
(21,789)
5,720
(211,584)
(396,314)
Other Financing Sources
Transfers In
13,456
2,458
300,000
400,000
Net Change in Fund Balances
(8,333)
8,178
88,416
3,686
697,059
134,036
186,304
150,661
505,690
$688,726
$142,214
$274,720
$154,347
$325,956
Fund Balances (Deficit)
Beginning of Year
Fund Balances End of Year
- 66 -
(187,436)
7,702
(179,734)
Recreation
$0
0
0
0
0
1,150
0
0
$0
41,098
0
0
31,134
2,783,416
50,186
46,557
$0
0
0
0
0
0
20,599
0
$0
0
9,855
0
0
0
0
0
$0
770
0
67,331
0
0
0
0
$0
4,250
0
0
0
0
0
0
$0
0
0
0
0
0
27,803
0
$1,019,306
1,337,276
331,262
67,331
31,134
2,784,566
98,588
63,033
1,150
2,952,391
20,599
9,855
68,101
4,250
27,803
5,732,496
0
0
0
0
0
0
0
0
4,943,760
0
0
0
33,427
0
0
0
0
0
0
0
0
0
305,353
0
34,650
0
0
0
0
0
0
0
0
2,125
0
0
6,724
4,474
16,834
280
0
0
785,645
1,149,061
5,485,913
2,405
305,353
1,079,000
0
4,943,760
33,427
305,353
34,650
2,125
28,312
8,807,377
(1,991,369)
(12,828)
(295,498)
33,451
2,125
0
0
Tree
Planting
1,150
0
1,995,000
1,150
3,631
249,806
$250,956
0
Landfill
Improvement
Law
Enforcement
Trust
Total
Nonmajor
Special Revenue
Funds
Police
Department
Programs
14,219
NOPEC
Grant
Donations
Trust
(12,828)
(281,279)
33,451
2,125
362,988
105,727
922,799
155,860
(2,125)
$366,619
$92,899
$641,520
$189,311
- 67 -
$0
(509)
0
(509)
(3,074,881)
2,732,835
(342,046)
69,814
3,538,619
$69,305
$3,196,573
City of Solon, Ohio
Combining Balance Sheet
Nonmajor Capital Projects Funds
December 31, 2011
Safety and
Service
Equipment
Assets
Equity in Pooled Cash and
Cash Equivalents
Intergovernmental Receivable
Municipal Income Taxes Receivable
Property Taxes Receivable
Community
Center
Building
Construction
0
$2,092,835
0
19,183
0
$3,712,319
24,593
19,183
402,524
$2,027
$891,671
$2,335
$2,112,018
$4,158,619
$121,627
0
427,117
$0
0
0
$31,174
0
0
$0
0
0
$480,463
52,739
228
$633,264
52,739
427,345
Total Liabilities
548,744
0
31,174
0
533,430
1,113,348
Fund Balances
Restricted
601,824
2,027
860,497
2,335
1,578,588
3,045,271
$1,150,568
$2,027
$891,671
$2,335
$2,112,018
$4,158,619
Liabilities and Fund Balances
Liabilities
Contracts Payable
Retainage Payable
Deferred Revenue
Total Liabilities
and Fund Balances
$2,027
0
0
0
$891,671
0
$1,150,568
Total
General
Nonmajor
Capital
Capital Projects
Improvements
Funds
$2,335
0
0
0
Total Assets
$723,451
24,593
0
402,524
Old City
Hall
Renovations
- 68 -
City of Solon, Ohio
Combining Statement of Revenues, Expenditures and Changes in Fund Balances
Nonmajor Capital Projects Funds
For the Year Ended December 31, 2011
Safety and
Service
Equipment
Revenues
Property Taxes
Municipal Income Taxes
Intergovernmental
Charges for Services
Miscellaneous
Community
Center
Building
Construction
Old City
Hall
Renovations
General
Capital
Improvements
Total
Nonmajor
Capital Projects
Funds
$390,098
0
99,444
0
19,922
$0
0
0
0
0
$0
0
0
0
0
$0
0
0
0
0
$0
78,085
0
27,740
0
$390,098
78,085
99,444
27,740
19,922
Total Revenues
509,464
0
0
0
105,825
615,289
Expenditures
Capital Outlay
802,740
0
32,600
4,685
748,866
1,588,891
(293,276)
0
(32,600)
(4,685)
(643,041)
Other Financing Sources
Sale of Capital Assets
Transfers In
24,852
133,123
0
0
0
0
0
0
0
1,126,500
24,852
1,259,623
Total Other Financing Sources
157,975
0
0
0
1,126,500
1,284,475
Net Change in Fund Balances
(135,301)
0
(32,600)
(4,685)
483,459
310,873
Excess of Revenues
Under Expenditures
Fund Balances Beginning of Year
Fund Balances End of Year
(973,602)
737,125
2,027
893,097
7,020
1,095,129
2,734,398
$601,824
$2,027
$860,497
$2,335
$1,578,588
$3,045,271
- 69 -
Combining Statements – Fiduciary Funds
Fiduciary Funds
Fiduciary fund reporting focuses on net assets and changes in net assets. The fiduciary fund
category is split into four classifications: pension trust funds, investment trust funds, private
purpose trust funds and agency funds. Agency Funds are purely custodial (assets equal
liabilities) and thus do not involve the measurement of results of operations.
Agency Funds
Inspection Deposits Fund – to account for money held by the City to insure compliance with
various City ordinances regarding development within the City.
Traffic Violations Fund – to account for traffic violation money collected by the City to be
distributed to other municipalities.
DARE Scholarship Fund – to account for money held by the City to provide college
scholarships for students in the DARE program.
Northeast Ohio Regional Sewer District Case Fee Fund – to account for money collected
from other municipalities representing their portion of sewer district legal case fees.
JEDD Income Tax Fund – to account for income tax revenue collected by the City to be
distributed to Bainbridge Township and the City of Solon.
- 70 -
City of Solon, Ohio
Combining Statement of Changes in Assets and Liabilities
Agency Funds
For the Year Ended December 31, 2011
Beginning
Balance
12/31/10
Additions
Deductions
Ending
Balance
12/31/11
Inspection Deposits Fund
Assets
Equity in Pooled Cash
and Cash Equivalents
$1,162,188
$59,350
$163,945
$1,057,593
Liabilities
Deposits Held and Due to Others
$1,162,188
$59,350
$163,945
$1,057,593
Traffic Violations Fund
Assets
Cash and Cash Equivalents
in Segregated Accounts
$0
$105,095
$105,095
$0
Liabilities
Intergovernmental Payable
$0
$105,095
$105,095
$0
DARE Scholarship Fund
Assets
Equity in Pooled Cash
and Cash Equivalents
$374
$0
$0
$374
Liabilities
Deposits Held and Due to Others
$374
$0
$0
$374
Northeast Ohio Regional Sewer District Case Fee Fund
Assets
Equity in Pooled Cash
and Cash Equivalents
$33,000
$0
$33,000
$0
Liabilities
Deposits Held and Due to Others
$33,000
$0
$33,000
$0
JEDD Income Tax Fund
Assets
Cash and Cash Equivalents
in Segregated Accounts
$41,163
$155,411
$154,960
$41,614
Liabilities
Intergovernmental Payable
$41,163
$155,411
$154,960
$41,614
$1,195,562
$59,350
$196,945
$1,057,967
41,163
260,506
260,055
41,614
$1,236,725
$319,856
$457,000
$1,099,581
$41,163
1,195,562
$260,506
59,350
$260,055
196,945
$41,614
1,057,967
$1,236,725
$319,856
$457,000
$1,099,581
Total - All Agency Funds
Assets
Equity in Pooled Cash
and Cash Equivalents
Cash and Cash Equivalents
in Segregated Accounts
Total Assets
Liabilities
Intergovernmental Payable
Deposits Held and Due to Others
Total Liabilities
- 71 -
Individual Fund Schedules of Revenues, Expenditures/Expenses and Changes
in Fund Balances/Fund Equity - Budget (Non-GAAP Basis) and Actual
- 72 -
City of Solon, Ohio
Schedule of Revenues, Expenditures and Changes
In Fund Balance - Budget (Non-GAAP Basis) and Actual
General Fund
For the Year Ended December 31, 2011
Budgeted Amounts
Original
Final
Actual
Variance with
Final Budget
Positive
(Negative)
Revenues
Property Taxes
Municipal Income Taxes
Intergovernmental
Investment Income
Fees, Licenses and Permits
Fines and Forfeitures
Charges for Services
Miscellaneous
$1,123,653
25,153,508
1,186,870
594,996
390,032
286,141
629,315
232,644
$1,292,534
29,844,638
1,331,770
675,800
443,000
325,000
655,500
269,889
$1,349,907
29,746,521
1,425,869
670,480
383,276
324,183
808,270
418,146
$57,373
(98,117)
94,099
(5,320)
(59,724)
(817)
152,770
148,257
Total Revenues
29,597,159
34,838,131
35,126,652
288,521
5,886,955
289,438
343,787
37,895
6,917,981
341,393
356,549
91,266
6,605,930
230,875
356,530
91,266
312,051
110,518
19
0
Total Police
6,558,075
7,707,189
7,284,601
422,588
Fire
Personal Services
Materials and Supplies
Contractual Services
Capital Outlay
5,168,669
269,171
239,333
215,533
6,046,685
303,575
272,925
217,750
5,838,734
234,147
255,653
10,555
207,951
69,428
17,272
207,195
Total Fire
5,892,706
6,840,935
6,339,089
501,846
86,241
127,534
101,733
150,084
101,733
144,989
0
5,095
213,775
251,817
246,722
5,095
Teen Court
Personal Services
Materials and Supplies
10,621
698
12,267
781
9,863
454
2,404
327
Total Teen Court
11,319
13,048
10,317
2,731
225,094
264,865
257,039
7,826
$12,675,875
$14,812,989
$13,880,729
$932,260
Expenditures
Current:
Security of Persons and Property
Police
Personal Services
Materials and Supplies
Contractual Services
Capital Outlay
Prosecutor
Prosecutor
Personal Services
Materials and Supplies
Total Prosecutor
Total Prosecutor
Total Security of Persons and Property
(continued)
- 73 -
City of Solon, Ohio
Schedule of Revenues, Expenditures and Changes
In Fund Balance - Budget (Non-GAAP Basis) and Actual
General Fund (continued)
For the Year Ended December 31, 2011
Budgeted Amounts
Original
Final
Actual
Variance with
Final Budget
Positive
(Negative)
Public Health and Welfare
Cemetery
Other
$4,248
$5,000
$4,904
$96
County Health District
Contractual Services
68,823
81,000
80,667
333
Total Public Health and Welfare
73,071
86,000
85,571
429
Leisure Time Activities
Recreation
Personal Services
38,638
38,638
38,638
0
466,643
9,795
28,379
510
549,451
8,927
28,990
56
547,167
8,927
28,990
0
2,284
0
0
56
505,327
587,424
585,084
2,340
Development Board
Materials and Supplies
Contractual Services
4,041
31,894
1,008
27,718
1,008
27,718
0
0
Total Development Board
35,935
28,726
28,726
0
Building Department
Personal Services
Materials and Supplies
Contractual Services
Capital Outlay
Other
334,823
14,291
20,185
1,933
11,895
391,751
12,488
18,605
6,975
1,365
317,554
12,488
18,605
6,975
0
74,197
0
0
0
1,365
Total Building Department
383,127
431,184
355,622
75,562
Engineering Department
Personal Services
Materials and Supplies
Contractual Services
Capital Outlay
732,486
35,558
103,147
6,372
864,450
48,275
163,160
1,310
707,351
48,275
163,160
1,310
157,099
0
0
0
$877,563
$1,077,195
$920,096
$157,099
Community Environment
Planning and Zoning
Personal Services
Materials and Supplies
Contractual Services
Capital Outlay
Total Planning and Zoning
Total Engineering Department
(continued)
- 74 -
City of Solon, Ohio
Schedule of Revenues, Expenditures and Changes
In Fund Balance - Budget (Non-GAAP Basis) and Actual
General Fund (continued)
For the Year Ended December 31, 2011
Budgeted Amounts
Original
Beautification Commission
Materials and Supplies
Contractual Services
Final
Actual
Variance with
Final Budget
Positive
(Negative)
$25,512
1,487
$26,700
1,503
$26,700
1,503
$0
0
26,999
28,203
28,203
0
1,828,951
2,152,732
1,917,731
235,001
421,082
49,408
12,745
493,333
62,547
10,580
488,784
62,547
9,674
4,549
0
906
483,235
566,460
561,005
5,455
Trees, Leaf and Brush
Materials and Supplies
Contractual Services
12,745
17,294
12,665
19,850
12,580
18,429
85
1,421
Total Trees, Leaf and Brush
30,039
32,515
31,009
1,506
Refuse Collection and Disposal
Personal Services
Materials and Supplies
Contractual Services
626,628
175,384
33,689
785,316
219,577
27,974
785,316
219,577
27,974
0
0
0
Total Refuse Collection and Disposal
835,701
1,032,867
1,032,867
0
1,348,975
1,631,842
1,624,881
6,961
674,533
793,740
735,086
58,654
Street Department
Personal Services
Materials and Supplies
Contractual Services
Capital Outlay
2,805,084
1,153,864
175,644
45,189
3,251,541
1,342,361
206,497
52,931
3,019,867
1,263,638
199,768
52,914
231,674
78,723
6,729
17
Total Street Department
4,179,781
4,853,330
4,536,187
317,143
$4,854,314
$5,647,070
$5,271,273
$375,797
Total Beautification Commission
Total Community Environment
Basic Utility Services
Storm Sewers
Personal Services
Materials and Supplies
Contractual Services
Total Storm Sewers
Total Basic Utility Services
Transportation
Street Lighting
Contractual Services
Total Transportation
(continued)
- 75 -
City of Solon, Ohio
Schedule of Revenues, Expenditures and Changes
In Fund Balance - Budget (Non-GAAP Basis) and Actual
General Fund (continued)
For the Year Ended December 31, 2011
Budgeted Amounts
Original
Variance with
Final Budget
Positive
(Negative)
Final
Actual
$250,179
21,107
8,335
$294,510
24,640
9,810
$278,033
21,169
8,553
$16,477
3,471
1,257
Total Council
279,621
328,960
307,755
21,205
Mayor
Personal Services
Materials and Supplies
Contractual Services
Capital Outlay
246,676
4,674
287
835
290,467
4,991
752
925
271,405
3,142
752
0
19,062
1,849
0
925
Total Mayor
252,472
297,135
275,299
21,836
Finance
Personal Services
Materials and Supplies
Contractual Services
Capital Outlay
614,856
23,809
85,635
1,699
724,047
27,808
100,571
2,000
683,558
24,424
90,362
1,046
40,489
3,384
10,209
954
Total Finance
725,999
854,426
799,390
55,036
Legal Department
Personal Services
Contractual Services
Other
73,139
169,933
18,896
86,080
200,000
21,903
85,433
185,001
1,903
647
14,999
20,000
Total Legal Department
261,968
307,983
272,337
35,646
Human Resources
Personal Services
Materials and Supplies
Contractual Services
Capital Outlay
388,487
4,128
125,599
6,993
457,498
4,783
146,590
7,970
448,566
4,064
136,558
5,748
8,932
719
10,032
2,222
Total Human Resources
525,207
616,841
594,936
21,905
Civil Service
Personal Services
Materials and Supplies
Contractual Services
3,441
495
27,189
4,223
555
31,640
4,223
356
29,289
0
199
2,351
Total Civil Service
31,125
36,418
33,868
2,550
165,282
850
1,274
194,499
1,360
1,500
189,193
1,360
1,157
5,306
0
343
$167,406
$197,359
$191,710
$5,649
General Government
Council
Personal Services
Materials and Supplies
Contractual Services
City Hall
Personal Services
Materials and Supplies
Contractual Services
Total City Hall
(continued)
- 76 -
City of Solon, Ohio
Schedule of Revenues, Expenditures and Changes
In Fund Balance - Budget (Non-GAAP Basis) and Actual
General Fund (continued)
For the Year Ended December 31, 2011
Variance with
Final Budget
Positive
(Negative)
Budgeted Amounts
Original
Final
Actual
$315,508
42,517
45,314
8,072
101,960
$371,534
49,042
53,244
9,500
120,000
$362,958
43,302
46,983
2,324
119,979
$8,576
5,740
6,261
7,176
21
513,371
603,320
575,546
27,774
20,000
20,000
50
19,950
City Administration
Personal Services
Materials and Supplies
Contractual Services
Capital Outlay
Other
105,163
155,698
1,044,654
9,346
55,653
119,742
182,187
1,226,272
11,000
65,500
95,883
179,763
1,028,598
2,970
46,812
23,859
2,424
197,674
8,030
18,688
Total City Administration
1,370,514
1,604,701
1,354,026
250,675
754,000
754,000
647,045
106,955
4,901,683
5,621,143
5,051,962
569,181
25,721,507
29,990,414
27,870,785
2,119,629
3,875,652
4,847,717
7,255,867
2,408,150
Other Financing Sources (Uses)
Sale of Capital Assets
Advances Out
Transfers In
Transfers Out
41,610
(500,000)
0
(5,208,250)
41,610
(500,000)
250
(5,431,250)
41,610
(500,000)
250
(5,420,217)
0
0
0
11,033
Total Other Financing Sources (Uses)
(5,666,640)
(5,889,390)
(5,878,357)
11,033
Net Change in Fund Balance
(1,790,988)
(1,041,673)
1,377,510
2,419,183
Fund Balance Beginning of Year
17,867,602
17,867,602
17,867,602
0
193,022
193,022
193,022
0
$16,269,636
$17,018,951
$19,438,134
$2,419,183
Income Tax Department
Personal Services
Materials and Supplies
Contractual Services
Capital Outlay
Other
Total Income Tax Department
Unclaimed Monies
Other
Sick Leave Reserve
Personal Services
Total General Government
Total Expenditures
Excess of Revenues Over Expenditures
Prior Year Encumbrances Appropriated
Fund Balance End of Year
- 77 -
City of Solon, Ohio
Schedule of Revenues, Expenditures and Changes
in Fund Balance - Budget (Non-GAAP Basis) and Actual
General Obligation Bond Retirement Fund
For the Year Ended December 31, 2011
Budgeted Amounts
Original
Revenues
Property Taxes
Special Assessments
Intergovernmental
Fees, Licenses and Permits
Final
Actual
Variance with
Final Budget
Positive
(Negative)
$1,186,000
800,000
356,297
0
$1,186,000
800,000
356,297
0
$1,426,210
722,102
356,297
3,489
$240,210
(77,898)
0
3,489
2,342,297
2,342,297
2,508,098
165,801
10,000
10,000
9,666
334
Debt Service:
Principal Retirement
Interest and Fiscal Charges
2,009,505
546,106
2,009,505
546,106
2,009,505
546,106
0
0
Total Debt Service
2,555,611
2,555,611
2,555,611
0
Total Expenditures
2,565,611
2,565,611
2,565,277
334
Total Revenues
Expenditures
Current:
General Government
Legislative and Executive
Contractual Services
Excess of Revenues Under Expenditures
(223,314)
Other Financing Sources
Transfers In
Net Change in Fund Balance
Fund Balance Beginning of Year
Fund Balance End of Year
0
(223,314)
(223,314)
0
(223,314)
(57,179)
166,135
371,317
371,317
314,138
537,452
1,800,852
1,800,852
1,800,852
0
$1,577,538
$1,577,538
$2,114,990
$537,452
- 78 -
City of Solon, Ohio
Schedule of Revenues, Expenditures and Changes
In Fund Balance - Budget (Non-GAAP Basis) and Actual
Infrastructure Fund
For the Year Ended December 31, 2011
Budgeted Amounts
Original
Revenues
Municipal Income Taxes
Intergovernmental
Miscellaneous
Final
Actual
Variance with
Final Budget
Positive
(Negative)
$9,749,926
42,563
58,796
$9,749,926
42,563
19,637
$9,749,926
42,563
12,518
$0
0
(7,119)
9,851,285
9,812,126
9,805,007
(7,119)
256,450
10,682,902
348,272
10,591,080
348,272
10,410,564
0
180,516
60,648
60,648
60,648
0
Total Expenditures
11,000,000
11,000,000
10,819,484
180,516
Excess of Revenues Under Expenditures
(1,148,715)
(1,187,874)
(1,014,477)
173,397
Total Revenues
Expenditures
Current:
Transportation
Engineering Department
Personal Services
Capital Outlay
Debt Service:
Principal Retirement
Other Financing Sources
Advances In
500,000
500,000
500,000
(648,715)
(687,874)
(514,477)
Fund Balance Beginning of Year
687,879
687,879
687,879
0
Fund Balance End of Year
$39,164
$5
$173,402
$173,397
Net Change in Fund Balance
- 79 -
0
173,397
City of Solon, Ohio
Schedule of Revenues, Expenses and Changes
In Fund Equity - Budget (Non-GAAP Basis) and Actual
Water Reclamation Fund
For the Year Ended December 31, 2011
Budgeted Amounts
Original
Revenues
Charges for Services
Tap-In Fees
Miscellaneous
Intergovernmental
OWDA Loans Issued
Total Revenues
Expenses
Personal Services
Materials and Supplies
Contractual Services
Other
Capital Outlay
Debt Service:
Principal Retirement
Interest and Fiscal Charges
Total Expenses
Final
Actual
$5,426,000
75,000
54,710
222,000
3,761,028
$5,851,000
75,000
54,710
158,500
3,761,028
$6,189,448
77,776
55,543
158,528
3,761,028
$338,448
2,776
833
28
0
9,538,738
9,900,238
10,242,323
342,085
2,100,000
503,000
1,334,517
220,770
4,437,644
2,100,000
503,000
1,609,517
220,770
4,437,644
1,814,513
335,844
963,881
197,198
4,254,483
285,487
167,156
645,636
23,572
183,161
1,551,090
325,115
1,551,090
325,115
1,551,090
325,115
0
0
10,472,136
10,747,136
9,442,124
1,305,012
1,647,097
Excess of Revenues Over (Under)
Expenses Before Transfers
(933,398)
(846,898)
800,199
Transfers In
Transfers Out
62,000
(404,581)
62,000
(404,581)
66,410
(371,317)
(1,275,979)
(1,189,479)
4,507,074
Net Change in Fund Equity
Fund Equity Beginning of Year
Prior Year Encumbrances Appropriated
Fund Equity End of Year
Variance with
Final Budget
Positive
(Negative)
4,410
33,264
495,292
1,684,771
4,507,074
4,507,074
0
58,163
58,163
58,163
0
$3,289,258
$3,375,758
$5,060,529
$1,684,771
- 80 -
City of Solon, Ohio
Schedule of Revenues, Expenses and Changes
In Fund Equity - Budget (Non-GAAP Basis) and Actual
Grantwood Recreation Fund
For the Year Ended December 31, 2011
Budgeted Amounts
Original
Revenues
Charges for Services
Rentals
Miscellaneous
Total Revenues
Expenses
Personal Services
Materials and Supplies
Contractual Services
Other
Capital Outlay
Total Expenses
Excess of Revenues Over (Under)
Expenses Before Transfers
Transfers In
Net Change in Fund Equity
Fund Equity Beginning of Year
Prior Year Encumbrances Appropriated
Fund Equity End of Year
Variance with
Final Budget
Positive
(Negative)
Final
Actual
$1,238,300
118,300
16,600
$920,100
118,300
16,600
$835,282
116,915
16,528
($84,818)
(1,385)
(72)
1,373,200
1,055,000
968,725
(86,275)
707,795
266,072
194,465
197,171
6,960
635,485
239,012
175,745
177,971
6,250
580,074
204,279
152,494
146,606
5,850
55,411
34,733
23,251
31,365
400
1,372,463
1,234,463
1,089,303
145,160
737
0
737
(179,463)
4,600
(120,578)
4,972
58,885
372
(174,863)
(115,606)
325,306
325,306
325,306
0
21,578
21,578
21,578
0
$347,621
$172,021
$231,278
$59,257
- 81 -
59,257
City of Solon, Ohio
Schedule of Revenues, Expenditures and Changes
In Fund Balance - Budget (Non-GAAP Basis) and Actual
Street Construction, Maintenance and Repair Fund
For the Year Ended December 31, 2011
Budgeted Amounts
Original
Revenues
Intergovernmental
Final
Actual
Variance with
Final Budget
Positive
(Negative)
$1,007,000
$1,007,000
$984,768
750,000
255,000
750,000
255,000
750,000
255,000
0
0
1,005,000
1,005,000
1,005,000
0
Excess of Revenues Over
(Under) Expenditures
2,000
2,000
(20,232)
(22,232)
Other Financing Sources
Transfers In
12,000
12,000
13,456
1,456
Net Change in Fund Balance
14,000
14,000
(6,776)
(20,776)
614,996
614,996
614,996
$628,996
$628,996
$608,220
Expenditures
Current:
Transportation
Street Maintenance and Repair
Personal Services
Materials and Supplies
Total Expenditures
Fund Balance Beginning of Year
Fund Balance End of Year
- 82 -
($22,232)
0
($20,776)
City of Solon, Ohio
Schedule of Revenues, Expenditures and Changes
In Fund Balance - Budget (Non-GAAP Basis) and Actual
State Highway Fund
For the Year Ended December 31, 2011
Budgeted Amounts
Original
Revenues
Intergovernmental
Final
Actual
$81,648
$81,648
$79,306
Expenditures
Current:
Transportation
State Highway
Materials and Supplies
70,000
74,000
74,000
Excess of Revenues Over Expenditures
11,648
7,648
5,306
2,000
2,000
2,458
13,648
9,648
7,764
127,922
127,922
127,922
$141,570
$137,570
$135,686
Other Financing Sources
Transfers In
Net Change in Fund Balance
Fund Balance Beginning of Year
Fund Balance End of Year
- 83 -
Variance with
Final Budget
Positive
(Negative)
($2,342)
0
(2,342)
458
(1,884)
0
($1,884)
City of Solon, Ohio
Schedule of Revenues, Expenditures and Changes
In Fund Balance - Budget (Non-GAAP Basis) and Actual
Police Pension Fund
For the Year Ended December 31, 2011
Budgeted Amounts
Original
Variance with
Final Budget
Positive
(Negative)
Final
Actual
$349,118
91,538
$349,118
91,538
$407,722
91,538
$58,604
0
Total Revenues
440,656
440,656
499,260
58,604
Expenditures
Current:
Security of Persons and Property
Police
Personal Services
760,000
760,000
707,496
52,504
(319,344)
(319,344)
(208,236)
111,108
Other Financing Sources
Transfers In
300,000
300,000
300,000
0
Net Change in Fund Balance
(19,344)
(19,344)
91,764
111,108
Fund Balance Beginning of Year
393,607
393,607
393,607
0
$374,263
$374,263
$485,371
$111,108
Revenues
Property Taxes
Intergovernmental
Excess of Revenues Under Expenditures
Fund Balance End of Year
- 84 -
City of Solon, Ohio
Schedule of Revenues, Expenditures and Changes
In Fund Balance - Budget (Non-GAAP Basis) and Actual
Fire Pension Fund
For the Year Ended December 31, 2011
Budgeted Amounts
Original
Revenues
Property Taxes
Intergovernmental
Total Revenues
Expenditures
Current:
Security of Persons and Property
Fire
Personal Services
Excess of Revenues Under Expenditures
Other Financing Sources
Transfers In
Net Change in Fund Balance
Fund Balance Beginning of Year
Fund Balance End of Year
Variance with
Final Budget
Positive
(Negative)
Final
Actual
$524,295
136,689
$524,295
136,689
$611,584
136,689
$87,289
0
660,984
660,984
748,273
87,289
1,164,000
1,164,000
1,160,276
3,724
(503,016)
(503,016)
(412,003)
400,000
400,000
400,000
(103,016)
(103,016)
(12,003)
498,430
498,430
498,430
0
$395,414
$395,414
$486,427
$91,013
- 85 -
91,013
0
91,013
City of Solon, Ohio
Schedule of Revenues, Expenditures and Changes
In Fund Balance - Budget (Non-GAAP Basis) and Actual
Cable TV Fund
For the Year Ended December 31, 2011
Budgeted Amounts
Original
Variance with
Final Budget
Positive
(Negative)
Final
Actual
$276,000
14,500
$315,000
14,500
$316,632
14,538
$1,632
38
Total Revenues
290,500
329,500
331,170
1,670
Expenditures
Current:
Leisure Time Activities
Cable TV
Personal Services
Materials and Supplies
Contractual Services
Capital Outlay
Other
3,217
6,985
219,472
195,000
123,600
3,217
6,985
219,472
195,000
145,000
1,524
3,680
215,792
185,771
142,484
1,693
3,305
3,680
9,229
2,516
Total Expenditures
548,274
569,674
549,251
20,423
(257,774)
(240,174)
(218,081)
22,093
Revenues
Fees, Licenses and Permits
Miscellaneous
Excess of Revenues Under Expenditures
Other Financing Sources
Transfers In
Net Change in Fund Balance
Fund Balance Beginning of Year
Prior Year Encumbrances Appropriated
Fund Balance End of Year
7,500
7,500
7,702
202
(250,274)
(232,674)
(210,379)
469,135
469,135
469,135
0
2,557
2,557
2,557
0
$221,418
$239,018
$261,313
$22,295
- 86 -
22,295
City of Solon, Ohio
Schedule of Revenues, Expenditures and Changes
In Fund Balance - Budget (Non-GAAP Basis) and Actual
Tree Planting Fund
For the Year Ended December 31, 2011
Variance with
Final Budget
Positive
(Negative)
Budgeted Amounts
Original
Revenues
Charges for Services
Final
Actual
$0
$0
$1,150
$1,150
200,000
200,000
0
200,000
(200,000)
(200,000)
1,150
201,150
Fund Balance Beginning of Year
249,806
249,806
249,806
0
Fund Balance End of Year
$49,806
$49,806
$250,956
$201,150
Expenditures
Current:
General Government
Tree Planting
Contractual Services
Net Change in Fund Balance
- 87 -
City of Solon, Ohio
Schedule of Revenues, Expenditures and Changes
In Fund Balance - Budget (Non-GAAP Basis) and Actual
Recreation Fund
For the Year Ended December 31, 2011
Budgeted Amounts
Original
Final
Actual
Variance with
Final Budget
Positive
(Negative)
Revenues
Intergovernmental
Rentals
Charges for Services
Contributions and Donations
Miscellaneous
$41,073
26,000
2,877,779
62,000
47,430
$41,073
26,000
2,908,520
62,000
47,430
$31,869
31,134
2,781,864
50,186
47,158
($9,204)
5,134
(126,656)
(11,814)
(272)
Total Revenues
3,054,282
3,085,023
2,942,211
(142,812)
Expenditures
Current:
Leisure Time Activities
Administration
Personal Services
Materials and Supplies
Contractual Services
Capital Outlay
555,070
60,796
47,000
9,500
555,070
64,557
40,486
17,617
548,442
64,557
40,486
17,617
6,628
0
0
0
Total Administration
672,366
677,730
671,102
6,628
Recreation Programs
Personal Services
Materials and Supplies
Contractual Services
Capital Outlay
Other
224,500
35,000
118,250
10,000
25,000
246,336
70,000
109,218
6,087
20,756
246,336
70,000
109,218
6,087
20,756
0
0
0
0
0
Total Recreation Programs
412,750
452,397
452,397
0
68,895
40,500
67,000
68,895
39,717
61,739
56,572
39,717
61,739
12,323
0
0
Total Swimming Pools
176,395
170,351
158,028
12,323
Community Parks
Personal Services
Materials and Supplies
Contractual Services
237,475
66,422
44,275
237,475
82,943
36,517
231,531
82,943
36,517
5,944
0
0
Total Community Parks
348,172
356,935
350,991
5,944
Concession Stand
Personal Services
Materials and Supplies
18,300
5,000
18,300
15,785
14,738
15,785
3,562
0
Total Concession Stand
$23,300
$34,085
$30,523
$3,562
Swimming Pools
Personal Services
Materials and Supplies
Contractual Services
(continued)
- 88 -
City of Solon, Ohio
Schedule of Revenues, Expenditures and Changes
In Fund Balance - Budget (Non-GAAP Basis) and Actual
Recreation Fund (continued)
For the Year Ended December 31, 2011
Budgeted Amounts
Original
Final
Actual
Final Budget
Positive
(Negative)
Youth Recreation Programs
Personal Services
Materials and Supplies
Contractual Services
Capital Outlay
Other
$948,813
144,795
368,384
609
12,024
$926,977
133,735
324,191
609
11,865
$896,148
133,735
324,191
609
11,865
$30,829
0
0
0
0
Total Youth Recreation Programs
1,474,625
1,397,377
1,366,548
30,829
Adult Recreation Programs
Materials and Supplies
Contractual Services
5,750
1,750
5,162
1,995
5,162
1,995
0
0
Total Adult Recreation Programs
7,500
7,157
7,157
0
Holiday Programs
Materials and Supplies
Contractual Services
4,500
21,500
25,322
5,394
25,322
5,394
0
0
Total Holiday Programs
26,000
30,716
30,716
0
Community Center
Personal Services
Materials and Supplies
Contractual Services
Capital Outlay
Other
1,199,240
155,163
580,461
25,000
7,500
1,199,240
142,292
608,889
19,899
11,404
1,128,819
142,292
608,889
19,899
11,404
70,421
0
0
0
0
Total Community Center
1,967,364
1,981,724
1,911,303
70,421
5,108,472
5,108,472
4,978,765
129,707
(2,054,190)
(2,023,449)
(2,036,554)
(13,105)
1,988,282
1,988,282
1,995,000
6,718
Total Expenditures
Excess of Revenues Under Expenditures
Other Financing Sources
Transfers In
Net Change in Fund Balance
(65,908)
(35,167)
(41,554)
Fund Balance Beginning of Year
411,750
411,750
411,750
0
24,129
24,129
24,129
0
$369,971
$400,712
$394,325
Prior Year Encumbrances Appropriated
Fund Balance End of Year
- 89 -
(6,387)
($6,387)
City of Solon, Ohio
Schedule of Revenues, Expenditures and Changes
In Fund Balance - Budget (Non-GAAP Basis) and Actual
Police Department Programs Fund
For the Year Ended December 31, 2011
Variance with
Final Budget
Positive
(Negative)
Budgeted Amounts
Original
Revenues
Contributions and Donations
Final
Actual
$30,000
$30,000
$20,599
($9,401)
Expenditures
Current:
Security of Persons and Property
Police
DARE program
Personal Services
Materials and Supplies
25,000
5,000
50,000
5,000
31,340
1,994
18,660
3,006
Total DARE Program
30,000
55,000
33,334
21,666
93
93
93
0
30,093
55,093
33,427
21,666
(25,093)
(12,828)
12,265
105,727
105,727
105,727
0
$105,634
$80,634
$92,899
$12,265
Violent Crime Prevention
Personal Services
Total Expenditures
Net Change in Fund Balance
Fund Balance Beginning of Year
Fund Balance End of Year
(93)
- 90 -
City of Solon, Ohio
Schedule of Revenues, Expenditures and Changes
In Fund Balance - Budget (Non-GAAP Basis) and Actual
Landfill Improvement Fund
For the Year Ended December 31, 2011
Budgeted Amounts
Original
Revenues
Fees, Licenses and Permits
Expenditures
Current:
Basic Utility Services
Landfill Improvement
Capital Outlay
Excess of Revenues Under Expenditures
Other Financing Sources
Transfers In
Net Change in Fund Balance
Fund Balance Beginning of Year
Prior Year Encumbrances Appropriated
Fund Balance End of Year
Final
Actual
Variance with
Final Budget
Positive
(Negative)
$0
$0
$9,719
$9,719
412,714
412,714
292,223
120,491
(412,714)
(412,714)
(282,504)
130,210
24,000
24,000
14,219
(388,714)
(388,714)
(268,285)
921,383
921,383
921,383
0
12,714
12,714
12,714
0
$545,383
$545,383
$665,812
$120,429
- 91 -
(9,781)
120,429
City of Solon, Ohio
Schedule of Revenues, Expenditures and Changes
In Fund Balance - Budget (Non-GAAP Basis) and Actual
Law Enforcement Trust Fund
For the Year Ended December 31, 2011
Variance with
Final Budget
Positive
(Negative)
Budgeted Amounts
Original
Final
Actual
Revenues
Intergovernmental
Fines and Forfeitures
$2,464
27,593
$5,000
56,000
$770
67,878
($4,230)
11,878
Total Revenues
30,057
61,000
68,648
7,648
7,000
7,000
5,944
1,056
Drug Money
Materials and Supplies
30,000
30,000
511
29,489
Immobilization
Materials and Supplies
35,000
35,000
28,000
7,000
Miscellaneous
Materials and Supplies
20,000
20,000
0
20,000
92,000
92,000
34,455
57,545
Net Change in Fund Balance
(61,943)
(31,000)
34,193
65,193
Fund Balance Beginning of Year
153,971
153,971
153,971
0
Fund Balance End of Year
$92,028
$122,971
$188,164
$65,193
Expenditures
Current:
Security of Persons and Property
Police
OMVI
Personal Services
Total Expenditures
- 92 -
City of Solon, Ohio
Schedule of Revenues, Expenditures and Changes
In Fund Balance - Budget (Non-GAAP Basis) and Actual
NOPEC Grant Fund
For the Year Ended December 31, 2011
Variance with
Final Budget
Positive
(Negative)
Budgeted Amounts
Original
Revenues
Intergovernmental
Expenditures
Current:
Community Environment
Energy Conservation
Contractual Services
Net Change in Fund Balance
Fund Balance Beginning of Year
Fund Balance End of Year
Final
Actual
$4,250
$4,250
$4,250
$0
5,100
5,100
5,100
0
(850)
(850)
(850)
0
850
850
850
0
$0
$0
$0
$0
- 93 -
City of Solon, Ohio
Schedule of Revenues, Expenditures and Changes
In Fund Balance - Budget (Non-GAAP Basis) and Actual
Donations Trust Fund
For the Year Ended December 31, 2011
Variance with
Final Budget
Positive
(Negative)
Budgeted Amounts
Original
Revenues
Contributions and Donations
Final
Actual
$17,015
$31,100
$32,753
$1,653
10,000
10,000
6,724
3,276
4,500
4,500
4,474
26
Total Security of Persons and Property
14,500
14,500
11,198
3,302
Leisure Time Activities
Senior Services Donations
Other
37,031
37,031
20,833
16,198
3,200
3,200
0
3,200
40,231
40,231
20,833
19,398
100
100
0
100
Beautification Donations
Other
646
646
280
366
Engineering Department
Personal Services
3,300
3,300
0
3,300
Total Community Environment
4,046
4,046
280
3,766
General Government
Special Donations
Other
8,600
8,600
0
8,600
Cemetery Endowment
Contractual Services
5,000
5,000
0
5,000
Total General Government
13,600
13,600
0
13,600
72,377
72,377
32,311
40,066
(55,362)
(41,277)
442
41,719
65,422
65,422
65,422
0
2,031
2,031
2,031
0
$12,091
$26,176
$67,895
$41,719
Expenditures
Current:
Security of Persons and Property
Police
Materials and Supplies
Fire
Materials and Supplies
Community Park Donations
Other
Total Leisure Time Activities
Community Environment
Blue Herron Donations
Other
Total Expenditures
Net Change in Fund Balance
Fund Balance Beginning of Year
Prior Year Encumbrances Appropriated
Fund Balance End of Year
- 94 -
City of Solon, Ohio
Schedule of Revenues, Expenditures and Changes
In Fund Balance - Budget (Non-GAAP Basis) and Actual
Street Lighting Fund
For the Year Ended December 31, 2011
Variance with
Final Budget
Positive
(Negative)
Budgeted Amounts
Original
Revenues
Final
Actual
$0
$0
$0
$0
Expenditures
0
0
0
0
Net Change in Fund Balance
0
0
0
0
377
377
377
0
$377
$377
$377
$0
Fund Balance Beginning of Year
Fund Balance End of Year
- 95 -
City of Solon, Ohio
Schedule of Revenues, Expenditures and Changes
In Fund Balance - Budget (Non-GAAP Basis) and Actual
Senior Services Fund
For the Year Ended December 31, 2011
Budgeted Amounts
Original
Variance with
Final Budget
Positive
(Negative)
Final
Actual
$111,900
2,300
$111,900
2,300
$110,293
2,239
($1,607)
(61)
Total Revenues
114,200
114,200
112,532
(1,668)
Expenditures
Current:
Leisure Time Activities
Administration
Personal Services
Materials and Supplies
Contractual Services
Capital Outlay
414,895
21,971
2,500
2,500
414,895
23,681
2,855
0
393,129
23,681
2,855
0
21,766
0
0
0
Total Administration
441,866
441,431
419,665
21,766
Senior Programs
Materials and Supplies
Contractual Services
Other
64,242
32,795
200
66,084
31,588
0
66,084
31,588
0
0
0
0
Total Senior Programs
97,237
97,672
97,672
0
539,103
539,103
517,337
21,766
(424,903)
(424,903)
(404,805)
20,098
417,000
417,000
417,000
0
Revenues
Charges for Services
Miscellaneous
Total Expenditures
Excess of Revenues Under Expenditures
Other Financing Sources
Transfers In
Net Change in Fund Balance
(7,903)
(7,903)
12,195
20,098
Fund Balance Beginning of Year
93,967
93,967
93,967
0
4,414
4,414
4,414
0
$90,478
$90,478
$110,576
$20,098
Prior Year Encumbrances Appropriated
Fund Balance End of Year
- 96 -
City of Solon, Ohio
Schedule of Revenues, Expenditures and Changes
In Fund Balance - Budget (Non-GAAP Basis) and Actual
Economic Incentive Fund
For the Year Ended December 31, 2011
Budgeted Amounts
Original
Revenues
Intergovernmental
Final
Actual
Variance with
Final Budget
Positive
(Negative)
$0
$0
$9,631
$9,631
900,500
1,123,000
1,122,433
567
(900,500)
(1,123,000)
(1,112,802)
Other Financing Sources
Transfers In
850,000
1,072,500
1,072,500
Net Change in Fund Balance
(50,500)
(50,500)
(40,302)
88,374
88,374
88,374
0
$37,874
$37,874
$48,072
$10,198
Expenditures
Current:
Community Environment
Enterprise Zone Monitoring
Other
Excess of Revenues Under Expenditures
Fund Balance Beginning of Year
Fund Balance End of Year
- 97 -
10,198
0
10,198
City of Solon, Ohio
Schedule of Revenues, Expenditures and Changes
In Fund Balance - Budget (Non-GAAP Basis) and Actual
Police Training Fund
For the Year Ended December 31, 2011
Variance with
Final Budget
Positive
(Negative)
Budgeted Amounts
Original
Revenues
Charges for Services
Expenditures
Current:
Security of Persons and Property
Police
Police Training
Materials and Supplies
Net Change in Fund Balance
Fund Balance Beginning of Year
Fund Balance End of Year
Final
Actual
$13,500
$13,500
$920
($12,580)
13,500
13,500
930
12,570
0
0
19,878
19,878
19,878
$19,878
$19,878
$19,868
- 98 -
(10)
(10)
0
($10)
City of Solon, Ohio
Schedule of Revenues, Expenditures and Changes
In Fund Balance - Budget (Non-GAAP Basis) and Actual
Police Bike Rodeo Fund
For the Year Ended December 31, 2011
Variance with
Final Budget
Positive
(Negative)
Budgeted Amounts
Original
Revenues
Final
Actual
$0
$0
$0
$0
Expenditures
0
0
0
0
Excess of Revenues Over Expenditures
0
0
0
0
Other Financing Uses
Transfers Out
(250)
(250)
(250)
0
Net Change in Fund Balance
(250)
(250)
(250)
0
250
250
250
0
$0
$0
$0
$0
Fund Balance Beginning of Year
Fund Balance End of Year
- 99 -
City of Solon, Ohio
Schedule of Revenues, Expenditures and Changes
In Fund Balance - Budget (Non-GAAP Basis) and Actual
Police Transfer of Prisoners Fund
For the Year Ended December 31, 2011
Variance with
Final Budget
Positive
(Negative)
Budgeted Amounts
Original
Revenues
Final
Actual
$0
$0
$0
$0
Expenditures
0
0
0
0
Excess of Revenues Over Expenditures
0
0
0
0
Other Financing Uses
Transfers Out
(133,123)
(133,123)
(133,123)
0
Net Change in Fund Balance
(133,123)
(133,123)
(133,123)
0
133,123
133,123
133,123
0
$0
$0
$0
$0
Fund Balance Beginning of Year
Fund Balance End of Year
- 100 -
City of Solon, Ohio
Schedule of Revenues, Expenditures and Changes
In Fund Balance - Budget (Non-GAAP Basis) and Actual
Community Improvement Corporation Fund
For the Year Ended December 31, 2011
Variance with
Final Budget
Positive
(Negative)
Budgeted Amounts
Original
Revenues
Expenditures
Current:
Community Environment
Development Board
Contractual Services
Net Change in Fund Balance
Fund Balance Beginning of Year
Fund Balance End of Year
Final
Actual
$0
$0
$0
$0
4,000
4,000
0
4,000
(4,000)
(4,000)
0
4,000
4,000
4,000
4,000
0
$0
$0
$4,000
$4,000
- 101 -
City of Solon, Ohio
Schedule of Revenues, Expenditures and Changes
In Fund Balance - Budget (Non-GAAP Basis) and Actual
Safety and Service Equipment Fund
For the Year Ended December 31, 2011
Budgeted Amounts
Original
Variance with
Final Budget
Positive
(Negative)
Final
Actual
$319,298
99,444
0
$319,298
99,444
0
$390,098
99,444
19,922
$70,800
0
19,922
Total Revenues
418,742
418,742
509,464
90,722
Expenditures
Capital Outlay
950,562
1,181,786
1,058,381
123,405
Revenues
Property Taxes
Intergovernmental
Miscellaneous
Excess of Revenues Under Expenditures
(531,820)
(763,044)
(548,917)
214,127
Other Financing Sources
Sale of Capital Assets
Transfers In
0
133,123
0
133,123
24,852
133,123
24,852
0
Total Other Financing Sources
133,123
133,123
157,975
24,852
(398,697)
(629,921)
(390,942)
238,979
712,316
712,316
712,316
0
73,562
73,562
73,562
0
$387,181
$155,957
$394,936
$238,979
Net Change in Fund Balance
Fund Balance Beginning of Year
Prior Year Encumbrances Appropriated
Fund Balance End of Year
- 102 -
City of Solon, Ohio
Schedule of Revenues, Expenditures and Changes
In Fund Balance - Budget (Non-GAAP Basis) and Actual
Community Center Fund
For the Year Ended December 31, 2011
Variance with
Final Budget
Positive
(Negative)
Budgeted Amounts
Original
Revenues
Expenditures
Capital Outlay
Net Change in Fund Balance
Fund Balance Beginning of Year
Fund Balance End of Year
Final
Actual
$0
$0
$0
$0
2,000
2,000
0
2,000
(2,000)
(2,000)
0
2,000
2,027
2,027
2,027
0
$27
$27
$2,027
$2,000
- 103 -
City of Solon, Ohio
Schedule of Revenues, Expenditures and Changes
In Fund Balance - Budget (Non-GAAP Basis) and Actual
Building Construction Fund
For the Year Ended December 31, 2011
Variance with
Final Budget
Positive
(Negative)
Budgeted Amounts
Original
Revenues
Other
Expenditures
Capital Outlay
Net Change in Fund Balance
Fund Balance Beginning of Year
Fund Balance End of Year
Final
Actual
$421,200
$421,200
$0
891,994
1,313,194
1,426
1,311,768
(470,794)
(891,994)
893,097
893,097
893,097
0
$422,303
$1,103
$891,671
$890,568
- 104 -
(1,426)
($421,200)
890,568
City of Solon, Ohio
Schedule of Revenues, Expenditures and Changes
In Fund Balance - Budget (Non-GAAP Basis) and Actual
Old City Hall Renovations Fund
For the Year Ended December 31, 2011
Variance with
Final Budget
Positive
(Negative)
Budgeted Amounts
Original
Final
Actual
Revenues
Contributions and Donations
$600
$600
$0
Expenditures
Capital Outlay
7,600
8,206
5,271
2,935
(7,000)
(7,606)
(5,271)
2,335
7,006
7,006
7,006
0
600
600
600
0
$606
$0
$2,335
$2,335
Net Change in Fund Balance
Fund Balance Beginning of Year
Prior Year Encumbrances Appropriated
Fund Balance End of Year
- 105 -
($600)
City of Solon, Ohio
Schedule of Revenues, Expenditures and Changes
In Fund Balance - Budget (Non-GAAP Basis) and Actual
General Capital Improvements Fund
For the Year Ended December 31, 2011
Budgeted Amounts
Original
Revenues
Municipal Income Taxes
Charges for Services
Total Revenues
Expenditures
Capital Outlay
Excess of Revenues Under Expenditures
Other Financing Sources
Transfers In
Net Change in Fund Balance
Final
Actual
Variance with
Final Budget
Positive
(Negative)
$71,000
20,000
$71,000
20,000
$70,965
27,740
($35)
7,740
91,000
91,000
98,705
7,705
1,641,000
1,825,000
1,715,089
109,911
(1,550,000)
(1,734,000)
(1,616,384)
117,616
1,126,500
1,126,500
895,556
(654,444)
(607,500)
(489,884)
0
117,616
Fund Balance Beginning of Year
1,083,555
1,083,555
1,083,555
0
Fund Balance End of Year
$429,111
$476,055
$593,671
$117,616
- 106 -
City of Solon, Ohio
Schedule of Revenues, Expenses and Changes
In Fund Equity - Budget (Non-GAAP Basis) and Actual
Workers' Compensation Fund
For the Year Ended December 31, 2011
Budgeted Amounts
Original
Variance with
Final Budget
Positive
(Negative)
Final
Actual
$150,000
0
$250,000
0
$250,000
910
$0
910
Total Revenues
150,000
250,000
250,910
910
Expenses
Contractual Services
Claims
148,230
127,102
148,230
227,102
148,230
74,443
0
152,659
Total Expenses
275,332
375,332
222,673
152,659
(125,332)
(125,332)
28,237
153,569
125,492
125,492
125,492
0
332
332
332
0
$492
$492
$154,061
$153,569
Revenues
Charges for Services
Miscellaneous
Net Change in Fund Equity
Fund Equity Beginning of Year
Prior Year Encumbrances Appropriated
Fund Equity End of Year
- 107 -
(This Page Intentionally Left Blank)
- 108 -
Statistical Section
This part of the City of Solon, Ohio's Comprehensive Annual Financial Report presents detailed information
as a context for understanding what the information in the financial statements, note disclosures, and required
supplementary information says about the City's overall financial health.
Contents
Page(s)
Financial Trends
These schedules contain trend information to help the reader understand how the City's
financial performance and well-being have changed over time.
S2 - S11
Revenue Capacity
These schedules contain information to help the reader assess the City's most
significant local revenue source, the municipal income tax.
S12 - S13
Debt Capacity
These schedules present information to help the reader assess the affordability of the
City's current levels of outstanding debt and the City's ability to issue additional debt
in the future.
S14 - S19
.
Economic and Demographic Information
These schedules offer economic and demographic indicators to help the reader understand
the environment within which the City's financial activities take place.
S20- S23
Operating Information
These schedules contain service data to help the reader understand how the information
in the City's financial report relates to the services the City provides and the activities
it performs.
S24 - S29
Sources: Unless otherwise noted, the information in these schedules is derived from the
comprehensive annual financial reports for the relevant fiscal year. The City implemented
GASB Statement 34 in 2003; schedules presenting government-wide information include
information beginning in that fiscal year.
- S1 -
City of Solon, Ohio
Net Assets By Component
Last Ten Years
(Accrual Basis of Accounting)
2011 (1)
2010 (1)
2009 (1)
2008
$116,112,789
$117,330,135
$104,060,699
$92,250,325
6,925,143
7,219,254
5,006,205
7,642,496
9,236,362
7,866,320
19,795,982
8,824,240
1,070,267
0
0
641,520
1,102,110
13,281,133
1,108,641
0
0
922,799
988,518
10,607,262
1,081,065
0
0
1,178,514
981,745
12,398,272
1,084,825
553,060
249,116
1,400,493
1,507,140
12,324,836
Total Governmental Activities
Net Assets
$146,352,216
$143,606,056
$136,802,977
$137,990,017
Business Type - Activities
Invested in Capital Assets,
Net of Related Debt
Unrestricted
$52,758,649
6,906,080
$52,548,182
4,735,569
$52,711,512
4,519,543
$51,496,779
5,470,918
Total Business-Type Activities
Net Assets
$59,664,729
$57,283,751
$57,231,055
$56,967,697
Primary Government
Invested in Capital Assets,
Net of Related Debt
Restricted
Unrestricted
$168,871,438
16,958,294
20,187,213
$169,878,317
15,668,659
15,342,831
$156,772,211
20,344,006
16,917,815
$143,747,104
33,414,856
17,795,754
Total Primary Government
Net Assets
$206,016,945
$200,889,807
$194,034,032
$194,957,714
Governmental Activities
Invested in Capital Assets,
Net of Related Debt
Restricted:
Capital Projects
Debt Service
Street Construction,
Maintenance and Repair
Cable TV
Tree Planting
Landfill Improvement
Other Purposes
Unrestricted
(1) The City implemented GASB 54 in 2010, causing the classification of net assets to change.
- S2 -
2007
2006
2005
2004
2003
2002
$87,878,235
$82,030,598
$78,760,236
$73,743,370
$74,138,179
$64,236,393
21,802,881
4,245,100
19,874,834
5,043,568
17,130,291
5,832,940
19,714,801
5,494,418
20,769,432
5,164,577
21,153,622
5,182,771
971,182
488,084
243,136
1,394,909
792,373
14,084,752
933,208
505,445
240,376
1,399,637
549,219
13,134,426
787,747
478,171
232,556
1,352,933
208,927
13,348,140
933,997
504,777
216,226
1,351,906
139,672
18,278,464
1,100,877
434,793
200,356
1,367,896
340,629
21,327,415
1,439,159
345,524
186,326
1,379,192
606,348
28,200,481
$131,900,652
$123,711,311
$118,131,941
$120,377,631
$124,844,154
$122,729,816
$50,615,585
4,291,875
$49,301,117
3,265,336
$44,682,581
5,723,344
$39,874,333
5,929,558
$39,017,736
7,447,417
$34,383,495
7,695,055
$54,907,460
$52,566,453
$50,405,925
$45,803,891
$46,465,153
$42,078,550
$138,493,820
29,937,665
18,376,627
$131,331,715
28,546,287
16,399,762
$123,442,817
26,023,565
19,071,484
$113,617,703
28,355,797
24,208,022
$113,155,915
29,378,560
28,774,832
$98,619,888
30,292,942
35,895,536
$186,808,112
$176,277,764
$168,537,866
$166,181,522
$171,309,307
$164,808,366
- S3 -
City of Solon, Ohio
Changes in Net Assets
Last Nine Years
(Accrual Basis of Accounting)
2011
2010
2009
2008
Program Revenues
Governmental Activities:
Charges for Services:
Security of Persons and Property
Police
Fire
Prosecutor
Public Health and Welfare
Leisure Time Activities
Community Environment
Basic Utility Services
Transportation
General Government
Operating Grants and Contributions
Capital Grants and Assessments
$354,441
711,236
10,242
3,391
3,165,390
124,986
73,489
201,984
237,449
1,407,239
149,004
$398,302
338,162
13,810
4,434
3,131,685
159,952
96,456
289,778
257,817
1,512,849
241,789
$421,753
367,317
16,910
4,901
3,075,799
113,636
52,604
358,670
257,235
1,620,631
3,022,448
$487,454
436,985
19,725
5,406
3,081,121
157,036
157,087
325,144
455,053
1,405,593
5,742,816
Total Governmental Activities
Program Revenues
6,438,851
6,445,034
9,311,904
12,273,420
Business-Type Activities:
Charges for Services:
Water Reclamation
Grantwood Recreation
Operating Grants and Contributions
7,797,724
951,371
158,528
5,659,317
978,466
0
5,421,385
1,079,991
0
5,842,685
1,329,215
585
Total Business-Type Activities
Program Revenues
8,907,623
6,637,783
6,501,376
7,172,485
Total Primary Government
Program Revenues
15,346,474
13,082,817
15,813,280
19,445,905
Expenses
Governmental Activities:
Security of Persons and Property
Police
Fire
Prosecutor
Public Health and Welfare
Leisure Time Activities
Community Environment
Basic Utility Services
Transportation
General Government
Interest and Fiscal Charges
8,501,513
8,137,648
258,477
85,571
6,594,011
2,793,632
2,668,113
14,847,835
5,426,644
533,090
8,673,149
8,075,434
255,132
81,915
6,347,442
2,994,824
2,758,637
10,227,176
4,592,923
641,829
8,534,822
8,054,144
293,094
84,955
6,463,393
2,831,678
2,331,673
16,375,233
5,364,048
857,669
8,558,640
8,312,572
299,401
82,050
6,607,556
3,343,663
2,159,306
15,653,183
6,037,327
1,232,429
Total Governmental Activities Expenses
49,846,534
44,648,461
51,190,709
52,286,127
Business-Type Activities
Water Reclamation
Grantwood Recreation
5,265,324
1,048,003
5,910,432
927,306
6,472,968
1,142,923
6,005,663
1,395,175
Total Business-Type Activities Expenses
6,313,327
6,837,738
7,615,891
7,400,838
56,159,861
51,486,199
58,806,600
59,686,965
(43,407,683)
2,594,296
(38,203,427)
(199,955)
(41,878,805)
(1,114,515)
(40,012,707)
(228,353)
($40,813,387)
($38,403,382)
($42,993,320)
($40,241,060)
Total Primary Government
Program Expenses
Net (Expense)/Revenue
Governmental Activities
Business-Type Activities
Total Primary Government
Net Expense
- S4 -
2007
2006
2005
2004
2003
$473,157
432,286
22,654
7,485
3,064,735
163,455
110,039
327,922
469,342
1,259,666
663,457
$467,125
410,437
21,545
8,328
2,901,646
151,067
223,131
293,743
521,404
1,186,197
1,597,434
$451,120
410,017
33,500
9,210
2,853,512
147,069
147,855
308,193
587,975
1,008,611
2,028,529
$397,347
342,623
19,334
8,076
2,591,960
138,260
107,112
241,598
649,852
1,073,328
30,000
$431,411
357,758
23,462
8,248
2,142,864
177,622
99,214
253,276
563,605
831,117
924,595
6,994,198
7,782,057
7,985,591
5,599,490
5,813,172
5,783,498
1,378,801
0
5,245,086
1,358,772
0
5,034,157
1,458,833
0
4,951,245
1,439,019
0
5,084,021
1,280,301
0
7,162,299
6,603,858
6,492,990
6,390,264
6,364,322
14,156,497
14,385,915
14,478,581
11,989,754
12,177,494
7,893,398
7,052,821
299,085
98,755
6,385,083
3,289,985
2,694,417
13,287,441
6,591,856
1,374,360
7,454,568
7,187,188
296,403
114,569
5,959,263
2,907,697
1,840,017
10,519,856
7,003,004
1,354,604
7,085,001
6,945,834
449,351
123,533
5,786,057
2,659,078
1,543,094
11,193,451
6,700,104
1,285,874
6,952,721
6,580,279
291,166
121,625
5,599,968
2,738,297
1,467,266
11,766,890
8,336,415
1,301,006
6,236,704
5,860,599
299,984
105,461
5,055,204
2,874,107
1,238,991
6,029,480
6,396,281
1,448,515
48,967,201
44,637,169
43,771,377
45,155,633
35,545,326
4,446,862
1,336,801
5,768,265
1,262,934
4,948,864
1,405,262
5,935,231
1,356,898
5,464,150
1,409,474
5,783,663
7,031,199
6,354,126
7,292,129
6,873,624
54,750,864
51,668,368
50,125,503
52,447,762
42,418,950
(41,973,003)
1,378,636
(36,855,112)
(427,341)
(35,785,786)
138,864
(39,556,143)
(901,865)
(29,732,154)
(509,302)
($40,594,367)
($37,282,453)
($35,646,922)
($40,458,008)
($30,241,456)
(continued)
- S5 -
City of Solon, Ohio
Changes in Net Assets (continued)
Last Nine Years
(Accrual Basis of Accounting)
2011
General Revenues and Other Changes
in Net Assets
Governmental Activities
Property Taxes Levied For:
General Purposes
Debt Service
Police Pension
Fire Pension
Service and Safety Equipment
Community Center
Municipal Income Taxes levied for:
General Purposes
Debt Service
Infrastructure
General Capital Improvements
Grants and Entitlements not Restricted to
Specific Programs
Investment Income
Gain on Sale of Capital Assets
Miscellaneous
Total Governmental Activities
General Revenues
Special Item - Gain on the Sale of Land
Transfers
Total Governmental Activities
2010
2009
2008
$1,338,758
1,419,400
407,280
610,920
389,788
0
$847,731
1,928,116
411,492
616,532
393,218
0
$830,331
2,227,871
425,385
637,371
392,947
0
$931,232
1,933,192
474,758
711,430
457,470
305,922
29,071,231
0
9,524,829
78,167
28,336,758
0
9,120,696
69,329
25,569,132
0
8,360,524
76,178
26,663,509
3,607
9,179,725
74,141
1,846,601
607,074
47,632
522,228
1,772,443
895,577
13,894
814,795
1,813,161
998,629
27,013
650,783
2,389,085
2,807,067
0
582,432
45,863,908
45,220,581
42,009,325
46,513,570
0
(1,317,560)
1,799,567
(2,211,065)
0
289,935
0
(214,075)
46,153,843
45,006,506
40,691,765
46,102,072
Business-Type Activities
Gain on Sale of Capital Assets
Miscellaneous
0
76,617
0
38,576
0
60,313
0
77,525
Total Business-Type Activities
General Revenues
76,617
38,576
60,313
77,525
(289,935)
214,075
1,317,560
2,211,065
(213,318)
252,651
1,377,873
2,288,590
45,940,525
45,259,157
42,069,638
48,390,662
2,746,160
2,380,978
6,803,079
52,696
(1,187,040)
263,358
6,089,365
2,060,237
$5,127,138
$6,855,775
($923,682)
$8,149,602
Transfers
Total Business-Type Activities
Total Primary Government General Revenues
and Other Changes in Net Assets
Change in Net Assets
Governmental Activities
Business-Type Activities
Total Primary Government Change
in Net Assets
- S6 -
2007
2006
2005
2004
2003
$951,950
2,535,666
486,686
729,324
471,740
0
$1,012,667
2,291,480
440,914
654,279
452,365
0
$745,476
2,237,086
410,539
615,809
420,530
0
$787,950
3,025,779
320,851
332,792
431,881
0
$729,028
3,061,294
298,464
298,464
430,479
0
30,601,737
41,358
9,682,464
0
27,042,160
0
8,136,936
0
22,840,197
0
7,127,506
0
21,800,820
0
4,971,768
0
21,673,469
0
6,603,732
0
1,941,816
3,242,148
0
397,834
2,229,329
2,426,337
31,726
260,020
2,572,766
893,329
0
87,494
2,336,884
1,155,225
8,450
90,038
1,929,875
1,298,459
0
401,395
51,082,723
44,978,213
37,950,732
35,262,438
36,724,659
0
(2,543,731)
0
(4,410,636)
50,162,344
42,434,482
33,540,096
35,089,620
31,846,492
1,498
40,494
2,518
41,620
0
52,534
0
67,785
0
17,738
41,992
44,138
52,534
67,785
17,738
920,379
2,543,731
4,410,636
172,818
4,878,167
962,371
2,587,869
4,463,170
240,603
4,895,905
51,124,715
45,022,351
38,003,266
35,330,223
36,742,397
8,189,341
2,341,007
5,579,370
2,160,528
(2,245,690)
4,602,034
(4,466,523)
(661,262)
2,114,338
4,386,603
$10,530,348
$7,739,898
$2,356,344
($5,127,785)
$6,500,941
0
(920,379)
0
(172,818)
- S7 -
0
(4,878,167)
City of Solon, Ohio
Fund Balances, Governmental Funds
Last Ten Years
(Modified Accrual Basis of Accounting)
2011
2010
2009
2008
General Fund
Non-spendable
Restricted
Committed
Assigned
Unassigned
Reserved
Unreserved
$732,687
377
1,003,676
909,960
20,646,611
0
0
$555,472
96,972
1,182,073
359,302
19,479,061
0
0
$623,912
83,358
1,101,884
459,812
22,636,438
0
0
$0
0
0
0
0
406,585
26,104,831
Total General Fund
23,293,311
21,672,880
24,905,404
26,511,416
All Other Governmental Funds
Restricted
Committed
Unassigned (Deficit)
Reserved
Unreserved, Undesignated,
Reported in:
Special Revenue Funds
Debt Service Funds
Capital Projects Funds
9,577,187
1,012,836
0
0
11,473,009
1,234,298
(3,790,560)
0
0
0
455,015
0
0
0
0
0
0
0
0
0
4,488,030
1,485,082
13,198,823
10,590,023
9,594,836
8,916,747
19,626,950
$
$33,883,334
$31,267,716
$
$33,822,151
$
$46,138,366
$
Total All Other Governmental Funds
Total G
Governmental Funds
8,408,663
1,188,298
(2,125)
0
Note: The City implemented GASB 54 in 2010.
- S8 -
2007
2006
2005
2004
2003
2002
$0
0
0
0
0
2,625,689
25,889,682
$0
0
0
0
0
2,746,771
25,898,002
$0
0
0
0
0
2,780,421
23,818,231
$0
0
0
0
0
2,892,935
25,438,890
$0
0
0
0
0
2,891,843
26,936,020
$0
0
0
0
0
786,678
34,724,059
28,515,371
28,644,773
26,598,652
28,331,825
29,827,863
35,510,737
0
0
5,339,021
0
0
1,902,166
0
0
255,949
0
0
3,560,449
0
0
3,505,304
0
0
11,589,137
3,563,983
1,074,820
6,549,744
3,185,684
1,529,697
10,924,870
2,762,247
1,996,287
10,570,361
2,737,070
2,362,134
9,525,748
3,520,429
2,298,675
10,043,906
4,035,765
1,995,644
1,768,345
16,527,568
17,542,417
15,584,844
18,185,401
19,368,314
19,388,891
$
$45,042,939
$46,187,190
$
$42,183,496
$
$46,517,226
$
$49,196,177
$
$54,899,628
$
- S9 -
City of Solon, Ohio
Changes in Fund Balances, Governmental Funds
Last Ten Years
(Modified Accrual Basis of Accounting)
2011
2010
2009
2008
Revenues
Property Taxes
Municipal Income Taxes
Special Assessments
Intergovernmental
Investment Income
Fees, Licenses and Permits
Fines and Forfeitures
Rentals
Charges for Services
Contributions and Donations
Miscellaneous
$4,175,477
38,635,456
722,102
3,369,326
607,074
722,408
397,909
31,134
3,741,157
98,588
522,228
$4,200,659
37,011,203
812,268
3,418,929
895,577
772,364
342,265
23,083
3,562,684
99,555
814,795
$4,439,830
33,433,337
788,768
6,379,986
998,629
670,840
337,471
24,097
3,646,417
75,173
650,587
$4,850,270
36,379,832
1,121,553
3,996,592
2,807,067
856,198
401,852
18,525
3,758,436
130,287
582,432
Total Revenues
53,022,859
51,953,382
51,445,135
54,903,044
0
8,077,151
7,444,523
257,217
85,571
6,023,319
2,838,647
1,894,005
6,181,872
4,966,488
10,388,586
0
8,264,487
7,429,107
252,624
81,915
5,669,661
3,001,106
1,890,447
6,429,141
4,327,183
14,549,895
0
8,078,371
7,574,187
297,440
84,955
5,793,337
2,801,923
1,641,022
6,491,425
4,061,450
22,775,769
0
7,985,861
7,750,303
299,953
82,050
5,900,904
3,316,686
1,920,896
6,095,752
4,790,951
13,280,808
2,070,153
546,106
0
1,995,556
657,129
0
3,271,373
879,836
0
1,732,382
1,246,408
0
50,773,638
54,548,251
63,751,088
54,402,954
2,249,221
(2,594,869)
(12,305,953)
66,462
0
0
0
4,363,775
(4,063,840)
112,607
0
0
0
7,529,125
(7,601,298)
83,882
0
0
0
5,553,280
(5,647,424)
14,175
0
0
0
8,344,130
(10,281,118)
(10,262)
(1,922,813)
Expenditures
Current:
Security of Persons and Property
Police
Fire
Prosecutor
Public Health and Welfare
Leisure Time Activities
Community Development
Basic Utilities Services
Transportation
General Government
Capital Outlay
Debt Service:
Principal Retirement
Interest and Fiscal Charges
Bond Issuance Costs
Total Expenditures
Excess of Revenues Over
(Under) Expenditures
Other Financing Sources (Uses)
Sale of Capital Assets
General Obligation Bonds Issued
Payment to Refunded Bond Escrow
OWDA Loans Issued
Transfers In
Transfers Out
Total Other Financing Sources (Uses)
Special Item
Proceeds from Sale of Land
Net Change in Fund Balances
Debt Service as a Percentage of
Noncapital Expenditures
366,397
40,434
0
0
$2,615,618
5.7%
(1) Security of Persons and Property was shown in total for 2002.
- S10 -
0
($2,554,435)
($12,316,215)
6.4%
8.2%
500,090
2,518,150
$1,095,427
6.1%
2007
2006
2005
2004
2003
2002 (1)
$5,167,986
38,530,269
1,003,236
3,127,153
3,242,148
989,533
353,490
13,598
3,714,454
103,806
397,834
$4,857,332
36,029,136
850,556
4,360,538
2,426,337
978,890
379,355
18,343
3,621,838
111,152
260,020
$4,501,679
29,535,375
1,083,930
3,766,964
893,329
1,112,664
332,732
31,992
3,471,063
66,982
87,494
$4,856,262
27,038,056
406,647
3,306,652
1,155,225
1,081,566
292,396
11,563
3,110,637
83,731
90,038
$4,824,148
28,383,580
370,838
3,536,577
1,298,459
1,040,886
282,640
8,397
2,725,537
67,961
401,395
$4,370,359
27,795,091
820,074
7,314,296
3,174,847
900,926
286,901
0
1,864,193
0
236,792
56,643,507
53,893,497
44,884,204
41,432,773
42,940,418
46,763,479
0
7,290,455
7,025,219
294,804
98,755
5,602,008
3,139,019
2,044,148
5,405,428
5,692,537
13,649,066
0
7,020,044
6,605,778
300,436
114,569
5,248,742
2,219,670
1,846,896
4,910,127
6,117,606
13,399,863
0
6,649,603
6,458,351
445,789
123,533
5,091,112
2,062,884
1,587,598
5,167,983
6,000,827
15,578,972
0
6,635,441
6,289,735
288,406
121,625
4,895,083
2,083,980
1,469,524
4,745,841
7,370,422
7,913,048
0
6,014,057
5,401,761
299,984
105,461
4,276,719
2,084,024
1,525,655
4,318,184
5,330,364
16,768,406
10,808,139
0
0
0
105,158
3,259,042
1,709,823
1,467,022
3,974,720
4,920,380
25,394,387
5,886,095
1,406,201
0
2,547,369
1,263,066
0
2,546,082
1,299,872
0
2,336,134
1,273,201
0
2,171,799
1,403,436
0
4,648,819
1,295,962
90,645
57,533,735
51,594,166
53,012,606
45,422,440
49,699,850
57,674,097
2,299,331
(8,128,402)
(3,989,667)
(6,759,432)
(10,910,618)
72,236
0
0
1,789,236
6,994,821
(7,151,930)
169,563
0
0
3,811,825
4,462,788
(4,649,504)
29,500
0
0
1,454,034
5,369,057
(5,541,875)
0
0
0
1,268,815
10,056,269
(10,269,103)
0
12,195,521
(2,860,468)
0
4,903,817
(6,080,540)
1,704,363
3,794,672
1,310,716
1,055,981
8,158,330
0
0
0
0
0
(890,228)
54,216
0
0
612,140
10,425,148
(11,345,527)
(254,023)
0
($1,144,251)
14.8%
$4,003,694
11.1%
($4,333,730)
($2,678,951)
($5,703,451)
($2,752,288)
11.5%
10.6%
12.2%
23.0%
- S11 -
City of Solon, Ohio
Income Tax Revenue Base and Collections
Last Ten Years
Tax
Year (1)
Tax
Rate (2)
Total Tax
Collected
Taxes from
Withholding
Percentage
of Taxes
from
Withholding
$38,674,227
$28,643,077
74.06%
Taxes From
Net Profits
Percentage
of Taxes
from
Net Profits
Taxes
From
Individuals
Percentage
of Taxes
from
Individuals
$6,882,485
17.80%
$3,148,665
8.14%
2011
2.00 %
2010
2.00
37,526,783
27,519,770
73.33
6,341,666
16.90
3,665,347
9.77
2009
2.00
34,005,834
26,232,767
77.14
4,716,335
13.87
3,056,732
8.99
2008
2.00
37,416,449
25,989,242
69.46
7,547,808
20.17
3,879,399
10.37
2007
2.00
40,325,559
29,517,754
73.20
6,937,835
17.20
3,869,970
9.60
2006
2.00
35,179,096
26,402,804
75.05
5,075,164
14.43
3,701,128
10.52
2005
2.00
29,967,703
23,220,297
77.48
3,337,974
11.14
3,409,432
11.38
2004
2.00
26,772,588
21,006,825
78.46
2,726,706
10.18
3,039,057
11.35
2003
2.00
28,277,201
22,338,251
79.00
2,968,932
10.50
2,970,018
10.50
2002
2.00
27,795,091
21,002,339
75.56
3,856,373
13.87
2,936,379
10.56
(1) 2003 through 2011 are on an Accrual Basis and 2002 is on a Modified Accrual Basis.
(2) Rates may only be raised by obtaining the approval of a majority of the voters at a public election.
Income Tax Collections for the Last 10 Years
(in Millions of Dollars)
$45
$40
$35
$30
$25
$20
$15
$10
$5
$0
Withholding
Net Profits
- S12 -
Individuals
City of Solon, Ohio
Principal Income Taxpayers
Current Year and Nine Years Ago
The following are the principal income taxpayers in the City; ranked in order of payroll withholding.
2011 Taxpayers
Ranking
Swagelok Manufacturing Company
Nestle Food Company
Keithley Instruments Inc.
Solon Board of Education
Erico Products Inc.
City of Solon
Parker Hannifin
National Enterprise Systems Inc.
Friction Products Company
LPS Management LLC
1
2
3
4
5
6
7
8
9
10
2002 Taxpayers
Ranking
Nestle Beverage Services
Swagelok Manufacturing Company
Solon Board of Education
Keithley Instruments Inc.
Pioneer Standard Electronics
Erico Products Inc.
Kennametal Inc.
L'Oreal USA Products, Inc.
City of Solon
Datavantage Corporation
1
2
3
4
5
6
7
8
9
10
Due to legal restrictions and confidentially requirements, the City cannot disclose the amount
of withholding.
Source:
Information provided by City's Finance Department.
- S13 -
City of Solon, Ohio
Ratio of Outstanding Debt to
Total Personal Income and Debt Per Capita
Last Ten Years
Governmental Activities
Special
Assessment
Bonds
Year
General
Obligation
Bonds
2011
$4,470,000
$84,895
$9,742,923
$199,235
$0
2010
5,620,000
167,497
10,519,826
259,883
0
2009
6,720,000
247,805
11,274,426
320,531
4,707,351
2008
9,150,000
325,818
12,007,462
350,855
5,739,897
2007
10,150,000
401,537
12,603,477
411,503
9,400,888
2006
15,210,000
15 210 000
474,961
474 961
12,683,360
12 683 360
472,151
472 151
7,112,751
7 112 751
2005
17,170,000
548,385
11,347,421
532,799
6,012,118
2004
19,040,000
722,220
7,977,195
593,447
6,531,075
2003
20,835,000
898,350
6,827,517
654,095
7,045,100
2002
22,570,000
1,060,714
5,975,352
714,744
7,500,000
OWDA
Loans
(1) The personal income and population can be found on S22.
Total Debt Per Capita
Last 10 Years
$3,000
$2,500
In Thousand Dollars
General
Obligation
Bond
Anticipation
Notes
$2,000
$1,500
$1,000
$500
$0
YEARS
- S14 -
OPWC
Loans
Business-Type
Activities
Total
Debt
Percentage
of Personal
Income (1)
$12,381,524
$26,878,577
2.46%
10,171,586
26,738,792
3.24
1,145
11,688,947
34,959,060
4.53
1,603
13,110,071
40,684,103
5.27
1,866
14,275,277
47,242,682
6.12
2,167
13 942 003
13,942,003
49,895,226
49 895 226
6.47
6 47
2,289
2 289
13,041,769
48,652,492
6.30
2,232
14,183,512
49,047,449
6.36
2,250
15,288,431
51,548,493
6.68
2,364
16,353,726
54,174,536
7.02
2,485
OWDA
Loans
Per
Capita (1)
$1,151
- S15 -
City of Solon, Ohio
Ratio of General Obligation Bonded Debt to Estimated
True Values of Taxable Property and Bonded Debt Per Capita
Last Ten Years
Year
Population (1)
Estimated
True Values of
Taxable
Property (2)
Bonded
Debt (3)
Ratio of
Bonded
Debt to Estimated
True Values of
Taxable Property
0.14 %
Bonded
Debt Per
Capital
2011
23,348
$3,232,882,651
$4,470,000
$191.45
2010
23,348
3,238,635,274
5,620,000
0.17
240.71
2009
21,802
3,629,826,351
6,720,000
0.19
308.23
2008
21,802
3,970,061,706
9,150,000
0.23
419.69
2007
21,802
4,250,386,170
10,150,000
0.24
465.55
2006
21,802
3,741,137,847
15,210,000
0.41
697.64
2005
21,802
3,522,804,158
17,170,000
0.49
787.54
2004
21,802
3,586,420,398
19,040,000
0.53
873.31
2003
21 802
21,802
3 471 059 759
3,471,059,759
20 835 000
20,835,000
0 60
0.60
955 65
955.65
2002
21,802
3,410,829,704
22,570,000
0.66
1,035.23
Sources:
(1) U. S. Bureau of Census, Census of Population.
(2) Cuyahoga County Auditor
(3) Includes all general obligation bonded debt.
(4) Although the general obligation bond retirement fund is restricted for debt service, it is not
specifically restricted to the payment of principal. Therefore, these resources are not shown as a
deduction from general obligation bonded debt.
debt
- S16 -
City of Solon, Ohio
Computation of Direct and Overlapping Governmental Activities Debt
December 31, 2011
Governmental
Activities Debt
Outstanding
Percentage
Applicable
to City (1)
Direct - City of Solon
General Obligation Bonds
Special Assessment Bonds
OWDA Loans
OPWC Loans
$4,470,000
84,895
9,742,923
199,235
100.00%
100.00%
100.00%
100.00%
Total Direct
14,497,053
Jurisdiction
Overlapping
Solon City School District
General Obligation Bonds
Capital Lease Obligations
Orange School District
General Obligation Bonds
Capital Lease Obligations
Cuyahoga County (2)
General Obligation Bonds
Revenue Bonds
Capital Lease Obligations
Loans Payable
Greater Cleveland Regional
Transit Authority
Total Overlapping Debt
Total
Amount
Applicable
to City of
Solon
14,497,053
17,853,237
111,702
97.86%
97.86%
17,471,178
109,312
26,473,006
127,646
2.14%
2.14%
566,522
2,732
298,113,842
166,580,000
20,851,000
8,310,000
3.87%
3.87%
3.87%
3.87%
11,537,006
6,446,646
806,934
321,597
166,047,138
3.87%
6,426,024
704,467,571
43,687,951
$718,964,624
$58,185,004
(1) The percentage of gross indebtedness of the City's overlapping political
subdivisions was determined by dividing each overlapping subdivision's assessed
valuation within the City by its total assessed valuation.
(2) The special taxing districts' debt (which includes the Cleveland Metropolitan
Park District, Cuyahoga Community College and the Cleveland-Cuyahoga Port
Authority) is included in the County total.
Source:
$4,470,000
84,895
9,742,923
199,235
Cuyahoga County Auditor
- S17 -
City of Solon, Ohio
Ratios of Bonded Debt Outstanding and Legal Debt Margin
Last Ten Years
2011
Population
Total Assessed Property Value
General Bonded Debt Outstanding:
General Obligation Bonds
Special Assessment Bonds
Bond Anticipation Notes
OPWC Loans
OWDA Loans
2010
2009
2008
23,348
23,348
21,802
21,802
$1,141,833,370
$1,138,422,059
$1,179,483,022
$1,189,301,755
$4,470,000
84,895
0
199,235
22,124,447
$5,620,000
167,497
0
259,883
20,691,412
$6,720,000
247,805
4,700,000
320,531
22,963,373
$9,150,000
325,818
5,700,000
350,855
25,117,533
Total Gross Indebtedness
Less:
Special Assessment Bonds
OWDA Loans
General Obligation
Bond Retirement Fund Balance
26,878,577
26,738,792
34,951,709
40,644,206
(84,895)
(22,124,447)
(167,497)
(20,691,412)
(247,805)
(22,963,373)
(325,818)
(25,117,533)
(2,114,990)
(1,800,852)
(1,186,990)
(1,485,082)
Total Net Debt Applicable to Debt Limit
2,554,245
4,079,031
10,553,541
13,715,773
119,892,504
119,534,316
123,845,717
124,876,684
$117,338,259
$115,455,285
$113,292,176
$111,160,911
Overall Legal Debt Limit
(10 ½ % of Assessed Valuation)
Legal Debt Margin Within 10 ½ % Limitations
Legal Debt Margin as a Percentage of the Debt Limit
Unvoted Debt Limitation
5 ½ % of Assessed Valuation
Total Gross Indebtedness
Less:
Voted General Obligation Bonds
Special Assessment Bonds
OWDA Loans
General Obligation
Bond Retirement Fund Balance
Net Debt Within 5 ½ % Limitations
Unvoted Legal Debt Margin Within 5 ½ % Limitations
Unvoted legal Debt Margin as a Percentage of the
Unvoted Debt Limitation
97.87%
$62,800,835
96.59%
$62,613,213
91.48%
$64,871,566
89.02%
$65,411,597
26,878,577
26,738,792
34,951,709
40,644,206
0
(84,895)
(22,124,447)
(240,000)
(167,497)
(20,691,412)
(465,000)
(247,805)
(22,963,373)
(2,060,000)
(325,818)
(25,117,533)
(2,114,990)
(1,800,852)
(1,186,990)
(1,485,082)
2,554,245
3,839,031
10,088,541
11,655,773
$60,246,590
$58,774,182
$54,783,025
$53,755,824
95.93%
Source: City Financial Records
- S18 -
93.87%
84.45%
82.18%
2007
2006
2005
2004
2003
2002
21,802
21,802
21,802
21,802
21,802
21,802
$1,268,462,154
$1,185,343,677
$1,178,760,526
$1,188,847,661
$1,139,784,898
$1,120,768,635
$10,150,000
401,537
9,390,000
411,503
26,878,754
$15,210,000
474,961
7,100,000
472,151
26,625,363
$17,170,000
548,385
6,000,000
532,799
24,389,190
$19,040,000
722,220
6,500,000
593,447
22,160,707
$20,835,000
898,350
7,000,000
654,095
22,115,948
$22,570,000
1,060,714
7,500,000
714,744
19,190,442
47,231,794
49,882,475
48,640,374
49,016,374
51,503,393
51,035,900
(401,537)
(26,878,754)
(474,961)
(26,625,363)
(548,385)
(24,389,190)
(722,220)
(22,160,707)
(898,350)
(22,115,948)
(1,060,714)
(19,190,442)
(1,074,820)
(1,529,697)
(1,996,287)
(2,362,134)
(2,298,675)
(1,596,515)
18,876,683
21,252,454
21,706,512
23,771,313
26,190,420
29,188,229
133,188,526
124,461,086
123,769,855
124,829,004
119,677,414
117,680,707
$114,311,843
$103,208,632
$102,063,343
$101,057,691
$93,486,994
$88,492,478
85.83%
$69,765,418
82.92%
$65,193,902
82.46%
$64,831,829
80.96%
$65,386,621
78.12%
$62,688,169
75.20%
$61,642,275
47,231,794
49,882,475
48,640,374
49,016,374
51,503,393
51,035,900
(2,250,000)
(401,537)
(26,878,754)
(2,430,000)
(474,961)
(26,625,363)
(2,605,000)
(548,385)
(24,389,190)
(2,770,000)
(722,220)
(22,160,707)
(2,920,000)
(898,350)
(22,115,948)
(3,060,000)
(1,060,714)
(19,190,442)
(1,074,820)
(1,529,697)
(1,996,287)
(2,362,134)
(2,298,675)
(1,596,515)
16,626,683
18,822,454
19,101,512
21,001,313
23,270,420
26,128,229
$53,138,735
$46,371,448
$45,730,317
$44,385,308
$39,417,749
$35,514,046
76.17%
71.13%
70.54%
- S19 -
67.88%
62.88%
57.61%
City of Solon, Ohio
Principal Employers
2010 and 2001 (1)
2010
Employer
W-2's
Percentage of
Total City
W-2's
Swagelok Company
Nestle Food Company
Solon Board of Education
National Enterprise Systems
City of Solon
Erico Products Inc.
The Cleveland Clinic
Keithley Instruments Inc.
L'Oreal USA Products, Inc.
Datavantage
2,800
2,113
1,063
882
848
535
446
356
328
321
6.37 %
4.81
2.42
2.01
1.93
1.22
1.01
0.81
0.75
0.73
Total
9,692
22.06 %
Total W-2's Received
43,929
2001
Employer
W-2's
Percentage of
Total City
W-2's
Nestle Food Company
Swagelok Company
Solon Board of Education
City of Solon
Agilysys Inc.
Keithley Instruments Inc.
Erico Products Inc.
L'Oreal USA Products, Inc.
Venture Lighting Inc.
Kennametal Inc.
2,378
1,012
989
722
648
601
589
516
499
498
4.85 %
2.06
2.02
1.47
1.32
1.23
1.20
1.05
1.02
1.02
Total
8,452
17.24 %
Total W-2's Received
49,028
(1) Current year data was not complete when this report was produced.
Source:
Information provided by City's Finance Department.
- S20 -
(This Page Intentionally Left Blank)
- S21 -
City of Solon, Ohio
Demographic and Economic Statistics
Last Ten Years
Personal
Income
Per Capita (1)
Median
Household
Income (1)
Median
Age (1)
Year
Population (1)
Total Personal
Income (5)
2011
23,348
$1,093,853,800
$46,850
$95,881
43
2010
23,348
1,093,853,800
46,850
95,881
43
2009
21,802
771,659,988
35,394
78,903
39
2008
21,802
771,659,988
35,394
78,903
39
2007
21,802
771,659,988
35,394
78,903
39
2006
21,802
771,659,988
35,394
78,903
39
2005
21,802
771,659,988
35,394
78,903
39
2004
21,802
771,659,988
35,394
78,903
39
2003
21,802
771,659,988
35,394
78,903
39
2002
21,802
771,659,988
35,394
78,903
39
(1) Source: U. S. Census
(2) Source: Ohio Department of Education Website: "http://www.ode.state.oh.us/data/"
(3) Ohio Labor Market Website: "http://www.lmi.state.oh.us"
(4) Source: Cuyahoga County Auditor
(5) Computation of per capita personal income multiplied by population
Total Assessed Property Value
Millions of Dollars
$1,500
$1,250
$1,000
$750
$500
$250
$0
- S22 -
Educational
Attainment:
Bachelor's
Degree
or Higher (1)
School
Enrollment (2)
Cuyahoga
County
Unemployment
Rate (3)
Total
Assessed
Property
Value (4)
57.0%
5,043
7.1%
$1,141,833,370
57.0
5,171
8.6
1,138,422,059
50.4
5,214
9.0
1,179,483,022
50.4
5,292
7.1
1,189,301,755
50.4
5,357
6.1
1,268,462,154
50.4
5,366
5.5
1,185,343,677
50.4
5,314
5.9
1,178,760,526
50.4
5,243
6.3
1,188,847,661
50.4
5,162
6.2
1,139,784,898
50.4
5,103
5.7
1,120,768,635
- S23 -
City of Solon, Ohio
Full-Time City Government Employees by Function/Program
Last Ten Years
Function/Program
Security of Persons and Property
Police
Dispatch and Clerks
Corrections
Fire
Leisure Time Activities
Recreation
Senior Services
Arts Center
Grantwood Golf Course
Community Environment
Planning
Building
Engineering
Public Works
Basic Utility Services
Water Reclamation
Transportation
Service
General Government
City Council
Mayors Office
Finance
Income Tax
Prosecutor Clerk
Human Resources
Network Administrator
City Hall Custodial
Receptionist
Totals:
2011
2010
2009
2008
44.00
18.00
7.00
58.00
46.00
17.00
8.00
60.00
47.00
19.00
10.00
61.00
46.00
19.00
10.00
61.00
12.00
4.00
4.00
5.00
13.00
5.00
4.00
5.00
14.00
5.00
4.00
5.00
15.00
5.00
4.00
6.00
6.00
3.00
10.00
0.00
6.00
4.00
11.00
1.00
6.00
4.00
11.00
2.00
6.00
5.00
10.00
2.00
17.00
23.00
23.00
22.00
68.00
66.00
70.00
68.00
2.00
2
00
2.00
10.00
4.00
1.00
2.00
3.00
2.00
1.00
2.00
2
00
2.00
11.00
4.00
1.00
2.00
3.00
2.00
1.00
2.00
2
00
2.00
11.00
4.00
1.00
2.00
3.00
2.00
1.00
2.00
2
00
2.00
10.00
4.00
1.00
2.00
3.00
2.00
1.00
283.00
297.00
309.00
306.00
Source: City of Solon, Ohio Payroll Department W2 Audit Lising
Method: Using 1.0 for each full-time employee at December 31.
No part-time or seasonal employees are included.
- S24 -
2007
2006
46.00
16.00
10.00
61.00
46.00
16.00
10.00
61.00
16.00
5.00
3.00
7.00
2005
2004
2003
2002
46.00
15.00
10.00
61.00
46.00
15.00
10.00
61.00
45.00
15.00
12.00
60.00
45.00
15.00
12.00
61.00
16.00
5.00
3.00
7.00
16.00
5.00
3.00
7.00
14.00
5.00
3.00
7.00
14.00
5.00
3.00
7.00
13.00
4.00
3.00
7.00
6.00
6.00
8.00
2.00
6.00
6.00
8.00
2.00
6.00
7.00
8.00
1.00
6.00
8.00
9.00
2.00
6.00
8.00
10.00
2.00
5.00
7.00
9.00
2.00
24.00
23.00
24.00
24.00
24.00
24.00
67.00
65.00
64.00
66.00
67.00
67.00
2.00
2
00
2.00
11.00
4.00
1.00
2.00
3.00
2.00
1.00
2 00
2.00
2.00
11.00
4.00
1.00
1.00
3.00
2.00
1.00
2 00
2.00
2.00
11.00
4.00
1.00
1.00
2.00
2.00
1.00
2 00
2.00
2.00
11.00
4.00
1.00
1.00
2.00
2.00
1.00
2 00
2.00
2.00
11.00
4.00
1.00
1.00
2.00
2.00
1.00
2 00
2.00
2.00
10.00
4.00
1.00
1.00
2.00
2.00
1.00
305.00
301.00
299.00
302.00
304.00
299.00
- S25 -
City of Solon, Ohio
Operating Indicators by Function/Program
Last Eight Years (1)
Function/Program
Security of Persons & Property
Police
Number of traffic citations issued
DUI Arrests
Prisoners Processed
Fire
Fire Responses
EMS Calls
Safety Inspections
Plan Reviews
Leisure Time Activities
Parks and Recreation
Community Center Memberships
Summer Camp Participants
Baseball/Softball Teams
Senior Services
Total Participation Hours
Arts Center
Class Registrations
Percentage of Solon Residents
Grantwood Golf Course
Rounds Played (18 holes)
Rounds Played (9 holes)
g Balls
Buckets of Range
Community Environment
Building
Building Permits Issued
Basic Utility Services
Waste Water Treatment
Average Daily Flow (millions of gallons)
Transportation
Service
Tons of Salt Purchased
Tons of Rubbish Collected
Tons of Leaves Collected
Tons of Recycling Materials Collected
General Government
City Council
Ordinances or Resolutions Introduced
Finance
Accounts Payable Checks Processed
Purchase Orders Issued
Network Administration
Computer Workstations
(1)
2011
2010
2008
3,744
132
1,732
4,673
118
1,521
4,266
126
1,376
4,743
135
1,445
746
1,726
1,529
247
737
1,789
1,589
150
785
1,725
1,703
231
753
1,831
2,600
293
8,341
1,201
81
8,495
1,248
99
9,550
1,295
108
9,950
1,475
117
36,817
31,678
84,233
73,216
3,160
79%
3,274
81%
3,508
83%
3,040
87%
14,025
10,967
,
6,525
12,021
17,148
,
8,870
12,649
19,289
,
10,342
12,464
19,398
,
11,291
793
819
706
726
4.131
3.733
3.291
3.787
10,119
7,835
2,590
1,422
16,000
7,868
2,100
1,334
12,700
8,147
2,788
1,199
11,509
8,987
1,752
1,069
255
286
311
372
9,333
4,829
9,547
4,355
10,838
4,880
10,525
4,828
237
235
235
225
Information prior to 2004 is not available.
Source:
2009
Information provided by various departments at the City of Solon
- S26 -
2007
2006
2005
2004
4,672
117
1,489
4,901
109
1,472
4,431
128
1,124
4,477
127
1,323
833
1,844
2,763
287
705
1,739
2,408
273
841
1,695
1,471
259
820
1,541
999
234
10,600
1,520
118
11,056
1,500
136
11,534
1,585
138
10,201
1,582
137
59,239
45,664
46,831
31,533
2,683
88%
2,332
83%
1,713
77%
1,447
79%
12,598
20,492
,
11,222
12,266
20,720
,
11,439
13,485
21,645
,
12,616
14,354
20,748
,
16,073
775
819
923
758
3.957
4.045
4.112
4.024
9,497
12,255
4,351
1,573
7,515
11,309
5,510
987
17,970
11,590
6,395
727
12,888
11,980
3,850
594
324
311
302
288
10,022
4,523
9,971
4,698
10,272
4,805
10,627
5,067
217
205
200
196
- S27 -
City of Solon, Ohio
Capital Assets Statistics by Function/Program
Last Eight Years (1)
Function/Program
2011
2010
2009
2008
37,168
28
37,168
27
37,168
25
37,168
24
37,168
16,200
9,610
19
37,168
16,200
9,610
21
37,168
16,200
9,610
21
37,168
16,200
9,610
23
92,500
7
92,500
7
92,500
7
92,500
8
4
4
6
5
15,000
15,000
15,000
15,000
7,200
5,000
1
7,200
5,000
1
7,200
5,000
1
7,200
5,000
1
2
2
2
2
4
4
5
5
9
8
8
9
Basic Utility Services
Waste Water Treatment
Square Footage of Buildings
Vehicles
56,000
12
56,000
12
56,000
12
56,000
13
Transportation
Service
Square Footage of Building
Vehicles
70,461
71
70,461
70
70,461
73
70,461
67
General Government
City Hall
Square Footage of Building
Mayor's Vehicle
Tax/Finance's Vehicle
Network Adminstration's Vehicle
City Hall Vehicle
55,950
1
1
1
1
55,950
1
1
1
1
55,950
1
1
1
1
55,950
1
1
1
1
Security of Persons and Property
Police
Square Footage of Station
Vehicles
Fire
Square Footage of Station #1
Square Footage of Station #2
Square Footage of Station #3
Vehicles
Leisure Time Activities
Parks and Recreation
Square Footage of Community Center
Vehicles
Senior Services
Vehicles
Arts Center
Square Footage of Building
Grantwood Golf Course
Square Footage of Clubhouse
Square Footage of Maintenance Building
Vehicles
Community Environment
Planning Department
Vehicles
Building Department
Vehicles
Engineering Department
Vehicles
(1) Information prior to 2004 is not available.
Source:
Information provided by various departments at the City of Solon
- S28 -
2007
2006
2005
2004
37,168
24
37,168
24
37,168
24
37,168
23
37,168
16,200
9,610
22
37,168
9,000
9,610
21
37,168
9,000
9,610
21
37,168
9,000
9,610
21
92,500
8
92,500
7
92,500
7
92,500
7
3
4
4
3
15,000
15,000
15,000
15,000
7,200
5,000
1
7,200
5,000
1
7,200
5,000
1
7,200
5,000
1
2
2
2
2
5
5
5
5
9
8
8
8
56,000
13
56,000
13
56,000
14
56,000
15
70,461
66
70,461
58
70,461
64
70,461
68
55,950
1
1
1
1
55,950
1
1
1
1
55,950
1
1
0
1
55,950
1
1
0
1
- S29 -
(This Page Intentionally Left Blank)
- S30 -
CITY OF SOLON
CUYAHOGA COUNTY
CLERK’S CERTIFICATION
This is a true and correct copy of the report which is required to be filed in the Office of the
Auditor of State pursuant to Section 117.26, Revised Code, and which is filed in Columbus, Ohio.
CLERK OF THE BUREAU
CERTIFIED
JULY 10, 2012
88 East Broad Street, Fifth Floor, Columbus, Ohio 43215‐3506 Phone: 614‐466‐4514 or 800‐282‐0370 Fax: 614‐466‐4490 www.auditor.state.oh.us


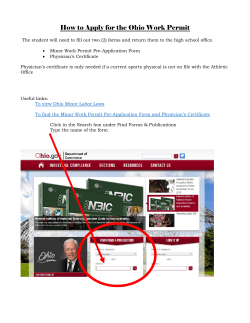


© Copyright 2026