
Quantitative Determination of Testosterone in Plasma Using Unique Automated Online Sample
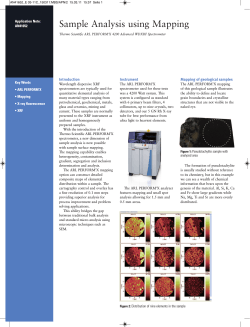
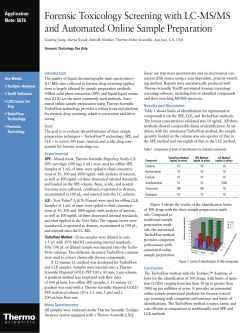
Application
Note: 490b
Quantitative Determination of Testosterone in
Plasma Using Unique Automated Online Sample
Preparation and LC-MS/MS
Marta Kozak, Thermo Fisher Scientific, San Jose, CA, USA
For Research Use Only. Not for use in diagnostic procedures.
Introduction
• TurboFlow
Technology
Goal
The goal is to develop an automated, interference-free LCMS/MS method to quantitate testosterone with a low limit
of quantitation (LOQ) in plasma. The method utilizes the
analytical speed of the Thermo Scientific Transcend
system, powered by TurboFlow™ automated, online
sample preparation technology, coupled with a triple stage
quadrupole mass spectrometer.
Experimental
Sample Preparation
A 100 µL aliquot of plasma was mixed with 100 µL of
methanol containing testosterone-d3 (internal standard)
and precipitated in ice for 10-15 minutes. The resulting
plasma was centrifuged at 12,000 rpm for 10 minutes at
4 °C. Calibrators were prepared in double charcoalstripped plasma at six concentration levels from 10 pg/mL
to 500 pg/mL.
Method performance summary
Target Analyte
Matrix
LOD
LOQ
Recovery
Assay Linearity
Precision (%CV)
Carryover at LLOQ
Sample Volume
Analysis Time
Testosterone
Plasma
3 pg/ mL
10 pg/mL
> 90%
10 – 500 pg/mL
1% to 7% (10% at LLOQ)
< 20%
100 µL
10 minutes
1.50
1.45
Standard
Y = 0.0187183+0.00269886*X R^2 = 0.9999 W: 1/X
1.40
% Difference
10 pg/mL
1.35
HPLC
HPLC analysis was performed using the Transcend™
TLX-1 system. Plasma samples were extracted using a
TurboFlow™ Cyclone P column (1 x 50 mm).
Chromatographic separation was performed using a
Thermo Scientific Hypersil GOLD aQ column
(100 x 2.1 mm, 5µm). A gradient liquid chromatography
method was used.
-0.80
1.30
1.25
1.20
1.15
1.10
1.05
1.00
20 pg/mL
1.89
50 pg/mL
-3.03
100 pg/mL
1.35
Figure 1: Testosterone
calibration curve
0.95
0.90
250 pg/mL
0.83
500 pg/mL
-0.45
0.85
0.80
0.75
0.70
0.65
0.60
0.55
M – 364 pg/mL
0.50
0.45
N – 384 pg/mL
0.40
0.35
RT: 4.26
AA: 15393
SN: 1004
0.30
100
RT: 4.21
AA: 15145
SN: 900
100
0.25
95
95
90
0.20
90
85
0.15
85
80
0.10
80
75
0.05
75
70
0.00
70
0
50
100
150
200
250
300
350
400
450
500
65
pg/mL
65
550
60
60
55
R e la tiv e A b u n d a n c e
• Clinical Research
55
50
45
50
45
40
40
35
35
30
30
25
25
20
20
3.98
15
15
3.34 3.62
3.38
10
4.05
3.55
Mass Spectrometry
MS analysis was carried out on a Thermo Scientific TSQ
Vantage triple stage quadrupole mass spectrometer with a
Thermo Scientific Ion MAX source and atmospheric
pressure chemical ionization (APCI) probe in the positive
ionization mode. The selective reaction monitoring (SRM)
mode was used for mass spectrometry detection.
Results and Discussion
Figure 1 shows the linear calibration curve for
testosterone. The R2 value is 0.9999, which indicates an
excellent linear fit over the dynamic range of 10 – 500
pg/mL. Figure 2 shows the results for four unknown
samples. Table 1 compares these results to the averaged
results from three other laboratories. The outside labs
5
2.11
2.75
2.35 2.52
2.95
3.80
4.38
4.50
4.83
10
4.44
3.22
4.52 4.69
4.81
4.88 5.06
5.47 5.63
5.82
6.05 6.34
6.43
6.69
5
0.48 0 .6 7 0.92
6.82
0
2.5
3.0
3.5
4.0
4.5
Time (min)
5.0
5.5
6.0
6.5
7.0
0
1
2 .5 4
RT: 4.23
AA: 28142
SN: 1479
100
2
4.90 5.40
3.23
3
4
6
8 . 2 2 8.60
7.61
7
9.07
8
9.61 9 .9 9
9
10
95
90
90
85
85
80
80
75
75
70
70
65
65
60
60
55
55
50
45
40
50
45
40
35
35
30
30
3.44
25
25
20
3.54
4.05 4.08
3.39
3.33
20
15
3.59
4.39
3.85
15
4.53 4.77
4.84
3.34
10
10
4.03
4.47
3.47 3.54 3.79
5
2 .1 0
2.31
2.63
2 .9 4
4.53
3.23
4.73 4.81
2.01 2.16
2.82
2.46
2.68
2.90
4.94 5.12
3.15
5.32
5.56
5.74 5.83
6.15
6.39
6.72
2.5
3.0
3.5
4.0
4.5
Time (min)
5.0
5.5
6.0
6.5
7.0
2.0
2.5
3.0
3.5
Table 1: Comparison of results for four unknown samples
Current Method (pg/mL) Other Laboratories (pg/mL)
R* is a gel-tube sample.
5.67 5.82
5.98
6.77
6.14 6.25
6.74
6.98
0
2.0
36
38
55
18
5.43 5.46
5
4.96
0
M
N
O
R*
5.98 6.10 6.58 7.05
RT: 4.24
AA: 3692
SN: 292
100
95
Sample
5
Time (min)
R* – 184 pg/mL
O – 546 pg/mL
Figure 2: SRM
chromatograms for
four unknown samples
1.59 1.81
0
2.0
R e la tive A b u n d a nc e
• Endocrinology
An automated method utilizing online sample preparation
coupled with a triple stage quadrupole mass spectrometer
met analytical requirements. The results correlated well
with conventional (LLE) sample preparation methods. The
method is interference-free and robust. The entire analysis
in plasma samples can be done in 10 minutes, with a
quantitation limit of 10 pg/mL and linearity range from
10 to 500 pg/mL. Analytical throughput can be increased
by implementing a 2-channel (TLX-2) or 4-channel (TLX4) column multiplexing system in clinical research.
R e la tiv e A b u n d a n c e
• TSQ Vantage
Conclusion
R e la tive A b u n d a n c e
• Transcend
System
used either SPE or LLE sample preparation. Ion ratios
were used for confirmation.
Area Ratio
Key Words
Testosterone quantitative methods require a limit of
quantitation of 10 pg/mL in plasma. The commonly-used
liquid-liquid extraction (LLE) technique for sample
preparation consists of multiple steps (including
evaporation). It is neither time- nor cost-efficient. We have
developed a fast and cost-efficient online sample
preparation method implementing Thermo Scientific
TurboFlow technology for clinical research purposes.
32
36
61
13
4.0
4.5
Time (min)
5.0
5.5
6.0
6.5
7.0
In addition to these
offices, Thermo Fisher
Scientific maintains
a network of representative organizations
throughout the world.
Africa-Other
+27 11 570 1840
Australia
+61 2 8844 9500
Austria
+43 1 333 50 34 0
Belgium
+32 53 73 42 41
Canada
+1 800 530 8447
China
+86 10 8419 3588
Denmark
+45 70 23 62 60
Europe-Other
+43 1 333 50 34 0
Finland / Norway /
Sweden
+46 8 556 468 00
France
+33 1 60 92 48 00
Germany
+49 6103 408 1014
India
+91 22 6742 9434
Italy
+39 02 950 591
Japan
+81 45 453 9100
Latin America
+1 608 276 5659
Middle East
+43 1 333 50 34 0
Netherlands
+31 76 579 55 55
South Africa
+27 11 570 1840
Spain
+34 914 845 965
Switzerland
+41 61 716 77 00
UK
+44 1442 233555
USA
+1 800 532 4752
www.thermoscientific.com
Legal Notices
©2010 Thermo Fisher Scientific Inc. All rights reserved. All trademarks are the property of Thermo Fisher Scientific Inc. and its subsidiaries. This information
is presented as an example of the capabilities of Thermo Fisher Scientific Inc. products. It is not intended to encourage use of these products in any manners
that might infringe the intellectual property rights of others. Specifications, terms and pricing are subject to change. Not all products are available in all
countries. Please consult your local sales representative for details.
Thermo Fisher Scientific,
San Jose, CA USA is ISO Certified.
AN62945b_E 04/10S
Part of Thermo Fisher Scientific


© Copyright 2026