
Sample Analysis using Mapping Instrument Mapping of geological samples Introduction
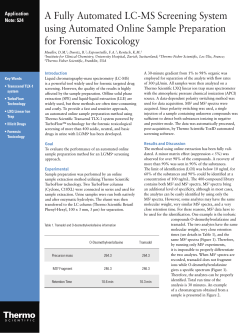
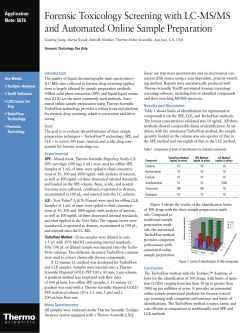
AN41652_E 03-11C_150311:MBS/APN/2 15.03.11 15:57 Seite 1
Application Note:
AN41652
Sample Analysis using Mapping
Thermo Scientific ARL PERFORM’X 4200 Advanced WDXRF Spectrometer
Key Words
• ARL PERFORM’X
• Mapping
• X-ray fluorescence
• XRF
Introduction
Instrument
Mapping of geological samples
Wavelength dispersive XRF
spectrometers are typically used for
quantitative elemental analysis of
many material types ranging from
petrochemical, geochemical, metals,
glass and ceramics, mining and
cement. These samples are normally
presented to the XRF instrument as
uniform and homogenously
prepared samples.
With the introduction of the
Thermo Scientific ARL PERFORM’X
spectrometer, a new dimension of
sample analysis is now possible
with sample surface mapping.
The mapping capability enables
heterogeneity, contamination,
gradient, segregation and inclusion
determination and analysis.
The ARL PERFORM’X mapping
option can construct detailed
composite maps of elemental
distribution within a sample. The
cartography control and overlay has
a fine resolution of 0.1 mm steps
providing superior analysis for
process improvement and problem
solving applications.
This ability bridges the gap
between traditional bulk analysis
and standard micro-analysis using
microscopic techniques such as
SEM.
The ARL PERFORM’X
spectrometer used for these tests
was a 4200 Watt system. This
system is configured as standard
with 6 primary beam filters, 4
collimators, up to nine crystals, two
detectors, and our 5 GN Rh X-ray
tube for best performance from
ultra light to heaviest elements.
The ARL PERFORM’X mapping
of this geological sample illustrates
the ability to define and locate
grain boundaries and crystalline
structures that are not visible to the
naked eye.
Figure 1: Pseudotachylite sample with
analyzed area
The ARL PERFORM’X analyzer
features mapping and small spot
analysis allowing for 1.5 mm and
0.5 mm areas.
The formation of pseudotachylite
is usually studied without reference
to its chemistry, but in this example
we can see a wealth of chemical
information that bears upon the
genesis of the material. Al, Si, K, Ca
and Fe show large gradients while
Na, Mg, Ti and Sr are more evenly
distributed.
Figure 2: Distribution of nine elements in the sample
AN41652_E 03-11C_150311:MBS/APN/2 15.03.11 15:57 Seite 2
Another example is shown in
Figures 3 and 4 with a feldspar
sample having a clear
inhomogeneous structure.
The ARL PERFORM’X identifies
the element constituents in the
selected section of the sample.
In addition to these
offices, Thermo Fisher
Scientific maintains
a network of representative
organizations throughout
the world.
Africa-Other
+27 11 570 1840
Australia
+61 3 9757 4300
Austria
+43 1 333 50 34 0
Belgium
+32 53 73 42 41
Canada
+1 800 530 8447
Figure 3: Heterogeneous feldspar sample
seen in the 30mm aperture sample holder
Figure 4: Distribution of eight elements in the sample
The interesting aspect of this
analysis is in the differences of
chemistry of the two feldspars, and
how the plagioclase comes to
mantle the earlier alkali feldspar.
The chemistry gives a lot of basic
information regarding this process.
packages. These packages allow for
quantitative data to be obtained for
completely unknown samples.
As in many real life situations,
obtaining any or enough standards
to create a calibration is not always
possible. This is certainly the case
when analyzing defects or unknown
contamination. In such situations,
we can offer the most comprehensive
standard-less software on the market:
Thermo Scientific UniQuant package.
It is a factory calibration based
on 64 pure element standards that
allows for concentration
determination of unknown samples
in any matrix by using complex
mathematical algorithms for up to
79 elements. These algorithms
correct for matrix effects as well as
Mapping of metallic samples
Mapping can be used for easy
identification and quantification of
contamination or metallic inclusions
as shown in Figures 5 to 8.
Standard-less analysis for
mapping
The most useful development of
XRF analytical programs has been
the availability of "standard-less"
China
+86 10 8419 3588
inter-elemental effects to provide a
precise quantitative result.
Denmark
+45 70 23 62 60
Europe-Other
+43 1 333 50 34 0
Finland / Norway / Sweden
+46 8 556 468 00
Conclusion
The elemental mapping capability
is a very interesting tool for all
applications dealing with
heterogeneity or concentration
gradients in samples as well as when
impurities or inclusions are found in
given specimens. It is seen that
analysis using mapping can easily
be performed with the ARL
PERFORM’X sequential XRF
spectrometer.
Operation is made easy through
the state-of-the-art Thermo Scientific
OXSAS software which is able to
operate with the latest Microsoft
Windows® 7 packages.
France
+33 1 60 92 48 00
Germany
+49 6103 408 1014
India
+91 22 6742 9434
Italy
+39 02 950 591
Japan
+81 45 453 9100
Latin America
+1 561 688 8700
Middle East
+43 1 333 50 34 0
Netherlands
+31 76 579 55 55
New Zealand
+64 9 980 6700
Russia/CIS
+43 1 333 50 34 0
South Africa
+27 11 570 1840
Spain
+34 914 845 965
Switzerland
+41 21 694 71 11
UK
+44 1442 233555
USA
+1 800 532 4752
To see our complete X-ray
product portfolio, visit
www.thermoscientific.com/xray
Thermo Fisher Scientific (Ecublens) SARL,
Switzerland is ISO certified.
Figure 5: Selected area
for mapping in green
Figure 6: Distribution of Cr
Figure 7: Distribution of Cu
Figure 8: Distribution of Fe
© 2011 Thermo Fisher Scientific Inc. All
rights reserved. Windows is a registered
trademark of Microsoft Corp. in USA and
other countries. All other trademarks are
the property of Thermo Fisher Scientific
Inc. and its subsidiaries.
AN41652_E 03/11C
Part of Thermo Fisher Scientific


© Copyright 2026