
BIOINFORMATICS ORIGINAL PAPER Strelka: accurate somatic small-variant calling from sequenced tumor–normal sample pairs
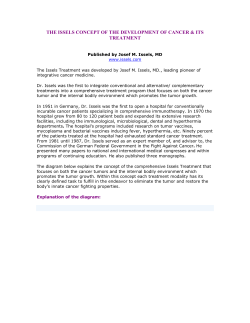
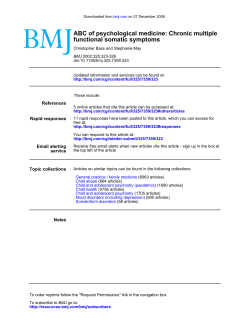
Copyedited by: TRJ
BIOINFORMATICS
MANUSCRIPT CATEGORY: ORIGINAL PAPER
ORIGINAL PAPER
Genome analysis
Vol. 28 no. 14 2012, pages 1811–1817
doi:10.1093/bioinformatics/bts271
Advance Access publication May 10, 2012
Strelka: accurate somatic small-variant calling from sequenced
tumor–normal sample pairs
Christopher T. Saunders1,∗ , Wendy S. W. Wong2 , Sajani Swamy1 , Jennifer Becq2 ,
Lisa J. Murray2 and R. Keira Cheetham2
Inc., 5200 Illumina Way, San Diego, CA 92122, USA and 2 Illumina Cambridge Ltd., Chesterford Research
Park, Little Chesterford, Essex CB10 1XL, UK
1 Illumina,
Associate Editor: Michael Brudno
Received on December 15, 2011; revised on March 29, 2012;
accepted on May 1, 2012
1
INTRODUCTION
Driven by declining sequencing costs, human tumor sequencing
has recently progressed from surveys of selected coding regions
(Sjöblom et al., 2006) to entire genomes (Ley et al., 2008; Pleasance
et al., 2010), and onwards to increasingly routine genome and
exome sequencing of diverse tumor samples (Meyerson et al.,
2010). A principal goal of such experiments is the identification
of somatic variants arising in the tumor, typically by comparing the
tumor sequence to that of a matched normal sample. The increasing
number of such paired tumor–normal sequencing experiments has
put greater demand on the accuracy and efficiency of somatic variant
∗ To
whom correspondence should be addressed.
calling methods, particularly for SNVs and small indels where the
number of somatic variants can easily overwhelm manual review. An
additional challenge for somatic variant calling on matched tumor–
normal samples is robust handling of impurity and copy-number
variation in the tumor sample, ideally without requiring external
purity estimates.
The somatic variant calling problem addressed in this study
requires the identification of alleles in a tumor which do not occur in
the host’s germline. This apparently simple process is confounded
by at least two factors. The first is that germline variants can
outnumber somatic variants by several orders of magnitude [e.g.
Pleasance et al. (2010)], so any tendency to mistake germline
variation as somatic can substantially contaminate the somatic
variant predictions. A second complicating factor is variability in
the somatic allele frequencies due to the presence of normal cells in
the tumor sample, copy number variation and tumor heterogeneity.
In earlier work somatic variants have been detected by
independently genotyping both samples and subtracting the results,
an approach which can provide reasonable predictions for cell lines
because the aforementioned variability in somatic allele frequency
is reduced for this case. For the general case, a joint analysis
of both samples should improve results by facilitating tests for
candidate somatic alleles in both samples (especially important
for indels) and enabling better representation of sequencing noise
and tumor impurity. Two prevalent approaches to joint sample
analysis are (i) to use joint diploid genotype likelihoods for both
samples and (ii) to disregard such genotype structure and test
whether a shared allele frequency between the two samples can
be rejected. An implementation of the first approach is available
in the SomaticSniper package (Larson et al., 2012), whereas the
second approach is implemented in VarScan, which applies Fisher’s
exact test to the sample allele frequencies (Koboldt et al., 2009).
Note that these approaches to joint sample analysis stand in
contrast to solutions addressing the related problem of independent
tumor sample analysis, such as in SNVMix (Goya et al., 2010),
although both cases share the challenge of non-diploid tumor allele
frequencies.
In this study we describe Strelka, a somatic variant detection
workflow designed to accurately and efficiently identify somatic
SNVs and small indels from aligned sequencing reads of matched
tumor–normal samples. Strelka is based on a novel Bayesian
approach wherein the tumor and normal allele frequencies are treated
as continuous values, with the normal sample represented as a
mixture of diploid germline variation with noise, and the tumor
© The Author 2012. Published by Oxford University Press. All rights reserved. For Permissions, please email: [email protected]
[10:32 18/6/2012 Bioinformatics-bts271.tex]
Downloaded from http://bioinformatics.oxfordjournals.org/ by guest on October 6, 2014
ABSTRACT
Motivation: Whole genome and exome sequencing of matched
tumor–normal sample pairs is becoming routine in cancer research.
The consequent increased demand for somatic variant analysis of
paired samples requires methods specialized to model this problem
so as to sensitively call variants at any practical level of tumor
impurity.
Results: We describe Strelka, a method for somatic SNV and
small indel detection from sequencing data of matched tumor–
normal samples. The method uses a novel Bayesian approach which
represents continuous allele frequencies for both tumor and normal
samples, while leveraging the expected genotype structure of the
normal. This is achieved by representing the normal sample as a
mixture of germline variation with noise, and representing the tumor
sample as a mixture of the normal sample with somatic variation.
A natural consequence of the model structure is that sensitivity
can be maintained at high tumor impurity without requiring purity
estimates. We demonstrate that the method has superior accuracy
and sensitivity on impure samples compared with approaches based
on either diploid genotype likelihoods or general allele-frequency
tests.
Availability: The Strelka workflow source code is available at
ftp://[email protected]/.
Contact: [email protected]
Supplementary information: Supplementary data are available at
Bioinformatics online
1811
Page: 1811
1811–1817
Copyedited by: TRJ
MANUSCRIPT CATEGORY: ORIGINAL PAPER
C.T.Saunders et al.
2
METHODS
Fig. 1. Overview of the Strelka somatic variant calling workflow. The
process begins with sorted and PCR-duplicate marked sequences in BAM
format (Li et al., 2009) for the tumor and normal samples, and ultimately
produces a set of somatic SNV and indel calls in variant call format (VCF;
Danecek et al., 2011)
2.1 Sequencing and data preparation
The tumor and matched normal samples used in this study are the metastatic
melanoma cell line COLO-829 and COLO-829BL, a lymphoblastoid line
derived from the same patient. These samples were sequenced to produce
paired-end 100 base reads on Illumina HiSeq instruments using TruSeq v3
chemistry. The samples were sequenced on two flowcells, AB01DHACXX
and BB0065ACXX, hereafter referred to as flowcells 1 and 2, respectively.
All analyses in this study are based on four lanes of COLO-829 and three
lanes of COLO-829BL from flowcell 1 and four lanes of each sample from
flowcell 2. The sequences were aligned, PCR-duplicate marked and sorted
into BAM format using CASAVA 1.8 (http://www.illumina.com/documents/
products/technotes/technote_eland_variantcalling_improvements.pdf). The
alignment and all subsequent analyses in this study use the hg19 human
reference genome. The sequencing data for both samples have been deposited
at the European Genome-Phenome Archive (http://www.ebi.ac.uk/ega/)
under accession number EGAS00001000245.
2.2 Strelka workflow
2.2.1 Candidate indel detection The first step in Strelka’s workflow
(Fig. 1) is a search for candidate indels to be used in the subsequent
realignment and somatic indel calling steps. Any indel can become a
candidate unless: (i) the number of reads containing the indel in the combined
tumor and normal samples is <3 (ii) the number of reads containing the indel
in both of the individual samples is <10% of the total depth for indels shorter
than 5 bases, or <2% otherwise. This search process produces a single shared
candidate indel set used to realign both samples.
2.2.2 Realignment Reads are realigned following candidate indel
detection. Different aspects of the realignment results are used for SNV
and indel calling. The somatic SNV calling uses one exemplar alignment for
each read based on the alignment probability computed from the basecall
qualities. If there are nearly equiprobable alignments for either end of the
read, the ambiguous segments are marked as soft-clipped and not used for
SNV calling. For somatic indel calling, the search process provides the best
alignments for each read when the candidate indel is included and excluded.
The two resulting alignment scores form the basis of the single-sample
indel likelihood computation. Realignment search details are described in
Supplementary Methods.
2.2.3 Somatic caller overview Following realignment, the somatic variant
caller uses the read alignment information from both samples to produce a
somatic variant probability. The somatic caller models allele frequencies
rather than diploid genotypes, representing the normal sample as a mixture
of diploid germline variation with noise, and the tumor sample as a mixture
of the normal sample with somatic variation. The somatic variant probability
produced by this model is not used directly because it detects many variants
in loss of heterzygosity (LOH) or copy number change regions. Instead,
each call is reported using the joint probability of a somatic variant and a
specific genotype in the normal sample, summarized as a quality score. In this
study the somatic calls are selected to have a homozygous reference normal
genotype, thus the quality scores discussed below express the probability that
each variant is both somatic and has a homozygous reference genotype in
the normal sample. An additional feature of the somatic caller is that it uses
two calling tiers to reduce false positives. The first tier (tier1) is a set of input
data filtration and model parameter settings with relatively stringent values,
whereas the second tier (tier2) uses more permissive settings. All calls are
initially made using tier1 settings, after which the variant is called again
using tier2. Strelka reports the minimum of the two somatic call qualities:
Q = min(Qtier1 ,Qtier2 ).
Filtration of input reads is substantially influenced by these calling tiers. At
tier1, Strelka removes all read pairs with a mapping quality <40, in addition
to read pairs with only a single end mapped or with an anomalous insert size.
At tier2 only read pairs with a mapping quality <5 are removed from the
input. Note that tier1 thresholds are applied to the reads which determine
the candidate indel set, however all reads participate in the subsequent
realignment step.
Downloaded from http://bioinformatics.oxfordjournals.org/ by guest on October 6, 2014
sample represented as a mixture of the normal sample with somatic
variation. Beyond the core modeling scheme, the Strelka workflow
is designed to improve accuracy by jointly performing indel search
and read realignment in the context of both samples. The model is
structured to account for any level of allele frequency variation in
the tumor sample without requiring purity estimates.
We test Strelka’s somatic variant predictions together with
alternate calling approaches to estimate accuracy and sensitivity
on a tumor cell line and a mixture of tumor cell line and normal
sequences designed to simulate an impure tumor sample. This
analysis suggests that Strelka’s results are comparable to or better
than existing methods for both somatic SNV and indel prediction
on the pure cell line, while demonstrating Strelka’s distinguishing
characteristic, per its design, of robust call sensitivity on the lowpurity sample. Strelka is designed for production use on very large
sample sets, and thus achieves these results as a single workflow
with reasonable computational efficiency: for the largest dataset
analyzed in this study the method completes somatic variant analysis
in 81 core-hours given roughly 180-fold human genome sequencing
coverage from the combined tumor and normal samples.
2.2.4 Post-call filtration The somatic calling model accounts for only a
few common error terms detectable from the local sequence context. To
approximately handle other error types, filters are applied to the raw SNV
and indel calls as the final step of Strelka’s workflow. All results discussed in
this study pertain to the filtered variants. Strelka filters the following variant
calls: (i) All calls with a normal sample depth >3 times the chromosomal
mean (meant to remove e.g. pericentromeric regions) (ii) Somatic SNVs
where, in either sample, >40% of basecalls have been filtered out by the
mismatch density filter (see Supplementary Methods) (iii) Somatic SNVs
where more than 75% of intersecting reads are spanning deletions across
1812
[10:32 18/6/2012 Bioinformatics-bts271.tex]
Page: 1812
1811–1817
Copyedited by: TRJ
MANUSCRIPT CATEGORY: ORIGINAL PAPER
Somatic variant calling with Strelka
the call site (iv) Somatic indels with a reference repeat count >8 (i.e. the
indel is an expansion/contraction of a homopolymer longer than 8 bases,
a dinucleotide repeat longer than 16 bases, etc.) (v) Somatic indels where
>30% of basecalls have been filtered out in a window extending 50 bases
to either side of the indel’s call position (vi) Somatic indels overlapping
‘interrupted homopolymers’ of length >15. An interrupted homopolymer is
the longest homopolymer intersecting or adjacent to the called indel when a
single non-homopolymer base is allowed.
2.3
Somatic variant calling model
For both SNVs and indels, the somatic calling model approximates a
posterior probability on the joint tumor and normal allele frequencies.
P(ft ,fn | D) ∝ P(D | ft ,fn )P(ft ,fn )
ft ,fn
where Is (ft ,fn ) is the somatic state indicator function. As previously
discussed, this somatic variant probability is not ideal for detecting variants
of interest because it does not distinguish somatic variant types. We therefore
associate somatic calls with the joint probability of somatic variation and the
normal sample genotype P(S,Gn |D) = P(S|D)P(Gn |Dn ), with the normal
sample diploid genotype posterior P(Gn |Dn ) computed using a conventional
single-sample Bayesian approach detailed in Supplementary Methods. The
Strelka workflow uses two calling tiers, thus all somatic calls are classified
according to their most-likely normal genotype if that value is the same in
tiers 1 and 2, and classified as conflicts otherwise. As noted in the somatic
caller overview, all analyses in this study are restricted to somatic calls
with homozygous reference normal genotypes, thus all Strelka quality scores
discussed below express P(S,Gn = ‘ref/ref’|D).
2.3.1 Joint allele-frequency prior The prior probability on the tumor
and normal allele-frequencies P(ft ,fn ) encodes the concept that the normal
sample is a mixture of diploid germline variation and noise whereas the
tumor sample is a mixture of the normal sample and somatic variation.
For each sample, the allele frequencies must sum to one and have at
most two non-zero values. For SNV calling the alleles are the four bases
{A,C,G,T}, whereas for indel calling there are two alleles, the indel and the
reference. The allele frequency term f also includes a strand-bias indicator
variable f (sb ), where f (sb ) = 1 designates that the non-reference allele occurs
at the indicated frequency on one strand only, and all alleles are modeled
as strand-symmetric otherwise. The term f ∗ refers to the allele frequencies
from f without the strand-bias variable. Note that strand-bias is currently
modeled for SNVs but not indels.
The marginal prior for the normal sample frequencies is a mixture of
expected diploid variation with a noise term P(fn ) = Pdiploid (fn )(1−μ)+
Pnoise (fn )μ. The noise term abstracts various sequencing, read mapping and
assembly issues which could produce an unexpected allele frequency shared
in the tumor and normal samples. For the SNV and indel models the noise
contribution is set to μSNV = 5×10⁻⁷ and μindel = 1×10⁻⁷ . Given P(fn ), the
joint frequency prior is
⎧
⎨ P(fn )(1−P(S)) if fn = ft
P(ft ,fn ) = P(fn )P(S)U (ft∗ ) if fn = ft ,fn (sb ) = 0,ft (sb ) = 0
⎩
0 otherwise
where the heterozygosity terms are θSNV = 1×10⁻³ and θindel = 1×10⁻⁴ .
The normal sample noise distribution is a mixture of conventional and
single-strand noise
Pnoise (fn ) = (1−σ )Pnoise (fn∗ | fn (sb ) = 0)+σ Pnoise (fn∗ | fn (sb ) = 1)
where σ is the single-strand noise fraction, set to 0.5 for snvs and 0 for
indels.
The strand-symmetric noise component Pnoise (fn∗ | fn (sb ) = 0) is uniform
over the allowed frequency space f ∗ , but re-weighted such that the
probability mass of each frequency axis (the frequency distribution between
each allele pair) matches the distribution among frequency axes in
Pdiploid (fn ).
The strand-bias noise component Pnoise (fn∗ | fn (sb ) = 1) is non-zero for a
subset of the allele frequencies, allowing mixtures of the reference allele
with one non-reference allele at a frequency of ≤0.5. The strand-bias noise
prior is uniform over this allowed frequency subset.
2.3.2 Practical computation The continuous allele frequencies modeled
above are efficiently computed by dividing each allele-pair axis into a set of
equidistant points and performing the somatic probability computation over
the resulting discrete point set. Several point resolutions were attempted
to confirm the expected stability and convergence of results as resolution
increased. A resolution of 11 points per axis is used for all computations in
this study, We expect that this resolution should be increased for improved
detection of somatic allele frequencies lower than 10%.
Downloaded from http://bioinformatics.oxfordjournals.org/ by guest on October 6, 2014
Here ft ,fn refer to the tumor and normal allele frequencies and D are the
sequencing data from both samples. The likelihood term above is computed
from independent sample-specific allele frequency likelihoods, P(D|ft ,fn ) =
P(Dt |ft )P(Dn |fn ), where Dt and Dn indicate tumor and normal sample data.
The single-sample SNV and indel likelihoods could in principal be supplied
by any probabilistic variant caller, Strelka currently provides its own samplespecific variant likelihoods (described in Supplementary Methods). The joint
allele-frequency prior distribution is detailed in the following section.
The allele frequency posterior is used to compute the somatic variant
probability given somatic state S = {(ft ,fn ) : ft = fn }
Is (ft ,fn )P(ft ,fn | D)
P(S | D) =
where U (ft∗ ) is a uniform distribution over the allowed tumor allele
frequencies. The somatic state prior P(S) is set to 1×10⁻⁶ for both SNVs and
indels. Note that P(S) is expected to scale the somatic variant probabilities but
not substantially influence their rank, thus its values were chosen empirically
to provide reasonable variant probabilities and are not adjusted for different
samples in practice.
The expected diploid variation in the normal sample Pdiploid (fn ) is defined
for the canonical diploid allele frequencies and 0 otherwise. It can be
described in terms of α = fn (aref ), the frequency of the reference allele and
β = fn (a2 )/fn (a1 ), the allele frequency ratio of the first and second most
frequent alleles, a1 and a2 , respectively. For SNVs and indels this is
⎧
⎪
θSNV /3 if α = 0.5
⎪
⎪
⎪
⎨
θSNV /6 if α = 0,β = 0
Pdiploid,SNV (fn ) =
2 /3
⎪
if α = 0,β = 0.5
θSNV
⎪
⎪
⎪
⎩1−3θ
2
/2+θ
if α = 1
SNV
SNV
⎧
⎪
θindel if α = 0.5
⎨
Pdiploid,indel (fn ) =
θindel /2 if α = 0
⎪
⎩
1−3θindel /2
if α = 1
2.4 Alternate somatic variant-caller workflows
Varscan results are computed from VarScan version 2.2.7, and pileup output
for each BAM file was generated using samtools version 0.1.17 (Li et al.,
2009). The mapping quality cutoff for pileup generation was set to 40, to
match the tier1 cutoff used by Strelka. VarScan’s ‘somatic’module was run on
the pileup output using the default settings, except when the method was run
on the ‘Low Purity’ sample set, in which case a tumor purity setting of 0.4 was
provided to indicate the simulated purity of this sample. To reduce VarScan’s
output to the gain of allele somatic call type analyzed in this study, we filtered
all VarScan calls with support for the variant allele in the normal. As a final
filtration step, we applied Strelka’s high-depth call filter by removing all
calls where the normal sample depth was higher than the filtration threshold
defined for each chromosome by Strelka. To produce SomaticSniper results,
we installed version 1.0.0 of the program bam-somaticsniper and ran this with
default settings except for using a minimum mapping quality of 40 to match
the cutoff used in VarScan and Strelka. Following the guidelines outlined
in the SomaticSniper study, we replicated the ‘Standard’ filtering procedure
1813
[10:32 18/6/2012 Bioinformatics-bts271.tex]
Page: 1813
1811–1817
Copyedited by: TRJ
MANUSCRIPT CATEGORY: ORIGINAL PAPER
C.T.Saunders et al.
Table 1. Genome comparison sets
Sample1a
Set
High Depth
Low Purity
Normal Replicate
Replicate Companion
Sample2a
Composition
Depth
Composition
Depth
COLO-829 FC1 and FC2b
Mixture simulating 40% purityc
COLO-829BL FC2
COLO-829 FC2
93.4
88.0
52.1
51.4
COLO-829BL FC1 and FC2
COLO-829BL FC1 and FC2
COLO-829BL FC1
COLO-829BL FC1
86.3
86.3
36.6
36.6
a Sample1 and Sample2 are, respectively, treated as the tumor and normal during somatic variant calling.
b FC1 and FC2 refer to flowcells 1 and 2.
c Mixture created by sampling 60 Gbases of COLO-829 sequence from each flowcell (120 Gbases total), and merging this with 90 Gbases of
COLO-829BL sequence sampled from each flowcell (180 Gbases total).
A
B
except that no filtering was performed for calls matching dbSNP entries. This
exception was made because we use dbSNP overlap to evaluate somatic call
quality for the various workflows below. As with VarScan we removed all
calls with support for the variant allele in the normal and applied Strelka’s
high-depth call filter. The quality values used to describe the stringency
cutoffs of SomaticSniper calls are obtained as Phred score transformations
of the Somatic Score.
whereas somatic indel calls are compared with VarScan only. Each
somatic caller was configured to exclude calls associated with
regional LOH or copy number changes, thus the evaluated variants
represent gain of allele mutations from the homozygous reference
state in the normal sample. In each test we examine somatic caller
results at a series of stringency levels, summarized as the minimum
accepted quality score for the somatic variants.
3
3.1
RESULTS
We tested Strelka on new sequencing results for COLO-829, a
melanoma sample and COLO-829BL, a lymphoblastoid cell line
from the same patient. As described in Section 2, these samples were
sequenced on two flowcells to produce a total aligned depth of 93×
and 86× for the tumor and normal samples respectively. The first
flowcell (FC1) included four lanes for the tumor and three lanes for
the normal, whereas the second flowcell (FC2) included four lanes
for each sample. These data were combined into several comparison
sets (detailed in Table 1) for the purpose of testing different aspects
of somatic call quality. Somatic SNV calls are compared with the
predictions from two existing methods, VarScan and SomaticSniper,
Downloaded from http://bioinformatics.oxfordjournals.org/ by guest on October 6, 2014
Fig. 2. Somatic variant call overlap with known germline variation. Somatic SNVs and indels were called from the ‘High Depth’ tumor/normal sequence
set (Table 1) using Strelka and alternate methods. For each method we show the results at a series of stringency levels, indicated by the minimum accepted
somatic quality score shown for each point. (A) Overlap of somatic SNV calls with the common subset of dbSNP build 132 (Sherry et al., 2001). The dbSNP
‘common’ subset was obtained from the UCSC Genome Browser database (Fujita et al., 2011). This set only includes SNPs which map to a single genomic
location and have a minor allele frequency of at least 1%. (B) Overlap of somatic indel calls with indels from phase 1 of the 1000 Genomes Project. The
set of known indel variants in the population is taken from the phase 1 results of the 1000 Genomes Project (1000 Genomes Project Consortium, 2010) as
provided in the Genome Analysis Toolkit resource bundle from 12 June 2011 (DePristo et al., 2011)
Somatic call overlap with population variants
We tested the somatic variants for overlap with known variants in
the human population to identify spurious somatic calls caused by
germline variation. Although it is possible for a somatic variant
to coincidentally match a variant identified as segregating in the
human population, such calls are far more likely to be non-somatic.
Figure 2A details the overlap of several SNV sets to the common
subset of dbSNP. For all three variant callers we observe the
expected behavior of decreasing dbSNP overlap with increasing call
stringency. We also observe that Strelka’s dbSNP overlap is lower
than either alternate method for any call stringency, consistent with
a lower rate of miscalling germline variants as somatic.
1814
[10:32 18/6/2012 Bioinformatics-bts271.tex]
Page: 1814
1811–1817
Copyedited by: TRJ
MANUSCRIPT CATEGORY: ORIGINAL PAPER
Somatic variant calling with Strelka
A
B
In Figure 2B a similar approach is used to evaluate somatic indel
calls. As with the SNVs, overlap of the somatic indel calls with
population indels decreases at greater stringency for both methods.
However we observe a much higher overlap with population
variants for the somatic indels. This may be explained by the
relatively high rates of both true variants and spurious indel noise
in microsatellites and tandem repeats (Levy et al., 2007), due to
polymerase slippage and other factors. Such indel hotspots can lead
to overlap between population variants and somatic predictions in
two ways: (i) coincidental occurrence of the same indel variant in the
population and the tumor cell line; and (ii) occurrence of spurious
indel noise at the same location as a population variant. To illustrate
this point, the Strelka indel calls at Q30 or higher from Figure 2 can
be classified as to whether they represent expansions or contractions
of a repeating unit with five or more copies. Note that repeat counts
larger than eight have already been filtered out. The ‘high repeat’
indel set from above has a population indel overlap of 10.5% (190
calls) while those with shorter repeats have an overlap of 3.3%
(462 calls). Apart from this issue, we observe that Strelka exhibits a
relatively lower overlap with the population indels given the same
total number of somatic indel calls, likely reflecting Strelka’s above
noted filtration of longer repeats in addition to joint sample candidate
indel discovery and explicit modeling of expected allele frequencies
in the normal sample.
We provide as Supplementary Material all non-synonymous
Strelka coding variants from the ‘High Depth’ sequence set used in
the above comparisons. These include all calls with quality scores
of at least 15 for SNVs and 30 for indels, yielding 216 missense
and 17 non-sense SNVs, in addition to 7 coding indels as annotated
from Ensembl release 64 (Flicek et al., 2012).
3.2 Technical replicate subtraction
Somatic calls can also be evaluated by analyzing replicated
sequencing runs of the same sample, and treating the replicates
as an artificial matched tumor–normal pair. All somatic calls made
in this case will be false positives, reflecting a mixture of errors
from sequencing and the somatic caller. To conduct such a test we
used COLO-829BL data from the ‘High Depth’ comparison set and
divided it by flowcell to create a ‘Normal Replicate’ comparison set.
We also created a ‘Replicate Companion’ comparison set containing
true tumor–normal sequencing data, but using only one flowcell
per sample so as to approximately match the depth of the ‘Normal
Replicate’ set (Table 1). In addition to matching depth, the ‘Normal
Replicate’ and ‘Replicate Companion’ sets also both compare data
between flowcells so that any flowcell artifact will be similar in both.
Figure 3 shows the variant calling results on the above data sets.
As expected, the ratio of normal replicate to tumor–normal calls
declines as stringency increases across all methods for both SNVs
and indels. For Strelka and SomaticSniper we observe a rapid decline
in somatic calls on the normal replicate set, and for Strelka there
are no somatic SNVs and indels called on the normal replicate at
≥Q50. In general Strelka provides a lower ratio of normal replicate
to tumor–normal calls compared with alternate methods, except for
indels at low call stringency. This is likely due to the additional
filtration used by Strelka on both somatic calls and input data. Such
filtration steps use thresholds fixed to a specific sensitivity/specificity
tradeoff which is not relaxed when selecting for variant calls at lower
quality scores.
3.3
Downloaded from http://bioinformatics.oxfordjournals.org/ by guest on October 6, 2014
Fig. 3. Somatic variant calls in normal replicate data. Each plot shows the number of somatic variants called from a comparison of the normal sample to itself,
versus the number of variants called from a comparison of the tumor and normal samples. The normal sample comparison is made using two independent
sets of sequencing results for this sample. The data used as input for the two somatic call sets have similar depth, and in both cases sequencing data are
compared across flowcells. The results provide a rough estimate of false somatic call count as a function of the total calls made by each method. The two
plots summarize the results for somatic (A) SNVs and (B) indels
Sensitivity of somatic calls at low purity
To investigate false negative calls we test each method for detection
of the validated somatic variants from Pleasance et al. (2010). To
better understand the influence of tumor purity on the false negative
rate, we also assembled a ‘Low Purity’ comparison set from the
melanoma and normal sequences, which was designed to simulate a
tumor sample at 40% purity. To do so we consider the melanoma cell
line (COLO-829) to be a pure sample and combine a subset of its
sequences with those from its matched normal to produce a mixture
sample with 40% melanoma sequence and depth similar to that of
the pure melanoma sample (Table 1). This scheme necessitates reuse of normal (COLO-829BL) sample sequences in both parts of
1815
[10:32 18/6/2012 Bioinformatics-bts271.tex]
Page: 1815
1811–1817
Copyedited by: TRJ
MANUSCRIPT CATEGORY: ORIGINAL PAPER
C.T.Saunders et al.
D
B
E
C
F
Fig. 4. Somatic variant call sensitivity. The sensitivity of the somatic variant callers is evaluated on a set of validated somatic SNVs and indels in COLO-829
at 100% purity (‘High Depth’ comparison set) and at simulated 40% purity (‘Low Purity’ comparison set). In all cases the sensitivity is compared with the
total number of calls made at 100% purity. Parts (A), (B) and (C) describe the results for somatic SNVs and parts (D), (E) and (F) for somatic indels. Parts (A)
and (D) show the percent of validated variants detected by each method at 100% purity for SNVs and indels respectively. Parts (B) and (E) show the same
results for variants detected at 40% purity. Parts (C) and (F) compare the total number of somatic calls at 40% purity to the number called at 100%. These
results demonstrate a pronounced reduction in performance of alternate methods at reduced tumor purity levels compared with Strelka, reflecting the fact that
Strelka’s somatic call model is designed for arbitrary allele frequencies in the tumor sample
the ‘Low Purity’ comparison set, so this set should not be used to
evaluate false positive calls.
The validated calls from Pleasance et al. (2010) include 454
SNVs and 66 indels. These variants were mapped to hg19 from their
published positions on the hg18 reference using the UCSC Genome
Browser liftover utility. Although we use the full set of validated
calls in our subsequent evaluation, we note that for eight SNVs and
four indels, the validated somatic allele is either absent from the
tumor or present in the normal at the hg19 liftover location in the
‘High Depth’ sequence set.
Downloaded from http://bioinformatics.oxfordjournals.org/ by guest on October 6, 2014
A
Figure 4 summarizes the sensitivity results. Figures 4A and D
show the fraction of validated calls detected from the pure melanoma
sequence. For this case the number of validated variants detected
by all methods is not substantially influenced by call stringency,
reflecting the sample purity and high sequencing depth. The only
validated SNV calls missed by Strelka at all stringency settings are
the eight cases of possible liftover artifact discussed above. Strelka
also misses 20 validated indels at all stringency settings, 8 of these
indels have quality scores of at least 60 but are removed by the
repeat filter for long homopolymers and dinucleotides.
1816
[10:32 18/6/2012 Bioinformatics-bts271.tex]
Page: 1816
1811–1817
Copyedited by: TRJ
MANUSCRIPT CATEGORY: ORIGINAL PAPER
Somatic variant calling with Strelka
4 DISCUSSION
In the above analysis we demonstrate that the somatic calls made by
Strelka (i) have a low fraction of population variants and thus are
likely to contain few erroneous germline calls; (ii) are infrequent
when the method is used to compare a normal sample against itself;
and (iii) retain high sensitivity when the tumor sample is impure.
We note that all Strelka results presented in this study use the same
model and filtration parameters, and per Strelka’s design the model
parameters need not be adjusted based on the tumor or normal
sequencing depth or expected tumor purity.
The alternate methods we examine represent two families of
somatic variant calling approaches, each of which has advantages
and drawbacks compared with Strelka’s. Methods which use a
diploid genotype likelihood for both tumor and normal samples
should perform well on high-purity samples. This is evident for
SomaticSniper, which makes very few spurious somatic calls when
run against a normal replicate sample. Any remaining performance
differences on cell line data may be an artifact of using the
ELAND read mapper and Strelka’s extra post-call filtration steps.
SomaticSniper is also extremely efficient, completing analyses in
approximately one seventh of the time required by Strelka. The
principal cost of this approach is apparent when testing sensitivity
on low purity data, in which case SomaticSniper shows the greatest
reduction in sensitivity between the impure and pure test data. The
approach of applying a general statisical test against the tumor
and normal allele frequencies, as implemented in VarScan, has
the significant advantage of being robust to a variety of sample
conditions such as contamination or alternate ploidy in the normal
sample. An analogous approach using a uniform allele frequency
prior for the normal sample was attempted in Strelka, but not
pursued due to a relative lack of power in situations where the
current model assumptions hold. This trend is also evident in the
VarScan results showing that tumor purity has a relatively high
impact on somatic call sensitivity. Nonetheless, the generality of
VarScan’s approach is a great advantage for many sample subtraction
problems.
Although not applied in this study, Strelka is designed to
optionally accept contigs from a local de-novo assembly routine to
enable detection of longer somatic indels and open breakends. Items
for future work include extending the model to represent normal
sample contamination and integrating the post-call filtration terms
with the current somatic quality score. The latter improvement has
recently been demonstrated for single-sample variant calls using
a machine learning approach (DePristo et al., 2011), and would
enable call selection based on a single score representing both the
core somatic call probability and post-call filtration terms, improving
selection of low-stringency variant calls.
ACKNOWLEDGEMENTS
We acknowledge Illumina’s sequencing and informatics teams, Prof.
Michael Stratton for permission to release COLO-829 data to the
EGA and our cancer sequencing users for their helpful feedback on
early Strelka results.
Conflict of Interest: All authors are employees of Illumina Inc.,
a public company that develops and markets systems for genetic
analysis.
REFERENCES
Danecek,P. et al. (2011) The variant call format and VCFtools. Bioinformatics, 27,
2156–2158.
DePristo,M.A. et al. (2011) A framework for variation discovery and genotyping using
next-generation DNA sequencing data. Nat. Genet., 43, 491–498.
Flicek,P. et al. (2012) Ensembl 2012. Nucleic Acids Res., 40, 84–90.
Fujita,P.A. et al. (2011) The UCSC Genome Browser database: update 2011. Nucleic
Acids Res., 39, D876–D882.
Goya,R. et al. (2010) SNVMix: predicting single nucleotide variants from nextgeneration sequencing of tumors. Bioinformatics, 26, 730–736.
Koboldt,D.C. et al. (2009) VarScan: variant detection in massively parallel sequencing
of individual and pooled samples. Bioinformatics, 25, 2283–2285.
Larson,D.E. et al. (2012) SomaticSniper: identification of somatic point mutations in
whole genome sequencing data. Bioinformatics, 28, 311–317.
Levy,S. et al. (2007) The diploid genome sequence of an individual human. PLoS Biol.,
5, e254.
Ley,T.J. et al. (2008) DNA sequencing of a cytogenetically normal acute myeloid
leukaemia genome. Nature, 456, 66–72.
Li,H. et al. (2009) The Sequence Alignment/Map format and SAMtools. Bioinformatics,
25, 2078–2079.
Meyerson,M. et al. (2010) Advances in understanding cancer genomes through secondgeneration sequencing. Nat. Rev. Genet., 11, 685–696.
Pleasance,E.D. et al. (2010) A comprehensive catalogue of somatic mutations from a
human cancer genome. Nature, 463, 191–196.
Sherry,S.T. et al. (2001) dbSNP: the NCBI database of genetic variation. Nucleic Acids
Res., 29, 308–311.
Sjöblom,T. et al. (2006) The consensus coding sequences of human breast and colorectal
cancers. Science, 314, 268–274.
1000 Genomes Project Consortium. (2010) A map of human genome variation from
population-scale sequencing. Nature, 467, 1061–1073.
Downloaded from http://bioinformatics.oxfordjournals.org/ by guest on October 6, 2014
Figure 4B and E show the fraction of validated somatic variants
detected from the ‘Low Purity’ comparison set. In this case call
stringency has a much greater influence on sensitivity. Both of the
alternate calling methods exhibit a consistent relationship between
sensitivity and call stringency, whereas for both SNVs and indels,
Strelka reaches a quality value where the number of validated calls
begins to fall off from a plateau, reflecting an approximate limit
to the quality scores assigned to variant calls in the lower purity
data. Even with this sensitivity drop-off, Strelka shows reasonable
sensitivity at 40% purity compared with the pure sample. For both
VarScan and SomaticSniper, the reduced sensitivity to validated
variants at 40% purity is partially explained by fewer calls made
overall at the same quality value compared with the pure sample.
This trend is illustrated in Figure 4C and F, which shows the number
of variants called at 40% purity compared with the pure sample. This
reduction in total calls made at lower purity is particularly noticeable
for SomaticSniper, for which SNV calls are reduced by over 50%
compared with the pure sample at all plotted stringency levels.
1817
[10:32 18/6/2012 Bioinformatics-bts271.tex]
Page: 1817
1811–1817


© Copyright 2026