
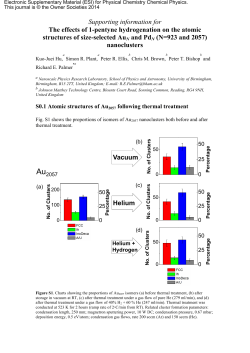
A PHOTOACOUSTIC METHOD OF DETRMINING THE THERMAL
Molecular and Quantum Acoustics vol. 28 (2007) 195 A PHOTOACOUSTIC METHOD OF DETRMINING THE THERMAL DIFFUSIVITY WITH A REFERENCE SAMPLE Jacek MAZUR, Barbara PUSTELNY Institute of Physics, Silesian University of Technology, Krzywoustego 2, 44-100 Gliwice, Poland This paper presents proposition of thermal wave method of measuring the thermal diffusivity by means of photoacoustic detection. Described procedure is based on determination of the phase-shift between light source and registered acoustic signal. A reference material is used for elimination of the measurement set-up contribution to phase. As there is no obligatory standard for measurement of thermal diffusivity by means of thermal wave method the paper suggests a method suitable for standardization. 1. INTRODUCTION Thermal diffusivity is one of those physical quantities which determine the thermal properties of materials. It is defined as the quotient of thermal conductivity and the product of the specific heat c and the density = m2 , []= . c s (1) Thermal diffusivity is applied to describe the properties of materials which are connected with the dynamics of temperature changes caused by time-dependent heat sources. It is, therefore, an essential material parameter informing about the rate of heat losses. 2. MEASUREMENT METHOD The oldest method of the measuring of the thermal diffusivity is the so-called Ångström method, formulated by Ångström in 1863 [1]. This method is based on periodical heating of one end of a thermally insulated rod and recording the temperature in several points along its length. The thermal diffusivity is determined by measuring of the time-lag with witch the maximum value of the temperature reaches the subsequent points of the sample. As the temperature must be measured at various points of the sample along the direction of the heat flow, this method is not applicable for technical purposes, particularly when the tested sample is a thin plate (a few millimeters or even less). 196 Mazur J., Pustelny B. The method presented in this paper refers to the way of taking measurements put forward by Ångström, without the necessity of measuring the temperature at various points of the sample, but only on its surfaces. A flux of heat is supplied to one of the surface of the tested sample (e.g. by the absorption of light). It ought to vary periodically with the frequency f of modulation of the absorbed light. It can be shown that in the case of semi-infinite sample the spatial distribution of the temperature component with the frequency f may be expressed by the formula: T z , t ; f =T 0A exp − f f z exp 2 f t−i z where z denotes the depth (z = 0 for the illuminated surface), T0 , (2) is the undisturbed temperature of medium. Due to the similarity to waves such a disturbance is called a thermal wave and the method has been called thermal wave method. As indicated by the formula (2), the temperature changes decrease with the depth . This property is characterized by the thermal path of diffusion: th= f . (3) Samples of thickness l may be classified by comparing them to the thermal path of diffusion as thermally thin (l < th) or thermally thick (l > th) [2]. On one hand the thermal path of diffusion depends on the frequency of modulation of the flux of energy supplied to the sample, but on the other hand it depends also on the thermal diffusivity of the material of the sample. This property allows to work out a measurement method, where the temperature of the sample surfaces is measured as function of the modulation frequency. The harmonic components of the temperature of the illuminated surface and the reverse surface are described respectively by the formulas T F f = I cosh l s , s sinhl s (4) T B f = I 1 , s sinh l s (5) where I is the amplitude of the absorbed flux of energy, s=1i as , a s= f . =−1 th The formulas presented above are simplified, assuming that the thermal conductivity of the medium surrounding the sample is significantly smaller than the thermal conductivity of the sample itself. Typically the frequency of modulation of the flux of energy varies within the range of fractions of single Hz to several kHz. It restricts the possibility of measuring of the temperature directly, e.g. by means of thermocouples. Therefore, indirect measurements have Molecular and Quantum Acoustics vol. 28 (2007) 197 to be applied, e.g. ones making use of the photoacoustic effect. This method utilizes detection of the acoustic signal resulting from pressure changes in the so-called photoacoustic cell attached to the surface of the sample. It is to be mentioned that such measurements are effective in the case of the frequency of transmission of the acoustic detector. An analysis of the way of recording of the photoacoustic signal has led to the conclusion that it is most feasible to measure the signal from the side opposite to the illumination. According to [3] such a signal can be expressed by the relation: S B= CB 1 , s sinh l s (6) where CB is the corresponding factor of proportionality. Fig. 1. Diagram of a typical measurement system. The acoustic signal generated by the absorption of light is detected by means of a microphone. It is measured with lock-in amplifier set to the frequency of modulation of the source of light. Such measurement system permits to measure the amplitude and phase shift of the signal with respect to the signal of the generator which controls the source of light. The amplitude and the phase shift of the signal described by the formula (6) are expressed by following two equations: ∣S B∣=∣C B∣ 2 f 1 , cosh 2 a s l−cos 2 a s l S B =−arctg tg as l − . tgha s l 2 (7) (8) 198 Mazur J., Pustelny B. 2.1. LINEAR APPROXIMATION In order to simplify the procedure of data processing and the analysis of the accuracy of measurements following linear approximation of expression (8) can be applied as suggested by Calderon et al. [4] S B ≃− l2 3 . f− 4 (9) This approximation represents correctly (with an error not exceeding 1.2%) the relationship given by formula (8) concerning frequencies not exceeding 2.5 fc (fc denotes the frequency at which the thickness of the sample is equal to the thermal path of diffusion). 3. THE INFLUENCE OF THE MEASUREMENT SYSTEM TO REGISTERED SIGNAL Formula (6) describes the signal for an ideal measurement set-up, which only changes the measured quantities into digits. In real set-up the signal coming from the detector undergoes deformations. The are two sources of these deformations. 3.1. THE SOURCE OF MODULATED LIGHT The electronic system which modulates the light is controlled by the generator of the reference signal of the lock-in amplifier. Measurement of the generated light by means of the photodetector indicates that the amplitude of the intensity of light decreases with the increasing frequency. A phase shift depending on the frequency also occurs. Temperature changes caused by the illumination are directly proportional to the intensity of the light absorbed in the sample. Thus, it may be concluded that the source of light affects the output signal due to the changes of the amplitude depending on the frequency (graduating factor CZS( f )) and effects an additional phase shift ZS( f ). 3.2. AMPLIFIERS AND INPUT FILTERS OF THE LOCK-IN AMPLIFIER Similarly as in former case, the influence of amplifiers and the high-pass filter situated at the input step of lock-in amplifier. May be taken into account by applying the graduating factor CWF( f ) and the additional phase shift WF( f ). 4. ELIMINATION OF THE INFLUENCE OF THE MEASUREMENT SYSTEM BY REFERENCE MEASUREMENTS Deformation of the signal caused by the source of light and the path of detection are independent of the measured sample. Taking into account deformations described above, the formula (7) and (8) take the following form: ∣SB∣=C ZS C WF ∣C B∣ 2 f 1 , cosh 2 a s l−cos 2 a s l (10) Molecular and Quantum Acoustics vol. 28 (2007) S B =−arctg 199 tg as l − ZS WF . tgha s l 2 (11) In order to eliminate the influence of measurement system to the signal, the real signal for another (reference) sample must be measured. In this case is S B ref = S B ref ZS WF . (12) Compilation of formulas (8), (11) and (13) permits to eliminate the phase shifts resulting from the measurement system: S B − S B ref S Bref = S B −[ S B ref − S B ref ] (13) S B = The correction function indicated by the square brackets can be determined once by measurement with wide-ranged and small-step of frequency, followed by adequate interpolations in subsequent data analysis. The main advantage of this approach is simplification of measurement procedure. If the reference sample is thermally thin over the entire range of measurements the simplified formula (9) can be used and the expression (13) can be reduced to the simple linear relation: S B − S B ref ≃− l 2ref l2 − f . ref (14) 5. EXEMPLARY RESULTS OF MEASUREMENTS At the presented arrangement the test measurements were carried out. As a reference sample a copper plate 255 m thick with purity of 99,98% was used. The uncertainty of its thickness was assumed to be 10 m. As no standard samples were available, high-purity metal plates were used. Details concerning these samples as well as the results of measurements are presented in Table 1. Signals for the reference tested samples were measured by lock-in amplifier SR830, which ensure measurements of the phase with resolution 0.008° and dynamic reserve exceeding 100 dB. Examples of the dependency of corrected phase on frequency and the matched linear dependences are shown in Fig.2. Corrections have been effected in compliance with the formula (13). The analysis of the data quoted in Table 1 displays differences between the determined values and the values quoted in literature (in the case of the samples 1-5 values are underrated). The results of the tests of determining of thermal diffusivity basing on the data resulting from the formula (6) have been presented in Fig.3. These results confirm the observed trends and may by used to correct them. 200 Mazur J., Pustelny B. Fig. 2. Corrected phase of the signal measured for copper samples with a thickness of 515mm (+) and 1020mm (●). Tab. 1 Results of test measurements. Materiał l u() lit (purity, %) m cm2s-1 cm2s-1 cm2s-1 Ti (99.7) 255 0.0926 0.0082 0.093 Ni (99.98) 510 0.206 0.010 0.229 Si (?)* 515 0.695 0.038 0.8 Cu (99.98) 515 1.046 0.075 1.16 Cu (99.999) 1020 1.052 0.048 1.16 Ag (99.9)** 255 1.92 0.32 1.74 * The degree of the purity of the applied silicon sample and possible doping are not known. ** Sample reflecting the light, the thickness of which is comparable to the reference sample. Measurements within the frequency range 120 – 1050 Hz. The accuracy of measurements has been assessed taking into account the uncertainty of measurements [5] of the sample thickness, the standard uncertainty resulting from the linear regression and the uncertainty of the parameters of the reference sample. The value of the standard uncertainty depends on the scatter of the points of measurement in relation to the matched straight line. The scatter of the points of the measurement depends on the ratio of the recorded signal to the noise occurring in the system. The quantity of the measured signal is Molecular and Quantum Acoustics vol. 28 (2007) 201 proportional to power of the applied source of light, as well as to the light absorption coefficient. Moreover, the amplitude of the signal decreases more or less exponentially with square root of modulation frequency. Adequate measurements can minimize the uncertainty of the measurements. Besides the determined value of the thermal diffusivity Table 1 also provides its uncertainty. Fig. 3. Difference between the establishment value (a) and the value determined by means of the regression method (areg) as the function of areg for samples 250-1000 mm thick and the reference sample aref = 1.16 cm2s-1 (Cu), l = 250mm. 6. CONCLUSIONS As indicated by the measurements which have been carried out, the suggested method may serve as a basis for the standardization of measurements of the thermal diffusivity making use of thermal wave method. This method is feasible in the case of small samples assuming a one-dimensional flow of the heat flux and an effective absorption of light by the material. Reflective samples ought to the be blackened. An advantage of this method is its simplicity and non-destructive character. Its drawback is the relatively high uncertainty of the measurements, due to the simplification of the procedure of measurements. The simplicity of this procedure constitutes a requirement of the standardization of measurements. 202 Mazur J., Pustelny B. This work is supported as part of project Elaboration of System for Measurement of Thermal Diffusivity by Thermal Wave Methods Multi-Year Programme PW-004 “Development of innovativeness systems of manufacturing and maintenance 2004-2008”, established by a resolution of the Council of Ministers of the Republic of Poland REFERENCES 1. A. J. Ångström, Phil. Mag. 25, 130 (1863). 2. A. Rosencweig, A. Gersho, J. Appl. Phys. 47/1, 67 (1976). 3. J. Mazur, Theoretical analysis of propagation and photodeflection detection of thermal waves in layered structures – Ph.D. thesis, Silesian University of Technology, Gliwice 1998 (in Polish). 4. A. Calderon, et al., J. Appl. Phys. 84/11, 6327 (1998). 5. Wyrażanie niepewności pomiaru. Przewodnik (Guide to the Expression of Uncertainty in Measurement), Główny Urząd Miar 1999 (in Polish).


© Copyright 2026