
GeneChip Eukaryotic Small Sample Target Labeling Assay Version II *
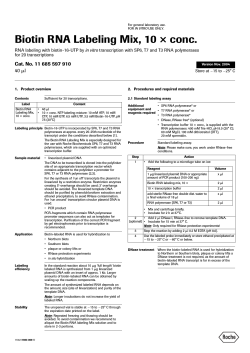
T E C H N I C A L N OT E
G E N E E X P R E S S I O N M O N I TO R I N G
GeneChip® Eukaryotic Small Sample Target
Labeling Assay Version II*
Introduction
Two-Cycle Eukaryotic Target Labeling for GeneChip® Expression Analysis
Total RNA
First Cycle
There is an overwhelming and continuing
demand for a well characterized
protocol that amplifies and labels as
low as a few nanograms (ng) of total
RNA for expression profiling using
GeneChip® probe arrays. This capability
is especially important for studies that
focus on utilizing a homogenous cell
population, where the amount of
starting material becomes the limiting
factor. This applies to samples from
laser capture microdissection, small
biopsies, and flow-sorted cells.
5'
AAAAA 3'
1. First Strand cDNA
Synthesis
3' TTTTT –
5'
3'
AAAAA 3'
TTTTT –
We continued to optimize the assay
conditions in ways such as fine tuning
the volume of each reaction, amount
of primers, as well as incubation time
for the IVT reactions.
The Small Sample Labeling Protocol
version II (vII) is shown to reproducibly
amplify antisense RNA from 10 to 100 ng
*Users who do not purchase the GeneChip T7Oligo(dT) Promoter Primer Kit may be required to
obtain a license under U.S. patent Nos. 5,569,584;
5,716,785; 5,891,636; 6,291,170 and 5,545,522 or
to purchase another licensed kit.
5 ' 1.5 hours
5'
2. Second Strand cDNA
Synthesis
2.5 hours
5'
3'
AAAAA –
TTTTT –
3. Cleanup of
Double-Stranded cDNA
3'
5'
0.5 hour – Overnight
Stopping Point
Un-labeled
Ribonucleotides
4. In vitro Transcription
3'
Affymetrix published the first version
of a research protocol (Version I) in the
GeneChip Eukaryotic Small Sample
Target Labeling Technical Note in 2001.
This Technical Note described
reproducible and satisfactory results
from 50–100 ng of total RNA. It was
based on the principle of performing
two cycles of cDNA synthesis and in
vitro transcription (IVT) reactions for
target amplification.
Approximate
Experiment Time
5–6 hours
UUUUU 5'
5. Cleanup of
Antisense RNA (cRNA)
0.5 hour
Stopping Point
Second Cycle
Random
Primers
6. First Strand cDNA
Synthesis
5'
2 hours
AAAAA 3'
UUUUU 5'
3'
3' T T T T T –
7. Second Strand cDNA
Synthesis
5'
2.5 hours
5'
3'
AAAAA –
TTTTT –
3'
5'
8. Cleanup of
Double-Stranded cDNA
1 hour
Biotinylated
Ribonucleotides
9. Biotin Labeling
Antisense cRNA
3'
Stopping Point
U 4–5 hours
C
UUUUU 5'
10. Cleanup of
Biotinylated cRNA
0.5 hours
Fragmentation and Hybridization
Legend:
RNA
DNA
T7 Primer
Biotin
Figure 1. Schematic representation of the Two-Cycle Eukaryotic Target Labeling Assay for
GeneChip® Expression Analysis.
of total RNA, or the approximate
equivalence to total RNA extracted
from 1,000 to 10,000 cells. As a result
of the increased optimization,
multiple assay performance metrics
such as cRNA yield, the 3’ to 5’ Signal
Intensity ratios of control probe sets
were improved.
Results
Total RNA was isolated from cultured
human HeLa cells. Samples ranging
from 1 ng to 100 ng were used in each
Small Sample Labeling Protocol vII
reaction (described in detail in
Appendix II, with the required reagents
listed in Appendix I). As a reference,
the targets were also prepared
following the standard procedure,
described in the GeneChip Expression
Analysis Technical Manual, using 5 µg
of the same HeLa total RNA.
Results are presented for the following
assay performance criteria, in order to
evaluate the effectiveness of the
two-cycle amplification for GeneChip
array expression analysis.
Labeled cRNA Yield
The yield of labeled cRNA is critical
because sufficient target needs to be
generated for hybridization onto the
GeneChip probe arrays. The required
amount of labeled cRNA is 10–15 µg
for each genome array.
A series of experiments were carried out
using different amounts of starting
material and the results are summarized
in Figure 2. The cRNA targets were
prepared by using either the standard
assay (5 µg of total RNA) or the Small
Sample Labeling Protocol vII (100 ng,
50 ng, 10 ng, and 1 ng of total RNA).
The quantity of cRNA obtained was
measured by absorbance at 260
nanometers (nm).
The average yields and standard
deviation from the six replicates were
plotted (Figure 2) to demonstrate the
repeatability of amplification reactions.
As shown in Figure 2, the quantities of
the labeled cRNA obtained from samples
of 10–100 ng total RNA with the Small
Sample Labeling Protocol vII were
comparable with the range anticipated
from the standard protocol.
The amount of template became too
limiting for the 1 ng samples with
only about 10 µg of cRNA targets
produced.
Standard Array Quality Metrics
To further evaluate whether the Small
Sample Labeling Protocol vII is suitable
for preparing targets for GeneChip array
expression analysis, 10 µg of cRNA
targets, generated from the experiments
described previously, were hybridized
on the GeneChip Human Genome
U133A (HG-U133A) arrays.
The data were then analyzed using
Affymetrix’ Microarray Suite 5.0
(MAS 5.0) software and various
standard array quality control metrics
were obtained. The results from the
two protocols were evaluated and
compared. Each metric is represented
by the average value (Avg), as well as
the standard deviation (SD) of the
six replicates.
We first examined the basic array data
such as Raw Q, Background, and
Scaling Factor to evaluate the overall
sample quality with the targets prepared
— Labeled cRNA yield
— Standard array quality metrics
including Raw Q, Background,
Scaling Factor, Percent Present
Calls, and 3’ and 5’ Signal
Intensity ratio of control
probe sets
— Linearity and sensitivity of
amplification as quantified
using spike-in bacterial poly-A
controls
— Replicate analysis and
reproducibility
— Concordance analysis between
the standard and the Small
Sample Labeling Protocol vII
5 µg
standard
100 ng
50 ng
small sample small sample
10 ng
small sample
1 ng
small sample
Figure 2. Comparison of cRNA yields. Average and standard deviation from 6 replicates
are shown.
according to the two protocols
(Version II and the standard protocol).
Table 1. Array Quality Metrics Comparisons: Raw Q, Background, and Scaling Factor.
Metric
Data 5 µg,
100 ng,
50 ng,
10 ng,
1 ng,
Standard Small Sample Small Sample Small Sample Small Sample
As shown in Table 1, comparable values
were obtained for all three parameters.
For example, the Background values
were all within the 20–100 range, as
anticipated for typical experiments.
The Scaling Factors were also within
threefold range—even when comparing
the data from 1 ng of starting material
amplified with the Small Sample
Labeling Protocol vII.
Raw Q
Avg
SD
The Percent Present Calls comparison
was used to globally assess the data
representations. As shown in Table 2,
comparable Percent Present Call values
have been obtained with reducing
amounts of starting materials. Even at
1 ng of starting total RNA, about 40
percent of the probe sets were called
as Present.
These results demonstrate significant
improvement of the Small Sample
Labeling Protocol vII, compared with
the first version of the protocol, in
delivering comparable representations
of various transcripts from smaller
size samples.
GeneChip arrays are designed with
probes selected from the 600 bases
adjacent to the poly-A tail. This design
strategy along with the inherent
generation of shorter fragment from
additional amplifications may create
targets that are skewed to the 3’ end.
To examine this phenomenon, probe sets
were created for specific maintenance
genes (e.g., GAPDH, beta actin).
These probe sets are designed to the 3’,
middle, and 5’ regions of the transcript.
The 3’ probe set Signal Intensity is then
compared to the 5’ probe set Signal
Intensity (3’/5’ ratio) to evaluate the
quality of starting material and
efficiency of target preparation.
As shown in Table 2, the 10 ng total
RNA sample with the Small Sample
2.25
0.21
2.28
0.11
2.30
0.19
2.13
0.05
1.84
0.18
Background Avg
SD
58.66
8.04
58.39
3.50
58.93
6.26
52.92
1.76
45.41
6.79
Scaling
Factor
1.00
0.15
0.80
0.14
0.79
0.39
1.25
0.37
2.53
0.65
Avg
SD
Table 2. Array Quality Metrics Comparisons: Percent Present Call, 3’/5’, and 3’/Middle Ratios.
Metric
Data 5 µg,
100 ng,
50 ng,
10 ng,
1 ng,
Standard Small Sample Small Sample Small Sample Small Sample
% Present Avg
Call
SD
48.0%
0.7%
47.7%
1.3%
46.4%
1.2%
44.7%
2.3%
40.6%
2.9%
GAPDH
3’/5’ Ratio
Avg
SD
0.87
0.04
2.03
0.12
1.78
0.22
3.06
0.64
3.82
0.78
GAPDH
Avg
3’/M Ratio SD
0.97
0.06
1.31
0.09
1.15
0.06
1.41
0.18
1.50
0.23
Actin
Avg
3’/5’ Ratio SD
0.96
0.03
5.60
1.12
9.91
2.91
13.09
4.46
28.75
10.29
Actin
Avg
3’/M Ratio SD
0.85
0.06
2.02
0.28
2.71
0.59
3.41
1.47
5.47
1.96
Labeling Protocol vII, produced the
3’/5’ ratio for GAPDH within the
recommended range of 3, only slightly
higher than those samples processed
with the standard protocol.
We also calculated the 3’/Middle probe
set ratio (3’/M) of the GAPDH gene
because the M probes lie approximately
430–770 bases from the most 3’ end
(Figure 3) and may be a more realistic
representation of reliability of the
array data. The resulting 3’/M ratios
for the GAPDH gene were below 2 for
all samples assayed.
Similarly, 3’/5’ and 3’/M ratios for a
second control gene, beta actin, were
also documented. These ratios
deteriorated more rapidly than those
for GAPDH consistent with the longer
length of the beta actin mRNA (see
Figure 3). However, the 3’/M ratio was
still 3 on average when using as little as
10 ng of total RNA with the Small
Sample Labeling Protocol vII .
Linearity
The ability of any amplification protocol
to accurately detect differences in
expression levels is highly dependent
on the assay’s linearity and sensitivity.
The Small Sample Labeling Protocol vII
was evaluated for both parameters by
analyzing the spike-in poly-A control
AFFX-HUMGAPDH/M33197
1268 bp
5'
882
1182
5' probe set
437
776
M probe set
1 bp
3'
13
361
3' probe set
AFFX-HSAC07/X00351
1761 bp
1 bp
5'
3'
1712
1178 1117
589 561
5' probe set
M probe set
3' probe set
24
Figure 3. Diagram of the Probe Set Positions for Human GAPDH and Beta Actin. Probe sets
are defined by numbered regions starting with one at the 3’ end. These numbers
do not correlate to the specific nucleotide sequence across the transcript.
transcripts in a complex sample. Four
in vitro-generated bacterial poly-A
controls—dap, lys, phe, and thr—were
spiked into the complex human HeLa
total RNA samples at various
concentrations.
After labeling 10 ng of total RNA with
the Small Sample Labeling Protocol vII,
the target was hybridized on HuGeneFL
arrays, and the Signal Intensities for
the controls were plotted (Figure 4).
The results were comparable to the
data generated with the standard
procedure (data not shown).
Sensitivity
The sensitivity of the assay was
estimated with the lowest concentration
of the control transcripts. Specifically,
at a 1:81,000- complexity ratio
(assuming an average transcript length
of 2,000 bases), the controls were
present at about three to four copies
per cell, in the complex samples. Using
10 ng of total RNA as starting material
and amplified with the Small Sample
Labeling Protocol vII, all four bacterial
control spike-in probe sets were called
as Present in all instances. This result
indicates that the sensitivity of the
assay was maintained in this study
even with the additional cycle of
amplification.
Figure 4. Assessment of Amplification Linearity. Evaluation of transcripts spiked into a
complex human HeLa total RNA sample was performed using Microarray
Suite 5.0 software.
The obtained r2 value of 0.98 was
consistent with those values observed
when comparing results from the two
standard labeling procedures (data not
shown).
To further assess the reproducibility
and degree of assay variability
associated with the Small Sample
Labeling Protocol vII, the average
coefficient of variability (CV) of
replicates for individual probe sets
was examined.
Comparing the standard labeling
procedure (using 5 µg of total RNA)
and the Small Sample Labeling
Protocol vII (using 10 ng and 100 ng
of the same sample), six independent
labeling reactions were analyzed.
As shown in Figure 6, the average CV
percent is very comparable with either
protocol. These results are indicated by
the nearly overlapping trendlines over
the entire range of Signal Intensity
values. Only probe sets having Signal
Reproducibility is a primary
requirement for any amplification
protocol, and it is essential for
generating reliable results.
Two independent target preparations
with 10 ng of total RNA using the
Small Sample Labeling Protocol vII
were hybridized to HG-U133A arrays.
Using the MAS 5.0 software, a scatter
plot was generated (Figure 5),
illustrating assay reproducibility by
comparing the Signal Intensities
obtained from the duplicate targets.
10 ng (Signal Intensity)
Reproducibility
10 ng (Signal Intensity)
Figure 5. Reproducibility of the Small Sample Labeling Protocol vII. Comparison of Signal
Intensities from duplicate samples are shown.
Data Concordance Between the
Standard and the Small Sample
Labeling Protocol
After hybridizing to HG-U133A arrays,
Signal Intensities were compared
between the 5 µg samples and the 10 ng
samples (Figure 7). The resulting
r2 value of 0.90 indicates that the two
protocols were highly similar, but did
not produce identical results.
As the standard and Small Sample
Labeling Protocol vll use different
total RNA amounts and different
numbers of amplification cycles, we do
not recommend comparing results
obtained from these labeling
protocols. This was evident from the
correlation obtained from the
comparison between the standard
versus the Small Sample Labeling
Protocol vll data (Figure 7).
To further investigate if the additional
cycle in the Small Sample Labeling
Protocol vII introduced amplification
bias, we conducted the detection call
concordance analysis.
10 ng
100 ng
5 µg
Figure 6. Reproducibility of the Small Sample Labeling Protocol vII. Comparison of
average CVs between a 5 µg sample processed with the standard protocol and
10 and 100 ng samples processed with the Small Sample Labeling Protocol vll
is shown. The trendlines representing a 200-probe set moving average of the
CVs were plotted against the average Signal Intensity.
Using both assays, various amounts of
starting materials were labeled, and the
data were analyzed using the MAS 5.0
software and its default analysis
parameters. The detection calls were
compared between samples to calculate
the percentage of probe sets that had
present/absent calls in common in the
two experiments. Conversely, the
percentage of discordant probe sets
were identified and compared. The
results are summarized in Table 3.
With 10 ng of starting material in
duplicate two-cycle labeling experiments,
the detection call concordance analysis
results provided a baseline as a “best
case” scenario (shown in Table 3A).
5 µg (Signal Intensity)
However, when amplifying 10 ng of
total RNA with the Small Sample
Labeling Protocol vII, the average CV
percent increases from 10 percent to
approximately 20 percent (Figure 6). We
speculate that such an increase is related
to the increased difficulty associated
with handling a very small amount of
material, especially in the first cDNA
synthesis steps.
Average CV %
Intensities over 100 are shown in
Figure 6 since the majority of the probe
sets with Signal Intensities below 100
were called as Absent.
10 ng (Signal Intensity)
Figure 7. Comparison between the Small Sample Labeling Protocol vII and the
Standard Procedure.
Less than 10 percent of the probe sets
were categorized as “Discordant” calls,
and the breakdown of these calls was
similar to those observed when
comparing the two standard labeling
experiments (data not shown).
Table 3.
Tables 3B, C, D, and E demonstrate
similar results, comparing 5 µg total
RNA from the standard assay to
gradually reducing amounts of
starting materials from 100 ng down
to 1 ng with the Small Sample
Labeling Protocol vII.
Detection Call Concordance Analysis.
P
P
10 ng
5 µg
B.
P
100 ng
P
A
P
A
41.4% 4.0%
1.9% 49.6%
5 µg
P
A
5 µg
P
A
C.
42.7% 4.9%
4.0% 45.2%
D.
10 ng
A
50 ng
P
A
5 µg
A
P
1 ng
A
42.2% 4.6%
4.4% 45.5%
E.
41.7% 3.9%
5.0% 46.3%
We found that the Small Sample
Labeling Protocol vII is suitable for
robustly amplifying and labeling as low
as 10 ng of total RNA for expression
profiling using GeneChip probe arrays.
The assay demonstrated good cRNA
yield, sensitivity, reproducibility, and
linear amplification.
10 ng
A.
Conclusions
P
A
A
38.7% 2.9%
7.7% 47.5%
Appendix I: Reagents and Materials Used in the Small Sample Labeling Protocol vII
Reagent Name
Vendor
Part Number
DEPC-treated water, 4L
Ambion
9920
T7-Oligo(dT) Promoter Primer, 50 µM, HPLC-purified
5’ – GGCCAGTGAATTGTAATACGACTCACTATAGGGAGGCGG – (dT)24 – 3’
Affymetrix
900375
SuperScript II, 200 U/µL, 40,000U
5X first strand buffer and 0.1M DTT included
Invitrogen
18064-071
dNTP mix, 10 mM, 100 µL
Invitrogen
18427-013
RNase inhibitor, 40 U/µL, 10,000U
Ambion
2684
5X second strand buffer, 500 µL
Invitrogen
10812-014
DNA ligase, E. coli, 10 U/µL, 100U
Invitrogen
18052-019
DNA polymerase I, E. coli, 10 U/µL, 1,000U
Invitrogen
18010-025
RNase H, 2 U/µL, 120U
Invitrogen
18021-071
T4 DNA polymerase, 5 U/µL, 250U
Invitrogen
18005-025
Glycogen, 5 mg/mL, 5,000 µL
Ambion
9510
Ammonium Acetate (NH4OAc), 5M
Ambion
9070G
MEGAscript T7 Kit
Ambion
1334
RNeasy Mini Kit
QIAGEN®
74104
β-Mercaptoethanol
Sigma
M-3148
Random primers, 3 µg/µL
Invitrogen
48190-011
ENZO® BioArray™ HighYield™ RNA Transcript Labeling Kit, 10 reactions
Affymetrix
900182
Miscellaneous Reagents
Ethanol, absolute, kept cold
Ethanol, 70%, kept cold
Appendix II: Small Sample Labeling Protocol vII
Recommendation: It is important to familiarize yourself with the protocol and handling of small amounts of
samples by practicing the procedure first with diluted total RNA samples.
Important points to note before starting:
1. Make a fresh dilution of the T7-Oligo(dT) promoter primer (5 µM), the random primers (0.2 µg/µL), and total RNA
(1 ng–100 ng, if diluted total RNA is used) each time.
2. When adding reagents, mix the components thoroughly by gently pipetting up and down several times.
Do not vortex the sample.
3. To ensure consistent results, keep the incubation time as close as possible to the instructions within the protocol.
First Cycle of Amplification
Step 1. First cycle, first strand cDNA synthesis
Note: Use a thermal cycler with a heated lid for incubations in this step. The following program can be used as
a reference; the 4°C hold steps are inserted to allow for reagent additions.
70°C
6 minutes
4°C
hold
42°C
60 minutes
70°C
10 minutes
4°C
hold
a. Mix the total RNA sample and the T7-Oligo(dT) promoter primer thoroughly in a 0.2 mL PCR tube:
Total RNA, 1 ng–100 ng
T7-Oligo(dT) promoter primer, 5 µM
Total volume
b.
c.
d.
e.
Incubate the sample at 70°C in a thermal cycler for 6 minutes.
Cool the sample to 4°C for 2 minutes.
Spin the tube briefly to collect the sample at bottom of tube.
Prepare the RT_Premix_1 as follows. It is recommended to assemble the master mix for at least four
reactions to avoid pipetting very small volumes.
DEPC-treated water
5X first strand buffer
DTT, 0.1M
dNTP mix, 10 mM
RNase inhibitor, 40 U/µL
SuperScript II, 200 U/µL
Total volume
f.
g.
h.
i.
j.
k.
1 µL
1 µL
2 µL
1 rxn
4 rxns
0.375 µL
1 µL
0.5 µL
0.375 µL
0.25 µL
0.5 µL
3 µL
1.5 µL
4 µL
2 µL
1.5 µL
1 µL
2 µL
12 µL
___ rxns
Add 3 µL of the RT_Premix_1 to the denatured RNA and primer mixture, making a final volume of 5 µL.
Mix the components thoroughly by pipetting gently up and down several times.
Spin the tube briefly to collect the sample at bottom of tube.
Incubate the sample at 42°C for 1 hour.
Heat the sample at 70°C for 10 minutes to inactivate SuperScript II.
Spin the tube briefly and cool the sample to 4°C.
Step 2. First cycle, second strand cDNA synthesis
Note: Use a thermal cycler without a heated lid for incubations in this step. The following program can be
used as a reference; the 4°C hold steps are inserted to allow for reagent additions.
16°C
120 minutes
4°C
hold
16°C
10 minutes
4°C
hold
a. Prepare the SS_Premix_1 as follows. It is recommended to assemble the master mix for at least four
reactions to avoid pipetting very small volumes.
1 rxn
4 rxns
__ rxns
DEPC-treated water
5X second strand buffer
dNTP mix, 10 mM
DNA ligase, E. coli, 10 U/µL
DNA polymerase I, E. coli, 10 U/µL
RNase H, 2 U/µL
Total volume
b.
c.
d.
e.
f.
g.
h.
22.75 µL
7.5 µL
0.75 µL
0.25 µL
1 µL
0.25 µL
32.5 µL
91 µL
30 µL
3 µL
1 µL
4 µL
1 µL
130 µL
Add 32.5 µL of the SS_Premix_1 to each first strand reaction, making a final volume of 37.5 µL.
Mix the components thoroughly by gently pipetting up and down a few times.
Spin the tube briefly to collect the sample at bottom of tube.
Incubate the sample at 16°C for 2 hours.
Add 1 µL of T4 DNA polymerase (5 U/µL) to the reaction.
Mix the components thoroughly by gently pipetting up and down a few times.
Continue to incubate the sample at 16°C for 10 minutes.
Step 3. First cycle, double-stranded cDNA cleanup by ethanol precipitation
a. Transfer the reaction, from the previous step, to a 1.5 mL centrifuge tube.
b. Add 80 µL of DEPC-treated water to dilute the reaction.
c. Add 2 µL of glycogen (5 mg/mL), 0.6 volumes (72 µL) of 5M NH4OAc, and 2.5 volumes (480 µL) of
cold absolute ethanol.
d. Mix the components well by pipetting up and down several times.
e. Precipitate the double-stranded cDNA at -20°C. For 10–100 ng of starting total RNA, the precipitation time may
be 30 minutes to 2 hours. For 1–10 ng of starting total RNA, overnight precipitation usually generates more
consistent results.
f. Centrifuge the tube at 14,000 rpm for 20 minutes at 4°C.
g. Remove the supernatant carefully and wash the pellet by adding 800 µL of 70% cold ethanol.
h. Centrifuge the tube at 14,000 rpm for 5 minutes at 4°C.
i. Remove the ethanol carefully.
j. Dry the pellet in a vacuum centrifuge for approximately 5–10 minutes.
Step 4. First cycle, IVT for cRNA amplification using Ambion MEGAscript T7 Kit
Notes:
i) Prepare premixed NTPs by adding equal amounts of each of the four NTPs (75 mM) provided in the kit.
ii) To ensure that the cDNA sample is dissolved completely, it is important to mix the reaction very well
after adding water and NTP mix to the dried cDNA pellet.
iii) The minimum IVT incubation time is 5 hours. This is particularly important if the starting sample
amount is as low as 1 ng of total RNA or from less than 100 cells.
iv) To bring down the condensation formed during the IVT incubation, it is important to mix the reaction
by gently tapping and briefly spinning the tube every 30–45 minutes.
v) In order to avoid sample loss, it is not recommended to transfer the sample to a fresh tube at this stage.
Perform the incubation in the 1.5 mL centrifuge tube in a water bath.
a. At room temperature, add the following reagents to the dried double-stranded cDNA pellet, in the order
indicated:
1 rxn
DEPC-treated water
Premixed NTPs, 18.75 mM each
10X reaction buffer
10X enzyme mix
Total volume
4 µL
4 µL
1 µL
1 µL
10 µL
___ rxns
b. Mix the components thoroughly after adding each reagent by gently pipetting up and down a few times.
c. Spin the tube briefly to collect the sample at bottom of tube.
d. Incubate the sample at 37°C in a water bath for 5–6 hours.
Step 5. First cycle, cRNA cleanup with RNeasy columns
a. Add 90 µL of RNase-free water to the cRNA product from the previous step.
b. Follow the RNeasy Mini Protocol for RNA Cleanup in the handbook from QIAGEN that accompanies the
RNeasy Mini Kit for cRNA purification.
c. In the last step of purification, elute the cRNA sample with 30 µL of RNase-free water first, and follow
with an additional 20 µL of water for the second elution.
d. To determine cRNA yield, remove 2 µL of the cRNA, and add to 98 µL of water to measure the absorbance
at 260 nm.
e. Use the following table to calculate the volume of cRNA to be used in the second cycle amplification and
labeling reactions:
Starting Total RNA
cRNA Yield After First IVT
cRNA to be Used for Second Cycle
100 ng
50 ng
10 ng
1 ng
1–2 µg in 50 µL
1–2 µg in 50 µL
Undetectable
Undetectable
>=10 µL or (200–400 ng)
>=10 µL or (200–400 ng)
All
All
Note: If the yield is less than those indicated in the table, use the entire RNeasy column eluate (50 µL)
for the second cycle of cDNA synthesis.
f. Transfer the appropriate volume of cRNA from above to a fresh 1.5 mL centrifuge tube and use vacuum
centrifuge with medium heat to reduce the sample volume to no more than 4 µL. Avoid complete drying
of the liquid. The cRNA can be stored at -20°C at this point before proceeding to the next step.
Note: If the cRNA sample is completely dried in the vacuum centrifuge, add 10 µL of RNase-free water and incubate at
42°C for 10 minutes to resuspend the sample completely. The volume will then need to be reduced to no more than
4 µL in the vacuum centrifuge before proceeding to the next step.
Second Cycle of Amplification and Labeling
Step 6. Second cycle, first strand cDNA synthesis
Notes:
Use heat blocks for incubations in this step.
a. Add random primers to the cRNA sample in the 1.5 mL centrifuge tube and mix thoroughly:
cRNA, variable
Random primers, 0.2 µg/µL
Total volume
b.
c.
d.
e.
4 µL
1 µL
5 µL
Spin the tube briefly to collect sample at bottom of tube.
Incubate the sample at 70°C for 10 minutes.
Cool the sample on ice for 2 minutes.
Prepare the RT_Premix_2 as follows. It is recommended to assemble the master mix for at least two
reactions to avoid pipetting very small volumes.
5X first strand buffer
DTT, 0.1M
dNTP mix, 10 mM
RNase inhibitor, 40 U/µL
SuperScript II, 200 U/µL
Total volume
1 rxn
2 rxns
2 µL
1 µL
0.5 µL
0.5 µL
1 µL
5 µL
4 µL
2 µL
1 µL
1 µL
2 µL
10 µL
__ rxns
f. Add 5 µL of the RT_Premix_2 to the denatured RNA and primer mixture, making a final volume of 10 µL.
g. Mix the components thoroughly by gently pipetting up and down several times.
h. Spin the tube briefly to collect sample at bottom of tube.
i. Incubate the sample at 42°C for 1 hour and spin briefly.
j. To remove the RNA template, add 1 µL of RNase H (2 U/µL) and incubate the sample for 20 minutes at 37°C.
k. Heat the sample at 95°C for 5 minutes to inactivate RNase H.
l. Chill the sample on ice for 2 minutes.
m. Spin the tube briefly to collect sample at bottom of tube.
Step 7. Second cycle, second strand cDNA synthesis with T7-Oligo(dT) promoter primer
Note: Use heat blocks and a water bath for incubations in this step. Alternatively, transfer sample to a 0.2 mL
PCR tube and perform the incubations in a thermal cycler without a heated lid. The following program
can be used as a reference; the 4°C hold steps are inserted to allow for reagent additions.
70°C
6 minutes
4°C
hold
16°C
120 minutes
4°C
hold
16°C
10 minutes
4°C
hold
a.
b.
c.
d.
e.
f.
Add 2.0 µL of the 5 µM T7-Oligo(dT) promoter primer to the chilled sample from the previous step.
Mix the sample thoroughly by gently pipetting up and down a few times.
Spin the tube briefly to collect sample at bottom of tube.
Incubate the sample at 70°C for 6 minutes.
Cool the sample to 4°C and spin the tube briefly.
Prepare the SS_Premix_2 as follows:
1 rxn
___ rxns
DEPC-treated water
5X second strand buffer
dNTP mix, 10 mM
DNA polymerase I, E. coli, 10 U/µL
Total volume
g.
h.
i.
j.
k.
l.
43.5 µL
15 µL
1.5 µL
2 µL
62 µL
Add 62 µL of the SS_Premix_ 2 to the sample, making a total volume of 75 µL.
Mix the components thoroughly by pipetting gently up and down a few times.
Spin the tube briefly to collect sample at bottom of tube.
Incubate the sample at 16°C for 2 hours.
Add 2 µL of T4 DNA polymerase (5 U/µL) to the reaction and mix thoroughly.
Incubate the sample at 16°C for 10 minutes.
Step 8. Second cycle, double-strand cDNA cleanup by ethanol precipitation
a. To the reaction tube, add 2 µL of 5 mg/mL glycogen, 0.6 volume of 5M NH4OAc, and 2.5 volumes
of cold absolute ethanol.
b. Mix the reaction well by pipetting up and down several times.
c. Precipitate the double-stranded cDNA at -20°C for 30 minutes.
d. Centrifuge the tube at 14,000 rpm for 20 minutes at 4°C.
e. Remove the supernatant carefully and wash the cDNA pellet by adding 800 µL of 70% cold ethanol.
f. Centrifuge the tube at 14,000 rpm for 5 minutes at 4°C.
g. Remove the ethanol carefully.
h. Dry the sample in a vacuum centrifuge for approximately 5–10 minutes, or until dry. The cDNA pellet
can be stored at -20°C overnight before proceeding to Step 9.
Step 9. Second cycle, IVT for cRNA amplification and labeling with ENZO BioArray HighYield RNA Transcript
Labeling Kit
Notes:
Use a water bath for incubations in this step.
a. At room temperature, add the following reagents to the dried double-stranded cDNA pellet, from the
previous step, in the following order:
1 rxn
___ rxns
DEPC-treated water
10X HY reaction buffer
10X Biotin labeled ribonucleotides
10X DTT
10X RNase inhibitor mix
20X T7 RNA polymerase
Total volume
22 µL
4 µL
4 µL
4 µL
4 µL
2 µL
40 µL
b. Mix the components thoroughly after adding each reagent, especially after adding water, ensuring
the cDNA pellet is completely dissolved.
c. Spin the tube briefly to collect sample at bottom of tube.
d. Incubate the sample at 37°C for 4–5 hours. To bring down condensation formed during incubation,
mix the sample reaction by gently tapping and briefly spinning the tube every 30–45 minutes.
Step 10. Second cycle, labeled cRNA target cleanup with RNeasy columns
a. Add 60 µL of RNase-free water to the cRNA product from the previous step.
b. Follow the RNeasy Mini Protocol for RNA Cleanup in the handbook from QIAGEN that accompanies
the RNeasy Mini Kit for cRNA purification.
c. In the last step of cRNA purification, elute the product with 30 µL of RNase-free water first, and then
follow with another 20 µL of water for the second time.
d. Remove 2 µL of the labeled cRNA, and add it to 98 µL of water in order to measure the absorbance at
260 nm, determining the cRNA yield.
Step 11. Fragmentation and Hybridization
Follow the instructions described in the GeneChip® Expression Analysis Technical Manual for the
fragmentation, hybridization, washing, and staining steps.
For research use only.
Not for use in diagnostic procedures.
AFFYMETRIX, INC.
AFFYMETRIX UK Ltd
3380 Central Expressway
Santa Clara, CA 95051 U.S.A.
Tel: 1-888-362-2447 (1-888-DNA-CHIP)
Fax: 1-408-731-5441
[email protected]
[email protected]
Voyager, Mercury Park,
Wycombe Lane, Wooburn Green,
High Wycombe HP10 0HH
United Kingdom
Tel: +44 (0)1628 552550
Fax: +44 (0)1628 552585
[email protected]
[email protected]
www.affymetrix.com
Part No. 701265 Rev. 3
®
®
©2002 Affymetrix, Inc. All rights reserved. Affymetrix®,GeneChip®,
,
™,
, HuSNP®, Jaguar™, EASI™, MicroDB™, GenFlex®, CustomExpress™, CustomSeq™,
NetAffx™, ‘Tools to take you as far as your vision™’, and ‘The Way Ahead™’ are trademarks owned or used by Affymetrix, Inc. Products may be covered by one or more of the
following patents and/or sold under license from Oxford Gene Technology: U.S. Patent Nos. 5,445,934; 5,744,305; 6,261,776; 6,291,183; 5,700,637; 5,945,334; 6,346,413; and
6,399,365; and EP 619 321; 373 203 and other U.S. or foreign patents.


© Copyright 2026