
Astronomy Astrophysics
Astronomy
&
Astrophysics
A&A 529, A106 (2011)
DOI: 10.1051/0004-6361/201015264
c ESO 2011
C-GOALS: Chandra observations of a complete sample
of luminous infrared galaxies from the IRAS Revised
Bright Galaxy Survey
K. Iwasawa1 , D. B. Sanders2 , S. H. Teng3 , V. U2,4, , L. Armus5 , A. S. Evans6 , J. H. Howell5 , S. Komossa7 ,
J. M. Mazzarella8 , A. O. Petric5 , J. A. Surace5 , T. Vavilkin9 , S. Veilleux3 , and N. Trentham10
1
2
3
4
5
6
7
8
9
10
ICREA and Institut de Ciències del Cosmos (ICC), Universitat de Barcelona (IEEC-UB), Martí i Franquès, 1, 08028 Barcelona,
Spain
e-mail: [email protected]
Institute for Astronomy, 2680 Woodlawn Drive, Honolulu, Hawaii 96822, USA
Department of Astronomy, University of Maryland, College Park, MD 20742, USA
SAO Predoctoral Fellow, Harvard-Smithsonian Center for Astrophysics, Cambridge, MA 02138, USA
Spitzer Science Center, California Institute of Technology, Pasadena, CA 91125, USA
Department of Astronomy, University of Virginia, 530 McCormick Road, Charlottesville, VA 22904 and NRAO,
520 Edgemont Road, Charlottesville, VA 22903, USA
Max Planck Institut für extraterrestrische Physik, Gießenbachstraße, 85748 Garching, Germany
IPAC, California Institute of Technology, Pasadena, CA 91125, USA
Department of Physics and Astronomy, State University of New York at Stony Brook, NY 11794, USA
Institute of Astronomy, Madingley Road, Cambridge CB3 0HA, UK
Received 23 June 2010 / Accepted 25 February 2011
ABSTRACT
We present X-ray data for a complete sample of 44 luminous infrared galaxies (LIRGs), obtained with the Chandra X-ray Observatory.
These are the X-ray observations of the high luminosity portion of the Great Observatory All-sky LIRG Survey (GOALS), which
includes the most luminous infrared selected galaxies, log (Lir /L ) ≥ 11.73, in the local universe, z ≤ 0.088. X-rays were detected
from 43 out of 44 objects, and their arcsec-resolution images, spectra, and radial brightness distributions are presented. With a
selection by hard X-ray colour and the 6.4 keV iron line, AGN are found in 37% of the objects, with higher luminosity sources more
likely to contain an AGN. These AGN also tend to be found in late-stage mergers. The AGN fraction would increase to 48% if objects
with [Ne v]λ14.3 μm detection are included. Double AGN are clearly detected only in NGC 6240 among 24 double/triple systems.
Other AGN are found either in single nucleus objects or in one of the double nuclei at similar rates. Objects without conventional
X-ray signatures of AGN appear to be hard X-ray quiet, relative to the X-ray to far-IR correlation for starburst galaxies, as discussed
elsewhere. Most objects also show extended soft X-ray emission, which is likely related to an outflow from the nuclear region, with a
metal abundance pattern suggesting enrichment by core collapse supernovae, as expected for a starburst.
Key words. infrared: galaxies – X-rays: galaxies – galaxies: active – galaxies: starburst
1. Introduction
The Great Observatory All-sky LIRGs Survey (GOALS, Armus
et al. 2009) is a multi-wavelength study of the most luminous infrared galaxies in the local Universe, selected from the
60 μm flux limited IRAS Revised Bright Galaxy Sample (RBGS:
Sanders et al. 2003). As the brightest far-infrared selected galaxies in the sky, these objects are the most amenable for study at
all wavelengths.
Luminous infrared galaxies (LIRGs: Lir > 1011 L 1 ) have
proven to be an extremely important class of extragalactic objects. In the local Universe they are more numerous than optically selected starburst and Seyfert galaxies and quasi-stellar
objects (QSOs) at comparable bolometric luminosity. Strong interactions and mergers of gas-rich spirals appear to be the trigger for the most luminous infrared objects, which are fueled by a
mixture of intense starbursts and AGN, with the latter becoming
1
NASA Jenkins Predoctoral Fellow.
Lir ≡ L(8−1000 μm).
more dominant with increasing Lir . At the highest luminosities,
ultraluminous infrared galaxies (ULIRGs: Lir > 1012 L ), may
represent an important stage in the formation of QSOs and powerful radio galaxies, and they may also represent a primary stage
in the formation of massive ellipticals, the formation of globular
clusters, and the metal enrichment of the intergalactic medium
(see Sanders & Mirabel 1996, for a more complete review and,
e.g., Chapman et al. 2005; Hopkins et al. 2006; Veilleux et al.
2009, for recent developments).
The X-ray survey data presented here (C-GOALS) is the
X-ray component of the GOALS multi-wavelength survey. This
initial C-GOALS paper presents data obtained by us and others with the Chandra X-ray Observatory (Chandra, hereafter).
Data obtained by us in Cycles 7 + 8 have been combined with
data from the Chandra Archive to produce the first complete
X-ray survey of the most luminous sources in the GOALS sample. Previous X-ray investigations of LIRGs, either by Chandra,
XMM-Newton or Suzaku, have been presented in Ptak et al.
(2003), Franceschini et al. (2003), Teng et al. (2005, 2009), and
Grimes et al. (2005).
Article published by EDP Sciences
A106, page 1 of 50
A&A 529, A106 (2011)
Fig. 1. The distribution of infrared luminosity, Lir (8−1000 μm) for the
44 objects in our C-GOALS sample with log (Lir /L ) = 11.73−12.57.
For the infrared luminosity, we have chosen to use units of erg s−1 (bottom axis), rather than the unit of L (top axis) normally used in infrared
astronomy, in order to be consistent with X-ray luminosity measurements.
The C-GOALS sample and observations are described in
Sects. 2 and 3, respectively, with the major results (X-ray images, flux density spectra, radial surface brightness profiles) presented in Sect. 4. Derived properties from the X-ray spectra, and
a discussion of trends of X-ray properties with infrared luminosity are presented in Sect. 5. A summary of our results is given
in Sect. 6. Notes for each object are presented in the Appendix.
The cosmology adopted here is consistent with that adopted by
Armus et al. (2009). Cosmological distances were computed by
first correcting for the 3-attractor flow model of Mould et al.
(2000) and adopting H0 = 70 km s−1 Mpc−1 , ΩV = 0.72, and
ΩM = 0.28 based on the 5-year WMAP results (Hinshaw et al.
2009), as provided by the NASA/IPAC Extragalactic Database
(NED).
2. The sample
The RBGS is a complete sample of 629 extragalactic objects
with IRAS 60 μm flux density greater than 5.24 Jy, covering
the full sky above Galactic latitude |b| > 5◦ . The GOALS sample contains 202 “systems” (77 of which contain multiple galaxies), drawn from the RBGS with the luminosity threshold Lir ≥
1011 L (see Armus et al. 2009, for further details). The current C-GOALS sample represents the high luminosity part of the
GOALS sample, and is complete down to log (Lir /L ) = 11.73.
The object with the largest IR luminosity, log (Lir /L ) = 12.57,
is UGC 8058 (hereafter the more common name, Mrk 231, is
used in the text). Table 1 gives basic data for all 44 galaxies in
the C-GOALS sample. The redshift range is z = 0.010–0.088.
The median IR luminosity of the sample log (Lir /L ) = 11.99
corresponding to log Lir = 45.58 (erg s−1 ). The distribution of
infrared luminosity is shown in Fig. 1.
3. Observations and data reduction
Twenty-six objects were observed with Chandra in Cycle-8 (PI:
D. Sanders) with a uniform 15 ks exposure on each target. All the
observations were carried out in imaging mode with the ACISS detector operated in VFAINT mode. The Chandra data for
the remaining 18 targets were taken from the Archive, including
four galaxies in the Cycle 7 mini survey of LIRGs with double
A106, page 2 of 50
nuclei (UGC 4881, VV 705, F08572+3915, and F14348–1447)
(PI: S Komossa). The exposure times for these 4 objects are also
15 ks each. For other archival data, the exposure times vary from
10 ks to 154 ks. The observation log for the 44 galaxies is shown
in Table 2. Where multiple Chandra observations are found, an
imaging observation with the ACIS-S is chosen. For Mrk 231,
four ACIS-S observations exist in the archive, and we use all
four to construct and analyze the X-ray images, while only the
first observation was used for the analysis of the radial surface
brightness profiles and the X-ray colour, since the source is not
variable and the single observation provides good quality data
for this purpose.
In Table 2, the Galactic HI column density, estimated from
the Leiden/Argentine/Bonn (LAB) survey (Kalberla et al. 2005),
is also quoted. Some of the Cycle-8 targets lie at low Galactic
latitudes and thus have been little studied because of high
Galactic extinction. The Galactic HI absorption column exceeds
1021 cm−2 for six objects.
The data reduction was performed using the Chandra
data analysis package CIAO version 3.4.1, and HEASARC’s
FTOOLS.
4. Results
Basic X-ray properties obtained from the Chandra data are presented in Table 3. For each object, the ACIS-S count rates
in the soft (0.5–2 keV) and hard (2–7 keV) bands, the X-ray
colour, estimated X-ray fluxes, X-ray luminosities in the two
bands, and their logarithmic ratio to the infrared luminosity,
Lir (8−1000 μm), are listed. The count rates are computed for
spatially distinctive components within a single object when
they are clearly resolved, as opposed to the source counts in
Table 2, which were collected from the whole X-ray emitting
region per object. Similarly, IR luminosity is divided into respective components, estimated from IRAS HIRES processing
(Surace et al. 2004) and new estimates based on Spitzer MIPS
photometry (see Howell et al. 2010). The X-ray colour is defined
as HR = (H −S )/(H +S ), often referred as the “Hardness Ratio”,
where H and S are background-corrected counts in the 2–8 keV
and 0.5–2 keV bands, respectively.
We use the energy ranges, particularly for the hard X-ray
band, that are slightly different from one another, but optimized
for different purposes, which can sometimes be confusing. Here,
we summarize the choice of the energy ranges used in this paper. 1) 0.4–7 keV: this is effectively the full ACIS-S bandpass,
and used only for observed counts; 2) 0.5–2 keV: the soft X-ray
band is always this range; 3) 2–8 keV: the choice of this band is
to match the conventional calculation of hardness ratio, HR, and
used only for the hard band counts in Table 3. The quoted counts
are as observed, although the majority of our sources have negligible counts above 7 keV where the background would simply
increases; 4) 2–7 keV: this is the nominal range for our observed
hard band flux, estimated from spectral fitting, and optimized
for the signal to noise ratio of the data for the majority of our
sources for the reason mentioned above; and 5) 2–10 keV: for
the hard band luminosity, we opted to use this extended range
for a purpose of comparison with results from other X-ray observatories, since the 2–10 keV is the standard band for missions
like XMM-Newton.
The images, spectra, colour and the selection of AGN based
on the colour, the correlation of X-ray and infrared luminosities
and the surface brightness distribution of individual objects are
presented in the subsections below.
K. Iwasawa et al.: C-GOALS survey
Table 1. The C-GOALS sample.
No.
IRAS Name
(1)
1
2
3
4
5
6
7
8
9
10
11
12
13
14
15
16
17
18
19
20
21
22
23
24
25
26
27
28
29
30
31
32
33
34
35
36
37
38
39
40
41
42
43
44
(2)
F01364–1042
F04454–4838
F05081+7936
F05189–2524
F06259–4708
07251–0248
F08520–6850
F08572+3915
09022–3615
F09111–1007
F09126+4432
F09320+6134
F10038–3338
F10173+0828
F10565+2448
F11257+5850
F12112+0305
F12540+5708
13120–5453
F13136+6223
F13182+3424
F13428+5608
F14348–1447
F14378–3651
F14547+2449
F15163+4255
F15250+3608
F15327+2340
F16330–6820
F16504+0228
F17132+5313
F17207–0014
F18293–3413
F19115–2124
F19297–0406
19542+1110
F20550+1655
F20551–4250
21101+5810
F22467–4906
F22491–1808
F23128–5919
F23180–6929
F23365+3604
Optical ID
(3)
IRAS F01364–1042
ESO 203-IG1
VII Zw 31
IRAS F05189–2524
ESO 255-IG7
IRAS 07251–0248
ESO 60-IG16
IRAS F08572+3915
IRAS 09022–3615
IRAS F09111–1007
UGC 4881
UGC 5101
ESO 374-IG 032a
IRAS F10173+0828
IRAS F10565+2448
NGC 3690
IRAS F12112+0305
UGC 8058
IRAS 13120–5453
VV 250a
UGC 8387
UGC 8696
IRAS F14348–1447
IRAS F14378–3651
VV 340a
VV 705
IRAS F15250+3608
UGC 9913
ESO 69-IG6
NGC 6240
IRAS F17132+5313
IRAS F17207–0014
IRAS F18293–3413
ESO 593-IG8
IRAS F19297–0406
IRAS 19542+1110
CGCG 448-020
ESO 286-IG19
IRAS 21101+5810
ESO 239-IG2
IRAS F22491–1808
ESO 148-IG2
ESO 77-IG14
IRAS F23365+3604
RA (NED)
(J2000)
(4)
01h38m52.92s
04h46m49.50s
05h16m46.44s
05h21m01.47s
06h27m22.45s
07h27m37.55s
08h52m31.29s
09h00m25.39s
09h04m12.70s
09h13m37.61s
09h15m55.11s
09h35m51.65s
10h06m04.80s
10h20m00.21s
10h59m18.14s
11h28m32.25s
12h13m46.00s
12h56m14.23s
13h15m06.35s
13h15m35.06s
13h20m35.34s
13h44m42.11s
14h37m38.37s
14h40m59.01s
14h57m00.68s
15h18m06.28s
15h26m59.40s
15h34m57.12s
16h38m12.65s
16h52m58.89s
17h14m20.00s
17h23m21.96s
18h32m41.13s
19h14m30.90s
19h32m21.25s
19h56m35.44s
20h57m23.90s
20h58m26.79s
21h11m30.40s
22h49m39.87s
22h51m49.26s
23h15m46.78s
23h21m04.53s
23h39m01.27s
Dec (NED)
(J2000)
(5)
–10d27m11.4s
–48d33m32.9s
+79d40m12.6s
–25d21m45.4s
–47d10m48.7s
–02d54m54.1s
–69d01m57.0s
+39d03m54.4s
–36d27m01.1s
–10d19m24.8s
+44d19m54.1s
+61d21m11.3s
–33d53m15.0s
+08d13m33.8s
+24d32m34.3s
+58d33m44.0s
+02d48m38.0s
+56d52m25.2s
–55d09m22.7s
+62d07m28.6s
+34d08m22.2s
+55d53m12.7s
–15d00m22.8s
–37d04m32.0s
+24d37m02.7s
+42d44m41.2s
+35d58m37.5s
+23d30m11.5s
–68d26m42.6s
+02d24m03.4s
+53d10m30.0s
–00d17m00.9s
–34d11m27.5s
–21d19m07.0s
–03d59m56.3s
+11d19m02.6s
+17d07m39.0s
–42d39m00.3s
+58d23m03.2s
–48d50m58.1s
–17d52m23.5s
–59d03m15.6s
–69d12m54.2s
+36d21m08.7s
z
(km s−1 )
(6)
0.0483
0.0529
0.0537
0.0425
0.0388
0.0875
0.0463
0.0584
0.0596
0.0541
0.0393
0.0394
0.0341
0.0491
0.0431
0.0104
0.0733
0.0422
0.0308
0.0311
0.0233
0.0378
0.0827
0.0676
0.0337
0.0402
0.0552
0.0182
0.0464
0.0245
0.0509
0.0428
0.0182
0.0487
0.0857
0.0650
0.0361
0.0430
0.0390
0.0430
0.0778
0.0446
0.0416
0.0645
DL
(Mpc)
(7)
210.0
235.0
240.0
187.0
173.0
400.0
210.0
264.0
271.0
246.0
178.0
177.0
156.0
224.0
197.0
50.7
340.0
192.0
144.0
142.0
110.0
173.0
387.0
315.0
157.0
183.0
254.0
87.9
212.0
116.0
232.0
198.0
86.0
222.0
395.0
295.0
161.0
193.0
174.0
191.0
351.0
199.0
186.0
287.0
log (Lir )
(L )
(8)
11.85
11.86
11.99
12.16
11.90
12.39
11.82
12.16
12.31
12.06
11.74
12.01
11.78
11.86
12.08
11.93
12.36
12.57
12.32
11.81
11.73
12.21
12.39
12.23
11.74
11.92
12.00
12.28
11.98
11.93
11.96
12.46
11.88
11.93
12.45
12.12
11.94
12.06
11.81
11.84
12.20
12.06
11.76
12.20
Other name
(9)
Arp 55
Arp 299
Mrk 231
Arp 238
IC 883, Arp 193
Mrk 273
Arp 302
I Zw 107
Arp 220
II Zw 96
Notes. (a) When the IRAS Revised Bright Galaxy Sample (RBGS, Sanders et al. 2003) was compiled, IRAS F10038–3338 was mistakenly crossidentified with the optical source IC 2545. The proper optical counterpart is ESO 374-IG 032. (See the Essential Notes in NED.) Column (1):
through number of the object, which are also used in other tables and Fig. 2. Column (2): original IRAS source, where an “F” prefix indicates
the Faint Source Catalog and no prefix indicates the Point Source Catalog. Column (3): optical cross-identification, where available from NED.
Column (4): the best available source right ascension (J2000) in NED as of October 2008. Column (5): the best available source declination (J2000)
in NED as of October 2008. Column (6): the best available heliocentric redshift, in NED as of October 2008. Column (7): the luminosity distance
in megaparsecs derived by correrecting the heliocentric velocity for the 3-attractor flow model of Mould et al. (2000) and adopting cosmological
parameters H0 = 70 km s−1 Mpc−2 , ΩV = 0.72, and ΩM = 0.28 based on the 5-year WMAP results (Hinshaw et al. 2009), as provided by NED.
Column (8): the total infrared luminosity in log10 Solar units computed using the flux densities reported in the RBGS and the lumiosity distances
in Col. (7) using the formulae Lir /L = 4π(DL[m] )2 (Fir [W m−2 ])/3.826 × 1026 [W m−2 ], where Fir = 1.8 × 10⁻¹⁴ {13.48 f12 μm [Jy] + 5.16 f25 μm [Jy] +
2.58 f60 μm [Jy] + f100 μm [Jy]} [W m−2 ] (Sanders & Mirabel 1996). Column (9): other conventionally used object name.
4.1. Images
Figure 2 shows the X-ray brightness contours overlaid on the
HST-ACS F814W (I-band) image (Evans et al., in prep.) for
all 44 targets. The contours are made from a 0.4–7 keV image,
smoothed using a circular Gaussian filter with typical dispersion of 1 arcsec. Note that the deep image of Mrk 231 reaches a
significantly lower brightness level, and thus the contour levels
are drawn down to a level which is a factor of 10 lower than for
the other objects.
The appearance of the X-ray images often differs dramatically between the soft and hard bands. In addition to the full
band (0.4–7 keV) image in unsmoothed (0.5 × 0.5 pixel size)
and smoothed forms, images of the same region of the sky in the
A106, page 3 of 50
A&A 529, A106 (2011)
Table 2. Chandra observation log.
No.
Galaxy
Obs ID
Date
Mode
Exp. Time
(ks)
0.4–7 keVa
(cts)
NH,Gal b
(1020 cm−2 )
1
2
3
5
6
7
9
10
13
14
19
20
21
24
25
29
31
33
34
35
36
37
39
40
41
43
F01364–1042
ESO 203-IG1
VII Zw 31
ESO 255-IG7
07251–0248
ESO 60-IG16
09022–3615
F09111–1007
ESO 374-IG32
F10173+0828
13120–5453
VV 250
UGC 8387
F14378–3651
VV 340
ESO 69-IG6
F17132+5313
F18293-3413
ESO 593-IG8
F19297–0406
19542+1110
CGCG 448-020
21101+5810
ESO 239-IG2
F22491–1808
ESO 77-IG14
7801
7802
7887
7803
7804
7888
7805
7806
7807
7808
7809
7810
7811
7889
7812
7813
7814
7815
7816
7980
7817
7818
7819
7820
7821
7822
Cycle 8 targets
2007 Sep. 10 VFAINT
2008 Jan. 17
VFAINT
2007 May 27 VFAINT
2007 May 27 VFAINT
2006 Dec. 01 VFAINT
2007 May 31 VFAINT
2007 Sep. 04 VFAINT
2007 Mar. 20 VFAINT
2007 Mar. 07 VFAINT
2008 Jan. 18
VFAINT
2006 Dec. 01 VFAINT
2007 Aug. 22 VFAINT
2007 Feb. 19 VFAINT
2007 Jun. 25
VFAINT
2006 Dec. 17 VFAINT
2007 Jun. 21
VFAINT
2007 Apr. 03 VFAINT
2007 Feb. 25 VFAINT
2007 Jun. 09
VFAINT
2007 Jun. 18
VFAINT
2007 Sep. 10 VFAINT
2007 Sep. 10 VFAINT
2007 Jul. 01
VFAINT
2007 Sep. 10
VFATIN
2007 Jul. 13
VFAINT
2008 Jan. 26
VFAINT
14.57
14.85
14.98
14.57
15.43
14.68
14.85
14.63
14.36
14.98
14.67
14.85
14.07
13.86
14.86
14.54
14.85
14.04
14.97
16.42
14.98
14.56
14.85
14.57
14.97
14.98
46.0 ± 7.3
0 (<3)
173.8 ± 13.3
341.8 ± 18.8
12.7 ± 3.6
122.6 ± 11.1
265.3 ± 16.5
118.7 ± 11.1
75.0 ± 9.1
9.8 ± 3.2
300.7 ± 17.4
391.9 ± 20.1
251.4 ± 16.0
45.3 ± 6.8
331.4 ± 20.4
330.1 ± 18.3
90.8 ± 10.0
444.6 ± 21.5
158.1 ± 13.7
85.8 ± 9.7
324.3 ± 18.0
301.3 ± 18.2
21.7 ± 4.8
151.5 ± 13.1
50.9 ± 7.3
84.1 ± 9.3
2.0
1.4
7.4
3.8
14.6
5.2
26.6
4.6
8.8
2.3
21.3
2.0
1.0
6.3
3.3
9.1
1.9
9.7
8.1
15.1
14.0
6.9
37.2
0.9
2.3
3.3
4
8
11
12
15
16
17
18
18
18
18
22
23
26
27
28
30
32
38
42
44
F05189-2524
F08572+3915
UGC 4881
UGC 5101
F10565+2448
NGC 3690
F12112+0305
UGC 8058
UGC 8058
UGC 8058
UGC 8058
UGC 8696
F14348-1447
VV 705
F15250+3608
UGC 9913
NGC 6240
F17207-0014
ESO 286-IG19
ESO 148-IG2
F23365+3604
3432
6862
6857
2033
4552
6227
4110
1031c
4028
4029
4030
809
6861
6858
4112
869
1590
2035
2036
2037
4115
Archival data
2002 Jan. 03
FAINT
2006 Jan. 26
FAINT
2006 Jan. 12
FAINT
2001 May 28
FAINT
2003 Oct. 23
FAINT
2005 Feb. 14
FAINT
2003 Apr. 15 VFAINT
2000 Oct 19
FAINT
2003 Feb. 03 VFAINT
2003 Feb. 11 VFAINT
2003 Feb. 20 VFAINT
2000 Apr. 19 VFAINT
2006 Mar. 12
FAINT
2006 Sep. 11
FAINT
2003 Aug. 27 VFAINT
2000 Jun. 24
FAINT
2001 Jul. 29
FAINT
2001 Oct. 24
FAINT
2001 Oct. 31
FAINT
2001 Sep. 30
FAINT
2003 Feb. 03 VFAINT
14.86
14.94
14.77
49.32
28.87
10.19
9.87
39.25
39.68
38.63
36.01
44.19
14.72
14.47
9.84
56.49
36.69
48.53
44.87
49.31
10.10
2016.9 ± 45.0
9.7 ± 3.2
69.4 ± 8.4
482.9 ± 22.3
335.2 ± 18.8
2526.0 ± 52.1
42.6 ± 6.6
2312.5 ± 66.2
2205.6 ± 59.7
2070.5 ± 57.3
1876.6 ± 52.0
2054.0 ± 45.8
75.9 ± 8.8
157.8 ± 12.6
26.6 ± 5.3
1555.1 ± 47.1
10010.7 ± 103.5
476.6 ± 23.1
767.8 ± 28.3
1052.2 ± 34.9
28.8 ± 5.4
1.7
2.0
1.4
3.0
1.1
0.9
1.8
1.0
1.0
1.0
1.0
0.9
7.5
1.8
1.5
3.9
4.9
9.7
3.3
1.6
9.6
Notes. The 26 Cycle 8 Chandra observations (PI: D. Sanders) are listed first, followed by archival data for the additional 18 objects with
log (Lir /L ) > 11.73. All observations were obtained in imaging mode with the ACIS-S, and the targets were placed at the nominal pointing
position on the detector. (a) The source counts are corrected for background and measured in the 0.4–7 keV band. The counts from separate components in a single objects are summed together. (b) The Galactic absorption column density is taken from the LAB HI map by Kalberla et al.
(2005). (c) This observation was used to make the radial surface-brightness profile.
soft (0.5–2 keV) and hard (2–7 keV) bands are shown. The same
smoothing has been applied to the 0.5–2 keV and 2–7 keV images. Linear scaling is normally used for presentation, but for a
few sources with strongly peaked emission, a logarithmic scale
was used to show faint extended features. The scale bar represents an angular scale of 5 arcsec. The soft (0.5–2 keV) and
hard (2–7 keV) band radial profiles, described in the following
section, are also shown. An example for these figures is shown
A106, page 4 of 50
in Fig. 3 for UGC 8387. Similar style multi-panel figures were
made for all 44 C-GOALS targets and these can be found in the
Appendix.
As seen clearly in UGC 8387, soft X-ray nebulae extending
along the minor axis of the galaxy, or in the direction displaced
from the optical light distribution, are often observed. These extended SX nebulae are likely associated with a galactic-scale
outflow from the nuclear region, driven by either a starburst or
K. Iwasawa et al.: C-GOALS survey
Table 3. X-ray spectral properties for the C-GOALS sample.
No.
Galaxy
SX
(1)
HX
(2)
1
2
3
5
5
5
6
7
9
10
10
13
14
19
20
20
21
24
25
25
29
29
31
33
34
35
36
37
39
40
41
43
43
F01364–1042
ESO 203-IG1
VII Zw 31
ESO 255-IG7 N
ESO 255-IG7 C
ESO 255-IG7 S
07251–0248
ESO 60-IG16
09022–3615
F09111–1007E
F09111–1007W
ESO 374-IG32
F10173+0828
13120–5453
VV 250 E
VV 250 W
UGC 8387
F14378–3651
VV 340 N
VV 340 S
ESO 69-IG6 (N)
ESO 69-IG6 (S)
F17132+5313
F18293–3413
ESO 593-IG8
F19297–0406
19542+1110
CGCG 448-020
21101+5810
ESO 239-IG2
F22491–1808
ESO 77-IG14 N
ESO 77-IG14 S
2.14 ± 0.41
0.00 ± 0.20
9.49 ± 0.80
12.40 ± 0.93
4.77 ± 0.57
1.53 ± 0.33
0.77 ± 0.22
3.24 ± 0.47
10.45 ± 0.84
5.27 ± 0.60
1.20 ± 0.29
4.02 ± 0.55
0.59 ± 0.21
11.63 ± 0.89
16.90 ± 1.08
1.78 ± 0.36
13.77 ± 0.99
1.92 ± 0.38
16.58 ± 1.08
2.35 ± 0.41
8.88 ± 0.79
2.19 ± 0.39
5.13 ± 0.60
22.92 ± 1.29
9.01 ± 0.81
3.85 ± 0.49
4.80 ± 0.57
15.91 ± 1.07
1.17 ± 0.29
9.14 ± 0.83
3.19 ± 0.47
2.65 ± 0.42
1.85 ± 0.35
0.86 ± 0.30
0.00 ± 0.20
2.01 ± 0.38
2.77 ± 0.46
1.35 ± 0.32
0.63 ± 0.23
0.05 ± 0.06
5.09 ± 0.59
7.38 ± 0.72
0.97 ± 0.27
0.55 ± 0.21
1.22 ± 0.32
0.06 ± 0.06
9.00 ± 0.79
6.94 ± 1.75
0.54 ± 0.22
3.98 ± 0.54
1.34 ± 0.31
2.55 ± 0.55
0.92 ± 0.33
1.78 ± 0.37
9.97 ± 0.83
0.76 ± 0.33
8.66 ± 0.82
1.65 ± 0.44
1.21 ± 0.30
17.12 ± 1.07
4.41 ± 0.64
0.33 ± 0.17
1.31 ± 0.36
0.14 ± 0.14
0.94 ± 0.26
0.22 ± 0.13
HR
FSX
(3)
(4)
Cycle 8 Data
−0.43 ± 0.18 4.5e-15
—
<1.5e-15
−0.65 ± 0.09 3.0e-14
−0.64 ± 0.08 3.5e-14
−0.56 ± 0.12 1.5e-14
−0.42 ± 0.20 4.5e-15
−0.87 ± 0.38 3.3e-15
+0.22 ± 0.09 8.1e-15
−0.17 ± 0.06 2.9e-14
−0.69 ± 0.13 1.6e-14
−0.37 ± 0.22 3.6e-15
−0.62 ± 0.13 1.3e-14
−0.82 ± 0.42 2.1e-15
−0.13 ± 0.06 3.7e-14
−0.42 ± 0.06 5.3e-14
−0.53 ± 0.20 6.0e-15
−0.55 ± 0.07 4.4e-14
−0.18 ± 0.15 6.7e-15
−0.74 ± 0.08 4.8e-14
−0.44 ± 0.18 6.6e-15
−0.67 ± 0.10 2.8e-14
+0.64 ± 0.09 8.1e-15
−0.74 ± 0.14 1.3e-14
−0.45 ± 0.05 6.9e-14
−0.69 ± 0.11 2.1e-14
−0.52 ± 0.13 1.2e-14
+0.56 ± 0.06 1.8e-14
−0.57 ± 0.07 4.9e-14
−0.56 ± 0.25 3.5e-15
−0.75 ± 0.11 3.0e-14
−0.91 ± 0.20 8.3e-15
−0.47 ± 0.15 7.8e-15
−0.78 ± 0.23 6.0e-15
4
8
11
11
12
15
16
16
16
17
18
22
22
23
23
26
26
27
28
30
32
38
42
F05189-2524
F08572+3915
UGC 4881 E
UGC 4881 W
UGC 5101
F10565+2448
NGC 3690 T
NGC 3690 E
NGC 3690 W
F12112+0305
UGC 8058
UGC 8696 core
UGC 8696 tail
F14348-1447 T
F14348-1447 S
VV 705 N
VV 705 S
F15250+3608
UGC 9913
NGC 6240
F17207-0014
ESO 286-IG19
ESO 148-IG2 Tot
27.15 ± 1.35
0.12 ± 0.09
2.09 ± 0.38
2.13 ± 0.38
6.34 ± 0.36
9.37 ± 0.58
204.84 ± 4.64
54.46 ± 2.33
58.71 ± 2.42
3.22 ± 0.57
34.23 ± 1.04
29.02 ± 0.82
7.09 ± 0.50
3.80 ± 0.51
1.15 ± 0.28
8.34 ± 0.76
1.03 ± 0.27
2.78 ± 0.54
21.90 ± 0.70
209.55 ± 2.45
7.13 ± 0.40
14.83 ± 0.58
14.46 ± 0.56
107.00 ± 2.69
0.45 ± 0.18
0.32 ± 0.15
0.13 ± 0.12
3.49 ± 0.27
2.21 ± 0.30
41.40 ± 2.17
15.43 ± 1.24
15.04 ± 1.23
1.09 ± 0.34
19.65 ± 0.74
16.20 ± 0.62
0.00 ± 0.31
1.32 ± 0.31
0.80 ± 0.24
1.39 ± 0.32
0.06 ± 0.07
0.00 ± 0.18
4.68 ± 0.46
59.57 ± 1.34
2.70 ± 0.26
1.98 ± 0.24
6.56 ± 0.43
Archival Data
+0.60 ± 0.03 8.2e-14
+0.57 ± 0.41 9.0e-15
−0.73 ± 0.21 6.7e-15
−0.88 ± 0.24 7.1e-15
−0.29 ± 0.05 1.9e-14
−0.62 ± 0.07 2.8e-14
−0.66 ± 0.03 6.2e-13
−0.56 ± 0.04 1.5e-13
−0.59 ± 0.04 1.6e-13
−0.49 ± 0.17 9.8e-15
−0.27 ± 0.03 9.5e-14
−0.28 ± 0.02 7.4e-14
−1.00 ± 0.12 1.7e-14
−0.48 ± 0.13 1.3e-14
−0.18 ± 0.19 4.1e-15
−0.71 ± 0.10 2.6e-14
−0.90 ± 0.34 3.5e-15
−1.0 ± 0.30
8.7e-15
−0.65 ± 0.04 2.7e-14
−0.56 ± 0.01 6.1e-13
−0.45 ± 0.05 1.9e014
−0.77 ± 0.05 4.3e-14
−0.38 ± 0.04 4.0e-14
FHX
(5)
LSX
(6)
LHX
(7)
SX/IR
(8)
HX/IR
(9)
2.0e-14
<3.0e-15
3.5e-14
2.9e-14
2.1e-14
6.8e-15
<3e-15
1.0e-13
1.4e-13
1.2e-14
4.5e-15
1.7e-14
1.0e-15
1.4e-13
9.5e-14
1.0e-15
4.3e-14
2.1e-14
7.3e-14
3.6e-15
1.8e-14
1.7e-13
1.1e-14
1.3e-13
2.5e-14
8.2e-15
2.9e-13
6.7e-14
4.0e-15
1.9e-14
3.0e-15
1.7e-14
6.1e-15
2.4e40
<5.6e39
2.0e41
1.2e41
5.3e40
1.5e40
6.2e40
5.5e40
4.4e41
1.2e41
2.1e40
3.8e40
1.1e40
1.1e41
1.2e41
1.3e40
5.4e40
8.0e40
1.3e41
1.7e40
1.4e41
3.5e40
8.3e40
5.7e40
1.2e41
3.0e41
2.2e41
1.4e41
1.9e40
1.4e41
1.3e41
9.6e40
2.4e40
1.5e41
<6.3e40
2.7e41
1.6e41
1.2e41
3.8e40
<5.8e40
7.3e41
2.0e42
9.8e40
3.8e40
6.3e40
6.6e39
4.5e41
3.1e41
2.5e39
6.4e40
3.4e41
2.9e41
1.2e40
1.0e41
1.2e42
8.6e40
9.4e40
1.9e41
1.8e41
4.1e42
2.8e41
2.0e40
9.7e40
0.6e41
6.8e40
2.5e40
–5.05
<–5.69
–4.27
–4.41
–4.76
–5.31
–5.18
–4.66
–4.25
–4.57
–5.32
–4.78
–5.40
–4.86
–4.32
–5.28
–4.58
–4.91
–4.21
–5.09
–4.42
–5.02
–4.63
–4.71
–4.44
–4.56
–4.36
–4.38
–5.12
–4.28
–4.67
–4.36
–4.96
–4.26
<–5.14
–4.14
–4.28
–4.41
–4.90
<–5.21
–3.54
–3.59
–4.65
–5.06
–4.56
–5.62
–4.25
–3.90
–6.00
–4.51
–4.28
–3.86
–5.25
–4.56
–3.49
–4.61
–4.49
–4.24
–4.78
–3.09
–4.08
–5.09
–4.44
–5.01
–4.51
–4.95
2.0e-12
2.5e-14
7.8e-15
3.0e-15
9.1e-14
2.8e-14
6.8e-13
2.6e-13
2.6e-13
1.9e-14
4.0e-13
4.2e-13
2.5e-15
2.4e-14
1.4e-14
1.6e-14
2.1e-15
<4.2e-15
6.6e-14
1.2e-12
3.9e-14
3.3e-14
1.1e-14
3.4e41
8.0e40
2.5e40
2.7e40
7.0e40
1.2e41
1.9e41
7.7e40
8.0e40
1.3e41
3.9e41
2.5e41
5.6e40
2.9e41
9.0e40
9.7e40
1.3e40
6.2e40
2.0e40
8.1e41
9.9e40
2.1e41
1.9e41
1.3e43
2.0e41
4.1e40
1.3e40
4.7e41
1.6e41
2.6e41
9.6e40
9.6e40
4.0e41
3.0e42
2.5e42
1.1e40
7.5e41
4.5e41
6.8e40
8.6e39
<4.5e40
6.8e40
2.1e42
2.2e41
2.1e41
8.3e41
–4.21
–4.83
–4.82
–4.19
–4.74
–4.58
–4.23
–4.49
–4.02
–4.83
–4.56
–4.39
—
–4.51
–4.90
–4.46
—
–4.87
–5.56
–3.19
–5.04
–4.32
–4.36
–2.63
–4.44
–4.61
–4.51
–3.92
–4.46
–4.10
–4.40
–3.94
–4.34
–3.67
–3.39
—
–4.09
–4.20
–4.62
—
<–5.11
–5.03
–2.97
–4.70
–4.32
–3.72
A106, page 5 of 50
A&A 529, A106 (2011)
Table 3. continued.
No.
42
42
44
Galaxy
ESO 148-IG2 N
ESO 148-IG2 S
F23365+3604
SX
(1)
2.78 ± 0.24
4.44 ± 0.30
1.67 ± 0.41
HX
(2)
0.41 ± 0.11
5.48 ± 0.34
1.07 ± 0.33
HR
(3)
−0.74 ± 0.10
+0.11 ± 0.05
−0.22 ± 0.20
FSX
(4)
7.6e-15
1.3e-14
5.7e-15
FHX
(5)
4.2e-15
9.0e-14
1.1e-14
LSX
(6)
3.7e40
5.7e40
5.3e40
LHX
(7)
2.4e40
6.6e41
1.6e41
SX/IR
(8)
–4.47
–4.75
–5.06
HX/IR
(9)
–4.66
–3.69
–4.58
Notes. Column (1): background corrected count rate in the 0.5–2 keV band in unit of 10−3 ct s−1 . Column (2): background corrected count rate in
the 2–8 keV band in unit of 10−3 ct s−1 . Column (3): X-ray colour, as defined by HR = (H − S )/(H + S ). Column (4): observed 0.5–2 keV band
flux (erg s−1 cm−2 ). Column (5): observed 2–7 keV band flux (erg s−1 cm−2 ). Column (6): 0.5–2 keV luminosity corrected for Galactic absorption
(erg s−1 ). Column (7): 2–10 keV luminosity corrected for Galactic absorption (erg s−1 ). Column (8): logarithmic luminosity ratio of the 0.5–2 keV
and 8–1000 μm bands. Column (9): logarithmic luminosity ratio of the 2–10 keV and 8–1000 μm bands.
AGN. Other examples are F18293–3413, VV 340 N, UGC 9913
(hereafter Arp 220), NGC 6240 and ESO 148-IG2.
4.2. Flux density spectra
X-ray spectra are traditionally shown as count rate spectra, i.e.,
data folded through the detector response. However, in this paper, in the interest of comparing the X-ray spectra with other
multi-wavelength datasets in GOALS, the ACIS spectra have
been corrected for the detector response curve and further converted into flux density units (Fig. 4). This correction may introduce some uncertainty, particularly when a spectral bin is wide
within which the response varies rapidly, e.g., at the high energy
end of the bandpass. In spite of this caveat, we think that this
presentation has merit given that the spectral properties can be
directly observed without resorting to spectral fitting. For this
purpose, the flux density range for all spectra was also kept to
be 2 orders of magnitude except where the dynamic range of
the spectra exceeds 2 decades. The flux density is in units of
[10−14 erg cm−2 s−1 keV−1 ], and can readily be converted into
units of [W m−2 Hz−1 ] by multiplying by 4.17 × 10⁻³⁵ .
For some objects, data of spatially separate components are
shown in Fig. 4, and when we consider it appropriate, data for
the total emission are shown to help facilitate comparison with
spectra taken from other X-ray observatories at lower spatial resolution. Finally, we note that these are not “unfolded spectra”,
which are sometimes presented in the literature. Instead, they
have been corrected solely for the detector effective area while
preserving the energy resolution of the detector, and thus are independent of any spectral model which might be fitted. (Note:
The spectra shown in Fig. 4 are for display purposes only; all
physical quantities reported in this paper were obtained through
conventional spectral fitting to the count rate spectra with appropriate detector responses.)
4.3. X-ray colour and AGN selection
The X-ray colour, or hardness ratio, HR, gives the relative
strength of the X-ray emission above and below 2 keV (in
counts). Since strong emission above 2 keV is often associated
with an absorbed X-ray source with a column density, NH , in the
range of 1022 –1024 cm−2 , which, in turn indicates the presence
of an obscured AGN, it often serves as a crude probe of AGN.
As described in Iwasawa et al. (2009), AGN are selected as
follows: The primary criterion is an hard X-ray spectrum as assessed by the X-ray colour, HR. The values of HR as a function
of Lir are plotted in Fig. 5. The median value of HR is −0.56.
Objects with HR > −0.3 are classified as an AGN. This threshold
is chosen because ULIRGs known to host AGN (e.g. Mrk 231,
A106, page 6 of 50
UGC 8696 (=Mrk 273), UGC 5101) cluster just above this value.
All of the optically identified AGN, i.e., Seyfert 1 and Seyfert 2
galaxies, in our sample are selected by this criterion.
Some Compton-thick AGN are missed by a HR > −0.3 selection because of their weakness in the hard band given that
only reflected radiation is observed. The relative strength of the
hard X-ray emission is largely suppressed, giving a small value
for HR. Objects that show a strong Fe K line at 6.4 keV, a characteristic signature of a Compton-thick AGN, are also classified as
AGN (e.g. NGC 6240 – Iwasawa & Comastri 1998; Vignati et al.
1999; Ikebe et al. 2000; Komossa et al. 2003; NGC 3690 West
– Della Ceca et al. 2002; Ballo et al. 2004; VV 340a – Armus
et al. 2009; UGC 5101 – Imanishi et al. 2003). Note that highionization Fe K lines from Fe xxv or Fe xxvi at 6.7–7 keV that
have been found in a few objects, (e.g., NGC 3690 East – Ballo
et al. 2004; Arp 220 – Iwasawa et al. 2005), are not considered
here as evidence for AGN since they can also originate from hot
gas produced by a starburst.
The selection by HR and the 6.4 keV Fe K line finds 16 objects that contain AGN. The remaining objects are characterized
by relatively soft spectra, defined by small HR values or relative
weakness of the hard X-ray band emission (2–8 keV). The integral spectral properties of this sample of 29 “hard X-ray quiet”
(HXQ, as defined by small HR) objects are reported in a separate paper (Iwasawa et al. 2009), in which the detection and
origin of a high-ionization Fe K line in the integrated spectrum
is discussed. The X-ray classifications of the sample are given in
Table 5, along with optical and SDSS spectral types, the mid-IR
[Ne v] λ14.3 μm detection, and the X-ray AGN selection criteria, which are met. We note that ESO 286-IG19 is classified as
AGN in Franceschini et al. (2003), based on the XMM-Newton
data (see Appendix A for more detail), while neither our Xray or mid-IR criteria selected this object as an AGN. Although
ESO 286-IG19 remains as a viable AGN candidate, the discussion below assume that this object is a HXQ.
In general, AGN being powerful X-ray emitters, an X-ray
observation is a sensitive probe of AGN unless they are hidden
behind Compton thick obscuration. However, it is not necessarily true that AGN selected by the X-ray technique are energetically important for the bolometric output of LIRGs. Here we
have made an attempt to access the importance of AGN contribution to the IR luminosity of the objects hosting the X-ray selected AGN, using the observed X-ray properties. However the
uncertainty in these estimate should be quite large, as explained
below, and they can be considered as a guide only.
There are two steps for estimating the bolometric luminosity of an AGN from the observed X-ray luminosity: 1) absorption correction which recovers the instrinsic X-ray luminosity by removing the flux suppression effect due to absorption;
K. Iwasawa et al.: C-GOALS survey
Fig. 2. X-ray and optical images of the 44 C-GOALS sample galaxies. X-ray (0.4–7 keV) brightness contours (magenta) are overlaid on the HSTACS F814W image (grey scale) for each object. The orientation of all images is north up and east to the left. Eleven contour levels are defined
in the fixed surface brightness range 4 × 10⁻⁵ −7 × 10⁻³ [counts s−1 arcsec−2 ], which is divided into ten equal logarithmic intervals. For majority
of objects, these contour levels were applied. For nine objects (F10173+0828, F17132+5313, F19297–0406, CGCG 448-020, F01364–1042,
IRAS 21101+5810, F10565+2448, UGC 9913, and UGC 5101), a further lower interval was added to outline lower surface brightness features.
For four bright objects, (UGC 8696, NGC 3690, F05189–2524 and UGC 8058), custom contour levels were made for describing their X-ray
morphology – these are listed in Table 4.
A106, page 7 of 50
A&A 529, A106 (2011)
Fig. 2. continued.
2) bolometric correction which converts the absorptioncorrected X-ray luminosity to the bolometric luminosity, assuming a typical spectral energy distribution (SED) of an unobscured AGN (e.g., Elvis et al. 1994). In our rough estimates,
A106, page 8 of 50
the absorption correction factors of 3 for a Compton thin AGN
and 100 for a Compton thick AGN (i.e., 1% of 2–10 keV
emission from a hidden AGN is visible) are adopted for the
2–10 keV band. The bolometric correction is assumed to be
K. Iwasawa et al.: C-GOALS survey
Fig. 2. continued.
Fig. 3. An example of X-ray images and the surface brightness distributions for individual objects is presented. The object shown here is UGC 8387
(=IC 883). Similar multi-panel figures for the other 43 objects in our C-GOALS sample can be found in Appendix. Upper left: the X-ray (0.4–
7 keV) brightness contours overlaid on the HST ACS I-band image. Upper right: the radial surface brightness profiles in the 0.5–2 keV (open
circles) and 2–7 keV (filled squares) bands are shown. These profiles are the azimuthal average and are measured from the peak of 2–7 keV
emission at 1 arcsec resolution. The Point Spread Function (PSF) computed at 3 keV is shown as a dotted histogram where the peak has been
matched to the observed 2–7 keV peak for comparison. The bottom four-panel figure shows (left to right) the raw 0.4–7 keV image, the Gaussian
smoothed version of the same image, the 0.5–2 keV smoothed image, and the 2–7 keV smoothed image. The pixel size is ≈0.5 × 0.5 . The scale
bar indicates 5 arcsec.
A106, page 9 of 50
F05189−2524
ESO255−IG7 N
Fν
1
0.1
1
FE
10
FE
1
10
10
VIIZw31
F01364−1042
1
2
Energy (keV)
5
0.5
2
Energy (keV)
5
0.5
IR07251−0248
1
2
Energy (keV)
0.5
5
1
2
Energy (keV)
5
F08572+3915 N
ESO60−IG16
FE
FE
0.1
0.1
1
FE
0.1
1
FE
1
ESO255−IG7 C
1
10
0.5
1
FE / 10−14erg keV−1cm−2s−1
100
A&A 529, A106 (2011)
0.5
1
2
Energy (keV)
5
0.5
1
2
Energy (keV)
5
0.5
F09111−1007 E
2
Energy (keV)
5
0.5
UGC4881 E
1
2
Energy (keV)
5
UGC4881 W
1
FE
FE
1
FE
0.1
0.1
0.1
1
FE
1
10
09022−3615
1
1
2
Energy (keV)
5
0.5
1
2
Energy (keV)
5
0.5
10
ESO374−IG32
UGC5101
1
2
Energy (keV)
5
0.5
F10565+2448
1
2
Energy (keV)
5
2
Energy (keV)
5
NGC3690
FE
0.1
10
1
1
FE
1
FE
FE
100
10
0.5
1
2
Energy (keV)
5
0.5
NGC3690 E
1
2
Energy (keV)
5
0.5
1
2
Energy (keV)
5
0.5
F12112+0305
NGC3690 W
1
UGC8058 core
10
FE
1
FE
10
FE
1
2
Energy (keV)
5
0.5
1
2
Energy (keV)
5
0.5
1
2
Energy (keV)
5
0.5
VV250 E
13120−5453
UGC8058 nebula
1
2
Energy (keV)
5
1
2
Energy (keV)
5
VV250 W
FE
FE
FE
0.1
0.1
1
1
1
FE
1
10
10
10
0.5
1
1
1
0.1
2
5
FE
10
20
50
0.5
0.5
1
2
Energy (keV)
5
0.5
1
2
Energy (keV)
5
0.5
1
2
Energy (keV)
5
0.5
Fig. 4. The X-ray flux density spectra of the C-GOALS sources, obtained from the Chandra ACIS. The energy scale is as observed. The flux
density is in units of [10−14 erg s−1 cm−2 keV−1 ].
A106, page 10 of 50
K. Iwasawa et al.: C-GOALS survey
F14378−3651
F14348−1447
FE
1
FE
10
FE
1
10
UGC8696
1
0.1
0.1
1
1
2
Energy (keV)
5
0.5
10
0.5
2
Energy (keV)
5
0.5
1
2
Energy (keV)
5
0.5
F15250+3608
VV705 N
1
2
Energy (keV)
5
1
2
Energy (keV)
5
UGC9913
FE
FE
FE
0.1
1
1
1
FE
1
10
VV340 N
1
10
FE / 10−14erg keV−1cm−2s−1
UGC8387
5
0.5
ESO69−IG6 N
1
2
Energy (keV)
5
0.5
NGC6240
1
2
Energy (keV)
5
0.5
10
2
Energy (keV)
10
1
F17132+5313
F17207−0014
FE
1
FE
10
1
1
FE
FE
100
10
0.5
2
Energy (keV)
5
0.5
2
Energy (keV)
5
0.5
ESO593−IG8
1
2
Energy (keV)
5
0.5
F19297−0406
1
2
Energy (keV)
5
19542+1110
0.1
2
Energy (keV)
5
0.5
1
2
Energy (keV)
5
0.5
ESO286−IG19
CGCG448−020
1
2
Energy (keV)
5
0.5
10
0.1
1
21101+5810
1
2
Energy (keV)
5
ESO239−IG2
FE
0.1
1
1
1
FE
FE
FE
1
10
10
0.5
0.5
1
1
2
FE
1
FE
FE
1
FE
5
10
10
F18293−3413
1
20
1
10
0.5
1
2
Energy (keV)
5
0.5
1
2
Energy (keV)
5
0.5
ESO148−IG2
F22491−1808
1
2
Energy (keV)
5
0.5
ESO148−IG2 N
1
2
Energy (keV)
5
ESO148−IG2 S
1
FE
FE
FE
0.5
1
2
Energy (keV)
5
0.5
1
2
Energy (keV)
5
0.1
0.1
1
1
FE
1
10
10
0.5
0.5
1
2
Energy (keV)
5
0.5
1
2
Energy (keV)
5
Fig. 4. continued.
A106, page 11 of 50
A&A 529, A106 (2011)
F23365+3604
FE
0.1
0.1
FE
1
1
1
ESO77−IG14 SW
0.1
FE / 10−14erg keV−1cm−2s−1
ESO77−IG14 NE
0.5
1
2
Energy (keV)
5
0.5
1
2
Energy (keV)
5
0.5
1
2
Energy (keV)
5
Fig. 4. continued.
Fig. 5. The X-ray colour (HR) as a function of infrared luminosity and
its distribution. See the text for the definition of HR. While the HR is
derived for individual components in a single object when the X-ray
sources are well resolved into multiple components (i.e., the nuclear
separation is ∼4 or larger; see Table 3). The threshold for selecting
AGN, based on the HR > − 0.3, is indicated by the dashed line. Objects
in which a 6.4 keV Fe Kα line detetion has been reported are marked by
open circles. Three known Compton thick AGN with strong (6.4 keV)
Fe K (NGC 3690 W, NGC 6240, VV340 N) lie below the HR threshold.
The HR distribution histogram of HR is attached on the right hand side.
The median is HR = −0.56.
Table 4. X-ray contours for bright objects.
No.
4
16
18
22
Galaxy
F05189–2524
NGC 3690
UGC 8058
UGC 8696
Low
(1)
High
(2)
n
(3)
3.0 × 10⁻⁵
2.7 × 10⁻⁵
8.5 × 10⁻⁷
2.3 × 10⁻⁶
4.2 × 10⁻³
1.8 × 10⁻³
3.7 × 10⁻⁴
1.8 × 10⁻³
10
10
11
9
Notes. Column (1): the lowest contour (cts s−1 arcsec−2 ) in Fig. 2.
Column (2): the highest contour (cts s−1 arcsec−2 ) in Fig. 2. Column (3):
the number of contour levels in Fig. 2.
Lbol /L2−10 = 30, where L2−10 is absorption-corrected 2–10 keV
luminosity, which is adopted from Marconi et al. (2004) for objects with Lbol ∼ 1012 L .
When applying the absorption correction, there is an ambiguity inherent in the AGN selected by X-ray colour alone with
a poor quality spectrum. They show flat X-ray spectra (Fig. 4),
as the HR analysis infers, but it is not trivial whether they are
Compton thick or thin objects without a good constraint on a
Fe K line. As the respective absorption correction factors differ
A106, page 12 of 50
significantly, the classification of the obscuration type introduces a large uncertainty in the AGN luminosity. Since only
weak reflected light is observed from a Compton thick AGN,
we tentatively assume that the X-ray colour selected AGN with
log (LHX /Lir ) < −4 are Compton thick AGN candidates2 and
they are marked as such in Table 6. It is also noted that AGN with
a reasonable quality spectrum showing a low-energy cut-off due
to moderate absorption, NH ∼ 1022 −1023 cm−2 , [F05189–2524,
ESO 60-IG16, Mrk 273, 19542+1110] all have larger values between −3.4 and −2.5 in log (LHX /Lir ).
The absorption correction for a Compton thick AGN is also
rather uncertain, since it strongly depends on the geometry of
the obscuring matter, which is not well known. While a uniform
correction factor of ×100 is used here, the final error in Fagn
can be easily larger than 0.5 dex, as demonstrated by Fagn > 1
for NGC 6240. In any case, taking the face values, the median
of log Fagn is −1, and there are only two objects (Mrk 231 and
NGC 6240) in which the AGN contribution exceeds 50% of their
infrared luminosity. In summary, according to this simplistic estimate, AGN-dominated objects would seem to be in the minority in our sample, and the typical AGN contribution to the infrared luminosity would appear to be ∼10%.
The X-ray-selected AGN represent 37% of the total sample
(16/44). This figure is comparable to that inferred from the midIR diagnostics for the same IR luminosity range (Petric et al.
2011). When the sample is divided into two luminosity bins,
above and below the median IR luminosity of log (Lir /L ) =
11.99, 12 of these 16 AGN (75%) are above the median, in agreement with previous studies showing the fraction of AGN rising
with increasing Lir (e.g., Veilleux et al. 1995). If objects with
[Ne v]λ14.3 μm detection (Table 5), which is generally considered as evidence for AGN, are included, the AGN fraction would
increase up to 48%. In terms of merger stage, X-ray-selected
AGN tend to be found more in mergers of later stages. For example, 50% (9/18) of final stage mergers (nuclear separation
<1 kpc) are X-ray-seleted AGN, while only 26% (7/27) of earlier
stage mergers are X-ray selected AGN. We refer to Evans et al.
(in prep.) for details on the galaxy morphology and merger-stage
classifications based on our HST imaging.
NGC 6240 is the only object in the sample where two nuclei both show evidence for harboring a powerful AGN3 out of
24 objects that have double or tripple nuclei. It should be noted
2
The hard X-ray to [OIII] λ5007 ratio is often used as a diagnostic
for a Compton thick AGN (e.g., Bassani et al. 1999). However, this
diagnostic may fail for dusty objects like LIRGs because emission lines
from the narrow-line regions are likely suppressed as well.
3
Mrk 266 (Mazzarella et al. 2010) and Mrk 463 (Bianchi et al. 2008),
two GOALS galaxies, but with Lir below our current C-GOALS sample
threshold, are other objects which are found to have X-ray evidence for
AGN in both nuclei.
K. Iwasawa et al.: C-GOALS survey
–
–
Y
–
–
Y
–
–
–
N
–
N
–
Y
–
N
N
–
Y
N
–
Y
N
N
–
–
–
N
–
Notes. Column (1): optical class based on Veilleux & Osterbrock
(1987) diagram from Veilleux et al. (1995, 1999). H: star-forming; S1:
Seyfert 1; S2: Seyfert 2; L: LINER. Column (2): the SDSS class from
Yuan et al. (2010). The symbols are the same as in Col. (1), plus an
additional class of “composite” objects; cp: composite of starburst and
AGN. Column (3): the AGN fraction Dagn derived from [O i]/Hα diagram (see Yuan et al. 2010, for details). Column (4): detection of
[Ne v] 14.32 μm from Farrah et al. (2007). New results on CGCG 448020 (Inami et al. 2010), VV340 N (Armus et al. 2009), UGC 8387
(Modica et al. 2010), and other GOALS objects (Petric et al. 2011)
are also included. Column (5): AGN selection criteria: C: X-ray colour
(HR ≥ 0.3); L: 6.4 keV Fe K line.
that we do not consider NGC 3690 to have a double AGN, as
the Fe xxv line found in the eastern galaxy is not taken as an
AGN signature. Other AGN are found either in a single nucleus
10
5
0
CL
C
C
C
CL
L
CL
C
CL
C
C
L
L
C
C
C
10
Others (HXQ sample)
F01364–1042
L
L
0.8
ESO 203-IG1
–
–
–
VII Zw 31
H
–
–
ESO 255-IG7
–
H
0
07251–0248
–
–
–
F09111–1007
–
–
–
UGC 4881 SW/NE H/H cp/cp 0.3/0.2
ESO 374-IG32
–
cp
0.3
F10173+0828
–
–
–
F10565+2448
H
cp
0.2
NGC 3690 E
H
–
–
F12112+0305
L
S2
0.7
VV 250 NW/SE
H/H cp/cp 0.4/0.3
UGC 8387
L
cp
0.5
VV 705 S/N
L/H cp/cp 0.5/0.3
F15250+3608
L
cp
0.4
UGC 9913
L
L
0.7
ESO 69-IG6
–
–
–
F17132+5313
H
H
0
F17207–0014
H
H
0
F18293–3413
–
–
–
ESO 593-IG008 S/N L/H S2/cp 0.4/0.2
F19297–0406
–
–
–
CGCG 448-020
H
H
0
ESO 286-IG19
H
H
0
21101+5810
–
–
–
ESO 239-IG2
–
–
–
F22491–1808
H
H
0
ESO 77-IG14
H
–
–
Y
–
N
N
Y
–
N
Y
Y
N
N
Y
Y
–
–
N
5
1
2
3
5
6
10
11
13
14
15
16
17
20
21
26
27
28
29
31
32
33
34
35
37
38
39
40
41
43
1
–
0.6
–
0.6
–
1
–
0.8
0.7
–
0.5
0.8
–
–
0.3
[Ne v] Xagn
(4)
(5)
0
Dagn
(3)
Nsrc (SX)
4
7
8
9
12
16
18
19
22
23
24
25
30
36
42
44
VO YKS
(1)
(2)
X-ray selected AGN
F05189–2524
S2
S2
ESO 60-IG16
–
–
F08572+3915 NW
L
S2
09022–3615
–
–
UGC 5101
L
S2
NGC 3690 W
H
–
UGC 8058
S1
S1
13120–5453
–
–
UGC 8696
S2
S2
F14348–1447 SW
L
cp
F14378–3651
S2
–
VV 340 N
L
cp
NGC 6240
L
L
19542+1110
–
–
ESO 148-IG2
–
–
F23365+3604
L
cp
Nsrc (HX)
No. Object
15
Table 5. Classification of C-GOALS sources.
40
41
42
log LX
43
Fig. 6. X-ray luminosity distribution in the soft (0.5–2 keV; upper
panel) and hard (2–10 keV; lower panel) bands.
(8 objects) or in one member of a double nucleus system (7 objects).
4.4. X-ray luminosities and correlation with Lir
The X-ray fluxes were estimated based on a best-fitting spectral
model in the 0.5–2 keV and 2–7 keV bands (i.e., no correction
of absorption). For faint sources, the hard band data are often not
good enough to constrain the shape, in which case a power-law
of Γ = 2.1 is assumed to derive the 2–7 keV flux (e.g., Ranalli
et al. 2003). The X-ray luminosities are estimated by correcting only for Galactic absorption. (Note: Significant absorption
intrinsic to the sources is likely present. However, X-ray spectra of our objects are complex with multiple components, while
most of the spectra do not have sufficient quality to uniquely
decompose and estimate absorption of each component. For this
reason, we opt to present the luminosities as observed.) The hard
band luminosity is for the 2–10 keV band, which is estimated by
extrapolating the 2–7 keV spectrum. For a few objects, the luminosity values have been updated from those in Iwasawa et al.
(2009). The distribution of the X-ray luminosity in the soft and
hard bands is shown in Fig. 6. The luminosity distribution in
both bands peaks at log (LX ) ≈ 41.1 erg s−1 , but the hard band
luminosity is spread over a wider range. The median logarithmic
values for the soft and hard band luminosities are 41.1 erg s−1
and 41.3 erg s−1 , respectively.
A moderate correlation between the IR and X-ray luminosities can be seen in Fig. 7, with a typical spread over an order of
magnitude. Note that when multiple components are present in a
single object, their luminosities are plotted separately in Fig. 7.
When integrated luminosities in a single objects are used, as
A106, page 13 of 50
10
10
0
5
Nsrc(HX)
15 0
5
Nsrc(SX)
15
A&A 529, A106 (2011)
−6
−5
−4
log (LX/LIR)
−3
−2
Fig. 8. X-ray to infrared luminosity ratio distribution.
band and logLHX = (−4.5 ± 0.1) + logLir for the hard X-ray
band. These values are significantly lower than those found for
local, star-forming galaxies with low star formation rates, e.g.,
log LX /LFIR ∼ −3.7 (Ranalli et al. 2003). Note that a direct comparison would need a correction for the different infrared bandpasses (details of the direct comparison can be found in Iwasawa
et al. 2009).
Fig. 7. Plots of X-ray (upper panel: 0.5–2 keV; lower panel: 2–10 keV)
versus infrared luminosity. The X-ray luminosity has been corrected
only for Galactic absorption. The X-ray selected AGN are marked with
filled squares. The typical error bars are indicated. For objects that are
not detected, the 95 per cent upper limits are indicated by arrows. When
multiple components are resolved in a single system, their luminosities
are computed separately (Table 3). The decomposition of the infrared
luminosity in individual objects is described in Appendix A. There is
a moderate correlation, with a correlation coefficient of ∼0.6 for both
plots.
shown in Iwasawa et al. (2009)4 , the correlation becomes less
clear. In the soft X-ray band, AGN are mixed in with the distribution of non-AGN (HXQ) objects, while in the hard X-ray
band, AGN tend to be the more luminous X-ray sources, as expected.
The X-ray to IR luminosity ratio distribution shown in Fig. 8
has a significant spread, which is caused by the scatter around
the correlation between the luminosities (e.g. Fig. 7) rather than
any non-linear correlation. Typical values are log (LSX /Lir ) =
−4.53±0.34 for the soft X-rays and log (LHX /Lir ) = −4.40±0.63
for the hard X-rays (the uncertainties are the dispersion of the
distributions). When X-ray-selected AGN are excluded, a linear
relation between logarithmic X-ray and IR luminosities (Fig. 7)
is given by logLSX = (−4.6 ± 0.1) + logLir for the soft X-ray
In Iwasawa et al. (2009), the IR luminosity (8–1000 μm) is also replaced by the FIR luminosity (40–400 μm) to allow direct comparison
with the previous studies on the X-ray – FIR correlation.
4
A106, page 14 of 50
4.5. Radial surface brightness profiles
Radial surface brightness profiles are derived in the soft (0.5–
2 keV) and hard (2–7 keV) bands at a resolution of 1 arcsec. In
general, the soft X-ray emission is spatially extended while the
hard X-ray emission is compact. A few exceptions are sources
dominated by absorbed hard X-ray emission as seen in objects
like IRAS 19542+1110, where both bands show equally compact emission.
With the 0.5 resolution of the Chandra ACIS, the presence of extended soft X-ray emission is immediately clear by visual inspection for all of the sources. To quantify the soft X-ray
extension, azimuthally-averaged surface brightness profiles are
produced in the soft (0.5–2 keV) and hard (2–7 keV) bands separately for individual targets. An example of these surface brightness profiles is shown in Fig. 3 for UGC 8387, and those for
all the other objects are presented in on-line material. The soft
X-ray profiles show a range of shapes – from an exponetial profile to a more peaky, power-law type profile. Since not all of the
sources have sufficient counts, the soft X-ray profiles are quantified by two characteristic radii, rather than fitting a profile model.
The maximum extension radius, rmax , and half power radius, rhp ,
are defined as follows: the radius where the surface brightness
falls to 1% of the peak brightness (usually of the central bin
of the surface brightness profile) is defined as rmax in arcsec.
This radius gives a measure of the source extension, which has
little dependence on the depth of the image. The total source
count, Cmax , integrated within rmax is then derived. Cmax can
K. Iwasawa et al.: C-GOALS survey
Table 6. Estimates of AGN contribution to IR luminosity.
No.
4
7
8
9
12
16
18
19
22
23
24
25
30
36
42
44
Galaxy
F05189–2524
ESO 60-IG16
F08572+3915
09022–3615
UGC 5101
NGC 3690 W
UGC 8058
13120–5453
UGC 8689
F14348–1447 S
F14378–3651
VV 340 N
NGC 6240
19542+1110
ESO 148-IG2
F23365+3604
log (HX/IR)
(1)
−2.63
−2.54
−4.44
−3.59
−3.92
−4.07
−3.67
−4.25
−3.39
−4.90
−4.28
−3.86
−2.97
−3.05
−3.72
−4.58
CT
(2)
∗
◦
◦
◦
∗
∗
∗
◦
◦
∗
log Fagn
(3)
−0.65
−1.54
−0.94
−1.59
−0.42
−0.57
−0.17
−0.75
−1.39
−1.50
−0.78
−0.36
+0.53
−1.09
−1.72
−1.08
Notes. (1) Logarithmic luminosity ratio of the observed 2–10 keV and
8–1000 μm bands, reproduced from Table 3. (2) Compton thick AGN
with Fe K detection are marked as ◦. Candidate Compton thick AGN
(see text for detail) are marked as ∗. (3) Logarithmic fraction of the
X-ray estimate for AGN contribution to the 8–1000 μm luminosity.
As a guide, the PSF simulated at an energy of 3 keV and normalized to the central peak of the hard X-ray emission is plotted
along side the observed surface brightness profiles. In Table 7,
the hard X-ray morphology is classified into three categories –
R/A/P. When more than 2 data points deviate by more than 2σ
from the PSF it is denoted as R (resolved). When the data points
agree with the PSF within the error bars, it is denoted as P (pointlike). Any other case is denoted as A (ambiguous).
Figure 9 shows a plot of Rmax versus the soft X-ray luminosity. No clear correlation is seen even if objects containing AGN
are removed.
The variety of shapes observed in the soft X-ray radial
profiles could be related to the origin of the X-ray emission.
Generally speaking, a gravitationally bound, virialized system
shows an exponential profile while a power-law profile is expected from a free-flowing outflow from a compact central
source. However, given the angular scale for our sample galaxies (0.24–1.74 kpc arcsec−1 ), any compact nuclear starbursts are
likely to be contained within the innermost 1 bin. There are
several objects showing a power-law type, peaky, soft X-ray
profile, and they are noted in the Notes on Individual Objects
(Appendix A). Absorption can modify the soft X-ray profile if it
has a radial dependence, e.g., centrally concentrated absorption,
which suppress the brightness of the compact nuclear component, e.g. Arp 220 and VV 340 N.
5. Discussion
Fig. 9. The soft X-ray emission radius, Rmax (kpc) versus soft X-ray luminosity. Filled symbols are of X-ray-selected AGN and open symbols
are others. The typical error bars are indicated. No trend can be seen.
The median value of Rmax is 5.3 kpc.
differ from the total source count when the surface brightness,
which is lower than 1% of the peak brightness, extends to large
radii. The radius where the accumulated source count reaches
half of Cmax is defined as the half power radius, rhp , in arcsec.
These quantities give a measure of the compactness/broadness
of the source extension. Since both rmax and rhp are determined
as the innermost radial bin which satisfies the required condition, their uncertainty is always 0.5 arcsec. For a compact source
(e.g., rhp ∼ 1 ), this half power radius is dominated by the point
spread function (PSF), and is likely to be over-estimated. The
radii in physical units (kpc) corresponding to rmax and rhp are
also given in Table 7.
The hard X-ray sources are compact and often point-like. We
note however that there are some objects in which hard X-ray
emission is resolved, e.g., Arp 220, and UGC 8387 (=IC 883).
In Sect. 4.3, we used relatively crude spectral information based
on the X-ray colour, (i.e. HR), to assess the presence of an AGN.
Here we discuss further characterizations of the ACIS spectra for
sufficiently bright objects. Before presenting the spectral analyses, a brief summary of the properties of X-ray sources in LIRGs
and their spectra are described below.
The primary origin of the X-ray emission in LIRGs is considered to be a starburst and/or AGN. Given the dusty nature
of LIRGs, if an AGN is present, it is likely to be an absorbed
source. Such absorbed X-ray sources can be selected by X-ray
colour analysis, as shown in Sect. 4.3. When the absorbing column density exceeds 1024 cm−2 and the absorbed transmitted
component moves out of the Chandra bandpass, the identification of an AGN becomes difficult as it must rely on the detection
of the Fe K line at 6.4 keV in faint reflected emission (see the
discussion in Sect. 4.3), and the data are often not of sufficient
depth to make a clear detection. Such heavy nuclear obscuration
could, however, occur in many LIRGs, and sometimes the hard
X-ray band is the only available window to check for signatures
of an AGN, e.g. as for NGC 4945 (e.g., Iwasawa et al. 1993;
Spoon et al. 2000).
In a starburst, there are various sources of X-ray emission (e.g., Persic & Rephaeli 2002) whose origin can be traced
back to massive stars. Individual supernovae and their remnants, stellar-wind heated ISM in star clusters, and X-ray binaries can all be X-ray sources. In particular, high-mass X-ray
binaries (HMXBs) are considered to be the dominant source
for the X-ray emission above 2 keV. A good correlation between the 2–10 keV luminosity and the star formation rate have
been found for nearby star forming galaxies (Ranalli et al. 2003;
Grimm et al. 2003; Gilfanov et al. 2004) as well as for late type
galaxies at higher redshift (Lehmer et al. 2008). The galacticscale emission nebulae, traced by Hα and the soft X-ray emission in local starburst galaxies like M 82, suggested that these
extended nebulae are produced by the shock heated interstellar medium, swept up by a starburst-driven outflow (see e.g.,
A106, page 15 of 50
A&A 529, A106 (2011)
Table 7. Properties derived from the X-ray radial surface brightness profiles.
No.
Galaxy
1
3
5
5
5
6
7
9
10
10
13
14
19
20
20
21
24
25
25
29
31
33
34
35
36
37
39
40
41
43
43
F01364–1042
II Zw 31
ESO 255-IG7 N
ESO 255-IG7 C
ESO 255-IG7 S
07251–0248
ESO 60-IG16
09022–2615
F09111–1007 E
F09111–1007 W
ESO 374-IG32
F10173+0828
13120–5453
VV 250 E
VV 250 W
UGC 8387
F14378–3651
VV 340 N
VV 340 S
ESO 69-IG6 (N)
F17132+5313
F18293–3413
ESO 593-IG8
F19297–0406
19542+1110
CGCG 448-020
21101+5810
ESO 239-IG2
F22491–1808
ESO 77-IG14 N
ESO 77-IG14 S
4
8
11
11
12
15
16
16
17
18
22
23
26
27
28
30
32
38
42
44
F05189–2524
F08572+3915
UGC 4881 E
UGC 4881 W
UGC 5101
F10565+2448
NGC 3690 E
NGC 3690 W
F12112+0305
UGC 8058
UGC 8696
F14348–1447
VV 705
F15250+3608
UGC 9913
NGC 6240
F17207–0014
ESO 286-IG19
ESO 148-IG2
F23365+3604
AS
rmax
(kpc arcsec−1 ) (arcsec)
Cycle 8 Data
0.93
6.5
1.06
6.0
0.76
7.0
0.76
5.0
0.76
7.0
1.74
4.0
0.93
7.0
1.19
5.5
1.08
4.0
1.08
4.0
0.73
8.0
0.99
–
0.63
3.0
0.63
5.5
0.63
6.0
0.50
9.0
1.37
3.0
0.70
18.0
0.70
>12.0
0.94
3.0
1.02
7.5
0.38
10.0
0.98
12.0
1.72
6.0
1.30
5.0
0.72
10.0
0.77
6.0
0.85
6.0
1.53
5.5
0.84
4.0
0.84
3.5
Rmax
(kpc)
rhp
(arcsec)
Rhp
(kpc)
Morph
HX
6.04
6.36
5.32
3.80
5.32
6.96
6.51
6.54
4.32
4.32
5.84
–
1.89
3.46
3.78
4.50
4.11
12.60
>8.40
2.82
7.65
3.80
11.76
10.32
6.50
7.20
4.62
5.10
8.42
3.36
2.94
2.0
2.0
2.5
2.0
2.5
1.5
2.0
1.5
1.0
1.0
2.5
–
1.0
1.5
2.5
3.0
1.0
5.5
7.5
1.0
2.5
3.0
4.5
2.5
1.0
3.0
1.5
1.5
2.0
1.0
2.0
1.86
2.12
1.90
1.52
1.90
2.61
1.86
1.78
1.08
1.08
1.82
–
0.63
0.95
1.57
1.50
1.37
3.85
5.25
0.94
2.55
1.14
4.41
4.30
1.30
2.16
1.16
1.27
3.06
0.84
1.68
P
R
R
A
R
–
P
R
A
A
R
A
P
R
A
R
P
R
–
R
R
R
R
P
P
R
P
P
P
A
P
Archival Data
2.0
–
2.5
8.0
6.0
7.0
>13
>13
8.0
5.0
9.0
6.5
4.5
4.0
30
15
11.0
9.0
7.0
3.0
1.7
–
2.0
7.0
4.7
6.1
>3.1
>3.1
11.3
4.3
6.9
10.3
3.7
4.4
12.2
8.0
9.6
7.7
6.2
3.7
1.0
–
1.0
3.5
1.5
2.0
–
–
4.0
1.0
2.5
3.0
1.5
1.5
8.5
5.5
3.0
3.5
3.5
1.0
0.83
–
0.79
3.1
1.2
1.7
–
–
5.7
0.85
1.9
4.8
1.2
1.6
3.5
2.9
2.6
3.0
3.1
1.2
P
A
P
–
P
P
R
R
P
P
R
P
A
–
R
R
R
R
R
A
0.83
1.13
0.79
0.79
0.79
0.87
0.24
0.24
1.42
0.85
0.77
1.58
0.82
1.10
0.41
0.53
0.87
0.85
0.88
1.22
Notes. The radius where the soft X-ray brightness goes below 1% of the peak brightness at 1 resolution is defined as rmax (arcsec). The corresponding physical radius, Rmax (kpc), is also listed. The half power radius, rhp (arcsec), is where the cumulative soft X-ray counts exceed half of
the integrated counts within rmax at 1 resolution. The corresponding physical radius, Rhp (kpc), is also given. Whether the 2–7 keV emission is
resolved or not is indicated by “P” (point-like), “R” (resolved), and “A” (ambiguous).
Veilleux et al. 2005, for a review on galactic outflow phenomena;
and Tomisaka & Ikeuchi 1988; Suchkov et al. 1996; TenorioTagle & Munoz-Yunon 1998; Strickland & Stevens 2000, for
simulations). As hypothesized by Chevallier & Clegg (1985),
A106, page 16 of 50
hot (T ∼ 108 K), high-pressure gas, produced via the collective kinetic energy from supernovae and massive stellar winds,
is considered to drive the outflow. Given the temperature, this
hot gas could be a hard X-ray source, but it is also expected to be
K. Iwasawa et al.: C-GOALS survey
rarefied, and thus not very radiative. The presence of weak emission from such gas has been suggested for M 82 (Griffiths et al.
2000; Strickland & Heckman 2007; Ranalli et al. 2008) and
NGC 253 (Pietsch et al. 2001).
5.1. X-ray spectra and derived properties
Except for some sources which are clearly absorbed AGN, the
0.4–7 keV Chandra spectra of the majority of the GOALS
sources appear similar – namely an emission-line dominated soft
X-ray band (below 2 keV) and a hard X-ray tail. The relative
composition of these two components is not widely different between objects, as the HR distribution (Fig. 5) shows. Objects that
have a spectrum of this type always show totally different X-ray
morphologies in the soft and hard X-ray bands (see the images
included in the Appendix), suggesting distinct origins for hard
and soft X-rays. Therefore, we will discuss the soft and hard
band spectra separately below5 .
As mentioned above, the hard X-ray emission is generally
attributed to HMXBs, but this may not always be true for our
objects. After excluding objects with clear AGN signatures, the
hard band spectra of the remaining objects have relatively low
signal to noise mainly due to the relative weakness of the source,
hence they have been referred to (see Sect. 4.3) as HXQ galaxies in Iwasawa et al. (2009). Any spectral feature like an Fe K
line is not evident in individual noisy spectra. However, the
stacked spectrum of the 29 HXQ galaxies in our C-GOALS sample shows a strong high-ionization Fe K line (Fe xxv) at 6.7 keV
with EW of 0.9 keV (Iwasawa et al. 2009). This means that a
non negligible fraction of the HXQ galaxies have strong Fe xxv
emission in their hard band spectra, but they are buried in the
noise in the individual spectra. Such a strong Fe xxv is not seen
in the spectrum of HMXBs in our Galaxy, except when they are
in an eclipse phase – they normally show a much weaker Fe line
at 6.4 keV (e.g. White et al. 1983; Torrejon et al. 2010). This
means that, unlike for local star-froming galaxies, HMXBs are
not the primary source of the hard X-ray band emission seen
in the more luminous C-GOALS objects. Also the 2–10 keV
luminosity of the HXQ galaxies deviate from the extrapolated
correlation line on the X-ray quiet side (∼0.7 dex on average,
Iwasawa et al. 2009). Most objects used to derive the X-ray vs.
FIR correlation (e.g., Ranalli et al. 2003) have Lir < 1011 L ,
while the lower bound of the IR luminosity of our sample is
1011.73 L . This suggests that a transition in the nature of the
dominant hard X-ray source in LIRGs occurs somewhere in the
range log (Lir /L ) = 11.0–11.73.
In the soft X-ray band, at the spectral resolution of a
CCD spectrometer like the ACIS, heavy blending of emission
lines makes it difficult to distinguish between photoionized gas
irradiated by an AGN and thermal gas induced from a starburst.
However, it is genrally assumed that thermal emission is responsible for the emission-line dominated spectra of LIRGs in the
soft X-ray band, and this appears even to be true for an object
5
It is generally possible to reproduce a Chandra full-band spectrum
for those objects whose spectra can be represented as the sum of a
power-law and a thermal emission spectrum with sub-keV temperature
and solar abundance. A good fit can often be found with the thermal
spectrum accounting only for the emission-line bump around 1 keV,
leaving not only the hard band (≥2 keV) emission but also the softest
emission below ∼0.7 keV to the power-law. This spectral decomposition would be invalid when the imaging data show a totally different
spatial distribution between these two bands (as seen in our sample objects), because they cannot come from the same component represented
by the power-law (see Appendix B).
Table 8. X-ray spectral slopes.
No.
Galaxy
ΓS
ΓH
3
5
5
7
9
10
19
20
21
25
29
31
33
34
35
36
37
40
Cycle 8 targets
VII Zw 31
2.7+0.4
−0.4
ESO 255-IG7 N
2.0+0.7
−0.6
ESO 255-IG7 C
2.0+0.5
−0.4
ESO 60-IG16
2.1+1.4
−1.3
09022-3615
2.3+0.6
−0.6
F09111-1007 E
3.1+0.9
−0.8
13120-5453
1.0+0.4
−0.4
VV 250 E
1.7+0.4
−0.4
UGC 8387
2.5+0.4
−0.4
VV 340 N
3.8+0.4
−0.4
ESO 69-IG6 N
3.0+0.4
−0.4
F17132+5313
2.4+1.4
−1.1
F18293-3413
2.7+0.4
−0.3
ESO 593-IG8
2.2+0.6
−0.6
F19297-0406
3.6+1.5
−1.4
19542+1110
∼–2.8
CGCG 448-020
2.3+0.3
−0.3
ESO 239-IG2
2.7+0.4
−0.4
—
—
—
+0.3
0.7−0.8
+0.8
−0.1−0.3
—
+1.5
2.6−0.9
+0.9
3.6−0.8
—
+1.7
−2.5−0.5
—
—
+0.4
2.0−1.0
—
—
+0.2
1.3−0.5
+0.5
1.7−0.4
—
4
12
15
16
16
18
18
22
26
28
32
38
42
42
Archival data
F05189-2524
∼0
UGC 5101
2.0+0.3
−0.3
F10565+2448
2.5+0.3
−0.3
NGC 3690 E
1.9+0.2
−0.2
NGC 3690 W
1.9+0.2
−0.2
UGC 8058 core
1.9+0.2
−0.1
UGC 8058 nebula 5.2+0.3
−0.3
UGC 8696
2.8+0.2
−0.2
VV 705 N
2.4+0.6
−0.5
UGC 9913
1.8+0.2
−0.2
F17207–0014
2.0+0.3
−0.3
ESO 286-IG19
3.8+0.2
−0.2
ESO 148-IG2 N
3.0+0.5
−0.4
ESO 148-IG2 S
1.3+0.3
−0.3
+0.20
0.48−0.08
∼–0.7
—
+0.7
1.0−0.7
+0.5
1.1−0.5
+0.15
0.71−0.06
—
+0.1
−1.8−0.3
—
+0.5
0.8−0.3
+0.9
0.7−0.4
+1.0
0.7−2.0
—
+0.3
1.4−0.4
Notes. Photon indices derived by fitting a power-law to the 0.8–2 keV
(ΓS ) and 3–7 keV (ΓH ) bands after correcting for Galactic absorption.
Measurements are given only when the detected source counts exceed
50 cts in the respective bands in order for the spectral slope to have
meaningful constraints.
like NGC 6240 in which AGN signatures appear only in the hard
band (Netzer et al. 2005). Thus we also utilize the thermal emission spectrum to compare with the soft X-ray spectra. However,
we still suspect that there might be a possible contribution from
photoionized gas to the soft X-ray spectra of some objects, as
will be discussed below.
In applying a thermal emission model, one problem specific
to our objects is the assumed solar abundance. The hot gas induced by a starburst is expected to be polluted heavily by ejecta
of core collapse supernovae, which is rich in α elements relative
to iron. Therefore the abundance pattern should deviate significantly from the solar pattern, and this has been found to be the
case for starburst knots in nearby galaxies, e.g., The Antennae
(Fabbiano et al. 2004). When the data quality is good, a standard
A106, page 17 of 50
4
3−7 keV band
0
2
4
0
2
Nsrc
6
0.8−2 keV band
−2
0
2
Photon index
4
6
Fig. 10. Distribution of spectral slope (photon index) measured by a
power-law fit in the 0.8–2 keV and 3–7 keV bands. A correction for
Galactic absorption has been made.
4
As a first order characterization of the spectral shape, spectral
slopes in the soft (0.8–2 keV) and hard (3–7 keV) bands, derived from power-law fitting are given in Table 8. The photon index, Γ, is the slope parameter of a power-law model for
describing a photon spectrum, defined as dN/dE ∝ E −Γ photons cm−2 s−1 keV−1 , and is related to the energy index α (FE ∝
E −α ) with Γ = α + 1. In order to obtain meaningful constraints,
the slopes were determined for those spectral data which have
more than 50 cts in the energy range of interest. In fitting the
power-law, Galactic absorption is assumed.
In most objects, the soft X-ray emission is dominated by
(largely unresolved) emission lines, and the spectrum turns over
below 0.8 keV where the Fe L complex becomes weak. The
power-law fits for the soft X-ray spectra are therefore mainly
for the emission-line blend, not the underlying continuum.
Nsrc
5.1.1. Spectral slopes
Nsrc
thermal emission spectrum with a solar abundance pattern as
computed by, e.g., MEKAL, indeed does not agree with some of
the observed emission line strengths, and a modified abundance
pattern, rich in α elements, gives a better description. This may
not be evident for poor quality spectra. Since the data quality between our spectra varies, we first measure a spectral slope and
then fit the thermal emission model with the abundance pattern
of core collapse SNe for all of the soft X-ray data. These spectral fits were performed to the count rate spectra by comparing
the model folded through the detector response, using XSPEC
(ver. 11).
8
A&A 529, A106 (2011)
5.1.3. Metal abundance pattern
As discussed above, the soft X-ray spectrum may be more complicated than a standard thermal emission spectrum with a solar metal-abundance pattern. For a more physically motivated
characterization of the soft X-ray emission than given by a simple power-law fit, we adopt a thermal emission model with a
Type II SN abundance pattern (e.g., Nomoto et al. 1997) to fit the
0.4–2 keV spectra. The nominal metallicity ratio relative to oxygen for various metals is assumed (as given in Dupke & Arnaud
2001) and varies together in the fit: (Mg, Si)/O = 1, (Ne, S)/O
= 0.67, (Ar, Ca, Ni)/O = 0.46, Fe/O = 0.27. We note that this
A106, page 18 of 50
0
The Fe K line is a well known diagnostic of heavily obscured
AGN, and it is clearly seen in some spectra of our sample
galaxies. Another prominent spectral line we observe is Si K at
∼1.8 keV. The strongest line is usually from Si xiii at 1.85 keV.
This line is relatively isolated in the soft X-ray range so that the
line properties are easier to measure than is the case for other
emission lines. It could also provide a clue to the origin of the
X-ray emission.
When a line is detected at >2σ after fitting with a Gaussian,
its line flux and equivalent width with respect to the neighboring continuum are measured. Tables 9 and 10 lists measured
values for the Si and Fe lines, respectively. Fe K features are
found at 6.4 keV (line emission from cold Fe) and/or at higher
energies (Fe xxv or Fe xxvi). The detection of these Fe K lines
have been reported previously, based on XMM-Newton, ASCA,
and Chandra observations (Imanishi et al. 2003; Xia et al. 2002;
Armus et al. 2009; Komossa et al. 2003; Della ceca et al. 2002;
Ballo et al. 2004; Clements et al. 2002; Iwasawa et al. 2005;
Iwasawa & Comastri 1998; Turner & Kraemer 2003; Braito et al.
2004). One addition is F17207–0014 for which a possible highionization Fe K line is detected (2σ) for the first time.
2
5.1.2. Prominent emission lines
0.5
1
kT (keV)
Fig. 11. The distribution of temperature, kT, when the thermal emission
spectrum is fitted to the 0.4–2 keV data (see Table 11). The median
value is kT = 0.88 keV.
abandance pattern is one of those calculated for core-collapse
SNe and may not be very accurate, but it deviates significantly
from the solar pattern and will provide a good reference against
the observed data. The metallicity measurement is primarily
driven by the strength of the Fe L complex around 1 keV at
the temperature assumed for the gas. The metallicity results are
given for the O abundance relative to solar (ZSNII in Table 11)
in the interest of α elements, i.e., ZSNII is an “equivalent” oxygen abundance, which is mainly determined by the Fe L feature
and converted by the above Fe/O ratio, since given the quality
of the data, the oxygen line (e.g., O viii at 0.65 keV) itself cannot give a strong constraint. Here the solar abundance is that of
Anders & Grevess (1989). Emission lines of He-like Mg and Si
are located at energies where the ACIS response is good, and in
some qood quality data their metallicity can be measured independently (when they are strong). When this is the case, their
metallicity measurements are given separately. In this case, Si
and Mg are assumed to have the same abundance.
This prescription described above usually gives better agreement with the data than that achieved with a solar abundance
pattern, as demonstrated for the spectrum of ESO 286-IG19
in Fig. 12. When a solar abundance pattern is assumed, the
0.01
10−3
Ct/keV/s
0.01
10−3
Ct/keV/s
K. Iwasawa et al.: C-GOALS survey
0.5
1
Energy (keV)
2
0.5
1
Energy (keV)
2
Fig. 12. The Chandra ACIS 0.4–2 keV spectrum of ESO 286-IG19, fitted with a thermal emission spectrum (MEKAL) with a solar abundance
pattern (left) and that of the core-collapse SNe (right), in which O viii (0.65 keV), Ne ix (1.0 keV), Mg xi (1.36 keV) and Si xiii (1.85 keV) are
more pronounced. The χ2 values for the two fits are 53 and 37 for 41 and 40 degrees of freedom, respectively.
metallicity is found to be only 0.21+0.05
−0.03 Z , and clearly underestimates emission-lines such as Si xiii, which would be better
described with ∼2 Z (Table 11). The temperature measurement
is also affected by the choice of abundance pattern. In the example of ESO 286-IG19, the temperature derived from the solar
abundance pattern is kT = 0.82 ± 0.03, while the SNII pattern
gives kT = 0.70 ± 0.04 keV.
The bright X-ray core of Mrk 231 is dominated by the unresolved nuclear component even in the soft X-ray band. Given
that a single thermal emission model is not able to give a reasonable fit, the spectral parameters are not presented in Table 11.
The argument for a non-solar abundance pattern has so far
been based on a single-temperature fit. One caveat is that a multitemperature model could mimic the same effect (e.g., Buote &
Fabian 1998) in some cases, since it is difficult to distinguish
between the two interpretations with spectral data at the CCD
resolution of the ACIS. High-resolution spectroscopy that could
identify individual lines could be used to determine the characteristic temperature of the gas. This would tell whether the gas
is in a multi-phase. At least for the very extended nebulae, as
seen in Mrk 231 and Mrk 273, which emit almost no emission
above 2 keV but strong Mg xi and Si xiii, higher temperature gas
is unlikely to be present. We note α-element rich gas would be
produced naturally if a starburst is responsible for the metal enrichment.
5.1.4. Strong Si xiii emission lines and their origin
Even when assuming the α-element rich abundance pattern of
core-collapse SNe, the observed Si metallicity sometimes requires an even larger value (see Table 11). This may simply
be due to more Si enriched gas than theoretically predicted.
However, the excess Si line intensity could also be due to an
additional source of the line emission, e.g., photoionized gas illuminated by a hidden AGN. In fact, among the objects listed in
Table 11, all of the AGN that are identified by spectral hardness
and/or the Fe K diagnostics show at least an excess of ×2 in the
Si metallicity relative to ZSNII . Since the energies around Si xiii
(1.84 keV) are where the spectrum of the soft X-ray emitting
thermal gas starts to decline rapidly, an extra contribution from
any AGN related component would stand out relatively well.
Here, we examine the Si line strengths of starbursts and AGN
in an alternative way by using the Si xiii detected objects in
Table 9. Si xiii (1.84 keV) measurements.
No.
10
12
15
16
18
18
19
21
25
28
29
30
32
33
34
37
38
Galaxy
F09111–1007 E
UGC 5101
F10565+2448
NGC 3690 E
UGC 8058 core
UGC 8058 nebula
13120–5453
UGC 8387
VV 340 N
UGC 9913
ESO 69-IG6 N
NGC 6240
F17207–0014
F18293–3413
ESO 593-IG8
CGCG 448-020
ESO 286-IG19
ISi
10−6 ph cm−2 s−1
+4.5
0.74−3.7
+0.22
0.66−0.30
+3.4
6.1−2.8
+1.1
2.3−1.1
+0.26
0.60−0.27
+0.15
0.30−0.14
+0.8
2.1−0.8
+0.7
1.5−0.7
+0.4
1.1−0.5
+1.5
1.3−0.5
+0.6
1.3−0.6
+3.5
20.4−4.0
+0.42
0.50−0.20
+0.8
4.0−1.0
+0.54
0.85−0.43
+0.7
1.1−0.5
+0.28
0.59−0.26
EWSi
keV
0.44
0.23
0.17
0.15
0.05
0.39
0.20
0.26
0.26
0.23
0.34
0.30
0.14
0.42
0.26
0.16
0.16
Note
a
a
b
Notes. Detections with 2σ or higher significance are listed. (a) This line
intensity is of a blend of Si xiii and Si xiv and is measured by fitting
a broad Gaussian. (b) This emission-line is not found at the expected
energy of Si xiii, but at 1.60 ± 0.06 keV.
Table 9. Since the metallicity, ZSNII , is driven by the Fe L emission (Sect. 5.1.3), the enhancement of ZSi is basically the relative
strength of the Si xiii line to the Fe L bump around 0.8–1 keV.
As the heavily blended Fe L emission is not resolved at the
CCD spectral resolution, the mean 0.8–1 keV intensity is used as
a crude measure of Fe L emission, assuming that Fe L dominates
in this band. Thus, the mean Si xiii/Fe L ratio can be assessed between starburst and AGN.
The starburst sample consists of 7 objects, F10565+2448,
NGC 3690 E, Arp 220, F17207–0014, F18293–3413,
CGCG 448-020 and ESO 286-IG19. Note that objects
with mid-IR [Ne v] detection are not included (see below).
The AGN sample consists of 5 known Compton-thick AGN,
UGC 5101, Mrk 231, 13120–5453, VV 340 N and NGC 6240.
A106, page 19 of 50
A&A 529, A106 (2011)
Table 11. Temperature, absorption and metallicity.
Table 10. Fe K line features.
No.
Galaxy
4
12
18
22
25
30
F05189–2524
UGC 5101
UGC 8058
UGC 8696
VV 340 N
NGC 6240
16
28
30
32
NGC 3690 E
UGC 9913
NGC 6240
F17207–0014
E
IFeK
keV
10−6 ph s−1 cm−2
Cold line
+4.0
6.4
6.0−2.8
+0.55
6.4
0.68−0.31
+0.3
6.4
1.0−0.4
+2.7
6.4
6.7−2.4
+1.1
6.4
1.8−0.9
+2.0
6.4
15.42.0
High-ionzation line
+0.03
+2.1
6.65−0.02
7.4−2.5
+0.03
+0.51
6.64−0.03
0.92−0.32
+0.02
+2.0
6.65−0.02
8.0−1.6
+0.05
+0.73
6.90−0.05
0.82−0.41
EWFeK
keV
0.12
0.30
0.10
0.24
1.2
0.40
—
0.93
0.16
0.82
Notes. Line detections with 2σ or higher significance are listed. The
cold Fe Kα at 6.4 keV and the high-ionization Fe Kα, Fe xxv or Fe xxvi
are listed separately. The line centroid energy is measured in the rest
frame in keV.
When making a mean spectrum of each sample, a redshift
correction was made due to the fact that the energy-scale shifts
between objects are not negligible. The spectral data of individual objects are chosen so that the rest-frame 0.50–2.18 keV
range is covered and then they are binned at (rest-frame) 21 eV
intervals. These spectra are corrected for the effective area in
the same way as those spectra in Fig. 4 (Sect. 4.2), which is
necessary when the redshift correction for the energy scale is
made. Since the soft X-ray band is sensitive even to variations
in Galactic column (NH ranges between 9 × 1019 cm−2 and
2.1 × 1021 cm−2 for the relevant objects here), an absorption correction for the Galactic column is also made. Individual spectra
are then normalised to the 0.8–1 keV intensity before computing
an average from the individual members of each sample.
The mean 0.5–2.2 keV spectra of the starburst and
AGN samples are shown in Figs. 13a and b, where the 0.8–
1 keV intensity of both spectra has been set to the same level.
The Si line strength relative to the Fe L emission can be readily compared. The Si line of the mean AGN spectrum appears
to be stronger than that of the starburst by a factor of 2.0 ± 0.6.
Albeit that this is a relatively crude measure, the result is consistent with an enhanced Si line in AGN spectra, as suggested by
the metallicity fitting (Table 11).
Furthermore, an additional mean spectrum was constructed
using the same procedure, for five objects which are not selected as AGN by the X-ray criteria, but which show a detectable
mid-IR [Ne v] line in their Spitzer IRS spectra (Petric et al.
2011): VII Zw 31, F09111–1007, UGC 8387, F17132+5313
and ESO 593-IG8 (see Table 5). The mean spectrum of these
Ne v detected objects also suggests an enhancement of Si xiii;
although the data are still noisy, the enhancement relative to the
starburst sample is a factor of 1.8 ± 0.9.
While it is premature to propose such enhanced Si xiii as an
alternative to the Fe K diagnostic for a hidden AGN, it is interesting to note that both X-ray selected Compton thick AGN and
mid-IR selected AGN candidates appear to show strong Si xiii on
average, even when the data quality is not good in the Fe K band.
A contribution from an AGN photoionized component in addition to a thermal component can be a feasible explanation, unless
the photoionized gas region is affected by internal absorption.
A106, page 20 of 50
No. Galaxy
kT
NH
ZSNII
keV
1021 cm−2
Z
Cycle 8 targets
+0.1
—
4−2
3 VII Zw 31
1.0−0.1
+0.8
+1.6
5 ESO 255-IG7 N 1.8−0.5
—
0.4−0.4
+0.5
+0.1
9 09022-3615
1.1−0.2
—
0.05−0.05
+0.18
+1.2
10 F09111-1007 E 0.90−0.13
—
1.0−0.5
+0.15
13 ESO 374-IG32 0.68−0.12
—
0.6+3
−0.4
+0.26
+0.8
19 13120-5453
0.82−0.14
—
0.7−0.3
+0.1
+0.5
—
0.7−0.2
20 VV 250
1.0−0.1
+0.1
+2.3
21 UGC 8387
1.0−0.1
—
2.2−0.7
+0.08
+0.8
25 VV 340 N
0.83−0.07
—
1.3−0.4
+0.10
29 ESO 69-IG6 N 0.88−0.10
—
4.5+20
−1.9
+0.10
31 F17132+5313
0.59−0.10
—
0.7−0.4
+4.9
+0.08
+0.8
7.2−1.0
1.4−0.7
33 F18293-3413
0.61−0.07
+0.16
+0.62
34 ESO 593-IG8
0.95−0.11
—
0.53−0.29
+0.3
35 F19297-0406
1.1−0.2
—
5−4
+0.23
+0.7
+2.3
2.9−1.0
0.09−0.09
37 CGCG 448-020 0.66−0.09
+0.07
40 ESO 239-IG2
0.76−0.06
—
1.2+5
−0.6
12
15
16
18
22
22
23
26
28
30
32
38
42
42
UGC 5101
F10565+2448
NGC 3690
UGC 8058 neb
UGC 8696
UGC 8696 neb
F14348–1447
VV 705 N
UGC 9913
NGC 6240
F17207–0014
ESO 286-IG19
ESO 148-IG2 N
ESO 148-IG2 S
Archival data
+0.08
0.89−0.07
—
+0.1
1.0−0.1
—
+0.04
+0.3
0.66−0.04
2.4−0.3
+0.03
0.50−0.03
—
+0.04
0.88−0.04
—
+0.04
0.58−0.04
—
+0.19
0.92−0.15
—
+0.12
—
0.94−0.09
+0.07
+0.4
0.90−0.06
2.9−0.3
+0.03
0.91−0.03
3.0+0.x
−0.x
+0.12
+1.0
0.59−0.10
5.2−1.0
+0.04
0.70−0.04
—
+0.13
0.84−0.10
—
+0.18
1.01−0.18
—
+0.2
0.9−0.2
+0.5
1.1−0.3
+0.05
0.30−0.05
+0.06
0.31−0.06
+0.08
0.52−0.07
+0.8
1.3−0.3
1.2+10
−0.8
+3.7
2.8−1.7
+0.12
0.37−0.10
+0.03
0.24−0.03
+0.32
0.30−0.15
+0.3
1.0−0.3
2.7+10
−1.3
+0.42
0.73−0.27
ZSi
Z
8+20
−5
—
+0.2
0.4−0.2
+7
4−2
+3.7
1.7−1.2
—
+1.9
2.6−0.7
+9
7−3
+2.6
3.0−1.1
10+18
−6
—
—
+1.5
2.11.0
—
—
3.5+10
−1.8
+1.5
4.7−1.4
+1.6
3.0−1.0
+0.10
0.43−0.10
+0.43
0.96−0.33
+0.2
1.10.2
+2.2
1.70.8
—
8+9
−4
+0.28
0.70−0.21
+0.06
0.54−0.05
+0.25
0.59−0.23
+0.6
2.0−0.5
6+8
−3
+1.8
3.2−1.0
Notes. The 0.4–2 keV data are fitted with a thermal emission spectrum
assuming the metal abundance pattern of core-collapse supernovae (see
text for details). When excess absorption above the Galactic value is
required, the best-fit column density (NH ) is listed. ZSNII is the metallicity for oxygen, which is tied to the other elements with the assumed
abundance pattern of Type II SNe. This value is mainly driven by the
Fe metallicity, which is assumed to be 0.27 times that of the oxygen
metallicity, and which fits the Fe L hump around 1 keV. When excess
metallicity for Si (and Mg) is required, the Silicon metallicity is fitted
independently (ZSi ).
5.2. Discrete X-ray emission from star clusters
There are a few objects that show discrete X-ray sources separate from the main body of the galaxy emission. Some of these
discrete X-ray sources have clear optical counterparts identified
in our high resolution HST-ACS images. The optical counterparts are star clusters or dwarf galaxies in the tidal tails. In most
cases, only a few X-ray counts are detected in the soft band.
Inferred X-ray luminosities are on the order of 1039 erg s−1 .
They are much more powerful than the super star clusters in
our Galaxy, for which the primary X-ray production mechanism
is considered to be shock heating by stellar winds. If the X-ray
emission in the C-GOALS objects comes from a single source in
a star cluster, then this could be an example of an ultra-luminous
X-ray source (ULX). Prime examples are the southern source in
K. Iwasawa et al.: C-GOALS survey
0.5
0
FE
1
a)
0.5
0
FE
1
b)
0.5
0
FE
1
c)
0.5
1
1.5
2
Rest energy (keV)
Fig. 13. The mean 0.5–2.2 keV spectra of a) seven starbursts;
b) five Compton-thick AGN; and c) five non X-ray AGN but with
[Ne v]λ14.3 μm detection. The energy scale is in the rest frame. The individual spectra have been corrected for Galactic absorption and the detector effective area and then normalized to the 0.8–1 keV intensity before averaging within each sample. These mean spectra are constructed
in order to facilitate comparison of the strength of Si xiii at 1.84 keV
relative to the 0.8–1 keV band where Fe L emission dominates between
the different classes of objects (see text for detail).
UGC 8387, and the eastern triple source in CGCG 448-020 (see
Fig. 2).
6. Summary
1. We present Chanda-ACIS data for a complete sample of
44 objects which represent the high luminosity portion of
the GOALS sample. The objects in this C-GOALS sample
have log (Lir /L ) = 11.73−12.57 with z = 0.010−0.088,
and represent the most luminous IR selected galaxies in the
local universe. X-rays are detected from 43 out of the 44 objects, and their arcsec-resolution images, spectra, and radial
brightness profiles are presented.
2. Objects with a clear AGN X-ray signature represent 37%
(16/44) of the total sample, and 75% (12/16) of these AGN
are found in the higher IR luminosity half of the sample at log (Lir /L ) > 12.0). The AGN fraction would increase to 48% if objects with [Ne v]λ14.3μm detection are
included. These AGN, however, appear to be a relatively minor (∼10%) component in the total energy output of the host
galaxies apart from a few exceptions.
3. While most objects show evidence for strong interactions/mergers, NGC 6240 remains the only object to clearly
show a double AGN in our X-ray spectra. Eight AGN are
found in single nucleus objects and an additional seven have
X-ray AGN in one of the double nuclei.
4. For objects without obvious X-ray AGN signatures, X-ray
luminosities are found to be lower than expeted from their
IR luminosities based on the correlation found for nearby
star-forming galaxies with lower star formation rates. The
hard X-ray emission of these objects does not always appear
to be due to HMXBs, given that the stacked spectrum shows
strong Fe xxv, a signature of hot gas.
5. The extended soft X-ray emission found in many objects
shows a spectrum consistent with a thermal emission spectrum with an abundance pattern with enhanced α elements
relative to iron, as expected for an interstellar medium enriched by core collapse SNe produced in a starburst.
6. A comparison between the soft X-ray spectra of starburst
galaxies and galaxies containing Compton thick AGN shows
that, on average, the latter show stronger Si xiii emission at
1.85 keV which may be due to a contribution of AGN photoionized gas besides thermal emission from a starburst.
Acknowledgements. This research has made use of software packages CIAO
provided by the Chandra X-ray Center (CXC) and FTOOLS provided by
NASAS’s HEASARC. This research has also made use of the NASA/IPAC
Extragalactic Database (NED), which is operated by the Jet Propulsion
Laboratory, California Institute of Technology, under contract with the National
Aeronautics and Space Administration. The Chandra data archive is maintained
by the Chandra X-ray Center at the Smithsonian Astrophysical Observatory.
D.B.S. acknowledges support from Chandra grants GO6-7098X and GO78108A. Vivian U also acknowledges support from a NASA Jenkins Predoctoral
Fellowship and a SAO Harvard-Smithsonian Predoctoral Fellowship. We thank
the referee for helpful comments.
References
Anders, E., & Grevesse, N. 1989, Geochim. Cosmochim. Acta, 53, 197
Armus, L., Charmandaris, V., Bernard-Salas, J., et al. 2007, ApJ, 656, 148
Armus, L., Mazzarella, J. M., Evans, A. S., et al. 2009, PASP, 121, 559
Baan, W. A., & Klöckner, H.-R. 2006, A&A, 449, 559
Balestra, I., Boller, T., Gallo, L., Lutz, D., & Hess, S. 2005, A&A, 442, 469
Ballo, L., Braito, V., Della Ceca, R., et al. 2004, ApJ, 600, 634
Bassani, L., Dadina, M., Maiolino, R., et al. 1999, ApJS, 121, 473
Bianchi, S., Chiaberge, M., Piconcelli, E., Guainazzi, M., & Matt, G. 2008,
MNRAS, 386, 105
Braito, V., Della Ceca, R., Piconcelli, E., et al. 2004, A&A, 420, 79
Buote, D. A., & Fabian, A. C. 1998, MNRAS, 296, 977
Burston, A. J., Ward, M. J., & Davies, R. I. 2001, MNRAS, 326, 403
Bushouse, H. A., Borne, K. D., Colina, L., et al. 2002, ApJS, 138, 1
Chapman, S. C., Blain, A. W., Smail, I., & Ivison, R. J. 2005, ApJ, 622, 772
Charmandaris, V., Stacey, G. J., & Gull, G. 2002, ApJ, 571, 282
Chevalier, R. A., & Clegg, A. W. 1985, Nature, 317, 44
Clements, D. L., McDowell, J. C., Shaked, S., et al. 2002, ApJ, 581, 974
Condon, J. J., Helou, G., Sanders, D. B., & Soifer, B. T. 1990, ApJS, 73, 359
de Vaucouleurs, G., de Vaucouleurs, A., Corwin, H. G., Jr., et al. 1991, Vol. 1–3,
XII, 2069 (Berlin Heidelberg, New York: Springer-Verlag)
Della Ceca, R., Ballo, L., Tavecchio, F., et al. 2002, ApJ, 581, L9
Downes, D., & Eckart, A. 2007, A&A, 468, L57
Duc, P.-A., Mirabel, I. F., & Maza, J. 1997, A&AS, 124, 533
Dudley, C. C. 1999, MNRAS, 307, 553
Dudley, C. C., & Wynn-Williams, C. G. 1997, ApJ, 488, 720
Dupke, R. A., & Arnaud, K. A. 2001, ApJ, 548, 141
Elvis, M., Wilkes, B. J., McDowell, J. C., et al. 1994, ApJS, 95, 1
Fabbiano, G., Baldi, A., King, A. R., et al. 2004, ApJ, 605, L21
Farrah, D., Afonso, J., Efstathiou, A., et al. 2003, MNRAS, 343, 585
Farrah, D., Bernard-Salas, J., Spoon, H. W. W., et al. 2007, ApJ, 667, 149
Franceschini, A., Braito, V., Persic, M., et al. 2003, MNRAS, 343, 1181
Gallagher, S. C., Brandt, W. N., Chartas, G., Garmire, G. P., & Sambruna, R. M.
2002, ApJ, 569, 655
Gallagher, S. C., Schmidt, G. D., Smith, P. S., et al. 2005, ApJ, 633, 71
Gilfanov, M., Grimm, H.-J., & Sunyaev, R. 2004, MNRAS, 347, L57
Goldader, J. D., Goldader, D. L., Joseph, R. D., Doyon, R., & Sanders, D. B.
1997a, AJ, 113, 1569
A106, page 21 of 50
A&A 529, A106 (2011)
Goldader, J. D., Joseph, R. D., Doyon, R., & Sanders, D. B. 1997b, ApJ, 474,
104
Gonçalves, A. C., Véron-Cetty, M.-P., & Véron, P. 1999, A&AS, 135, 437
Griffiths, R. E., Ptak, A., Feigelson, E. D., et al. 2000, Science, 290, 1325
Grimes, J. P., Heckman, T., Strickland, D., & Ptak, A. 2005, ApJ, 628, 187
Grimm, H.-J., Gilfanov, M., & Sunyaev, R. 2003, MNRAS, 339, 793
Heckman, T. M., Armus, L., & Miley, G. K. 1990, ApJS, 74, 833
Hinshaw, G., Weiland, J. L., Hill, R. S., et al. 2009, ApJS, 180, 225
Hopkins, P. F., Hernquist, L., Cox, T. J., et al. 2006, ApJS, 163, 1
Howell, J. H., Armus, L., Mazzarella, J. M., et al. 2010, ApJ, 715, 572
Ikebe, Y., Leighly, K., Tanaka, Y., et al. 2000, MNRAS, 316, 433
Imanishi, M., Terashima, Y., Anabuki, N., & Nakagawa, T. 2003, ApJ, 596, L167
Imanishi, M., Dudley, C. C., & Maloney, P. R. 2006, ApJ, 637, 114
Inami, H., Armus, L., Surace, J. A., et al. 2010, AJ, 140, 63
Iwasawa, K., & Comastri, A. 1998, MNRAS, 297, 1219
Iwasawa, K., Sanders, D. B., Evans, A. S., et al. 2005, MNRAS, 357, 565
Iwasawa, K., Sanders, D. B., Evans, A. S., et al. 2009, ApJ, 695, L103
Iwasawa, K., Mazzarella, J. M., Surace, J. A., et al. 2011, A&AS, in press
Kalberla, P. M. W., Burton, W. B., Hartmann, D., et al. 2005, A&A, 440, 775
Kim, D.-C., Veilleux, S., & Sanders, D. B. 1998, ApJ, 508, 627
Komossa, S., Burwitz, V., Hasinger, G., et al. 2003, ApJ, 582, L15
Kondratko, P. T., Greenhill, L. J., & Moran, J. M. 2006, ApJ, 652, 136
Lehmer, B. D., Brandt, W. N., Alexander, D. M., et al. 2008, ApJ, 681, 1163
Lutz, D., Veilleux, S., & Genzel, R. 1999, ApJ, 517, L13
Marconi, A., Risaliti, G., Gilli, R., et al. 2004, MNRAS, 351, 169
Mazzarella, J. M., et al. 2010, AJ, submitted
Mazzarella, J. M., et al. 2011, AJ, submitted
McDowell, J. C., Clements, D. L., Lamb, S. A., et al. 2003, ApJ, 591, 154
Mirabel, I. F., & Sanders, D. B. 1987, ApJ, 322, 688
Modica, F., et al. 2010, AJ, submitted
Mould, J. R., Huchra, J. P., Freedman, W. L., et al. 2000, ApJ, 529, 786
Muñoz Marín, V. M., González Delgado, R. M., Schmitt, H. R., et al. 2007, AJ,
134, 648
Murphy, T. W., Jr., Armus, L., Matthews, K., et al. 1996, AJ, 111, 1025
Netzer, H., Lemze, D., Kaspi, S., et al. 2005, ApJ, 629, 739
Nomoto, K., Hashimoto, M., Tsujimoto, T., et al. 1997, Nucl. Phys. A, 616, 79
Pérez-Torres, M. A., Mattila, S., Alberdi, A., et al. 2007, ApJ, 671, L21
Persic, M., & Rephaeli, Y. 2002, A&A, 382, 843
Petric, A. O., Armus, L., Howell, J., et al. 2011, ApJ, 730, 28
Pietsch, W., Roberts, T. P., Sako, M., et al. 2001, A&A, 365, L174
Ptak, A., Heckman, T., Levenson, N. A., Weaver, K., & Strickland, D. 2003, ApJ,
592, 782
Ranalli, P., Comastri, A., & Setti, G. 2003, A&A, 399, 39
Ranalli, P., Comastri, A., Origlia, L., & Maiolino, R. 2008, MNRAS, 386, 1464
Risaliti, G., Gilli, R., Maiolino, R., & Salvati, M. 2000, A&A, 357, 13
Risaliti, G., Sani, E., Maiolino, R., et al. 2006a, ApJ, 637, L17
Risaliti, G., Maiolino, R., Marconi, A., et al. 2006b, MNRAS, 365, 303
Sanders, D. B., & Mirabel, I. F. 1996, ARA&A, 34, 749
Sanders, D. B., Mazzarella, J. M., Kim, D.-C., Surace, J. A., & Soifer, B. T.
2003, AJ, 126, 1607 (RBGS)
Spoon, H. W. W., Koornneef, J., Moorwood, A. F. M., Lutz, D., & Tielens,
A. G. G. M. 2000, A&A, 357, 898
Spoon, H. W. W., Marshall, J. A., Houck, J. R., et al. 2007, ApJ, 654, L49
Strickland, D. K., & Stevens, I. R. 2000, MNRAS, 314, 511
Strickland, D. K., & Heckman, T. M. 2007, ApJ, 658, 258
Suchkov, A. A., Berman, V. G., Heckman, T. M., & Balsara, D. S. 1996, ApJ,
463, 528
Surace, J. A., Sanders, D. B., & Mazzarella, J. M. 2004, AJ, 127, 3235
Teng, S. H., Wilson, A. S., Veilleux, S., et al. 2005, ApJ, 633, 664
Teng, S. H., Veilleux, S., Anabuki, N., et al. 2009, ApJ, 691, 261
Tenorio-Tagle, G., & Munoz-Tunon, C. 1998, MNRAS, 293, 299
Tomisaka, K., & Ikeuchi, S. 1988, ApJ, 330, 695
Torrejón, J. M., Schulz, N. S., Nowak, M. A., & Kallman, T. R. 2010, ApJ, 715,
947
Turner, T. J., & Kraemer, S. B. 2003, ApJ, 598, 916
van der Werf, P. P., Isaak, K. G., Meijerink, R., et al. 2010, A&A, 518L, 42
Veilleux, S., & Osterbrock, D.. E. 1987, ApJS, 63, 295 (VO)
Veilleux, S., Kim, D.-C., Sanders, D. B., Mazzarella, J. M., & Soifer, B. T. 1995,
ApJS, 98, 171
Veilleux, S., Kim, D.-C., & Sanders, D. B. 1999, ApJ, 522, 113
Veilleux, S., Cecil, G., & Bland-Hawthorn, J. 2005, ARA&A, 43, 769
Veilleux, S., Rupke, D. S. N., Kim, D.-C., et al. 2009, ApJS, 182, 628
Vignati, P., Molendi, S., Matt, G., et al. 1999, A&A, 349, L57
Wegner, G., Bernardi, M., Willmer, C. N. A., et al. 2003, AJ, 126, 2268
White, N. E., Swank, J. H., & Holt, S. S. 1983, ApJ, 270, 711
Xia, X. Y., Xue, S. J., Mao, S., ET AL. 2002, ApJ, 564, 196
Yuan, T.-T., Kewley, L. J., & Sanders, D. B. 2010, ApJ, 709, 884 (YKS)
A106, page 22 of 50
Zenner, S., & Lenzen, R. 1993, A&AS, 101, 363
Zezas, A., Ward, M. J., & Murray, S. S. 2003, ApJ, 594, L31
Appendix A: Notes on individual objects
IRAS F01364-1042: The optical emission-line spectrum is consistent with a shock-heated, LINER spectral type, similar to the
extended optical emission in Arp 220 and NGC 6240. The detected X-ray emission is too faint to infer its origin. A point-like
hard X-ray source is located at the nucleus of the galaxy. The soft
X-ray emission is elongated along the SE-NW direction, possibly due to two blobs straddling the nuclear source.
ESO 203-IG1: This is the only object in our sample from which
no X-ray counts are detected. There are two faint X-ray sources
to the SSW (15 ) and NWW (20 ), which have optical counter
parts in the HST-ACS image that are much fainter than ESO 203IG1 and unrelated to the IRAS galaxy.
VII Zw 31: The soft X-ray image shows a relatively symmetric source with a slight elongation along the NW-SE direction.
There are two faint spurs extending to the NW. This is a “typical” soft X-ray source showing an exponential radial brightness
profile. A strong Mg xi line at 1.3 keV is visible in the spectrum. The hard X-ray emission is resolved (a compact but not
point-like source) with a weaker source at 3 to the West of the
compact nucleus. While this object is not met the X-ray AGN
selection criteria, the mid-IR [Ne v] line is detected (Petric et al.
2011).
IRAS F05189–2524: There are two Chandra observations of this
galaxy (ObsID 2034, 3432) with 20 ks and 15 ks exposures,
respectively. The Chandra results have been published in Ptak
et al. (2003) and Grimes et al. (2005). Since this is a bright X-ray
source, we only use the ObsID 3432 data, which has a similar
exposure time to that of our Cycle 8 targets.
The soft X-ray image shows a faint extensions to the NW
and SW, but is dominated by a compact source at the nucleus.
The hard X-ray source is point-like. The low surface-brightness
envelope is consistent with the wing of the PSF, which is broader
than that in the soft X-rays.
The spectrum has a hard X-ray bump, typical of the absorbed
emission from an AGN. When a photon index of 1.8 is assumed,
the absorbing column density is found to be NH = 9 ± 1 ×
1022 cm−2 , by fitting the 3–8 keV spectrum. The absorption correction factor for the 2–10 keV luminosity is 1.7. A 6.4 keV
Fe K line is detected at the 2σ level.
There is a steep rise of the spectrum below 1.5 keV. In analogy to Seyfert 2 galaxies with similar absorption, this is likely
due to emission line blends of photoionised gas, unresolved at
the CCD resolution.
ESO 255-IG7: This is a triple system of linearly aligned galaxies. All three galaxies are detected with MIPS but the northern
galaxy is much brighter than the other two (Mazzarella et al.
2011). The X-ray brightness shows a similar pattern. We tentatively assume that the total IR luminosity is distributed among
the three galaxies in the ratio of N:C:S = 8:3:1. The northern
galaxy is the brightest and has a softer spectrum than the others.
The X-ray spectrum is strangely featureless in the soft X-ray
band. The central galaxy, in contrast, shows stronger rest energy emission-lines at 0.85 keV and 1.7 keV. Resolved hard
X-ray emission is detected from all the three galaxies. The X-ray
colour varies gradually from the northern to southern galaxies,
with HR(N:C:S) = −0.64, −0.56, −0.42.
K. Iwasawa et al.: C-GOALS survey
IRAS 07251–0248: This galaxy is the highest redshift object in
our sample. The X-ray source is very faint, detected only in the
soft band.
ESO 60-IG16: A compact X-ray source is located at the nucleus
of the NE galaxy of this galaxy pair, as is the mid/far-IR emission seen in the MIPS image (Mazzarella et al. 2011). The soft
X-ray image shows a faint tail to the SW of length 7 , while the
hard X-ray emission is point-like. The X-ray spectrum is typical
of Seyfert 2 galaxies with an excess in the hard band due to transmitted emission from an AGN absorbed by NH ∼ 1 × 1023 cm−2 .
The absorption-corrected 2–10 keV luminosity, 1042 erg s−1 , is in
the range of Seyfert nuclei. The weakness of the soft X-ray emission is partly due to the large Galactic extinction (see Table 2).
IRAS F08572+3915: The northwest nucleus of this double system is suspected to have an heavily obscured AGN, as the Spitzer
IRS spectrum shows a very deep silicate absorption and little PAH emission (e.g., Spoon et al. 2007). The northwest nucleus is detected only in the hard band, (2–4 keV), with a small
number of counts (∼10). There is a faint, soft X-ray source
near the southeast nucleus but its physical association is unclear. The hard X-ray colour (HR = +0.57) of the northwest
nucleus strongly suggests the presence of an obscured AGN.
However, the very small hard X-ray to IR luminosity ratio,
log (HX/IR) = −4.4, points to a Compton-thick AGN, although
the limited X-ray counts do not allow us to confirm it with the
Fe K line detection. The Chandra result is also reported in Teng
et al. (2009).
IRAS 09022–3615: The X-ray spectrum is flat (HR = −0.17)
and the 2–10 keV luminosity is 1042 erg s−1 , which qualifies this
galaxy as an AGN. However, the hard X-ray source is marginally
resolved. The [Ne v] line is not detected (Farrah et al. 2007).
IRAS F09111–1007: Two galaxies with projected separation of
40 are both MIPS sources; however, the western galaxy, which
is less luminous in the optical, is a stronger 24 μm source.
HIRES processing of the IRAS image (Surace et al. 2004) suggests that the two galaxies each make comparable contributions to the IRAS flux, contrary to some previous suggestions
(Murphy et al. 1996; Duc et al. 1997; Goncalves et al. 1999). In
the X-ray, the eastern galaxy is brighter, but the western galaxy
has a harder spectrum although the HR does not meet our criterion for AGN selection. The spectrum of the eastern galaxy
shows strong Si xiii (see Table 9).
UGC 4881: This system is a pair of galaxies separated by 11 .
The eastern component is brighter in the IR and radio than the
western component. Howell et al. (2010) estimated the IRAS luminosity ratio of the E–W pair is ∼2:1, based on the SpitzerMIPS data. SN1999 GW, reported at the position (RA, Dec)
= (09h 15m 54.7s, +44d 19m 55s)J2000 , is located near the western
nucleus. Three X-ray counts are detected at the position of the
supernova in our 15 ks exposure, but the association of the Xrays with the SN is not clear given the limited counts.
X-ray emission is detected both from the eastern and western
nuclei. The eastern componet is brighter and relatively peaky
at the nucleus while the X-ray source for the western galaxy is
diffuse and has a rather flat brightness distribution. The X-ray
spectrum is soft with HR = −0.73, −0.88.
UGC 5101: The hard X-ray spectrum (HR = −0.29 ± 0.05) and
the detection of a cold Fe K line with XMM-Newton demostrate
that this galaxy contains an obscured AGN (Imanishi et al.
2003). A high-ionization Fe K line might be present, but its detection is below 2σ in the Chandra data. Strong Si xiii (Table 9)
as well as S xiv needs a large enhancement in abundance of
these metals in order to be explained by a thermal emission
spectrum alone. A significant contribution of photoionized gas
from an AGN would better explain these spectral features. The
same Chandra data have been published in Ptak et al. (2003) and
Grimes et al. (2005).
ESO 374-IG32: This galaxy pair hosts an OH megamaser (Baan
& Klöckner 2006). The X-ray source is compact but resolved.
The soft X-ray emission is elongated in the NE–SW direction
while the hard X-ray source has a faint spur to the south.
IRAS F10173+0828: This edge-on galaxy hosts a mega-maser
source (Mirabel & Sanders 1987), and is expected to have an
heavily obscured source that powers the large IR luminosity
(Goldader et al. 1997a,b). A very faint X-ray source (10 cts) is
found at the nucleus only in the soft band.
IRAS F10565+2448: The western galaxy is the IRAS source as
it is the only source in the MIPS 24 μm image (Mazzarella et al.
2011), and the X-ray emission also comes only from the western
galaxy. Much of the X-ray emission arises from the nucleus as
indicated by a peaky X-ray distribution. The hard X-ray emission is point-like and the soft X-ray emission has an extension
up to 7 (∼rmax ). There is a weaker point-like X-ray source 12
to the south (10h 59m 18.48s, 24d 32m 23.3s, J2000), for which the
counterpart is not visible in the HST-ACS I-band image, but it
is possibly detected in the Spitzer-IRAC bands. It is probably a
background AGN.
NGC 3690 (=Arp 299): This nearby pair of galaxies are often
referred to as Arp 299. Although the easten galaxy is referred
to as NGC 3690 and the westen galaxy as IC 694 by several
authors, here we follow the RBGS and NED conventions and
refer to the two galaxies as NGC 3690 East (E) and NGC 3690
West (W). Both galaxies are strong infrared sources. The IRAS
flux distribution between the two galaxies estimated by Surace
et al. (2004) using the HIRES algorithm is E:W = 3:1, which is
different from that assumed in Iwasawa et al. (2009) based on
the 38 μm result by Charmandaris et al. (2002). The X-ray to
IR luminosity ratios for the eastern and western components are
derived using the 3:1 IRAS image ratio.
A detailed study based on a 25 ks Chandra ACIS-I observation (ObSID 1641) has been published by Zezas et al. (2003). In
this paper, we used the 10 ks ACIS-S observation. As mentioned
in Zezas et al. (2003), there are many discrete sources distributed
over the galaxy pair, as well as surrounding diffuse emission.
With the overlay on the high-resolution HST-ACS image, association of the discrete X-ray sources with optical counterparts
becomes clear in many cases.
Strong Fe K line emission was first detected with BeppoSAX
(Della Ceca et al. 2002). A subsequent XMM-Newton observation resolved the two nuclei and found that the spectra of both
nuclei show Fe lines but at different energies – at 6.4 keV in
NGC 3690 W and at 6.7 keV in NGC 3690 E (Ballo et al. 2004).
The Chandra data alone provide detection of these lines at the
2σ level. From the hard band image, the 6.4 keV line should
originate from the B1 knot of the eastern galaxy and serves
as strong evidence for this region to contain a Compton-thick
AGN. We do not consider, contrary to Ballo et al. (2004), that
the 6.7 keV immediately implies an AGN (see also Neff et al.
2004, for radio data), but we do assume that it should have the
same origin as that in Arp 220. There are two hard X-ray knots
in the eastern galaxy, for which eastern knot has a more absorbed
spectrum than the western knot.
The surface brightness profiles are measured separately for
the eastern and western galaxies. Because of the proximity of the
two galaxies, the measurements are limited within 13 radius.
A106, page 23 of 50
A&A 529, A106 (2011)
UGC 8058 (=Mrk 231): Mrk 231 is the only optically classified Seyfert 1 galaxy in our C-GOALS sample and it is also a
low-BAL object. The infrared SED is considered to be powered
primarily by the AGN (e.g. van der Werf et al. 2010), but note
that mid-IR [Ne v] is not detected (Farrah et al. 2007). There
are four separate Chandra-ACIS exposures giving a total exposure time of 160 ks, making this the longest exposure time by far
among the observations of our sample. Results on part or all of
these data have been reported in Ptak et al. (2003), Grimes et al.
2004), and Gallagher et al. (2002, 2005).
Almost all of the emission above 2 keV comes from the unresolved nucleus. Despite the Seyfert 1 optical classification, the
X-ray spectrum does not at all resemble that which is typically
observed in Seyfert 1 galaxies, i.e., a steep (Γ ∼ 2) power-law
with or without weak absorption by partially ionized gas (the
“warm” absorber). The Mrk 231 spectrum above 3 keV is flat
(Γ 0.7). A Fe K feature is visible at 6.4 keV (EW ∼ 100 eV),
in the 160 ks exposure spectrum, similar to that previously seen
in the XMM-Newton data (Franceschini et al. 2003; Turner &
Kraemer 2003; Braito et al. 2004). Given the detection of an hard
X-ray excess with the BeppoSAX PDS (Braito et al. 2004), the
nucleus is considered to host a heavily obscured AGN with an
absorbing column of NH ∼ 2 × 1024 cm−2 . The flat 3–7 keV continuum is attributed to the reflected AGN continuum. The constant flux measured in the four separate observations (Gallagher
et al. 2005) is compatible with this interpretation. However, the
observed EW of the Fe K line is much smaller than the expected
nominal value.
The soft X-ray emission also peaks strongly at the nucleus.
This causes rmax to be only 5 , because of how this parameter is
defined (the radius where the brightness falls to 1% of the peak
brightness).
A large, low surface brightness extension of more than 30
(=25 kpc) down to the 2×10⁻¹⁷ erg s−1 cm−2 arcsec−2 level is detected in the deep X-ray image. Much of the extended emission
beyond 5 from the nucleus is emitted below 1 keV. Between
1 keV and 2 keV, the emission is due predominantly to emission
lines of Mg xi and Si xiii (see Fig. 13 in Sect. 5.1.4).
The deep X-ray exposure reveals a horse-shoe structure 15
south of the nucleus (indicated by an arrow in Fig. 2), where a
faint optical counterpart is visible in the HST image. Note this is
not the UV horse-shoe structure with star forming knots, located
closer (∼4 ) to the nuclues, imaged in the optical/UV (MuñozMarin et al. 2007).
With the long exposure time, a reasonably good quality spectrum of the extended, low surface-brightness emission was obtained. The temperature implied from the fit to this very extended
low surface brightness emission (kT 0.5 keV) is lower than the
spatially averaged values for other galaxies and little emission is
A106, page 24 of 50
Ct/keV/s
10
−3
IRAS F12112+0305: Two X-ray sources aligned in the NE–SW
direction with a separation of ∼2.5 are resolved in the Chandra
image. They are coincident with the positions of the two optical
nuclei of this double system. Both nuclei are hard X-ray sources,
with the SW nucleus being slightly brighter and harder in X-ray
colour. The quality of the spectrum from this short exposure observation is poor. A faint soft X-ray arm, similar to that seen
in Mrk 266 (Mazzarella et al. 2010, and references therein), emanates from the NE nucleus. The same Chandra data are reported
in Teng et al. (2005) and the XMM-Newton results are reported
in Franceschini et al. (2003) where this object is considered to
be starburst dominated.
0.01
The soft band profile does not reach the 1% level to define rmax ,
so we do not give the compactness in Table 7.
0.5
1
Energy (keV)
2
Fig. A.1. The Chandra ACIS spectrum of the extended, low surface
brightness emission around Mrk 231, fitted with a thermal emission
model.
detected above 2 keV. The spectrum fitted with the model above
is also shown for comparison (Fig. A.1). The diameter of the
nebula is ∼50 kpc.
IRAS 13120–5453: The X-ray source is compact both in the soft
and hard bands. The radial brightness profile is slightly broader
than the PSF but the extension is limited below 1 . The hard
X-ray colour (HR = −0.13) classifies this object as an AGN.
The large Galactic extinction (Table 2) is part of the reason
for the hard X-ray colour. The small hard X-ray to IR ratio,
log (HX/IR) < −4, places this object as a Compton thick AGN
candidate (Table 6).
VV 250: This is a widely separated galaxy pair with a clear
tidal structure conneting the two galaxies. The eastern galaxy
is brighter in X-rays than the western galaxy, with a count ratio of ∼10:1. The IRAS HIRES estimate gives a flux ratio of
E:W = 0.85:0.15 (Surace et al. 2004). The hard X-ray core is
marginally resolved. A broad Fe L bump is seen below 1 keV
in the spectrum, but the other emission lines, e.g., Si xiii, do
not stand out. The X-ray emission associated with the Western
galaxy is patchy and distributed roughly towards the direction of
the Eastern galaxy.
UGC 8387 (=IC 883): The soft X-ray emission is elongated
along the minor axis of the galaxy’s main body, with faint filaments forming a loop on the NW side. There is a relatively
sharp boundary in the soft X-ray emission on the SE side. A
compact, but resolved hard X-ray source is located at the nuclear position, which produces a faint tail in the energy spectrum above 4 keV. There is a compact soft X-ray source about
9 to the SE of the galaxy nucleus, which has an optical counterpart in the HST-ACS image, most likely a star cluster. The
total counts detected from this object is 15.8 ± 4.0 cts in the
0.4–7 keV band. The X-ray color, HR = −0.64 ± 0.30, suggests
that the X-ray spectrum is softer than the source associated with
the galaxy main body. The details of this galaxy together with the
other GOALS datasets are discussed in a separate paper (Modica
et al. 2010). Very faint [Ne v] is detected in the Spitzer IRS high
resolution spectrum, which indicates that a weak AGN might be
present in this galaxy. The X-ray spectrum of this object is one
of those exhibiting enhanced Si xiii emission (Table 9).
UGC 8696 (=Mrk 273): A detailed analysis of the Chandra
data for this ULIRG, which has an absorbed AGN, has been
published in Xia et al. (2002). Analyses of the same data set
K. Iwasawa et al.: C-GOALS survey
are also given in Ptak et al. (2003), Satyapal et al. (2004),
Grimes et al. (2005), and González-Martín et al. (2006). The
XMM-Newton results have been reported by Balestra et al.
(2005). The absorbing column density towards the X-ray source
is NH ∼ 4 × 1023 cm−2 , and the absorption corrected 2–10 keV
luminosity is 0.9 × 1043 erg s−1 . A cold Fe K line at 6.4 keV is
detected with EW ∼ 0.24 keV. Our analysis of the hard X-ray
emission seems to indicate that the absorbed AGN may be located at the southern nucleus. The soft X-ray tail, which emits
little above 2 keV and has luminosity of 5.5 × 1040 erg s−1 , extends to the south. This X-ray emission is, however, not associated with the tidal tail imaged in the optical, but rather is located
behind it. The details concerning the nuclear position, the nature of the double nuclei, and the soft X-ray tail can be found in
Iwasawa et al. (2011).
IRAS F14348–1447: This is a double system with two nuclei
separated by ∼4 . In the IRAC bands, the southern nucleus is
brighter (Mazarella et al. 2010b), while the MIPS image is unresolved. We assumed the northern and southern nuclei to have
IR flux ratio of N:S = 1:3. The southern nucleus is also a brighter
X-ray source and shows point-like hard X-ray emission. While
the HR value for the total emission is −0.48, when selecting only
the southern nuclear region, HR = −0.18 ± 0.19, indicating the
possible presence of an AGN, which is possibly Compton thick,
based on the small HX/IR ratio (Table 6). Imanishi et al. (2007)
present Spitzer IRS spectra and also suggest the presence of an
AGN based on the L-band spectrum. The northern nucleus is
enveloped by soft X-ray emission. Based on the XMM-Newton
data, Franceschini et al. (2003) classified this galaxy as a starburst dominated source.
IRAS F14378–3651: A faint, point-like source is detected at the
nucleus of this galaxy in the hard band while there is an additional fainter blob (or an extension) at 3 to the west, which
is also detected in the soft X-ray band. The hard X-ray colour
(HR = −0.18) classifies this object as an AGN with a relatively
low 2–10 keV luminosity of ∼3 ×1041 erg s−1 , which agrees with
the Seyfert 2 classification derived from the optical spectroscopy
(Kim et al. 1998). The small HX/IR ratio means this object is a
Compton thick AGN candidate (Table 6). There is a faint structure in the HST-ACS image, which might be a star cluster within
the NW extended structure noted by Bushouse et al. (2002).
VV 340: This galaxy pair consists of an edge-on galaxy to the
north and a face-on galaxy to the south. The IRAS HIRES estimate yields a flux ratio N:S = 0.85:0.15 (Surace et al. 2004).
The northern galaxy is brighter in the 24 μm image and the detection of [Ne v] in the IRS spectrum plus the Chandra spectrum
with a possible 6.4 keV line (see below) suggest the presence of
a heavily obscured AGN (see Armus et al. 2009, for the GOALS
multi-wavelength datasets on this object). The northern galaxy
is brighter in X-rays than the southern galaxy. The soft X-ray
emission of the northern galaxy shows a complex morphology
and has a flat brightness profile. It extends along the minor axis
of the edge-on galaxy, suggesting a relation with a nuclear outflow. The soft X-ray peak is displaced by 2 to NE from the
nuclear position, where the hard X-ray emission peaks. This is
reflected in the surface brightness profile, with the innermost bin
being depressed. Absorption at the nucleus is a probable cause.
While the hardness ratio, HR = −0.74 ±0.08, indicates a soft
spectrum, there is a small bump above 4 keV which peaks at the
rest-energy of 6.4 keV. The quality of the data is insufficient to
warrant a significant detection of the Fe K line at 6.4 keV (∼2σ),
but the spectral shape is strongly suggetive of a heavily obscured,
possibly Compton-thick AGN. The absorbing column density
has to be close to 1024 cm−2 . The hard X-ray source is resolved
into a nuclear source and small blobs located both North and
South up to 7 away, which are in alignment with the radio morphology (Condon et al. 1990). A strong Si xiii (EW ∼ 0.3 keV)
at 1.87 keV is noted in the soft band spectrum, which could be
partly due to extended gas photoionied by the AGN in addition
to thermal emission from a starburst. The Chandra data has been
published as a part of the water maser sample of Kondratko et al.
(2006).
The X-ray emission associated with the southern galaxy has
no well-defined peak and shows a patchy brightness distribution. An inspection of the X-ray and optical images suggests that
the X-ray emission in this galaxy may be composed of multiple
X-ray sources associated with individual star clusters or giant
H ii regions within this galaxy.
VV 705 (=I Zw 107): This system contains a close pair of galaxies with clear tidal tails. The northern galaxy dominates the
IRAS flux. While X-ray emission is detected from both galaxies, the northern source is also much brighter in X-rays (N:S =
8:1). A bright core is found at the northern nucleus with a faint
arc to the NE that has a flat brightness distribution. There are
two faint sources to the NW at (RA, Dec) = (15h 18m 05.22s,
+42d 44m 58.23s)J2000 and to the W (RA, Dec) = (15h 18m 05.05s,
42d 44m 47.53s)J2000 , which are probably background sources.
IRAS F15250+3608: With only a 10 ks exposure, a weak soft
X-ray source is detected. No emission is detected above 2 keV,
which implies an extremely hard X-ray limit compared to the
IR luminosity, log (LHX /LIR ) < −5. The Chandra result has been
reported in Teng et al. (2005) while the XMM-Newton results
are published in Franceschini et al. (2003).
UGC 9913 (=Arp 220): This object, the nearest ULIRG, has
been studied extensively at all wavelengths. The hard X-ray
emission is elongated across the two nuclei with a separation of
1 , and is peaked at the western nucleus (Clements et al. 2002;
Iwasawa et al. 2005). The strong, Fe xxv emission, detected in
XMM-Newton (Iwasawa et al. 2005) and Suzaku (Teng et al.
2009) spectra, should come from this region. The line detection in the Chandra data is barely 2σ (Clements et al. 2002,
and Table 10). The region around the western nucleus within
2.7 shows a hard X-ray colour, HR = −0.16, which is in the
range observed for AGN. However, absorption, rather than an
intrinsicaly hard spectrum of an AGN, plays an important role in
making the spectrum appear hard.
The soft X-ray peak is displaced to the NW from the western
nucleus where the hard X-ray emission is peaked. This is primarily due to absorption in the nuclear region, which leads to the dip
at the innermost bin of the soft X-ray radial profile. The abrupt
drop of the surface brightness at 3–4 NW from the nucleus is
also due to absorption which is caused by the dust lane running
across the nucleus. Towards the SE, a relatively flat soft X-ray
tail is seen up to 10 , where the brightness drops sharply.
The low surface brightness emission extending beyond the
inner bright part emits little emission above 2 keV. The soft Xray nebula’s extension is up to ∼45 arcsec in the E–W direction. Both ends seem to show a looped morphology with a welldefined edge. The same data have appeared in Ptak et al. (2003),
McDowell et al. (2003) and Grimes et al. (2005).
ESO 69-IG6: This system is a widely separated (∼60 ) pair,
and the northern galaxy likely accounts for almost all the IRAS
flux, as it is the only source in the MIPS image (Mazzarella
et al. 2011). The X-ray source properties described in this paper are only for this northern galaxy. The northern galaxy shows
an intriguing X-ray morphology. The soft X-ray image shows a
A106, page 25 of 50
A&A 529, A106 (2011)
double morphology with diffuse emission, while the hard band
shows three compact sources aligned linearly. One of the hard
X-ray sources is located inbetween the soft X-ray double peaks.
This suggests that the soft X-ray depression between the brightness peaks may be due to absorption. This complex X-ray morphology has no correspondence in the images in the other bands
(UV/optical/near-IR). The optical nucleus imaged by the HSTACS is located at the northern blob seen in the soft X-ray band,
and this is the apex of the X-ray radial profiles. The X-ray spectrum is soft (HR = −0.67) and shows strong Si xiii (Table 9).
The southern galaxy hosts a point-like, strongly absorbed Xray source with NH ∼ 4 × 1022 cm−2 . The absorption-corrected
2–10 keV luminosity is estimated to be 1.5 × 1042 erg s−1 . It is
likely a moderately luminous Seyfert 2 nucleus.
NGC 6240: This nearby LIRG has often been considered to be
starburst dominated. The presence of an AGN was suggested
by the detection of a strong Fe K complex in the ASCA spectrum (Iwasawa & Comastri 1998), followed by the detection of
an hard X-ray excess with BeppoSAX (Vignati et al. 1999) and
RXTE (Ikebe et al. 2000), indicating a strongly absorbed (NH ∼
2 × 1024 cm−2 ) AGN. Additional evidence for an AGN was also
obtained from infrared spectroscopy (Armus et al. 2006; Risaliti
et al. 2006a). Chandra observations resolved the X-ray source
into two nuclei and revealed that both nuclei host Comptonthick AGN through the detection of reflection-dominated spectra
(Komossa et al. 2003). The same Chandra data are included in
Ptak et al. (2003) and Grimes et al. (2005). A detailed analysis of the soft X-ray emission spectrum, using the X-ray grating
spectrometer data, is presented by Netzer et al. (2005).
The low surface brightness emission in soft X-rays extends
to large radii corresponding to a projected diameter of ∼70–
80 kpc. This soft X-ray nebula has a similar morphology to that
of other galactic wind signatures like Hα (Heckman et al. 1996;
Veilleux et al. 2003). The hard X-ray emission is concentrated at
the two nuclei with a projected separation of 1.6 , which are
barely separated at the Chandra resolution. The southern nucleus is the brighter hard X-ray source. The X-ray spectrum presented in this paper is taken from the brighter, butterfly-shaped,
inner part.
IRAS F17132+5313: Two merging galaxies aligned in the E–
W direction make up this system, and both contribute to the
IRAS flux. In X-rays, the eastern galaxy is the main X-ray source
and a faint extension is seen towards the western galaxy both in
the soft and hard X-ray bands. The Chandra spectrum shows
strong emission lines of Ne ix (0.9 keV) and Mg xi (1.3 keV).
The Si xiii spectral region is noisy. No AGN signatures are detected in optical (Veilleux et al 1995; Yun et al. 2010) or in X-ray,
while the mid-IR [Ne v] is detected in the Spitzer IRS spectrum
(Petric et al. 2011).
IRAS F17207–0014: This galaxy has been observed with
Chandra twice, one snapshot with 9 ks (ObsID 4114) and another longer (49 ks) exposure (ObsID 2035). Here, we used the
long exposure data. The same data have been published in Ptak
et al. (2003), Grimes et al. (2005) and Teng et al. (2005).
The X-ray source has two peaks separated by ∼2 . The
southern peak is due to hard X-ray emission and coincides with
the NED nuclear position. The northern peak is mainly due to
soft X-ray emission. The weak soft X-ray emission at the nuclear position means that an excess of absorption is responsible
for the suppression. The dip of the soft X-ray surface brightness
profile at the innermost 1 , similar to Arp 220, is likely an effect
of absorption.
A106, page 26 of 50
The optical and infrared diagnostics (Veilleux et al. 1999;
Lutz et al. 1999; Risaliti et al. 2006b), the XMM-Newton observation (Franceschini et al. 2003) and previous Chandra publications all point to a starburst classification. Our analysis shows the
possible presence of strong, high-ionization Fe K (Table 10) on
a hard continuum (Table 8), which is, again, similar to Arp 220.
IRAS F18293–3413: X-ray emission is detected only at the
brighter face-on galaxy in this pair system. The observed X-ray
flux is consistent with the BeppoSAX value reported in Risaliti
et al. (2000). There is a possible 2–7 keV excess at the position of SN 2004ip (Perez-Torres et al. 2007, RA = 18h 32m 41.2s,
Dec −34d 11m 26.8s). However, the position is too close to the
nuclear source (∼1 away) to be resolved, given the small detected counts (6 cts). The X-ray source in this galaxy is one of the
brightest sources among our 26 Cycle-8 targets. The X-ray emission is resolved both in the soft and hard bands (up to 12 and
7 , respectively). The soft X-ray emission extends towards the
south beyond the main body of the galaxy, suggesting a possible outflow in this direction. The X-ray spectrum shows a strong
Si xiii line as well as Mg xi and Fe L blends around 0.9 keV.
ESO 593-IG8: A cross-shaped double galaxy system aligned
perpendicularly. Dudley (1999) has classified this source as a
“PAH galaxy” based on near-IR spectroscopy. The mid-IR spectroscopy detected [Ne v] (Petric et al. 2011). The X-ray emission
peaks near the intersection of the two galaxies and shows a curious morphology. The bright core is elongated in the NE–SW
direction and soft X-ray emission extends primarily towards the
south. The hard X-ray source has a narrow ∼10 tail extending
to the south. There is a sharp peak, r < 1 , in the soft X-ray
band. The spectrum shows distinct emission-line peaks at 0.95,
1.8, and possibly at 0.6 keV. Possible identifications for these
lines are Ne ix, Si xiii and O viii, respectively. If the presence
of O viii is real, this soft X-ray spectrum would be difficult to
account for by a keV-temperature thermal spectrum. The Si xiii
is strong (Table 9).
IRAS F19297–0406: This is the third most luminous object in
the C-GOALS sample but the observed X-ray emission is faint.
While the soft X-ray emission shows a slight extension, the hard
X-ray emission is point-like.
IRAS 19542+1110: This face-on galaxy has a compact X-ray
source with a very hard spectrum. The hard X-ray emission is
point-like. The hard X-ray spectrum is consistent with a transmitted AGN continuum absorbed by NH ∼ 5 × 1022 cm−2 . The
absorption-corrected 2–10 keV luminosity is estimated to be
6 × 1042 erg s−1 . No information on the optical classification is
available, most likely due to the low Galactic lattitude b = −8.9◦ .
CGCG 448-020 (=II Zw 96): This V-shaped interacting pair has
been suggested to host obscured star forming sites. Four principal near-IR peaks are identified by Zenner & Lenzen (1993)
and denoted as A, B, C, and D (also see Fig. 2 in Goldader et al.
1997b). The Spitzer-MIPS image has revealed that the more than
70 per cent of the total 24 μm emission comes from D (Inami
et al. 2010), which is almost invisible in the B-band image.
Source D is the closest to the IRAS peak and is likely to dominate the IRAS flux. There are two compact hard X-ray sources,
one of which is slightly elongated encompassing Sources C+D
and the other is coincident with Source A. Source C+D has a
X-ray colour, HR = +0.05 ± 0.14, which is in the range of AGN,
but like the nuclear region of Arp 220, absorption within these
red knots is likely the major reason for the hard X-ray colour.
There is a spur extending from Source A to the north, which is
identified as the base of a soft X-ray filament bending over to the
NW. There is another soft X-ray filament extending towards the
K. Iwasawa et al.: C-GOALS survey
NW. Both filaments appear to connect to a northern soft X-ray
blob, which altogether form an elongated loop. The location of
the NW soft X-ray blob is displaced from the NW galaxy, and
the relationship between the X-ray source and optical galaxy is
not clear.
There are three faint sources to the east, aligned linearly and
only seen in soft X-rays (Sect. 5.2). Two of these sources have
clear optical counterparts in the HST-ACS image. They are luminous star clusters or dwarf galaxies residing within the tidal
tail of the merger.
The radial surface brightness profiles were constructed with
Source A as the apex. The soft X-ray profile has a power-law
form with a slope of −1.5±0.1 out to 17 . The hard X-ray profile
has a bump at 4–10 due to Source C+D. The X-ray colour map
shows that Source D is the hardest X-ray source, which is consistent with an absorbed X-ray source associated with an obscured
far-IR source. No clear evidence for an obscured AGN can be
found in the X-ray spectrum. A clear line feature at 1.6 keV,
which is, however not at the energy of Si xiii, remains unidentified. There is a marginally significant line feature at 4.1 keV,
which also has no obvious identification.
In terms of the Lx − IR correlation (Ranalli et al. 2003), a
comparison between Source A and Source C+D may be illuminating. While the hard X-ray luminosities of Source C+D and
Source A are comparable, the IR luminosity of Source C+D is
larger than Source A by factor of ∼2 at 24 μm and factor of ∼7
at 70 μm (Inami et al. 2010), i.e., within this single object, it is
obvious that the Lx − IR correlation does not hold for individual
“knots”. The powerful, obscured IR Source C+D is X-ray quiet
(at a given IR luminosity), compared with the less powerful, unobscured Source A. This is reminiscent of the hard X-ray queiet
nature of the HXQ galaxies relative to the nearby star-forming
galaxies (Iwasawa et al. 2009).
ESO 286-IG19: A bright elliptical soft X-ray core, elongated
along the NE–SW direction, is seen around the nucleus of the
galaxy. A faint spur towards the NW is extended up to 10 . The
hard X-ray image shows a point like source with a resolved faint
extension to the NE up to 3 . The Chandra data have been published in Ptak et al. (2003) and Grimes et al. (2005). Franceschini
et al. (2003) classified this object as an AGN based on the XMMNewton data. No AGN signatures were detected in the optical
and mid-IR spectra (Table 6).
There is a faint point-like source, visible both in the soft and
hard bands, at 7 to the SE from the nucleus. A brighter compact
source with a rather hard spectrum, located at 8.5 to the SSW
from the nucleus, is also found. An optical counterpart of this
X-ray source is found in the HST-ACS I-band image (see the
Chandra overlay in Fig. 2), and is probaly a background AGN.
The X-ray spectrum shows a clear hard X-ray tail with Γ ∼
0.7. While the X-ray colour of the total emission (HR = −0.77)
does not qualify as AGN, this hard X-ray emission is the one
identifed as an absorbed AGN component in the XMM-Newton
spectrum (Franceschini et al. 2003). An iron K line is not detected either in the Chandra or XMM-Newton spectra. As shown
in Fig. 12, the relatively good quality soft X-ray spectrum suggests that the X-ray emitting gas is α element rich relative to
iron and the metallicity pattern deviates from solar. Strong Si xiii
is detected, suggesting a further enhancement of Si metallicity
(Table 11), similar to the same line detected in Compton thick
AGN (Sect. 5.1.4).
IRAS 21101+5810: A faint, compact X-ray source is detected at
the nuclear position. A western extension is seen only in the soft
band where no obvious optical counterpart is visible in the ACS
image.
ESO 239-IG2: A point-like source is detected at the nucleus in
the hard band while the soft band shows a sharp peak at the nucleus with low-brightness emission extending to 10 . The soft
X-ray extension is primarily in the N–S direction. The spectrum
is softer than the sample average (HR = −0.75) with the possible
presence of a weak hard X-ray tail.
IRAS F22491–1808: This is a well-known merger system with
spectacular tidal tails. Farrah et al. (2003) conclude that more
than half of the bolometric luminosity originates from an AGN,
based on an SED fit while optical data favour a starburst. The observed X-ray source is faint and most of the counts are detected
in the soft band, thus it has a very soft spectrum. No X-ray signature of an AGN can be found in the data. The XMM-Newton
data have been presented in Franceschini et al. (2003).
ESO 148-IG2: Two galaxy nuclei are aligned in the N–S direction with a 5 separation, and the optical image shows a classic double tidal tail. The XMM-Newton data show that this object contains an absorbed AGN based on the X-ray spectrum
(Franceschini et al. 2003), with an estimated absorbing column
density, NH ∼ 7 × 1022 cm−2 , although the broad PSF of XMMNewton did not identify the location of the AGN. Many pieces
of evidence show that the southern nucleus, which is a much
brighter source in the Spitzer-MIPS 24 μm image (we assumed
IR flux ratio of 1:3 for N:S, based on the mid-IR flux ratio estimated by Charmandaris et al. 2002), contains the AGN. The
HST-ACS image shows a point-like optical source at the southern nucleus. Risaliti et al. (2006a,b) classified this nucleus as an
AGN based on their analysis of the L-band spectrum.
Chandra results have been reported previously in Ptak et al.
(2003) and Grimes et al. (2005). The Chandra observations
clearly demonstrate that the southern nucleus is the hard X-ray
source, and the location of the absorbed AGN. When the intrinsic spectral slope is assumed to have Γ = 1.8, the absorbing column density is estimated to be NH = (5 ± 2) × 1022 cm−2 . The absorption corrected 2–10 keV luminosity is then 0.8×1042 erg s−1 .
ESO 77-IG14: This galaxy pair has two similar disk galaxies
separated by ∼17 , and two Spitzer-MIPS sources with comparable fluxes are detected at the respective nuclei; thus both
members are likely to contribute to the IRAS flux. The optical
spectral type listed in NED is H ii. Two X-ray sources, also with
comparable fluxes (1:0.6 in the 0.4–7 keV count ratio for the
NE and SW galaxies). The NE source is harder in X-ray colour.
Both X-ray sources are faint but they are not point-like. There is
another faint X-ray source (7.8 ± 2.8 cts in the 0.4–7 keV band)
located further south, which has a very faint optical counterpart
in the ACS image.
IRAS F23365+3604: This galaxy is generally considered to be
a heavily obscured object (Burston et al. 2001) and the optical
class is LINER (Veilleux et al. 1995). A faint X-ray source is
detected at the nucleus. The quality of the spectrum of the short
exposure (10 ks) observation is poor, but the hard X-ray colour,
HR = −0.22, classifies this object as an AGN, which could be
Compton thick, based on the small HX/IR ratio (Table 6). The
Chandra results are also reported in Teng et al. (2005).
Appendix B: Image extension of the very soft X-ray
band
The 0.4–0.7 keV images of Arp 220 (UGC 9913), ESO 286IG19, NGC 6240 and Mrk 231 (UGC 8058) are shown as a supporting material for footnote 4, which argues against a spectral
A106, page 27 of 50
A&A 529, A106 (2011)
Fig. B.1. The soft band (0.4–0.7 keV), grey scale images of Arp 220,
ESO 286-IG19, NGC 6240 and Mrk 231. The hard band (3–7 keV)
source in each object is indicated by the purple contours. The scale bar
in each panel indicates 5 arcsec.
A106, page 28 of 50
model in which a power-law component accounts for the very
soft band (e.g., 0.4–0.7 keV) spectrum as well as the hard band
(3–7 keV) in a starburst galaxy. The four objects were selected
for their brightness in the 0.4–0.7 keV band. The upper panels
for Arp 220 and ESO 286-IG19 are objects in which no clear
AGN signature is found in the hard band, and thus relevant to the
above argument. The bottom two panels are for NGC 6240 and
Mrk 231 in which an AGN component is found in their hard band
spectra. In all cases, the soft band (0.4–0.7 keV) emission is significantly extended, while the hard band (3–7 keV) emission is
much more compact, as shown in contours. Furthermore, the soft
band emission is displaced from the 3–7 keV hard band emission
apart from Mrk 231. It should be noted that the unresolved nuclear component of Mrk 231 is always dominant over the whole
energy band. In Arp 220 and NGC 6240, it is evident that the soft
X-ray emission is suppressed in their nuclear regions where obscuration is substantial and only the hard band emission comes
through. As shown in the above examples, the distinct morphology between the 0.4–0.7 keV and 3–7 keV bands means that the
origins of the emission in the two bands are different and cannot be represented by a single component in spectral modelling,
even if it can provide a good fit.
K. Iwasawa et al.: C-GOALS survey
Appendix C: X-ray images of the C-GOALS sample
F01364-1042
0.4-7 keV
0.4-7 keV
0.5-2 keV
2-7 keV
Fig. C.1. X-ray images and the surface brightness distributions for IRAS F01364-1042. An example of figure in the same format is shown in Fig. 3
of the main text with detailed description of the panels in the caption.
ESO 203-IG1
Fig. C.2.
A106, page 29 of 50
A&A 529, A106 (2011)
VII Zw 31
0.4-7 keV
0.4-7 keV
0.5-2 keV
0.4-7 keV
0.5-2 keV
2-7 keV
Fig. C.3.
F05189-2524
0.4-7 keV
Fig. C.4.
A106, page 30 of 50
2-7 keV
K. Iwasawa et al.: C-GOALS survey
ESO 255-IG7
N
0.4-7 keV
0.4-7 keV
0.5-2 keV
C
S
2-7 keV
Fig. C.5.
IRAS 07251-0248
0.4-7 keV
0.4-7 keV
0.5-2 keV
2-7 keV
Fig. C.6.
A106, page 31 of 50
A&A 529, A106 (2011)
ESO 60-IG16
0.4-7 keV
0.4-7 keV
0.5-2 keV
0.4-7 keV
0.5-2 keV
2-7 keV
Fig. C.7.
F08572+3915
0.4-7 keV
Fig. C.8.
A106, page 32 of 50
2-7 keV
K. Iwasawa et al.: C-GOALS survey
IRAS 09022-3615
0.4-7 keV
0.4-7 keV
0.5-2 keV
2-7 keV
0.4-7 keV
0.5-2 keV
2-7 keV
Fig. C.9.
F09111-1007
0.4-7 keV
Fig. C.10.
A106, page 33 of 50
A&A 529, A106 (2011)
UGC 4881
NE
SW
0.4-7 keV
0.4-7 keV
0.5-2 keV
2-7 keV
0.4-7 keV
0.5-2 keV
2-7 keV
Fig. C.11.
UGC 5101
0.4-7 keV
Fig. C.12.
A106, page 34 of 50
K. Iwasawa et al.: C-GOALS survey
ESO 347-IG32
0.4-7 keV
0.4-7 keV
2-7 keV
0.5-2 keV
Fig. C.13.
F10173+0828
0.4-7 keV
0.4-7 keV
0.5-2 keV
2-7 keV
Fig. C.14.
A106, page 35 of 50
A&A 529, A106 (2011)
F10565+2448
0.4-7 keV
2-7 keV
0.5-2 keV
0.4-7 keV
Fig. C.15.
NGC 3690
E
W
0.4-7 keV
Fig. C.16.
A106, page 36 of 50
0.4-7 keV
0.5-2 keV
2-7 keV
K. Iwasawa et al.: C-GOALS survey
F12112+0305
0.4-7 keV
0.4-7 keV
0.5-2 keV
2-7 keV
0.4-7 keV
0.5-2 keV
2-7 keV
Fig. C.17.
UGC 8058
0.4-7 keV
Fig. C.18.
A106, page 37 of 50
A&A 529, A106 (2011)
IRAS 13120-5453
0.4-7 keV
0.4-7 keV
2-7 keV
0.5-2 keV
Fig. C.19.
VV 250
East
0.4-7 keV
0.4-7 keV
0.5-2 keV
West
2-7 keV
East
0.4-7 keV
0.4-7 keV
0.5-2 keV
2-7 keV
West
Fig. C.20.
A106, page 38 of 50
K. Iwasawa et al.: C-GOALS survey
UGC 8387
0.4-7 keV
0.4-7 keV
0.5-2 keV
2-7 keV
Fig. C.21.
UGC 8696
0.4-7 keV
0.4-7 keV
0.5-2 keV
2-7 keV
Fig. C.22.
A106, page 39 of 50
A&A 529, A106 (2011)
F14348-1447
0.4-7 keV
0.4-7 keV
0.5-2 keV
0.4-7 keV
0.5-2 keV
2-7 keV
Fig. C.23.
F14378-3651
0.4-7 keV
Fig. C.24.
A106, page 40 of 50
2-7 keV
K. Iwasawa et al.: C-GOALS survey
VV 340
North
South
Northern source
0.4-7 keV
0.4-7 keV
2-7 keV
0.5-2 keV
Fig. C.25.
VV 705
N
0.4-7 keV
0.4-7 keV
0.5-2 keV
S
2-7 keV
Fig. C.26.
A106, page 41 of 50
A&A 529, A106 (2011)
F15250+3608
0.4-7 keV
0.4-7 keV
0.5-2 keV
2-7 keV
0.4-7 keV
0.5-2 keV
2-7 keV
Fig. C.27.
UGC 9913
0.4-7 keV
Fig. C.28.
A106, page 42 of 50
K. Iwasawa et al.: C-GOALS survey
ESO 69-IG6
North
0.4-7 keV
0.4-7 keV
0.5-2 keV
0.4-7 keV
0.5-2 keV
2-7 keV
Fig. C.29.
NGC 6240
0.4-7 keV
2-7 keV
Fig. C.30.
A106, page 43 of 50
A&A 529, A106 (2011)
F17132+5313
0.4-7 keV
0.4-7 keV
0.5-2 keV
0.4-7 keV
0.5-2 keV
2-7 keV
Fig. C.31.
F17207-0014
0.4-7 keV
Fig. C.32.
A106, page 44 of 50
2-7 keV
K. Iwasawa et al.: C-GOALS survey
F18293-3413
0.4-7 keV
0.4-7 keV
0.5-2 keV
2-7 keV
Fig. C.33.
ESO 593-IG8
0.4-7 keV
0.4-7 keV
0.5-2 keV
2-7 keV
Fig. C.34.
A106, page 45 of 50
A&A 529, A106 (2011)
F19297-0406
0.4-7 keV
0.4-7 keV
0.5-2 keV
2-7 keV
Fig. C.35.
IRAS 19542+1110
0.4-7 keV
Fig. C.36.
A106, page 46 of 50
0.4-7 keV
0.5-2 keV
2-7 keV
K. Iwasawa et al.: C-GOALS survey
CGCG448-020
0.4-7 keV
0.4-7 keV
0.5-2 keV
2-7 keV
Fig. C.37.
ESO 286-IG19
0.4-7 keV
0.4-7 keV
0.5-2 keV
2-7 keV
Fig. C.38.
A106, page 47 of 50
A&A 529, A106 (2011)
IRAS 21101+5810
0.4-7 keV
0.4-7 keV
0.5-2 keV
2-7 keV
Fig. C.39.
ESO 239-IG2
0.4-7 keV
Fig. C.40.
A106, page 48 of 50
0.4-7 keV
0.5-2 keV
2-7 keV
K. Iwasawa et al.: C-GOALS survey
F22491-1808
0.4-7 keV
0.4-7 keV
0.5-2 keV
0.4-7 keV
0.5-2 keV
2-7 keV
Fig. C.41.
ESO 148-IG2
0.4-7 keV
2-7 keV
Fig. C.42.
A106, page 49 of 50
A&A 529, A106 (2011)
ESO 77-IG14
0.4-7 keV
0.4-7 keV
0.5-2 keV
Fig. C.43.
F23365+3604
0.4-7 keV
Fig. C.44.
A106, page 50 of 50
0.4-7 keV
0.5-2 keV
2-7 keV
2-7 keV


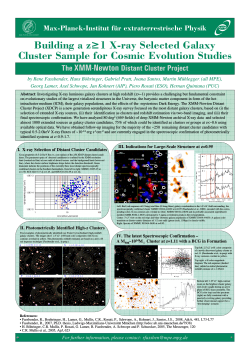


© Copyright 2026