
Mathematics Algebra II – Unit 1 (SAMPLE) 14 days
Mathematics
Algebra II – Unit 1 (SAMPLE)
Possible time frame:
14 days
Unit 1: Properties of Functions Through Quadratics
There are several concepts that students will apply to all of the major function types discussed in this course. Because students will come into Algebra II with a good
understanding of quadratic functions and their graphs, quadratics will be the starting point to introduce these function concepts. This unit will be a place to reengage students
with the Algebra I concepts of factoring, completing the square, and solving quadratic equations (to find x-intercepts). Beyond graphing, students will derive the equation of
quadratic functions given a focus and directrix. While working with quadratics the students will use function transformations, estimate rates of change, calculate average rates
of change on an interval, and begin to explore the idea of inverse functions.
Major Cluster Standards
Standards Clarification
Interpret functions that arise in applications in terms of the context
HSF-IF.B.6 Calculate and interpret the average rate of change of a function (presented symbolically or as a table) over a
specified interval. Estimate the rate of change from a graph.★
Modeling standard
HSF-IF.B.6 This skill (finding average rate of change on
an interval) should appear again in the units on
polynomial, exponential, logarithmic, and trig
functions (Units 6, 10, and 11). However, this standard
is only listed in Unit 1 because the skill needed will be
fully taught in this unit and will then be applied to the
other function types throughout the year.
Additional Cluster Standards
Build new functions from existing functions
HSF-BF.B.3 Identify the effect on the graph of replacing f(x) by f(x) + k, k f(x), f(kx), and f(x + k) for specific values of k
(both positive and negative); find the value of k given the graphs. Experiment with cases and illustrate an explanation
of the effects on the graph using technology. Include recognizing even and odd functions from their graphs and
algebraic expressions for them.
HSF-BF.B.4 Find inverse functions.
a. Solve an equation of the form f(x) = c for a simple function f that has an inverse and write an expression for the
3
inverse. For example, f(x) =2 x or f(x) = (x+1)/(x–1) for x ≠ 1.
★
Standards Clarification
HSF-BF.B.3The idea of function transformations is first
introduced in Algebra I and will continue to be
developed through quadratics. An understanding of
function transformations will aid students in graphing
all function types throughout the course.
HSF-BF.B.4a This standard is only a very basic
introduction to inverse functions.
Translate between the geometric description and the equation for a conic section
HSG-GPE.A.2 Derive the equation of a parabola given a focus and directrix.
Applying Mathematical Practices to CCSS
MP.4 Model with mathematics.
MP.7 Look for and make use of structure.
Work with modeling and fitting quadratic data in contextual situations will help students demonstrate MP.4. As students
derive the equation of a parabola using the focus and directrix, they will need to make use of geometric structures such as
the distance formula (MP.7).
Review the Algebra II sample year-long scope and sequence associated with this unit plan.
1
Mathematics
Algebra II – Unit 1 (SAMPLE)
What will students know and be able to do by the end of this unit?
Students will demonstrate an understanding of the unit focus and meet the expectations of the Common Core State Standards on the unit assessments.
Standards
Unit Assessment
Objectives and
Formative Tasks
The major cluster standards
for this unit include:
Students will demonstrate
mastery of the content
through assessment items
and tasks requiring:
Objectives and tasks
aligned to the CCSS prepare
students to meet the
expectations of the unit
assessments.
HSF-IF.B.6 Calculate and
interpret the average rate
of change of a function
(presented symbolically or
as a table) over a specified
interval. Estimate the rate
of change from a graph.★
•
•
•
•
Conceptual
Understanding
Procedural Skill and
Fluency
Application
Math Practices
Concepts and Skills
Each objective is broken
down into the key concepts
and skills students should
learn in order to master
objectives.
Possible connections to
math practices include:
MP.4 Model with
mathematics.
MP.7 Look for and make use
of structure.
2
Mathematics
Algebra II – Unit 1 (SAMPLE)
End-of-unit Assessment Sample Items:
1)
A potato is launched into the air. Estimate rates of change over different intervals and use these
to describe the height, in feet, of the potato over time, in seconds.
Time
2)
The height h, in meters, of a rock thrown straight up after t seconds is described by the equation
ℎ(𝑡) = 2 + 20𝑡 − 4.9𝑡 2 . Find and interpret the average rate of change in the height of the rock
over the first two seconds of flight.
3)
The function 𝐶(𝐿) = 750𝐿2 describes the cost 𝐶(𝐿) of planting seeds in a square field of edge
length L, in meters.
a. Find the average rate of change between 1 meter and 4 meters and explain its meaning.
b. Explain why the average rate of change calculated in part a is different than the average
rate of change between 1 meter and 2 meters.
c. Write a function for the edge length 𝐿(𝐶) of a square field that can be planted for a
given amount of money C.
d. Discuss the relationship between these two functions.
4)
Which of the following would produce a graph that is the reflection of 𝑓(𝑥) = (𝑥 − 3)2 − 4
across the x-axis?
a.
𝑓(𝑥) = 𝑥 2 − 6𝑥 + 5
b.
𝑓(𝑥) = −𝑥 2 − 6𝑥 + 5
c.
𝑓(𝑥) = −𝑥 2 + 6𝑥 − 5
d.
𝑓(𝑥) = 𝑥 2 + 6𝑥 + 5
3
Mathematics
Algebra II – Unit 1 (SAMPLE)
5)
Write the function for 𝑓(𝑥) as shown below. Describe the transformations used to transform
𝑓(𝑥) into 𝑔(𝑥). Write the function for 𝑔(𝑥) in terms of 𝑓(𝑥).
𝑓(𝑥)
𝑔(𝑥)
6)
A parabola has focus (–2, 1) and directrix 𝑦 = −3. Determine whether or not the point (2, 1) is
part of the parabola. Justify your response.
7)
The table below shows the population for Riverdale City between 1990 and 2010.
Year
Population
(hundreds)
1990
1992
1995
1997
2000
2005
2010
55
60
68
74
83
88
90
a. Find the average rate of change over the following intervals (be sure to include the
units):
• 1997 – 2000
• 2000 – 2005
• 2005 – 2010
b. Describe how the rates are changing among the three time periods based on the
population of Riverdale City.
4
Mathematics
Algebra II – Unit 1 (SAMPLE)
Sample Tasks:
1)
An object is launched at an initial velocity of 19.6 meters per second from a 58.8–meter tall
platform. This situation can be modeled by the function 𝑓(𝑥) = −4.9𝑥 2 + 19.6𝑥 + 58.8 where x
represents the time, in seconds, that the object is in motion, and 𝑓(𝑥) is the height of the object.
a. Find the average rate of change from 0 seconds to 1 second. Find the average rate of change
from 1 second to 2 seconds. Explain what each average rate of change means based on the
problem. Compare the two average rates of change to explain what is happening with the
object.
b. Find the average rate of change from 3 seconds to 5 seconds and explain its meaning.
c. What is the maximum height of the object? When does the object reach its maximum height?
d. When does the object hit the ground? How do you know?
e. What is the average rate of change between 1 second and 3 seconds? Why?
f. How would the function and graph of the function change if the object were launched from a
platform which is 63.8 meters tall? Explain your reasoning.
5
Mathematics
Algebra II – Unit 1 (SAMPLE)
End-of-unit Assessment Sample Item Responses:
1)
HSF-IF.B.6
From 0 – 2 seconds, the potato is traveling upward at an average rate of approximately 2.25 feet
per second. Between 2 and 3 seconds, the average rate of change is 0 feet per second because
the potato reaches a maximum height of about 9 feet at approximately 2.5 seconds. Then from 3
to 6 seconds the potato falls at an average rate of 3 feet per second. I know it is falling because
when calculated the average rate of change is negative which indicates the falling motion. The
potato will hit the ground at 6 seconds.
**Students may use different intervals to describe the flight. Students should also explain why
the average rate of change is different during one-second intervals: from 0-1 second the average
rate of change is 3 feet per second where from 1-2 seconds the average rate of change is
approximately 1.5 feet per second; this occurs because the potato is reaching its maximum
height when it will then begin its descent to the ground.
2)
HSF-IF.B.6
ℎ(2)−ℎ(0)
2−0
=
per second.
3)
22.4−2
2
=
20.4
2
= 10.2 The rock is traveling upward at an average rate of 10.2 meters
HSF-BF.B.4a, HSF-IF.B.6
12,000−750
11,250
a.
=
= 3750; On average, the cost of planting the field will increase $3,750
4−1
3
per meter that the length of each side increases.
b. The average rate of change between 1 meter and 2 meters is $2,250 per meter which is less
than the average change between 1 meter and 4 meters ($3,750 per meter). As the length of
the sides of the square field increases, so does the area of the field. The area of the field is
represented by the expression 𝐿2 in the function and drives the cost. This expression is a
quadratic expression which has a variable rate of change. As the square gets larger the
amount that the area changes also increases and the rate of change is not constant.
c. 𝐿(𝐶) = �
𝐶
750
d. The functions 𝐶(𝐿) = 750𝐿2 and 𝐿(𝐶) = �
𝐶
are
750
inverses of each other. The domain of
𝐶(𝐿) becomes the range of 𝐿(𝐶). The range of 𝐶(𝐿) becomes the domain of 𝐿(𝐶). The
function 𝐿(𝐶) could be used by someone to determine the size of the square field they would
be able to plant for a given amount of money they could spend on the planting.
4)
HSF-BF.B.3
Solution: Answer choice C.
5)
HSF-BF.B.3
𝑓(𝑥) = 𝑥 2 − 2
𝑔(𝑥) was created by shifting 𝑓(𝑥) 3 units to the right and 4 units up.
𝑔(𝑥) = 𝑓(𝑥 − 3) + 4
6
Mathematics
Algebra II – Unit 1 (SAMPLE)
6)
HSG-GPE.A.2
Two possible solution methods:
Method One: find the equation using the focus and directrix then substitute the ordered pair to
see if it satisfies the equation.
1
Equation: 𝑦 = (𝑥 + 2)2 − 1; ordered pair (2, 1) satisfies the equation.
8
Method Two: use the definition of a parabola as the locus of all points equidistant from the focus
and directrix.
The distance from (2, 1) to the focus (–2, 1) is four units. The distance from (2, 1) to the directrix
y = –3 is 4 units. Since these distances are the same, the point would be on the parabola.
7)
The table below shows the population for Riverdale City between 1990 and 2010.
Year
Population
(hundreds)
1990
1992
1995
1997
2000
2005
2010
55
60
68
74
83
88
90
a. Find the average rate of change over the following intervals (be sure to include the
units):
• 1997 – 2000
300 people per year
• 2000 – 2005
100 people per year
• 2005 – 2010
40 people per year
b. Describe how the rates are changing among the three time periods based on the
population of Riverdale City.
Even though the population of Riverdale City is increasing overall, the rate at which the
population is increasing is dropping. In the first period, 1997-2000, the population was
increasing at an average rate of 300 people per year. In 2000 – 2005, the population was
still increasing but only at an average rate of 100 people per year. This means not as
many people are moving into Riverdale or more people are moving out of Riverdale. The
rate of increase in population is even lower from 2005-2010 with an average increase of
40 people per year.
7
Mathematics
Algebra II – Unit 1 (SAMPLE)
Sample Task Responses:
An object is launched at an initial velocity of 19.6 meters per second from a 58.8–meter tall platform.
This situation can be modeled by the function 𝑓(𝑥) = −4.9𝑥 2 + 19.6𝑥 + 58.8 where x represents
the time, in seconds, that the object is in motion, and 𝑓(𝑥) is the height of the object.
a. Find the average rate of change from 0 seconds to 1 second. Find the average rate of change
from 1 second to 2 seconds. Explain what each average rate of change means based on the
problem. Compare the two average rates of change to explain what is happening with the
object.
𝑓(1)−𝑓(0)
1−0
𝑓(2)−𝑓(1)
2−1
=
73.5−58.8
1
78.4−73.5
1
= 14.7 meters per second
=
= 4.9 meters per second
The average rate of change during the second interval is slower than the first because as
the object is traveling upward it will start to slow down as it reaches its maximum height
and begin its descent. I know it is still traveling upward because the average rate of
change is still positive.
b. Find the average rate of change from 3 seconds to 5 seconds and explain its meaning.
𝑓(5)−𝑓(3)
5−3
34.3−73.5
=
= −19.6 meters per second. This means the object is falling at an
2
average rate of 19.6 meters per second. I know it is falling because the rate is negative.
c. What is the maximum height of the object? When does the object reach its maximum height?
The maximum height of the object is reached at 2 seconds and will be located at 78.4
meters.
d. When does the object hit the ground? How do you know?
The object will hit the ground at 6 seconds. The object is on the ground when f(x) = 0
since f(x) represents the height of the object. So we solve the quadratic equation when
set equal to zero. There are two answers, but one is negative and since x represents time
in seconds and time cannot be negative, the answer must be 6 seconds.
e. What is the average rate of change between 1 second and 3 seconds? Why?
The average rate of change between 1 second and 3 seconds is 0 meters per second
because the object reached its maximum height at 2 seconds which means it traveled
the same distance from 1 to 2 seconds as it did from 2 to 3 seconds, only in opposite
directions.
f.
How would the function and graph change if the object was launched from a platform which is
63.8 meters tall? Explain your reasoning.
The function would become 𝑓(𝑥) = −4.9𝑥 2 + 19.6𝑥 + 63.8 since the initial height of
the object now changed. This shifts the graph of the function up by 5 units because the
platform is 5 meters higher than the original. The maximum height would then be 83.4
meters.
8
Mathematics
Algebra II – Unit 1 (SAMPLE)
Possible Pacing and Sequence of Standards
Content and Practice Standards
Interpret functions that arise in applications in terms of
the context
HSF-IF.B.6 Calculate and interpret the average rate of
change of a function (presented symbolically or as a table)
over a specified interval. Estimate the rate of change from
a graph.★
Build new functions from existing functions
HSF-BF.B.3 Identify the effect on the graph of replacing
f(x) by f(x) + k, k f(x), f(kx), and f(x + k) for specific values
of k (both positive and negative); find the value of k given
the graphs. Experiment with cases and illustrate an
explanation of the effects on the graph using technology.
Include recognizing even and odd functions from their
graphs and algebraic expressions for them.
HSF-BF.B.4 Find inverse functions.
a. Solve an equation of the form f(x) = c for a simple
function f that has an inverse and write an
3
expression for the inverse. For example, f(x) =2 x or
f(x) = (x+1)/(x–1) for x ≠ 1.
Translate between the geometric description and the
equation for a conic section
HSG-GPE.A.2 Derive the equation of a parabola given a
focus and directrix.
Possible Pacing and Sequence
Days 1-4
Objective:
Students will be able to analyze quadratic functions presented symbolically, as a table, or as a graph to
determine the average rate of change on specified intervals and the effect of various transformations on
the defined functions.
Concepts and Skills:
• Calculate and interpret the average rate of change of a function over a specific interval based on the
given context.
• Estimate the average rate of change of a function based on the graph and interpret the average rate
of change within the given context.
• Identify the effect on the graph of a function by replacing f(x) by f(x) + k, k f(x), f(kx), and f(x + k) for
specific values of k.
• Find the value of k given the graphs of a function and the transformed function.
Sample Task:
1.
The Just for Fun t-shirt company used the function 𝑃(𝑞) = −100 + 0.5𝑞 + 0.01𝑞2 to determine
the profit 𝑃(𝑞), in dollars, of selling q t-shirts.
a. Compare the average rate of change between 100 t-shirts and 200 t-shirts to the average
rate of change between 200 t-shirts and 300 t-shirts.
b. Alison thinks the average rate of change between 0 t-shirts and 50 t-shirts is negative. Do you
agree or disagree? Explain your reasoning.
2.
See Illustrative Mathematics for a sample task which could be used during instruction.
9
Mathematics
Algebra II – Unit 1 (SAMPLE)
Possible Connections to Standards for Mathematical
Practices
MP.1 Make sense of problems and persevere in solving
them.
Students have to make sense of real-world problems to
solve problems presented in context.
MP.2 Reason abstractly and quantitatively.
In order to interpret average rates of change correctly,
students will have to reason both abstractly and
quantitatively to be able to understand what the rates of
change mean.
MP.3 Construct viable arguments and critique the
reasoning of others.
Students will have to provide viable arguments in order to
demonstrate understanding of many concepts in this unit.
MP.4 Model with mathematics.
Students will use graphs, calculations, and expressions to
model the problems they are presented with.
MP.6 Attend to precision.
As students construct arguments they will need to be sure
to use appropriate terms. They will also need to attend to
the appropriate units given contextual situations.
MP.7 Look for and make use of structure.
Students will use the structure of quadratic equations and
the coordinate system to assist them in deriving the
equation of a parabola given the focus and directrix.
Students will also use the structure of given functions to
write expressions for the inverse of the given functions.
Days 5-6
Objective:
Apply the understandings of average rate of change to solve a real-world problem.
Application Task Description:
This task asks students to use various average rates of change for one set of data to determine whether
they would invest in the Verizon wireless company.
Days 7-8
Objective:
Students will be able to write an expression for the inverse of simple quadratic functions and use the
expression to solve problems in context.
Concepts and Skills:
• Understand how inverse functions are related symbolically and graphically.
• Explain the relationship between the domain and range for inverse functions.
• Apply understanding of inverse functions to solve real-world problems.
Sample Task:
The function 𝐵(𝑟) = 0.0515𝑟 2 represents the braking distance for a car traveling at a speed of r miles per
hour. The braking distance is the distance the car travels after the brakes are applied until it comes to a
stop. Write a function to determine the rate of speed 𝑟(𝐵) a car must travel given a specified braking
distance, B. Explain how these two functions are related. Is the function 𝑟(𝐵) useful? Explain your
reasoning.
Days 9-12
Objective:
Students will be able to write the equation of a parabola given the focus and directrix.
Students will be able to solve real-world and mathematical problems involving the focus and directrix of
a parabola.
10
Mathematics
Algebra II – Unit 1 (SAMPLE)
Concepts and Skills:
• Define a parabola in terms of the focus and directrix.
• Understand how the focus and directrix affect the shape and equation of the parabola.
• Find the general form of the equation of a parabola given the focus and directrix.
• Apply the understanding of focus, directrix, and focal length to real-world problems.
Sample Task:
The course for a sailboat race includes a turnaround point marked by a stationary buoy. The sailboats
follow a path that remains equidistant from the buoy and the shoreline. The distance from the buoy to
the shoreline is 2.5 miles
Buoy
Checkpoint
Shoreline
**Not drawn to scale
a. Find an equation representing the path of the sailboat. Explain how you know the equation you wrote
represents the path of the sailboat.
b. Racers cross a Checkpoint at two points along their course, as indicated by the dashed line above. At
each of these points, racers can receive information about their average pace and predicted finish time.
How far is the boat from the buoy at either of these points?
Days 13-14: End of Unit Assessment
11
Mathematics
Algebra II – Unit 1 (SAMPLE)
Application Task:
You have been hired as a financial analyst to help an investor determine whether to invest in various
companies. A financial analyst might look at the average rates of change between multiple variables to
determine whether the company is in a period of growth.
Below is a table which gives the annual revenue from Verizon’s wireless business and the number of
wireless connections that yields this revenue.
Year
2006
2007
2008
2009
2010
2011
Wireless Revenue
(billions of dollars)
38.0
43.9
49.3
60.3
63.4
70.2
Wireless Connections
(millions)
59.1
65.7
72.1
96.5
102.2
107.8
1. Graph the data for wireless revenue with respect to time. Be sure to label the axes.
a. Estimate the rate of change between 2006 and 2008. Estimate the average rate of
change between 2008 and 2011. Be sure to include units in the answers.
b. Support each estimate with calculations.
c. Describe how the average revenue per year changes between the two time intervals.
2. Graph the data for wireless connections with respect to time. Be sure to label the axes.
a. Estimate the rate of change between 2006 and 2008. Estimate the rate of change
between 2008 and 2011. Be sure to include units in the answers.
b. Support each estimate with calculations.
c. Describe how the average connections per year change between the two time intervals.
3. Graph the data for wireless revenue with respect to wireless connections. Be sure to label the
axes.
a. Estimate the rate of change between 2006 and 2008. Estimate the rate of change
between 2008 and 2011. Be sure to include units in the answers.
b. Support each estimate with calculations.
c. Describe how the average revenue per connection changes between the two time
intervals.
4. Provide a written recommendation to your employer explaining why you believe they should or
should not invest in Verizon. Be sure to use information from the comparisons above to support
your recommendation. Also include any other factors you feel may need to be considered in
order to make a final decision.
12
Mathematics
Algebra II – Unit 1 (SAMPLE)
Task adapted from http://www.whyseemath.com/pdf212/ave_rate_verizon_wksht.pdf. More
information found at http://whyseemath.com/wp/surveyofcalc/2013/02/09/calculating-andinterpreting-average-rates-of-change/.
13
Mathematics
Algebra II – Unit 1 (SAMPLE)
Application Task Exemplar Response:
You have been hired as a financial analyst to help an investor determine whether to invest in various
companies. A financial analyst might look at the average rates of change between multiple variables to
determine whether the company is in a period of growth.
Below is a table which gives the annual revenue from Verizon’s wireless business and the number of
wireless connections that yields this revenue.
Year
2006
2007
2008
2009
2010
2011
Wireless Revenue
(billions of dollars)
38.0
43.9
49.3
60.3
63.4
70.2
Wireless Connections
(millions)
59.1
65.7
72.1
96.5
102.2
107.8
1. Graph the data for wireless revenue with respect to time. Be sure to label the axes.
Students may choose to use integers to represent the years (i.e., 0 represents 2006, 1
represents 2007, etc.). If so, they must indicate what the values represent.
a. Estimate the average revenue per year between 2006 and 2008. Estimate the average
revenue per year between 2008 and 2011.
Estimated revenue per year for 2006-2008:
50−39
2
≈ 5.5 billion dollars per year
14
Mathematics
Algebra II – Unit 1 (SAMPLE)
Estimated revenue per year for 2008-2011:
70−50
3
≈ 6.67 billion dollars per year
**Students may estimate differently but the values should be close to what is here.
b. Support each estimate with calculations.
Average revenue per year for 2006-2008:
per year
49.3−38.0
2008−2006
=
11.3
2
≈ 5.65 billion dollars
Average revenue per year for 2008-2011:
per year
70.2−43.9
2011−2008
=
20.9
3
≈ 6.97 billion dollars
c. Describe how the average revenue per year changes between the two time intervals.
The average amount of revenue per year is higher from 2008 to 2011 indicating that the
revenue is increasing faster from 2008 to 2011 than it did between 2006 and 2008.
2. Graph the data for wireless connections with respect to time. Be sure to label the axes.
Students may choose to use integers to represent the years (i.e., 0 represents 2006, 1
represents 2007, etc.). If so, they must indicate what the values represent.
a. Estimate the average connections per year between 2006 and 2008. Estimate the
average connections per year between 2008 and 2011.
70−59
≈ 5.5 million connections per year.
2
110−70
2008-2011:
≈ 13.3 million connections per
3
Estimated connections per year for 2006-2008:
Estimated connections per year for
year.
**Students may estimate differently but the values should be close to what is here
15
Mathematics
Algebra II – Unit 1 (SAMPLE)
b. Support each estimate with calculations.
Average connections per year for 2006-2008:
connections per year
Average connections per year for 2008-2011:
connections per year
72.1−59.1
2008−2006
=
13
2
107.8−72.1
2011−2008
=
35.7
3
≈ 6.5 million
≈ 11.9 million
c. Describe how the average connections per year change between the two time intervals.
The average number of connections per year is higher from 2008 to 2011 indicating that
each year more connections are being made.
3. Graph the data for wireless revenue with respect to wireless connections. Be sure to label the
axes.
Wireless Revenue (billions $)
80.0
70.0
60.0
50.0
40.0
30.0
20.0
10.0
0.0
50
60
70
80
90
100
110
120
Wireless Connections (millions)
a. Estimate the average revenue per connection between 2006 and 2008. Estimate the
average revenue per connection between 2008 and 2011.
49−38
11
Estimated revenue per connection for 2006-2008:
= ≈ 0.917 billion dollars per
72−60
12
million wireless connections. Since 1 billion divided by 1 million is 1 thousand, this really
means $917 per connection from 2006 to 2008.
70−49
21
Estimated revenue per connection for 2008-2011:
= ≈ 0.6 billion dollars per
108−73
35
million wireless connections or $600 per connection from 2008 to 2011.
b. Support each estimate with calculations.
16
Mathematics
Algebra II – Unit 1 (SAMPLE)
49.3−38.0
11.3
Average revenue per connection for 2006-2008:
=
≈ 0.869 billion dollars
72.1−59.1
13
per million wireless connections. Since 1 billion divided by 1 million is 1 thousand, this
really means $869 per connection from 2006 to 2008.
70.2−49.3
20.9
Average revenue per connection for 2008-2011:
=
≈ 0.585 billion dollars
107.8−72.1
35.7
per million wireless connections, or $585 per connection from 2008 to 2011.
c. Describe how the average revenue per connection changes between the two time
intervals.
The comparison of these rates indicates that even though revenue is increasing based on
revenue per year, and the number of connections is increasing per year, the amount of
money per connection is lower from 2008 to 2011 than it was from 2006 to 2008.
4. Provide a written recommendation to your employer explaining why you believe they should or
should not invest in Verizon. Be sure to use information from the comparisons above to support
your recommendation. Also include any other factors you feel may need to be considered in
order to make a final decision.
These recommendations will vary. Students should use the information they determined in the
first three situations to support their recommendation.
Task adapted from http://www.whyseemath.com/pdf212/ave_rate_verizon_wksht.pdf. More
information on responses can be found at
http://whyseemath.com/wp/surveyofcalc/2013/02/10/verizon-rates-boardwork/.
17
![[WCR-300S] How to Change the Wireless Network Name(SSID)](http://cdn1.abcdocz.com/store/data/000232989_1-c13ffbaf9a88e423608ef46454e68925-250x500.png)
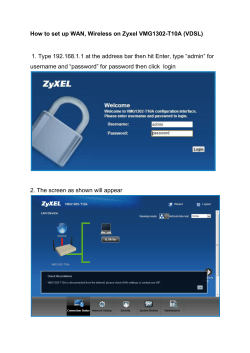

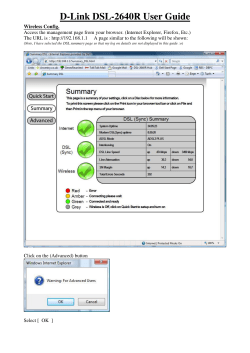


© Copyright 2026