
Chapter 7 Two sample t -tests and CI, Lecture Introduction to Geostatistics,
Two sample t-tests
and CI,
type I and II errors,
power of t-tests
Chapter 7
Katharina
Henneb¨
ohl
Two sample t-tests and CI,
type I and II errors, power of t-tests
Two sample
t-tests (and CI)
Lecture Introduction to Geostatistics,
May 17, 2011 - updated: May 18, 2011
Difference in two means,
independent samples
Pooled standard deviation
CI for difference in two
means, independent samples
Two sample t-test,
independent samples
CI for difference in two
means, paired samples
Two sample t-test, paired
samples
How large should a sample
be?
Type I and type II
errors
Katharina Henneb¨ohl
Institute for Geoinformatics
University of Muenster
Influencing type I and II
errors
Power of a t-test
Outlook
References &
further readings
7.1
Review chapter 6
Two sample t-tests
and CI,
type I and II errors,
power of t-tests
Katharina
Henneb¨
ohl
Confidence intervals population σ unknown
Two-sided and one-sided confidence intervals
Two-sided CI ⇔ two-sided one sample t-test
One-sided CI ⇔ one-sided one sample t-test
t0 (=t) value ⇔ p value
t0 (=t) value ⇔ sample mean
Connection CI/t-test: The confidence interval can be seen as
the set of acceptable null hypotheses.
Two sample
t-tests (and CI)
Difference in two means,
independent samples
Pooled standard deviation
CI for difference in two
means, independent samples
Two sample t-test,
independent samples
CI for difference in two
means, paired samples
Two sample t-test, paired
samples
How large should a sample
be?
Type I and type II
errors
Influencing type I and II
errors
Power of a t-test
Outlook
References &
further readings
7.2
Some learning goals chapter 7
Two sample t-tests
and CI,
type I and II errors,
power of t-tests
Katharina
Henneb¨
ohl
From confidence intervals for single mean to confidence
intervals for difference in means
Two sample
t-tests (and CI)
Understand the difference between independent and
paired samples
Difference in two means,
independent samples
From one sample t-test to two sample t-test
Two sample t-test,
independent samples
Test errors
Understand the concept of power of t-tests
Pooled standard deviation
CI for difference in two
means, independent samples
CI for difference in two
means, paired samples
Two sample t-test, paired
samples
How large should a sample
be?
Type I and type II
errors
Influencing type I and II
errors
Power of a t-test
Outlook
References &
further readings
7.3
Decision tree - one sample t-test
Two sample t-tests
and CI,
type I and II errors,
power of t-tests
Katharina
Henneb¨
ohl
Two sample
t-tests (and CI)
Difference in two means,
independent samples
Pooled standard deviation
CI for difference in two
means, independent samples
Two sample t-test,
independent samples
CI for difference in two
means, paired samples
Two sample t-test, paired
samples
How large should a sample
be?
Type I and type II
errors
Influencing type I and II
errors
Power of a t-test
Outlook
References &
further readings
7.4
Overview hypotheses - one sample t-test
Two sample t-tests
and CI,
type I and II errors,
power of t-tests
Katharina
Henneb¨
ohl
1
H0 : µ = µ0 , H0 : µ 6= µ0
2
H0 : µ ≥ µ0 , H0 : µ < µ0
We want to test (be sure) that a threshold is not
exceeded. Critical region is [t1−α,df , ∞].
3
H0 : µ ≤ µ0 , H0 : µ > µ0
We want to test (be sure) that a threshold is not
undershot. Critical region is [−∞, tα,df ].
Two sample
t-tests (and CI)
Difference in two means,
independent samples
Pooled standard deviation
CI for difference in two
means, independent samples
Two sample t-test,
independent samples
CI for difference in two
means, paired samples
Two sample t-test, paired
samples
How large should a sample
be?
Type I and type II
errors
Influencing type I and II
errors
Power of a t-test
Outlook
References &
further readings
7.5
Difference in two means, independent samples
Two sample t-tests
and CI,
type I and II errors,
power of t-tests
Katharina
Henneb¨
ohl
Suppose we have two pseudo samples S1 and S2 drawn from
two different populations 1 and 2.
We are interested in the difference of the population
means µ1 − µ2 .
A reasonable point estimate would be the difference in
sample means m1 − m2 .
An appropriate symmetric confidence interval around
this estimate would have the form (m1 − m2 ) ± zα/2 · SE
(NOTE: z are the quantiles of the standard normal
distribution.)
How do we obtain the standard error SE for (m1 − m2 )?
Two sample
t-tests (and CI)
Difference in two means,
independent samples
Pooled standard deviation
CI for difference in two
means, independent samples
Two sample t-test,
independent samples
CI for difference in two
means, paired samples
Two sample t-test, paired
samples
How large should a sample
be?
Type I and type II
errors
Influencing type I and II
errors
Power of a t-test
Outlook
References &
further readings
7.6
Standard error for CI difference in two means,
σ1 and σ2 known
Two sample t-tests
and CI,
type I and II errors,
power of t-tests
Katharina
Henneb¨
ohl
We assume that we know the standard deviation of the
populations from which sample S1 and S2 were drawn. What
is the standard error SE for m1 − m2 ?
s
σ12 σ22
SE =
+
n1
n2
where σ1 and n1 represent the standard deviation of
population 1 and size of sample S1 and σ2 and n2 the
standard deviation of population 2 and size of sample S2 .
Two sample
t-tests (and CI)
Difference in two means,
independent samples
Pooled standard deviation
CI for difference in two
means, independent samples
Two sample t-test,
independent samples
CI for difference in two
means, paired samples
Two sample t-test, paired
samples
How large should a sample
be?
Type I and type II
errors
Influencing type I and II
errors
Power of a t-test
Outlook
References &
further readings
7.7
Standard error CI difference in two means, σ1 = σ2
known/unknown
Two sample t-tests
and CI,
type I and II errors,
power of t-tests
Katharina
Henneb¨
ohl
Suppose the standard deviations of the two populations are
equal σ1 = σ2 = σ, then
r
1
1
SE = σ ·
+
n1 n2
In practice, we need an estimate for σ:
r
1
1
SE = sp ·
+
n1 n2
How do we obtain sp based on the sample standard
deviations s1 and s2 ?
Two sample
t-tests (and CI)
Difference in two means,
independent samples
Pooled standard deviation
CI for difference in two
means, independent samples
Two sample t-test,
independent samples
CI for difference in two
means, paired samples
Two sample t-test, paired
samples
How large should a sample
be?
Type I and type II
errors
Influencing type I and II
errors
Power of a t-test
Outlook
References &
further readings
7.8
Pooled standard deviation sp
Since both populations should have the same unknown
standard deviation σ, it seems appropriate to pool the
information from both samples to derive an estimate. We
will call this estimate sp pooled standard deviation:
sP
P
(X1 − m1 )2 + (X2 − m2 )2
sp =
(n1 − 1) + (n2 − 1)
where X1 and X2 represent the data values in the respective
sample.
The same equation reformulated
s
(n1 − 1) ∗ s12 + (n2 − 1) ∗ s22
sp =
(n1 − 1) + (n2 − 1)
Two sample t-tests
and CI,
type I and II errors,
power of t-tests
Katharina
Henneb¨
ohl
Two sample
t-tests (and CI)
Difference in two means,
independent samples
Pooled standard deviation
CI for difference in two
means, independent samples
Two sample t-test,
independent samples
CI for difference in two
means, paired samples
Two sample t-test, paired
samples
How large should a sample
be?
Type I and type II
errors
Influencing type I and II
errors
Power of a t-test
We need the degrees of freedom
df = (n1 − 1) + (n2 − 1) = n1 + n2 − 2 to specify t
Outlook
References &
further readings
7.9
CI for difference in two means, σ1 = σ2 unknown
Two sample t-tests
and CI,
type I and II errors,
power of t-tests
Katharina
Henneb¨
ohl
We can now form a (symmetric) confidence interval for the
difference of two means, assuming independent samples and
equal population standard deviations:
Two sample
t-tests (and CI)
Difference in two means,
independent samples
Pooled standard deviation
CI for difference in two
means, independent samples
(µ1 −µ2 ) ∈ [(m1 −m2 )−t(1−α/2),df ∗SE, (m1 −m2 )+t(1−α/2),df ∗SE]
Two sample t-test,
independent samples
with SE = sp ∗
q
1
n1
+
1
n2 .
The usual interest is whether this interval contains zero.
CI for difference in two
means, paired samples
Two sample t-test, paired
samples
How large should a sample
be?
Type I and type II
errors
Influencing type I and II
errors
Power of a t-test
Outlook
References &
further readings
7.10
Example by hand (1)
Example
Consider the two pseudo samples S1 and S2 drawn from two
different populations 1 and 2: S1 = {7, 6.4, 6.9, 5.5, 6.5, 6.0}
and S2 = {5.1, 4.9, 4.7, 4.6, 5.0}. We compute the 95%
confidence interval for the difference of the two population
means.
m1 = 6.4 and m2 = 4.9
s12 = 0.2647 and s22 = 0.043
n1 = 6 and n2 = 5
df = 6 + 5 − 2 = 9
s
r
5 ∗ s12 + 4 ∗ s22
1.496
sp =
=
≈ 0.41
(6 − 1) + (5 − 1)
9
Two sample t-tests
and CI,
type I and II errors,
power of t-tests
Katharina
Henneb¨
ohl
Two sample
t-tests (and CI)
Difference in two means,
independent samples
Pooled standard deviation
CI for difference in two
means, independent samples
Two sample t-test,
independent samples
CI for difference in two
means, paired samples
Two sample t-test, paired
samples
How large should a sample
be?
Type I and type II
errors
Influencing type I and II
errors
Power of a t-test
Outlook
References &
further readings
7.11
Example by hand (2)
Example
Given the pooled standard deviation sp computed on the
previous slide we obtain the 95% confidence interval as
follows:
p
p
SE = sp ∗ 1/5 + 1/6 = 0.41 ∗ 1/5 + 1/6 ≈ 0.61
Given α = 0.05 then t0.025,df =9 ≈ −2.26 and
t0.975,df =9 ≈ 2.26
Given m1 = 6.4 and m2 = 4.9 then m1 − m2 = 1.5
(µ1 − µ2 ) ∈ [1.5 − 2.26 ∗ 0.61, 1.5 + 2.26 ∗ 0.61] ⇒
(µ1 − µ2 ) ∈ [0.14, 2.9]
We may be 95% sure that the true difference between µ1
and µ2 lies within the given interval. Note that the interval
does not contain zero.
Two sample t-tests
and CI,
type I and II errors,
power of t-tests
Katharina
Henneb¨
ohl
Two sample
t-tests (and CI)
Difference in two means,
independent samples
Pooled standard deviation
CI for difference in two
means, independent samples
Two sample t-test,
independent samples
CI for difference in two
means, paired samples
Two sample t-test, paired
samples
How large should a sample
be?
Type I and type II
errors
Influencing type I and II
errors
Power of a t-test
Outlook
References &
further readings
7.12
Example in R (1)
Example
We compute the 95% confidence interval for the difference in Length
means between female and male students in studNoEx.rda.
>
>
>
>
>
>
>
>
>
>
>
>
x1 = studNoEx[studNoEx$Gender == "f", ]
x2 = studNoEx[studNoEx$Gender == "m", ]
m1 = mean(x1$Length)
m2 = mean(x2$Length)
delta = m1 - m2
var1 = var(x1$Length)
var2 = var(x2$Length)
n1 = length(x1$Length)
n2 = length(x2$Length)
v = ((n1 - 1) * var1 + (n2 - 1) * var2)/(n1 + n2 - 2)
sp = sqrt(v)
sp
[1] 7.048812
sp the pooled standard deviation sp , and v the pooled variance.
Two sample t-tests
and CI,
type I and II errors,
power of t-tests
Katharina
Henneb¨
ohl
Two sample
t-tests (and CI)
Difference in two means,
independent samples
Pooled standard deviation
CI for difference in two
means, independent samples
Two sample t-test,
independent samples
CI for difference in two
means, paired samples
Two sample t-test, paired
samples
How large should a sample
be?
Type I and type II
errors
Influencing type I and II
errors
Power of a t-test
Outlook
References &
further readings
7.13
Example in R (2)
Example
> se = sp * sqrt(1/n1 + 1/n2)
> se
Two sample t-tests
and CI,
type I and II errors,
power of t-tests
Katharina
Henneb¨
ohl
[1] 1.269341
> df = n1 + n2 - 2
> t0_025 = qt(0.025, df)
> t0_025
Two sample
t-tests (and CI)
Difference in two means,
independent samples
Pooled standard deviation
CI for difference in two
means, independent samples
[1] -1.978820
>
>
>
>
t0_975 = qt(0.975, df)
lower = delta + t0_025 * se
upper = delta + t0_975 * se
c(lower, upper)
[1] -16.52085 -11.49725
Two sample t-test,
independent samples
CI for difference in two
means, paired samples
Two sample t-test, paired
samples
How large should a sample
be?
Type I and type II
errors
Influencing type I and II
errors
Power of a t-test
We can be 95% sure that the true difference in Length means lies in
[−16.52085, −11.49725]. Note that the interval does not contain zero.
Outlook
⇒ Why is the interval negative?
References &
further readings
7.14
Two sample t-test & CI for the difference in means
Example
Alternatively, we could obtain the 95% confidence interval for the
difference in Length means between female and male students in
studNoEx.rda by a two sample t-test in R.
> female = x1$Length
> male = x2$Length
> t.test(female, male, var.equal = TRUE, conf.level = 0.95)
Two sample t-tests
and CI,
type I and II errors,
power of t-tests
Katharina
Henneb¨
ohl
Two sample
t-tests (and CI)
Difference in two means,
independent samples
Two Sample t-test
Pooled standard deviation
CI for difference in two
means, independent samples
Two sample t-test,
data: female and male
independent samples
CI for difference in two
t = -11.0365, df = 127, p-value < 2.2e-16
means, paired samples
alternative hypothesis: true difference in means is not equal toTwo 0sample t-test, paired
samples
95 percent confidence interval:
How large should a sample
be?
-16.52085 -11.49725
Type I and type II
sample estimates:
errors
mean of x mean of y
Influencing type I and II
errors
169.0294 183.0385
Power of a t-test
Do you see the connection between a CI for the difference in
means and a two sample t-test?
Outlook
References &
further readings
7.15
Explanation R output
Two sample t-tests
and CI,
type I and II errors,
power of t-tests
Katharina
Henneb¨
ohl
How do we compute df = 127?
df = 51 − 1 + 78 − 1 = 127
How do we compute the t = −11.0365?
t = (m1 − m2)/SE =
(169.0294 − 183.0385)/1.269341 = −11.03651
Conclusion from the example: we can be 95% sure that
the true difference between the means is not zero.
Two sample
t-tests (and CI)
Difference in two means,
independent samples
Pooled standard deviation
CI for difference in two
means, independent samples
Two sample t-test,
independent samples
CI for difference in two
means, paired samples
Two sample t-test, paired
samples
How large should a sample
be?
Type I and type II
errors
Influencing type I and II
errors
Power of a t-test
Outlook
References &
further readings
7.16
Two sample t-test - by hand
Example
Two sample t-tests
and CI,
type I and II errors,
power of t-tests
Katharina
Henneb¨
ohl
We consider the variable Length in the studNoEx.rda dataset and
want to test whether the mean Length significantly differs between
female and male students, at a significance level α = 0.05.
1 H0 : µ1 − µ2 = 0, HA : µ1 − µ2 6= 0 ( H0 : µ1 = µ2 ,
HA : µ1 6= µ2 )
2 n1 = 51, n2 = 78 (number of female and male students)
3 α = 0.05
4 df = 127 ⇒ t0.025,df = −1.979 and t0.975,df = 1.979
5 Critical region, so any t0 outside t0.025,df = −1.979 and
t0.975,df = 1.979 leads to rejection of H0 .
6 t0 = (m1 − m2 )/SE = (169.0294 − 183.0385)/1.269341 =
−11.0365
7 We can reject H0 and can be 95% sure that µ1 and µ2 are
significantly different.
Two sample
t-tests (and CI)
Difference in two means,
independent samples
Pooled standard deviation
CI for difference in two
means, independent samples
Two sample t-test,
independent samples
CI for difference in two
means, paired samples
Two sample t-test, paired
samples
How large should a sample
be?
Type I and type II
errors
Influencing type I and II
errors
Power of a t-test
Outlook
References &
further readings
7.17
Difference in means - independent samples
Two sample t-tests
and CI,
type I and II errors,
power of t-tests
Katharina
Henneb¨
ohl
Two sample
t-tests (and CI)
Difference in two means,
independent samples
Pooled standard deviation
CI for difference in two
means, independent samples
Two sample t-test,
independent samples
CI for difference in two
means, paired samples
Two sample t-test, paired
samples
How large should a sample
be?
Type I and type II
errors
Influencing type I and II
errors
Power of a t-test
Outlook
References &
further readings
7.18
Difference in means - paired samples
Two sample t-tests
and CI,
type I and II errors,
power of t-tests
Katharina
Henneb¨
ohl
Two sample
t-tests (and CI)
Difference in two means,
independent samples
Pooled standard deviation
CI for difference in two
means, independent samples
Two sample t-test,
independent samples
CI for difference in two
means, paired samples
Two sample t-test, paired
samples
How large should a sample
be?
Type I and type II
errors
Influencing type I and II
errors
Power of a t-test
Outlook
References &
further readings
7.19
CI for the difference in two means; paired samples
Paired/matched samples: a single object has been measured
twice (usually at two moments, or ”before” and ”after”
treatment)
obj
1
2
3
4
5
t1
13.5
15.3
7.5
10.3
8.7
t2
12.7
15.1
6.6
8.5
8.0
t1 − t2
0.8
0.2
0.9
1.8
0.7
The average of the differences t1 − t2 is md = 0.88, the
standard deviation
sd = 0.58, and the standard error
√
SE = sd / 5 ≈ 0.26.
Using t0.025,df =4 = −2.776, the 95% CI for the average
population difference ∆ is
[0.88 − 2.776 ∗ 0.26, 0.88 + 2.776 ∗ 0.26] = [0.15824, 1.60176].
Two sample t-tests
and CI,
type I and II errors,
power of t-tests
Katharina
Henneb¨
ohl
Two sample
t-tests (and CI)
Difference in two means,
independent samples
Pooled standard deviation
CI for difference in two
means, independent samples
Two sample t-test,
independent samples
CI for difference in two
means, paired samples
Two sample t-test, paired
samples
How large should a sample
be?
Type I and type II
errors
Influencing type I and II
errors
Power of a t-test
Outlook
References &
further readings
7.20
Two sample t-test, paired samples - by hand
Example
Two sample t-tests
and CI,
type I and II errors,
power of t-tests
Katharina
Henneb¨
ohl
We consider the sample from the previous slide and want to test
whether the average difference of t1 and t2 is zero.
1 H0 : ∆ = 0, HA : ∆ 6= 0
2 n1,2 = 5 ⇒ The differences are the sample, so there is basically
only one sample!
3 α = 0.05
4 df = 4 ⇒ t0.025,df = −2.776 and t0.975,df = 2.776
5 Critical region, so any t0 outside t0.025,df = −2.776 and
t0.975,df = 2.776 leads to rejection of H0 .
6 t0 = md /SE = md = 0.88/0.26 ≈ 3.385
7 We can reject H0 and can be 95% sure that the average difference
of paired samples ∆ significantly differs from zero.
Two sample
t-tests (and CI)
Difference in two means,
independent samples
Pooled standard deviation
CI for difference in two
means, independent samples
Two sample t-test,
independent samples
CI for difference in two
means, paired samples
Two sample t-test, paired
samples
How large should a sample
be?
Type I and type II
errors
Influencing type I and II
errors
Power of a t-test
Outlook
References &
further readings
7.21
CI for the difference in means; paired or independent
samples?
On the previous slide we have seen that the 95% CI for the
average population difference ∆ is [0.15824, 1.60176]. This
interval does not contain zero.
The 95% CI for the difference in two means for the same two
samples is [-4.111314, 5.871314]. This interval does contain
zero and is wider than the 95% CI for ∆.
With both methods, we estimate the difference in population
means.
Using paired samples, it is sometimes possible to obtain a
more precise interval estimate for the difference in two
population means (or a lower p-value when testing) because
pairing may keep extraneous variables constant.
Two sample t-tests
and CI,
type I and II errors,
power of t-tests
Katharina
Henneb¨
ohl
Two sample
t-tests (and CI)
Difference in two means,
independent samples
Pooled standard deviation
CI for difference in two
means, independent samples
Two sample t-test,
independent samples
CI for difference in two
means, paired samples
Two sample t-test, paired
samples
How large should a sample
be?
Type I and type II
errors
Influencing type I and II
errors
But only if the pairs make sense!
Power of a t-test
Outlook
References &
further readings
7.22
Paired or independent samples? Example (1) in R using
function t.test
Example
Two sample t-tests
and CI,
type I and II errors,
power of t-tests
Katharina
Henneb¨
ohl
> x1 = c(13.5, 15.3, 7.5, 10.3, 8.7)
> x2 = c(12.7, 15.1, 6.6, 8.5, 8)
> t.test(x1, x2, var.equal = TRUE)
Two sample
t-tests (and CI)
Difference in two means,
Two Sample t-test
independent samples
Pooled standard deviation
data: x1 and x2
CI for difference in two
means, independent samples
t = 0.4066, df = 8, p-value = 0.695
Two sample t-test,
alternative hypothesis: true difference in means is not equal toindependent
0 samples
CI for difference in two
95 percent confidence interval:
means, paired samples
Two sample t-test, paired
-4.111314 5.871314
samples
How large should a sample
sample estimates:
be?
mean of x mean of y
Type I and type II
11.06
10.18
errors
Here we compare the difference in two population means using
independent samples and obtain a 95% CI
(µ1 − µ2 ) ∈ [−4.111314, 5.871314].
We can not reject H0 .
Influencing type I and II
errors
Power of a t-test
Outlook
References &
further readings
7.23
CI for the difference in means; paired or independent
samples? Example (2) in R using function t.test
Example
Two sample t-tests
and CI,
type I and II errors,
power of t-tests
Katharina
Henneb¨
ohl
> x1 = c(13.5, 15.3, 7.5, 10.3, 8.7)
> x2 = c(12.7, 15.1, 6.6, 8.5, 8)
> t.test(x1, x2, paired = TRUE, var.equal = TRUE)
Two sample
t-tests (and CI)
Difference in two means,
independent samples
Paired t-test
Pooled standard deviation
data: x1 and x2
CI for difference in two
means, independent samples
t = 3.3896, df = 4, p-value = 0.02754
Two sample t-test,
alternative hypothesis: true difference in means is not equal toindependent
0 samples
CI for difference in two
means, paired samples
95 percent confidence interval:
Two sample t-test, paired
samples
0.1591929 1.6008071
How large should a sample
be?
sample estimates:
mean of the differences
Type I and type II
errors
0.88
Influencing type I and II
errors
Here we compare the difference in two population means using paired
samples and obtain a 95% CI ∆ ∈ [0.1591929, 1.6008071].
We can reject H0 .
Power of a t-test
Outlook
References &
further readings
7.24
CI for the difference in means; paired or independent
samples? Example (3) in R using function t.test
Example
Two sample t-tests
and CI,
type I and II errors,
power of t-tests
Katharina
Henneb¨
ohl
> x1 - x2
[1] 0.8 0.2 0.9 1.8 0.7
> t.test(x1 - x2)
One Sample t-test
data: x1 - x2
t = 3.3896, df = 4, p-value = 0.02754
alternative hypothesis: true mean is not equal to 0
95 percent confidence interval:
0.1591929 1.6008071
sample estimates:
mean of x
0.88
Two sample
t-tests (and CI)
Difference in two means,
independent samples
Pooled standard deviation
CI for difference in two
means, independent samples
Two sample t-test,
independent samples
CI for difference in two
means, paired samples
Two sample t-test, paired
samples
How large should a sample
be?
Type I and type II
errors
Influencing type I and II
errors
Power of a t-test
A paired t-test somehow corresponds to a one sample t-test: the
Outlook
differences between the pairs are the sample.
References &
further readings
7.25
More confidence intervals
We have computed confidence intervals for a single mean
and the difference in two means, using either independent or
paired samples. There are more possibilities to obtain
confidence intervals such as:
Confidence intervals for proportions (percentages); very
similar to confidence intervals for means.
Confidence intervals for difference in proportions
(percentages)
Confidence intervals for difference in proportions
(percentages)
Confidence intervals for population variance (will be
adressed in chapter 8)
Two sample t-tests
and CI,
type I and II errors,
power of t-tests
Katharina
Henneb¨
ohl
Two sample
t-tests (and CI)
Difference in two means,
independent samples
Pooled standard deviation
CI for difference in two
means, independent samples
Two sample t-test,
independent samples
CI for difference in two
means, paired samples
Two sample t-test, paired
samples
How large should a sample
be?
Type I and type II
errors
Influencing type I and II
errors
Power of a t-test
Outlook
References &
further readings
7.26
How large should a sample be?
Given that a 95% confidence interval, e.g. for µ is obtained
by
[m − tdf ,(1−α/2) · SE, m + tdf ,(1−α/2) · SE]
and given that α is chosen and σ is not under our control,
we can only control the width W of the interval by
manipulating n:
s
W = 2tdf ,(1−α/2) · SE = 2tdf ,(1−α/2) · √
n
2tdf ,(1−α/2) · s 2
n=(
)
W
This equation helps to compute the sample size necessary to
obtain a confidence interval with a specific width W .
Two sample t-tests
and CI,
type I and II errors,
power of t-tests
Katharina
Henneb¨
ohl
Two sample
t-tests (and CI)
Difference in two means,
independent samples
Pooled standard deviation
CI for difference in two
means, independent samples
Two sample t-test,
independent samples
CI for difference in two
means, paired samples
Two sample t-test, paired
samples
How large should a sample
be?
Type I and type II
errors
Influencing type I and II
errors
Power of a t-test
Outlook
References &
further readings
7.27
Type I and type II errors - basic idea
Two sample t-tests
and CI,
type I and II errors,
power of t-tests
Katharina
Henneb¨
ohl
To illustrate the concept of type I and II errors, we consider
the situation of a trial (example adapted from
[Wonnacott & Wonnacott (1990)]). The judge should
decide between H0 , the hypothesis that the accused is
innocent, and the alternative HA , that he is guilty.
Two sample
t-tests (and CI)
Difference in two means,
independent samples
Pooled standard deviation
A type I error occurs if the judge considers an innocent
person guilty (reject true H0 ).
A type II error occurs if the accused is guilty but set
free (not reject H0 although HA is true).
To prove guilt beyond reasonable doubt means that α
should be very small.
CI for difference in two
means, independent samples
Two sample t-test,
independent samples
CI for difference in two
means, paired samples
Two sample t-test, paired
samples
How large should a sample
be?
Type I and type II
errors
Influencing type I and II
errors
Power of a t-test
Outlook
References &
further readings
7.28
Type I and type II errors - illustration
Two sample t-tests
and CI,
type I and II errors,
power of t-tests
Katharina
Henneb¨
ohl
Two sample
t-tests (and CI)
Difference in two means,
independent samples
Pooled standard deviation
CI for difference in two
means, independent samples
Two sample t-test,
independent samples
CI for difference in two
means, paired samples
Two sample t-test, paired
samples
How large should a sample
be?
Type I and type II
errors
Influencing type I and II
errors
Power of a t-test
Outlook
References &
further readings
7.29
Type I and Type II errors - definition
Two sample t-tests
and CI,
type I and II errors,
power of t-tests
Katharina
Henneb¨
ohl
The risk to wrongly rejecting a true H0 is the significance
level of the test α. The risk that we wrongly not reject a
false H0 is called β.
Truth
Test result
H0 true
H0 false
Reject H0
Type I error, α OK, (1-β), power
Do not reject H0
OK (1-α)
Type II error, β
We call (1 − β) the power of a test. The power of a test is
the probability the null hypothesis is rejected when it is false.
Two sample
t-tests (and CI)
Difference in two means,
independent samples
Pooled standard deviation
CI for difference in two
means, independent samples
Two sample t-test,
independent samples
CI for difference in two
means, paired samples
Two sample t-test, paired
samples
How large should a sample
be?
Type I and type II
errors
Influencing type I and II
errors
Power of a t-test
Outlook
References &
further readings
7.30
Reducing α and β?
Two sample t-tests
and CI,
type I and II errors,
power of t-tests
Katharina
Henneb¨
ohl
Two sample
t-tests (and CI)
Difference in two means,
independent samples
Pooled standard deviation
CI for difference in two
means, independent samples
Two sample t-test,
independent samples
CI for difference in two
means, paired samples
Two sample t-test, paired
samples
How large should a sample
be?
Type I and type II
errors
Influencing type I and II
errors
Power of a t-test
Decreasing the type I error α from ≈ 0.05 to e.g. 0.01...
Outlook
References &
further readings
7.31
Reducing α and β?
Two sample t-tests
and CI,
type I and II errors,
power of t-tests
Katharina
Henneb¨
ohl
Two sample
t-tests (and CI)
Difference in two means,
independent samples
Pooled standard deviation
CI for difference in two
means, independent samples
Two sample t-test,
independent samples
CI for difference in two
means, paired samples
Two sample t-test, paired
samples
How large should a sample
be?
Type I and type II
errors
Influencing type I and II
errors
Power of a t-test
... will increase the type II error β. And vice versa.
Outlook
References &
further readings
7.32
Reducing α and β?
Two sample t-tests
and CI,
type I and II errors,
power of t-tests
Katharina
Henneb¨
ohl
Two sample
t-tests (and CI)
Difference in two means,
independent samples
Pooled standard deviation
CI for difference in two
means, independent samples
Two sample t-test,
independent samples
CI for difference in two
means, paired samples
Two sample t-test, paired
samples
How large should a sample
be?
Type I and type II
errors
Influencing type I and II
errors
Alone an increase in sample size allows to reduce β without
increasing α ≈ 0.05. The ”trick”: standard error decreases
with larger n ⇒ sampling distribution has less variance!
Power of a t-test
Outlook
References &
further readings
7.33
Compute β for a given alternative - example
Example
For Length, let us compute β for H0 : µ = µ0 = 175 the
fixed alternative HA : µ = µA = 180 (s = 10.3, m = 178,
n = 80, SE = 1.152, α = 0.05).
1
2
3
Two sample t-tests
and CI,
type I and II errors,
power of t-tests
Katharina
Henneb¨
ohl
Two sample
t-tests (and CI)
The critical value is
mc = 1.64 ∗ 1.152 + 175 = 176.8893.
Difference in two means,
independent samples
We standardize the critical value with regard to
µA = 180
Z = (mc − µA )/SE = (176.8893 − 180)/1.152 ≈ −2.70.
Two sample t-test,
independent samples
Thus,
Pr (m < 176.8893) = Pr (Z < −2.70) = 0.0035 = β
1 − β = 0.9965 denotes the power (of a test).
Pooled standard deviation
CI for difference in two
means, independent samples
CI for difference in two
means, paired samples
Two sample t-test, paired
samples
How large should a sample
be?
Type I and type II
errors
Influencing type I and II
errors
Power of a t-test
Outlook
References &
further readings
7.34
Compute β for a given alternative - illustration
Two sample t-tests
and CI,
type I and II errors,
power of t-tests
Katharina
Henneb¨
ohl
Two sample
t-tests (and CI)
Difference in two means,
independent samples
Pooled standard deviation
CI for difference in two
means, independent samples
Two sample t-test,
independent samples
CI for difference in two
means, paired samples
Two sample t-test, paired
samples
How large should a sample
be?
Type I and type II
errors
Influencing type I and II
errors
Usually a larger the difference between µA and µ0 induces a
larger power. But further aspects need to be considered...
Power of a t-test
Outlook
References &
further readings
7.35
How to compute the power function?
Given that H0 is not true, then what is true?
Probabilities cannot be computed without assumptions
about the population.
Given a fixed HA , we can compute power as in the
figure in the previous slide.
Two sample t-tests
and CI,
type I and II errors,
power of t-tests
Katharina
Henneb¨
ohl
Two sample
t-tests (and CI)
Difference in two means,
independent samples
Pooled standard deviation
For all possible HA ’s, we obtain the power function.
What determines the power?
The difference between the H0 and√HA means (delta)
The width of the curves (SE = σ/ n)
α
where is α? – one-sided or two-sided
what is n? how is SE computed? – type of test:
one-sample, two-sample, paired
CI for difference in two
means, independent samples
Two sample t-test,
independent samples
CI for difference in two
means, paired samples
Two sample t-test, paired
samples
How large should a sample
be?
Type I and type II
errors
Influencing type I and II
errors
Power of a t-test
Outlook
References &
further readings
7.36
Compute power function vs. delta, n = 20, s = 1
Two sample t-tests
and CI,
type I and II errors,
(0:20)/10, power of t-tests
1.0
> plot((0:20)/10, power.t.test(power = NULL, delta =
+
n = 20)$power, type = "l", xlab = "delta", ylab = "power")
Katharina
Henneb¨
ohl
Two sample
t-tests (and CI)
0.8
Difference in two means,
independent samples
Pooled standard deviation
0.6
Two sample t-test,
independent samples
0.4
CI for difference in two
means, paired samples
Two sample t-test, paired
samples
0.2
How large should a sample
be?
Type I and type II
errors
Influencing type I and II
errors
0.0
power
CI for difference in two
means, independent samples
Power of a t-test
0.0
0.5
1.0
delta
1.5
2.0
Outlook
References &
further readings
7.37
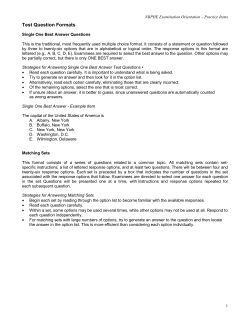
Compute power function vs. n; delta = 1
1.0
> plot(1:50, power.t.test(delta = 1, n = 1:50)$power, type =
+
xlab = "n (sample size)", ylab = "power")
Two sample t-tests
and CI,
type I and II errors,
"l",power of t-tests
Katharina
Henneb¨
ohl
Two sample
t-tests (and CI)
0.8
Difference in two means,
independent samples
Pooled standard deviation
0.6
Two sample t-test,
independent samples
CI for difference in two
means, paired samples
0.4
Two sample t-test, paired
samples
How large should a sample
be?
Type I and type II
errors
0.2
power
CI for difference in two
means, independent samples
Influencing type I and II
errors
Power of a t-test
0
10
20
30
n (sample size)
40
50
Outlook
References &
further readings
7.38
The power concept beyond n
In a testing framework, increasing n will make every small
difference in means significant, as small differences will be
noted (with large power). This does not mean that the
difference found is relevant.
Suppose we’re studying the effect of a medication type on
health, or a herbicide type on plant disease. Two large
samples (with and without treatment) confirmed (showed
significantly) that in the group without treatment there was
45% succes, less than in the group with treatment with 47%
success.
That’s OK, but should we now collectively apply the
treatment? Do the effects compensate for the costs and side
effects?
Two sample t-tests
and CI,
type I and II errors,
power of t-tests
Katharina
Henneb¨
ohl
Two sample
t-tests (and CI)
Difference in two means,
independent samples
Pooled standard deviation
CI for difference in two
means, independent samples
Two sample t-test,
independent samples
CI for difference in two
means, paired samples
Two sample t-test, paired
samples
How large should a sample
be?
Type I and type II
errors
Influencing type I and II
errors
Significance is something else as relevance.
Power of a t-test
Outlook
References &
further readings
7.39
Power computation using power.t.test
Two sample t-tests
and CI,
type I and II errors,
power of t-tests
Katharina
Henneb¨
ohl
Description: Compute power of test, or determine
parameters to obtain target power.
Details: Exactly one of the parameters n, delta, power, sd,
and sig.level must be passed as NULL, and that
parameter is determined from the others. Notice that the
last two have non-NULL defaults so NULL must be explicitly
passed if you want to compute them.
Two sample
t-tests (and CI)
Difference in two means,
independent samples
Pooled standard deviation
CI for difference in two
means, independent samples
Two sample t-test,
independent samples
CI for difference in two
means, paired samples
Two sample t-test, paired
samples
How large should a sample
be?
Type I and type II
errors
Influencing type I and II
errors
Power of a t-test
Outlook
References &
further readings
7.40
Compute sample size
Two sample t-tests
and CI,
type I and II errors,
power of t-tests
Katharina
Henneb¨
ohl
> power.t.test(n = NULL, delta = 1, sd = 1, sig.level = 0.05, power = 0.9,
+
type = "two.sample", alternative = "two.sided")
Two-sample t test power calculation
n
delta
sd
sig.level
power
alternative
=
=
=
=
=
=
22.02110
1
1
0.05
0.9
two.sided
NOTE: n is number in *each* group
Two sample
t-tests (and CI)
Difference in two means,
independent samples
Pooled standard deviation
CI for difference in two
means, independent samples
Two sample t-test,
independent samples
CI for difference in two
means, paired samples
Two sample t-test, paired
samples
How large should a sample
be?
Type I and type II
errors
Influencing type I and II
errors
Power of a t-test
Outlook
References &
further readings
7.41
Compute delta (HA )
Two sample t-tests
and CI,
type I and II errors,
power of t-tests
Katharina
Henneb¨
ohl
> power.t.test(n = 20, delta = NULL, sd = 1, sig.level = 0.05,
+
power = 0.9, type = "two.sample", alternative = "two.sided")
Two-sample t test power calculation
n
delta
sd
sig.level
power
alternative
=
=
=
=
=
=
20
1.051970
1
0.05
0.9
two.sided
NOTE: n is number in *each* group
Two sample
t-tests (and CI)
Difference in two means,
independent samples
Pooled standard deviation
CI for difference in two
means, independent samples
Two sample t-test,
independent samples
CI for difference in two
means, paired samples
Two sample t-test, paired
samples
How large should a sample
be?
Type I and type II
errors
Influencing type I and II
errors
Power of a t-test
Outlook
References &
further readings
7.42
Two sample t-tests
and CI,
type I and II errors,
power of t-tests
Compute power
Katharina
Henneb¨
ohl
> power.t.test(n = 20, delta = 1, sd = 1, sig.level = 0.05, power = NULL,
+
type = "two.sample", alternative = "two.sided")
Two-sample t test power calculation
n
delta
sd
sig.level
power
alternative
=
=
=
=
=
=
20
1
1
0.05
0.8689528
two.sided
NOTE: n is number in *each* group
Two sample
t-tests (and CI)
Difference in two means,
independent samples
Pooled standard deviation
CI for difference in two
means, independent samples
Two sample t-test,
independent samples
CI for difference in two
means, paired samples
Two sample t-test, paired
samples
How large should a sample
be?
Type I and type II
errors
Influencing type I and II
errors
Power of a t-test
Outlook
References &
further readings
7.43
Compute significance level
Two sample t-tests
and CI,
type I and II errors,
power of t-tests
Katharina
Henneb¨
ohl
> power.t.test(n = 20, delta = 1, sd = 1, sig.level = NULL, power = 0.9,
+
type = "two.sample", alternative = "two.sided")
Two-sample t test power calculation
Two sample
t-tests (and CI)
n
delta
sd
sig.level
power
alternative
=
=
=
=
=
=
20
1
1
0.07004584
0.9
two.sided
NOTE: n is number in *each* group
(Note that this is of little operational use; computing sd is of
even less operational use)
Difference in two means,
independent samples
Pooled standard deviation
CI for difference in two
means, independent samples
Two sample t-test,
independent samples
CI for difference in two
means, paired samples
Two sample t-test, paired
samples
How large should a sample
be?
Type I and type II
errors
Influencing type I and II
errors
Power of a t-test
Outlook
References &
further readings
7.44
Outlook chapter 8
Two sample t-tests
and CI,
type I and II errors,
power of t-tests
Katharina
Henneb¨
ohl
Two sample
t-tests (and CI)
1
F distribution
2
ANOVA - Analysis of Variance
Difference in two means,
independent samples
Pooled standard deviation
CI for difference in two
means, independent samples
Two sample t-test,
independent samples
CI for difference in two
means, paired samples
Two sample t-test, paired
samples
How large should a sample
be?
Type I and type II
errors
Influencing type I and II
errors
Power of a t-test
Outlook
References &
further readings
7.45
Two sample t-tests
and CI,
type I and II errors,
power of t-tests
Katharina
Henneb¨
ohl
Wonnacott & Wonnacott (1990): Introductory
Statistics, 5th edition, Wiley
Edzer Pebesma (2010): Introduction to Geostatistics,
http://ifgi.uni-muenster.de/~epebe_01/
Geostatistics10/
Two sample
t-tests (and CI)
Difference in two means,
independent samples
Pooled standard deviation
CI for difference in two
means, independent samples
Two sample t-test,
independent samples
CI for difference in two
means, paired samples
Two sample t-test, paired
samples
How large should a sample
be?
Type I and type II
errors
Influencing type I and II
errors
Power of a t-test
Outlook
References &
further readings
7.46


© Copyright 2026