
2-8 Sample: a function from which other related
Name
Name
2-8
LESSON
MASTER
Questions on SPUR Objectives
See pages 152–157 for objectives.
Representations Objective K
Breaking Strength (3 1,000 pounds)
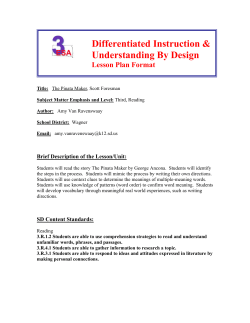
y ≈ 924x 2 7285
quadratic model:
y
See pages 225–229 for objectives.
1. Explain what is meant by a parent function.
Sample: a function from which other related
functions can be derived.
30
2. Describe the asymptotes and point of discontinuity of the graph of the function
1
f (x) 5 2
. Use an automatic grapher if needed. vertical
x 2 3x 2 4
20
5 10 15 20 25 30 35 40 x
Rope Diameter (mm)
b. Plot the residuals for each model in part a.
linear model:
asymptotes: x 5 4 and x 5 -1; horizontal
asymptote: y 5 0; points of discontinuity:
x 5 4 and x 5 -1
10
y ≈ 18.57x 2 1
88.1x 2 321.4
Representations Objective J
In 3–5, give an equation of a parent function whose Samples
graph has the given features.
given.
3. an asymptote but no points of discontinuity
quadratic model:
y
4000
y
4000
4. points of discontinuity but no asymptotes
2000
2000
5. two asymptotes
0
10
20
30
0
40 x
-2000
-2000
-4000
-4000
10
are
y 5 bx
20
30
y 5 x
y 5 1x or y 5
6. a. Give an equation for the parent function of
a parabola with equation y 5 3(x 2 2)2 1 2.
b. Graph y 5 3(x 2 2)2 1 2 and its parent function on
an appropriate viewing window of an automatic grapher.
Give the intervals of x- and y-values for your window.
40 x
-5 ≤ x ≤ 5
c. From the residual plots in part b, which do you believe is a
more appropriate model for this data? Justify your answer.
-2 ≤ y ≤ 15
1
x2
y 5 x2
Samples
are given.
c. In the screen at the right, sketch
what you see on your window.
d. Describe the relationship between
the two graphs.
Sample:The quadratic model, since the
residuals are much closer to zero and
since there appears to be a pattern in
the residuals for the linear model
The graph of
y 5 3(x 2 2)2 1 2 is
shifted 2 units right and
-5 # x # 5, x -scale = 1
2 units up from the
-2 # y # 15, y -scale = 1
graph of its parent
function, y 5 x 2.
29
Name
30
Name
LESSON
MASTER
3-2
LESSON
MASTER
Questions on SPUR Objectives
See pages 225–229 for objectives.
Properties Objective C
y 5 (x 2 5)3 2 92
I: (x, y ) →
(x 1 3, y 2 9)
I: (x, y ) →
(x 1 8, y 1 15)
Properties Objective D
See pages 225–229 for objectives.
zero at x 5 4; asymptotes x 5 3 and y 5 - 1
5. True or false. A translation does not change
the number of asymptotes of a graph.
True
Representations Objective K
6. a. Use the Graph-Translation Theorem to
write an equation for the graph at the
1
right. An equation for the y 5
2
1
(x 2 2)
parent function is y 5 2 .
x
1. A data set has a mean of 5 and a standard
deviation of 2. Suppose 1,000 is added
to each observation. What are the new
mean and standard deviation?
2. A data set has a median of 35 and a mode of
30. Suppose 15 is added to each observation.
What are the new mode and median?
b. What is the standard deviation of airtemperature readings in degrees Kelvin?
y=1
a. Give an equation for the parent function of t.
b. What transformation maps the
T: (x, y)
parent function onto t?
y5x
2.27°K
4. The box plot below displays the annual salaries of
employees at Transformation Technologies, Inc., a
small biotech company involved in cloning research.
x
x=2
7. Consider the function t given by t(x) 5 (x 2 5)3 2 2.
mean: 45
st. dev.: 50
Uses Objective I
y
11
82
81
mean: 1005
st. dev.: 2
3. A meteorologist takes a number of air-temperature readings
and finds that the mean temperature is -24.66°C with a
standard deviation of 2.27°C. He then decides to convert
all of his measurements from degrees Celsius to degrees
Kelvin. To do this, he uses the formula K 5 C 2 273.15,
where C is the temperature in degrees Celsius and K is
the temperature in degrees Kelvin.
a. What is the mean air-temperature reading in
-297.81°K
degrees Kelvin?
1
4. What are the zeros and the asymptotes of the graph of y 5
x
under the translation T(x, y) 5 (x 1 3, y 2 1)?
20 25 30 35 40 45 50 55 60 65 70
Salaries (3 $1,000)
3
Suppose, due to profit sharing, each employee receives
an end-of-year bonus of $5,000. Which, if any, of the
following descriptive statistics will change due to this
bonus? If they change, give their new values.
→ (x 1 5, y 1 2)
c. Use an automatic grapher to graph t
and its parent function on the same
window. Choose an appropriate
window for viewing key features of
both graphs. In the screen at the right,
sketch what you see on your window.
a. median annual income
b. interquartile range
c. range
d. Identify the x- and y-intercepts of t
and its parent function.
t : x ø 6.26; parent:
x 5 0, y 5 0
Questions on SPUR Objectives
Properties Objective E
1. Let T be the transformation T: (x, y) →
(x 1 5, y 2 6). Find an equation for
3
the image of y 5 x3 1 under T.
2
2. Give an equation for the transformation T
which moves each point 9 units down and
3 units to the right.
3. What transformation maps the graph of
y 5 zx z onto the graph of y 5 zx 2 8z 1 15?
b. Use your equation in part a
to find the value of the
graphed function at x 5 11.
3-3
d. outliers
$45,000
no change
no change
$30,000, $72,000
-2 #x # 8, x -scale = 1
-5 # y # 5, y -scale = 1
31
32
131
Functions, Statistics, and Trigonometry © Scott Foresman Addison Wesley
Functions, Statistics, and Trigonometry © Scott Foresman Addison Wesley
Questions on SPUR Objectives
Vocabulary
1. Use the scatterplot at the right
showing the relation between
diameter and breaking strength of
3-strand polypropylene rope.
a. Use a statistics utility to
determine the regression
equation for each model of the
data.
linear model:
Functions, Statistics, and Trigonometry © Scott Foresman Addison Wesley
3-1
Functions, Statistics, and Trigonometry © Scott Foresman Addison Wesley
LESSON
MASTER
Name
Name
LESSON
MASTER
3-4
LESSON
MASTER
Questions on SPUR Objectives
See pages 225–229 for objectives.
Properties Objective F
In 1–4, decide whether the function with the given equation
is even, odd, or neither. Justify your answer algebraically.
Odd; 8(- t )7 5 - 8t 7 5 - (8t 7)
1. s(t) 5 8t7
5
2
5 -7x 2 1 5x 2
5
2 Neither; 7(-x) 2 5(-x)
2. f(x) 5 7x 2 5x
2
Even;
h
)
1
5
5 -9h 2 1 5
9(
2
3. g(h) 5 9h 1 5
Neither; z7(-m) 1 2z 2 5 5
z -7m 1 2 z 2 5
4. v(m) 5 z 7m 1 2z 2 5
Representations Objective L
In 5 and 6, decide whether the function whose graph is
given is even, odd, or neither.
y
y
5.
6.
π
2. Find an equation for the image of y 5 Ïx2 1 1
5 3Ï9x 2 1 1
y
under the scale change S: (x, y) → 3 , 3y .
3. Describe two different transformations S1 and S2which
(x )
Samples
are given.
S2: (x, y) → x, 94 y
9
map the graph of y 5 x2 onto the graph of y 5 4 x2.
S1: (x, y) → (23 x, y)
(
)
c
(Ï )
(b) S(x, y) 5
(
(d) S(x, y) 5 x, 2 y
2 2
π x, π
)
2
(Ï )
π
(
(c) S(x, y) 5 x, π y
x
2
x,
π
y
)
Properties Objective D
5. The graph of an equation has x-intercepts
-1.5, 1, and 2, and y-intercept -3. Give
the x- and y-intercepts for the image of
the graph under the transformation
S: (x, y) → (2x, 3y).
odd
In 7 and 8, describe the symmetries of the graphed function.
y
7. (-7, 12) y
8.
(
-8 -6 -4 -2
2
4
6
have on the graph’s asymptotes?
-6
-8
(7, -12)
180° rotation
symmetry about
the origin
)
7. Suppose the scale change S: (x, y) → (4x, 3y) is applied to
x
the graph of y 5 x 2 2 9 . What effect does this transformation
8x
-4
(-2, -6) -8
1
of y = [x] under the scale change S: (x, y) → 2x, 3 y .
2
6 10 x
2
integral
multiples of 8
6. Describe the points of discontinuity on the image of the graph
8
4
12
8 (2, 6)
4
x-intercepts: -3, 2, 4;
y-intercept: -9
reflection symmetry
about x 5 1
Horizontal asymptote
y 5 0 is unchanged; vertical asymptotes
3
3
x 5 3 and x 5 -3 move to x 5 4 and x 5 - 4
Representations Objective K
8. Sketch graphs of y 5 Ïx and its
image under the transformation
1
S: (x, y) → 4 x, y .
(
)
Functions, Statistics, and Trigonometry © Scott Foresman Addison Wesley
Functions, Statistics, and Trigonometry © Scott Foresman Addison Wesley
S: (x, y) → (x6 , 8y)
so that the transformed graph includes the point (1, 1)?
2π x
odd
-12
1. Find the scale change S which shrinks a graph
1
horizontally with a factor of 6 and stretches it
vertically with a factor of 8.
π
-1
-10 -6 -2
See pages 225–229 for objectives.
Properties Objective C
(a) S(x, y) 5
-π
Questions on SPUR Objectives
4. Multiple choice. Which scale change will map y 5 2 x2
1
-2π
3-5
y
6
4
2
33
Name
4
6
8 10 12 x
Name
3-6
LESSON
MASTER
Questions on SPUR Objectives
See pages 225–229 for objectives.
Properties Objective E
In 1–4, suppose each element in a data set is
multiplied by -7. Describe the effect of this
transformation on each measure.
1. mean
2. mode
multiplied by -7
3. median
In 1 and 2, let f(x) 5 x2 1 2x 1 7 and g(x) 5 5x 2 3.
1. Evaluate each composite.
multiplied by 7
47
b. g( f(1))
2. Find a formula for each composite.
a. f(g(x))
y 5 25x 2 2 20x 1 10
b. g(g(x))
y 5 25x 2 18
3. Let F 5 {(1, 7), (2, 4), (3, 2), (4, 1)} and
G 5 {(7, 6), (1, 3), (2, 2), (4, 1)}. Find each composite.
a. F ° G
b. G ° F
a 5 2 and a 5 -2
{(1, 2), (2, 4), (4, 7)} {(1, 6), (2, 1), (3, 2), (4, 3)}
Uses Objective I
4. Consider the functions h mapping
A to B and j mapping B to C.
4. Neil Vestor is trying to decide whether he should purchase
stock in an American or a Japanese manufacturing company.
He recorded the price of each stock over a 3-week period
and computed the mean and standard deviation for each.
American Company
Japanese Company
$39.60
$ 2.50
¥6734
¥ 187
a
b
c
d
A
h
a
b
c
d
B
j
a
b
c
d
C
Evaluate each composition.
a. h( j(a))
To compare the two stocks, Neil rescales his raw data by
converting the stock prices in yen to dollars, using the exchange
rate $1 = ¥127. If Neil is trying to minimize his risk by choosing
the stock with the least variability, which stock should he buy?
Justify your answer.
b
b. j(h(b))
c
c. (h ° j)(d )
c
Properties Objective G
5. Let s(x) 5 Ïx 2 1 and n(x) 5 x2 2 2. Give the domain
of each composite.
a. n ° s
b. s ° x
Sample: the Japanese company, as its
standard deviation is 187
127 5 $1.47 so it
set of all reals > 1
set of all reals > Ï3
1
6. Let p(t) 5 t 2 1. True or false. The domain of p is
the same as the domain of p ° p. Justify your answer.
is less variable than that of the American
company.
False;The domain of p is the set of all real
numbers except 0; the domain of p ° p is the
set of all real numbers except 0 and 1.
35
132
15
a. f(g(1))
multiplied by -7
5. A data set is rescaled so that its variance is multiplied
by 4. What are two possible values for the scale factor?
Mean stock value
Standard deviation
Questions on SPUR Objectives
See pages 225–229 for objectives.
Skills Objective A
4. range
multiplied by -7
3-7
36
Functions, Statistics, and Trigonometry © Scott Foresman Addison Wesley
LESSON
MASTER
Functions, Statistics, and Trigonometry © Scott Foresman Addison Wesley
2
34
Name
Name
3-8
LESSON
MASTER
Questions on SPUR Objectives
See pages 225–229 for objectives.
Skills Objective B
In 1–3, a function is described.
a. Give an equation for the inverse
of the function.
b. State whether the inverse is a function.
y 5 - 12 x 1 32
1. y 5 3 2 2x a.
The mean is subtracted from the raw score; the
difference is divided by the standard deviation.
a function
b.
not a function
b.
a function
2. A data set has a mean of 25.6 and a standard deviation
of 2.3. Find each for the data set’s z-scores.
a. the mean
0
1
b. the standard deviation
In 3 and 4, a z-score is given. Explain what it means in terms
of the mean and standard deviation of the original data set.
3 of a standard deviation above the mean
Properties Objective G
3. z 5 0.75 4
5 of a standard deviation below the mean
4. Let f(x) 5 x and g(x) 5 x. Are functions f and g
inverses? Justify your answer.
4. z 5 - 1.25 4
f (g (x)) 5 x; if x 5 2.5, f (g (2.5)) 5 3; so
f (g (x)) Þ x and f and g are not inverses.
5. True or false. If a function is an even
function, then its inverse is not a function.
Uses Objective I
5. The following sets of data show the average number of points
scored per game by players on the boys’ and girls’ basketball teams.
True
Boys
6. Suppose f is a function such that for all x, f(x) 5 f(x 1 2).
Is the inverse of f a function? Justify your answer.
Girls
No; if x 5 0, then f (0) 5 f (2) and the line
y 5 f (0) intersects two points on the graph:
(0, f (0)) and (2, f (2)).
Representations Objectives L and M
In 7–9, determine whether the inverse of the graphed
function is a function. If the inverse is a function,
sketch its graph on the same set of axes.
y
y
7.
8.
9.
4
0.3
11.6
0.3
3.6
6.2
1.3
7.6
4.0
20.5
0.8
2.5
3.6
7.0
2.6
9.8
6.3
5.7
0.8
6.5
12.4
7.2
5.3
7.9
9.1
7.6
6.9
1.1
8.5
a. Convert the above data for the 15 boys and 15 girls to z-scores.
(When calculating z-scores, use the population standard deviation,
not the sample standard deviation.)
Boys
Girls
-0.1
-0.32
0.03
2.05
-0.86
0.55
-1.61
0.11
1.33
-0.14
1.08
-0.60
-0.86
3.06
-0.23
0.37
-0.22
-0.77
-0.45
0.82
0.28
-0.44
-2.28
0.26
-0.67 -0.71
-0.22
-0.15 0.59
0
b. Who did better relative to the rest of the team, the boy who
averaged 6.2 points per game or the girl who averaged
7.9 points per game? Justify your answer in terms of z-scores.
y
4
4.7
3.1
4
the girl; her z-score was 0.37 and boy’s was 0.28
3 x
-3
3 x
-3
-4
3 x
-3
-4
a function
6. A student took two tests. On the first, she scored 87 and on the
second she scored 80. If the class mean was 80 and the standard
deviation was 10 on the first test and the class mean was 72 with
a standard deviation of 5 on the second, on which test did she do
better compared to the other students?
-4
not a
function
a function
second test (1st z-score: 0.7; 2nd z-score: 1.6)
37
Name
Name
LESSON
MASTER
4-1
LESSON
MASTER
Questions on SPUR Objectives
See pages 303–307 for objectives.
Skills Objective A
In 1 and 2, the measure of a rotation is given.
a. Convert the measure to revolutions.
b. On the
circle draw a central angle showing the given rotation.
5π
1. 225°
2. - 2 radians
5
, counterclockwise
a. 8
a.
b.
b.
2. Find the area of a sector of a circle of
diameter 22 in. if the central angle of
the sector is 315°.
1
14
, clockwise
4. Give two other radian measures,
one positive and one negative,
4π
for a rotation of 3 .
≈ 20.94, m
≈ 332.62 in2
π , 30°
6
5. James needs to replace the glass of the
speedometer on his old car. If the needle can
maximally rotate 5π
12 , find the area of the
glass that James needs.
10π, or ≈ 31.4, cm2
10π - 2π
3 , 3
3π
4
6. 135°
-7π
6
7. -210°
π
9. - 10
-18°
10. 3.14159
b. to radians
12. 19π
b. to degrees
≈ 0.12, clockwise
a. to revolutions
95, counterclockwise
a. to revolutions
≈ 3.02, counterclockwise
14. 0.33 revolution clockwise
a. to radians
≈ 2.073 radians
0
10
20 30
≈ 180°
40 50 60 70
80
≈ 359 mi
7. Kaitlin watched her son Dizzy ride a horse 22 ft from the
center of a merry-go-round. Dizzy completed one revolution
in 45 seconds.
a. How far did Dizzy travel in one
≈
revolution?
≈ -0.733
b. How far did Dizzy travel in one
minute?
3420°
1088.620°
138 ft
≈ 184 ft
c. Kaitlin noted that her son started at the
easternmost position. If the merry-go-round
rotates counterclockwise and the ride lasts
4 minutes, sketch the position of her son
when the ride ended.
b. to degrees
N
W
E
b. to degrees
S
-118.8°
39
90
4 cm 8 cm
6. Austin, TX, and Oklahoma City, OK, have
approximately the same longitude, 97°30’ W.
Austin has latitude 30°16’ N. Oklahoma City
has latitude 35°28’ N. Use 3,960 miles for the
radius of the earth to estimate the air distance
from Austin to Oklahoma city.
In 11–14, use a calculator to convert the given angle
measure to the indicated units. Give your answer
correct to the nearest thousandth.
11. -42° a. to revolutions
4Ï3 m
Uses Objective G
In 8–10, convert to a degree measure without using a calculator.
13. 19
847π , or
8
4. A sector in a circle with central angle 12 .
has an area of 14π m2. Find the exact
length of the radius of the circle.
In 5–7, convert to a radian measure without using a calculator.
330°
20π , or
3
3. The arc of a circle of radius 4 cm has a
2π
length of 3 cm. Find the measure of
the central angle in radians and degrees.
498°, -222°
11π
See pages 303–307 for objectives.
7π
3. Give two other degree measures,
one positive and one negative, for
a rotation of 138°.
8. 6
Questions on SPUR Objectives
1. Find the length of an arc of a circle of radius
5π
8 m if the central angle of the arc is 6 .
90°
π
3
4-2
Skills Objective B
135°
5. 60°
38
40
133
Functions, Statistics, and Trigonometry © Scott Foresman Addison Wesley
Functions, Statistics, and Trigonometry © Scott Foresman Addison Wesley
See pages 225–229 for objectives.
1. Explain how a z-score is calculated.
(-2.5, 0), (3, 1), (1,3)}
Functions, Statistics, and Trigonometry © Scott Foresman Addison Wesley
Questions on SPUR Objectives
Properties Objective H
b.
Ïx
y56x
1
a.
x2
3. f 5 {(- 2.5, 0), (0, - 2.5), (1, 3), (3, 1)}
-1
5 {(0, -2.5),
a. f
2. g(x) 5
3-9
Functions, Statistics, and Trigonometry © Scott Foresman Addison Wesley
LESSON
MASTER


© Copyright 2026