
Brian L. Bingham Department of Environmental Sciences Huxley College of the Environment
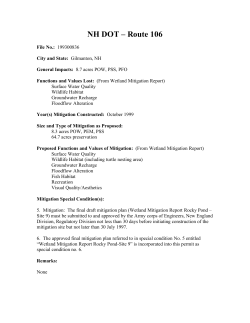
The Log Pond Restoration Project: Structure and Function of the Benthic
Community – Year 2 report
Brian L. Bingham
Department of Environmental Sciences
Huxley College of the Environment
Western Washington University
Brita Clothier
Department of Environmental Sciences
Huxley College of the Environment
Western Washington University
Robin Matthews
Institute for Watershed Studies
Huxley College of the Environment
Western Washington University
1
Introduction
As part of the comprehensive plan to clean up sediments and restore habitat in
Bellingham Bay, the Georgia Pacific Log Pond was capped with clean sediment. The
initial capping, which occurred in 2000, involved covering existing sediments with a
thick layer of clean sediment followed by a thinner layer of native silt material. It was
expected that the native silt would already contain local infaunal invertebrates and would
provide good settlement habitat for larvae from other regional invertebrate species.
The Log Pond restoration plan requires assessment of the new habitat performance.
While capping the sediments in the pond should improve sediment quality, it is important
to demonstrate that a healthy, productive benthic community is developing in the restored
site. This is important both for the inherent value of the benthic invertebrate community
itself and for the role it plays in the broader Bellingham Bay and regional ecosystems
(e.g., as food for juvenile salmonids).
Sampling done 5-6 months after installation of the cap revealed a developing
invertebrate community in the Log Pond (Bingham et al., 2001). The Log Pond and the
Chuckanut reference sites held similar numbers of species, had similar levels of diversity
and evenness, and had similar levels of invertebrate biomass. While diversity/evenness
indices and biomass measurements indicated that the communities at the two sites were
similar, other analyses showed that the populations were not the same. In particular,
cluster analyses clearly separated the two sites, indicating that the Chuckanut sites were
much more similar to each other than they were to the Log Pond sites. The effect
resulted from differences in the species that occurred in the two locations. For example,
the Chuckanut sites were dominated by crustaceans while the Log Pond held a much
higher proportion of polychaete annelids.
Given the patchiness of invertebrate recruitment in space and time, the differences
we saw in these communities in our sampling may have simply resulted from the failure
of settling larvae to reach the Log Pond within the first 5 months after capping. If this is
the case, we might expect to see more convergence in the two sites after an additional
year of recruitment has occurred. The goals of the present study were 1) to determine
how the invertebrate community had changed over the 12 months since the first sampling
and 2) to determine how closely the Log Pond community resembles the undisturbed
community in the Chuckanut reference site a full 18 months after capping was done.
Materials and Methods
To ensure that data collected in Year 2 were comparable to those collected in the
Year 1 sampling, we used the same collection methods (full details in Bingham et al.,
2001).
Quantitative sampling of the epibenthos
The epibenthic community was sampled with an epibenthic suction pump as
described by Simenstad et al. (1991). Three replicate 0.033 m2 samples were taken at
each of 3 fixed stations (SS74, SS75 and SS76) within the log pond (Fig. 1). These are
2
the same locations that were sampled in the Year 1 work. We washed the samples
through a 0.253-mm mesh sieve, preserved them in 10% buffered formalin and later
transferred them to 70% ethanol.
For comparison with the Log Pond, samples were also taken at a reference site in the
inner part of Chuckanut Bay (Fig. 1). Triplicate samples at stations CH1 and CH2 (the
same stations sampled in the Year 1 study) were taken as described above. The Log Pond
and Chuckanut sites were sampled on May 14 and again on June 24, 2002.
In the laboratory, all invertebrates were picked from the samples, sorted and
identified to the lowest taxonomic level. To determine biomass composition of each
sample, we separated the invertebrates into broad taxonomic groups (i.e., nematodes,
annelids, mollusks, crustaceans and echinoderms). These grouped samples were dried in
a 60° C oven for 24 hours then weighed.
For each sample, we calculated the total number of invertebrate species, the
Shannon-Weiner diversity index (H’, using log base e) and Pielou’s evenness index (J’).
To look for differences between the two study sites and between the two sampling dates,
we used a 3-way partially nested analysis of variance. Time and Site were fixed main
effects. Station (e.g., SS74, CH1) was a random factor nested within site. We used the
same model to test for differences in total invertebrate biomass. Where the ANOVA
assumption of equal variances was violated, we attempted to correct the violation by
transforming the data. If that was unsuccessful, we continued with the analysis, realizing
that our analyses would suffer from an increased possibility of Type I error (i.e., finding
significant differences that were not really there).
Quantitative sampling of benthic invertebrates
As in Year 1 (and the baseline sampling), we used a 0.023 m2 petite ponar grab
sampler (PSEP 1997a) to collect benthic invertebrates. On each sampling date, three
replicate samples were taken at each station in the log pond (SC-74, SC-75, SC-76) and
at the Chuckanut Bay reference stations (CH1, CH2). All ponar samples were collected
on June 24, 2002.
The collected samples were washed through a 0.5-mm brass sieve and fixed with
10% buffered formalin. They were later transferred to 70% ethanol, sorted and identified
to the lowest possible taxonomic group. After we had sorted and counted all the
invertebrates, we grouped them into taxonomic groups, oven dried them at 60° C for 24
hours then weighed them to get a dry biomass measurement. A large proportion of the
biomass in some samples was due to a single polychaete (Owenia fusiformis). This
species lives in tubes it constructs of sand and mucous. Unfortunately, it was not possible
to remove the worms from their tubes making it difficult to get an accurate measure of
the actual biomass. To give us maximum flexibility for data analysis and presentation,
we weighed the O. fusiformis separately from other polychaetes. To compare total
invertebrate biomass in the Log Pond and Chuckanut sites, we summed total biomass
(including O. fusiformis) at each station, log transformed the data (to homogenize the
variances) and tested for site and station differences with a 2-way nested ANOVA (with
station nested in site).
3
Community analyses
We ran cluster analyses to get a better idea of similarities between the invertebrate
communities in the Log Pond and in Chuckanut Bay. These analyses go beyond simple
counts of species, diversity indices and evenness indices as they consider the species
composition of the samples (which may indicate interactions among species or common
responses to environmental characteristics).
We used hierarchical cluster analysis (Ward’s method with a Euclidean distance
measure) and k-means cluster analysis to reveal patterns in the data. We ran separate
analyses for epibenthic data (all stations in both May and June) and for the ponar data (all
stations on the single June sampling date).
Characterization of the sediments
Because sediment composition can have a strong impact on benthic community
structure and composition, we felt it was important to characterize the sediments. To do
this, we took a single ponar bottom grab from each station on June 24, 2002. The
sediments were held in a -80° C freezer until they could be processed. At that time, the
samples were washed through a series of sieves that separated the sediment into size
fractions. The fractions were oven dried at 60° C for 48 hours and weighed. We used the
weights to determine the grain-size composition for each sample. A subsample of the
unsorted sediment was also oven dried for 96 hours at 60° C, weighed, and burned at
500° C in a muffle furnace to remove all organic material. The drop in weight was used
to calculate a percent organic content.
To determine whether sediment composition was different between the Log Pond
site and the reference site, we calculated the average percent composition for each
sediment fraction at each site. We then compared the sediment size distributions for the
two sites with a Kolmogorov-Smirnov test. Organic fraction was compared with a oneway analysis of variance with site (Log Pond vs. Chuckanut) as the main effect.
Results
Biomass measurements
Statistical analysis of epibenthic invertebrate biomass failed to show any
significant differences between the Log Pond and Chuckanut reference communities
(Table I). While none of the effects were significant, the power of this analysis was quite
low, reflecting the low replication and imbalance in the design (i.e., 9 samples in the Log
Pond and only 6 in the Chuckanut reference site). An examination of the data suggests
that there may, in fact, be differences among the stations in the Log Pond (Fig. 2). The
SS75 station (Fig. 1), in particular, stands out in both the May and June samples. This
station is deeper than the other two Log Pond sites and appears, in the Year 2 sampling,
to be distinctly different.
The biomass of benthic invertebrates in the ponar samples showed strong
differences among stations (though there were no statistically significant site effects,
Table II). Once again, the SS75 station stood out dramatically (Fig. 2). The dramatic
4
difference in this site was partially due to the polychaete Owenia fusiformis, which was
extremely abundant here. The organic dry weight of these samples was overestimated due
to the inclusion of their sand tubes in the measurements. However, it is clear from Figure
2 that differences existed even when O. fusiformis weights were not included. The
invertebrate community at Station SS75 was clearly different from any other station we
sampled.
Figure 3 shows how different taxonomic groups contributed to the dry weight
biomass of the Log Pond and Chuckanut samples. Several patterns are clear. The first is
the shift in epibenthic community composition of samples taken only a month apart,
particularly in the Log Pond site. In the May samples, the community (on a weight basis)
was composed primarily of annelids. By June, the composition had shifted toward a
community with a greater representation of nematodes and crustaceans. These changes
were not as clear in the Chuckanut site where the May and June samples were quite
similar.
Ponar samples showed differences in the benthic communities at the Log Pond
and Chuckanut sites. The Log Pond appeared to hold a greater proportion of annelids
while the Chuckanut sites had more molluscs.
Community indices
Epibenthic community
To further evaluate community composition, we examined total numbers of
species, diversity and evenness in the epibenthic samples. Statistical analysis showed
significant seasonal differences in the number of species with more species in June than
in May (Table III, Fig. 4). There was also a significant Time*Site interaction (indicating
that the change in number of species was greater at the Chuckanut site than it was in the
Log Pond) and a significant Station effect (indicating differences between stations within
each site). There was no clear site difference, suggesting that total number of species is
similar in the Log Pond and Chuckanut sites. We could detect no significant temporal or
spatial differences in diversity or evenness indices (Tables IV - V, Fig. 4). However,
power for these analyses was again quite low.
Benthic community
In contrast to the epibenthic samples, ponar samples showed strong patterns in
number of species, diversity and evenness. Number of species differed among stations
within sites (Table VI, Fig. 5) but there were no differences between the Chuckanut and
Log Pond sites. There were, however, site differences in diversity and evenness; both
were slightly higher in the Chuckanut site than in the Log Pond (Tables VII - VIII, Fig.
5).
Cluster analyses
Cluster analysis of epibenthic samples showed a strong effect of date on
community composition. The analysis produced 4 data clusters (Fig. 6). Cluster 1 was a
5
peculiar outlier group consisting of one June stations in the Log Pond (SS76). Because
this sample stood out so strongly from all other clusters, we removed it and reran the
analysis. Removing the sample had no effect on the clustering of the remaining stations
so we returned to the original analysis.
Cluster 2 was composed almost entirely of May samples. Clusters 3 and 4
consisted almost exclusively of June samples. The separation of these clusters was
largely due to changes in abundance of foraminiferans, nematodes and several
crustaceans (Cumella vulgaris, Tisbe sp., and Harpacticus sp.). The strong difference in
Cluster 1 appears related to an unusually high number of nematodes and harpacticoid
copepods there. It is not clear why this particular station on this date was so different. It
is likely that, in our sampling, we simply landed on an unusual habitat patch.
There was no separation of the Log Pond and Chuckanut sites in the cluster
analysis, indicating that the epibenthic communities in these sites were similar. This was
verified by a chi-square association test in a k-means cluster analysis, which showed no
Site contribution to separation of the clusters (X28df = 11.6, p = 0.17).
In contrast to the epibenthic samples, ponar samples showed very strong
clustering of sites. The most striking pattern was the clear separation of station SS75 in
the Log Pond (Cluster 1, Fig. 6). Clusters 2 and 4 were composed entirely of Chuckanut
sites. Cluster 3 contained the remaining Log Pond stations and two samples from
Chuckanut station CH2 (Fig. 6). K-means cluster analysis verified the strong
contribution of site to the clustering (X24df = 15.0, p = 0.004).
Five species appeared to contribute most strongly to the separation of the ponar
clusters. The polychaetes Nephtys longosetosa, Owenia fusiformis, and Spirorbis sp.
were particularly important in separating out SS75 (all were much more abundant at
SS75 than at any other station). Separation of the remaining clusters was strongly
influenced by differing abundances of the crustacean Cumella vulgaris and the gastropod
Alvania carpenteri (C. vulgaris was particularly abundant in the Chuckanut sites while A.
carpenteri was abundant at SS75, SS76, and CH1).
Sediment characteristics
Sediments from both study sites were composed largely of sands in the 0.064 0.495 mm size fractions (Fig. 7). Kolmogorov-Smirnov analysis showed that the Log
Pond sediments were coarser (i.e., had larger average grain sizes) than the Chuckanut
sediments (D = 0.37, p > 0.01).
The organic content of sediments from all sites was less than 3% (Fig. 7). Oneway ANOVA failed to detect significant differences between the study sites (F0.05, 1,3 =
0.47, p = 0.54). However, power was very low (power = 0.08).
Discussion
Results of Year 2 sampling suggest that a diverse invertebrate community has
established itself in the Log Pond site approximately 18 months after it was capped with
clean sediment. We could detect no differences in epibenthic or benthic invertebrate
biomass between the Log Pond and the Chuckanut Bay reference site. In addition, many
of the same species occurred in both habitats (though there were slight differences in their
biomass contribution to the invertebrate communities).
6
While these are good indications that a healthy community is being established in
the Log Pond, there are still distinct differences between it and the Chuckanut site. For
example, benthic invertebrate diversity and evenness were higher in the Chuckanut site
than in the Log Pond. Furthermore, the actual structure of the community appeared to
differ in these two sites. In particular, the Chuckanut site seemed to have a better
representation of mollusks, while the Log Pond had a higher relative proportion of
annelids.
An overriding feature that emerged several times in our analyses was the
significant small-scale variability of the invertebrate community at both the Chuckanut
and Log Pond locations; we frequently found significant “Station” differences in species
abundances, biomass, and community indices. This suggests that the invertebrate
communities are patchy in both of these environments. This could reflect small scale
differences in sediment composition or in other features of the habitat. The variability
could also represent biological features of the habitat. For example, there are many
patches of eelgrass (primarily Zostera marina) in the Chuckanut site and smaller patches
have recently appeared in the Log Pond (P. Schlenger, pers. comm.). If invertebrate
communities are responding to such a mosaic of patches, it could well account for the
variability we saw in our sampling.
While small-scale patchiness appears important in both sites, it was evident that
the variability is greatest in the Log Pond. To determine whether the Log Pond
community is converging on the “natural” state represented by the Chuckanut reference
site, we performed cluster analyses. The clustering was based only on the species present
and their relative abundances (without reference to sites). After the clustering was
complete, we overlaid the sample station identifier and looked for patterns. If the habitats
are converging, any clusters that formed should have included a random assortment of
stations from both Chuckanut and the Log Pond. While this was clearly the case for most
of the epibenthic samples (temporal effects were them most important factor controlling
the formation of clusters), it was not true for the SS76 station, indicating habitat
patchiness. The effect was even more dramatic in the ponar sampling. All clusters had a
strong “site” component to them. The most striking effect was the distance of the SS75
samples from everything else in the analysis.
In addition to spatial variability, the Log Pond samples also showed greater
temporal variability than the Chuckanut site. Both the invertebrate biomass and
community composition seemed to change more between the May and June samples in
the Log Pond than they did in the Chuckanut site. This spatial and temporal variability is
not surprising given the relatively short time since the Log Pond habitat was created. It is
probable that the Log Pond community will continue to change for some time as
sediments stabilize, as species not currently represented in the site recruit from the
plankton, and as species interactions are influenced by the return of predators (e.g., fish).
Comparison of Year 1 and Year 2 data provides additional information about the
changing structure of the invertebrate community in the Log Pond and in the Chuckanut
site. Overall examination of the data again suggests considerable temporal variability.
The most striking feature was the difference in diversity between the Year 1 and Year 2
data, which occurred in both the Log Pond and Chuckanut sites (Fig 4). It is not clear
what factors may have contributed to this difference.
7
Figure 2 suggests a clearer pattern in the overall invertebrate biomass. Dry weight
biomass in both the Log Pond and Chuckanut sites was higher in the second year than in
the first. The major difference in the two years appears to be the change in Log Pond
Station SS75. We suggest that the enormous change there was due to either 1) the
establishment of a new O. fusiformis population in the SS75 site or 2) a patchy
distribution of O. fusiformis in the Log Pond with the sampler missing the patches in the
first year but sampling a dense patch in the 2nd year.
Percent biomass measurements also show substantial differences from Year 1 to
Year 2. Of particular interest is the great increase in mollusc biomass in the Log Pond
benthic samples; molluscs were nearly absent in the Year 1 sampling at that site.
Comparison of the Year 1 and Year 2 cluster analyses suggest that the Log Pond
community has changed. In Year 1, much of the clustering of the benthic samples was
driven by Owenia fusiformis and by the bivalve Macoma nasuta (both were much more
abundant in the Chuckanut samples than in the Log Pond sites). That has clearly changed
since 1) M. nasuta did not contribute to the clustering (indicating that its abundance has
gone up in the Log Pond) and 2) O. fusiformis again contributes to the clustering, but it is
in the other direction with much higher abundances in the Log Pond. This suggests that
these species have established strong populations in the Log Pond. The Log Pond still has
fewer bivalves in general, but the populations appear to be growing.
While there are clear differences between the invertebrate communities in the Log
Pond and at the Chuckanut reference site, there is reason to believe that a healthy,
functioning community has been established in the sediment cap. Both sites show
considerable spatial and temporal variability in their invertebrate fauna. This is a natural
characteristic of healthy invertebrate assemblages. The community fluctuations appear to
be greater in the Log Pond than in the reference site. This would be expected in a habitat
that has been recently disturbed. Over time, we would expect the fluctuations to become
less pronounced as the community stabilizes with the addition of a full complement of
invertebrate, and vertebrate, species.
Literature cited
Anchor Environmental, L.L.C. & Hart Crowser, Inc, 2000. Remedial
Investigation/Feasibility Study, Whatcom Waterway Site, Bellingham, Washington,
prepared for Georgia-Pacific West, Inc. July 25, 2000.
Bingham, B.L., B. Clothier and R. Matthews. 2001. The Log Pond Restoration Project:
structure and function of the benthic community. Prepared for Georgia-Pacific West,
Inc.
PSEP 1997a. Recommended guidelines for sampling marine sediment, water column, and
tissue in Puget Sound. Final Report. Prepared for U.S. Environmental Protection
Agency, Seattle, Washington, and the Puget Sound Water Quality Action Team,
Olympia, Washington.
8
Simenstad, C.S., C.D. Tanner, R.M. Thom and L.L. Conquest. 1991. Estuarine Habitat
Assessment Protocol. Report prepared for U.S. Environmental Projection “Agency
by Fisheries Research Institute and Center for Quantitative Science, University of
Washington, Seattle, WA. EPA 910/9-91-037.
9
Table I. Analysis of variance for total dry biomass of epibenthic invertebrates. Time had
2 levels (May and June). Site also had two levels (Log Pond and Chuckanut). The
assumption of equal variances was violated for this data set. This did not, however, affect
our conclusions since no significant effects were found.
Source
Time
Site
Time*Site
Station
Time*Station
Error
Total
SS
df
MS
F
p
Power
1.84E-03
6.39E-03
8.00E-04
2.13E-02
2.86E-03
2.56E-02
5.88E-02
1
1
1
3
3
20
29
1.84E-03
6.39E-03
8.00E-04
7.12E-03
9.54E-04
1.28E-03
1.93
0.89
0.83
7.46
0.74
0.25
0.41
0.42
0.06
0.53
0.16
0.10
0.10
0.53
0.18
Table II. Analysis of variance table for dry biomass measurements of invertebrates
collected with a ponar grab. Biomass data were log transformed to meet the assumption
of equal variances.
Source
SS
df
MS
F
P
Power
Site
Station
Error
Total
1.16
9.15
0.77
11.08
1
3
10
14
1.16
3.05
0.07
0.38
39.57
0.58
< 0.01
0.07
Table III. Analysis of variance table for number of invertebrate species collected in
epibenthic samples. The assumption of equal variances was met for these data.
Source
Time
Site
Time*Site
Station
Time*Station
Error
Total
SS
df
MS
F
p
911.3
174.0
233.4
553.7
7.5
410.6
2290.5
1
1
1
3
3
20
29
911.3
174.0
233.4
184.5
2.5
20.5
363.2
0.9
93.0
73.5
0.1
< 0.01
0.40
< 0.01
<0.01
0.94
10
Power
0.10
0.06
Table IV. Analysis of variance table for Shannon-Wiener (H’) diversity indices
calculated for epibenthic samples. The equal variance assumption was met for these data.
Source
SS
df
MS
F
p
Time
Site
Time*Site
Station
Time*Station
Error
Total
0.18
2.61
0.54
2.63
0.36
2.90
9.22
1
1
1
3
3
20
29
0.18
2.61
0.54
0.87
0.12
0.14
1.48
2.97
4.49
7.19
0.84
0.30
0.18
0.12
0.07
0.48
Power
0.14
0.23
0.31
0.52
0.19
Table V. Analysis of variance table for the Pielou’s (J’) evenness indices from epibenthic
samples. Unequal variance problems could not be corrected by transformation. Since no
results were significant, however, the consequences of this ANOVA violation are minor.
Source
Time
Site
Time*Site
Station
Time*Station
Error
Total
SS
0.089
0.118
0.018
0.313
0.095
0.336
0.969
df
1
1
1
3
3
20
29
MS
F
p
0.089
0.118
0.018
0.104
0.003
0.016
2.80
1.12
0.58
3.28
1.89
0.19
0.36
0.50
0.17
0.16
Power
0.22
0.11
0.08
0.28
0.41
Table VI. Analysis of variance table for the number of species collected in ponar grabs.
Variances were homogeneous.
Source
SS
df
MS
Site
Station
Error
Total
1.11
622.22
50.66
673.99
1
3
10
14
1.11
207.40
5.06
11
F
P
Power
0.01
40.93
0.94
< 0.01
0.05
Table VII. Analysis of variance table for the Shannon-Wiener (H’) diversity indices
calculated from ponar samples. Variances were homogeneous.
Source
SS
df
MS
F
Site
Station
Error
Total
0.83
0.27
1.68
2.78
1
3
10
14
0.83
0.09
0.16
9.09
0.54
P
Power
0.05
0.66
0.12
Table VIII. Analysis of variance table for the Pielou’s (J’) evenness index. Indices were
calculated for each ponar sample. The assumption of equal variances was met.
Source
SS
df
MS
F
Site
Station
Error
Total
0.11
0.03
0.24
0.38
1
3
10
14
0.11
0.01
0.02
10.01
0.44
12
P
0.05
0.72
Power
0.72
Figure 1. Study sites in the Log Pond and at the Chuckanut reference site. Scale bars on
all figures represent 100 m.
13
Epibenthic samples
Dry weight (g • 0.1 m-2)
0.6
Year 1
Year 2
May
June
0.4
0.2
0.0
SS74 SS75 SS76
Log Pond
CH1 CH2
SS74 SS75 SS76
Chuckanut
Log Pond
CH1 CH2
Chuckanut
Ponar samples
Dry weight (g • 0.1 m-2)
10
Year 1
Year 2
8
*
6
4
2
0
SS74 SS75 SS76
Log Pond
CH1 CH2
SS74 SS75 SS76
Chuckanut
Log Pond
CH1 CH2
Chuckanut
Figure 2. Total dry weights of all invertebrates picked from epibenthic and ponar
samples. Standard errors are shown. Because weights of the polychaete Owenia
fusiformis and its sand tubes were not included in the Year 1 ponar data, we also did not
included them in the figure for the Year 2 data. The inclusion of those data would have
had a major effect only on the height of the SS75 bar for Year 2 (indicated with an
asterisk). The biomass volume of samples from that site (with O. fusiformis included)
would have averaged 26.3 g • m-2.
14
Epibenthic samples
Chuckanut
Log Pond
Annelids
May
Nematodes
Crustaceans
Echinoderms
Molluscs
June
Ponar samples
Chuckanut
Log Pond
June
Figure 3. Dry weight composition of invertebrate samples from the Log Pond and
Chuckanut study sites.
15
Year 2
Number of Species
Year 1
Diversity index (H')
30
20
20
10
10
0
SS74 SS75 SS76
0
CH1 CH2
10
10
8
8
6
6
4
4
2
2
0
Pielou's Evenness (J')
May
June
30
SS74 SS75 SS76
0
CH1 CH2
1.0
1.0
0.8
0.8
0.6
0.6
0.4
0.4
0.2
0.2
0.0
0.0
SS74 SS75 SS76
CH1 CH2
SS74 SS75 SS76
CH1 CH2
SS74 SS75 SS76
CH1 CH2
SS74 SS75 SS76
CH1 CH2
Log Pond
Chuckanut
Log Pond
Chuckanut
Figure 4. Community composition in epibenthic samples from the Log Pond and
Chuckanut sites. Total number of species, the Shannon-Weiner diversity index (H’) and
Pielou’s evenness index (J’) are plotted. Standard errors are shown.
16
Year 1
Pielou's Evenness (J')
Diversity index (H')
Number of Species
30
30
20
20
10
10
0
0
SS74 SS75 SS76
CH1 CH2
10
10
8
8
6
6
4
4
2
2
0
0
SS74 SS75 SS76
CH1 CH2
1.0
1.0
0.8
0.8
0.6
0.6
0.4
0.4
0.2
0.2
0.0
SS74 SS75 SS76
CH1 CH2
Log Pond
Chuckanut
0.0
Year 2
SS74 SS75 SS76
CH1 CH2
SS74 SS75 SS76
CH1 CH2
SS74 SS75 SS76
CH1 CH2
Log Pond
Chuckanut
Figure 5. Community indices for ponar samples from the Log Pond and Chuckanut sites.
Total number of species, the Shannon-Weiner diversity index (H’) and Pielou’s evenness
index (J’) are plotted. Standard errors are shown.
17
Figure 6. Cluster analysis for invertebrate samples with an epibenthic pump and with a
ponar grab in the Georgia Pacific Log Pond and at a Chuckanut Bay reference site.
Ward’s cluster method with a Euclidean distance measurement was used for the analysis.
Red text indicates that the samples were taken in May. The remaining samples were
taken in June.
18
Percent composition
60
Year 1
Year 2
50
Log Pond
Chuckanut
40
30
20
10
0
< 0.063 0.064 - 0.125 - 0.247- 0.469 - > 1.000
0.125 0.246
0.495 1.000
< 0.063 0.064 - 0.125 - 0.247- 0.469 - > 1.000
0.125 0.246
0.495 1.000
Size fraction (mm)
Percent organics
4
Year 2
Year 1
3
2
1
0
Log Pond
Log Pond
Chuckanut
Chuckanut
Figure 7. Sediment characteristics at the study sites. Grain-size distribution and percent
organic content are plotted. Standard errors are shown.
19
Appendix I.
Species Checklist for invertebrates collected in the Georgia Pacific Log Pond and in the
Chuckanut Reference Site (Year 2).
Phylum Sarcomastigophora
Class Granuloreticulosea
Order Foraminiferida
Unidentified foraminiferans
Phylum Nematoda
Unidentified nematodes
Phylum Cnidaria
Class Hydrozoa
Order Hydroida
Family Campanulariidae
Obelia sp.
Phylum Kinorhyncha
Order Cyclorhagida
Family Centroderidae
Kinorhynchus sp.
Phylum Annelida
Class Polychaeta
Order Capitellida
Family Capitellidae
Capitella capitata (Fabricius, 1780)
Mediomastus sp.
Family Maldanidae
Unknown species
Order Cirratulida
Family Cirratulidae
Cirriformia cirratus (Muller, 1776)
Order Cossurida
Family Cossuridae
Cossura sp.
Order Chaetopterida
Family Chaetopteridae
Order Eunicida
Family Lumbrineridae
Lumbrineris sp.
Order Flabelligerida
Family Flabelligeridae
Pherusa sp
Order Opheliida
Family Opheliidae
Armandia brevis (Moore, 1906)
Order Orbiniida
Family Orbiniidae
Leitoscoloplos pugettensis (Pettibone, 1957)
Order Oweniida
Family Oweniidae
Owenia fusiformis (Chiaje, 1841)
Order Phyllodocida
Family Goniadidae
Glycinde polygnatha (Hartman, 1950)
Family Hesionidae
20
Ophiodromus pugettensis (Johnson, 1901)
Family Nephtyidae
Nephtys cornuta (Berkley and Berkley, 1945)
Nephtys longosetosa (Ørsted, 1843)
Family Nereidae
Platynereis bicanaliculata (Baird, 1863)
Nereis vexillosa (Grube, 1851)
Family Pholoididae
Pholoe sp.
Family Phyllodocidae
Phyllodoce castanea (Marenzeller, 1879)
Family Polynoidae
Harmothoe imbricata (Linnaeus, 1766)
Arctone sp.
Family Syllidae
Exogone lourei (Berkeley & Berkeley, 1938)
Sphaerosyllis sp.
Order Sabellida
Family Spirobidae
Spirobis sp.
Order Spionida
Family Spionidae
Pygospio sp.
Prionospio jubata (Blake)
Sphiophanes sp.
Polydora sp.
Order Terebellida
Family Pectinariidae
Pectinaria sp.
Family Maldanidae
Axiothella rubrocincta (Johnson, 1901)
Class Oligochaeta
Unidentified species
Phylum Mollusca
Class Gastropoda
Subclass Opisthobranchia
Order Pyramidellacea
Family Cyclostremellidae
Cyclostremella concordia (Bartsch, 1920)
Family Pyramidellidae
Odostomia sp.
Turbonilla sp.
Order Cephalaspidea
Family Atyidae
Haminaea vesicula (Gould, 1855)
Family Cylichnidae
Cylichna alba (Carpenter, 1864)
Order Nudibrancia
Family Dendronotidae
Dendronotus sp.
Subclass Prosobranchia
Order Archaeogastropoda
Family Trochidae
Margarites sp.
Family Turbinidae
21
Astrea sp.
Order Mesogastropoda
Family Lacunidae
Lacuna vincta (Montagu, 1803)
Family Naticidae
Polinices sp.
Unknown sp. 1
Family Rissoidae
Alvania carpenteri (Weinkouff, 1885)
Order Neogastropoda
Family Columbellidae
Alia gausapata (Carpenter, 1864)
Family Nassariidae
Nassarius mendicus (Gould, 1849)
Class Bivalvia
Order Mytiloida
Family Mytilidae
Mytilus sp.
Order Veneroida
Superfamily Galeommatoidea
Family Cardiidae
Clinocardium nuttallii (Conrad, 1837)
Nemocardium centifilosum (Carpenter, 1864)
Clinocardium sp.
Family Lucinidae
Parvilucina tenuisculpta (Carpenter, 1864)
Family Montacutidae
Rochefortia tumida (Carpenter, 1864)
Family Tellinidae
Macoma nasuta (Conrad, 1837)
Macoma sp.
Tellina bodegensis (Hinds, 1845)
Family Veneridae
Transennella tantilla (Gould, 1852)
Class Polyplacophora
Order Neoloricata
Family Leptochitonidae
Leptochitona sp.
Phylum Arthropoda
Subphylum Crustacea
Class Branchiopoda
Order Cladocera
Family Podonidae
Podon leuckarti (G. O. Sars, 1862)
Evadne sp.
Class Ostracoda
Suborder Myodocopina
Euphilormedes carcharodonta (Smith, 1952)
Suborder Podocopida
Unidentified ostracod species 1
Unidentified ostracod species 2
Unidentified ostracod species 3
Class Cirripedia
Balanus sp.
Unidentified nauplius larvae
22
Unidentified cyprid larvae
Class Copepoda
Order Calanoida
Unidentified species
Order Harpacticoida
Harpacticus sp.
Tisbe sp.
Ectinosoma melaniceps (Boeck 1865)
Orthopsyllus illgi
Nannopus palustris (Brady, 1880)
Class Malacostraca
Subclass Phyllocarida
Order Leptostraca
Family Nebaliidae
Nebalia pugettensis (Clark, 1932)
Subclass Peracarida
Order Cumacea
Family Leuconiidae
Nippoleucon hinumensis (Gamo, 1967)
Family Nannastacidae
Cumella vulgaris (Hart, 1930)
Order Tanaidacea
Family Paratanaidae
Leptochelia dubia (Kröyer,1842)
Family Tanaidae
Sinelobus stanfordi (Richardson, 1901)
Order Isopoda
Suborder Asellota
Munna ubiquita Menzies, 1952
Order Amphipoda
Superfamily Gammaroidea
Family Anisogammaridae
Eogammarus sp.
Superfamily Corophioidea
Family Corophiidae
Corophium spinicorne Stimpson, 1857
Order Decapoda
Infraorder Caridea
Family Hippolytidae
Heptacarpus sp.
Infraorder Anomura
Family Paguridae
Pagurus sp.
Infraorder Brachyura
Unidentified zoea larvae
Unidentified megalopa larvae
Phylum Echinodermata
Class Ophiuroidea
Order Ophiuroidea
Family Amphiuridae
Amphiodia occidentalis (Lyman, 1860)
Amphipholis sp.
Class Holothuroidea
Order Dendrochirotida
Family Phyllophoridae
Pentamera populifera (Stimpson, 1864)
23
Phylum Chordata
Subphylum Urochordata
Order Doliolida
Class Larvacea
Oikopleura sp.
24
Appendix II. Organisms collected in May epibenthic samples from three stations in the Georgia Pacific Log
Pond (SS-74, SS-75, SS-76) and from two reference stations in Chuckanut Bay (CH-1, CH-2). Unknown
specimens were generally juveniles too small to identify.
Annelida
Arctonoe sp.
Armandia brevis
Axiothella rubrocincta
Capitella capitata
Exogone lourei
Glycinde polygnatha
Harmothoe imbricata
Mediomastus sp.
Nephtys longosetosa
Ophiodromus pugettensis
Owenia fusiformis
Pholoe sp.
Phyllodoce castanea
Prionospio jubata
Sphaerosyllis sp.
CH-1
0
0
0
36
0
0
3
0
5
0
5
0
0
1
0
CH-2
0
0
0
0
4
0
8
0
5
0
4
0
0
1
0
Station
SS-74
0
0
0
0
0
0
0
0
0
0
3
0
2
0
0
Spirorbis sp.
Unidentified oligochaete
0
0
0
0
0
3
CH-1
0
1
0
0
0
0
0
0
0
0
0
16
1
0
0
CH-2
9
0
0
0
0
1
0
0
2
2
0
66
0
0
0
Station
SS-74
0
0
0
0
0
0
0
0
0
0
0
0
0
0
0
SS-75
2
0
3
0
10
36
0
0
0
0
0
5
12
3
0
SS-76
1
2
0
1
4
1
1
4
0
4
15
84
14
0
3
CH-1
0
0
7
1
CH-2
1
1
2
0
Station
SS-74
1
0
5
3
SS-75
2
1
1
1
SS-76
11
4
5
0
Mollusca
Alvania carpenteri
Clinocardium nuttallii
Cyclostremella concordia
Haminaea vesicula
Lacuna vincta
Macoma nasuta
Mytilus sp.
Nassarius mendicus
Odostomia sp.
Parvilucina tenuisculpta
Polinices sp.
Rochefortia tumida
Tellina bodegensis
Transennella tantilla
Unknown gastropod #1
Crustacea
Balanus sp.
Corophium spinicorne
Cumella vulgaris
Ectinosoma melaniceps
25
SS-75
0
0
1
2
0
0
10
0
5
0
111
1
1
0
0
SS-76
1
2
0
3
1
1
16
1
8
9
16
0
0
0
1
2
1
1
9
Eogammarus sp.
Evadne sp.
Harpacticus sp.
Heptacarpus sp.
Leptochelia dubia
Munna ubiquita
Nannopus palustris
Nebalia pugettensis
Nippoleucon hinumensis
Pagurus sp.
Podon leuckarti
Tisbe sp.
Unidentified carangid copepod
Unidentified ostracod species 1
Unidentified cyprid larva
Unidentified zoeae larva
24
0
15
10
1
0
0
0
0
1
0
0
1
2
1
5
10
10
0
2
1
3
0
3
0
0
0
2
1
0
0
3
1
0
2
3
0
0
0
0
0
0
1
0
0
0
0
0
0
0
0
0
0
4
1
0
1
0
16
1
0
0
0
1
2
0
34
0
0
0
4
0
1
0
5
2
3
1
4
0
CH-1
13
105
0
1
2
0
CH-2
18
35
0
0
9
1
Station
SS-74
0
29
0
0
0
0
SS-75
0
24
1
0
5
0
SS-76
441
843
0
0
1
0
Miscellaneous
Unidentified foraminiferans
Unidentified nematodes
Obelia medusa (Cnidaria)
Amphiodia occidentalis (Echinodermata)
Amphipholis sp. (Echinodermata)
Oikopleura sp. (Urochordata)
26
Appendix III. Organisms collected in June epibenthic samples from three stations in the Georgia Pacific
Log Pond (SS-74, SS-75, SS-76) and from two reference stations in Chuckanut Bay (CH-1, CH-2).
Annelida
Armandia brevis
Axiothella rubrocincta
Capitella capitata
Chaetopteridae (Family)
Exogone lourei
Glycinde polygnatha
Harmothoe imbricata
Leitoscoloplos pugettensis
Lumbrineris sp.
Mediomastus sp.
Nephtys cornuta
Nephtys longosetosa
Nereis vexillosa
Ophlodromus pugettensis
Owenia fusiformis
Pectinaria sp.
Pherusa sp.
Pholoe sp.
Platynereis bicanaliculata
Prionospio jubata
Polydora sp.
Spirorbis sp.
Unidentified oligochaete
CH-1
6
0
2
1
1
7
7
0
0
0
0
10
0
0
111
0
0
0
0
2
8
1
2
CH-2
15
0
0
0
0
0
1
0
0
0
0
1
0
0
167
1
0
0
1
0
1
1
6
Station
SS-74
0
0
3
0
12
0
0
3
0
0
0
0
1
0
3
0
0
0
0
0
0
0
84
SS-75
2
0
22
0
1
0
1
0
1
0
0
0
1
0
151
0
3
4
0
0
2
5
5
SS-76
1
2
0
0
24
9
0
0
0
16
1
48
0
1
195
0
0
0
0
0
3
1
16
CH-1
0
4
0
34
0
1
5
28
0
0
1
3
418
0
4
CH-2
0
1
0
117
2
29
54
1
1
2
50
62
387
9
0
Station
SS-74
0
0
6
0
0
0
0
0
0
0
0
0
0
0
0
SS-75
1
16
12
18
0
0
0
0
2
0
9
2
39
4
7
SS-76
0
3
0
48
0
0
0
0
0
0
0
12
204
0
8
CH-1
14
2
64
25
CH-2
7
11
396
1
Station
SS-74
2
0
0
2
SS-75
6
5
3
0
SS-76
6
0
13
146
Mollusca
Alia gausapata
Alvania carpenteri
Clinocardium nuttallii
Clinocardium sp.
Dendronotus sp.
Lacuna vincta
Macoma nasuta
Macoma sp.
Mytilus sp.
Neocardium centifilosum
Parvilucina tenuisculpta
Polinices sp.
Rochefortia tumida
Tellina bodegensis
Unknown gastropod #2
Crustacea
Balanus sp.
Corophium spinicornis
Cumella vulgaris
Ectinosoma melaniceps
27
Eogammarus sp.
Euphilomedes carcharodonta
Evadne sp.
Harpacticus sp.
Heptacarpus sp.
Leptochelia dubia
Munna ubiquita
Nannopus palustris
Nebalia pugettensis
Nippoleucon hinumensis
Orthopsyllus illogic
Podon leuckarti
Sinelobus stanfordi
Tisbe sp.
Unidentified carangid copepod
Unidentified ostracod species 1
Unidentified ostracod species 2
Unidentified ostracod species 3
Unidentified nauplius larva
Unidentified cyprid larva
Unidentified zoea larvae
Unidentified megalopa larva
23
2
1
367
1
13
19
160
5
0
40
147
1
121
48
0
0
131
30
37
5
0
162
0
17
676
0
0
0
352
0
0
23
139
0
205
22
40
15
0
7
20
4
0
0
0
0
1681
0
0
0
46
0
7
1
33
0
65
28
0
0
0
0
4
2
1
0
0
0
6
0
0
5
0
1
1
0
6
0
11
17
0
0
0
0
5
0
0
0
0
0
4737
6
0
0
78
0
4
12
13
2
317
43
0
0
0
1
135
7
0
CH-1
1112
1180
0
0
2
CH-2
120
273
1
0
0
Station
SS-74
2
1688
0
0
0
SS-75
104
198
0
0
2
SS-76
728
8787
0
2
0
Miscellaneous
Unidentified foraminiferans
Unidentified nematodes
Obelia medusa (Cnidaria)
Kinorhynchus sp. (Kinorhyncha)
Amphipholis sp. (Echinodermata)
28
Appendix IV. Organisms collected in ponar samples from three stations in the Georgia Pacific Log Pond
(SS-74, SS-75, SS-76) and from two reference stations in Chuckanut Bay (CH-1, CH-2).
Annelida
Armandia brevis
Capitella capitata
Cirriformia cirratus
Chaetopteridae (Family)
Cossura sp.
Exogone lourei
Glycinde polygnatha
Harmothoe imbricata
Leitoscoloplos pugettensis
Maldanidae (Family)
Mediomastus sp.
Nephtys longosetosa
Owenia fusiformis
Pectinaria sp.
Pholoe sp.
Phyllodoce sp.
Prinospio jubata
Pygospio sp.
Sphiophanes sp.
Spirorbis sp.
CH-1
18
7
2
2
0
0
16
0
37
0
1
9
93
1
1
0
0
6
3
15
CH-2
5
0
0
0
0
0
0
0
0
0
2
8
22
0
0
0
0
0
0
0
Station
SS-74
2
47
0
0
0
1
3
0
6
0
0
0
0
0
5
9
2
2
0
0
SS-75
0
16
7
0
15
0
30
13
0
0
25
74
6227
8
0
0
0
0
0
75
SS-76
1
22
0
0
0
0
13
0
2
3
0
11
125
0
1
0
0
5
0
0
CH-1
3
90
0
1
69
13
1
1
0
2
0
3
0
2
0
0
4
15
1409
57
7
0
0
0
CH-2
0
0
1
1
313
0
0
0
0
4
0
0
0
10
2
0
0
0
62
0
0
0
0
0
Station
SS-74
0
2
0
0
1
0
1
6
0
7
0
0
0
0
0
0
0
0
7
15
0
0
0
1
SS-75
0
540
0
33
0
0
0
0
0
0
0
0
13
18
0
1
17
75
182
91
0
2
1
6
SS-76
0
107
0
0
4
0
5
0
1
2
6
0
0
0
0
0
0
0
25
14
0
0
1
0
Mollusca
Alia gausapata
Alvania carpenteri
Astrea sp.
Cylichna alba
Clinocardium nuttalli
Clinocardium sp.
Haminaea vesicula
Lacuna vincta
Leptochitona sp.
Macoma nasuta
Macoma sp.
Margarites sp.
Mytilus sp.
Nassarius mendicus
Naticidae (Family)
Neocardium centifilosum
Odostomia sp.
Parvilucina tenuisculpta
Rochefortia tumida
Tellina bodegensis
Transennella tantilla
Turbonilla sp.
Unknown gastropod #1
Unknown gastropod #2
29
Crustaceana
Balanus sp.
Corophium spinicorne
Cumella vulgaris
Eogammarus sp.
Euphilormedes carcharodonta
Heptacarpus sp.
Leptochelia dubia
Munna ubiquita
Nannopus palustris
Nebalia pugettensis
Nippoleucon hinumensis
Sinelobus stanfordi
Tisbe sp.
Unidentified calanoid copepod
Unidentified ostracod species 1
Unidentified cyprid larva
Unidentified magalopa larva
CH-1
26
0
67
18
24
0
62
25
0
0
3
0
0
0
2
CH-2
4
1
22
2
0
0
1
0
0
1
0
0
0
0
0
Station
SS-74
0
0
2
0
0
1
0
0
8
0
1
0
1
0
0
SS-75
7
22
5
16
3
0
6
19
0
0
0
9
0
4
0
SS-76
8
10
10
0
0
0
0
0
0
0
7
0
0
0
0
0
0
0
1
0
CH-1
557
408
0
0
4
0
0
CH-2
2
8
0
0
0
0
4
Station
SS-74
8
268
0
0
0
0
0
SS-75
111
517
69
0
0
5
0
SS-76
8
654
0
0
0
0
0
Miscellaneous
Unidentified foraminiferans
Unidentified nematodes
Obelia medusa (Cnidaria)
Amphiodia occidentalis (Enchinodermata)
Amphipholis sp. (Enchinodermata)
Pentamera populifera (Enchinodermata)
Oikopleura sp. (Chordata)
30


© Copyright 2026