
Inertness Comparison of a Sample of 5% Phenyldimethylpolysiloxane columns Pittcon 2003 Poster
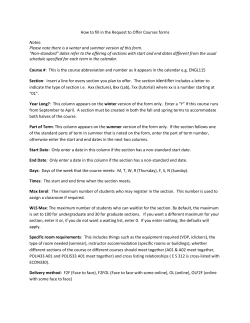
Inertness Comparison of a Sample of
5% Phenyldimethylpolysiloxane columns
Pittcon 2003 Poster
Mitch Hastings, Allen K. Vickers,
and Cameron George
Agilent Technologies, Inc
91 Blue Ravine Road, Folsom, CA 95630
Introduction
The Test
A few nascent manufacturers of capillary columns
have taken the provocative position in the marketing of their capillary columns by stating that "The
only difference is the price." It has previously been
shown that this is not the case in terms of 5%
phenyldimethylpolysiloxane columns and carbowax columns in the performance categories of
column bleed, selectivity (the ability of one of
these new columns to mimic the elution order of
an industry standard column) and general column
inertness, (the ability to chromatograph even modestly active compounds such as phenols, amines,
and multifunctional group compounds).1
There are three things a column manufacturer can
do with their column test to make the column look
better than it really is: 1) select chromatographically undemanding probes, 2) run the test on a
temperature program, and 3) run the test at higher temperatures.
Three questions arise, just how different are these
columns, for which analyses do the differences
matter, and how can you tell? To the latter, the
types of analyses that typically demand the most
inertness from a GC system (inlet, column and
detector) are those interested in trace amounts of
active analytes. Trace analysis is generally defined
as less than 10 nanogram of analyte on-column.
These analyses uncover weaknesses inherent in a
column's design and/or manufacture because there
is so little analyte present on column. Thus, a
greater percentage of analyte molecules are affected by the fixed number of column (and inlet and
detector) active sites, resulting in more readily
detectable tailing and loss of response. Real world
examples include analytical methods for drugs of
abuse (methamphetamine and others which are
basic, barbiturates which are generally mild acids),
many pesticides analyses (which have acidic, basic,
nitro, phosphorous and sulfur moieties), and environmental analyses for semivolatile industrial contaminants including USEPA method 8270 which
has some of the more notoriously difficult compounds to chromatograph without loss to column
activity.
It is impractical to test all chromatographically
problematic compounds on all columns. However,
it is reasonable to assign as proxy probes, known
active analytes with functional groups that are the
same as many of the chromatographically active
compounds in the previously mentioned analyses.
Further, if the test conditions are truly demanding,
one can get a more accurate evaluation of how different manufacturers' columns compare. The work
that follows takes this approach.
2
Undemanding Probes
Almost all column manufactures include in their
test mixes an organic acid (a substituted phenol),
base (an amine), and an alcohol, along with nonactive probes. Assuming inert compound (hydrocarbons) chromatography is good, the acid, if it
tails or loses response, indicates that the column
is "basic." The base, likewise, will indicate if the
column is acidic. The alcohol will give an indication if there has been oxygen damage, or if there
are any surface silanols exposed as it will not lose
response except in severe damage situations, but
will tail. If peak shapes for all these compounds
are symmetrical, then the column is considered
"inert" toward them.
By selecting undemanding probes, column activity
can go undetected. This is the equivalent of using
a magnifying glass instead of a microscope when
you need to look for bacteria-you won't see anything wrong because you don't have a powerful
enough tool to see. A surprising number of column
manufacturers use undemanding probes to check
the quality of their columns to “improve” their
manufacturing yield and then sell at a lower price.
Additionally, the ratio of the active functional
group relative to the overall size of the molecule,
and the less sterically hindered this active moiety,
the more potential there is for the moiety to interact with an active site in the column. Here are a
couple examples of undemanding probes based on
these assumptions:
2,6-Dimethylphenol-Sterically shielded -OH function, very, very weak acid
Dicyclohexylamine-Sterically shielded, secondary
amine function, weaker base
Temperature Programming
As depicted in figure 8, when a probe chromatographs under temperature programmed conditions, the percentage of molecules of the probe
in the mobile phase is increasing as the probe
passes from the inlet to the detector end of the
column. As such, it is spending more time interacting with the column stationary phase toward
the inlet end of the column, so the probes are not
testing the entire column equally, a problem with
traditional test mixes like the Grob mix. Oven programming also can hide the appearance of tailing
(i.e., activity). In short, a column’s inertness
should be tested isothermally.
Figure 8.
Column Length
Flow
Flow
Cool
Detector
Temperature
Hot
Test Temperature
Table 1. Test Probes in Performance Mixture.
Generally, the longer a test probe is in the column,
the more it interacts with active sites in the column. Additionally, the lower the column temperature, the greater the strength of these adverse
interactions. A demanding test will be one that is
run at lower temperatures thus, increasing k and
enhancing the interaction opportunity for all the
test probes. In practice, we have observed significantly more revealing results at test temperatures
below with all probes2. At lower temperatures even
a moderately retained probe is just as revealing as
a homologue probe that is retained longer. (For
example, n-heptanol reveals just as much about
column activity as n-decanol, once they achieve a
k of 3 or more).
Room Tem perature: Tim e (Days) v RRFs
1.200
y = -0.0003x + 1.0422
1.000
RRF (to Decane)
Inlet
This test mix is somewhat unconventional as it
uses a solvent which elutes after the probes. Many
solvents used in test mixes are polar solvents. It
can be reasonably argued that such polar solvents
and their low level impurities might actually temporarily "mask" active sites on the column, interfering with the interaction between the test probes
and the column, again making the column look better than it is. For this reason, a solvent eluting
after the probes was used. Also, methane could be
introduced and retained into the standard for
determining linear velocity. Test probes and their
estimated on-column amounts (in nanograms) are
shown below. Amounts cannot be determined
exactly because the injection mode is split.
Propionic Acid
y = 0.0002x + 0.8864
Octane
0.800
y = -2E-05x + 0.5888
0.600
Nitrobutane
y = -0.0005x + 0.4236
0.400
4-Picoline
y = -0.0002x + 0.281
Trimethyl
Phosphate
0.200
0.000
0
5
10
15
20
25
Days at Room Tem perature
Probe
(ng)
Methane
Column functional test
NA
Propionic acid
1.4
Basicity
Octane
0.5
HC marker (inert)
Taking all the above under consideration, and
working through roughly 50 test probe candidates,
the following test conditions were selected to compare a variety of 5% phenyldimethylpolysiloxane
columns:
Nitrobutane
1.0
Acidity
4-Picoline
0.6
Acidity
Trimethyl phosphate
2.6
Acidity
1,2-Pentanediol
1.1
Silanol
Injection:
ALS (with nanoliter adapter)
Propylbenzene
0.4
HC marker (inert)
0.1 µl, Split, 250°C
1-Heptanol
0.6
Silanol
30m x 0.25 mm I.D., 0.25 µm
3-Octanone
0.6
Polarity
5% phenyldimethylpolysiloxane
Decane
0.4
HC marker (inert)
"Demanding" Test Criteria-Separating Wheat from Chaff
All Columns tested:
Carrier:
34 cm/sec or 1.0 mL/min flow, H2
Oven:
65°C for 14 min
(until last probe elutes)
65-300°C, 25°/min
300°C until solvent elutes
3
As these are very chemically reactive probes compared to traditional test mix probes, test mix stability was determined. Results in Figure 9 showing
the mixture stable at a higher concentration over a
period of 3 weeks demonstrate mix stability sufficient for the duration of this comparison, which
was only 1.5 weeks.
Figure 9. Test Mix Stability
The stock standard (at 5X concentration) was run
on the day of preparation, 7, 13, and 21 days after
preparation, and was kept at room temperature
during the course of testing. Relative Response
Factors to Decane for the active probes were calculated, and plotted against time (days). A negative
slope indicates probe loss, and propionic acid had
the greatest rate of loss. This equates to a loss of
0.5% over the 10 days this study was run-not significant-so the standard was deemed "stable."
Conclusions
A Picture is worth a thousand words. As the
Figures above show, a demanding test mix reveals
the inertness differences in the performance of
capillary columns from one manufacturer to the
next. In some cases, even comparably priced competitors do not perform as well as Industry
Standard columns like the HP-5ms and DB-5ms.
Footnotes
1M. Hastings, E. Kuhn, A.K. Vickers, Evaluation of Capillary Columns for
General Performance Parameters, Poster, Pittcon 2002.
2Personal communication, C. George, J. Ellis, Agilent Technologies, Inc,
M.D'Amico, Michrom Inc.
4
HP-5ms
Acid
C8
R-NO3
CH4
Base
Phosphate
Diol
Ph-R
Alcohol
R,R‘-C=0
C10
C1121a
2
4
6
Time (min)
8
10
8
10
Figure 1. Modest tailing of base and phosphate.
DB-5ms
Base
Phosphate
Diol
2
C1121b
4
6
Time (min)
Figure 2. Slight tailing on base, phosphate, and diol, but still good.
Manufacturer A--Comparably Priced
Phosphate/Diol
Alcohol
Base
2
4
6
Time (min)
8
10
Figure 3. Loss of base and co-elution of phosphate and diol, and tailing alcohol.
5
Manufacturer B--Low Priced
Diol
Phosphate
Alcohol
Base
2
4
6
Time (min)
8
10
Figure 4. Loss of base and phosphate severe diol response loss, tailing on alcohol.
Manufacturer C--Comparably Priced “5ms” Competitor
Base
2
4
Phosphate
Diol
Alcohol
6
Time (min)
8
R,R‘-C=0
10
Figure 5. Complete loss of base and phosphate, severe diol response loss, tailing on alcohol and even the ketone, an extreme form of activity.
Manufacturer C--Premium Priced Extra Inertness Column
Phosphate
Diol
Alcohol
Base
2
4
6
Time (min)
8
R,R‘-C=0
10
Figure 6. Good response for the acid, but complete loss of base and near complete loss of phosphate, severe diol response loss, tailing on
alcohol and even ketone, an extreme form of activity.
6
Manufacturer D--Low Priced Manufacturer’s “MS Grade” Column
Diol
Acid
2
Base
4
Phosphate
Alcohol
6
Time (min)
8
R,R‘-C=0
10
Figure 7. Near complete loss of acid, complete loss of base and near complete loss of phosphate and diol, tailing on alcohol and even the ketone, an
extreme form of activity.
7
Ordering Information
www.agilent.com
800 227-9770
This information is subject to change without notice.
Printed on recycled paper
© Agilent Technologies, Inc. 2003
B-0465


© Copyright 2026