
Aerothermal Analysis of a Sample-Return Reentry Capsule
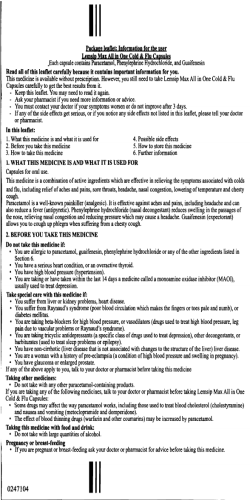
Copyright © 2013 Tech Science Press FDMP, vol.9, no.4, pp.461-484, 2013 Aerothermal Analysis of a Sample-Return Reentry Capsule V. Carandente1 , R. Savino1 , M. Iacovazzo1 and C. Boffa1 Abstract: The article deals with the aerothermal analysis of a sample-return hypersonic capsule reentering on Earth from an interplanetary exploration mission. The main objective of the work is to estimate the heat flux distribution on the capsule surface and to perform one-dimensional thermal analyses for its ablative heat shield. After a short review of sample-return missions, the numerical models implemented are described and the computational results, obtained along a feasible reentry trajectory, are presented and discussed. Particular attention has been paid to compare the convective stagnation point heat fluxes obtained by means of Computational Fluid Dynamic (CFD) analyses with the ones computed with engineering correlations. A further comparison between CFD and with Direct Simulation Monte Carlo (DSMC), in order to investigate the air rarefaction effects, is reported. The article shows an overall satisfactory agreement between engineering correlation and numerical results and also presents a preliminary dimensioning of the capsule ablative heat shield at the stagnation point. Keywords: Aerothermodynamics, hypersonic flow, sample-return reentry capsule, ablative heat shield. 1 Introduction and objectives The flow field around hypersonic vehicles is characterized by the presence of strong shocks, equilibrium or non-equilibrium gas chemistry, very high temperatures and, as a consequence, by large heat fluxes, requiring a proper designed thermal protection system. For these reasons, the estimation of the reentry flow environment and the correct design of the thermal protection structure is essential for a space mission which considers the atmospheric entry of a spacecraft module. Despite technological progress over time, reentry capsules since the early Mercury program in 1960’s have been characterized by the same basic design concept: a blunt shape protected by a heat shield. Blunt bodies, in fact, are subjected to the 1 Department of Aerospace Engineering (DIAS), University of Naples “Federico II”, Naples, Italy 462 Copyright © 2013 Tech Science Press FDMP, vol.9, no.4, pp.461-484, 2013 maximum deceleration at higher altitudes, where the density is lower and the drag force that they encounter is therefore mostly due to the pressure forces. This results in lower heat fluxes, if compared to the ones occurring, at the same conditions, for sharp bodies. From the beginning of the space exploration era, most of the missions included sample return, because of the very large interest for the scientific community in the study of extraterrestrial samples. The former Soviet Union has a long history of successful Earth reentry missions. For instance, during the period 1970-1976 the robotic Soviet missions Luna 16, Luna 20 and Luna 24 successfully returned on Earth some samples of lunar soil. Then, during 1996-1997, Earth-Orbital Debris Collection (ODC) has been deployed on the Mir space station for 18 months. It used aerogel to capture particles from low-Earth orbit, mainly consisting of interplanetary dust. In recent years, NASA Stardust was the first successful space mission that, in 2006, brought to Earth solid extraterrestrial samples collected from a comet, Wild Wild 2 [Desai, Lyons, Tooley, and Kangas (2006)]. The Japanese Hayabusa was a sample return mission by Japan’s space science agency JAXA, whose objective was to return samples from the surface of a small near Earth asteroid. The spacecraft was launched in May 2002 and returned to Earth in June 2010 with a reentry velocity of about 12.2 km/s [Brucato, Rotundi, and Epifani (2009)]. Marco Polo is a joint European-Japanese mission study, to return unaltered materials from a Near Earth Object (NEO), the asteroid 1999 JU3. For Marco Polo a launch in years 2017/2018 and a reentry on Earth in the years 2022/2024 are under study. The requirements for the Earth Reentry Capsule (ERC) include a maximum mass of 30 kg, a ballistic coefficient (i.e. the ratio between the vehicle reentry mass and the reference surface times the drag coefficient) of 70 kg/m2 [Brucato, Rotundi, and Epifani (2009)]. The nominal reentry conditions consist in an inertial entry flight path angle near −10◦ and in a maximum velocity in the order of 13 km/s. The most effective solution for the thermal protection systems of these kind of vehicles seems to be an ablative heat shield. In the present work Phenolic Impregnated Carbon Ablator (PICA) materials, which are part of the Lightweight Ceramic Ablators (LCAs) family, have been considered for the forebody heat shield of the capsule. This material consists of a commercially available low density carbon fiber matrix substrate impregnated with a phenolic resin [Tran, Johnson, Rasky, Hui, Hsu, Chen, Chen, Paragas, and Kobayash (1997); Tran (1994)]. The objective of the work is the estimation of the aerothermal loads for a bluntnosed sphere-conic capsule which could be potentially employed in a sample return Aerothermal Analysis of a Sample-Return Reentry Capsule 463 mission and the preliminary sizing of its ablative heat shield at the stagnation point. The work is organized as follows. In Section 2 the capsule geometry and the numerical models used to evaluate the reentry trajectory and aerothermal loads are presented, along with the model implemented to perform one-dimensional thermal analyses for the ablative heat shield. In Section 3 the computed reentry trajectory is presented. In Section 4 the aerothermal loads on the capsule, estimated by means of CFD and DSMC analyses are illustrated. Section 5 reports the main outcomes of the one-dimensional thermal analysis of the capsule ablative heat shield. Finally, Section 6 summarizes the main conclusions of the study. 2 Geometry and Models The capsule configuration and the different models considered to perform the analyses reported in the following paragraphs are summarized below. 2.1 Aerodynamic configuration According to previous conceptual design studis, the baseline configuration for a sample return reentry capsule depicted in Figure 1 has been considered. This configuration consists of a sphere-cone with half cone angle of 45◦ , a base radius Rb of 0.33m and a nose radius Rn of 0.30m. Figure 1: Capsule baseline configuration The half cone angle and the nose and base radii have been selected after a trade-off analysis, which took into consideration the influence of each parameter on mechanical and aerothermal loads acting on the capsule and on its aerodynamic stability. 464 Copyright © 2013 Tech Science Press 2.2 Model for reentry trajectories evaluation FDMP, vol.9, no.4, pp.461-484, 2013 Equation 1 characterizes the dynamics of the reentry capsule. ρV 2 CD S ρV 2 dV = − · − g sin γ = − dt 2 m 2B − g sin γ 2 dγ V V dt = r − g cos γ 2 dφ V dt = − Vr cos γ cos φ tan λ dH dt = V sin γ dλ V = dt r cos γ sin φ dΛ V cos γ cos φ dt = r · cos λ (1) The gravitational acceleration has been assumed to vary (with respect to the capsule altitude) according to Equation 2, while air density, pressure and temperature according to the U. S. Standard Atmosphere. g = g0 2.3 R⊕ R⊕ + H 2 (2) Engineering models to evaluate convective and radiative heating The engineering models to evaluate stagnation point convective heat fluxes include three different formulations: Sutton and Graves (1971); Tauber (1989); Detra and Hidalgo (1961) models, which in the past have shown to reasonably agree with experiments. Formulations by Sutton-Graves and Tauber allow one to estimate the convective heating at the stagnation-point of axisymmetric blunt bodies. The models consider the gas mixtures encountered during high velocity planetary entry to be in chemical equilibrium. These two models are both characterized by Equation 3, where V is the velocity in m/s, ρ is the atmospheric density in kg/m3 , Rn is the nose radius in m and K is a constant derived, for a general gas mixture, as a function of the mass fraction, of the molecular weights, and of the individual transport properties. For this constant the values of 1.73 · 104 for Sutton-Graves and 1.83 · 104 for Tauber model are considered, respectively. r q˙conv = K ρ 3 V Rn W m2 (3) The other convective heat transfer correlation has been provided by Detra and Hidalgo (see equation 4). It provides an accuracy of 10% for velocities between 1.8 km/s and 8 km/s and for altitudes up to 70 km [Detra and Hidalgo (1961)]. Aerothermal Analysis of a Sample-Return Reentry Capsule −5 q˙conv = 5.16 · 10 r ρ 3.15 V Rn W m2 465 (4) As it will be pointed out in Section 4.1, a significant deviation, between DetraHidalgo and the other two proposed models, occurs at altitudes around 60 km, corresponding to the maximum heat flux along the reentry trajectory. At super-orbital speeds, however, convective heat flux is not the only thermal load acting on a re-entering capsule. Also radiative heat fluxes are in fact significant for the thermal protection system. Among the different engineering models for radiative heating available in literature, the one provided by Tauber and Sutton (1991) has been considered in the present work. Tauber and Sutton’s engineering correlation is reported in Equation 5, being C a constant that depends on the atmosphere and f (V ) tabulated values, functions of both flight velocities V and atmospheric composition. The exponents a and b can be either constants, or functions of density and free stream velocity, as specified in [Tauber and Sutton (1991)]. q˙rad = C · Ran · ρ b f (V ) 2.4 (5) CFD model for aerothermodynamic analysis Computational Fluid Dynamics (CFD) analyses represent a key technology for the design of entry vehicles or capsules. In order to design vehicles reentering from space, in fact, an accurate understanding of all physical phenomena taking place in the flow field around the hypersonic vehicle is required to assess its aerodynamic and aerothermodynamic performances. CFD allows one to significantly reduce the number of in-flight and Plasma Wind Tunnel (PWT) experimental test campaigns and to account for real-gas flow features, which are difficult to reproduce in groundtest facilities. Flight measurements collected during reentry have demonstrated that real gas effects, in fact, strongly influence both aerodynamics and aerothermal loads [Anderson (1989); Park (1990)]. During atmospheric descent, reentry vehicles encounter several flow regimes and thermochemical phenomena. In fact, they fly from free molecular to fully continuum phases and, when in continuum, from laminar to fully turbulent flows. When the freestream enthalpy is large enough, the flow passing through the bow shock dissociates resulting in a reacting mixture flow around the vehicle. The thermal and chemical characteristics of the gas in the shock layer, i.e. the flow field between the shock-wave and the body, depend on the atomic and molecular structure of the species. For this reason, it is important to predict the composition of the flid mixture surrounding the vehicle [Anderson (1989); Park (1990)]. 466 Copyright © 2013 Tech Science Press FDMP, vol.9, no.4, pp.461-484, 2013 For the configuration and the flight conditions considered in the present work, the flow can be considered laminar and in chemical non-equilibrium. Different models exist in literature for modeling the dissociation and the ionization phenomena. The one implemented is based on the solution of the Navier-Stokes equations for a chemically reacting mixture composed of eleven species (N2 , N, + + − + O2 , O, NO, N+ 2 , N , O2 , NO , e ). In particular, the kinetic parameters of the of the ionization reactions have been set according to Evans’ model [Evans, Jr., and Hubert (1973)], which has been validated in previous works also cross checking experimental results [Savino, Paterna, Fumo, and D’Elia (2010)]. Numerical simulations have been performed using the software FLUENT, which is able to solve the laminar Navier-Stokes equations at high temperatures in chemical non-equilibrium, including dissociation and ionization reactions. In this case a density-based, time implicit, numerical resolution scheme has been used, solving the above mentioned field equations, through a control-volume-based technique. In addition, the AUSM (Advanced Upstream Splitting Method) scheme for convective numerical fluxes has been employed. The chemical kinetic model has been implemented in the software with the same procedure adopted in previous works [Paterna, Monti, Savino, and Esposito (2001); Savino and Fumo (2008); Monti, Savino, and Fumo (2007); Monti, Fumo, and Savino (2005)]. Figure 2: Computational grid The computational grid used to perform calculations has been realized in a preprocessing phase taking advantage of the software GRIDGEN (see Figure 2). The grid is composed of 10800 quadrilateral cells, whose density becomes higher approaching the nose of the capsule. This choice provides the best resolution in the most critical region of the flow field, where in particular high temperature and velocity gradients must be considered. Aerothermal Analysis of a Sample-Return Reentry Capsule 467 Different kinds of conditions have been set for the computational domain boundaries: a pressure far-field condition was set for the boundary labeled as 1, in order to model a free stream condition, an axis condition for the symmetry surface (label 2), a wall conditions for the surface of the capsule (label 3) and a pressure outlet was set for the downstream surface (not visible in Figure 2). In particular, on the wall a non slip condition and a constant temperature of 300 K were set. Also, CFD analyses have been performed setting either a Non-Catalytic (NC, see Equation 6) and a Fully-Catalytic (FC, Equation 7) condition. In Equation 6 ci represents the concentration of the ith species and n the direction normal to the wall while, in the first relation in Equation 7, cion,dis stands for the concentration of the dissociated and ionized species. Non-Catalytic condition (NC) Fully-Catalytic condition (FC) ∂ ci ∂n =0 (6) w (cion,dis )w = 0 (cO2 )w = 0.22 (cN2 )w = 0.78 (7) The fully-catalytic condition includes the influence of the wall recombination reactions on the heat flux. In this condition, in fact, the energy stored in the chemical degrees of freedom is completely released at the wall, causing additional heating. For a non-catalytic surface, this additional heating does not occur at all. As we will observe from computational results, non-catalytic heat fluxes at the stagnation point could be even 50% lower than the corresponding fully-catalytic ones. The above two cases represent the best and the worst possible case from the thermal heating point of view, but they are not necessarily encountered in practice. Generally, real TPS materials have an intermediate catalyticity. A grid convergence analysis, in order to ensure the solution independence from the mesh fineness, has been performed. The percentage error between significant parameters computed using two different grids at a height of 80 km has been evaluated. Table 1 shows that the main fluid-dynamic parameter calculated using the coarse mesh are very similar to the ones obtained from a finer mesh. 2.5 Numerical model for ablative heat shields thermal analyses Calculating the thermal response of an entry vehicle’s Thermal Protection System (TPS) is very important for its correct sizing. This kind of analysis is particularly 468 Copyright © 2013 Tech Science Press FDMP, vol.9, no.4, pp.461-484, 2013 Table 1: Grid convergence analysis Drag Coefficient Stagnation point pressure [kPa] Stagnation point heat flux [MW /m2 ] Coarse mesh (10800 cells) 1.104 2.904 4.502 Fine mesh (43200 cells) 1.097 2.967 4.293 Error 0.64% 2.1% 4.9% significant for ablative heat shields, for which two different effects due to aerodynamic heating have to be considered [Dec and Braun (2006)]. On the one hand the instantaneous material recession rate has to be estimated and, on the other hand, the in-depth temperature response of the TPS has to be computed, in order to evaluate the amount of material required as insulation to keep the bondline temperature (i.e. the temperature of the material surface not directly exposed to the flow) below a specified limit. For the first analysis the assumption of steady-state ablation has been considered. At each instant of time, for surface temperatures higher than a threshold value, the ablation rate s˙ has been estimated by Equation 8, in which Q˙ hw is the hot wall convective heat flux acting on the external surface of the material, ρM is the material density and Q∗ the heat of ablation. Then, the total recession has been calculated by integrating the recession rate over the trajectory. s˙ = Q˙ hw ρM · Q∗ (8) The hot wall convective heat flux has been obtained from Equation 9, in which Q˙ cw is the cold wall convective heat flux acting on the material (estimated by means of one of the models reported in Section 2.3), c p is the material specific heat, Tw the wall temperature and Htot the fluid total enthalpy per unit of mass. c p · Tw ˙ ˙ Qhw = Qcw 1 − (9) Htot The in-depth temperature response of the material has been accomplished using a finite-difference formulation for the one-dimensional conduction of energy through the material. Equation 10 reports the just mentioned equation, with k the material thermal conductivity and T its temperature (assumed to be a function of both the time t and of the spatial coordinate x, defined as depicted in Figure 3). ∂T ∂ ∂T ρM · c p · = k (10) ∂t ∂x ∂x Aerothermal Analysis of a Sample-Return Reentry Capsule 469 Figure 3: Spatial coordinate system definition for the ablative heat shield thermal analysis As initial condition a uniform temperature of 20◦C has been considered while, as boundary conditions, the ones reported in Equation 11 and 12 have been assumed. In particular, the second equation represent the adiabatic condition for the bondline wall, while, in the first one, the hot wall convective heat flux acting on the material external surface, decreased by the re-radiated flux (being σ the Stephan-Boltzmann constant and ε the material emissivity), has been specified. c p · Tw ∂T ˙ q˙ = −k = Qcw 1 − − σ · ε · Tw4 ∂ x x=0 Htot ∂T =0 q˙ = −k ∂ x x=L (11) (12) This model has been in particular implemented for Phenolic Impregnated Carbon Ablators (PICA). The thermal analysis implemented takes into account the main thermal property variation (i.e. the thermal conductivity, the specific heat and the effective heat of ablation) with respect to the temperature or the convective heat flux, basing on the experimental results reported in [Tran, Johnson, Rasky, Hui, Hsu, Chen, Chen, Paragas, and Kobayash (1997)]. The material density variation has been implemented applying the Arrhenius relation [Milos, Chen, and Squire (2006)] (labeled as Equation 13) for each ith component of the PICA. In Equation 13 B and ψ are constants, E is the activation energy, ρ0 and ρc are the densities of the virgin and char material. The material density 470 Copyright © 2013 Tech Science Press FDMP, vol.9, no.4, pp.461-484, 2013 ρM has been therefore obtained as the weighted mean of its components (in Equation 14 Γ is the resin volume fraction, A and B represent the resin components and C the carbon Fiberform). These parameters have been set according to [Tran, Johnson, Rasky, Hui, Hsu, Chen, Chen, Paragas, and Kobayash (1997); Williams and Curry (1992)]. ρ −ρ E ∂ ρM,i M,i ci − RTi ρ0i = − Bi e i = A, B,C (13) ∂t ρ0i ρM = Γ · (ρM,A + ρM,B ) + (1 − Γ) · ρM,C (14) Finally, a further term, labeled as φBlow and calculated on the basis of the model reported in [Mohammadiun and Kianifar (2011)], has been considered in the Equation 15, in order to take into account the reduced heat flux acting on the material exposed surface due to the blowing of the ablated PICA. c p · Tw ∂T q˙ = −k = Q˙ cw 1 − φBlow − σ ε · Tw4 (15) ∂ x x=0 Htot It also has to be underlined that, at each time step, the material thickness δ has been decreased by the receded material, as reported in Equation 16. δ (t + dt) = δ (t) − Z t+dt s(τ) ˙ dτ (16) t Figure 4: Comparison between the experimental temperature profiles obtained for a test case [Covington (2004)] and numerical profiles from DIAS and FIAT code Aerothermal Analysis of a Sample-Return Reentry Capsule 471 The validation of the just presented model is shown in Figure 4. Experimental results reported in literature for a test case realized in an arc-jet facility [Covington (2004)] have been compared with the outcomes of the “FIAT” code [Covington (2004)] and of the previously discussed model (labeled as “DIAS”). The validation shows a satisfactory agreement between the compared analyses. 3 Reentry trajectory evaluation The reentry trajectory has been obtained numerically integrating Equations 1, taking advantage of the Euler’s method. On the basis of the computed reentry corridor, obtained imposing the maximum mechanical and thermal loads reported in Table 2, a flight path angle of −8.5◦ and a constant ballistic parameter of 65kg/m2 have been assumed. The assumption of a constant ballistic parameter is due to the fact that the drag coefficient, for conventional reentry capsule, is fairly equal to 1 in the layer of atmosphere under 80 km (i.e. the most interesting for the present study). Table 2: Maximum tolerable mechanical and thermal loads Maximum tolerable loads Heat flux Heat load Deceleration Dynamic pressure [MW /m2 ] [MJ/m2 ] [g] [kPa] 15 300 80 800 Initial conditions employed for the reentry trajectory calculation are summarized in Table 3. The initial azimuth angle and latitude have been assumed equal to zero in such a way to compute an equatorial reentry trajectory. Table 3: Initial conditions for reentry trajectories calculation Height [km] Velocity [km/s] Flight-path angle [deg] Initial condition 120 13.1 -8.5 From Figure 5 to Figure 7 some relevant flow parameters variation along the computed reentry path, including the Mach number, the total specific enthalpy, the aerothermal and mechanical loads acting on the capsule, are plotted. In Figure 7 the Detra-Hidalgo model for the convective stagnation point heat flux evaluation has been employed, while Tauber-Sutton correlation has been implemented for radiative heating. Figure 7 shows that the range of selected altitudes 472 Copyright © 2013 Tech Science Press FDMP, vol.9, no.4, pp.461-484, 2013 Figure 5: Mach number variation along reentry trajectory Figure 6: Enthalpy variation along reentry trajectory for CFD calculations (from 80 to 50 km) includes a significant range of mechanical and aerothermal loads. In fact, the stagnation point heat flux monotonically 473 Aerothermal Analysis of a Sample-Return Reentry Capsule Figure 7: Mechanical and aerothermal loads variation along reentry trajectory increases in the range of altitudes between 120 km and 63 km (where the heating peak is observed). In addition, the maximum heat load resulted to be less than 270 MJ/m2 . Mechanical and thermal loads acting on the capsule therefore match all the requirements listed in Table 2. From Figure 7 it is also important to observe that, although the peak for the aerothermodynamic loads is strictly linked to the amount of deceleration, the maximum values for the mechanical and aerothermodynamic loads do not occur at the same altitude. This represents an important requirement for the successful ending of the mission. According to Figure 5, the requested values to set the boundary conditions in CFD simulations are presented in Table 4. Table 4: Boundary and initial condition for CFD simulations Altitude [km] 50 60 70 80 Mach Number 20.46 35.84 43.14 46.24 Pressure [Pa] 79.6 20.5 4.52 0.886 Temperature [k] 271 245 216 198 474 4 Copyright © 2013 Tech Science Press FDMP, vol.9, no.4, pp.461-484, 2013 CFD aerothermodynamic analysis CFD simulations of the flow field around the reentry capsule have been performed assuming as boundary conditions the ones reported in Table 4 and using the numerical models reported in Section 2.4. 4.1 CFD results In Figure 8 and in Figure 9, as examples of computational results obtained, the mass fraction and temperature profiles along the stagnation line, at an altitude of 80km and for a fully-catalytic case, are shown. Figure 8, in particular, further testify why NC heat fluxes, compared to FC ones, can be even 50% lower. In fact, as we can see, the dissociation and ionization phenomena are so developed in the shock layer that the FC condition on the wall leads to a significant increase of the convective heat flux, due to the imposed fully-recombination. Figure 8: Mass Fraction variation along the stagnation line of atomic and ionized species As far as the convective stagnation point heat fluxes evaluation is concerned, at the different altitudes analyzed, direct comparisons between the numerical results and semi-empirical models presented in Section 2.3 have been performed, as plotted in Figure 10. Figure 10 also shows that the Detra-Hidalgo stagnation point heat flux distribution Aerothermal Analysis of a Sample-Return Reentry Capsule 475 Figure 9: Temperature variation along the stagnation line Figure 10: Comparisons between the stagnation point heat flux semi-empirical distributions and CFD results provides the best agreement with the numerical CFD results, when fully-catalytic conditions are assumed, even if, at the altitude of 60 km, in proximity of the peak 476 Copyright © 2013 Tech Science Press FDMP, vol.9, no.4, pp.461-484, 2013 of the heat flux distribution, the biggest discrepancies have been registered. Results are briefly summarized in Table 5, including surface catalyticity effects on computed heat transfer. The maximum percentage difference between peak heat fluxes computed with CFD and Detra-Hidalgo predictions, regarding FC conditions, is in the order of 13%. Finally, the results are in good accordance with the ones found for Mars Pathfinder and Stardust [Dec and Braun (2006)] and for Hayabusa [Winter, McDaniel, Chen, Liu, and Saunders (2011)]. Table 5: Stagnation point heat flux semi-empirical predictions and CFD results H [km] 50 60 70 80 Tauber 3.27 8.06 6.08 3.11 Heat Fluxes [MW /m2] Sutton-Graves Detra-Hidalgo CFD (NC) 3.1 3.46 3.25 7.70 9.19 5.98 5.56 7.07 4.20 2.95 3.63 2.95 CFD (FC) 4.25 10.4 7.80 4.50 The dimensionless heat flux variations have also been analyzed. They are almost coincident at altitudes of 80 and 70 km, while the corresponding normalized variations at altitudes of 60 and 50 km are slightly different, but correspond to a lower surface integral heat flux, due to its reduction on the conical part of the capsule. Nonetheless, it is reasonable to consider the average dimensionless heat flux distribution constant along the reentry trajectory, taking into account the variation of the maximum heat flux along the reentry path on the basis of the formulation provided by Detra and Hidalgo. 4.2 CFD and DSMC analysis comparison In the present work another important target consists in direct comparisons between numerical results coming from continuum CFD and particle DSMC (Direct Simulation Monte Carlo) methods. These two methods are totally different in their approaches to model the strongly non-equilibrium thermo-chemical phenomena generated under highly energetic entry conditions. DSMC method is considered the only numerical method capable of computing flowfields in the range between the continuum and free-molecular regimes. At high altitudes, in fact, it is well known that Navier-Stokes equations fail, because of the air rarefaction, while using a particle-based statistic method, as DSMC, more precise results can be obtained [Ley, Wittmann, and Hallmann (July 2009)]. The DSMC results have been obtained with the DS2V code developed by Bird [Bird (2004)]. The Gupta model is considered for the atmosphere. The ratio be- Aerothermal Analysis of a Sample-Return Reentry Capsule 477 tween the mean collision separation and the mean free path is less than 1 everywhere in the domain, while in the upstream region it is less than 0.2, as suggested by Bird [Bird (2004)]. Figure 11 and Figure 12 show the comparisons between the pressure coefficient and non-dimensional heat flux distributions along the capsule surface, at the altitude of 80 km. Results obtained testify that the two models are in an overall good agreement. This means that CFD continuum method can be used with reasonable results also in relatively rarefied regimes, characterized by a low density. It also has to be underlined that the comparisons between the heat fluxes distributions is particularly satisfactory if compared to the analogous one reported in previous works [Boyd, Trumble, and Wright (2010)]. Further details about DSMC calculations can be found in [Zuppardi, Savino, Boffa, and Carandente (2012)]. Figure 11: Comparison between DSMC and CFD in the evaluation of the pressure coefficient distribution along the surface capsule at the altitude of 80 km 5 Thermal analysis for an ablative heat shield As previously discussed, the heat shield dimensioning for an entry vehicle is a critical issue, in particular for interplanetary missions. 478 Copyright © 2013 Tech Science Press FDMP, vol.9, no.4, pp.461-484, 2013 Figure 12: Comparison between DSMC and CFD in the evaluation of the heat flux distribution along the surface capsule at the altitude of 80 km and for fully-catalytic conditions In the present section a one-dimensional thermal analysis for an ablative PICA heat shield has been carried out on the basis of the numerical model described in Section 2.5. The analysis had been carried out for the stagnation point, assuming the heat flux variation reported in Figure 7 but, due to the different uncertainties of the models implemented, considering a 20% margin for the convective and a 100% margin for the radiative heat flux, respectively. This resulted in a maximum stagnation point heat flux in the order of 16.6 MW /m2 . In addition, the stagnation pressure time profile, useful to take into account the material blowing, has been obtained from the dynamic pressure time history considering a pressure coefficient equal to 2 and neglecting the static pressure contribution. Figure 13 reports the time variation, during the capsule atmospheric reentry, of the bondline temperature, for different values of the PICA initial thickness. If a maximum tolerable temperature of 200◦C is assumed, Figure 13 shows that a PICA layer 4 cm thick is necessary to this scope at the stagnation point. The one-dimensional analysis can be also applied to the entire heat shield dimensioning, properly scaling the stagnation point heat flux by the normalized distribution reported in Figure 12. Aerothermal Analysis of a Sample-Return Reentry Capsule 479 Figure 13: Bondline temperature variation for different values of the PICA starting thickness Figure 14: Material thickness and surface temperature variation along the entry trajectory The material thickness and the surface temperature variations along the flight path are shown in Figure 14. The dashed line shows that the surface temperature increases for the first 40 seconds (up to about 58 km of altitude, where a maximum 480 Copyright © 2013 Tech Science Press FDMP, vol.9, no.4, pp.461-484, 2013 of about 3300◦C is reached) and then, due to both the heat flux reduction along the trajectory and to the high re-radiated flux, it starts to decrease. The solid line, on the other hand, shows the thickness variation for the material, due to its ablation. Basing on the ablation model described in Section 2.5, the recession rate has been considered nonzero for surface temperatures higher than a threshold value (which has been assumed equal to 2000 K for the material under investigation [Dec and Braun (2006)]). The total recession has estimated to be of about 6.4 mm. It has to be specified that the initial material thickness in the stagnation point region is therefore not driven by the total amount of receded material, but by the maximum bondline temperature reached due to the in-depth conduction. 6 Conclusions The main purpose of the present work was to calculate aerothermal loads occurring during an Earth reentry of a sample-return capsule from super orbital speeds. CFD analyses have been performed in four points of the computed reentry trajectory, assuming a possible baseline capsule configuration, both in non-catalytic and in fully-catalytic conditions. Due to the large amount of energy characterizing the atmospheric reentry, dissociation and ionization processes are so developed that the fully-catalytic heat flux at the stagnation point at the altitude of 60 km is about twice the corresponding non-catalytic value. Comparing CFD results at the investigated altitudes with three different semi-empirical models a reasonably agreement with the Detra-Hidalgo correlation was observed. In addition, direct comparisons between a CFD continuum and a DSMC particle method have been considered at an altitude of 80 km. The analysis showed that CFD can be successfully employed not only in continuum regimes, but also in relatively rarefied ones, where particle methods give more precise results. Finally, a one-dimensional thermal analysis for the capsule ablative heat shield has been carried out at the stagnation point, in order to preliminary dimension the material thickness necessary to maintain the bondline temperature below a maximum tolerable value. References Anderson, J. D. (1989): McGraw-Hill. Hypersonic and High Temperature Gas Dynamics. Bird, G. (2004): The ds2v/3v program suite for dsmc calculations. In Capitelli, M.(Ed): Proceedings of the 24th International Symposium on Rarefied Gas Dynamics, Monopoli, Italy. Aerothermal Analysis of a Sample-Return Reentry Capsule 481 Boyd, I.; Trumble, K.; Wright, M. (2010): Modeling of stardust entry at high altitude, part1: Flowfield analysis, nasa ames research center. Journal of Spacecraft and Rockets, vol. 47, no. 5. Brucato, J. R.; Rotundi, A.; Epifani, E. M. (2009): Sample return missions from minor bodies: Achievements, future plan and observational support. Earth, Moon and Planets, vol. 105, no. 2-4. Covington, M. A. (2004): Performance of a light-weight ablative thermal protection material for the stardust mission sample return capsule. In Proceedings of the 2nd International Planetary Probe Workshop, NASA Ames Conference Center, Moffett Field, California USA. Dec, J. A.; Braun, R. D. (2006): An approximate ablative thermal protection system sizing tool for entry system design. In 44th AIAA Aerospace Sciences Meeting and Exhibit, Reno, Nevada. Desai, P. N.; Lyons, D. T.; Tooley, J.; Kangas, J. (2006): Entry, descent, and landing operations analysis for the stardust re-entry capsule. Technical Report 2006-6410, AIAA, 2006. Detra, R. W.; Hidalgo, H. (1961): Generalized heat transfer formulas and graphs for nose cone re-entry into the atmosphere. ARS Journal, vol. 31, pp. 318–321. Evans, J. S.; Jr., C. J. S.; Hubert, P. (1973): Boundary-layer profiles for a entry of a blunt slender body at high altitude. Technical Report TN D-7332, NASA, 1973. Ley, W.; Wittmann, K.; Hallmann, W. (July 2009): Technology. Handbook of Space Milos, F. S.; Chen, Y.; Squire, T. H. (2006): Updated ablation and thermal response program for spacecraft heatshield analysis. In Proceedings of the 17th Thermal and Fluids Analysis Workshop, University of Maryland. Mohammadiun, H.; Kianifar, A. (2011): Numerical modeling of non-charring material ablation with considering chemical reaction effects, mass transfer and surface heat transfer. European Journal of Scientific Research, vol. 54, no. 3, pp. 435–447. Monti, R.; Fumo, M. D. S.; Savino, R. (2005): Thermal shielding of a reentry vehicle by ultra high temperature ceramic materials. Journal of Thermophysics and Heat Transfer, vol. 20, no. 3, pp. 500–506. Monti, R.; Savino, R.; Fumo, M. D. S. (2007): Matching flight conditions on sharp leading edges in plasma wind tunnels. Journal of Thermophysics and Heat Transfer, vol. 21, no. 3, pp. 660–664. 482 Copyright © 2013 Tech Science Press Park, C. (1990): FDMP, vol.9, no.4, pp.461-484, 2013 Nonequilibrium Hypersonic Aerothermodynamics. Wiley. Paterna, D.; Monti, R.; Savino, R.; Esposito, A. (2001): Experimental and numerical investigation of martian atmosphere entry. Journal of Spacecrafts and Rockets, vol. 39, no. 2, pp. 227–236. Savino, R.; Fumo, M. D. S. (2008): Aerothermodynamic study of ultra-high temperature ceramic winglet for atmospheric test. AIAA Journal of Thermophysics and Heat Transfer, vol. 22, no. 4, pp. 669–676. Savino, R.; Paterna, D.; Fumo, M. D. S.; D’Elia, M. (2010): Plasmaradiofrequency interactions around atmospheric reentry vehicles. modelling and arc-jet simulation. The Open Aerospace Engineering Journal, vol. 3, pp. 76–85. Sutton, K.; Graves, R. A. (1971): A general stagnation-point convective-heating equation for arbitrary gas mixtures. Technical Report TR-R-376, NASA, 1971. Tauber, M. E. (1989): A review of high-speed, convective, heat-transfer computation methods. Technical Report Technical Paper 2914, NASA, 1989. Tauber, M. E.; Sutton, K. (1991): Stagnation-point radiative heating relations for earth and mars entries. Journal of Spacecraft, vol. 28, no. 1, pp. 40–42. Tran, H. K. (1994): Development of lightweight ceramic ablators and arc jet test results. Technical Report TM-108798, NASA, 1994. Tran, H. K.; Johnson, C. E.; Rasky, D. J.; Hui, F. C. L.; Hsu, M. T.; Chen, T.; Chen, Y. K.; Paragas, D.; Kobayash, L. (1997): Phenolic impregnated carbon ablators (pica) as thermal protection systems for discovery missions. Technical Report TM-110440, NASA, 1997. Williams, S. D.; Curry, D. M. (1992): Thermal protection materials - thermophysical property data. Technical Report RP-1289, NASA, 1992. Winter, M. W.; McDaniel, R. D.; Chen, Y. K.; Liu, Y.; Saunders, D. (2011): Current status on radiation modeling for the hayabusa re-entry. In Workshop on Re-Entry Emission Signatures V, Brisbane, Australia. Zuppardi, G.; Savino, R.; Boffa, C.; Carandente, V. (2012): Aero-thermodynamic analysis of a sample-return capsule in high altitude re-entry path. In Proceedings of the 28 th International Symposium on Rarefied Gas Dynamics, Zaragoza July. Appendix A: Nomenclature ci mass fraction of the ith specie, [kg/kg] cp material specific heat, [J/(kg · K)] Aerothermal Analysis of a Sample-Return Reentry Capsule f (V ) g tabulated values functions used in Equation 5 gravitational acceleration at the altitude H, [m/s2 ] g0 standard gravitational acceleration, [m/s2 ] k material thermal conductivity, [W /(m · K)] q˙conv stagnation point convective heat flux, [W /m2 ] q˙rad stagnation point radiative heat flux, [W /m2 ] r curvature radius of the trajectory, [m] s˙ ablation rate, [m/s] t time, [s] x spatial coordinate, [m] B ballistic parameter, [kg/m2 ] C atmosphere depending constant used in Equation 5 CD drag coefficient E activation energy, [J] H altitude, [m] Htot K fluid total enthalpy per unit of mass, [J/kg] constant used in Equation 3 derived for a general gas mixture Q∗ heat of ablation, [W · s/kg] Rb base radius, [m] Rn nose radius, [m] R⊕ Earth radius, [m] T surface temperature, [K] V flight velocity, [m/s] γ flight path angle, [rad] 483 484 Copyright © 2013 Tech Science Press FDMP, vol.9, no.4, pp.461-484, 2013 δ material thickness, [m] ε material emissivity λ latitude, [rad] ρ air density, [kg/m3 ] σ Stephan-Boltzmann constant, [W /(m2 · K 4 )] φBLOW blowing parameter used in Equation 15 Γ resine volume fraction, [m3 /m3 ] Λ longitude, [rad] ψ azimuth angle, [rad] Subscripts c char material cw cold wall dis dissociated species hw hot wall ion ionized species m material n direction normal to the wall o virgin material w wall A, B resin components C carbon Fiberform Superscripts a, b exponents used in Equation 5


© Copyright 2026