
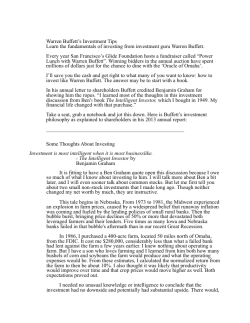
The Value Line Sample Page JoHnSon&JoHnSon 0.95 2.9% 92.00 16.7
The Value Line Sample Page
Value Line’s Ranks—the
rank for Timeliness; the rank
for Safety; the Technical rank.
Beta, the stock’s sensitivity
to fluctuations of the market as
a whole, is included in this box,
but is not a rank. (See Glossary
for Industry rank.)
The Legends box contains
the “cash flow” multiple,
the amounts and dates of
recent stock splits, and
an indication if options
on the stock are traded.
The "Cash Flow" line —
reported earnings plus
depreciation (“cash
flow”) multiplied by
a number selected to
correlate the stock’s 3to 5-year projected target
price, with “cash flow”
projected out over the
same period.
P/E ratio—the
recent price
divided by
the latest six
months’ earnings
per share
plus earnings
estimated for the
next six months.
Recent Price—
see page 2 of
the Summary
& Index for
the date, just
under “Index to
Stocks.”
2
1
4
High:
Low:
Raised 7/26/13
65.9
41.4
59.1
48.1
rECEnt
PriCE
64.3
49.3
lEgEndS
11.0 x ″Cash Flow″ p sh
Relative Price Strength
2-for-1 split 6/01
Options: Yes
Shaded areas indicate recessions
New 7/27/90
70.0
59.8
92.00 P/Eratio 16.7(
)
trailing: 17.2 rElatiVE
Median: 15.0 P/E ratio
69.4
56.7
68.8
59.7
72.8
52.1
65.4
46.3
66.2
56.9
68.1
57.5
Yld 2.9%
0.95 diV’d
72.7
61.7
94.4
70.3
2016-18 ProJECtionS
ann’l total
Price
gain
return
High 110 (+20%)
8%
low
90
(nil)
3%
insider decisions
The record of insider
decisions—decisions by
officers and directors to buy
or sell as reported to the SEC.
1997 1998 1999 2000 2001 2002 2003 2004 2005 2006 2007 2008 2009 2010 2011 2012 2013 2014
Stock purchases/sales by
institutions—the number
of times institutions with
more than $100 million of
assets under management
bought or sold stock during
the past three quarters and
the total number of shares
held by those institutions
at the end of each quarter.
Historical Array—historical
financial data appears in
regular type.
The Capital Structure as
of the indicated recent date
showing, among other things,
the $ amount and % of capital
in long-term debt and preferred
stock.
C u r re n t P o s i t i o n— t o t a l
current assets and total current
liabilities, and their detail.
Annual Rates of Change
(on a compound pershare
basis). Actual for each of the
past 5 and 10 years, estimated
for the next 3 to 5 years.
Quarterly Sales are shown
on a gross basis. Quarterly
earnings on a per-share basis
(estimates in bold type).
Quarterly Dividends Paid
are actual payments. The
total of dividends paid in four
quarters may not equal the
figure shown in the annual
series on dividends declared
in the Historical and Statistical
Arrays. (Sometimes a dividend
declared at the end of the year
will be paid in the first quarter
of the following year.)
o
0
2
1
n
0
1
1
d
0
2
1
J
0
1
0
f
0
1
0
M
0
0
0
institutional decisions
a
0
0
0
target Price range
2016 2017 2018
160
120
100
80
60
50
40
30
Projected stock price in
3 to 5 years. Also, the total
expected % gain/loss before
dividends and the Annual
Total Return (% including
dividends).
S
0
2
2
M
0
0
1
3Q2012
4Q2012
1Q2013
756
752
811
to Buy
to Sell
844
920
843
Hld’s(000)177454118274781887134
% TOT. RETURN 7/13
Percent
shares
traded
9
6
3
8.41
8.80
9.88 10.47 10.83 12.23 14.10 15.94 16.98 18.43 21.51 23.02 22.47 22.49
1.62
1.83
2.03
2.27
2.46
2.85
3.36
3.84
4.25
4.60
5.23
5.70
5.69
5.92
1.21
1.34
1.49
1.70
1.91
2.23
2.70
3.10
3.50
3.76
4.15
4.57
4.63
4.76
.43
.49
.55
.62
.70
.80
.92
1.10
1.28
1.46
1.62
1.80
1.93
2.11
.52
.54
.62
.59
.57
.71
.76
.73
.88
.92
1.04
1.11
.86
.87
4.59
5.06
5.83
6.76
7.95
7.65
9.05 10.71 12.73 13.59 15.25 15.35 18.37 20.66
2690.3 2688.1 2779.4 2781.9 3047.2 2968.3 2968.0 2971.0 2974.5 2893.2 2840.2 2769.2 2754.3 2738.1
24.9
28.1
31.6
26.4
27.2
25.9
19.4
18.1
18.5
16.6
15.4
14.3
12.5
13.1
1.44
1.46
1.80
1.72
1.39
1.41
1.11
.96
.99
.90
.82
.86
.83
.83
1.4%
1.3%
1.2%
1.4%
1.3%
1.4%
1.8%
2.0%
2.0%
2.3%
2.5%
2.8%
3.3%
3.4%
CaPital StruCturE as of 6/30/13
total debt $14,982 mill. due in 5 Yrs $7,400 mill.
lt debt $9,643 mill.
lt interest $425 mill.
(12% of Capital)
leases, uncapitalized Annual rentals $251 mill.
Pension assets-12/12 $17.5 bill. oblig. $21.8 bill.
Preferred Stock None
Common Stock 2,818,073,863 shares
as of 7/26/13
MarKEt CaP: $259 billion (large Cap)
CurrEnt PoSition 2011
2012 6/30/13
($Mill.)
Cash Assets
32261 21089 25129
Receivables
10581 11309 11614
Inventory (FIFO)
6285
7495
7822
Other
5189
6223
6708
Current Assets
54316 46116 51273
Accts Payable
5725
5831
5687
Debt Due
6658
4676
5339
Other
10428 13755 12741
Current Liab.
22811 24262 23767
The stock’s highest and
lowest prices of the year.
ValuE
linE
....
Lowered 8/23/13
BETA .65 (1.00 = Market)
to Buy
options
to Sell
Relative P/E ratio—the
stock’s current P/E divided by
the median P/E for all stocks
under Value Line review.
D iv id en d Yield — cas h
dividends estimated to be
declared in the next 12 months
divided by the recent price.
JoHnSon & JoHnSon nYSE-JnJ
TIMELINESS
SAFETY
TECHNICAL
Trailing and Median
P/E—the first is the
recent price divided
by the sum of reported
earnings for the past 4
quarters; the second is
an average of the price/
earnings ratios over the
past 10 years.
Monthly price ranges of the stock—
plotted on a ratio (logarithmic) grid
to show percentage changes in true
proportion. For example, a ratio chart
equalizes the move of a $10 stock
that rises to $11 with that of a $100
stock that rises to $110. Both have
advanced 10% and over the same
space on a ratio grid.
41862 47348 50514 53324 61095 63747 61897 61587
31.3% 31.6% 30.6% 28.7% 29.4% 29.5% 31.6% 31.4%
1869.0 2124.0 2093.0 2177.0 2777.0 2832.0 2774.0 2939.0
8096.6 9298.0 10545 11133 12085 12949 12906 13279
30.2% 27.6% 24.8% 23.3% 22.1% 23.5% 22.0% 21.1%
19.3% 19.6% 20.9% 20.9% 19.8% 20.3% 20.9% 21.6%
9547.0 13393 18759 3814.0 10108 13525 17810 24235
2955.0 2565.0 2017.0 2014.0 7074.0 8120.0 8223.0 9156.0
26869 31813 37871 39318 43319 42511 50588 56579
27.4% 27.3% 26.5% 27.1% 24.1% 26.0% 22.3% 20.6%
30.1% 29.2% 27.8% 28.3% 27.9% 30.5% 25.5% 23.5%
19.9% 19.0% 17.8% 17.5% 17.1% 18.6% 15.0% 13.2%
34%
35%
36%
38%
39%
39%
41%
44%
23.87 24.19 25.95 27.25
6.25
6.48
7.20
7.60
5.00
5.10
5.46
5.80
2.25
2.40
2.59
2.79
1.06
1.06
1.10
1.10
20.95 23.33 25.75 28.40
2724.4 2778.5 2750.0 2730.0
12.7
13.1 Bold figures are
Value Line
.80
.84
estimates
3.5%
3.6%
65030 67224
32.3% 35.7%
3158.0 3666.0
13867 14345
20.1% 23.1%
21.3% 21.3%
31505 21854
12969 11489
57080 64826
20.2% 19.1%
24.3% 22.1%
13.5% 11.9%
44%
46%
71400
35.8%
4200
15600
23.0%
21.8%
24400
11800
70800
19.0%
22.0%
11.5%
47%
74400
35.8%
4400
16400
23.0%
22.0%
26900
12100
77500
18.5%
21.0%
11.5%
47%
1 yr.
3 yr.
5 yr.
THIS
STOCK
39.6
78.8
61.8
20
15
VL ARITH.*
INDEX
36.4
63.6
92.7
© ValuE linE PuB. llC
Sales per sh a
‘‘Cash flow’’ per sh
Earnings per sh B
div’ds decl’d per sh C■
Cap’l Spending per sh
Book Value per sh d
Common Shs outst’g E
avg ann’l P/E ratio
relative P/E ratio
avg ann’l div’d Yield
Sales ($mill) a
operating Margin
depreciation ($mill)
net Profit ($mill)
income tax rate
net Profit Margin
Working Cap’l ($mill)
long-term debt ($mill)
Shr. Equity ($mill)
return on total Cap’l
return on Shr. Equity
retained to Com Eq
all div’ds to net Prof
16-18
32.45
9.05
7.30
3.45
1.15
37.50
2680.0
13.5
.90
3.5%
87000
36.0%
4700
19600
23.0%
22.5%
35200
13300
100500
17.5%
19.5%
10.5%
47%
BuSinESS: Johnson & Johnson is engaged in the research & development, manufacture, and sale of a broad range of products in
the healthcare field. Has three business segments: Consumer
(baby care, skin care, oral care, wound care, etc.), Pharmaceutical
(antiinfective, antipsychotic, contraceptive, dermatology, gastrointestinal, etc.), and Medical Devices & Diagnostics (electrophysiol-
ogy, circulatory disease management, orthopedic joint reconstruction, etc.). Employs about 128,000. Officers & directors own less
than 1% of common stock; BlackRock, 5.5%; State Street, 5.5%
(3/13 Proxy). Chairman & CEO: Alex Gorsky. Incorporated: NJ. Address: One Johnson & Johnson Plaza, New Brunswick, NJ 08933.
Telephone: 732-524-0400. Internet: www.jnj.com.
Timely shares of Johnson & Johnson
continue to move higher. Investors
annual ratES Past
Past Est’d ’10-’12 have been favoring this issue of late, likely
of change (per sh)
10 Yrs.
5 Yrs.
to ’16-’18
thanks to its stability, predictability, and
Sales
7.5%
4.5%
5.5%
earnings growth prospects. The recent
‘‘Cash Flow’’
9.5%
6.0%
6.5%
Earnings
10.0%
5.5%
6.5%
second-quarter sales and earnings beats
Dividends
12.5%
9.0%
7.5%
added some fuel to fire, too. All told, JNJ
Book Value
11.5%
9.5%
9.5%
stock is up more than 30% since the start
QuartErlY SalES ($ mill.) a
Calfull of the 2013, and the uphill climb has been
endar Mar.Per Jun.Per Sep.Per dec.Per Year surprisingly steady. We continue to recom2010 15631 15330 14982 15644 61587 mend this blue chip to momentum chasers.
2011 16173 16597 16005 16255 65030 The company’s second-quarter per2012 16139 16475 17052 17558 67224 formance was much better than ex2013 17505 17877 17718 18300 71400
2014 18200 18600 18500 19200 74400 pected. Sales were $17.9 billion, up 9%
from a year earlier, as operational growth
EarningS PEr SHarE aB
Calfull of 10% was slightly offset by a 1% drag reendar Mar.Per Jun.Per Sep.Per dec.Per Year
lated to currency translation. The top-line
2010
1.29
1.21
1.23
1.03
4.76 figure was on a par with our estimate, but
2011
1.35
1.28
1.24
1.13
5.00 was roughly $175 million ahead of the con2012
1.37
1.30
1.25
1.19
5.10
2013
1.44
1.48
1.31
1.23
5.46 sensus. J&J also shined on the bottom
2014
1.49
1.47
1.44
1.40
5.80 line, as adjusted share earnings climbed
14%, to $1.48. (GAAP share net nearly triQuartErlY diVidEndS Paid C■
Calfull pled, to $1.30.) Both Value Line and Wall
endar Mar.31 Jun.30 Sep.30 dec.31 Year
Street analysts, on average, were looking
2009 .46
.49
.49
.49
1.93 for adjusted share profits of $1.39. All of
2010 .49
.54
.54
.54
2.11 J&J’s divisions contributed to the positive
2011 .54
.57
.57
.57
2.25 June-quarter performance, including the
2012 .57
.61
.61
.61
2.40
embattled Consumer segment. The Phar2013 .61
.66
.66
maceuticals and Medical Devices & Diagnostics groups both shined, posting doubledigit revenue growth in the period.
We have bolstered our 2013 shareearnings target. Management was
hesitant to raise guidance by a considerable margin, even after putting together
back-to-back strong performances in the
March and June quarters. In fact, the company only increased 2013 share-earnings
guidance from $5.35-$5.45 to $5.40-$5.47.
We were already expecting share net to
come in at $5.43, while most on Wall
Street were looking for $5.41. As a result,
we have added $0.03 to our full-year target, but we actually cut $0.06 from our
second-half estimates. Our top-line call
has been slightly reduced, to $71.4 billion.
This top-quality blue chip is a good
option for both momentum-oriented
and conservative investors, but those
with a longer-term horizon should
probably look elsewhere, for now. The
recent increase in share price has really
discounted this issue’s 3- to 5-year appeal.
The dividend yield is good, however, and
JNJ is as stable as they come.
Erik A. Antonson
August 23, 2013
(a) Years end on last the Sunday in December. d23¢; ’10, 2¢; ’11, d$1.51; ’12, d$1.24¢; ’13,
(B) Diluted earnings. Excludes nonrecurring:
d37¢. Next earnings report due late October.
’98, 22¢; ’99, 2¢; ’01, d7¢; ’02, d7¢; ’03 d30¢; (C) Dividends historically paid: March, June,
’04, d26¢; ’05, d4¢; ’06, d3¢; ’07, d52¢; ’09,
September, and December. ■ Dividend rein-
vestment plan available.
(d) Includes intangibles. In ’12: $51.2 billion,
$18.42 a share.
(E) In millions, adjusted for stock split.
© 2013 Value Line Publishing LLC. All rights reserved. Factual material is obtained from sources believed to be reliable and is provided without warranties of any kind.
THE PUBLISHER IS NOT RESPONSIBLE FOR ANY ERRORS OR OMISSIONS HEREIN. This publication is strictly for subscriber’s own, non-commercial, internal use. No part
of it may be reproduced, resold, stored or transmitted in any printed, electronic or other form, or used for generating or marketing any printed or electronic publication, service or product.
Footnotes explain a number of
things, such as the way earnings are
reported, whether basic or diluted.
Company’s financial Strength
Stock’s Price Stability
Price growth Persistence
Earnings Predictability
A++
100
60
100
To subscribe call 1-800-833-0046.
Target Price Range—the
range in which a stock price
is likely to trade in the 3- to
5-year projection period. Also
shown in the "Projections” box
on the left.
Relative Price Strength
describes the stock’s past
price performance relative to
the Value Line (Arithmetic)
Average of approximately
1,700 stocks. (A rising line
indicates the stock price has
been rising more than the Value
Line universe.)
The % Total Return shows
the price appreciation and
dividends of a stock and the
Value Line (Arithmetic) Index
for the past 1, 3, and 5 years.
The percent of shares traded
monthly—the number of
shares traded each month as
a % of the total outstanding.
Statistical Array—Value
Line estimates and projections
appearing in the area on the
right side are in bold italics.
Business Data—a brief
description of the company’s
business and major products,
along with other important data.
Analyst's Commentary—A
300 – 400 word report on recent
developments and prospects –
issued every three months on a
preset schedule. Supplementary
reports are issued when there is
major news.
The expected date of receipt
by subscribers. This is also
referred to as the issue date.
Value Line’s Indexes of
Financial Strength, Stock’s
Price Stability, Price Growth
Persistence, and Earnings
Predictability. (See Glossary
for definitions.)
Building An Investment Portfolio
Building Your Portfolio
What Value Line Does
By Industry—Timeliness
What You Do
Maintaining Your
Portfolio
TM
Value Line ranks groups in order of their Timeliness.
(Relative performance in the next 12 months). You will
find them listed on the page following the Index to Stocks
section in the Summary & Index.
Read the latest Value Line reports on the top-ranked
industries. Select at least six industry groups shown to
be most timely. See page 1 of the Summary & Index for
the page numbers of these industry reports.
By Stock—TimelinessTM
Value Line ranks approximately 1,700 stocks in five
categories according to their Timeliness. The top 100
stocks are ranked 1 (Highest) for expected relative
performance in the next 12 months; 300 are ranked
2 (Above Average); about 900, 3 (Average); 300, 4
(Below Average); and 100, 5 (Lowest).
Make up a list of those stocks included in your six or
more most timely industry groups that are ranked 1
(Highest) or 2 (Above Average) for performance in
the next 12 months. You will find the latest full-page
report on each stock in Ratings & Reports.
When and if a stock in your portfolio is found to be no
longer a timely investment—that is to say, it has fallen
in rank to 4 or 5 for Timeliness—make that stock a
candidate for sale. (See Post Script and Note at the
bottom of this page.)
Eliminate from this list of timely stocks in timely industries those that fall short of your Safety standard.
These Safety ranks are significant and should not
be ignored.
By Stock—SafetyTM
Value Line also ranks approximately 1,700 stocks
according to their Safety in five categories with 1
(Highest) expected to be least volatile and financially
most strong, and 5 (Lowest) most volatile and least
strong financially.
By Stock—Technical
Value Line also ranks approximately 1,700 stocks
according to their expected price performance relative to the overall market in the next three to six
months, based on a complex analysis of the stock's
relative performance during the prior 52 weeks. Unlike the Timeliness Rank, earnings are not a factor
in the Technical Rank.
Particularly if you are a short-term investor, you
should look at the Technical Ranks and try to limit
purchases to stocks with Technical Ranks of 1 or
2. Under no circumstances, however, should the
Technical Rank replace the Timeliness Rank, which
has a superior record over the years.
Value Line estimates the next 12 months' dividend
yield of each stock based on its most recent price.
The expected yield is updated in the Summary &
Index. Value Line also shows, for comparative purposes, the median yield of all dividend-paying stocks
on the first page of the Summary & Index.
Value Line Reports
If one of your objectives is income, you should
eliminate from your list those that fall short of your
current-income standard. For example, if your
standard is 3%, eliminate stocks that yield less
than 3%. Or if you accept a stock that yields less
than 3%, see to it that other stocks you select yield
enough to bring the average up to 3%.
Value Line reports on each stock and each industry
once every three months, on a preset schedule, in the
Ratings & Reports section. The page numbers on
which the reports appear are shown in the Summary
& Index. When evidence requires, a "Supplementary
Report" is published. The "Supplementary Reports"
appear in the final pages of the Ratings & Reports
section, as well as on our Web site.
Read the latest Value Line reports on the industry
groups and stocks that have qualified according to
all of your standards.
By Stock—Income
When a stock is sold, replace it with another stock
ranked 1 or 2 for Timeliness that also meets your
standards for Safety and current income. It would be
best in the long run to maintain diversification through
at least 15 or more stocks in a variety of different and
diverse industries. (See Note below.)
Make your final selection of stocks from the list that
has been refined through the above procedures. See
to it that you have stock representation in a variety
of different and diverse industry groups.
Selection & Opinion
Value Line's Selection & Opinion section provides
a current appraisal of the economy and of the stock
market. It recommends how much of one's capital
should be invested in common stocks and how much
set aside temporarily in cash reserves. Value Line will
also recommend, as a general strategy, investments
in stocks with lower Betas if we believe that stocks in
general are overvalued in the marketplace.
Post Script: Aggressive accounts may follow a policy of switching out of stocks when they
fall to rank 3 for Timeliness and replacing them with others ranked 1. This strategy,
of course, will result in a higher turnover rate. Tests have shown that, if followed
consistently year in and year out, such a strategy will give an even higher return than
the less aggressive policy of switching only when stocks have fallen to ranks 4 and 5.
Note: There can be no assurance that every one of the 1700 stocks will always perform
in accordance with its rank for Timeliness. But it can be said that a high percentage
have done so in the past and that you place the odds strongly in your favor by keeping your portfolio lined up with the Timeliness Ranks. Note that diversification is
essential to this strategy.
Of the Safety Ranks, it can be said that stocks ranked high for Safety have held up better
than average during significant market declines in the past. In strongly rising markets,
however, high Safety could prove to be a restraining influence upon performance. For
When the Value Line service in its Selection & Opinion section recommends building cash reserves
because the general market seems temporarily to
be too high, sell stocks and invest instead in shortterm government bonds or other safe instruments.
In selling, dispose of stocks ranked 5 or 4 or 3 for
Timeliness, in that order.
example, in the case of two stocks, both ranked 1 (Highest) for Timeliness, the stock
ranked 1 for Safety will tend to go up less than another ranked 5 for Safety during a rising
phase in the market. Conversely, in a down market, the stock with the high Safety Rank
should hold up better than the stock ranked 1 for Timeliness that rated low for Safety.
In the case of well diversified portfolios—those consisting of at least 15 or more stocks in
a variety of different industries—we recommend that risk be controlled by applying
Beta instead of the Safety ranks.
Explanation: In a widely diversified portfolio, the variations in individual stock
prices in response to their individual characteristic risks tend to cancel each
other out, leaving the general market fluctuation as the main influence. The Beta
measures the individual stock's sensitivity to the general market. The Safety Rank,
on the other hand, is a measure of the stock's total risk, i.e., sensitivity to the market
plus sensitivity to all other factors affecting the individual stock's price.
© 2013 by The Value Line Investment Survey.
Published by Value Line Publishing LLC, 485 Lexington Avenue, New York, NY 10017-2630; 212-907-1500; 800-634-3583. www.valueline.com
1308009


© Copyright 2026