
Computer Use and Attitudes for A Sample of Canterbury, New
Computer Use and Attitudes for
A Sample of Canterbury, New
Zealand Dairy Farmers
Jorge Alvarez and Peter Nuthall
Research Report 03/2001
July 2001
Farm and Horticultural Management Group
Applied Management and Computing Division
Lincoln University
ISSN 1174-8796
Farm and Horticultural Management Group
The Farm and Horticultural Management Group comprises staff of the Applied Management and
Computing Division at Lincoln University whose research and teaching interests are in applied and
theoretical management and systems analysis in primary production.
The group teaches subjects leading to agricultural/horticulturalcommerce and science degrees, though the
courses offered also contribute to other degrees.
The group is strongly involved in postgraduate teaching leading to honours, masters and PhD degrees.
Research interests are in systems modelling, analysis and simulation, decision theory, agnbusiness and
industry analysis, business strategies, employment relations and labour management, financial
management, information and decision systems, rural development and also risk perceptions and
management.
Research Reports
Every paper appearing in this series has undergone editorial review within the group. The editorial panel is
selected by an editor who is appointed by the Chair of the Applied Management and Computing Division
Research Committee.
The views expressed in this paper are not necessarily the same as those held by members of the editorial
panel, nor of the Group, Division or University. The accuracy of the information presented in this paper is
the sole responsibility of the authors.
Copyright
Copyright remains with the authors. Unless otherwise stated permission to copy for research or teaching
purposes is granted on the condition that the authors and the series are given due acknowledgement.
Reproduction in any form for purposes other than research or teaching is forbidden unless prior written
permission has been obtained from the authors.
Correspondence
This paper represents work to date and may not necessarily form the basis for the authors' final conclusions
relating to this topic. It is likely, however, that the paper will appear in some form in a journal or in
conference proceedings in the future. The authors would be pleased to receive correspondence in
connection with any of the issues raised in this paper. Please contact the authors either by email or by
writing to the address below.
Any correspondence concerning the series should be sent to:
The Editor
Farm and Horticultural Management Group
Applied Management and Computing Division
PO Box 84
Lincoln University
Canterbury
NEW ZEALAND
Email: [email protected]
Abstract
With the objective of collecting data for assessing research hypotheses about
information management, a mail survey was carried out on Canterbury dairy farmers
between July and August of 2000. From a total of 537 questionnaires sent, 300 were
received, resulting in 290 usable responses. This report describes the average farm,
farm sizes, the manager's dairy farming experience and age, tenancy, educatibn,
management teams, non-family people giving a reasonable input into farm decision
making, farm office equipment used, computer use, software utilisation, information
sources, internet use, farmer goals, and farmer opinions about information
management. While almost three quarters of the farmers own a computer, 61% are
using computerised systems to manage farm information. Financial management
was the most common use of computers with 54.48% of the farmers using them in
this way, followed by the livestock area with 35.17%, while only 16.9% of the farmers
were using software to support their feed management. Farmers using computerised
systems were younger, more educated, and more profit oriented than non-users.
This group managed bigger farms, they have been farming less time both in
Canterbury and in total, and they also used farm advisers more extensively in their
decision making, and they spent more time doing office work.
Contents
Abstract ...............................................................................................................- 2
Tables .................................................................................................................. 4
.....................................................................................................6
2. SURVEY RESULTS................................................................................................
7
1. INTRODUCTION
2.1 THEAVERAGE FARM .........................................................................................
7
2.2 FARM
SIZE ...........................................................................................................
7
2.3 DAIRYFARMING EXPERIENCE AND AGE ...................................................................8
2.4 TENANCY
...........................................................................................................
10
2.5 EDUCATION
...................................................................................................... 11
2.6 MANAGEMENT
TEAM ...........................................................................................
12
2.7 NON-FAMILY
PEOPLE WHO GIVE A REASONABLE INPUT INTO FARM DECISION MAKING.13
2.8 FARM
INFORMATION MANAGEMENT .......................................................................
14
2.8.1 Financial recording system (FRS) ............................................................. 14
2.8.2 Feed (pasture) recording and management system (Feed RS) ................ 15
2.8.3 Livestock recording and management system (LSRS)..............................16
2.8.4 GST returns...............................................................................................17
2.9 THEFARM OFFICE ...............................................................................................
18
2.9.1 Office work ................................................................................................ 18
2.9.2 Office equipment .......................................................................................18
2.1 0 COMPUTER
USE ...............................................................................................
19
2.1 1 SOFTWARE
UTILISATION ...................................................................................
-20
2.1 2 INFORMATION
SOURCES ....................................................................................
20
2.1 3 INTERNET
......................................................................................................21
2.14 FARMER
GOALS ................................................................................................
21
2.1 5 FARMER
OPINIONS ABOUT THEIR INFORMATION MANAGEMENT ..............................22
3 FACTORS ASSOCIATED WITH FARMER'S COMPUTER UPTAKE AND
COMPUTERISED INFORMATION SYSTEM (CIS) USE
..........................................28
3.1 HERDSIZE, COMPUTER UPTAKE AND CIS USE.......................................................28
3.2 FARMER
AGE, COMPUTER UPTAKE AND CIS USE ...................................................29
3.3 EDUCATION,
COMPUTER UPTAKE AND CIS USE .....................................................
30
3.3.1 Farmer education .....................................................................................-30
3.3.2 Spouse and child education, computer ownership and CIS use ...............31
3.4 ~NVOLVEMENTOF NON-FAMILY PEOPLE, COMPUTER OWNERSHIP AND CIS USE ........32
3.4.1 Adviser .....................................................................................................-32
3.4.2 Accountant ................................................................................................32
3.5 ~NFORMAT~ON
SOURCES, COMPUTER OWNERSHIP AND CIS USE .......................... -33
3.6 FARMER
GOALS ..................................................................................................
33
4 SUMMARY .............................................................................................................
34
4.1 MAINFINDINGS FROM THE SURVEY .......................................................................
34
4.2 COMPUTER
UPTAKE AND COMPUTERISED INFORMATION SYSTEM USE ......................35
Farm ..................................................................................................................-36
Farmer................................................................................................................36
Management .....................................................................................................-36
.......................................................................................................37
5 REFERENCES
.
.
W
6 APPENDIXES
....... ..38
6.1 APPENDIX1 : MAILQUESTIONNAIRE .........................
6.2APPENDIX
2:FEEDSOURCES ..................................r.cp~jTg351.;zy;~p~
I!
J? .:. :. . . -...
.........../...44
~ - ~ 2 t ~ ~ 2 ~ ~ .~f ...
t 46
~ ~
6.3APPENDIX
3:AGEAND ADVISER INVOLVEMENT.....................
6.4APPENDIX
4:AGEAND ACCOUNTANT
INVOLVEMENT .............................
G:....47
6.5APPENDIX
5: LAWYER
AND FRIEND~NEIGHBOUR
INVOLVEMENT .............................. 48
Tables
Table 1 .1 Herd size distribution ...................................................................................6
Table 2.1 Average Canterbury dairy farm ......................
.
.........................................7
Table 2.2 Feed sources used ......................................................................................
7
Table 2.3 Farm size groups .........................................................................................8
Table 2.4Stocking and replacement rate and farm size..............................................8
Table 2.5 Farmers' dairy farming experience ..............................................................
8
Table 2.6 Percentage of farmers according their dairy farming experience in
9
Canterbury, and in total (290responses) .............................................................
Table 2.7Average difference between total and Canterbury dairy farming experience
(years) .....................
........ .,................................................................................9
Table 2.8Average age of farmers according their dairy farming experience in
Canterbury, and in total ......................................................................................I0
Table 2.9Tenancy, age and herd size ......................................................................l 1
Table 2.10 Education .........................
................................................................1 1
Table 2.11 Management team and age .....................................................................12
Table 2.12Management involvement by Non-family members .................................13
Table 2.13Financial recording system ......................................................................14
Table 2.14 Range of computerised financial recording system ................................ l5
Table 2.15 Feed recording and management system used by farmers ....................15
Table 2.16 Range of computerised feed recording and management system ...........16
Table 2.17 Livestock recording and management systems ............
.....................16
Table 2.18 Range of computerised livestock recording and management systems ..l7
Table 2.19Percentage of farmers, age and herd size related to the person doing the
.
.
........................................................................17
GST returns.........................
Table 2.20Office work ...............................................................................................
18
Table 2.21 Office equipment .................................
.
...............................................
18
Table 2.22Main computer user .............................................................................. 19
Table 2.23 Computer user experience, uses and use time ....................................... 19
Table 2.24Computer use routine ..............................................................................
19
Table 2.25 Types of software used ...........................................................................20
Table 2.26 Information sources .................................................................................
20
Table 2.27 lnternet use .............................................................................................
21
Table 2.28 Importance of farmer goals: percentage of farmers in each category......22
Table 2.29Answers to the question "Any ideas or suggestions about what is wrong
with your current informationldecisionsystem?" ................................................24
Table 2.30Answers to the question "Any ideas or suggestions as to what newlbetter
information/decisionsystem you would like?" .................................................. 26
Table 2.31 Answers to the question What new things, if any, have you done in the
last 3 years to improve the information you have for making decisions? (for
~
e
l
T
!
example. you have started using a new diary. or you have purchased a
computer. subscribed to a new magazine...). ....................................................27
Table 3.1 Computer ownership and herd size ...........................................................28
Table 3.2 CIS use and herd size ...............................................................................28
Table 3.3 Farmer's age distribution ...........................................................................29
.....................29
Table 3.4 Farmer's age, computer uptake and CIS use .....................
Table 3.5 Age and education................................................................................... 30
Table 3.6 Farmer education, computer uptake and CIS use ................................... 30
Table 3.7 Spouse education and computer uptake ................................................. 31
Table 3.8 Children education and computer uptake ..................................................31
Table 3.9 Adviser involvement, computer ownership and CIS use............................32
Table 3.1 0 Accountant involvement, computer ownership and CIS use ....................32
Table 4.1 Type of information system use by dairy farmer -percentage use by
column................................................................................................................
34
Table 4.2 Statistical tests values for factors affecting computer uptake and CIS use36
Table A.l Feed resources of farms with less than 150 cows .....................................44
............ 44
Table A.2 Feed resources of farms from 150 to 299 cows .....................
........
.....44
Table A.3 Feed resources of farms from 300 to 449 cows ...................
.
......45
Table A.4 Feed resources of farms from 450 to 599 cows ............................
Table A.5 Feed resources of farms from 600 to 899 cows ........................................45
Table A.6 Feed resources of farms with more than 900 cows ...................................45
46
Table A.7 Age and adviser involvement ....................................................................
46
Table A.8 Herd size and adviser involvement ........................................................
Table A.9 Education and adviser involvement...........................................................46
47
Table A.10 Age and accountant involvement ............................................................
47
Table A.1 1 Herd size and accountant involvement ...................................................
Table A .12 Education and accountant involvement.................... ............................. 47
Table A.13 Lawyer involvement, computer uptake and CIS use ...............................48
Table A.14 Friendlneighbour involvement, computer uptake and CIS use................48
1. Introduction
As part of a PhD thesis' a mail survey of Canterbury dairy farmers was carried out.
The purpose of the survey was to collect part of the data needed to assess some
research hypotheses related to farmer adoption, and the usefulness of computerised
information systems. The aims of this paper are to present some of the data and
provide a discussion relative to the research topic.
A survey questionnaire was sent to 537 dairy farmers whose farms are located in
Canterbury, New zealand*. From these, there were returned 290 usable responses.
This represents a good response rate according to Lincoln University-Farm
Management Group mail survey history3.
The original farmer database included the number of cows on each farm. This
variable was used to compare the population (537 dairy farmers) with the 290
answers. Table 1 shows the percentages of different herd size groups for both the
population and the sample.
Table 1.1 Herd size distribution
Herd class (cows) Population (537
Responses Difference
Canterbury dairy farms) % (290) %
Less than 150
10.18%
3.26%
13.44%
I More than 899
8.89%
1
10.18% 1
-1.28%
*
1
Chi-square=3.9 p>50%
The Chi-square test indicates that the differences are not significant. However, it
seems that farmers with large herds had a greater response rate than small herd
farmers.
The questionnaire covered six sections -General, Farm information management,
Farm office, Computer usage, Information sources and Manager. A copy of the
questionnaire is given as appendix 1.
The data is presented following the original order.
1
Research project: A study of factors affecting the adoption and usefulness of information system innovations:
the case of Canterbury and Uruguayan dairy farmers
2 Livestock Improvement Corporation provided this original list on June of 2000.
Nuthall, P. (2000), pers corn.
2. Survey results
2.1 The average farm
Table 2.1 presents a group of statistics that describe the average Canterbury dairy
farm.
Table 2.1 Average Canterbury dairy farm
I Effective area / Cows
(hectares)
(head)
Average
167
Std Dev.
123
Median
140
Mode
150
Maximum
1050
Minimum
30
I Heifers
I Calves
(head)
478
374
400
500
2850
46
(head)
111
92
95
100
700
0
132
109
104
100
900
10
The average farm is a little larger than the model used by the Ministry of Agriculture
and Forestry for the Farm Monitoring report. Their Canterbury dairy farm has an
effective area of 155 hectares, 440 cows and 100 heifers4.
The farm effective area provides pasture resources for grazing as the largest
component of animal intake. Feedcrops and pasture resources from other areas (a
runoff) usually complement the first feed source. Additionally, some farmers
purchase reserves and other animal meal to complete their cow diet.
Table 2.2 presents the percentages of farms that use additional feed resources and
the average amounts.
1
Table 2.2 Feed sources used
- - - Farms that use:
I Percentage
Feedcrop
Runoff
Purchased feed
* The averages were calculated among farms that
-
-
1 Average amountlfarm*
27%
36 hectares
96 hectares
56%
67%
33,695 dollars
used the extra-feed resource.
Eighty eight percent of the farms complement their effective area grazing resources
with at least one other feed source.
2.2 Farm size
The number of cows, as shown below in Table 2.3, was selected to reflect farm size.
Six farm size classes were developed.
Ministry of Agriculture and Forestry (1999) Farm Monitoring Report: South Central Region.
Table 2.3 Farm size groups
Herd classes
Number
Cowslfarm
Heiferslfarm Calveslfarm
Effective
(average)
(cows)
areajfarm
(average)
(average)
of farms
hectares
(average)
Less than 150
26
59
101
34
30
84
64
150-299
213
65
56
127
104
300-449
358
80
63
450-599
113
175
138
512
54
199
600-899
176
229
693
52
357
More than 899
1364
315
453
26
As Table 2.4 shows the stocking rate increases with the farm and herd size. It
appears Large herd farms are more intensively production oriented. However, the ttest shows that the means are statistically different between the first herd class (less
than 150 cows) and the second (150-299 cows) - t= -1.g08 p=6%, and again
between the first one and the largest class (more than 899) -t=-1 .g02 p=6%.
On the other hand, small herd farms show larger replacement rates. The only
significant differences were between herd class 150-299 cows and herd class 300449 cows -t=-2.312 p= 2.3%. Note, however, that this data does not allow for
purchased feed and run-offs.
I
Table 2.4 Stocking and replacement rate and farm size
Herd classes I Stocking rate
I Replacement rate I Replacement rate
(cows)
(~owslhectare) (~eiferslcow)
(~alveslcow)
Less than 150
1.71
0.26
0.34
0.26
0.30
150-299
2.54
0.22
0.29
300-449
2.82
I More than 899 1
1
3.01
0.23
1
0.26
I
1
2.3 Dairy farming experience and age
Farmers were asked how long they have been dairy farming in the region and in
total. Table 2.5 shows the details.
Table 2.5 Farmers' dairy farming experience
Dairy farming
Dairy farming
Farmer age
I
I years in
I years in total I (years)
Canterbury
Mean
18.9
43.3
13.3
Std Dev.
11.9
12.4
9.6
Median
18.0
43.0
10.0
20.0
Mode
3.0
46.0
60.0
Maximum
23.0
60.0
I Minimum
0.0 I
0.0 1
80.0
1
I
1
1
I
1
On average, farmers have been (dairy) farming almost 19 years, 6 out of the region,
and 13 in Canterbury. The dairy farming experience variable has been grouped into
four classes. The first includes what might be called the developing stage of a dairy
farm, that is less than 5 years of experience. The second involves the consolidation
stage, involving farmers dairy farming from 5 to 10 years and the third involves
farmers from 10 to 30 years, which might be called a consolidated stage, and finally,
a fourth class includes farmers with more than 30 years of dairy farming, which could
be called exit stage of dairy farming. This grouping might be incorrect in that the predairying history for the existing owners is not known.
Table 2.6 shows the number of farmers that result from combining both Canterbury
and total experience variables.
Table 2.6 Percentage of farmers according their dairy farming experience in
Canterbury, and in total (290 responses)
Percentage of farmers
Dairy farming in Canterbury
Dairy farming in total Less than Between 5 Between 10 More than Total
5 years
and 10
and 30
30 years
years
years
Less than 5 years
8.28%
0.00%
0.00%
0.00%
8.28%
Between 5 and 10
9.31%
6.90%
0.00% 16.21%
0.00%
years
Between 10 and 30
15.86%
6.55%
0.00% 56.21%
33.79%
years
More than 30 years
2.41%
0.34%
14.48% 19.31%
2.07%
Total
16.21%
33.45%
14.48% 100.00%
35.86%
Chi-square=684 ~ ~ 0 . 1 %
Farmers who have more years of dairy farming in total than in Canterbury have
clearly started their activities in other regions. At the developing stage, from a
total of 97 farmers, only 24 farmers seem to have started their operations in
Canterbury. On the other hand, some farmers with more than 30 years of dairy
farming in total started their business in the region.
Table 2.7 Average difference between total and Canterbury dairy farming experience
(years)
Dairy farming in Canterbury
Dairy farming in total Less than Between 5 Between 10 More than Overall
and 10
5 years
and 30
30 years average
years
years
difference
Less than 5 years
0.1
0.1
Between 5 and 10
4.7
0.4
2.2
years
Between 10 and 30
14.1
8.7
2.9
6.7
years
24.0
More than 30 years
32.2
21.5
1.3
7.7
Overall average
10.0
4.3
4.0
1.3
5.6
difference
Table 2.7 shows that farmers with less than 5 years of dairy farming in Canterbury
have started, on average, dairy farming 10 years before, those between 5 and 30
years of dairy farming in the region have started 4 years before, and those with more
than 30 years in Canterbury have largely started in the region.
In the eighties, dairy farmers from the North Island came to Canterbury to start new
dairy farms to take advantage of lower land prices.
The next table shows the average age of each subgroup of farmers that have been
counted in the former table.
Table 2.8 Average age of farmers according their dairy farming experience in
Canterbury, and in total
Dairy farming in Canterbury
Dairy farming in
Less than Between 5 Between 10 More than Overall
5 years
average
and 10 years and 30
30 years
total
years
age (yrs)
Less than 5 years
48ab
48
Between 5 and 10
34ab
35
35
years
42
Between 10 and
38
43a
40a
30 years
More than 30 years .
55
51
54
56
Overall average
43
41
36
44
56
age (yrs)
Notes: "a" means statistical difference between one average and the following, "b"
%;
means statistical difference between one figure and the next. t-test=6.48 ~ ~ 0 . 1 ttest=4.32 ~ ~ 0 . 1 %
t-test=-3.22
;
p=0.2%; t-test=7.39 ~ ~ 0 . 1 %
t-test=-5.516
;
pc0.1%,
and t-test=-2.87 p=0.5% (top-botton,left-right).
It is interesting to note that farmers who started developing their dairy farms in
Canterbury without coming from other regions are relatively older than those who
came from outside. Within this group of 24 farmers (with less than 5 years of dairy
farming in Canterbury), more than a half are 45 or more years old,It-is-likely-thatthese were sheep and crop farmers who decided to complement, or change, their
former farming to dairying.
2.4 Tenancy
Farmers were asked to define themselves as either owner, sharemilker (50150 type)
or contract milker (other than 50150 type). The next table shows that 59% of farmers
identified themselves as owners while 22% as sharemilkers.
On average, sharemilkers (50150) are 10 years younger than owners, and they
manage larger herds. The t-test shows highly significant differences in both cases.
Table 2.9 Tenancy, age and herd size
l~enancy
percentage of l~verageage l~verageherd
farmers
(head)
(years)
58.97%
Owner
41 0**
46*
21.72%
Sharemilker
36*
574**
50150
Sharemilker
0.34%
49
350
c50150
Other
2.41%
35
893
Unknown
44
16.55%
538
Total
100.00%
l
2.5 Education
Farmers were asked their formal education background in five categories: primary or
less, equal or less than 4 years of secondary, more than 4 years of secondary, equal
or less than 2 years of tertiary, and more than 2 years of tertiary. Table 2.1 0 gives the
details.
Table 2.1 0 Education
Education level
Percentage
Number of
Average herd
Average age
farmers
size (head)
4
1.43%
Primary or less
68a
145*
Secondary. Equal
136
48.75%
53b
447**
or less than 4
years
Secondary. More
31
11.11%
424
53c
than 4 years
37
13.26%
Tertiary. Equal or
43
520
less than 2 years
71
Tertiary. More
25.45%
41
571
than 2 years
Total
279
100.00%
a primary or less average age is statistically different from other education levels (ttest=5.195 ~ ~ 0 . 1 %
t-test=4.614
;
pc0.1%; t-test=7.189 ~ ~ 0 . 1 %
t-test=6.799
;
p<0.1%)
b secondary (=c4 yrs) average age is statistically different from both tertiary
t-test=3.495 p=0.1%)
education levels (t-test=4.073 pcO.lO/~;
c secondary (>4 yrs) average age is statistically different from tertiary (=c2 yrs) (ttest=1.828 p=7.2%)
* primary or less average herd size is statistically different from other education levels
(t-test=-1.776 p=7.8%; t-test=-5.770 ~ ~ 0 . 1 %
t-test=-2.246
;
p=3%;t-test=-1.715
p=9.1%)
** secondary (=c4 yrs) average herd size is statistically different from tertiary (>2 yrs)
(t-test=-2.129 p=3.4%)
More than 60% of the dairy farmers have a secondary level of education, while
almost 40% have tertiary education. The higher the education background, the
younger (on average) the farmers are. Education is correlated with age and has a
Spearman's correlation coefficient of -0.279 (highly significant). Likewise, the higher
the education background, the larger the herd. The Spearman's correlation
coefficient is 0.174 between education and number of cows (highly significant).
2.6 Management team
Farmers were asked to describe whether management responsibilities were
assumed personally, or whether they were shared within the family group. The next
table shows that 19% of respondents state that they carried out the management job
personally. Those who share their management work with their partner or spouse are
in the majority (more than 60%). Almost 3% of farmers stated that they share
decision making with brother(s) and, finally, the other 19% of farmers said that the
whole family carries out the management work. This last group had the older average
age. Couple management teams have the youngest average age, but the differences
are not significant.
The following graph shows that "couple" management teams are common among
sharemilkers. Conversely, owners show higher percentages of "whole family" and
"brothers" management teams than sharemilkers. The chi-square test shows a high
level of significance.
Female participation is more likely to occur in farms that are managed by "couple"
management teams. This issue is discussed later with respect to computer
ownership and computerised information systems use.
Table 2.1 1 Management team and age
Number of farmers Average farmer age
Management team
l-Myself
18.97%
43*
41 **
2-Couple
60.34%
3-FatherIMother and
50
17.93%
SonsIDaughters (FIM and SID)
2.76%
4-BrothersISisters (BIS)
45
(~otal
100 .0o0/01
*farmer "Myself" average age is statistically different from FatherIMother and
SonsIDaughters (t-test=-3.379 p=0.1%)
**farmer "Couple" average age is statistically different from FatherIMother and
SonsIDaughters (t-test=-5.074 ~ ~ 0 . 1 % )
Structure of the management team and tenancy
Owner
Sharemilker 501.50
Managementteam structure
[R 1-Myself E4 2-Couple 03-F/M and S D O 4-BIS
I
See Table 2.11 for definitions
2.7 Non-family people who give a reasonable input into farm decision making
Farmers were asked whether they involved non-family people through asking for
ideas or suggestions as input into their farm decision making. Four types were
suggested: advisers, accountants, lawyers, and friendslneighbours. Four levels of
involvement were suggested: none, a little, quite a lot and heavy involvement.
Table 2.12 Management involvement by Non-family members
Percentage who are involved
A little
Quite a lot
None
Heavy
Adviser
34.83%
28.28%
28.62%
33.45%
16.90%
46.21%
Accountant
Lawver
27.24%
1.03%
I
71.38%
I Friendlneighbour 1
74.48% 1
20.00% 1
4.83% 1
8.28%
3.45%
0.34%
0.69% 1
Advisers and accountants are the main contributors. Both show a similar level of
involvement, but advisers seem to be more intensively involved than accountants.
Lawyers and friendslneighbours are very much less involved.
2.8 Farm information management
2.8.1 Financial recording system (FRS)
Farmers were asked to describe which type of FRS they were using. Five
alternatives were suggested: an informal system (such as memory to record, informal
writing might be used such as notes on calendars, and off-farm printed reports as
backup information), a manual FRS (such as a cash book), a computerised FRS
(software), a combination of manual and computerised FRS, and a system based on
a service that might be provided by an accountant. The farmer was allowed to tick
one or more alternatives. To process this variable the responses were coded in the
following order:
a) If a computerised FRS was involved, the farmer was classified into this group.
b) For the remaining farmers, it they use a "service system", they were classified into
the "service system" group.
c) For those not classified above, if a manual system was used, they were put into
this group.
d) The remaining farmers were put into the "informal FRS" group.
Table 2.13 presents the results. A large majority of Canterbury dairy farmers used a
computerised information system, and 20% of these farmers used a service system.
Table 2.13 Financial recording system
Financial recording Number Percentage of
Total
of
system (FRS)
farmers
54.48%
Com~uterisedFRS
158
Service FRS
56
19.315%
44
Manual FRS
15.1
7%
Informal FRS
11.03%
32
Total
100.00%
290
Farmers who were using computerised FRS were asked to identify which software
package they were using. Table 2.14 presents the results involving seventeen
commercial brands. However, almost 80% of farmers who identified their software
were using one product, with just 5% using the second most important.
Table 2.14 Range of computerised financial recording system
Computerised
FRS
Brand 12
Brand 13
Brand 14
Brand 15
Brand 16
Spreadsheet
Non identified
1
1
1
1
1
4
32
2.8.2 Feed (pasture) recording and management system (Feed RS)
Farmers were asked to describe their Feed RS. Five alternatives were provided.
Systems based on: (i) farmer memory, (ii) on notes in calendars, (iii) a manual
system based on pocket notebooks, farm diary, field record books, or similar, (iv) a
computerised recording scheme, and finally, (v) on an off-farm service. Farmers
could tick one or more alternatives. The answers were coded following a similar
procedure that was described above for the FRS.
Table 2.15 Feed recording and management system used by farmers
Number of
Percentage of Total
farmers
Computerised Feed RS
49
16.90%
Service
40
13.79%
Book
126
43.45%
Calendar
16
5.52%
Memory
59
20.34%
Grand Total
290
100.00%
* See text for an explanation of the categories
Table 2.1 5 shows the results. The majority use a manual device, such as a book or
similar, or a calendar, with only 17% using a computer system. This is in contrast to
the FRS situation. The second largest group are those who solely relied on their
human capacities. A few used an off-farm service. Farmers using computers were
asked to name the software that supported the information management. See table
2.16
Table 2.16 Range of computerised feed recording and management system
Softw'are name
I
Number of users
I
l~rand
2
3
l
L
Brand 4
R
U
I
7
3
1
I
"
I
Brand 6
I
Brand 9
Brand 10
Brand 1 1
Brand 12
Own programme
Spreadsheet
Non identified
1
I
I
1
1
5
17
6
na
Total
Twelve brands of commercial information systems were identified, with 33% using
one product and 14% the second most important brand. An important number of
farmers used spreadsheets to manage feed information. Adding these to those who
said that they used their own programme (which may be developed on a
spreadsheet), this group represents 55% of the farmers who have identified the kind
of software they were using.
2.8.3 Livestock recording and management system (LSRS)
Farmers were also asked to describe their LSRS. The same five alternatives as
offered for Feed RS were given. The next two tables show the results.
Table 2.17 Livestock recording and management systems
Number of
Percentage of Total
farmers
Computerised
1 02
35.17%
LSRS
Service
66
22.76%
Book
118
40.69%
Calendar
I
1
0.34%
-
.
I
~ n Total
d
I
3
1.03%
Table 2.1 8 Range of computerised livestock recording and management systems
Software name
Number of users
66
Brand 1
Brand 2
16
2
Brand 3
Brand 4
1
1
Own programme
I
S~readsheet
l ~ o identified
n
15
103
Total
The majority of farmers (41%) used a manual system. The next group (35%) are
those that used computerised LSRS. Finally, a third group (23%) managed their
livestock information through an off-farm service.
I
Farmers who used computerised LSRS were asked to identify the software used.
Table 2.1 8 shows the results. The majority of these farmers (76%) that identified their
software used one commercial product. The second most important product was
used by 18% of these farmers.
2.8.4 GST returns
Farmers were asked to identify the person responsible for doing the GST returns.
Table 2.1 9 shows the results.
Table 2.1 9 Percentage of farmers, age and herd size related to the person doing
- the
GST returns
Number / Percentage / Average farmer I Average herd
of farmers of farmers
age (years)*
(head)**
82
28.28%
44
Accountant
510
Farmer
94
32.41%
44
430
SpouseIPartner
94
42
32.41 %
458
3
SonIDaughter
1.03%
50
28 1
Other
4.48%
41
13
844
4
None mentioned
42
1.38%
368
*Chi-square=I 65 pc001%; **Chi-square=156 p<001%.
I
Approximately one third of GST returns are completed by accountants, similarly for
spouses and farmers. Those who pay an accountant or ask an employee have larger
herds.
2.9 The farm office
2.9.1 Office work
Farmers were asked the proportion of their total work devoted to management tasks
and how many hours they spent doing office work per week. Table 2.20 shows the
results.
Table 2.20 Office work
Farm office
Management
work (hours
work (% of
total work time) per week)
25.5%
10.5
Mean
20.2%
10.2
Std
7
20%
Median
Mode
10%
10
95%
Maximum
60
1 Minimum
0% I
01
On average farmers spent a quarter of their time on management work. This appears
to represent 10.5 hours per week. At the same time, notice that some farmers did not
perform any formal management work and others stated that their jobs were largely
all a farm management operation.
2.9.2 Office equipment
Farmers were asked to identify which equipment they used for helping their
management and office work. Table 2.21 presents the results.
I
Table 2.21 Office equipment
Equipment type Fax machine
Telephone answering machine
Cellular phone
Photocopier
Computer
% Owning
89.3%
81 -4%
76.6%
70%
73.8%
1
In addition to this equipment, 10 farmers stated that they used a hand help computer
(palm pilot) and 3 others stated that they used a scanner. Clearly the respondents
farmers are well versed with electronic equipment
The percentage of computer uptake has been increasing since it started to be
measured. Measures in New Zealand started in 1986, when a 5.6% of computer
ownership among New Zealand farmers was reported ( Pryde and McCartin, 1987).
In 1993 the percentage rose to 24.4%(Nuthall and Bishop-Hurley, 1994), and in 1998
a new measurement showed 42.72% of farmers having computers (Nuthall and
Benbow, 1999).
2.1 0 Computer use
Farmers were asked to identify the person who was the main user of the farm
computer. The results are presented in the next table. Clearly, farmer and hislher
partner or spouse are the main operators.
Table 2.22Main computer user
Computer user
Spouse
Farmer
Other familv member
Hired personnel
Other
Does not have a computer
Total
Number of Percentage of
computer
famers
users
95
86
8
2
1
98
290
49.48%
44.79%
4.17%
1.04%
0.52%
Table 2.23shows how long the farm computer user has had a computer, what are
the main uses of the machine and the average time per day that the computer is in
use.
Farmers were also asked to identify their computer use routine. Seven alternatives
were given to answer this question (see annex 1 question 17).Table 2.24presents
the results.
Table 2.23Computer user experience, uses and use time
Computer
user
experience
(years)
Mean
Std
Median
Mode
Maximum
Minimum
7.4
5.2
6.0
10.0
25.0
0.4
Farm
business
(average O/O
of total use)
63.67%
2.01%
70%
80%
1 00%
0%
Learning
and
education
14.76%
1.34%
10%
10%
100%
0%
Leisure/ Commu
personal nication
14.56%
1 .l1%
10%
10%
60%
0%
12.62%
0.91%
10%
10%
80%
0%
Off farm
business
17.28%
2.16%
10%
10%
90%
0%
Table 2.24Computer use routine
l~otal
On rainy days
A reaular ~ e r i o deach month
A regular period each week during daytime
A regular period each week during evenings
In irreaularlv available ware time
Exactly when need arises
Other
U
0.56%
16.67%
1 7.22%1
14.44%
20.00%
30.00%
1 .l 1%
Average
computer
use time
(hourslday)
1.5
1.3
1 .O
1 .O
12.0
0.15
2.1 1 Software utilisation
Farmers were asked to identify the types of software used and the time per month
spent on each type. Table 2.25 shows the results.
Table 2.25 Types of software used
Software category
Average time per
Percentage of
userslcomputer month (hours)*
owners
Word-processor
42.52%
7.5
Financial and accounting recording system
59.81%
9.2
Pasture and cror, record svstem
4.8
14.49%
Livestock record system
39.72%
7.3
Feed budgeting,
14.49%
4.4
Herd testing,
21.03%
4
Integrated farm management package
3.27%
2.3
Other spreadsheet use
14.95%
5.3
Other database use,
2.34%
4.2
lnternet
51.87%
7.3
E-mail
54.67%
4.5
* The average was calculated among those who declared some use.
2.1 2 lnformation sources
Farmers were asked to identify which information sources are used on their farms.
Ten sources were suggested (see annex 1 question 18). Respondents were asked to
use a 1 to 3 scale where 1 means that this source is not used at all, 2 means a little
and 3 means an important use. Table 2.26 contains the results.
Table 2.26 lnformation sources
Information source
Daily newspaper
Farm publications
Commodity newsletter or magazines
Breed journals
Electronic news
Daily farm reports on radio or
television
MAF reports
LIC advisory service publications
Field dayslseminar
Neighboursllocal contacts
An
important
'
1
A little
use
Not used
Nonresponse
27.24%
47.24%
15.17%
9.66%
3.10%
6.55%
56.21%
43.1 0%
46.90%
27.24%
22.76%
40.34%
10.34%
3.10%
25.52%
46.90%
53.45%
38.28%
6.21 %
6.55%
12.41%
16.21%
20.69%
14.83%
6.21%
37.24%
38.28%
20.69%/
39.31%
43.1 0%
40.00%
53.10%1
35.86%
10.69%
9.66%
11.03%)
18.62%
8.97%
12.07%
15.17%/
The main sources of information seems to be farm publications, LIC advisory service
publications and field days or similar events. Secondly, farmers get information from
daily newspapers, neighbours or local contacts and commodity newsletter or
magazines. In last place appears the use of electronic media as a source of
information.
2.13 lnternet
Farmers were asked to identify which types of information or service they obtained
from the internet. From 290 responses, l l1 (38%) and 117 (40%) farmers identified
themselves as internet and e-mail users respectively. Ten types of information were
suggested for helping answering this question (see annex 1 question 19).
Respondents were asked to use a 1 to 3 scale where 1 means that this type of
information or service is used very occasionally, 2 means occasionally and 3 means
frequently. The next table presents the results.
lnternet is mainly used for electronic mail, although significant use is made of the
media to obtain dairy company news. Ordering equipment and supplies and latest
research results appears next. Finally, the other kinds of information or services
show little use.
Table 2.27 lnternet use
Type of information or
service get from internet
E-mail
News and weather
information
Market information
Technical information
Economic information
Updates on changes to
agricultural legislation
Latest research results
Entertainment and fun
Ordering equipment and
supplies
Dairy company news
Frequently
Occasional1 Very
Nonresponse
occasionally
Y
27.93%
16.21%
7.24%
48.62%
2.41%
27.24%
59.66%
10.69%
P
2.76%
3.45%
1.72%
2.41%
7.93%
9.31%
5.86%
12.41%
25.86%
23.45%
27.24%
27.93%
63.45%
63.79%
65.17%
57.24%
3.10%
1.72%
7.24%
15.17%
4.48%
15.52%
21.72%
28.97%
20.00%
60.00%
64.83%
57.24%
16.90%
13.79%
11.72%
57.59%
2.14 Farmer goals
Farmers were asked to rank their goals using seven suggested statements on a 1 to
5 scale where 1 means not important and 5 means very important (see annex 1
question 20). The next table presents the results.
All the goals proposed were ranked highly. The ranking has "enjoying farming" as the
most important goal, with "achieving high profits" second, "to provide an income to
raise farmer's family" third, "farming in a sustainable way" fourth, "achieving high farm
production" and "having a reasonable income and plenty of time to enjoy other
interests" follow with the lowest ranked goal "to be a top farmer".
Table 2.28 Importance of farmer goals: percentage of farmers
Goal\Goal
1 Not
1 A little I Moderately 1 Quite 1
ranking
important importa important
importa
nt
nt
17.24% 25.86%
To be a top
4.83%
4.14O/0
dairy farmer
To achieve
12.76% 22.41 %
1.72%
3.79%
high farm
production
To achieve
1.38%
0.69%
6.55% 14.83%
high profits
4.14% 15.17%
To enjoy
1.03%
0.69%
farming
To provide
4.14%
6.21% 14.48%
1.38%
an income to
raise my
family
1.72%
1.72%
To farm in a
11.03% 28.28%
sustainable
way
1.72%
To have a
12.41% 17.93%
4.83%
reasonable
income and
plenty of time
to enjoy
other
interests
l
l
/
l
l
in each category
Very
1 Non
imp-orta response
nt
6.21OO/
41.72%
/
54.14%
5.17%
72.41%
4.14%
75.52%
3.45%
66.90%
6.90%
52.07%
5.1 7%
57.24%
5.86%
I
2.15 Farmer opinions about their information management
The final three questions gave to farmers were open type ones asking them about
their ideas or suggestion about what is wrong, if anything, with their current
information system; what newlbetter informationldecision system they would like; and
what new things they have done in the last 3 years for improving their information
management (see questions 23,24 and 25 in annex 6.1).
Tables 2.29, 2.30 and 2.31 present the results.
Only 33% of responders (from 290 usable responses) answered question 23. Some
farmers stated more than one idea or suggestion. Each answer of these multiple
responses was considered separately.
Farmers who thought that there was nothing wrong with their current information
systems represent 13.5%. It can be guessed that this percentage is higher because
some farmers who did not answer this question may feel satisfied with their current
information systems. The other responses were grouped into four main explanations,
(i) those related to the farmer himlherself, (ii) those that can be associated with
technicalloperational problems, (iii) those that involve information system off-farm
components, and (iv) those that are components of the on-farm information system.
Each group contained 34.385'4, 5.21%, 9.38% and 37.5%, respectively, of the
farmers.
Within the first group (difficulties that involve the farmer himlherself), the main thing
that farmers identified is their lack of time for improving information management.
Farmers might know what was wrong, or what could be improved, but they have
other priorities to improving a better information system. However, 57% of these
farmers (who stated lack of time as a main constraint) have made changes during the
last 3 years.
The farmers commenting on the information systems themselves were divided into
three categories. One related to specific functions such as recording, storing and
retrieving; a second involved information tools, and finally a category that refers to
the whole information system. Each subgroup counts for 5.21%, 21.88% and 10.42%
respectively.
Within the first category (5.21% of farmers), recording was identified as a major
problem. In the second subgroup some farmers focused on the lack of computers,
and the need for a computer upgrade, as information management constraints. Some
farmers identified problems with available software. Finally, 10.42% of farmers
identified the information problem as a broader one that might be solved by changing
the whole information system.
Table 2.30 presents the results from question 24. This question was answered by
only 20% of the respondents. Again, like question 23, some responses involve more
than one idea/suggestion. Each of these was analysed separately. Answers were
grouped into three categories, (i) those that relate changes to the farmer, (ii) those
that have solutions from on-farm tools, and (iii) those that asked for off-farm
tools/services. Possibly because the way that question 24 was asked (it is not
immediately evident that the farmer is part of the farm information system), very few
farmers focused change on themselves. The other two categories received
approximately 50% each.
Within the second category (solution using on-farm tools), more than 30% of the
responses focused on using a computer to improve information management. The
use of a palm pilot was also suggested. Other farmers focused on the need for better
software, especially for feed budgeting.
Those who proposed changes to off-farm tools/services, requested better local
information, and suggested a web site with relevant information and links to dairy
farmers. Others asked for better consultant services.
Table 2.29 Answers to the question "Any ideas or suggestions about what is wrong
with your current information/decision system?"
Percentage of respondents
It is O.K.
13.54% 13.54%
Farmer related difficulties
3.13%
Enjoy being outside too much
Lack of time
23.96%
Isolation
1.04%
Computer illiterate
3.13%
lnternet illiterate
1-04%
Lack of computer skills
2.08% 34.38%
Technical problems
Problem to access lnternet
Problem receiving LIC data
Unable to record on line information
Off farm components
Conflicting information
lnformation overload
Lack of local information
FMlS
Functions
Lack of recording
Lack of storing
Slow to retrieve information
Tools
Lack of computerisation
Need computer update
Unfriendly software
Unreliable software
Unsuitable software
Irrelevant information from software.
Lack of integration
Too many different systems/packages
General
Problem to use information
lnformation is not always available
Not quick at forecasting trends
Lack of formalisation and /or organisation
Total
Table 2.31 presents the results from question 25. This question was answered by
more than half the respondents. Like the former question, some farmers gave
multiple examples of things done during the last 3 years to improve their information
systems. Each action was treated separately.
Answers were grouped into four categories, (i) those that focused on improving
farmer information management skills (1.42%), (ii) those that upgraded farm office
capabilities (51.88%), (iii) those that involved a change in the information system
(17.45%), and finally (iv) those that addressed new, or greater access to information
(29.25%).
Very few farmers stated that they had learned how to use a computer, however farm
office upgrades mainly involved having a computer, or upgrading it. This
improvement is usually associated with a software purchase or upgrade. Some
farmers introduced the use of palm pilots and other office devices such as fax and
answering machines.
Some farmers said that they reorganised their entire information system, others
focused on the recording function, introducing the use of tools such as a pasture
probe, diary and cashbook.
Farmers who addressed new information sources focused on employing farm
consultants, taking part in discussion groups, more reading, especially farm
publications and the use of internet, as well as participating in field days and
seminars.
Table 2.30Answers to the question "Any ideas or suggestions as to what new/better
information/decision system you would like?"
Percentage of respondents
Farmer information management skills
1.61%
A shift from reactive to proactive decision making
1.61%
3.23%
Always have an open mind, read, listen and develop
ideas
On farm tools
More use of computer
29.03%
1.61%
Better use of computer
4.84% 35.48%
Tools like palm pilot that can be use in the paddocks
Better software
8.06%
Feed budgeting
1.61%
Herd management
1.61%
lrrigation management
1.61% 12.90%
Accounting
Off farm tools/services
1.61%
Better use of radio programmes
1.61%
Channel information through Dairy Co.
Local information
1 1.29%
Employ a consultant
3.23%
6.45%
Better adviser service
Improve farm publications
1.61%
8.06%
Web site with relevant information
More oversea information
1.61%
Access to top farmers
3.23%
Better climate information
3.23%
1.61%
Improve research information presentation
1.61%
Information suitable for small dairy farm
Meeting with scientists
1.61%
More use of research
1.61% 48.39%
Total
62
1 00.OO0/~
Table 2.31 Answers to the question What new things, if any, have you done in the
last 3 years to improve the information you have for making decisions? (for example,
you have started using a new diary, or you have purchased a computer, subscribed
to a new magazine...).
Percentage of respondents
Farmer information management skills
Learn to use computer
1.42%
1.42%
Office
Computerisation
Computer purchase/update/upgrade/use
28.77%
Software purchaseluse/upgrade
16.04%
Palm Pilot
3.77% 48.58%
Other machines
Answering machine
0.94%
Fax
2.36%
3.30%
Reorganise FMlS
reorganise farm information system
2.83%
2.83%
Other changes
Staff meetings
0.47%
Employ staff
0.47%
More use of budgets
0.47%
Register with LIC
0.47%
E-mail
3.30%
E-banking
2.83%
8.02%
lmprove recording
Improve recording
1-89%
Pasture probe
2.36%
Diary
1.89%
Cashbook
0.47%
6.60%
Information sources
Read more
2.83%
Employ farm consultant/specialist
7.08%
Disscusion group1 listen to colleagues
3.30%
lnternet
8.49%
2.36%
Field dayslseminar
Newspaper
0.47%
Journal
0.47%
Farm publication
3.30%
Computer magazine
0.94% 29.25%
Total
3 Factors associated with farmer's computer uptake and computerised
information system (CIS) use
This research is concerned with farmer use of computers and computerised
information systems (CIS) to manage farm information. According to the data
collected, 73.8% of the farmers have a farm computer and 60.7% use at least one
kind of computerised information system. Farmers' information systems were divided
into three areas: finance (54.5%), feed and pasture (16.9%), and livestock (35.2%).
Only 11-4% of respondents had a completely computerised information system, that
is, using some software to support their information management in all three areas.
While it is necessary to own a computer to use any CIS, the reverse it is not true.
Thirteen percent have computers but they use other non-computerised systems for
their information management.
3.1 Herd size, computer uptake and CIS use
Table 3.1 presents the relationship between the size of the herd (as a farm size
measure) and farmer computer adoption. There is a clear association between both
variables, the larger the herd the higher the percentage of computer uptake. The ttest is significant.
Table 3.2 shows the relationship between the herd size and the use of at least one
CIS. This variable shows a similar clear association with herd size, the larger the
herd the higher the percentage of CIS use. The t-test is highly significant.
Table 3.1 Computer ownership and herd size
h e r d size (cows) 1% with com~uterl
More than 899
80.77%
Table 3.2 CIS use and herd size
[ ~ e r size
d (cows) 1% that use at
least one CIS
Less than 150
26.67%
150-299
49.23%
300-449
65.08%
450-599
66.67%
600-899
76.92%
More than 899
73.08%
. -
There are at least two possible explanations that support this positive association
between herd size and CIS use. Firstly, the extra income from using computer
technology increases with the scale of the dairy operation, particularly, where the
technology is not easily divisible, as it is the case with computer and software. This
fact may be related to the second explanation that there is a minimum critical time
input needed to take advantage of a computer system. Large farms may have
farmers more management oriented and therefore prepared to devote time to
computer use.
3.2 Farmer age, computer uptake and CIS use
For analysis purposes the farmers' age was grouped into seven classes. The next
table shows the age classes, the number of farmers that each includes and the
percentage over the total.
Table 3.3 Farmer's aae distribution
Farmer age (years) Average
Number of Percentage
age (years) farmers
Less than 30
27
17
6.07%
Between 30 to 34
32
32
11.43%
Between 40 to 44
Between 45 to 49
Between 50 to 59
More than 59
42
47
53
65
59
50
49
18
21.07%
17.86%
17.50%
6.43%
Table 3.4 shows the relationship between the farmer's age, computer uptake and
CIS use.
Table 3.4 Farmer's age, computer uptake and CIS use
Farmer's age
% with computer* % that use at least
one CIS**
(years)
Less than 30
70.59%
70.59%
Between 30 to 34
75.00%
71.88%
Between 35 to 39
76.36%
65.45%
Between 40 to 44
76.27%
66.10%
Between 50 to 59
More than 59
65.31%
50.00%
48.98%
27.78%
While the relationship between farmer age and computer ownership does not seem
so strong, farmer age and CIS are strongly related. The t-tests were non significant
and highly significant respectively. The younger the farmer the higher the percentage
of CIS use.
Personal computers became available by the eighties, and they became relatively
cheaper by the nineties. People, as they get older, may progressively lose learning
capability. Younger people are more likely to change and start new things, however,
availability and cost must also be considered.
3.3 Education, computer uptake and CIS use
3.3.1 Farmer education
As was discussed earlier there is a relationship between farmer age and education
(see pages 5 and 6). The younger the farmer the more educated. However, as each
farmer age class is considered, there is some variability in education levels. The next
table presents the relationship between farmer age classes and education levels.
Table 3.5 Age and education
Education level (percentage within each age class)
Farmer age
Primary I~econdar
/secondary I~ertiaryl~ertiary/ ~ o t a l
or
less
<=2yrs >2yrs
y <=4yrs Ayrs
lyears)
Less than 30
0.00% 18.75%
12.50% 31.25% 37.50% 100.00%
6.45%1 16.13%1 41.94%( 1O0.OO0/c
Between 30 to 34 1 0.00%1 35.48%1
Between 35 to 39 1 0.00%1 50.00%/
15.38%1 17.31%/ 17.31%l 1OO.OOO/c
Between 40 to 44 1 0.00~/0( 42.37%/
11.860/0/ 16.95%/ 28.81%l 100.00%\
Between 45 to 49 1 0.00%1 46.94%1
10.20%/ 10.20%/ 32.65%) 100.00%1
Between 50 to 59 1 2.13%) 68.09%)
4.26%/ 4.26%) 21.28%) 100.00%1
More than 59
20.00% 60.00%
20.00%1 0.00% 0.00% 100.00%
Total of each
1.49% 47.96%
10.78% 13.38% 26.39% 1O0.OO0/~
education level
Chi-square=37.991 p=9.9%
The next table shows the relationship between farmer education and computer
uptake and CIS use.
Table 3.6 Farmer education, computer uptake and CIS use
Farmer education, computer uptake and CIS use
Education level
1% with
1% that use at least
computer*
one CIS**
Primary or less
0.00%
25.00%
71.32%
53.68%
ISecondarv. More than 4 vears
I
83.87%/
67.74%)
ITertiarv. Eaual or less than 2 vears
I
70.27%/
59.46%1
I~ertiaty.More than 2 years
83.10%1
78.87%1
Mann-Whitney U-test=-2.149 p=3.2%;**Mann-Whitney U-test=-3.829 p<0.1%
1
1
1
Education shows a stronger relationship with CIS use compared with computer
ownership. Mann-Whitney U-tests were significant and highly significant for
education and computer uptake and for education and CIS use respectively. The
more educated the farmer, the higher percentage of computer uptake and CIS use.
There are possible explanations for this positive relationship. Firstly, as was noted
before, there is a positive association between education and farmer age. For the
very young farmers (less than 30 years, and may be those between 30 and 34)
computers were part of their educational environment. Additionally, youth and
education may provide an ability for changing and trying new things. Finally,
education, especially tertiary education, reduces the knowledge gap that may exist
between farmers and information technology developers. Educated farmers may tend
to see and think about their farm management problems and their solutions in a
similar way to scientists and CIS developers.
3.3.2 Spouse and child education, computer ownership and CIS use
Farmers who stated that they manage their farms with family member assistance
were asked to identify their education levels. As was noted earlier, there were 175
and 55 farmers that stated "couple" and "whole family" management team structures
respectively. From their responses the education level of 201 spouses or partners,
and 33 farmer children, were available for analysis.
The next table shows the analysis.
Table 3.7 Spouse education and computer uptake
Farmer spouse education level
% with computer
I~rimarvor less
I~econdarv.Eaual or less than 4 vears
I~econdarv.More than 4 vears
Tertiary. Equal or less than 2 years
Tertiary. More than 2 years
I
I
I
% that use at least
one CIS
0.00%1
0.00%1
75.00%1
55.95%1
85.37%1
78.05741
78.26%
65.22%
80.77%
69.23%
The next table shows the relationship between the children's education and computer
uptake and CIS use.
Table 3.8 Children education and computer uptake
Children education level
% with computer
Primary or less
Secondary. Equal or less than 4 years
Secondary. More than 4 years
Tertiary. Equal or less than 2 years
Tertiary. More than 2 years
% that use at least
one CIS
100.00%
0.00%
31.25%
50.00%
75.00%
50.00%
80.00%
60.00%
85.71 %
57.14%
The results appear similar to those developed for farmer education. However, the
Mann-Whitney U-tests were not significant, due, in part, to the lower number of
observations.
3.4 Involvement of non-family people, computer ownership and CIS use
3.4.1 Adviser
The next table shows the relationship between adviser involvement, computer uptake
and CIS use.
Table 3.9 Adviser involvement, computer ownership and CIS use
Adviser involvement
% with computer*
% that use at least one CIS**
0-No involvement
48.51 OO/
65.35%
11-A little
73.17%1
64.63%1
81.93%(
66.27%1
12-Quite a lot
13-Heavv involvement
I
83.33%1
79.17%1
Mann-Whitney U-test=-2.751 p=0.6%;**Mann-Whitney U-test=-3.169 p=0.2%
Adviser involvement is strongly related with both computer ownership and CIS use.
U-tests
y
are highly significant. The stronger the adviser
Both ~ a n n - ~ h i t n e
involvement, the higher percentage of both variables. While the relationships
between adviser involvement level and farm herd size and education are not clear,
younger farmers use advisers more intensively (see tables in appendix 6.3). Farms
who heavily rely on advisers may tend to see and think through their farm
management problems and solutions in a similar way to scientist and CIS developers
do. In this way, well advised farmers may act as educated farmers.
3.4.2 Accountant
The next table shows the relationship between accountant involvement, computer
uptake and CIS use.
Table 3.10 Accountant involvement, computer ownership and CIS use
Accountant involvement
OO
/
with
OO
/
that use at
computer least one CIS
1 69.07%1
57.73%1
0-No involvement
1-A little
1 75.37%1
61.19%1
2-Quite a lot
65.31 OO/
79.59%
3-Heavy involvement
60.00%
70.00%
Unlike adviser involvement, accountant use does not have a relationship with
computer ownership and CIS use. Both Mann-Whitney U-tests are not significant.
Accountant use was also not related to herd size, farmer age and education (see
tables in appendix 6.4). This may be explained because most farmers use an
accountant for tax purposes.
Neither a lawyer nor friendlneighbour involvement levels show any relationships with
computer ownership and CIS use (see tables in appendix 6.5).
3.5 Information sources, computer ownership and CIS use
From the 10 sources of information, only 2 have statistically significant (MannWhitney U-tests) relationships with computer ownership. These are electronic news,
as can be expected, and daily newspapers (MWU-test=-3.429p=0.1% and -2.693
p=0.7% respectively). Field days and seminar, however, are related to computer
ownership in that there is only a 9.7% probability of accepting the null hypothesis (no
relationship).
CIS use shows a highly statistically significant (Mann-Whitney U-tests) relationship
with Breed journals and electronic news (MWU-test=-2.656 p=0.8% and -3.393
p=0.1% respectively) and a statistically significant (Mann-Whitney U-tests)
relationship with MAF reports and daily newspapers (MWU-test=-1.87 p=6.1% and 1.g46 p=5.2% respectively).
3.6 Farmer goals
Achieving high profits is the only goal that shows a statistically significant (MannWhitney U-test=-1.g33 p=5.3%) relationship, and highly statistically significant
(Mann-Whitney U-test=-2.231 p=2.6%) relationship with computer uptake and CIS
use respectively.
4 Summary
4.1 Main findings from the survey
The average dairy farm in Canterbury milks 478 cows using an effective area of 167
hectares. Besides adult stock, 111 heifers and 132 calves are kept as replacements.
In addition to on-farm pasture, 27%, 56% and 67% of farmers use feedcrops, a runoff
and other purchased feeds respectively. Only 12% of farmers rely on just home farm
pasture.
The average dairy farmer is 43 years old and has been farming for almost 19 years,
6 of them outside Canterbury. Newer farmers have longer dairy farming off-region
experience than older ones. More than 60% of dairy farmers have a secondary level
of education, while almost 40% have tertiary education.
Owners (71%) and 50150 sharemilkers (26%) are the two largest tenancy types. The
average sharemilker is 10 years younger and manages a larger herd (164 more
cows) than owners. More that 60% of dairy farms are managed by a partnership
between the farmer and hislher spouse or partner. Only 19% of farms are managed
by the "farmer alone". Other 18% are managed by family members of two
generations (parents and sonsldaughters).
Two thirds of the dairy farmers involve, in varying degrees, advisers and accountants
in decisions.
Table 4.1 Type of information system use by dairy farmer -percentage use by
column
Livestock recording
Information
Financial recording Feed (pasture)
systems
and management
system
recording and
management
system
svstem
Memory
20.34
1.03
11.03
Manual-informal
5.52
0.34
( Service
( 19.31
1 13.79
1 22.76
Table 4.1 summarises the percentage of farmers using each type of information
system practice in the three main management areas: finance, feeding and livestock.
More than 60% of farmers use at least one computerised information system, while
only 10% use a computer for all three areas.
Farmers use on average 25.5% of their working time to perform management work,
meanwhile, they spend 10.5 hours per week in the farm "office". The average office is
well equipped with electronic devices such as a fax machine (89.29'0)~telephone
answering machine (81.4%), cellular phone (76.6% and personal computer (70%).
The two significant types of computer users are the farmer's spouse or partner
(49.5%) and the farmer himlherself (44.8%). The average farm computer user has
7.4 years of experience as a PC-operator and the machine is used on an average of
1.5 hours per day.
The main sources of information for dairy farmers seems to be farm publications, LIC
advisory service publications and field days, or similar, events. Secondly, farmers get
information from daily newspapers, neighbours or local contacts and commodity
newsletters or magazines. Finally, other information sources such as breed journals,
MAF reports and daily farm reports on radio or television appear to have less
(relative) importance for dairy farmers. In the last place appears the use of the
electronic media as a source of information.
The internet is mainly used for electronic mail. Next is the use of this media to obtain
dairy company news. Then, ordering equipment and supplies and latest research
results appears next. Finally, other kinds of internet information sources or services
such as climate, market, technical and economic data show some use.
Farmers ranked all the proposed goals highly. Enjoying farming was the highest
ranked goal, secondly, achieving high profits. The next most important was to provide
an income to raise the farmer's family, and farming in a sustainable way. The fourth
most important was to achieve high farm production and have a reasonable income
and plenty of time to enjoy other interests. The lowest ranked goal was to be a "top
farmer".
The analysis of the final set of open questions (question 23, 24 and 25) shows
farmers are concerned with continuing to introduce computers and software to
improve their information management. Increasing farm consultant employment as
well as other information sources, such as the internet, are other strategies
suggested by farmers.
4.2 Computer uptake and computerised information system use
Table 4.2 summarises the statistical results. Computer uptake and CIS use are more
likely on large farms (large herd and large effective area). Young farmers, with less
dairy farming experience, more education and profit oriented, are more likely to have
a computer and to use it for managing farm information. Farmers that involve a farm
adviser, spend more time doing office work, and obtain information from daily
newspaper, electronic news, breed journals and MAF reports are more likely to own
a computer and use farm management software.
Table 4.2 Statistical tests values for factors affectinc computer uptake and CIS use
Computerised information
Computer uptake
system use
Farm
Herd size
-2.122 (t-test) p=3.5%
-3.345 (t-test) pcO. l%
+
Effective area
-2.573 (t-test) p=l .l%
Tenancy
Farmer
Age
Education
Goals
Time dairy
farming in
Canterbury
Time dairy
farming in total
Management
Management
team structure
Adviser
involvement
Accountant
involvement
Management
work
Office time
Information
sources
3.567 (t-test) ~ ~ 0 . 1 %
-2.149 (M-W-test) p=3.2%
-3.829 (M-W-test) ~ ~ 0 . 1 %
To achieve high farm production To achieve high farm production
-2.231 (M-W-test) p=2.6%
-1 .g33 (M-W-test) p=5.3%
2.585 (t-test) p=l .l
%
3.846 (t-test) p<0.1%
2.451 (t-test) p=1.6%
4.085 (t-test) p<0.1%
-2.751 (M-W-test) p=0.6%
Daily newspaper:
-2.693 (M-W-test) p=0.7%
Electronic news
-3.429 (M-W-test)
p=o.1%
1
+ a blank cell represent a non significant relationship
-1.g25 (t-test) p=5.5%
Daily newspaper:
-1 .g46 (M-W-test) p=5.2%
Breed journals
-2.656 (M-W-test) p=0.8%
Electronic news
-3.393 (M-W-test) p=0.1%
MAF reports
-1.870 (M-W-test) p=6.1%
5 References
Ministry of Agriculture and Forestry (1999) Farm Monitoring Report: South Central
Region.
Nuthall, P. and Bishop-Hurley, G. (1994) Feed Management and Computer Practices
on a Sample of New Zealand Farms. AERU Research Report 225, Lincoln
University, Canterbury.
Nuthall, P. and Benbow, C. (1999) Computer System Uptake and Use on New
Zealand Farms. Research Report 99/01, Farm and Horticultural Management Group,
Lincoln University, Canterbury.
Pryde, J. and McCartin, P. (1986) Survey of New Zealand Farmer Intentions and
Opinions. AERU Research Report 188, Lincoln College, Canterbury.
6 Appendixes
1
6.1 Appendix 1: Mail questionnaire
Farm Management Group
I
- Lincoln University
1
Dairy Farmers' Information Systems Questionnaire
All information given is strictly confidential. Any published results will contain only
averages and non-identifiable information.
Section 1. General
If you are not the manager of the farm, please pass this on to the manager, who may
be the owner, the sharemilker (50150) or the contract milker (other than 50150
arrangement). Please, write here which category you fall into:
1. Please give the following information about your dairy production system for the
last season.
Effective (milking) area:
hectares
Milkers:
head
Non-calved heifers:
head
Calves reared:
head
hectares
Feed crops owned
hectares andlor feed crops rented
hectares
Runoff owned
hectares andlor runoff rented
Approximate value of other purchased feed (for example silage)
dollars
2. a) How many years have you been dairy farming in Canterbury?
b) How many years have you been dairy farming in total?
years
years
3. Which family members, if any, are regularly involved in farm decisions? (Tick the
most appropriate box)
a)
Myself. ..................................................................................... .I and my spouselpartner............................................................
....b)
I,
my
spouselpartner
and
my
son(s)
andlor
daughter(s)
.....................
...c)
I, and my son(s) andlor daughter(s) .................................................
d)
e)
Other (please specify
p
4. For each family member actually involved in decision making, please give tki e level
slhe completed their formal education? (Tick the appropriate box)
a)
b)
c)
d)
e)
Primary or less
Secondary - four years or less
Secondary - more than four years
Tertiary - two or less years
Tertiary - more than two years
(note here if more members are involved
1
38
5. Which non-family people have a reasonable input into farm decision making? (Tick
each relevant box)
Heavy involvement
a) Farm consultant
b) Accountant
c) Lawyer
d) Friend or neighbour
e) Other (please specify
f) Other (please specify
Section 2 Farm information management
6. Which of the following best describes your financial recording system? (Tick one
or more boxes; for computers please give name of software (SW))
a) Informal system with reliance on bank and similar statements as backup
b) Manual (or hand-written) record system
c) Computer-based record system: SW
d) Both manual and computer-based: SW
e) Accounting or consulting service
1
f) Other (please specify
7. Who does the GST returns? (Tick one box)
................................................................
a) Myself.......................
b) SpouseIPartner.............................................................................
c) Sonldaughter...............................................................................
d) Accountant..................................................................................
e) Other (please specify
1
8. Which of the following best describes your pasture and other feed-crop
recordinglmanagement system? (Tick one or more boxes; for computers please
give name of software (SW))
a) My memory..................................................................................
b) Notes on calendars........................................................................
c) Pocket notebooWFarm diary ..................
...................................
d) Field record book (hand-kept). .........................................................
e) Computer-based system: SW
f) Consultant or company service: name of service
1
g) Other (please specify
9. Which of the following best describes your livestock recording /management
system? (Tick one or more boxes; for computers please give name of software
(SW))
a)
b)
c)
d)
e)
f)
g)
My memory... ...............................................................................
Notes on calendars........................................................................
Pocket notebooklFarm diary.. ..........................................................
Livestock record book (hand-kept)....................................................
Computer-based: SW
Consultant or company service: name of service
Other (please specify
U
39
Section 3 Farm office
As a farmer you perform different kind of tasks, e.g. milking, renewing pastures, fixing
fences, supervising staff, purchasing inputs, planning the whole operation, etc.
10. On average, what percentage of your working time do you spend doing:
YO
a) Field work and other physical farm activities
YO
b) Management work including farm office time or its equivalent
c) Other (please specify
)
YO
100%
I I . On average, how many hours per week (including phone time) do you spend in
your farm office (or its equivalent) organising your farm activities and staff?
hours
12. What farm office machines do you have? (Tick one or more boxes)
a) Fax machine. ...............................................................................
b) Telephone answering machine.........................
...... .......................
c) Cellular phone ..............................................................................
d) Photocopier.................................................................................
e) Computer.............. .
...................................................................
f) Other (please specify
)
If you do not use a computer for business, please go on to question 18 Section 5
If you use a computer for business, please continue answering the following
questions.
Section 4 Computer usage
13. Who is the primary computer operator on your farm? (Tick one box)
a) Myself .....................................................................................
b) My spouse. ................................................................................
c) Other family member....................................................................
d) Hired personnel............
............................................................
e) Other (please specify
)
years
14. How long has this person been using computers?
15. (i) What percentage of computer time is spent on each of the following? (Give a
percentage of total computing time)
a) Farm business.........................................................................
b) Learning and education.............................................................
c) Leisure/personal......................................................................
d) Communication..........................................................................
e) Off farm business .....................................................................
100%
1(
(ii) What is the average TIME PER DAY that the computer is used?
hours
%
%
%
%
%
16. How many HOURS PER MONTH do you spend using each of the following
packages or system? (leave blank if zero) (SW=software)
a)
b)
c)
d)
e)
f)
g)
h)
i)
j)
k)
I)
Wordprocessor (SW name
Financial and accounting record system (SW name
Pasture and crop record system(SW name
Livestock record system(SW name
Feed budgeting(SW name
Herd testing(SW name
Integrated farm management package (SW name
Other spreadsheet use (SW name
Other database use (SW name
lnternet
E-mail
Other (please specify
)
1
)
)
)
)
)
)
)
1
17. Which statement best describes how often the computer is used for business
(Please tick one box)
.
....................
a) A regular period each week during evenings .............
b) A regular period each week during daytime .....................................
c) A regular period each month.........................................................
d) On rainy days ............................................................................
e) In irregularly available spare time. .................................................
f) Several days at the end of the financial year ....................................
g) Exactly when the need arises ......................................................
h) Other (please specify
) ~Section 5 Information sources
18. Which of the following sources of information are used on your farm?.Please rate
the importance of each on a 1 to 3 scale (l=not at a11,2=a little,3=very important)
a)
b)
c)
d)
e)
f)
g)
h)
i)
j)
k)
I)
Daily newspaper..........................................................................
Farm publications.......................................................................
Commodity newsletter or magazines.. .............................................
Breed journals ............................................................................
Electronic news ..........................................................................
Daily farm reports on radio or television...........................................
MAF reports (market, analysis and others) .......................................
Livestock Improvement advisory service publications.. ......................
Field dayslseminar.. ..................................................................
Neighbours/local contacts.............................................................
Other (please specify
)
Other (please specify
)
If you do not use the Internet, please go on to question 20 in Section 6
19. Indicate how frequently you use the internet for each of the following
information/functions by entering in each box either l=very occasionally,
2=occasionally, 3=frequently
a)
b)
c)
d)
e)
f)
g)
h)
i)
j)
k)
I)
E-mail....................................................................................
News and weather information.......................................................
Market information (prices, suppliers)..............................................
Technical information ..................................................................
Economic information (interest rate, exchange rates, etc.). ..................
Updates on changes to agricultural legislation..................................
Latest research results.................................................................
Entertainment and fun ..................................................................
Ordering equipment and supplies.. ....................................:............
Dairy company news...................................................................
Other (please specify
1
Other (please specify
)
Section 6 Manager
20. For each of the following objectives, please rate its importance on a 1 to 5 scale
(l =not important through to 5=very important).
a) To be a top dairy farmer.. .................................................................
b) To achieve high farm production........................................................
c) To achieve high profits....................................................................
d) To enjoy farming .............................................................................
e) To provide an income to raise my family.. ............................................
f) To farm in a sustainable way ............................................................
g) To have a reasonable income and plenty of time to enjoy other interests
h) Other (please specify)
i) Other (please specify)
21. What percentage of your total income is derived from dairy farming?
22. What is your age?
. %
years
23. Any ideas or suggestions about what is wrong with your current
informationldecision system?
24. Any ideas or suggestions as to what new/better informationldecision system you
would like?
25. What new things, if any, have you done in the last 3 years to improve the
information you have for making decisions? (for example, you have started using a
new diary, or you have purchased a computer, subscribed to a new magazine.. .).
Thank vou verv much for takinq the time to complete and return this questionnaire.
The results will be of qeneral interest to manv people, includinq other farmers,
businesses and policv makers while also assistinq us to develop solutions for dairv
production problems.
Once this mail-survev is completed another interview survev on a much smaller
group of farmers will be carried out to obtain more detailed information. If vou would
be happv to spend approximatelv 2 hours with me, Jorqe, discussing ideas on
information svstems and how these could be improved, please aive your name and
telephone number on the space below. The numbers interviewed will be restricted to
a random selection.
Please use the self addressed freepost envelope enclosed to return the
questionnaire.
Name
Phone
6.2 Appendix 2: Feed sources
The next six tables show (one per herd size class) details about the feedcrops, runoff
and other purchased feed used by the surveyed farmers.
I
Table A. 1 Feed resources of farms with less than 150 cows
1 Average amount (hectares)
Number of farms in the class
1 30
Percentage of
farms that use:
I
Puchased feed
1 66.67%
l
1 Average expenditure
$ 8,050.Silage tonnes equivalent5
Table A.2 Feed resources of farms from 150 to 299 cows
I Average amount (hectares)
1 65
18.5
Percentage of
Feedcrop
21.54%
farms that use:
55.4
Runoff
64.15%
I Number of farms in the class
l
Puchased feed
(
l
80%
1 Average expenditure
$26,433.Silage tonnes equivalent
Table A.3 Feed resources of farms from 300 to 449 cows
I Average amount (hectares)
Number of farms in the class
1 63
34.1
Feedcrop
22.22%
Percentage of
farms that use:
I
Puchased feed
1 63.49%
l
/ Average expenditure
$21,085.Silage tonnes equivalent
$ 0. l/kg of DM of silage
Table A.4 Feed resources of farms from 450 to 599 cows
Number of farms in the class
Average amount (hectares)
54
Percentage of
Feedcrop
35.19%
35.6
farms that use:
Runoff
44.44%
125
I
Puchased feed
Average expenditure
$ 34.310.Silage tonnes equivalent
34 t
Table A.5 Feed resources of farms from 600 to 899 cows
Average amount (hectares)
Number of farms in the class
52
34.62%
Feedcrop
Percentage of
39.4
farms that use:
Runoff
50%
128.3
1
/
I
Puchased feed 1 59.62%
I
I Averaae ex~enditure
$ 38,681.Silaae tonnes eauivalent
Table A.6 Feed resources of farms with more than 900 cows
Number of farms in the class
26
Average amount (hectares)
Percentage of
Feedcrop
30.77%
85.1
farms that use:
Runoff
57.69%
57.69
Puchased feed
1 Averaae ex~enditure
$135,000.Silaae tonnes eauivalent
I
6.3 Appendix 3: Age and adviser involvement
Table A.7 Aae and adviser involvement
Adviser involvement levels (percentage of farmers within each
age class)
Farmer age (years)
2-Quite a 3-Heavy
0- No involvement I -A little
lot
involvement
Less than 30
12.50%
31.25%
12.50%
43.75%
(Between35 to 39
Between 40 to 44
Between 45 to 49
I
38.46%)
28.81%
38.78%
26.92%)
3
3
28.57%
30.77%)
32.20%
20.41 %
3.85~1
5.08%
12.24%
Chi-square test: 7.9% probability of accepting the null hypothesis.
Table A.8 Herd size and adviser involvement
Adviser involvement levels (percentage of farmers within each
herd class)
Herd classes (cows)
0- No involvement1l -A little
12-~uitea 1 3 - ~ e a v ~
lot
involvement
Less than 150
45.83%
12.50%
29.17%
12.50%
150-299
27.42%
29.03%
33.87%
9.68%
300-449
40.00%
30.00%
6.67%
23.33%
450-599
41.67%
25.00%
29.17%
4.1 7%
I
I
I
I ~ o r than
e
899
23.08%1
38.46~1 30.77%)
Chi-square test: 26% probability of accenting the null hypothesis.
l
I
I
I
7.69%1
I
Table A.9 Education and adviser involvement
E
education level)
0- No involvementll -A little
( 2 - ~ u i tae 1 3 - ~ e a v ~
Education level
Primary or less
Secondary equal or
less than 4 years
Secondary more than 4
years
Tertiary equal or less
than 2 years
Tertiary more than 2
U
I
25.00%
36.03%
25.00%
33.09%
50.00%
24.26%
0.00%
6.62%
54.84%
19.35%
25.81 %
0.00%
24.32%
32.43%
32.43%
10.81%
33.80%
21.13%
30.99%
14.08%
I
1
I
I
Chi-square test: 45.3% probability of refusing the null hypothesis.
6.4 Appendix 4: Age and Accountant involvement
Table A. 10 Age and accountant involvement
Accountant involvement levels (percentage of farmers within I
each age class)
2-Quite a 3-Heavy
Farmer age (years)
0- No involvement l -A little
involvement
lot
Less than 30
31.25%
50.00%
18.75%
0.00%
Between 30 to 34
32.26%
38.71%
6.45%
22.58%
Between 35 to 39
1
26.92%1
50.00%1
15.38%1
7.69%1
30.51%
Between 40 to 44
49.15%
1.69%
18.64%
Between 45 to 49
38.78%
20.41%
36.73%
4.08%
34.04%
Between 50 to 59
2.13%
61.70%
2.1 3%
More than 59
40.00%
13.33%
46.67%
0.00%
Chi-square test: 23.7% probability of accepting the null hypothesis.
I
-
Table A.ll Herd size and accountant involvement
Accountant involvement levels (percentage of farmers within
each herd class)
Herd classes (cows)
0- No involvement l -A little
2-Quite a 1 3 - ~ e a v ~
lot
involvement
Less than 150
54.17%
4.1 7%
25.00%
16.67%
150-299
33.87%
46.77%
6.45%
12.90%
300-449
25.00%
0.00%
53.33%
21.67%
450-599
47.92%
4.17%
31.25%
16.67%
600-899
53.06%
32.65%
4.08%
10.20%
lMore than 899
I
26.92%1
53.85%) 15.38%)
3.85%)
Chi-square test: 19.8% probability of accenting the null hypothesis.
1
1
B
I
I
I
I
Table A. 12 Education and accountant involvement
I Accountant involvement levels (percentage of farmers within (
I
each education level)
Education level
0- No involvementl l -A little
12-Quite a 3 - ~ e a v y
lot
involvement
Primary or less
25.00%
50.00%
25.00%
0.00%
lsecondary equal or
1
29.41 %l
55.15%1
11.76%1
3.68%1
less than 4 years
Secondary more than 4
41.94%
41.94%
16.13%
0.00%
years
35.14%
35.14%
24.32%
Tertiary equal or less
5.41%
l than 2 vears
I
I
I
I
I
Tertiary more than 2
1 years
Chi-square test: 41 % probability of refusing the null hypothesis.
1
6.5 Appendix 5: Lawyer and Friendlneighbour involvement
Table A.13 Lawyer involvement, computer uptake and CIS use
Lawyer involvement
% with
% that use at
computer least one CIS
0-No involvement
71.98%
59.42%
Il-A little
1 78.48%1
65.82%1
12-~uite
a lot
1 66.67'341
33.33%1
13-~eavy
involvement
( 100.00%1
0.00%1
Mann-Whitney U-test: 100% of accepting the null hypothesis
Table A.14 Friendlneighbour involvement, computer uptake and CIS use
Friendheighbour
% that use at
% with
involvement
computer least one CIS
0-No involvement
57.21 %
71.16%
I l-A little
1 82.76%1
72.41
12-Quite a lot
1 80.00%\
66.67%1
13-~eavy
involvement
50.00%/
50.00%1
Mann-Whitney U-test: 100% of accepting the null hypothesis
1


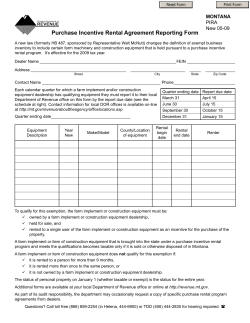
© Copyright 2026