
Market Timing Digest Sample Issue – Sixth complete year, September 2013
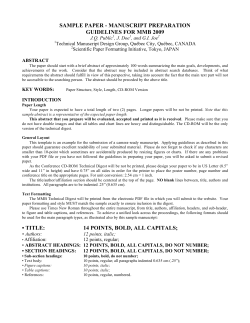
Market Timing Digest Sample Issue –
This main issue only contains synopsises of the views of 12 financial astrologers-analysts.
This sample does not include the Analysts’ views which subscribers receive separately each month.
Worldwide Platform for Financial Astrology
Sixth complete year, September 2013
Irma Schogt ©
“Millionaires don’t use astrology. Billionaires do.”
-
J.P. Morgan
“You know, economic forecasting was invented to make Astrology look respectable.”
- Richard Fisher, Dallas Federal Reserve Bank President, 1 April 2009.
First Publication date 7th September 2013
Copyright © Schogt Market Timing, The Netherlands, 2013
Introduction
Dearest Reader,
The month of September has gained a bad name on the markets and not for no reason: on average
the Dow Jones loses a lot during this month, as seen between 1950-2012. What do we see for this
coming September? The worldly news that mainstream media (MSM) broadcasts are currently
worser than worse: the threat of invasion by ‘the West’ in Syria, we hear a word of warning from
president Putin from Russia to the US (link). In Japan one wants to invest hundreds of millions to
hold back radiation after the world’s biggest-ever nuclear disaster two years ago? (Watch out for
fish from the East!) The question arising in me is “Where are we heading?” What are hundreds of
millions when it concerns the saving of lives and the possibility of living a healthy life there (and in
other places) on earth? Where is it going? What do the ‘western’ country rulers want to achieve by
invading Syria? What is this all about?
It is Mars in Leo, square Saturn in Scorpio on 9th September: always been a war aspect. Now 1000
times stronger as the ruler of Scorpio, Pluto (everything he touches intensifies) stands in Capricorn
where Saturn itself rules: they now empower each other. Mars, the desire to come into action,
often does that in Leo out of self-interest with the wish to be heard and seen, to state a deed.
Masculine dynamics play a game (sometimes literally, link) that now encounters adversity from
Saturn. It saddles the world with great fear (also Saturn). More dangerous is the aspect on 15 th
September, when Mars stands trine with Uranus (nuclear energy, breakouts, sudden changes).
Things could run out of hand by that time unless other powers manage to tame and get control in
time. These do exist only MSM gives them little attention, just like the wave of matters being
revealed, such as the thousands of violations done by the American Secret Service NSA (link).
What is clear is that there is currently a very different feeling than say, two months ago. In August
all our forecasts were correct with thanks to the knowledge of cosmic patterns. On the markets we
are going to look if we can see the great movements (confirmed) that we have been waiting for for
a long time. You can read this and our planning for the portfolio in this issue of Market Timing
Digest.
Forecast summary for the markets this month:
Shares: Relief makes place for selling panic
Gold: Pullback buying chance early September, then strongly upward
Euro/dollar: Downward: sell all rises.
Copyright © Schogt Market Timing, The Netherlands, 2013
Content
Shares, Looking back to last month ............................................................................................ 5
The Australian Sydney index ...................................................................................................... 6
Fundamental news shares .............................................................................................................7
Forecast share markets September 2013 ..............................................................................................7
Sector news ............................................................................................................................................8
Gold, window of opportunities ..............................................................................................................9
Looking back and to the future .................................................................................................. 9
Forecast gold September 2013 ............................................................................................................10
Euro/Dollar ...........................................................................................................................................12
Looking back ............................................................................................................................. 12
US dollar/Japanese yen ............................................................................................................ 13
Turning Data.........................................................................................................................................14
Astrology ..............................................................................................................................................15
Market Timing Digest Model Portfolio ................................................................................................18
Planning Shares ...........................................................................................................................18
Advert...................................................................................................................................................19
IAbout Market Timing Digest ................................................................................................ 20
How to read Market Timing Digest ...................................................................................... 20
Disclaimer: Due to the time that is needed to publicise and send the information it is possible that the opinions of the
analysts might have changed even before the date of publication. Every financial astrologer has his/her own view on
the markets, compares different historical similarities with the upcoming astrological aspects. For a more complete
version from the analysts I suggest consulting their individual websites, which are mentioned in Market Timing Digest.
Copyright © Schogt Market Timing, The Netherlands, 2013
Shares The markets in figures: the past month
AMERICA
End July
End August
Month result
Nasdaq Composite
3626,37
3589,87
-1,01%
Bovespa
48.234,49
49.528,00
2,68%
Dow Jones
15499,54
14810,31
-4,45%
S&P 500 index
1685,73
1632,97
-3,13%
Brazilian
Average
-1,48%
EUROPE
End July
End August
Month result
German DAX
8275,97
8103,15
-2,09%
French Cac 40
3992,69
3933,78
-1,48%
Dutch AEX
369,81
362,68
-1,93%
Swiss SMI
7820,43
7745,97
-0,95%
EuroStoxx50
2768,15
2721,37
-1,69%
Average (ex
EuroStoxx50)
-1,61%
EAST
End July
End August
Month result
Japanese Nikkei
13668,32
13388,86
-2,04%
Hang Seng
Hong Kong
21883,66
21731,37
-0,70%
Australia, Sydney
5035,67
5125,3
1,78%
Russian MICEX
1375,79
1364,65
-0,81%
Average
Copyright © Schogt Market Timing, The Netherlands, 2013
-0,44%
The greatest losses over the past month occurred in the few indices that booked record highs
during May and August just gone. The German DAX that peaked on 22 May at 8557.86 now lies,
four months later, 5 percent under; the American Dow Jones that recently made a record high of
15,658.42 on 2nd August has also, at the end of the month, fallen more than 5 percent whilst the
S&P500 index ended the month nearly 5 percent lower than the record top on the 2 nd August. The
Japanese Nikkei and all the other indices in our comparison that fell had already set new highs,
highest in years, earlier on in the year, from which they now return.
Looking back to last month
Dow Jones from 3rd June until 30th August 2013. On the 2nd August the Dow Jones set a new record
high at 15.658.43 and slid away again to a close at the end of the month at 14.810.31: 5.4 percent
under the record, a great fall in 19 trading days.
The forecast for last month was: “A top looks set to be made in August, followed by a steady decline
lasting in to the autumn. Noticeable is the number of warning tones in many analyses. One is not
quite sure when the top will be exactly but that it will come is definite. This month we see two
dangerous cosmic aspects, two fuses in a barrel of gunpowder, one at the beginning of the month
and the other at the end.”
We have nothing to add to this. With these sorts of forecasts our readers can earn a lot of money.
Our monthly views on shares came to be with thanks to: Dharmik Team, GannTrader Jan van
Gemeren, Robin Handler, Robert Hitt, Raymond Merriman, Gaby Mittelman, Grace K. Morris, Edwin
Niemans, Ted Phillips, Barry Rosen, Richard Schulz, Tjerk Spriensma, Norm Winski.
Copyright © Schogt Market Timing, The Netherlands, 2013
The Australian Sydney index
The Australian Sydney index did well until 15th May just gone with a top at 1529.80. The rise ended
at a resistance level of an old top from August-September 2008. Here the top was found after 4
years in a rise starting 15th March 2009. As long as the market cannot override the 1529.80 then
this could be the long-term top in a 4-/5-year cycle.
The market did try and ended with a double top at 5151.60 and 5148.50 on 14 th and 26th August.
Below you can see the chart on week basis for the Australian Sydney index from May 2007 and
below the months chart from December 1999. The triangle that formed there from the end of 2007
could indicate a turnaround pattern. If it cannot break out above 5151 there is danger of breaking
out on the underside, that is to say rates under 4700-4500.
Copyright © Schogt Market Timing, The Netherlands, 2013
Fundamental news shares
If corrected on (official)
inflation, the tops are a lot
lower. The Dow Jones is for
example still (slightly) under
his peaks from 1999 and
2007. See Chart of the Day,
Link.
‘
Forecast share markets September 2013
Total conclusion
The month could begin with a relieved market that … makes way for a fierce correction … into
October.
The individual opinions from our financial astrologers are in the supplement
Copyright © Schogt Market Timing, The Netherlands, 2013
Sector news
One of the pearls in Financial Astrology is that per period it is able to name the best scoring sectors.
From 26th June 2013 until 16th July 2014 they are: amongst others is the housing sector (especially
American real estate), (re) building of houses, …, …, …, …, … and other shares and sectors related to
the zodiac sign Cancer. Some sectors related to other water signs also qualify such as …and the …
industry.
Grace K. Morris:
“PLAYING FAVORITES
They say don’t have favourites with your kids (or with your stocks). Be objective! I have to confess I
have a favourite stock since it first started to trade and I grow increasingly fond of it. Qihoo
Technology (QIHU) continues to rise even on down days in the market. It was put on our
Recommended List 12/1/12 at $23. It is now over $80. It is the Chinese ‘Google’ in
competition with Baidu (BIDU). We look for Monster Stocks under $100 with the possibility of going
over $500 such as Apple, Google, Priceline and LinkedIn. “
Is Grace Morris’ favourite share Qihoo Technology (QIHU) later on in the autumn cheaper after the
big correction in the share markets we expect, then we think this could be considered for buying!
And: one of the markets that expect to do better with Jupiter in Cancer is
silver. On the 2nd July this report came in the Zerohedge.com “Silver is winning
India’s “War on Gold”. The import of silver in to India has exploded, from 1900
tonnes in 2012 to 2400 tonnes already in the first 5 months of 2013. India
bought in 2012 10% of the world’s production of silver. India’s gold traders and jewellery union
have summoned a ban on the 1st July on the selling of gold; this could have effect on the further
price increases for silver and gold.
Copyright © Schogt Market Timing, The Netherlands, 2013
Gold, window of opportunities
“Gold is money. Everything else is credit.”
J.P. Morgan talking to American congress in 1912.
“The last duty of a central banker is to tell the public the truth.”
Alan Blinder, chairman of the Federal Reserve, in PBS "Nightly
Business Report," 1994.
Looking back and to the future
For last month we said: “As long as support holds at 1270 or even 1250, there are chances that gold
will in August can go back towards 1350 and rise above 1400. Should 1250 break, then a test can be
expected between 1200-1180.”
Gold in US dollars on day basis August 2013 until 2nd September. ___=45-DMA (1320); - - - =15-DMA (1378).
Below in chart Slow Stochastics.
It first went down to $ 1271 on 7th August and pulled up to a peak at $ 1434 on 28th August. This
was a rise of 12.8 percent that was noted sharply by our analysts beforehand. This analysis resulted
from the opinions and expectations from:
Dharmik Team, GannAnalyst Jan van Gemeren, Robin Handler, Robert Hitt, Raymond Merriman,
Ted Phillips, Barry Rosen, Richard Schulz.
Long-term forecast gold (and silver)
The long-term trend until +/- 2020 is … in gold and silver and other precious metals.
………………………………………………………………..
Copyright © Schogt Market Timing, The Netherlands, 2013
Source: Fortucast Financial Vision from Barry Rosen
(Chart source: Garrett Goggin)
….
Forecast gold September 2013
Total conclusion
Gold will make a pullback at the latest 11th September, somewhere between 1380-1340. ….
Strategy:….
Copyright © Schogt Market Timing, The Netherlands, 2013
The chart above shows the price of gold in US$ 1994-2013 ; below you can see silver in US$. For
euros click the link.
Please read the individual opinions from our financial astrologers in the supplement
Copyright © Schogt Market Timing, The Netherlands, 2013
Euro/Dollar
“It is a good thing that the people of the country do not understand
anything about our monetary system, for if they did, then I think a
revolution would break out immediately.”
-American Industrial Henry Ford
Looking back
A month ago the following total conclusion came forth: “As long as
support holds at 1.3060 euro/dollar this month could veer up to
1.3400-1.3500 or perhaps 1.3700. After that we see a serious decline until October and further.”
€/$ Day chart 18th June until 2nd September. With Slow Stochastics, --- = the 23-DMA (1.3312) --- =
69-DMA (1.3192).
This currency pair started the month at 1.3302, went first to 1.3188 on 2nd August and held at
1.3060. It went to a 1.3452-top that went paired with negative oscillator divergence on 20th August
and fell then to 1.3172 on 30th August. The euro fell more than 2 percent in 8 trading days, the
decline has started that could last into and past October
This analysis came to be with the input of opinions and expectations from:
Dharmik Team, GannAnalyst Jan van Gemeren, Robert Hitt, Raymond Merriman, Ted Phillips,
Barry Rosen, Richard Schulz.
Copyright © Schogt Market Timing, The Netherlands, 2013
US dollar/Japanese yen
US Chart US dollar/ Japanese yen from 1992 on month basis. As written earlier this currency pair
formed an 18-year cycle bottom in 2011 and it fits to buy for a long-term position in our portfolio.
Short-term it reveals a primary cycle 30-week +/- 7 weeks where in it shows a 3-phase pattern of 914 weeks. If this also happens then it is now the 12th week since the last ‘mb’ on the chart and
within 2 weeks a new 9-14-week major bottom could be made. Price wise we look to the US
dollar/Yen under the 28-day Moving Average, that is now at 97.93 (and falling). Perhaps the 95.79
from 7th August will be tested, should this happen and the 93.80 from 2 nd April continues to give
support then it is likely to be buyable. .
Jan. 2014 we see that US dollar/Japanese yen went to 96.55 on 8th October, which was a good
buying opportunity.
Copyright © Schogt Market Timing, The Netherlands, 2013
Turning Data
Turning dates indicate when the collective psyche of investors has the best chance of changing. This often leads to
turns on the markets. When a market turn is expected look to or around the turning date (+/- 3 trading days). Using the
turning dates this way will produce the best results.
We look to the Dow Jones for turning date effects. When we expect a turn, based on cycle analysis, fundamentals and
technical analysis then turning dates are a welcome addition.
Looking back at turning dates from the past month (31st July**, 23rd – 26th Aug***)
Above: Day chart Dow Jones from April 2013. Below in chart slow stochastics. …. = 14-DMA; __ =
42-DMA.
The top was made at 15.658 on 2nd August; this was 3 trading days after 31st July. The lowest price
was noted at 14.760 on 28th August, two trading days after the second MTD turning date from this
month. Today 3rd September the market rose for the third day, if 14.760 holds as support then this
turning date will also be spot on.
Turning dates September 2013
The following dates come forth as having the greatest chance (within 2-3 trading days) of coinciding
with the onset of a correction on the share markets. The more stars, the more powerful the effect
can be on the ruling trend.
12th – 15th September**
23rd September*
Turning data is filtered from the data of possible trend reversals provided by the financial astrologers.
They often form the heart of periods filled with astrological aspects that coincide with changes in the
markets and ruling sentiment amongst investor.
Copyright © Schogt Market Timing, The Netherlands, 2013
Astrology
Important weeks are mid September with the Mars-Uranus square: the fuse in a barrel of
gunpowder, which will most probably result in an MTD turning date. This is followed end
September with Mercury in Scorpio where it stays until 5th December. This could represent a very
intense time on the markets where dark matters are revealed and great turnarounds (of 8 percent
or more) are perceived.
Wednesday 28th August Mars steps over to Leo. The urge to come into action that first came from
our emotion now comes from our intuition, our honour, because we feel like doing it, get attention
with it and see it as a game. Research, FAR software, reveals that Mars in this sign rises the German
DAX head and shoulders above all others qua market turns of 4% or more: it could well be a highly
volatile period from now until 15th October as Mars travels through Leo.
September
Sunday 2nd September Sun decreasing trine Pluto. Strong aspect that is definitely felt: everything
is more intensely felt in the days running up to today. Managers could pick up on this to strengthen
policies. Matters that are started here have good chances to succeed, are mighty strong even
though the start up phase won’t be ultra fast (decreasing Moon phase).
Monday 9th September Mercury moves to Libra. In communication one is now more focused on
the other, how one is perceived is now unconsciously the reason why one expresses one’s self
clearer, politer and more focussed. Mercury in Libra is also: word choice becomes word art. FAR
software research reveals that Mercury in this sign rises the German DAX head and shoulders above
all others qua market turns of 4% or more: it could well be a highly volatile period from now until
30th September as Mercury moves through Libra.
Mars decreasing square Saturn. Light market aspect. The urge to act and the decision
maker meet resistance and blockades. Matters are not moving along as fast as one wishes and
certain formalities need to be taken through. Legislation and policy makers could, with their actions
(or delays), negatively influence the markets.
Wednesday 11th September 8.35 CEST – 02:35 AM EDST – Friday 13th September 11.56 CEST /
05:56 EDST: Moon in Sagittarius. The
general mood is
up-lifting
during these days. Optimism could do the markets good. If
there is no
reason for optimism then a negative atmosphere could result
in a greater
pressure to sell and higher volatility.
Saturday 14th September: Mars waxing trine Uranus. Fuse in a barrel of gunpowder: strong
market correlation. The urge to act meets the creator of shocks, Uranus. Here the chance of
accidents is greater than normal, same as at the end of July when Mars ran opposite Uranus and
Copyright © Schogt Market Timing, The Netherlands, 2013
the world was confronted with the serious train accident in Italy killing 78 people. Until 2015
Uranus makes a square with Pluto and all fast moving planets that make an aspect with one of
these planets bring these disruptive dynamics in to existence. On the financial markets this is also
one of the most powerful dynamics concerning market turns. In more than half of researched cases
since 1960 it coincided, within 8 trading days, with a trend change in the primary cycle (15-21
weeks from trough to trough in the Dow Jones) to 70% within 12 trading days.
Wednesday 18th September Venus conjunct Saturn, light market aspect. This aspect does little
with the mood on the markets. Financial values are now critically researched before one steps in.
The feeling that something is missing now rules.
19th September 13.14 hours CEST / 7:00AM EDT: Full Moon in Pisces-Virgo. General mood change.
After today the time to harvest and tidy up starts. Shares now do generally better than during the
first moon half, as seen in research “Looney, lunar or simply moonstruck?”. The moon phase
determines the mood. Before the Full Moon the pressure is on to get everything done, agenda’s are
usually filled to the brim. These two weeks leading to the New Moon things become slower and
certainly quieter as the growth and build-up period passes and nature comes to rest.
19th – 29th September: heliocentric Mercury through Sagittarius. Greater volatility in many
markets. The periods wherein Mercury, in his orbit of 88 days of
the Sun,
stands in Sagittarius are known for the market’s up-lifting effect
in the
share markets, currencies versus the US dollar and especially
precious
metals. However during the past three times we have seen
exactly
the opposite and we need to go back to April 2012 to be able to
see the
old faithful image: a steady veer upwards for a day or 4, only to hand in all profits afterwards, this
all within heliocentric Mercury in Sagittarius.
Friday 20th September Pluto turns direct. Also a light market aspect but with a lot of tension. Here
Pluto exaggerates the 4 D’s that he represents: Death, Destruction, Deficit and Default (not being
able to pay up).
Sunday 22nd September Sun to Libra. Autumn begins: day and night are now both equal in both
hemispheres.
Thursday 26th September Venus waxing trine Jupiter: this aspect is the most harmonious aspect
between two planets. Venus and Jupiter are associated with the good and lovely side of life:
relationships, values, luck (Venus) and hope, future and growth (Jupiter) and now they compliment
each other. Life seems to be a lot friendlier these days. Share market prices tend to take flight and
traders can now look for selling chances. According to research* this aspect can coincide with a top
within 9 trading days.
Saturday 28th September (medium mild market aspect) Venus waxing square Mars is the typical
woman versus man aspect: the intense feeling (Venus in Scorpio) in stride with the stronger,
Copyright © Schogt Market Timing, The Netherlands, 2013
attention asking will (Mars in Leo), or rather that what one is fighting for does not coincide with
what one loves. It could have disastrous effects, break-ups in working together or in the most
favourable situation a sharpening up of matters.
Sunday 29th September – Thursday 5th December Mercury in Scorpio (this is longer than normal
due to retrograde from 22nd October – 10th November) – the god of trade, the urge to
communicate and trade now works from the unconscious or ‘gut feeling’. Mercury in Scorpio has
the most chances of turnings of 8 percent or more: more than in any other sign. Every stone is
turned over and/or the truth is put on the table. The market reacts fiercely and chooses another
direction that could lead to turnarounds of 8 percent or more.
October
Wednesday 2nd October Sun decreasing trine Pluto: medium mild aspect that according to
research* can, within 11 trading days, give a primary or long-term cycle accumulation (often a top).
Should prices rise the 5 trading days running up to this aspect and a major (5-7-week in US indices)
or primary (13/15-21-week) cycle top is expected then traders can look for possibilities to take
profit on (long) share positions.
Thursday 3rd October Sun opposite Uranus – surprising aspect with light market aspect. Expect
unexpected news within 1-2 days, possibly the breaking of supports, resistance.
Friday 4th October 10:36 PM EDT / Saturday 5th October 2:36 hours CEST: New Moon in Libra.
General mood change. The start of a new sowing period, time to build up, end of the harvest and
tidy up period. This again is a phase to do and launch new things. Historically seen shares do a little
less well. This shows up in financial astrology, in published research done by RBS Sheer Lunacy
staring at the Heavens’.
Monday 7th October Venus steps into Sagittarius: the end of the worst ever period for money and
relationships. The period of Venus in Scorpio is of the past. Sagittarius is stimulating and hope
giving, could boost sentiment on the markets – or strengthen negative sentiment.
*) The Ultimate Book on Stock Market Timing, VOL 3, Geocosmic Correlations to Trading Cycles by Raymond Merriman.
Copyright © Schogt Market Timing, The Netherlands, 2013
Market Timing Digest Model Portfolio
The model portfolio records the investment portfolio from the initiator of this newsletter, Irma Schogt. It is filled with
products that are expected to do better (middle) long-term than the rest of the market.
Market Timing Digest vs benchmark indices
Market
Timing
Digest
S&P 500
AEX
Morgan
Stanley
Commodity
Index(€)
2010*
+ 25,2%
+ 16,0%
+ 14,6%
+ 24,7%
2011
+ 4,5 %
+0%
-/- 8,8%
-/- 5,4%
2012
+ 24.7%
+14.2%
+ 11.2%
+10.1%
*) All market figures 27 November 2009 - 31 December 2010.
Market Timing Digest follows the visions of the international team of financial astrologers and
market analysts and makes her investment decisions based on a market timing method that is
grounded in the richly documented historical correlation of planetary movemnets and economy,
politics and market history.
1.
2.
3.
4.
5.
6.
7.
Planning
Shares
…
…
Currency
…
Should during the coming weeks (at latest 20th September) a major bottom form in
US$/Jap.yen then we want to buy. See the chapter on currency.
Precious metals
…
….
….
Copyright © Schogt Market Timing, The Netherlands, 2013
Advert
It's that time of the year again!
We are pleased to announce that the pre-orders for
Forecast 2014 Book will begin now.
A special $49.00 / € 37.00 rate (plus postage) is now
available to those who order next year’s book prior to
October 31, 2013 with extra 5% discount for current
customers.
The rate after October 31 will be $55.00 / € 45.00 plus
postage. The Forecast 2014 Book will cover the second
Cardinal Climax period, which is in effect now and will
peak in April 2014.
It will discuss the world and national outlook for the economy and politics, the collective
psychology, “hot” times during the year to watch, as well as our long-term and yearly outlook for
U.S. stock indices, Gold, Silver, Treasuries and interest rates, Currencies, Crude Oil, weather, and
Grain markets. The book will be printed and delivered on or before December 15.
PICK THE WINNING STOCKS FOR 2014
Workshop - Saturday, Sept. 14, 2013
Hotel InterContinental Chicago
9:00AM - 4:00PM
$350 includes new book,
How To Choose Stocks
To Outperform The Market 2014
Special offer for subscribers only.
Register for the workshop and we'll add four months to your current subscription.
www.astroeconomics.com/orders
___________________________________________________________________________
Copyright © Schogt Market Timing, The Netherlands, 2013
About Market Timing Digest
Market Timing Digest is an incentive from former currency trader and financial astrologer Irma Schogt. Every month
Market Timing Digest receives analyses from international financial astrologers and distilles from these the forecast for
the coming month for the Worldwide Platform for Financial Astrology. The common ground for all of Market Timing
Digest’s participants is that they, in whatever way, use astrology in their work. They do this in their own manner and
from their own perspective and thus opinions can vary. Astrology is nothing more than historical correlation of
planetary patterns in the heavens and human behaviour on earth, in financial astrology, expressed in rates and
planetary cycles. It can only be applied using human input, which can vary from person to person. Wrong assessments
are often down to human error, not with the method, which is also not perfect but does however provide better results
in the financial markets than without the use of financial astrology. Market Timing Digest issues monthly, based on the
st
rd
gathered essence from a number of financial astrologers between 1 and 3 of the month, an overall opinion of the
th
market at latest the 5 of the month (The English translation is often 2 days later). In the updates, which are provided
in the weeks where there is no monthly issue, we look back at the month’s forecast and make the necessary
adjustments. HOT TIPS also appear regularly in between wherein Irma Schogt shows which (relatively conservative)
investment decisions she herself makes based on amongst others financial astrology.
How to read Market Timing Digest
Market Timing Digest brings together two different areas of profession, the financial world and astrology. Using both
professions to communicate in a faster and more efficient way, their own technical language. To keep reading easy it
has been chosen to provide only basic and summary information in the newsletters and updates. For explanations
about definitions and concepts in Market Timing Digest we refer you to our newly created web pages with concept
definitions for you as reader. See our FAQ pages.
FAQ about Market Cycles, patterns and Technical Analysis: at http://www.markettiming.nl/en/faq-cycles-analysis
FAQ about Astrology are still under construction but will be ready soon at http://www.markettiming.nl/en/faqastrology
Also still in the make are definitions and concepts about Market Timing Digest turning data and critical turning dates
(Merriman method).
On the home page of MarketTiming.nl you will find the FAQ button, this will take you to
http://www.markettiming.nl/en/faq
______________________________________
Translated by Nathalie Robertson-Porter
“You know, economic forecasting was invented to make Astrology look respectable.”
-
Richard Fisher, Dallas Federal Reserve Bank President, 1 April 2009.
© Copyright by Schogt Market Timing. No part of this may be reproduced or copied without written permission from
Schogt Market Timing.
Important Information
Copyright © Schogt Market Timing, The Netherlands, 2013
All information provided herein is based upon Schogt Market Timing’s technical, cyclical, and Geocosmic analysis, and
the integration of each of these factors. It is presented with reliable intent. However no claims for future accuracy are
being made, no can projections be guaranteed. Reliance of information in this report is at the sole risk of the reader.
Market Timing Digest contains no individual investment advice only a general recommendation on which investors can
base their investment decisions. It does in no way form any sort of contract or obligation. The customer receiving this
information is responsible for his or her own choices and use of the information, hereby understood as the decision to
hold, buy, sell or actions as such regarding stocks or financial instruments. The supplied information is exclusively
indicative and can be altered at any given moment without warning. No rights can be derived from the market opinions
from Schogt Market Timing. Schogt Market Timing, or any other (legal) person, is not liable for damages of any nature
resulting from on this website published newsletters and market opinions, the therein admitted or processed
information. Developments that occur after our market opinions and investment recommendation(s) have been
published can influence the accuracy of investment recommendation facts and provided points of view. Schogt Market
Timing obtains her information from trustworthy sources and at the time of printing has taken continuous and utmost
care to provide information based on her points of view that are accurate and not misleading. Market opinions are
based on trustworthy sources. Schogt Market Timing does not warrant that her attained and processed information is
accurate or complete.
Copyright © Schogt Market Timing, The Netherlands, 2013


© Copyright 2026