ABC
docz
Explore
Log in
Create new account
Download
Report
technology and computing
consumer electronics
tv and video equipment
projectors
Q4 2014 Presentation.pdf
Enough is Enough Special 2 FebWeb
NO0010714033
– Third quarter 2014 Weifa 22 October 2014
Financial report 1 JANUARY â 30 APRIL 2015
Teaching Excellence @ HKBU - Centre for Holistic Teaching and
attached document
A Look At The Last Quarter - Northern Oklahoma
FX strategies: NOK Strengthening trend intact but the risk
How to Write S.M.A.R.T. Objectives Guide
June 15th, 2015. Oslo Spektrum.
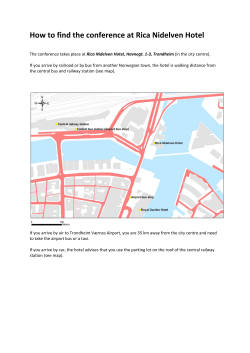
How to find the conference at Rica Nidelven Hotel
How to use HiBu SafeCom Online Store
28.05.2015 - Multiconsult Investor Relations
2015-11-24 Interim Report NattoPharma ASA 3 Quarter
3rd Quarter 2015
OTE Q1 - 15 English
OTE Q4 - Olav Thon Gruppen
Ukerapport 8. august - SpareBank 1 Markets
3rd quarter results 2015 report
Interim report Q3 2015
Interim report Q2 2015
Interim report Q2 2016
© Copyright 2026
About abcdocz
DMCA / GDPR
Report