
8 CHAPTER LEARNING OBJECTIVES
8
CHAPTER 8
ACTIVITY-BASED COSTING
LEARNING OBJECTIVES
After completing this chapter, you should be able to:
1 explain the problems associated with
conventional costing systems, resulting
from a failure to adapt to the changing
business environment;
2 recognise common indicators of an
outdated product costing system;
3 describe both the costing view and
the activity-management view of the
activity-based costing (ABC) model;
4 evaluate the costs and benefits
associated with some of the different
approaches to activity-based costing,
which include different subsets of
costs;
5 use the activity-based model to
measure the costs of activities, and
assign activity costs to products;
6 explain the differences between
product costs prepared under activitybased costing and those prepared
under conventional costing systems;
8 identify the impediments to
implementing activity-based costing;
9 outline various design issues to be
considered when implementing
activity-based costing, including
budgeted versus actual costs,
implementation of activity-based
costing as a ‘project’ and the inclusion
of other cost objects;
10 explain the implications of spare
capacity for estimating the cost of
activities;
11 appreciate the importance of
‘behavioural issues’ in implementing
activity-based costing;
12 identify the limitations of activity-based
costing in providing accurate product
costs;
13 describe the difficulties of implementing
activity-based costing in service
organisations; and
Y
L
N
O
R
E
T
P
A
H
C
E
L
SAMP
7 recognise what types of organisations
can gain the greatest benefits from
activity-based costing;
LS(5e)-08.indd 362
14 after studying the appendix, use a
relatively simple version of activitybased costing to allocate overhead
costs to products.
17/11/08 11:38:45 AM
INTRODUCTION 8
A revolution is transforming manufacturing industries. Not since the mid-nineteenth century
have changes been as sweeping and dramatic as they are today. The growth of global
markets for both production inputs and for products with an increasing emphasis on customer
satisfaction, in particular the emergence of China as a major source of manufactured goods, the
breakneck pace of technological innovation, and startling advances in computerised systems
have resulted in a new playing field for manufacturers around the world. Some manufacturers
have emerged as world-class producers, while others have fallen by the wayside.
The service sector, which includes businesses such as consulting firms, banks and
transportation companies, has also been through a period of dramatic change. Spectacular
advances in information and communication technologies have altered the service
environment. Competition has increased. Customers are demanding a greater diversity of
services, more flexibility and better quality. As in the manufacturing sector, some service
enterprises have adapted; others have failed.
As we discussed in Chapter 1, managers in many organisations have responded
to the changing business environment by adopting new management structures and
practices. Concepts such as team-based structures, employee empowerment, enterprise
resource planning systems, real-time reporting and continuous improvement have gained
widespread acceptance. What has happened to management accounting during this period
of change? Gradually, management accountants have become aware of the deficiencies in
conventional approaches and a number of techniques have developed that are more suited
to the changing needs of businesses, to help them create and manage value for both their
owners and their customers. Many of these techniques are still not widely used in practice.
However, it is important for you to understand them because they may gain popularity
as more managers and management accountants become aware of the limitations of
conventional management accounting systems. These new approaches can help to provide
the information that managers need to make their businesses world-class.
We begin this chapter by identifying some of the problems with conventional costing
systems. Activity-based costing has been one of the most significant responses to these
problems. We introduced activity-based costing in Chapter 7 when we looked at alternative
methods for allocating overhead costs to products at Hot Exhausts Ltd. However, there
are different approaches to activity-based costing that suit particular cost structures
and problems that businesses face. In this chapter we look at an actual implementation
of activity-based costing at the South Australian foundry Mason & Cox, to explain the
principles of activity-based costing and to describe a common approach to activity-based
costing that provides useful information for cost management as well as product costing.1
The focus in this chapter is on using activity-based costing to assign costs to products.
The role that activity-based costing (ABC) can play in managing resources is discussed
in Chapter 15, where ABC is applied to the management of customers and suppliers and
in Chapter 16, where the concept is extended to incorporate activity-based management.
The broader implications of activity-based costing for making decisions to create value are
dealt with throughout Part 4 of this book.
Y
L
N
O
R
E
T
P
A
H
C
E
L
SAMP
1 The Mason & Cox story is based on fact, although the characters are fictional, the analysis has been simplified, and the
numbers have been altered to maintain confidentiality. Mason & Cox was taken over by Hensley Industries Australia Pty
Ltd in 1999, which, in turn, was taken over by PAC Mining Pty Ltd in 2001. The foundry was closed in late 2003 when its
Environmental Protection Authority licence expired.
CHAPTER 8 ACTIVITY-BASED COSTING
LS(5e)-08.indd 363
363
17/11/08 11:38:46 AM
PROBLEMS WITH CONVENTIONAL PRODUCT
COSTING SYSTEMS
LEARNING
OBJECTIVE
1
Many Australian businesses use conventional costing systems. However, since the early 1980s
these systems have been widely criticised for failing to provide accurate product costs to
inform management decisions. Activity-based costing has evolved as an alternative approach.
Let’s begin our study of activity-based costing by reviewing the key features of, and problems
with, conventional costing systems.
FEATURES OF CONVENTIONAL PRODUCT COSTING SYSTEMS
conventional product
costing system a
product costing system
that traces direct
material and direct
labour to products, and
allocates manufacturing
overheads to products
using a predetermined
overhead rate, which
is usually based on a
volume-based cost
driver
Although conventional product costing systems vary from one business to another, they
usually include the following features:
■ Direct material and direct labour costs are traced to products.
■ Manufacturing overhead costs are allocated to products using a predetermined overhead
rate for the whole plant (or one for each production department).
■ The manufacturing overhead rate is calculated using some measure of production
volume—that is, using a volume-based cost driver.
■ Non-manufacturing costs are not assigned to products.
In selecting an overhead cost driver we should ask: ‘What causes, or drives, these manufacturing overhead costs?’ There needs to be a strong correlation between the overhead costs
and the cost driver to ensure that product costs are accurate—that is, that product costs do
measure the cost of resources used to produce the product. However, most conventional
costing systems assume that manufacturing overhead is driven by the volume of production,
which is measured by output measures such as the number of units produced, or, more commonly, by input measures such as the number of direct labour hours worked, the direct labour
cost, the number of machine hours worked or some measure of material inputs. Conventional
product costing systems tend to aggregate the overhead costs into very large cost pools, sometimes with a separate cost pool for each department, but often with just one cost pool for the
whole plant. Chapter 7 describes several conventional methods for allocating overhead costs
to products.
FAILURE TO ADAPT TO THE CHANGING
BUSINESS ENVIRONMENT
It is generally believed that the principles and practices of conventional costing systems were
developed by the mid-1920s (Kaplan, 1984; Johnson & Kaplan, 1987). Chapter 1 describes
the dramatic changes in the business environment since the 1980s. In many businesses, these
changes have led to changes in the number of products, the types of production processes
and the composition of costs, which are no longer compatible with assumptions underlying
conventional approaches to product costing. The following ‘Real life’ indicates that by the late
1980s, managers in Australia were being frustrated by problems with conventional product
costs. But what causes these problems?
Increasing levels of non-volume-driven manufacturing overhead costs
Conventional costing systems allocate manufacturing overhead costs to products, using
volume-based cost drivers. However, fixed manufacturing overhead costs do not vary with
production volume, although some of them do vary with other factors. That is, fixed overhead
may be non-volume driven. Also, it is assumed that variable overhead costs vary in proportion
to production volume. However, it is unlikely that a single cost driver (or even one cost driver
in each production department) can explain the behaviour of all variable overhead costs, and
while some of these costs may increase or decrease with production volume, they do not vary
in proportion to volume change. In the past these problems have not always caused major
364
LS(5e)-08.indd 364
PART 2 COSTS AND COSTING SYSTEMS
Y
L
N
O
R
E
T
P
A
H
C
E
L
SAMP
17/11/08 11:38:52 AM
COST SYSTEMS HAVE GONE AWRY!
In 1992, Stewart Lamond, who was a partner with Coopers and Lybrand Consultants in Sydney,
observed the following fundamental changes to the business environment: the development of the
global marketplace, an increased customer focus on quality, increased price sensitivity, the effects
of deregulation, and the ‘technological explosion’. In his experience, ‘Companies today have many
questions to which they need answers, though usually they must seek answers from increasingly
moribund traditional cost systems’. More than a decade later, these changes and outdated costing
systems continue to present major challenges in many businesses.
Lamond noted a range of information needs not satisfied by current costing systems, including
accurate estimates of the costs and profitability of goods and services. He described the experience
of three Australian companies, Parke Davis, ICI Film Products and Comalco Rolled Products, in their
search for better costing information. Each of these companies had identified a need for better product
costing, in particular for better ways to allocate overhead.
Management at Parke Davis was concerned about the company’s increasing level of overhead
costs and its arbitrary allocation of overhead to products, which resulted in the costs of some
products being understated and others overstated. ICI was troubled by product costs that were
inconsistent with operations managers’ views of actual costs. Products that the operations managers
felt were unprofitable were reported in ‘a favourable light’ in the current costing system. Comalco’s
management faced the same sorts of problems. Their product costing system lacked credibility
with managers and resulted in decisions that were inconsistent with the company’s manufacturing
strategy.
In many businesses, accurate product costs are essential to enable managers to make informed
decisions, and relying on inaccurate costs may adversely impact on an organisation’s competitiveness.
Parke Davis, ICI and Comalco were amongst the companies that recognised, by the late 1980s, the
problems that can arise from outdated costing systems.
REAL
LIFE
Source: Lamond (1992)
distortions to product costs because non-volume-driven manufacturing overhead costs have
been relatively insignificant. But is this still the case?
Exhibit 8.1 (overleaf) presents manufacturing cost information from a 1997 survey of
Australia’s 1000 largest manufacturers (Wijewardena & De Zoysa, 1999). Manufacturing
overhead costs averaged 21 per cent of manufacturing costs, direct labour 22 per cent, and
direct material 57 per cent, and survey respondents reported a trend of decreasing direct
labour and increasing factory overhead costs. The ‘machinery and computers’ industry was
the most overhead intensive (32 per cent of manufacturing costs) and ‘food and beverages’ the least overhead intensive (17 per cent). These results are consistent with a survey
of Australian manufacturers in 1995, which found that manufacturing overhead costs
accounted for 20 per cent of manufacturing costs, and the majority of these respondents
also indicated that overhead had increased as a proportion of product cost over the previous
five years (Booth & Giacobbe, 1997).2
Increasing proportions of non-manufacturing costs
Conventional product costing usually excludes non-manufacturing costs. However, many
non-manufacturing costs can be related directly to products, and these costs have become a
more significant proportion of total costs in many organisations. In today’s environment of
high technology, increased research and development, shortened product life cycles, increased
Y
L
N
O
R
E
T
P
A
H
C
E
L
SAMP
2 More recent information about the extent of overhead costs in Australian manufacturing businesses is not available.
However, the increasing emphasis on computer integrated automation and the associated reduction in direct labour
suggests that, in many businesses, manufacturing overheads are likely to be a significant cost.
CHAPTER 8 ACTIVITY-BASED COSTING
LS(5e)-08.indd 365
365
17/11/08 11:38:53 AM
Exhibit 8.1
Direct labour costs
22%
Manufacturing costs in
Australian businesses
Direct material costs
57%
Manufacturing
overhead
costs
21%
Relative importance of material, labour and overhead costs
levels of customer support and substantial marketing costs, manufacturing overhead and nonmanufacturing costs may account for a large proportion of a manufacturing entity’s costs.
product diversity the
number of different
products produced
Causes of changes in costs
Although not clear-cut, the evidence does suggest that manufacturing overhead costs are
increasing and becoming more non-volume-driven, and the proportion of non-manufacturing
costs that are incurred to develop, support and promote products are becoming more substantial. What has caused these changes?
■ Growing automation has certainly increased manufacturing overhead costs, relative to
direct labour costs. Moreover, more machines implies more non-volume-driven overhead
costs are incurred, such as depreciation, insurance and setups.
■ Greater product diversity has caused increased production complexity and this has
led to increased demand for manufacturing overhead support, such as production
scheduling, material handling and production setups. The costs of many of these support
functions do not vary in proportion to production volume. More product diversity has
also increased costs in non-manufacturing areas such as research and development,
product design, distribution and after-sales service.
■ Increased customer demands for improved service and quality have resulted in increased
manufacturing overhead and non-manufacturing costs (many of them not being driven
by production volume).
■ Many organisations are investing more resources in downstream areas such as customer
service and marketing. The increase in customer service costs reflects an increasing
emphasis on customer support. Increased marketing expenditure is also occurring as
many firms engage in increased product promotion and advertising to position their
products in the more aggressive market place.
Volume-based cost drivers do not drive many of the above costs, and therefore they are
inappropriate to use in costing products. Yet, as discussed in Chapter 7, volume-based cost
drivers are commonly used in Australian firms. Also, the wisdom of omitting, from product
costs for management decision-making purposes, non-manufacturing costs that are productrelated can be queried given their increased significance.
Y
L
N
O
R
E
T
P
A
H
C
E
L
SAMP
Changing product structures
The conventional approach to product costing did not cause too many problems when
businesses produced a limited range of products. However, to remain competitive many
366
LS(5e)-08.indd 366
PART 2 COSTS AND COSTING SYSTEMS
17/11/08 11:38:53 AM
businesses have increased the number of different products they produce. Apart from its
effects on the cost structure, product diversity causes cost distortions because conventional
costing systems are not good at recognising different overhead consumption patterns for
different products.
INDICATORS OF PROBLEMS WITH A PRODUCT COSTING SYSTEM
Conventional approaches to product costing are likely to result in inaccurate product costs
when:
■ proportion of direct labour costs decreases;
■ proportion of manufacturing overhead costs increases;
■ proportion of manufacturing overhead costs not related directly to production volume
increases;
■ non-manufacturing costs that are product-related become substantial; and
■ product diversity increases.
Firms often experience these types of changes in the modern business environment,
but how do they know when they need a new product costing system? Exhibit 8.2 outlines
common indicators of an outdated product costing system.
Indicator
Production managers want to drop products
that the costing system claims are profitable
■
These products use more production
resources than is indicated by their product
cost
■
Profit margins on individual products are
difficult to explain. For example, a product
has a higher than expected cost, and lower
margin
■
The product costing system is distorting the
product’s costs
■
Products that are difficult to make have high
profit margins
■
The costing system understates the costs of
making these products
■
Manufacturing and marketing managers
develop their own ‘private’ systems for
estimating product costs
■
Managers have lost faith in the ‘official’
product costing system
■
The management accountant spends a lot
of time on special product costing studies
■
The costing system does not provide reliable
information for product-related decisions
■
There are no competitors for products that
the costing system claims are profitable
■
The costing system is understating the costs
of these products
■
Competitors’ prices appear unrealistically
low
■
The costing system is overstating the costs
of these products
■
Customers are not deterred by price
increases
■
The costing system is understating the costs
of these products. Competitors already
charge higher prices
■
At year-end, actual overhead far exceeds
overhead applied to products
■
Applying overhead to products, using the
overhead application rate, understates the
overhead resources consumed. Product
costs are understated
■
The company consistently wins bids for
products that are difficult to produce and
loses bids for simple products
Indicators of an outdated
costing system
Y
L
N
O
R
E
T
P
A
H
C
E
L
SAMP
■
The costing system is understating the costs
of complex products and overstating the
costs of simple products
CHAPTER 8 ACTIVITY-BASED COSTING
LS(5e)-08.indd 367
LEARNING
OBJECTIVE
Exhibit 8.2
Probable cause
■
Source: Adapted from Cooper (1989)
2
367
17/11/08 11:38:53 AM
When inaccurate product cost information is used by managers to make decisions, the
effect on the business may be profound. The ‘Real life’ on page 365 provides some examples
of firms that have had this unhappy experience.
PROBLEMS WITH COSTING IN SERVICE BUSINESSES
In Chapter 6 we noted the increasing size and importance of the service sector. There may also
be problems with conventional costing systems in service enterprises. Many businesses do not
estimate the costs of individual services, but those that do have tended to use business-wide
volume-based overhead rates. As in the manufacturing sector, overhead costs have become
increasingly important and increasingly non-volume driven.
In the service sector, customers are demanding a more diverse range of higher-quality
services. Consider, for example, housing loans. There was once very little difference between
the terms and conditions of housing loans offered by the various banks but, since the late
1980s, the range of housing loan packages has grown exponentially. Banks are seeking to
differentiate their products by offering different establishment fees, different terms and flexible repayment plans. Moreover, the range of non-bank lenders in the housing market has
increased dramatically. There is fierce competition over interest rates. These forces have had
the same impact as in manufacturing: increased product diversity and increased overhead
costs. Each of these products is part of a carefully devised marketing strategy, supported by
detailed cost analysis. However, customer demands for service diversity and quality add to
the level of non-volume-driven overhead costs and cast doubt on the accuracy of service costs
derived from conventional costing systems. Clearly accurate costing can provide important
information to assist those banks to achieve their strategies.
ACTIVITY-BASED COSTING
Activity-based costing (ABC) may be used to overcome the problems with conventional
product costing systems. One Australian business that implemented activity-based costing was
Mason & Cox Foundries. This foundry produced moulded metal equipment, called ‘castings’,
for a wide range of local industries including mining, sugar refining, cement manufacture, and
general engineering companies. It also produced for export markets. The company’s major
product lines included the ‘Hensley’ line of digging equipment, used in mining; the ‘Canron’
range of mining products; and custom-made castings.
PRODUCTION PROCESSES AT MASON & COX
To understand Mason & Cox’s costing system, you need to be familiar with its production
processes. Casting usually involves six main steps:
1 Product designs, called ‘patterns’, are drawn.
2 Moulds are built, based on the patterns.
3 The metal is melted and poured into the moulds.
4 When the metal has set, the castings are knocked out of their moulds and sent for
finishing.
5 In finishing, the castings are smoothed. Any high spots are ground down, and hollow
spots are welded up.
6 Last, the casting is heated.
PROBLEMS WITH THE CONVENTIONAL COSTING SYSTEM AT
MASON & COX
Y
L
N
O
R
E
T
P
A
H
C
E
L
SAMP
By the early 1990s, Mason & Cox’s management had become concerned about their product
costing. The company used a conventional costing system. However, there were a number of
managers at Mason & Cox who were sure that their product costs were inaccurate.
368
LS(5e)-08.indd 368
PART 2 COSTS AND COSTING SYSTEMS
17/11/08 11:38:54 AM
The product costs did not make sense to production managers
Joe Costello, the manufacturing manager, had no faith in the current system and selected two
products to prove his point. Mason & Cox manufactured two types of 7.5 kilogram ‘teeth’ for
digging up ground in the mining industry. The Hensley Tooth was one of their best sellers.
It was made in batches of 250 and the company sold about 25 000 each year. The other type,
a Custom Cast Tooth, was made specifically for Mount Isa Mines. It was made to order
in batches of 50 about ten times a year. As shown in Exhibit 8.3, the existing conventional
product costing system estimated that both these castings cost the same to produce—$36.32.
Their direct costs were the same, because they used the same basic direct labour operations
and the same direct materials. Manufacturing overhead was applied on direct labour hours, so
they both had the same amount of applied overhead.
Yet Costello was certain that the Hensley Tooth could not cost the same as the Custom
Cast Tooth. Many overhead services were provided for individual batches and, as the
Custom Cast Tooth was made in much smaller batches, Costello felt that its overhead cost
per unit should be higher. Also, the Hensley Tooth was simple to make, while custom-made
products were generally more complex. For these reasons, each Custom Cast Tooth required
a lot more overhead support, yet none of this showed up in its conventional product cost. This
was not an isolated case. Costello was sure that the conventional product costing system was
overstating the cost of the company’s popular products, the high-volume lines, and understating the cost of the minor products, the low-volume lines.
Product profit margins were difficult to explain
The marketing people at Mason & Cox were also perplexed. The company had set its prices
at the conventional product cost plus some ‘markup’, but the marketing manager, Danny
Exhibit 8.3
7.5 kg Hensley Tooth
Direct material (metal and sand)
$12.00
Conventional product
costs at Mason & Cox
Direct labour:
Moulding (4 minutes @ $0.33 per minute)
1.32
Metal melting (6 minutes @ $0.50 per minute)
3.00
Finishing (20 minutes @ $0.30 per minute)
6.00
10.32
Manufacturing overhead:
14.00
(0.5 direct labour hours @ $28 per hour)*
$36.32
Product cost (DM, DL and MOH)
7.5 kg Custom Cast Tooth
Direct material (metal and sand)
$12.00
Direct labour:
Moulding (4 minutes @ $0.33 per minute)
1.32
Metal melting (6 minutes @ $0.50 per minute)
3.00
Finishing (20 minutes @ $0.30 per minute)
6.00
10.32
Manufacturing overhead:
(0.5 direct labour hours @ $28 per hour)*
Product cost (DM, DL and MOH)
14.00
Y
L
N
O
R
E
T
P
A
H
C
E
L
SAMP
$36.32
* Manufacturing overhead rate
= budgeted manufacturing overhead ÷ budgeted direct labour hours
= $4 880 000 ÷ 174 285 DLH
= $28 per direct labour hour
CHAPTER 8 ACTIVITY-BASED COSTING
LS(5e)-08.indd 369
369
17/11/08 11:38:54 AM
Harris, was not able to make any sense of these prices. To compete in the marketplace, Harris
had found he had to cut the price of the high-volume lines like the Hensley Tooth. But with
speciality products like the Custom Cast Tooth, a low-volume line, they had seemed able to
charge well above the cost-based price.
Company profits were being eroded
Roy Kidman, the managing director, was also far from pleased because company profit was
not meeting monthly targets. The price cuts on the high-volume lines had increased sales
volume but eroded total sales revenue. The better-than-expected prices on the speciality
products had not offset the poor performance of the high-volume lines.
CAUSES OF THE PROBLEMS WITH THE CONVENTIONAL
COSTING SYSTEM
Eventually, Costello and Harris tackled the accounting manager, Olivia Shannon, who recognised these problems as classic indicators of an outdated costing system. Mason & Cox’s
costing system was developed in the 1920s and had changed little since then, despite:
■ product range becoming far more diverse;
■ manufacturing overhead increasing significantly, relative to direct costs, and becoming
more non-volume driven; and
■ non-manufacturing costs, which were product-related, increasing, relative to
manufacturing costs.
Using a volume-based cost driver
Mason & Cox’s product costing system had used direct labour hours, a measure of production
volume, as a cost driver to apply manufacturing overhead costs to products. Yet an analysis
of the company’s manufacturing processes indicated that a significant part of the overhead
costs was caused by factors other than production volume. For example, some of the overhead costs, such as setup costs, were incurred for each production batch regardless of the
number of castings in the batch. Others, such as factory rent, were incurred each month regardless of the number of castings produced. Still others were caused by product complexity.
OUTDATED COSTING SYSTEMS IMPLY DISTORTED
PRODUCT COSTS
What did this mean for the product costs at Mason & Cox? Earlier in this chapter we warned
that conventional costing systems are not suited to businesses where product diversity has
increased and cost structures have become more overhead-intensive, and where a higher
proportion of the overhead costs are fixed costs. Under these circumstances, the costs of
high-volume, relatively simple products produced in large batches are likely to be overstated,
and the costs of low-volume, speciality products produced in small batches are likely to be
understated. Indeed, this seemed to have happened with the Hensley Tooth and the Custom
Cast Tooth.
In addition, Olivia Shannon was concerned about the non-manufacturing costs. She felt
that product-related costs were not confined to the manufacturing area but were spread right
across the value chain. Over time, non-manufacturing costs, both upstream and downstream,
had grown. Many of them, such as product design and development costs and advertising costs, were related to particular products and were used disproportionately by different
products. Yet, as shown in Exhibit 8.4, like many other conventional costing systems, the
Mason & Cox system had not assigned these costs to product. Instead, all non-manufacturing
costs were expensed in the period in which they were incurred. How could management have
made rational decisions about which products to produce, and what prices to set, if these
product-related costs were ignored?
370
LS(5e)-08.indd 370
PART 2 COSTS AND COSTING SYSTEMS
Y
L
N
O
R
E
T
P
A
H
C
E
L
SAMP
17/11/08 11:38:54 AM
Exhibit 8.4
Included in conventional product cost
No
No
Research
and
development
Design
Upstream
No
Supply
Yes
Manufacturing
or
production
No
No
Marketing
Distribution
The value chain and
conventional product
costing
No
Customer
service
Value of
products and
services
Downstream
THE SOLUTION: ACTIVITY-BASED COSTING
Shannon had heard about activity-based costing, which has the potential to overcome many of
the problems that occur with conventional costing systems. Activity-based costing (ABC) is
a methodology that can be used to measure both the cost of cost objects and the performance
of activities. It evolved in the mid-1980s to improve the allocation of manufacturing overhead
costs to products, but it soon became apparent that activity-based costing systems could be
expanded to include non-manufacturing costs.
From the early 1990s, many companies, including some of Australia’s icons (as described
in the ‘Real life’ overleaf), have come to realise that activities that form the basis of activitybased costing are more than mechanisms for costing products. They can be used to analyse
the profitability of major customers and they provide a logical framework for managing the
business through the identification and analysis of key activity characteristics such as root
cause cost drivers and performance measures. We consider this broader role for activity-based
costing in Chapters 15 and 16.
activity-based costing
(ABC) a methodology
that can be used to
measure the cost of
cost objects and the
performance of activities
AN ACTIVITY-BASED COSTING MODEL
In learning about activity-based product costing, Shannon had felt overwhelmed by the many
new terms she encountered.3 The model shown in Exhibit 8.5 (overleaf) helped her to come
to grips with the mechanics of activity-based costing.
The model shows that activity-based costing can be used for two purposes: costing and
activity management.
3
LEARNING
OBJECTIVE
COSTING VIEW
The vertical, costing view shows how activity-based costing can be used to estimate the cost
of products.
Step one: Measuring the costs of activities
The first step is to measure the cost of the resources used to undertake each activity. An
activity is a unit of work performed within the organisation—that is, activities are the ‘things
that are done’ within the business. Common activities in the manufacturing area of Mason
& Cox included ‘Set up machine’, ‘Operate machine’, ‘Move material’ and ‘Inspect parts’. To
determine the total cost of each type of activity, resource drivers are used to assign costs to separate cost pools for each activity. The costs of the resources are already recorded in the existing
accounting system and include items such as wages, supplies and utilities costs. Resource
drivers are cost drivers used to estimate the cost of resources consumed by an activity.
Remember, cost drivers are factors or activities that cause costs. For example, factory area
may be a cost driver for factory cleaning costs—the bigger the factory, the higher the costs of
activity a unit of work
performed within the
organisation
resource driver a cost
driver used to estimate
the cost of resources
consumed by an activity
Y
L
N
O
R
E
T
P
A
H
C
E
L
SAMP
cost driver a factor or
activity that causes a
cost to be incurred
3 The terminology used in this section is based on: Raffish & Turney, 1991 and Turney, 1991.
CHAPTER 8 ACTIVITY-BASED COSTING
LS(5e)-08.indd 371
371
17/11/08 11:38:54 AM
REAL
LIFE
R.M. Williams
ABC IN SOME AUSTRALIAN ICONS
We discuss costing at R.M. Williams in Chapter 10, when we describe standard costing. R.M. Williams
is a successful designer, manufacturer and retailer of boots, clothing and accessories, initially for
‘people from the bush’, but over time the company has become an Australian icon, with a high profile
both in Australia and overseas.
With help from a federal government industry assistance program, the
company revisited the way it costed some of its key products, using activitybased costing to help to ensure maximum profitability from each major product
group. In addition to providing more accurate product costs, R.M. Williams
found that activity-based costing (ABC) enabled the company to identify what
drives costs and to strive for future savings.
Telstra is the major provider of telecommunications services in Australia. In
the early 1990s, the company completed a major review of its costing system.
It discovered that managers were uncertain about product and process costs,
overheads were allocated to products by algorithm, and too many decisions
were based on gut feeling rather than on reliable costing information. As a
consequence, Telstra was unable to identify the costs of changes in strategic
direction and was at risk of making uncompetitive and inappropriate decisions.
Telstra needed a costing system that would give the organisation better
information for decision making, including more accurate product and process
costs. It achieved this by implementing activity-based costing.
In describing real-life experiences with cost drivers in Chapter 3, we
introduced you to Holden Engine Company (HEC), located at Fishermans
Bend in Victoria. Holden Engine Company manufactures a range of engines and components for local
and overseas vehicle manufacturers. The company had operated as a division of GM Holden, and when
it was established as a separate company in 1986, it maintained its conventional approach to product
costing. Manufacturing overhead was allocated to products on the basis of direct labour hours.
In that era at Holden Engine Company overheads represented 40 per cent of manufacturing cost,
while direct labour was only 5 per cent. The company produced a diverse range of products that had
varying levels of complexity. Production volume, machine cycle time and batch size differed significantly
between products.
By 1990 the company was struggling. Profitability had declined and there was a possibility that
subsidies from its parent company, General Motors Overseas Corporation, would cease. As part of the
strategy for survival, HEC decided to build parts for car makers other than GMHA, but to do this the
company needed more accurate information about product costs and product profitability, as well as
better information for cost management. The solution for HEC was to introduce ABC.
Activity-based costing has also been used by the National Roads and Motorists’ Association
(NRMA) in New South Wales and, according to one published report, with great success. NRMA
accounting staff identified a number of deficiencies in their management accounting system, particularly
the ‘blanket’ overhead allocation rates, which simply spread high administrative costs across all types
of services. This approach could not supply accurate service costs.
Activity-based costing was used to cost NRMA’s services. The impact was dramatic, with all
services altering their relative cost/profit positions. In addition, ABC was used for activity management,
which enabled management to identify the costs of non-value-added activities and the impact of their
total quality management (TQM) program.
From mid-1998, the Group Costing unit of Commonwealth Bank of Australia began transforming
the Bank’s approach to costing and cost management. Their first project focused on developing
activity-based costing, which provided detailed information about processes, products and customer
segments, across the entire bank.
Y
L
N
O
R
E
T
P
A
H
C
E
L
SAMP
Sources: www.isr.gov.au/industry/tcf/cs2000/case_studies/rm_williams.html (2000); Newbold (1997); Chenhall & Langfield-Smith (1999);
Vogel & Crossley (1992); www.agility.com.au/clienttestimonials/text.html (2004)
372
LS(5e)-08.indd 372
PART 2 COSTS AND COSTING SYSTEMS
17/11/08 11:38:55 AM
Exhibit 8.5
COSTING VIEW
An activity-based
costing model
RESOURCES
(i.e. costs)
Source: Turney (1991)4
Step
one
Resource drivers
ACTIVITY
MANAGEMENT
VIEW
Root cause
cost drivers
ACTIVITIES
Activity drivers
Performance
measures
Step
two
COST OBJECTS
(e.g. products)
cleaning. The ‘Real life’ (overleaf) describes how the police in a number of Australian states
have identified the costs of various policing activities.
Step two: Assigning activity costs to products
The outcome of Step one is a list of the activities performed in the business, and total activity
costs. The second step is to calculate the cost per activity and to assign these activity costs to
cost objects using activity drivers. An activity driver is a cost driver used to estimate the cost
of an activity consumed by the cost object. For example, the number of setups might drive
the cost of the activity ‘Set up machine’. The more times the machine has to be set up, the
higher the total cost of the setup activity. A product that uses two setups will be assigned twice
as much in setup costs as a product that uses only one setup. A cost object is any item for
which management wants a separate measure of cost. Products, services, customers, suppliers,
contracts and projects are examples of cost objects. In Chapter 15 we describe how activitybased costing can be used to estimate the costs associated with customers and suppliers. At
Mason & Cox, the activity-based system was used to estimate the costs of the products. Step
two produced a total cost for each product that consisted of a list of the activities used by the
product and their costs.
activity driver a cost
driver used to estimate
the cost of an activity
consumed by the cost
object
cost object an item
that is assigned a
separate measure
of cost
ACTIVITY MANAGEMENT VIEW
The horizontal, activity management view shows how activity-based information can be used
to monitor and control what is happening in a business. In addition to analysing activity costs,
the activity management view provides information about the root causes of activities, their
value to customers, and various measures of their performance. This can provide an effective
way of managing (or controlling) costs, as well as managing other sources of customer value
such as quality and timely delivery. Mason & Cox actually used activity-based costing to cost
Y
L
N
O
R
E
T
P
A
H
C
E
L
SAMP
4 Adapted from page 96 of Common Cents: The ABC Performance Breakthrough by Dr Peter B.B. Turney, president and
CEO of Cost Technology Inc., a management consulting firm specialising in ABC/ABM implementations, Cost
Technology Inc., Beaverton, Oregon, 1991. Reprinted by permission of the publisher. All rights reserved.
CHAPTER 8 ACTIVITY-BASED COSTING
LS(5e)-08.indd 373
373
17/11/08 11:38:55 AM
REAL
LIFE
Police on duty at the
Sydney 2000 Olympics
IDENTIFYING AND MEASURING
POLICE ACTIVITIES
In the past, little attention has been paid to the resources consumed by various policing activities. Since
the late 1990s, the police in a number of Australian states and in New Zealand have implemented an
activity measurement project to identify the key
activities performed and their costs. The methods
used to collect activity data have varied among
jurisdictions. In South Australia, police officers
were required to fill in a survey form every 15
minutes across each shift during a survey period
of two weeks. The list of activities included in the
survey was based on those identified in other
Australian jurisdictions. A total of 126 activities
were identified for general policing, including
‘community patrols’, ‘police station services’,
‘traffic policing’, ‘traffic crash investigation’,
‘targeting illegal drug activity’ and so on.
The activity-based data provides information for
cost management, particularly when benchmarked
against other jurisdictions. For example, a recent
national report found that the South Australian police spent a higher proportion of their time on
‘crime investigation’ than other states; the Australian Capital Territory police spent most resources on
‘community safety and support’; Victoria spent most on ‘road safety and traffic management’; and the
Western Australian police spent most on ‘services to the judicial process’.
Activity information can also be used to estimate the costs of major programs. For example, the
National Drug Law Enforcement Research Fund supported an activity-based study of the cost of police
activities associated with alcohol-related crime in New South Wales. Based on a survey of time spent,
the major activities involved responding to alcohol-related assault incidents, random breath testing and
paper-work. This study found that policing alcohol-related activities cost the NSW government almost
$50 million in 2005.
Source: Dadds & Scheide (2000); Donnelly et al. (2007)
products and to manage activities, but at this stage we will focus on the product costing. In
Chapter 16 we will look at how Mason & Cox also used their activity-based system for activity management.
THE NATURE OF THE COST DRIVERS
root cause cost
drivers the underlying
factors that cause
activities to be
performed and their
costs to be incurred
By now you will have noticed that ABC uses cost drivers in three different ways. Cost drivers
called resource drivers are used to assign costs to activities. Cost drivers called activity drivers are
used to assign activity costs to cost objects. And, as Exhibit 8.5 shows, cost drivers called root
cause cost drivers are used for activity management. They are called root cause cost drivers
because they describe the primary reason that the activity is performed. Different names are used
for each of these cost drivers because they each play a different role in activity-based costing.
Y
L
N
O
R
E
T
P
A
H
C
E
L
SAMP
INITIAL DECISIONS ABOUT ABC AT
MASON & COX
LEARNING
OBJECTIVE
4
374
LS(5e)-08.indd 374
The starting point for any ABC implementation is to identify the problem that needs to be
addressed. Shannon identified the main problem that the company was facing as distorted
PART 2 COSTS AND COSTING SYSTEMS
17/11/08 11:38:56 AM
product costs. She assessed three possible activity-based approaches that could be used to
tackle this problem:
1 simple activity-based product costing system, which allocates manufacturing overhead
costs to products;
2 activity-based product costing system for indirect costs, which allocates manufacturing
overhead costs and non-manufacturing costs to products; and
3 comprehensive activity-based system for allocating all costs (except direct material) to
products and for activity management.
The report she prepared for Kidman is shown in Exhibit 8.6. It demonstrates that the
more inclusive the system, the greater are both the costs and the benefits.
In Chapter 7 we described three approaches to allocating manufacturing overhead costs to
products. It is useful to think of each of these approaches as part of a continuum of costing
systems, with both the accuracy of product costs and the complexity of the costing system
increasing as we move along the continuum.
■ The simplest and least accurate approach is to use a plantwide overhead rate, where all
manufacturing overhead costs are accumulated in a single cost pool and allocated to
products using a single volume-based cost driver.
To:
From:
RE:
Exhibit 8.6
Roy Kidman, Managing Director
Olivia Shannon, Accounting Manager
Evaluation of activity-based costing
Evaluation of activitybased costing for
Mason & Cox
I have had a look at activity-based costing. This is a tricky area because there are a number of
different approaches that we could use. Since we have a serious problem with product costing,
I have evaluated the simplest approach to activity-based product costing and then looked at
two refinements. I have summarised my findings in the accompanying table.
Evaluation
ABC approach
Costs included
Benefits
1 Simple activitybased product
costing system*
■
Manufacturing
overhead
■
Product costs
more accurate
than existing
system
■
More complex than
existing system
because more
thorough analysis
of manufacturing
overhead
2 Activity-based
product costing
system for indirect
costs
■
Manufacturing
overhead and
non-manufacturing
costs
■
Product costs
more accurate than
simple ABC system
as it covers wider
range of costs
■
More complex
than simple ABC
system because
wider range of
costs analysed
3 A comprehensive
ABC system for
product costing
and activity
management
■
All costs, except
direct material
costs
■
Accurate product
costs as full range
of costs covered
Improved
management
of costs and
performance in
other strategic
areas
■
More complex
than including
just indirect costs
because an even
wider range of
costs is analysed
and the costs are
analysed in more
detail
■
Costs
Y
L
N
O
R
E
T
P
A
H
C
E
L
SAMP
* This approach is described in Chapter 7 and the appendix to this chapter.
CHAPTER 8 ACTIVITY-BASED COSTING
LS(5e)-08.indd 375
375
17/11/08 11:38:56 AM
Departmental overhead rates are more accurate than a plantwide rate, but also more
complex as manufacturing overhead costs are accumulated into a separate cost pool for
each production department, and each cost pool has its own volume-based cost driver.
■ Activity-based costing further increases the accuracy and complexity of allocating
manufacturing overhead costs to products. Manufacturing overheads are accumulated in
a separate cost pool for each activity, and each activity has its volume- or non-volumebased cost driver.
Now in this chapter we have introduced two refinements to activity-based costing that
expand the possible range of costs to include:
■ non-manufacturing overheads; and
■ direct labour costs.
While Shannon and Kidman could not have predicted the actual levels of costs and benefits identified in Exhibit 8.6 (see page 375), they felt intuitively that, at Mason & Cox, the
best solution was to adopt an ABC system that could be used first for product costing, and then
at a later stage for activity cost management. Thus, a comprehensive ABC system was implemented. This involved higher costs in designing, implementing and maintaining the system,
but provided more accurate product costs and improved information for cost management.
■
WHICH COSTS SHOULD BE INCLUDED IN THE ABC SYSTEM?
Although activity management is not discussed until Part 3 of this book, it is important to
understand that the decision to include activity management in its ABC system influenced
the range of costs analysed by Mason & Cox. Direct labour, manufacturing overhead and
non-manufacturing costs were analysed so that management could obtain useful information
for managing activities right across the business. Also, the system was built around a long
and detailed list of activities. If a simple product costing system had been chosen instead, the
structure would have looked quite different. It would have covered manufacturing overhead
costs only, and would have been based on a relatively short list of broadly defined overhead
activities. You have encountered this simpler approach to ABC in the Hot Exhausts Ltd
case study in Chapter 7, and it is described in more detail in the appendix to this chapter.
Ultimately, the range of costs included in an activity-based system depends on its purpose,
which, in turn, depends on the needs of the organisation.
Direct material costs were not included in the Mason & Cox ABC system. As in most
organisations, the Mason & Cox’s existing accounting system provided accurate estimates of
direct material costs, so Shannon saw no real benefit in putting them through the activitybased system.
USING THE ABC MODEL FOR PRODUCT
COSTING AT MASON & COX
LEARNING
OBJECTIVE
5
In the activity-based costing model described in Exhibit 8.5 (see page 373), the costing view
is used to cost products. There are two steps: measuring the cost of activities and assigning
activity costs to cost objects or products. We will describe how Shannon worked through
these two steps by analysing the costs and activities for the year.
STEP ONE: MEASURING THE COSTS OF ACTIVITIES
Y
L
N
O
R
E
T
P
A
H
C
E
L
SAMP
In the first step, the costs of resources are assigned to activities. This process can be simplified
by using activity centres: costs are assigned to activity centres and then to activities.5
5 Activity centres receive inconsistent treatment in the literature. Brimson, 1991, and O’Guin, 1991, use them in
this manner. In contrast, Turney, 1991, uses activity centres to aggregate activities within processes or functions for
reporting purposes.
376
LS(5e)-08.indd 376
PART 2 COSTS AND COSTING SYSTEMS
17/11/08 11:38:56 AM
Assigning costs to activity centres
Shannon began by dividing the company into activity centres. An activity centre consists
of a work area in which the activities have a common purpose. The types of activity centres
vary from one organisation to another. At Mason & Cox, there were nine activity centres:
‘Corporate management’, ‘Administration’, ‘Sales and dispatch’, ‘Factory management’,
‘Pattern design’, ‘Moulding’, ‘Metal melting’, ‘Finishing’ and ‘Quality control’.
Next, Shannon assigned costs to each activity centre using resource drivers. The costs
included all direct labour, manufacturing overhead and non-manufacturing costs for the past
year and totalled $11.13 million. They were drawn directly from the general ledger accounts.
Where costs were of a similar nature and driven by the same resource driver, Shannon combined them into a single cost category to simplify the allocation process. For example, rent,
insurance, council rates and cleaning costs were combined as ‘building costs’. This approach
enabled Shannon to reduce the relatively large number of general ledger accounts to six cost
categories: ‘Wages’, ‘Depreciation’, ‘Consumables’, ‘Energy’, ‘Building costs’ and ‘Other costs’.
You will remember that a resource driver is a cost driver used to estimate the cost of
resources used by an activity. It can also be used to estimate the cost of the resources used
by an activity centre. Resource drivers often include the sorts of cost allocation bases used to
assign indirect costs to responsibility centres, as described in Chapter 7, such as floor area,
number of employees and various measures of direct inputs used. Some costs can be traced
directly to activity centres rather than allocated, for example the wages of the people who work
in a particular activity centre.
Exhibit 8.7 (overleaf) shows how Shannon assigned the costs to the nine activity centres,
and the resource drivers used. Let’s look at the costs of the Administration Centre. She identified
the employees who worked in the Administration Centre and, using payroll records, estimated
their wages and related on-costs at $800 000. She prepared a list of the equipment in the
Administration Centre and identified depreciation expenses of $40 000 for that equipment. She
reviewed the order forms for consumables and compiled a list of the orders from Administration;
they totalled $50 000. She measured the floor space occupied by the Administration Centre and
allocated building costs of $10 000 on that basis. Finally, she spread the ‘Other costs’ in proportion to the number of employees working in each centre, and Administration was assigned
$7000. Exhibit 8.7 (overleaf) shows only the costs assigned to the Administration Centre, but
exactly the same procedures were used to assign costs to the other eight centres.
activity centre a
work area in which
the activities have a
common purpose
Identifying and costing the activities performed in each activity centre
Once the activity centres had been costed, Shannon needed to assign the activity centre costs
to activities. She interviewed representatives from each activity centre to identify activities and
their resource drivers. While some activities may be common to most organisations, many of
them will be specific to individual businesses.
Let’s look at the method that Shannon used for developing the cost pool for the activity ‘Process receivables’ in the Administration Centre. This is illustrated in Exhibit 8.8 (see
page 379). The wages assigned to Administration in Exhibit 8.7 were $800 000. The interviewees from Administration estimated that the employees within the centre spent 22 per
cent of their time processing receivables, so 22 per cent of the wages cost ($176 000) was
assigned to ‘Process receivables’. The depreciation costs for the Administration Centre were
$40 000, which related to the Centre’s 10 computer terminals. One of the terminals was
used exclusively and another was used about half of the time to process receivables, so 15 per
cent of the depreciation costs ($6000) were assigned to the activity ‘Process receivables’. To
understand how the remaining costs were assigned to the activity ‘Process receivables’, review
the costs assigned to the Administration Centre and the resource drivers shown for each cost
in Exhibit 8.8 (see page 379). While we describe ‘Process receivables’ as an activity, some
businesses refer to activities as cost pools, reflecting the fact that a number of costs have been
pooled to estimate the cost of an activity.
Y
L
N
O
R
E
T
P
A
H
C
E
L
SAMP
CHAPTER 8 ACTIVITY-BASED COSTING
LS(5e)-08.indd 377
377
17/11/08 11:38:57 AM
Exhibit 8.7
Assigning costs of
resources to activity
centres at Mason & Cox
* Energy used by Administration
Centre was minimal.
TOTAL COSTS ACROSS
MASON & COX
ACTIVITY CENTRE: COSTS ($’000s)
Wages $6.17m
Resource driver: assigned
directly based on
employees in the centre
Corporate management $563
Quality control
Finishing
Melting
Depreciation $1.01m
Resource driver: assigned
directly to equipment in
the centre
$3115
Moulding
$1710
Pattern design
$482
Factory management
Sales & dispatch
Consumables $1.96m
Resource driver:
orders placed by the centre
Energy $1.80m
Resource driver:
kilowatts used by the centre
Building costs $0.15m
Resource driver: floor space
occupied by the centre
$1072
$2349
$682
$250
Administration
Wages
Depreciation
Consumables
Energy*
Building costs
Other costs
Total
$800
40
50
0
10
7
$907
Total activity centre costs $11.13m
Other costs $0.04m
Resource driver: number of
employees in the centre
Total costs $11.13m
Exhibit 8.8 shows the costs of only one activity, ‘Process receivables’, in one activity
centre, Administration. However, the same procedures were used to cost the other activities
in the Administration Centre and in the eight other centres.
Once the interviews were complete, Shannon was able to compile a list of all the activities
performed at Mason & Cox and their estimated cost. The costed activities became the basic
building blocks for the product costing system.
While the activities of a foundry may seem quite foreign to you, the ‘Real life’ (overleaf)
deals with more familiar territory, describing the resources and activities used by an Australian
university to estimate the costs of its courses and programs.
STEP TWO: ASSIGNING ACTIVITY COSTS TO PRODUCTS
According to the model shown in Exhibit 8.5 (see page 373), the second step of activity-based
product costing is to assign activity costs to products. This involves estimating the cost per unit
of activity driver for each activity, and then preparing a bill of activities for each product.
Y
L
N
O
R
E
T
P
A
H
C
E
L
SAMP
Calculating the cost per unit of activity driver
When interviewees identified activities in the previous step, they also identified activity drivers
for each activity. You will remember that an activity driver is a cost driver used to estimate
378
LS(5e)-08.indd 378
PART 2 COSTS AND COSTING SYSTEMS
17/11/08 11:38:57 AM
ADMINISTRATION CENTRE
COSTS*
ADMINISTRATION CENTRE
ACTIVITIES: COSTS ($'000s)
Wages $800 000
Resource driver: % labour
time spent on the activity
Depreciation $40 000
Resource driver: machines
used by the activity
* See Exhibit 8.7.
Prepare payroll
Operate IT system
Process payables
Consumables $50 000
Resource driver:
consumables used by
the activity
Energy $0
Resource driver: kilowatts
used for factory's machines
Building costs $10 000
Resource driver: floor area
occupied by the activity
Exhibit 8.8
Assigning activity centre
costs to activities at
Mason & Cox
$132
$300
$275
Process receivables
Wages
Depreciation
Consumables
Energy
Building costs
Other costs
Total
$176.0
6.0
14.5
0
2.0
1.5
$200
Total activity costs $907 000
Other costs $7000
Resource driver: % labour
time spent on each activity
Total costs $907 000
the cost of an activity consumed by the cost object—in this case, products. For example, the
‘number of invoices processed’ is an activity driver for the activity ‘Process receivables’. It can
be used to assign the cost of the activity ‘Process receivables’ to all the products that involve
receivables. In selecting an activity driver, there must be a linear relationship between the
activity costs and the activity driver, otherwise the cost of the cost object will be distorted. For
example, when we select the number of invoices as the activity driver, we are saying that twice
as many resources are used to process two invoices as are used to process one invoice.
Shannon obtained estimates of the quantity of activity driver for each activity for the year
so that she could calculate the cost per unit of activity driver. Some businesses use the term
cost pool rate to describe the cost per unit of activity driver, reflecting the fact that an activity is
a cost pool.6 The activities, costs and activity drivers are shown in Exhibit 8.9 (overleaf).
A careful examination of Exhibit 8.9 shows that there are three main types of activity
driver:
cost per unit of
activity driver the
total cost of an activity
divided by the quantity
of its activity driver
Y
L
N
O
R
E
T
P
A
H
C
E
L
SAMP
6 Because each product may consume a large number of activities, some ABC systems include an intermediate step
where individual activities are combined into larger homogeneous ‘activity cost pools’. The aim is to reduce the
complexity of the costing system by reducing the number of ‘activities’ and therefore the number of activity drivers.
To be aggregated into a larger cost pool, activities must share a common activity driver. Shannon chose not to use
these larger ‘activity cost pools’.
CHAPTER 8 ACTIVITY-BASED COSTING
LS(5e)-08.indd 379
379
17/11/08 11:38:57 AM
Exhibit 8.9
Activities and activity
costs per unit
of activity driver,
Mason & Cox
Activity centres and
activities
Corporate management
Manage business
(CEO and Board)
Prepare annual accounts
Administration*
Process receivables
Process payables
Operate IT system
Prepare payroll
Sales & Dispatch
Process sales order
Factory management
Program production
Expedite orders
Manage plant
Pattern design
Design method
Issue pattern
Moulding
Make CT moulds
Make job moulds
Move material
Melting
Pour metal
Finishing
Grind castings
Weld defects
Set up heat treat furnace
Operate heat treat furnace
Quality control
Inspect moulds
Inspect castings
Preventative maintenance
Total costs
Activity
cost
(’000s)
$471
92
563
Activity driver
None available
None available
200
275
300
132
907
No. of invoices
No. of purchase orders
No. of minutes CPU time
No. of payslips
250
No. of sales orders
262
220
200
682
No. of production runs
No. of expedited batches
No. of production man-hours
357
125
482
Direct assignment†
No. of patterns issued
Quantity
of activity
driver
Cost per
unit of
activity
driver
Facility activity
Facility activity
5 000
2 500
100 000
3 385
$40
110
3
39‡
2 500
100
1 000
500
100 000
262
440
2
1 000
125
810
480
420
1 710
No. of man-hours
No. of man-hours
No. of moves
40 500
24 000
10 000
20
20
42
3 115
No. of kilograms
778 750
4
560
377
332
1 080
2 349
No. of man-hours
No. of man-hours
No. of setups
No. of kilogram-hours
16 000
13 000
1 000
540 000
35
29
332
2
60 000
20 000
14 525
5
11
38
300
220
552
1 072
$11 130
No. of moulds inspected
No. of castings inspected
No. of machine-hours
Y
L
N
O
R
E
T
P
A
H
C
E
L
SAMP
* See Exhibit 8.8 on page 379.
†
The costs of ‘Design method’ was assigned directly to individual products based on their consumption of these activities.
‡
Rounded
380
LS(5e)-08.indd 380
PART 2 COSTS AND COSTING SYSTEMS
17/11/08 11:38:58 AM
ABC IN AUSTRALIAN UNIVERSITIES
REAL
LIFE
In 1998, the Department of Education, Training and Youth Affairs (DETYA) commissioned the
multinational accounting firm, Ernst & Young, to develop an ABC methodology for Australian higher
education institutions. In 2000, the University of Newcastle conducted a pilot study, focusing
on library costs. Since then, other universities that have used ABC include RMIT, University of
Technology Sydney, University of Wollongong, University of Queensland, University of Western
Australia, Edith Cowan University, University of South Queensland (USQ) and Northern Territory
University.
What would an ABC system look like for a university? The diagram below describes USQ’s ABC
system. University of South Queensland wanted to estimate the costs and contribution of each
delivery mode (e.g. class room, online and distance education), course, program, department and
faculty.
RESOURCES
Delivery Modes
Faculties
Academic
Support
Payroll
System
Time
Surveys
Preparing
Lectures
Delivering
Lectures
Answering
Students
Administration
Support
Courses
ACC 1100
SCC1123
Student
Records
System
Programs
B. Bus
Floorspace
Timetabling
Systems
B. Arts
International
Onshore
M. Bus
M. Sc
International
Offshore
M. IB
Researching
Library
Finance, IT, HR
Providing
Library Services
Financial
Systems
B. Sc
Students
Supporting
Students
Enrolling
Students
Facilities
Timetabling
Systems
Liaising with
Students
Marketing
Research
Support
COST OBJECTS
ACTIVITIES
Domestic
HECS
Domestic
Fee Paying
Research
Providing
Corporate
Services
Business
Sustaining
Grants
Publications
HRD
Completions
Leadership
Govern
Strategy
Compliance
Y
L
N
O
R
E
T
P
A
H
C
E
L
SAMP
Sources: Ernst & Young (1998); Ernst & Young (2000); Department of Education, Training & Youth Affairs (DETYA) (2001); Jackson
(2001); Ellis-Newman (2003); Agility Consulting (2002 & 2005)
CHAPTER 8 ACTIVITY-BASED COSTING
LS(5e)-08.indd 381
381
17/11/08 11:38:58 AM
1 Physical volume, such as the number of kilograms for the activity ‘Pour metal’.
2 The number of transactions, such as the number of setups for the activity ‘Set up heat
treat furnace’.
3 Time duration, such as the number of man-hours for the activity ‘Make CT moulds’.
In addition, the costs of some activities, such as ‘Design method’, relate to specific products and can be assigned directly to those products.
bill of activities a
report identifying the
activities, the cost per
unit of activity driver,
the quantity of activity
drivers consumed and,
therefore, the cost of the
activities consumed by a
product
batch level activities
activities performed for
each batch of product
unit level activities
activities performed for
each unit of product
product level (or
product-sustaining)
activities activities
performed for specific
products or product
families
facility level (or
facility-sustaining)
activities activities
required to support the
business as a whole;
not caused by any
particular product
Preparing a bill of activities for each product
Next, Shannon prepared a bill of activities for each major product, which identified the
activities, the cost per unit of activity driver, the quantity of activity drivers consumed and,
therefore, the cost of the activities consumed by the product. The bills of activities for the
Hensley Tooth and the Custom Cast Tooth are shown in Exhibit 8.10 (overleaf).
The activity-based product costs
The activity-based product costs for the Hensley Tooth and the Custom Cast Tooth are
shown in Exhibit 8.10. The Hensley Tooth now has an estimated cost of $29.01 per unit.
The direct material cost, which was drawn from the conventional costing system, remains at
$12.00 per unit. The remaining $17.01 reflects the estimated cost of all the activities consumed in designing, producing and selling one Hensley Tooth. The Custom Cast Tooth
now has an estimated cost of $76.78 per unit, of which $12.00 is the direct material cost and
$64.78 is the cost of activities.
Where did Shannon get these numbers from, and what did they mean? Let’s focus on the
cost of the Hensley Tooth. Over the year, the Hensley Tooth was produced in 100 batches of
250 units to meet the required annual volume of 25 000 units. Exhibit 8.10 (overleaf) shows
the cost of producing the annual volume of 25 000 units. For each activity, the annual cost
is the cost per unit of activity driver, multiplied by the quantity of activity drivers consumed
in producing and selling the Hensley Tooth over the year.7 The unit cost is the annual cost
divided by the number of units, 25 000, produced over the year.
As you examine Exhibit 8.10 (overleaf) you may notice that the quantity of activity drivers
consumed by a product depends on whether the activity is performed for each unit, batch, or
entire product line. (You may remember that we introduced the concept of unit, batch, product
and facility level activities in Chapter 3, when discussing cost drivers.) For example, the activities
‘Program production’ and ‘Set up heat treat furnace’ are batch level activities, as they were
performed for each batch of castings. In contrast, activities such as ‘Inspect moulds’, ‘Inspect
castings’ and ‘Pour metal’ are unit level activities, as they were performed for each casting
(production unit) produced. The third type of activity identified in Exhibit 8.10 (overleaf) is a
product level (or product-sustaining) activity, which is an activity performed to enable the
design, production and sale of an entire product line. At Mason & Cox, the activity ‘Design
method’, which referred to designing a product and its production processes, is a product level
activity. The costs of some product level activities vary with the number of products produced,
but others may be assigned directly to individual products. There is a fourth type of activity, a
facility level (or facility-sustaining) activity, which is an activity required to run the business. Facility level activities reflect the costs of providing the overall environment for producing
and selling products. Since facility level activities are not caused by any particular product and
can only be allocated to products in some arbitrary manner, it can be argued that they should
not be included in the product cost. However, it seems that the allocation of facility level
costs to products does occur in practice (Cooper, 1990). In Exhibit 8.9 (see page 382) all the
Y
L
N
O
R
E
T
P
A
H
C
E
L
SAMP
7 The only exception is the activity ‘Design method’. The cost of this activity is assigned directly to products and then
spread over the expected life of the product.
382
LS(5e)-08.indd 382
PART 2 COSTS AND COSTING SYSTEMS
17/11/08 11:38:59 AM
Cost per
unit of
activity
driver
Activity
level
Activity
Unit
Make CT moulds
Unit
Annual
quantity of
cost driver
consumed
Exhibit 8.10
Annual
cost
Cost per
unit of
product
Activity-based
product costs,
Mason & Cox
7.5 kg Hensley Tooth: Bill of activities
$20
1 650
$33 000
Pour metal
4
18 750
75 000
Unit
Operate heat treat furnace
2
75 000
150 000
Batch
Process payables*
110
200
22 000
Batch
Process sales order*
100
200
20 000
Batch
Program production
262
100
26 200
Batch
Issue pattern*
125
100
12 500
Batch
Move material
42
1 000
42 000
Batch
Set up heat treat furnace
332
100
33 200
Product
Design method*†
Facility
Manage plant
1 250
2
5 000
Total activity cost (annual and per unit)#
10 000
$425 150
$17.01
12.00
Direct material cost
$29.01
Total product cost per unit
7.5 kg Custom Cast Tooth: Bill of activities
Unit
Make job moulds
$20
20
$400
Unit
Inspect moulds
5
500
2 500
Unit
Pour metal
4
375
1 500
Unit
Operate heat treat furnace
2
1 500
3 000
Unit
Inspect castings
11
500
5 500
Batch
Process payables*
110
20
2 200
Batch
Process sales order*
100
10
1 000
Batch
Program production
262
10
2 620
Batch
Issue pattern*
125
10
1 250
Batch
Move material
42
100
4 200
Batch
Set up heat treat furnace
332
10
3 320
Batch
Expedite orders
440
5
2 200
Product
Design method*
Facility
Manage plant
†
2 500
2
§
Total activity cost (annual and per unit)
Direct material cost
Total product cost per unit
100
200
$32 390
$64.78
12.00
Y
L
N
O
R
E
T
P
A
H
C
E
L
SAMP
$76.78
* Non-manufacturing activity.
†
Design costs are assigned directly to products.
#
Annual cost is based on 100 batches of 250 units; unit cost is based on the annual cost divided by the annual volume of 25 000
units.
§
Annual cost is based on 10 batches of 50 units; unit cost is based on the annual cost divided by the annual volume of 500 units.
CHAPTER 8 ACTIVITY-BASED COSTING
LS(5e)-08.indd 383
383
17/11/08 11:38:59 AM
activities in the Corporate Management Centre, were facility level activities. Hence no activity
drivers were identified. The activity ‘Manage plant’ was also a facility level cost, but Shannon
decided to allocate the costs of this activity to products. She wished to include all manufacturing activities in product costs, and, in her view, the man-hours worked in the production plant
provided a reasonable basis for allocating this cost.
ACTIVITY-BASED VERSUS CONVENTIONAL
PRODUCT COSTS
LEARNING
OBJECTIVE
6
To demonstrate the impact of the new activity-based system, Shannon chose to compare the
activity-based costs of the 7.5 kilogram Hensley Tooth and the 7.5 kilogram Custom Cast
Tooth to their cost under the existing, conventional product costing system. As mentioned
earlier, under the current conventional costing system these products had identical product
costs of $36.32 per unit (see Exhibit 8.3 on page 369), but this had not seemed to make sense
to the managers.
When comparing activity-based product costs with conventional product costs, we must
be careful to compare ‘like with like’. For example, the conventional product costs calculated earlier in this chapter included manufacturing costs only, but at Mason & Cox, the
activity-based product costs included both the manufacturing and non-manufacturing costs
that were related to the product. The non-manufacturing costs are denoted by an asterisk in
Exhibit 8.10 (see page 383).
Exhibit 8.11 identifies the manufacturing and non-manufacturing costs for the Hensley
Tooth and the Custom Cast Tooth. The total product cost per unit of the Hensley Tooth
of $29.01 included manufacturing costs of $26.78 and non-manufacturing costs of $2.23 per
unit, whereas the $76.78 per unit for the Custom Cast Tooth, included manufacturing costs
of $62.88 and non-manufacturing costs of $13.90.
Remember that Costello was sure that the existing system overstated the manufacturing
cost of the high-volume product line, the Hensley Tooth, and understated the cost of the
low-volume product line, the Custom Cast Tooth. Exhibit 8.11 shows that he was right. The
conventional cost for the Hensley Tooth is 36 per cent higher than its activity-based cost, and
the conventional cost of the Custom Cast Tooth is 42 per cent lower than its activity-based
cost. What caused these differences? How do we know that the activity-based cost is more
accurate?
CAUSES OF DIFFERENCES BETWEEN ABC AND
CONVENTIONAL PRODUCT COSTS
The existing system assumed that each unit of the two products had the same manufacturing
overhead cost because they consumed the same amount of direct labour. In fact, the Hensley
Tooth had a much lower manufacturing overhead cost, for two reasons. First, the conventional
system assumed that all manufacturing overhead costs were driven by the volume of production—that is, that they were unit level costs. But, as shown in Exhibit 8.10 on page 383,
a number of the overhead costs were batch level costs rather than unit level costs. Hensley
Tooth batches were large, which meant there was a relatively low level of consumption of
batch activities per unit produced. Second, the Hensley Tooth was a simple product to make.
It did not require a large amount of overhead support. The level of overhead support was
lower than the average level of support assumed in the average plantwide overhead rate. The
Custom Cast Tooth had a much higher manufacturing cost than that estimated by the conventional system. As shown in Exhibit 8.10 on page 383, it had a number of batch activities, and
batch sizes were small. This meant a relatively high consumption of batch level costs per unit.
In addition, the Custom Cast Tooth was complex to make and required a higher than average
level of overhead support activities.
384
LS(5e)-08.indd 384
PART 2 COSTS AND COSTING SYSTEMS
Y
L
N
O
R
E
T
P
A
H
C
E
L
SAMP
17/11/08 11:39:00 AM
Activity Level
Activity
Cost per
unit of
activity
driver
Annual
quantity of
cost driver
consumed
Exhibit 8.11
Annual
cost
Cost per
unit of
product
$369 400
$14.78*
Activity-based
manufacturing
product costs,
Mason & Cox
7.5 kg Hensley Tooth: Bill of activities
Make CT moulds
$20
1 650
$33 000
Pour metal
4
18 750
75 000
Operate heat treat furnace
2
75 000
150 000
262
100
26 200
Program production
Move material
Set up heat treat furnace
Manage plant
Total manufacturing activity cost
42
1 000
42 000
332
100
33 200
2
5 000
10 000
#
Direct material cost
12.00
Total manufacturing product cost per unit
26.78
Process payables
110
200
22 000
Process sales order
100
200
20 000
Issue pattern
125
100
12 500
1 250
Design method
Total non-manufacturing activity cost
55 750
2.23
$29.01
Total product cost per unit
7.5 kg Custom Cast Tooth: Bill of activities
Make job moulds
$20
20
$400
Inspect moulds
5
500
2 500
Pour metal
4
375
1 500
Operate heat treat furnace
2
1 500
3 000
11
500
5 500
262
10
2 620
Inspect castings
Program production
Move material
42
100
4 200
Set up heat treat furnace
332
10
3 320
Expedite orders
440
5
2 200
2
100
200
Manage plant
§
$25 440
Total manufacturing activity cost
$50.88
Direct material cost
12.00
Total manufacturing product cost per unit
62.88
Process payables
110
20
2 200
Process sales order
100
10
1 000
Issue pattern
125
10
1 250
Design method
Total non-manufacturing activity cost
Total product cost per unit
* Rounded to the
nearest cent.
#
Annual cost is based
on 100 batches
of 250 units; unit
cost is the annual
cost divided by the
annual volume of
25 000 units.
§
Annual cost is based
on 10 batches of
50 units; unit cost
is the annual cost
divided by the
annual volume of
500 units.
Y
L
N
O
R
E
T
P
A
H
C
E
L
SAMP
2 500
6 950
13.90
$76.78
CHAPTER 8 ACTIVITY-BASED COSTING
LS(5e)-08.indd 385
385
17/11/08 11:39:00 AM
In the activity-based system, the inclusion of non-manufacturing costs increased the cost
of the Hensley Tooth by $2.23 and the cost of the Custom Cast Tooth by $13.90. Both
products used the same types of non-manufacturing support activities, but the non-manufacturing costs had a more dramatic effect on the Custom Cast Tooth. This is because a number
of these activities were batch level activities, and the small batch size resulted in a relatively
high cost per unit. Mason & Cox’s management could have used this total cost information to
assess product profitability and review product prices (or to consider how activities and costs
could have been managed more effectively, as we will see in Chapter 16).
The Mason & Cox case demonstrates that moving from a conventional costing system
to ABC can significantly improve the accuracy of product costs. As shown in the ‘Real life’
below, a recent survey of practitioners supports this view.
ABC AT MASON & COX: TRIAL OR TRIUMPH?
Once the activity-based system had been established, Kidman and Shannon decided to review
its costs and benefits. Implementing activity-based costing had consumed a lot of Shannon’s
time and a lot of management and interviewee time. The activity-based system was more
complex than the existing costing system and would require a considerable amount of ongoing
effort and costs to maintain the accuracy of the information used within the system.
The new system had not been in place for long, before Kidman saw some benefits.
Product costs reflected more accurately the cost of the resources used in producing and
selling the product. They made sense to both the production and marketing people. Under
ABC, the company’s ‘cost-plus’ pricing seemed to be in line with competitors’ prices and
customer expectations. Also, it was possible to make more reliable estimates of product
profitability, which provided a sound basis for decisions about product mix and product
promotion.
Under the conventional costing system, many product costs had been distorted and the
‘cost-plus’ prices were not accepted by customers. It was frightening to think that management may have used this unreliable costing information to decide which products to produce
and promote. They may have discontinued some high-volume products because they appeared
REAL
LIFE
ABC DOES MAKE A DIFFERENCE TO
PRODUCT COSTS
In 2004, the Chartered Institute of Management Accountants (CIMA) and the consulting firm, ABM
Systems, surveyed CIMA members in Australia as well as a random sample of prior attendees at
training courses facilitated by ABM Systems, about their activity-based costing (ABC) experiences.
Respondents covered 96 companies, ranging from small (less than 100 employees) to very large
(more than 10 000 employees).
Sixty-five per cent of respondents indicated that they used ABC to estimate product costs. Many
of the respondents were members of CIMA (which promotes ABC amongst its members) or had
attended an ABM Systems training session, it could be expected that their involvement or interest in
ABC was higher than many other accountants. So it is risky to generalise about the extent of activitybased costing in Australia. However, it is interesting to note that 87 per cent of these respondents
found that their product costs differed substantially from those based on their conventional costing
system. While the majority reported average cost differences of 5 to 10 per cent, 11 per cent reported
cost differences of more than 100 per cent. Around 50 per cent of these respondents had re-priced
their products as a result!
Y
L
N
O
R
E
T
P
A
H
C
E
L
SAMP
Source: Chartered Institute of Management Accountants (CIMA)–ABM Systems (2004)
386
LS(5e)-08.indd 386
PART 2 COSTS AND COSTING SYSTEMS
17/11/08 11:39:01 AM
unprofitable when, in fact, they were not. Or perhaps they had promoted some low-volume
products that appeared profitable, when they were losers rather than winners!
The important point is that these problems were not confined to Mason & Cox. They are likely
to occur in many businesses. A number of progressive Australian businesses, including Holden’s
Engine Company, Parke Davis, BHP Billiton, Nestlé, Orica, Hamersley Iron and Argyle
Diamonds have implemented activity-based costing in some of their business units. Now he
understood why!
THE ABC DECISION
In many businesses, product diversity has increased and cost structures have become more
overhead-intensive and less volume-driven. Under these circumstances, conventional costing
systems are likely to overstate the costs of high-volume simple products produced in large
batches, and understate the costs of low-volume customised products produced in small
batches. Where product costs are an essential part of the strategic decision making, planning and control processes, these businesses are likely to experience considerable difficulty
because of the inadequate information from their conventional costing systems, and to
reap substantial benefits from implementing activity-based costing. Given the emerging
business environment and its implications for product and cost structures, we might have
expected a strong trend towards the adoption of ABC since its introduction in the late 1980s.
However, as the ‘Real life’ (overleaf) shows, many businesses do not use ABC. The decision
of whether or not to implement ABC should be based on a careful assessment of the costs
and benefits.
WHEN TO USE ABC
The benefits from ABC will be greatest where:
■ overhead costs are a significant portion of total costs, and a large part of overhead is not
directly related to production volume;
■ the business has a diverse product range, and individual products’ use of support
resources differs from their use of volume-based cost drivers;
■ production activity involves diverse batch sizes and product complexity;
■ the proportion of product-related costs incurred outside of manufacturing is increasing
relative to manufacturing costs;
■ there are likely to be high ‘costs’ associated with making inappropriate decisions based
on inaccurate product costs (this is most likely in a highly competitive environment
where product cost is a key input to strategic decision making and where competitors
have accurate product cost information);
■ the cost of designing, implementing and maintaining the ABC system is likely to be
relatively low due to sophisticated IT support.
7
LEARNING
OBJECTIVE
8
LEARNING
OBJECTIVE
IMPEDIMENTS TO INTRODUCING ABC
While the benefits from ABC can be significant, the take-up rate has been relatively slow.
Some firms believe that their existing costing is adequate—and it may be, if they have low
overheads and limited product diversity. In other firms ABC would significantly improve the
accuracy of product costing, but it has not been adopted. Why not? Perhaps these firms:
■ remain unaware of ABC;
■ are uncertain about the potential benefits from ABC;
■ understand the need for change but are concerned about the extensive resource
requirements to implement ABC; or
Y
L
N
O
R
E
T
P
A
H
C
E
L
SAMP
CHAPTER 8 ACTIVITY-BASED COSTING
LS(5e)-08.indd 387
387
17/11/08 11:39:01 AM
REAL
LIFE
THE ADOPTION OF ABC IN AUSTRALIA AND
NEW ZEALAND
Below you will find the results of some surveys of ABC adoption in Australia and New Zealand.
However, this evidence is difficult to interpret, with reported adoption rates between 1995 and
2007 ranging from 12 to 57 per cent. The apparent inconsistencies amongst the results may reflect
differences in industry (manufacturing, manufacturing and service, or public sector), firm size, time
period and survey instruments used to measure ABC. For example, some studies focused on
whether or not an organisation had implemented ABC whereas, following the ideas of Gosselin
(1997), Baird et al. (2004) and Baird (2007) identified three different levels of activity-based analysis,
activity analysis (AA) (which identifies activities and procedures), activity cost analysis (ACA) (which
identifies the costs of activities and their cost drivers), and activity-based costing (ABC) (which traces
overhead costs to products using activity cost pools and activity drivers). The extent of adoption
reported in these two studies is significantly higher than in other studies but they do alert us to the
fact that there is no single ABC model, rather different firms use different approaches.
ABC
adoption
rate
Publication
date
Largest manufacturers in Australia
13%
1995
Clarke & Mia
Manufacturers in Australia
12%
1997
Booth & Giacobbe
Very large manufacturers in Australia
56%
1998
Chenhall &
Langfield-Smith
Australia’s largest manufacturers
23%
2000
Wijewardena &
De Zoysa
Manufacturing and service entities,
both public and private, as well as
not-for-profit in New Zealand, with
more than 100 employees
20%
2003
Cotton et al.
Industry/firm size
Author
Australian manufacturing and service
business units, with at least 50
employees
AA
ACA
ABC
57%
50%
42%
2004
Baird et al.
Australian public sector organisations
AA
ACA
ABC
48%
43%
34%
2007
Baird
While the evidence is murky, the surveys of practice in Australia and New Zealand indicate that
many businesses have not adopted ABC. What is happening here? Within the accounting profession
ABC is viewed as a rational response to the contemporary business environment and associated
cost structures. Recent studies have found that rather than technical factors (such as the level
product diversity and extent of overhead costs), organisational factors (such as the level of top
management support for ABC and the existence of an internal champion to drive the acceptance and
implementation of ABC) influence the adoption and success of ABC (Brown et al., 2004; Baird et al.,
2007). Clearly the decision to implement ABC is complex, and involves consideration of behavioural
issues as well as assessing the more technical costs and benefits of ABC.
Y
L
N
O
R
E
T
P
A
H
C
E
L
SAMP
Sources: Clarke & Mia (1995); Booth & Giacobbe (1997); Chenhall & Langfield-Smith (1998); Wijewardena & De Zoysa (2000); Cotton
et al. (2003); Baird et al. (2004); Brown et al. (2004); Baird (2007); Baird et al. (2007)
388
LS(5e)-08.indd 388
PART 2 COSTS AND COSTING SYSTEMS
17/11/08 11:39:01 AM
are constrained by powerful behavioural factors that cause resistance to change. (This
issue is explored later in the chapter.)
We should not view the decision to stick with an existing costing system as irrational. In
many cases it is likely to reflect an assessment, formal or informal, of the perceived costs and
benefits of ABC.
■
OTHER ACTIVITY-BASED COSTING ISSUES
The Mason & Cox case provides a comprehensive description of ABC, but there are a
number of additional issues that must be considered, including the variations in the types of
ABC systems, the implications of spare capacity, behavioural issues and limitations of ABC.
9
LEARNING
OBJECTIVE
VARIATIONS IN TYPES OF ABC
There is not one ABC system but many. ABC can be used for product costing, activity management, or both. Product costing systems may be confined to the analysis of manufacturing
overhead, or they may include product-related non-manufacturing costs and direct labour
costs too. But there are other sources of variation, such as whether:
■ actual (past) or budgeted costs are analysed;
■ implementation is a one-off project or an ongoing system;
■ cost objects other than products are included.
Budgeted or actual costs
The ABC implementation at Mason & Cox analysed the prior year’s costs. However, it’s not
‘What did this product cost?’ but ‘What will this product cost?’ that is relevant to making
strategic decisions such as deciding which products to produce and what prices to charge.
Budgeted costs provide more timely and relevant information for such decisions. In a stable
environment, past costs can be reliable indicators of future costs. In a rapidly changing environment, past costs are less relevant, but it may be very difficult to predict future costs and
activities accurately. (You may remember that Hot Exhausts Ltd, in Chapter 7, developed
budgeted activity costs to estimate the costs of its two exhaust systems.) Some businesses
analyse past costs as a starting point for their ABC system, and later move to budgeted costs.
Others simply analyse past costs as a one-off exercise.
ABC project or ABC system?
Not all businesses implement ABC as an ongoing costing system; some adopt a project
approach instead. However, the choice is not whether ABC is either a project or an ongoing
system: these choices can be viewed as ends of a continuum. For example, a survey of
Australian manufacturers found that only 56 per cent of ABC adopters had implemented
ABC as an ongoing system, 20 per cent had developed ABC as an ad hoc system to be
updated and consulted when necessary, 12 per cent had implemented ABC as a one-off cost
analysis exercise, and the remaining 12 per cent used ABC for some other purpose (Booth
& Giacobbe, 1997). Where strategic plans are developed or reviewed relatively infrequently,
a business may not require accurate estimates of product costs on a day-by-day basis. They
may simply determine activity-based product costs as an occasional special project to better
understand the relative costs of their products. The ‘Real life’ overleaf describes an ABC
project undertaken for CardLink Services Ltd. Although the activity-based information was
invaluable to CardLink’s CEO, it was not required on a regular basis.
Y
L
N
O
R
E
T
P
A
H
C
E
L
SAMP
Other cost objects
In the Mason & Cox case study, we have focused on using activity-based costing to estimate
product costs. However, the cost assignment dimension of ABC can be used to assign costs
CHAPTER 8 ACTIVITY-BASED COSTING
LS(5e)-08.indd 389
389
17/11/08 11:39:01 AM
to any chosen cost object. For example, some businesses use ABC to estimate the costs of
using particular suppliers, and some businesses identify the costs of producing products and
servicing particular customers. These ABC models include product-related cost drivers (i.e.
unit, batch and product level cost drivers) and customer-related cost drivers. We describe
customer-related activities and cost drivers as well as supplier-related activities and drivers in
Chapter 15.
IMPLICATIONS OF SPARE CAPACITY
10
LEARNING
OBJECTIVE
committed resources
resources, such as
plant, equipment and
supervision, supplied in
advance of being used
in production
Courtesy of Shutterstock®
REAL
LIFE
Activity-based costing estimates the cost of resources used to perform activities to produce
and sell products. Conventional financial statements, such as the income statement, focus on
the cost of the resources supplied. Some resources, such as direct material, energy sources and
some forms of labour, are supplied as they are used. However, other resources, such as plant,
equipment and supervision, are supplied in advance. These resources are called committed
resources. Where activity costs are based on budgeted costs, the committed resources supplied
will not necessarily equal the resources used because of spare capacity (i.e. underutilised activities).
In estimating and reporting profit under an ABC system, therefore, it is necessary to include
the cost of unused capacity, when budgeted costs have been used (Cooper & Kaplan, 1992).
At Mason & Cox, the ABC system was used to assign actual costs, including committed
costs, to products at year-end, so this issue did not arise. The ‘Real life’ about art.com (opposite) describes an ABC system that included the identification of costs of unused capacity.
ABC: A PROJECT OR A SYSTEM?
CardLink Service Ltd was established in 1988 by a consortium of leading financial institutions,
including Australia’s major banks, to provide a range of back office services. Operating in an
environment of rapid technological change, CardLink’s major services now include credit card
authorisation, credit card transactions processing and the popular
consumer to business bill paying service, BPay (including the
related online billing service BPay View).
Although initially established as a ‘necessary processing
service’ with little emphasis on commercial viability, in 2000,
CardLink’s management decided only to offer services that
were profitable. An activity-based costing (ABC) project was
implemented to estimate the costs of services and to help set fair
prices.
Prices had not been reviewed for years and the ABC team
quickly discovered that a number of services were unprofitable,
particularly those that involved manual processing, such as the
paper processing and scanning of credit card transactions. Armed
with these results, management decided to cease some aspects of
the business, by either selling them or closing them down. Others
would be tackled through differential pricing and technology.
Although the CEO of CardLink described the results of the ABC analysis as invaluable, the
company opted not to implement an ongoing activity-based costing system, instead using ABC ‘as
a management tool on a periodic basis’. As is the case with any management accounting innovation,
it is important to weigh up the costs and benefits of the new approach. It seems that CardLink was
able to derive the benefits it really needed from the improved cost information by undertaking only
occasional ABC projects.
Source: Agility Consulting (2002)
390
LS(5e)-08.indd 390
PART 2 COSTS AND COSTING SYSTEMS
Y
L
N
O
R
E
T
P
A
H
C
E
L
SAMP
17/11/08 11:39:02 AM
BEHAVIOURAL ISSUES IN IMPLEMENTING ACTIVITY-BASED COSTING
Activity-based costing involves major changes in the ways in which data are collected and
analysed and the business is managed. In many organisations, any change is perceived as
threatening and is therefore likely to be resisted. To succeed, the introduction of activity-based
costing must be accompanied by a change management plan that is carefully constructed to
take account of the extent of change required and the personalities involved. The design
and implementation of ABC requires far more involvement of non-accounting staff than
that of a conventional costing system. Consider the amount of involvement of operational
employees from across the business in the development of the ABC system at Mason & Cox.
Developing an effective ABC system requires the cooperation and expertise of many people—
not just accountants!
There is no single formula for managing change, although there is some evidence to
suggest that the process will be most effective where a ‘bottom up’ approach rather than a ‘top
down’ approach is used. With a ‘bottom up’ approach, instead of viewing the activity-based
system as a financial system imposed by top management, employees would be encouraged to
consider ABC as a tool that they own, to help them manage their work. Developing a sense of
ownership requires a high degree of participation in the development and implementation of
the new system across all levels of the organisational hierarchy. Management must be seen to
be totally committed to the activity-based project, but also willing to let employees play a major
role in developing and using the system. Evidence from the US indicates that organisational
and behavioural issues can have a major effect on the success of activity-based costing (Shields,
1995). Similarly the ‘Real life’ on page 388 reminds us that Australian studies have found that
top management support and the influence of an ABC champion within the organisation
can be more important to the successful adoption of ABC than technological factors such as
cost and product structures.
11
LEARNING
OBJECTIVE
12
LEARNING
OBJECTIVE
LIMITATIONS OF ACTIVITY-BASED COSTING
While ABC has the potential to improve the accuracy of product costs, it is important to
understand its limitations:
■ Facility level costs. Some proponents of ABC recommend that virtually all costs,
including facility costs, be assigned to products. However, facility level activities may
bear no obvious relationship to products. (In the Mason & Cox case, the costs of
THE COST OF SPARE CAPACITY AT ART.COM
The e-retailer art.com sells prints and framed print art. Timely and accurate cost information is
particularly important for e-businesses because their competitive environment tends to be very fluid.
Activities for art.com include ‘service customers’, ‘web site optimisation’, ‘merchandise inventory
selection and management’, ‘purchasing and receiving’, ‘customer acquisition and retention—revenue
share marketing’, ‘customer acquisition and retention—paid for marketing’, ‘sustain information system’,
‘sustain business—administration’, ‘sustain business—production’, ‘sustain business—executive’,
‘maintain facility—administration’ and ‘maintain facility—production’. A major problem facing dot.com
companies is the difficulty in predicting demand and, therefore, in matching resources supplied with
resources used. At art.com, in addition to estimating the cost of each order, the activity-based costing
(ABC) system was used to estimate the dollar value of unused resources in total, by activity and by
product line. According to art.com, ‘unless a dollar value is attached to used and unused capacity, it
won’t gain management’s attention’.
Source: Zeller, Kublank & Makris (2001)
REAL
LIFE
Y
L
N
O
R
E
T
P
A
H
C
E
L
SAMP
CHAPTER 8 ACTIVITY-BASED COSTING
LS(5e)-08.indd 391
391
17/11/08 11:39:02 AM
‘Manage plant’ were the only facility level costs assigned to products.) If these facility
level costs are assigned to products, the allocation basis must be arbitrary. The higher
the proportion of allocated facility costs, the greater the arbitrary element of the product
costs. Of course a business must cover its facility level costs to make a profit but, in the
income statement, it is better to deduct them after estimating the product-related profit
margin rather than including them in the product costs.
■ Use of average costs. Activity-based estimates of the cost per unit of product, such as the
costs of the Hensley Tooth and the Custom Cast Tooth in Exhibit 8.10 (see page 383),
are average costs. Unit level costs are incurred for each unit of product, but batch level,
product level and any allocated facility level costs must be divided by the number of
units produced to estimate the cost per unit of product. It is important that managers
understand this. Many product-related decisions are better based on either unit level
costs in the short term or total product costs in the longer term, rather than looking at
the average cost per unit of product.
■ Complexity. When ABC is set up as an ongoing costing system, it involves more
detailed recording and analysis than for conventional costing systems. If the company
is changing rapidly, the data in the activity-based system must be updated frequently
to avoid the production of outdated, irrelevant information. This can be expensive.
The level of complexity increases dramatically when the system is used for activity
management as well as for product costing, because activity management requires a
more extensive and detailed analysis of costs and activities. This issue is dealt with
further in Chapter 16.
Despite these limitations, there are many examples of businesses, both in Australia and
abroad, that have implemented some form of ABC.
ACTIVITY-BASED COSTING IN SERVICE
ORGANISATIONS
13
392
LS(5e)-08.indd 392
LEARNING
OBJECTIVE
Activity-based costing can help to overcome the problems of inaccurate conventional costing
in service businesses, although three factors make it more difficult to implement than in
manufacturing:
1 Service businesses often have a higher level of facility costs than do most manufacturers,
so fewer costs may be included in the ABC system.
2 It is often difficult to identify individual activities, because they are non-repetitive. An
activity may be repeated, but in a different way for each client.
3 The non-repetitive production environment may also make it difficult to identify service
outputs.
Consider the services provided by your local doctor. Two patients may be booked in
for the removal of skin lesions. One skin lesion is a small sunspot that can be removed by
burning it with dry ice. The second lesion is much larger and deeper and has to be cut out. Is
there one product, ‘The removal of a skin lesion’, or are there two products, ‘Burning off skin
lesions’ and ‘Cutting out skin lesions’? To cut out the skin lesion, the doctor has to administer
a local anaesthetic. Is this part of the product ‘Cutting out skin lesions’, or a separate product,
‘Administering local anaesthetic’? What appears to be a basic product may actually disguise a
whole range of different products.
Now what if both patients had sunspots which required the same basic activities of
drawing up the dry ice, burning the lesion and dressing the wound, but the burning of one
lesion turned out to be much more difficult and time consuming than burning the other? Both
services require the same basic activities, but they have very different costs. Is ‘Burning the
lesion’ one activity, or should there be one activity for ‘Burning simple lesions’ and another
for ‘Burning more difficult lesions’?
PART 2 COSTS AND COSTING SYSTEMS
Y
L
N
O
R
E
T
P
A
H
C
E
L
SAMP
17/11/08 11:39:02 AM
ACTIVITY-BASED COSTING IN LOCAL
GOVERNMENT
Courtesy of Shutterstock®
In 1995, the National Competition Policy was introduced and local governments were required to
commit to the principles of competitive neutrality. These principles required local councils to open
significant business activities to competitive tendering and ensure that full costs were estimated in
submitting in-house tenders for the provision of goods and services. The National Competition Policy
program ended in 2005–06, but by then a number of local councils had moved to activity-based
costing (ABC) systems because of their effectiveness in estimating the full cost of their services.
REAL
LIFE
For example, Bayside City Council, located on the eastern shore of Port Phillip Bay, Victoria,
used ABC to develop an accurate set of costs for corporate overheads. Activity-based cost recovery
chargeout rates were estimated for major support services including ‘invoices paid and invoices
raised’, ‘cash receipting and payroll’, ‘management reporting and accounting services’, ‘information
services (including PC workstations and peripheral equipment)’, ‘office rental’ and ‘utilities’. The
council also found that activity-based data provided useful information for reducing costs and
improving efficiency, by identifying and eliminating wasteful activities. And in north-west Tasmania,
Devonport City Council used activity-based costing to identify the key activities required to provide
the full range of its programs, including city management, city development, community health,
leisure, the roads network, waste management and water supplies. In addition to providing a very
detailed allocation system for estimating the costs of goods and services, the ABC system helped
to establish and monitor responsibility for activities and service level agreements. The Council set
revenue and expenditure budgets and reviewed performance for each major activity. The financial
outcomes for activities were aggregated to program level for internal and external reporting.
According to the Council’s General Manager
The use of activity-based costing has proved to be appropriate to a local government entity,
has enabled the development a fully integrated information and reporting system . . . and has
enabled compliance with externally imposed National Competition policy requirements.
Sources: Hoban (1995); Lewis (1999); Devonport City Council (2004)
Y
L
N
O
R
E
T
P
A
H
C
E
L
SAMP
Despite these problems, activity-based costing has been used in a number of major
Australian service businesses including the National Roads and Motorists’ Association
(NRMA), Telstra, Australia Post, and the Electricity Trust of South Australia, and a number
of universities and local councils, as described in the ‘Real life’ above.
CHAPTER 8 ACTIVITY-BASED COSTING
LS(5e)-08.indd 393
393
17/11/08 11:39:03 AM
SUMMARY 8
Product costs are needed to help managers make decisions that create value and manage
resources as well as for reporting to various outside organisations. In Chapters 4, 5 and 6
we described conventional approaches to estimating the costs of goods and services. In
this chapter we identified the problems that may occur with conventional product costing
systems and described activity-based product costing, which has been developed to
overcome these problems. Key points include:
■
■
■
■
■
■
■
■
■
■
394
LS(5e)-08.indd 394
Conventional product costing systems allocate overhead costs to products using one
(or sometimes several) broad volume-based overhead rates. They also tend to ignore
non-manufacturing costs. Yet, in many businesses overheads are a significant cost
(and a large part of this cost is now caused by such factors as product diversity and
production complexity, rather than by production volume), and non-manufacturing
costs are becoming more substantial. In these situations, the conventional approach to
product costing is likely to distort product costs.
There are a number of common indicators of an outdated costing system, as described
in Exhibit 8.2 on page 367.
Activity-based costing (ABC) has been the major response to the problems encountered
with conventional costing systems. The ABC model has two dimensions. The costing
view assigns resources to the activities that consume them and then to products on
the basis of the activities that the products consume. The activity management view
provides information about the root causes of activities and their value to customers,
and various measures of their performance.
The range of costs assigned by the activity-based system depends on the purpose of
the system. An ABC system can be used to assign manufacturing overhead costs to
products, or manufacturing overhead and product-related non-manufacturing costs,
or direct labour costs, in addition to manufacturing overhead and non-manufacturing
costs. This third approach to activity-based costing was illustrated in this chapter, using
the Mason & Cox case, and is discussed further in Chapter 16.
Activity-based product costing involves two main steps:
– measuring the costs of activities; and
– assigning activity costs to products.
Each of these steps is described in the chapter using the Mason & Cox example.
A comparison of activity-based and conventional product costs indicates that, in
businesses that are overhead intensive and have a diverse product range, conventional
product costing systems tend to overstate the cost of simple products that are made
in large quantities and understate the costs of complex products made in small
quantities.
Activity-based costing is likely to benefit businesses with significant levels of nonvolume driven overhead costs, a diverse product range (involving diverse batch sizes
and differing degrees of production complexity) and substantial non-manufacturing
costs, and where product cost information is important and IT resources are good.
Organisations may not use ABC because of a lack of awareness or concerns about the
potential benefits, finding appropriate cost drivers and the level of resources required.
There are a range of design issues to be considered in implementing activity-based
costing, including whether to use budgeted or actual costs, whether to develop an
ongoing costing system or a project approach, and which cost objects should be
included.
In estimating and reporting profit under an activity-based system, where activity costs
are based on budgeted costs, the cost of unused capacity should be recognised,
PART 2 COSTS AND COSTING SYSTEMS
Y
L
N
O
R
E
T
P
A
H
C
E
L
SAMP
17/11/08 11:39:03 AM
■
■
■
■
because of the difference between the costs of resources used (identified under ABC)
and the cost of resources supplied.
Activity-based costing, particularly as an ongoing system, can involve significant
organisational change and the ABC implementation should consider and actively
manage resistance to change.
Although more accurate than conventional product costing, ABC also has some
limitations. Facility level costs should not be assigned to products, as they have no
obvious cost drivers; average batch, product and facility level costs per unit can
undermine product-related decisions; and ABC is more complex than conventional
product costing.
Activity-based costing can be useful in service organisations but can be more difficult to
implement because of high facility-level costs, non-repetitive activities and difficulties in
identifying and measuring service outputs.
As discussed in the appendix, where activity-based costing is used solely to assign
manufacturing overheads to products, it is possible to develop a simple system with
relatively few major overhead activities and cost drivers.
We will return to activity-based costing in Chapters 15 and 16, where we examine its role
in supply chain and cost management.
KEY TERMS
cost object 373
cost per unit of activity driver 379
facility level (or facility-sustaining) activities 381
product diversity 366
product level (or product-sustaining) activities 381
resource driver 371
root cause cost drivers 374
unit level activities 381
activity 371
activity-based costing (ABC) 371
activity centre 377
activity driver 373
batch level activities 380
bill of activities 380
committed resources 390
conventional product costing system 364
cost driver 373
REFERENCES
Agility Consulting 2002, ABC identifies long-term value drivers,
Management case study, issue 3, www.agility.com.au/pdfs/
FINALC1.PDF, viewed 18 April 2008.
Agility Consulting 2002, Northern Territory University trail-blazes
integrated business costing, Management case study,
issue 2, www.agility.com.au/pdfs/NTUCAS1.PDF, viewed
18 April 2008.
Agility Consulting 2005, University of Southern Queensland uses
ABM for strategic business improvement, Management case
study, issue 5, www.agility.com/au/pdfs/USQ_Case_Study.
pdf, viewed 18 April 2008.
Baird, K 2007, ‘Adoption of activity management practices in
public sector organizations’, Accounting and Finance, 47,
pp. 551–69.
Baird, KM, Harrison, GL & Reeve, RC 2004, ‘Adoption of activity
management practices: a note on the extent of adoption
and the influence of organizational and cultural factors’,
Management Accounting Research, 15, pp. 383–99.
Baird, K, Harrison, G & Reeve, R 2007, ‘Success of activity
management practices: the influence of organizational and
cultural factors’, Accounting and Finance, 47, pp. 47–67.
Booth, P & Giacobbe, F 1997, ‘Activity-based costing in
Australian manufacturing firms: key survey findings’, Issues
Report 5, CPA Australia Management Accounting Centre of
Excellence, March, p. 2.
Brimson, JA 1991, Activity Accounting, John Wiley & Sons,
New York.
Brown, DA, Booth, P & Giacobbe, F 2004, ‘Technological
and organizational influence on the adoption of activitybased costing in Australia’, Accounting and Finance, 44,
pp. 329–56.
Chenhall, RH & Langfield-Smith, K 1998, ‘Adoption and benefits
of management accounting practices: an Australian study’,
Management Accounting Research, 8, no. 3, pp. 1–20.
Chenhall, RH & Langfield-Smith, K 1999, Innovative Costing
Systems: A Study of Five Manufacturing Companies, Australian
Society of Certified Practising Accountants, Melbourne.
Charterted Institute of Management Accountants (CIMA)-ABM
Systems 2004, Survey on the use of activity based costing
(ABC) in Australia, www.abmsystems.com/services/CIMAABMS%20Survey%20on%20ABC.pdf, viewed 4 April 2008.
Clarke, B & Mia, L 1995, ‘Activity-based costing systems:
use and application in Australia’, Discussion Paper, no. 8,
series 11, Monash Univerisity and Griffith University.
Cooper, R 1989, ‘You need a new cost system when . . .’,
Harvard Business Review, January/February, pp. 77–82.
Y
L
N
O
R
E
T
P
A
H
C
E
L
SAMP
CHAPTER 8 ACTIVITY-BASED COSTING
LS(5e)-08.indd 395
395
17/11/08 11:39:06 AM
Cooper, R 1990, ‘Cost classification in unit-based and activitybased manufacturing cost systems’, Journal of Cost
Management, Fall, pp. 4–14.
Cooper, R & Kaplan, RS 1992, ‘Activity-based systems:
measuring the cost of resource usage’, Accounting Horizons,
September, pp. 1–13.
Cotton, DJ, Jackman, SM & Brown, RA 2003, ‘Note on a New
Zealand replication of the Innes et al. UK activity-based
costing survey’, Management Accounting Research, 14,
pp. 67–72.
Dadds, V & Scheide, T 2000, ‘Police performance and
activity measurement’, Australian Institute of Criminology,
Trends and Issues in Crime and Criminal Justice, no. 180,
November, pp. 1–6.
Department of Education, Training & Youth Affairs (DETYA)
2001, Activity Based Costing—study to develop a costing
methodology for Library and Information Technology
activities for the Australian Higher Education Sector, April.
Devonport City Council 2004, Devonport City Council 5 Year
Operational Plan for 2004–2009, http://cms.dcc.tas.gov.
au/NR/rdonlyres/D3CBEOFE-129D-4FAO-BB92-57F6A2ED
22F4/0/5YearOperationalPlan20042009.pdf, viewed 7 April
2008.
Donnelly, N, Scott, L, Poynton, S, Weatherburn, D, Shanahan,
M & Hansen, F 2007, NDLERF: Estimating the short-term
cost of police time spent dealing with alcohol-related crime
in NSW, National Drug Law Enforcement Research Fund:
Commonwealth of Australia, Hobart.
Ellis-Newman, J 2003, ‘Activity-based costing in user services of
an academic library’, Library Trends, 53, no. 3.
Ernst & Young 1998, Costing Methodology for Use in Australian
Higher Education Institutions.
Ernst & Young 2000, ABC Pilot Study at The University of
Newcastle.
Gosselin, M 1997, ‘The effect of strategy and organizational
structure on the adoption and implementation of activitybased costing’, Accounting, Organizations and Society, 22,
pp. 105–22.
Hoban, B 1995, ‘ABC in local government’, Australian
Accountant, August 1995, pp. 29–36.
Jackson, J 2001, RMIT staff newsletter: Introduction of activitybased costing to RMIT University, www.rmit.edu.au/
resources/staffletter.html.
Johnson, HT & Kaplan, RS 1987, Relevance Lost: The Rise and
Fall of Management Accounting, Harvard Business School
Publishing, Boston, MA.
Kaplan, RS 1984, ‘The evolution of management accounting’,
The Accounting Review, July, pp. 390–418.
Lamond, S 1992, ‘Activity-based management: an Australian
perspective’, Journal of Cost Management, Summer,
pp. 42–6.
Lewis, M 1999, ‘Defining the organisation: the process of ABC’,
Australian CPA, April.
Newbold, K 1997, ‘Process re-engineering: the full story’,
presentation to the Australian Centre for Management
Accounting Development, Victorian Division, 20 February.
O’Guin, M 1991, The Complete Guide to Activity Based Costing,
Prentice Hall, New York.
Raffish, N & Turney, PBB (eds) 1991, ‘Glossary of activity-based
management’, Journal of Cost Management, Fall, pp. 53–63.
Shields, M 1995, ‘An empirical analysis of firms’ implementation
experiences with activity-based costing’, Journal of
Management Accounting Research, vol. 7, Fall, pp. 148–66.
Turney, PBB 1991, Common Cents: The ABC Performance
Breakthrough, Cost Technology Inc., Beaverton, OR.
Vogel, B & Crossley, A 1992, ‘Activity based costing in a service
environment’, C’OZ, no. 24, February/March, pp. 8–9.
Wyewardena, H & De Zoysa, A 1999, ‘A comparative analysis of
management accounting practices in Australia and Japan:
an empirical investigation’, The International Journal of
Accounting, 34, no. 1, pp. 49–70.
www.agility.com.au/clienttestimonials/text.html, 2004.
www.isr.gov.au/industry/tcf/cs2000/case_studies/rm_williams.
html, 2000.
Zeller, TL, Kublank, DR & Makris, PG 2001, ‘How art.com uses
ABC to succeed’, Strategic Finance, March, pp. 24–31.
SELFSTUDY 8
SELF-STUDY PROBLEM: ACTIVITY-BASED
COSTING
Barbara Higgins is the manager of Inhouse Training, a company that provides in-house
management development training courses. The company offers two basic training packages:
two-day short courses covering topics such as leadership skills, managing change and learning
organisations, and five-day courses in areas such as strategic management, supply chain
management and developing performance measurement systems.
At the end of the year, Higgins reviewed the company’s total costs with a view to setting
prices for the coming year. Over the past 12 months, the company ran 40 two-day courses,
with an average of 50 participants, and 60 five-day courses, with an average of 30 participants.
Total costs amounted to $696 000. Higgins decided to base prices for the coming year on the
cost per day for last year plus a 20 per cent profit margin.
396
LS(5e)-08.indd 396
PART 2 COSTS AND COSTING SYSTEMS
Y
L
N
O
R
E
T
P
A
H
C
E
L
SAMP
17/11/08 11:39:06 AM
Before setting these prices, Higgins bumped into a friend who was a management
consultant. He suggested that activity-based costing would provide a more accurate estimate
of the cost of the two types of courses. With his help, Higgins identified the following activities
and costs for last year:
Activity
Activity
cost
Activity driver
$50 000
Number of courses
Advertise courses
Enrol participants
19 000
Hire presenters
Quantity
of activity
driver
100
Number of participants
3 800
570 000
Number of days
380
Hire premises
38 000
Number of days
380
Hire audiovisual equipment
95 000
Number of days
380
Produce handouts
Provide lunches
Total costs
38 000
Number of participants
195 000
Number of person-days
3 800
13 000
$960 000
Required:
1 Estimate the costs of a two-day course and a five-day course, using the ‘average cost
per day’ approach.
2 Estimate the cost of a two-day course and a five-day course, using activity-based costing.
3 Which cost out of those estimated in requirements 1 and 2 do you think would provide
a more reliable basis for cost-plus pricing? Explain your answer.
Solution to Self-study problem
1 Cost per course based on average cost per day:
Total number of days on which courses were run = (40 × 2) + (60 × 5)
= 380 days
Total cost = $960 000
$960 000
Cost per day =
380 days
= $2526 per day
Cost of two-day course = $2526 × 2 = $5052
Cost of five-day course = $2526 × 5 = $12 630
2 Cost per course based on activity-based costing:
Two-day course
Activity driver
Cost per unit of
activity driver
Quantity of
activity driver
Activity
cost
Advertise courses
$500 per course
1 course
Enrol participants
$5 per participant
50 participants
Hire presenters
$1500 per day
2 days
3 000
Hire premises
$100 per day
2 days
200
Hire audiovisual equipment
$250 per day
2 days
500
Produce handouts
$10 per participant
50 participants
500
Provide lunches
$15 per person per
day
100 person-days
Total cost
$500
250
Y
L
N
O
R
E
T
P
A
H
C
E
L
SAMP
1 500
$6 450
CHAPTER 8 ACTIVITY-BASED COSTING
LS(5e)-08.indd 397
397
17/11/08 11:39:07 AM
Five-day course
Cost per unit of
activity driver
Activity driver
Quantity of
activity driver
Activity
cost
Advertise courses
$500 per course
1 course
$500
Enrol participants
$5 per participant
30 participants
Hire presenters
$1500 per day
5 days
7 500
Hire premises
$100 per day
5 days
500
Hire audiovisual equipment
$250 per day
5 days
1 250
Produce handouts
$10 per participant
30 participants
Provide lunches
$15 per person per
day
150 person-days
150
300
2 250
$12 450
Total cost
You will notice that we have omitted the step shown in Exhibit 8.10 (see page 383), in
which annual activity costs were calculated for products and these costs were divided by the
number of units produced over the year. For Inhouse Training, we have sufficient information
to identify directly the consumption of activities for each unit of product (i.e. each course).
3 The activity-based costing system provides a more accurate estimate of cost. The average
cost assumes that the cost of courses varies proportionately with the number of days. While
this is true for some costs (such as the costs of presenters, premises and equipment hire),
other costs are incurred for each course (such as advertising costs), or for each participant
(such as the costs of enrolling participants and providing them with handouts).
CYBERSEARCH 8
1 Look for web sites of consulting firms that offer activity-based costing services or software
packages.
(a) Are the concepts of activity-based product costing consistent with those described in
the chapter? If not, describe any differences.
(b) What benefits do the software consultants suggest may be expected from activitybased product costing? Do you consider the proposed benefits to be realistic? Explain
your answer.
(c) Do the software consultants suggest that activity-based product costing is appropriate
for allorganisations? If so, do you agree? Explain your answer.
2 Find a web site with an example of an organisation that uses activity-based product costing.
(a) Compare their approach with that described in the chapter.
(b) Outline the advantages that activity-based product costing has provided for the
organisation.
3 Locate web sites with examples of universities that have implemented activity-based
costing.
(a) Describe the benefits from ABC that universities have experienced in estimating the
costs of their courses and programs.
(b) Can you find any evidence of resistance to the move to ABC in these universities?
Y
L
N
O
R
E
T
P
A
H
C
E
L
SAMP
For a list of useful web sites to help you with these exercises visit the Online Learning
Centre at www.mhhe.com/au/langfield5e.
398
LS(5e)-08.indd 398
PART 2 COSTS AND COSTING SYSTEMS
17/11/08 11:39:09 AM
APPENDIX TO CHAPTER 8
ACTIVITY-BASED COSTING: AN
ALTERNATIVE APPROACH
From the discussion in this chapter, you will be aware that there are many variations of
activity-based costing. Management assesses the problems that their business is facing, and
an ABC system is designed to tackle those problems. The approach used at Mason & Cox
is useful for businesses that need more accurate product costs and better information for
activity management. However, the inclusion of the activity management view, in addition
to the product costing view, makes the ABC system more complex. Some businesses choose
a simpler version of ABC to meet their product costing needs. This type of ABC assigns
only indirect costs (often only manufacturing overhead costs) to products. We introduced
this approach to activity-based costing in the Hot Exhausts case in Chapter 7. Now we will
look at it in more detail and consider how it differs from the activity-based costing system
described in this chapter.
14
LEARNING
OBJECTIVE
SIMPLIFYING ACTIVITY-BASED
PRODUCT COSTING
Let’s assume that the only serious problem facing Mason & Cox was distorted product costs.
The distortions were caused by the inappropriate allocation of manufacturing overhead.
Remember, Mason & Cox used a plantwide overhead rate based on direct labour hours.
There were no major difficulties with the conventional approach to tracing direct material
and direct labour costs to products. The solution to this problem would have been to develop
an ABC system to assign the manufacturing overhead costs to activities and then to products.
This is the simple activity-based product costing system that was described in the chapter (see
Exhibit 8.6 on page 375).
The activity-based costing model in Exhibit 8.5 (see page 373) can be used to describe
this simple activity-based product costing system. However, this ABC system is confined to
the vertical costing view and analyses only manufacturing overhead costs and manufacturing
overhead activities. Thus, the two steps for the costing view become:
■ Step one: Measure the costs of the manufacturing overhead activities.
■ Step two: Assign the costs of the manufacturing overhead activities to the products.
The ABC system at Mason & Cox, which we described in the chapter, assigned
$11.13 million to activities. These costs included direct labour costs ($4.53m), manufacturing
Y
L
N
O
R
E
T
P
A
H
C
E
L
SAMP
CHAPTER 8 ACTIVITY-BASED COSTING
LS(5e)-08.indd 399
399
17/11/08 11:39:10 AM
overhead ($4.88m) and non-manufacturing costs ($1.72m).8 Direct material costs were not
included as they were traced to products using the conventional approach. What would
happen to these costs in the simple activity-based product costing model? The direct material
costs would still be traced using the conventional approach and so would the the $4.53 million
direct labour costs. With direct costs, the conventional tracing should be reasonably accurate.
The direct labour costs were included in the ABC system described in the chapter to enhance
the activity management view, not to improve the product costing. The $1.72 million of nonmanufacturing costs would have been expensed as they were incurred. These were included
previously for activity management and also to provide a more complete measure of product
cost. (The simple ABC system could have been expanded to include these costs if management had believed that their omission seriously distorted the product costs.)9 Thus, at Mason
& Cox, the simple ABC system would have assigned the $4.88 million manufacturing overhead costs, first to activities and then to products. Let’s look at these two steps.
STEP ONE: MEASURING THE COST OF OVERHEAD ACTIVITIES
As in the more complex system, the first step in simple activity-based product costing is to
identify the activities and measure their costs. Let’s suppose that there were six manufacturing
overhead activities at Mason & Cox: a machine-related activity, an inspection activity, a setup
activity, a material-handling activity, an engineering activity and a facility activity.
Exhibit 8.12 shows the allocation of the $4.88 million of manufacturing overhead
costs to the six major activities. Note that the activities are classified as unit level, batch
level, product level and facility level, just as the detailed activities were in the chapter. The
machine-related activity is a unit level activity since every product unit (casting) required
machine time. Likewise the inspection activity is a unit level activity as individual moulds
and castings were inspected. (If batches of moulds and castings rather than individual units
had been inspected the inspection activity would have been a batch level activity.) The setup
and material-handling activities are classified as batch level activities because these activities
were performed for batches of castings. The engineering activity is classified as a product level
activity because it was needed to support an entire product line, but was not always performed
every time a new casting or batch of castings was produced. The facility level activity covers
the costs that support the entire production process—plant management salaries, and some
plant maintenance and insurance costs.
The procedure for assigning the manufacturing overhead costs to the activities is similar
to the procedure for measuring activity costs described earlier in this chapter. The accounts
that made up the $4.88 million would have been reviewed and, where they were of a similar
nature and driven by the same resource driver, they would have been combined into cost categories. Resource drivers would have been used to assign the costs in each category to activities.
For example, the machine-related costs would have included machinery depreciation costs,
consumables used by machines and the energy costs of operating the machinery. The setup
costs would have included wages of employees involved in setting up machinery, consumables
used during setups, and the costs of other resources used during setups. In the chapter, activity
centres were used as an intermediate step to accumulate costs before assigning them to activities. Activity centres can also be used in this way in a simple product costing system.
In reality, there were more than six manufacturing overhead activities at Mason & Cox.
The six major activities identified in Exhibit 8.12 were made up of a number of smaller activities that have been aggregated into larger activity cost pools. Activities can be aggregated in
Y
L
N
O
R
E
T
P
A
H
C
E
L
SAMP
8 These costs have been classified by ‘cost category’ (see Exhibit 8.7 on page 378) and activity (see Exhibit 8.9 on
page 380), but it is not possible to identify direct labour, manufacturing overhead and non-manufacturing costs from
these exhibits. Instead, a separate exercise was required to identify these costs.
9 In this chapter we described this approach as the activity-based product costing system for indirect costs (see
Exhibit 8.6 on page 375). It is not illustrated here, but the procedures for costing the non-manufacturing activities
are similar to the procedures for costing the manufacturing overhead activities.
400
LS(5e)-08.indd 400
PART 2 COSTS AND COSTING SYSTEMS
17/11/08 11:39:11 AM
Exhibit 8.12
Unit
level
Batch
level
Product
level
Facility
level
Machine-related
activity
$2.36m
Setup
activity
$0.7m
Engineering
activity
$0.59m
Facility
activity
$0.2m
Inspection
activity
$0.52m
Material-handling
activity
$0.51m
Measuring the cost of
overhead activities at
Mason & Cox
Total manufacturing overhead costs $4.88 million
this way if they are at the same level (i.e. unit, batch or product) and use the same activity
driver. As discussed in the chapter, reducing the number of activities helped to keep down the
complexity and cost of the system. Detailed activities were not required because the system
was to be used only for product costing, not for activity management.
STEP TWO: ASSIGNING THE ACTIVITY COSTS TO PRODUCTS
The second step is to assign the costs of the overhead activities to the products that consume
them, based on the costs per unit of activity driver, sometimes called cost pool rates. You
will notice that the costing procedures are very similar to those described in this chapter. Once
the activity cost pools have been estimated, the costs are divided by the annual quantity of
activity driver to obtain the cost per unit of activity driver for each activity. Let’s assume that,
in the Mason & Cox case, activity drivers could have been measured for machine-related costs
(machine hours), inspection costs (number of units inspected), setup costs (number of production runs), material handling (metres of material moved) and engineering (the number of
engineering hours). This is shown in Exhibit 8.13. You will notice that we have not calculated
a cost per unit of activity driver for facility level costs, and they have not been apportioned
to product lines. As discussed in the chapter, most facility costs are not attributable to any
particular product lines and it would be misleading to assign them to products.
To estimate the overhead cost of a product, it is necessary to estimate the amount of
each overhead activity consumed by the product. This is illustrated in Exhibit 8.14 (overleaf),
which shows the cost of the manufacturing overhead activities consumed by our old favourites, the 7.5 kilogram Hensley Tooth and the 7.5 kilogram Custom Cast Tooth. The costs
of the activities are calculated by multiplying the cost per unit of activity driver by the quantity
of activity driver consumed by each product. Exhibit 8.14 (overleaf) also includes the cost of
direct material and direct labour (as shown in Exhibit 8.3 on page 369) to give the manufacturing cost of each product. The costs of the Hensley Tooth and the Custom Cast Tooth are
$29.78 and $67.18, respectively.
Activity
Machine-related
Activity cost ($m)
$2.36
Inspection
0.52
Setup
0.70
Material handling
0.51
Engineering
0.59
Quantity of
activity drivers*
100 000
Cost per unit of
activity driver
$23.60
cost pool rate an
alternative term for cost
per unit of activity driver
Exhibit 8.13
Calculating the activity
cost rates at
Mason & Cox
* Activity drivers were:
– machine-related:
number of machine
hours
– inspection: number of
units inspected
– setup: number of
production runs
– material handling:
number of metres
moved
– engineering: number of
engineering hours
Y
L
N
O
R
E
T
P
A
H
C
E
L
SAMP
80 000
$6.50
4 000
$175.00
17 000
$30.00
59 000
$10.00
CHAPTER 8 ACTIVITY-BASED COSTING
LS(5e)-08.indd 401
401
17/11/08 11:39:11 AM
Exhibit 8.14
7.5 kg Hensley Tooth
Product costs based on
the simple ABC system
at Mason & Cox
Quantity
of
activity
driver
Cost
Cost
per unit of
activity driver
Activity
Custom Cast Tooth
Quantity
of
activity
driver
Cost
Machine-related
$23.60
per machine hour
2 500
$59 000
50
$1 180
Inspection
$6.50
per unit inspected
–
–
1000
6 500
Setup
$175.00
per setup
100
17 500
10
1 750
Material handling
$30.00
per metre
1 000
30 000
100
3 000
Engineering
$10.00
per engineering hour
8 000
80 000
1 000
10 000
$186 500
$22 430
Number of units produced:
7.5 kg Hensley Tooth
25 000
Custom Cast Tooth
500
Overhead cost per unit
$7.46
$44.86
Direct material*
12.00
12.00
Direct labour*
10.32
10.32
$29.78
$67.18
Product cost per unit
* From Exhibit 8.3 on page 369.
The cost of the Hensley Tooth at $29.78 and the Custom Cast Tooth at $67.18 are quite
different to the ABC manufacturing product costs shown in Exhibit 8.11 on page 385 ($26.78
and $62.88 respectively).10
EVALUATING THE SIMPLE ACTIVITY-BASED
PRODUCT COSTING SYSTEM
The simple ABC approach can be compared to the conventional approaches to product
costing and to the more comprehensive approaches to activity-based costing described in this
chapter.
SIMPLE ABC COMPARED TO CONVENTIONAL
PRODUCT COSTING
Simple activity-based product costing can be viewed as a refinement to the conventional
approaches to estimating product costs, which were described in Chapter 7. Exhibit 8.15
shows that it differs from the conventional approaches only in its treatment of manufacturing
overhead. As we move from a plantwide rate to departmental rates and then to the simple
ABC manufacturing overhead rates, the level of disaggregation of manufacturing overhead
increases, enabling better identification of cost drivers; and, as a result, the accuracy of the
allocation of the manufacturing overhead costs to products also increases.
Y
L
N
O
R
E
T
P
A
H
C
E
L
SAMP
10 Strictly speaking to compare these costs we should remove the facility level costs (‘manage plant’) included in
Exhibit 8.10 on page 383. However this would have a relatively minor impact, reducing the costs per unit shown in
Exhibit 8.10 by $0.40.
402
LS(5e)-08.indd 402
PART 2 COSTS AND COSTING SYSTEMS
17/11/08 11:39:11 AM
Product
costing
approach
■
■
■
Costs traced
directly to
products
Conventional
approach:
Plantwide rate
■
Conventional
approach:
Departmental
rates
■
Simple ABC
■
■
■
■
Costs allocated
to products
Overhead
cost driver(s)
(activity
driver(s))
Overhead
allocation
basis (cost per
unit of activity
driver)
Direct material
Direct labour
■
Manufacturing
overhead
■
One volumebased cost
driver for the
entire plant
■
One rate for
the whole
plant
Direct material
Direct labour
■
Manufacturing
overhead
■
One volumebased cost
driver for each
production
department
■
One rate
for each
production
department
Direct material
Direct labour
■
Manufacturing
overhead
■
One cost
driver, either
volume-based
or non-volumebased for
each overhead
activity
■
One rate
for each
manufacturing
overhead
activity
Exhibit 8.15
Comparing conventional
and simple ABC
approaches to
estimating product
costs
SIMPLE ABC COMPARED TO MORE COMPREHENSIVE
ACTIVITY-BASED COSTING MODELS
Exhibit 8.6 (see page 375) evaluated the various approaches to activity-based costing and
concluded that the more comprehensive activity-based costing systems result in more accurate
product costs because they include a wider range of costs. In Mason & Cox’s case, there was
a significant difference in the manufacturing cost of the Hensley Tooth and the Custom Cast
Tooth under the two approaches. Using an ABC system with a large number of detailed
activities may or may not not greatly improve the accuracy of the product costing over the
simple ABC system based on relatively few manufacturing overhead activities. However,
the comprehensive ABC system described in the chapter does offer two advantages. First,
it includes non-manufacturing costs in product costs, although the simple system could be
expanded to accommodate non-manufacturing activities. Second, and much more importantly, the ABC system described in the chapter provides lots of useful information for activity
management. The value of this information is explained in Chapter 16. The issue of which
system is appropriate can be resolved only in the light of the needs of each business.
KEY TERM
cost pool rate 401
Y
L
N
O
R
E
T
P
A
H
C
E
L
SAMP
CHAPTER 8 ACTIVITY-BASED COSTING
LS(5e)-08.indd 403
403
17/11/08 11:39:12 AM
QUESTIONS
EXERCISES
PROBLEMS
CASES
QUESTIONS
8.1
8.2
8.3
8.4
8.5
8.6
8.7
8.8
8.9
8.10
8.11
8.12
8.13
8.14
8.15
8.16
404
LS(5e)-08.indd 404
Identify some of the common causes of changes to cost and product structures
that many businesses are experiencing.
Conventional costing systems apply manufacturing overhead costs to products
using a volume-based cost driver such as direct labour hours. What do we
mean by the term volume-based cost driver? What problems can arise with this
approach to product costing when used in a modern manufacturing environment?
Describe the common indicators of an outdated product costing system.
Which types of businesses are most likely to experience product costing
problems with conventional costing systems? (Hint: Think about the composition
of costs, and product diversity.) Why?
How are non-manufacturing costs treated under conventional costing systems?
Is this approach useful for management?
Describe the two dimensions of the activity-based costing model shown in
Exhibit 8.5 on page 373. Using the terms resources, activity and resource driver,
and the diagram in the ‘Real life’ on ABC in Australian universities (see page 381)
explain how costs are assigned to activities.
Using the terms activity costs, activity drivers and cost per unit of activity driver
and the diagram in the ‘Real life’ on ABC in Australian universities (see page 381)
explain how the costs of the Hensley Tooth has been calculated in Exhibit 8.10
(see page 383).
Explain the three different ways in which the term cost driver is used in activitybased costing and give two examples of each type of cost driver for a bank. (Hint:
First think about the activities performed in a bank and then think about their cost
drivers.)
There is not just one approach to activity-based costing: there are many. Describe
some of the major areas of difference between the various approaches to activitybased costing systems.
Outline the three major approaches to activity-based product costing discussed in
the chapter and describe their costs and benefits. What are the major differences
between each of these approaches and conventional product costing systems?
What factors would you consider in deciding whether a business needs to
implement activity-based costing; and, if so, what is the most appropriate
approach to adopt?
Explain why an activity-based costing system might include direct labour and
non-manufacturing costs, as well as manufacturing overhead costs.
Describe the role of activity centres when assigning costs to activities.
Explain how cost categories can be used to simplify the assignment of costs to
activities. Give three examples of cost categories that a manufacturing business
might find useful and describe the costs that might be included in each category.
Activities may be classified as unit level, batch level, product level or facility level.
Define each of these terms and give an example of each of these four types of
activities for:
(a) Car manufacturer.
(b) Courier company.
How is the unit, batch, product and facility level classification relevant to product
costing?
Should facility level costs be included when estimating product costs for:
(a) Reporting inventory balances?
(b) Evaluating product profitability?
Explain your answer.
PART 2 COSTS AND COSTING SYSTEMS
Y
L
N
O
R
E
T
P
A
H
C
E
L
SAMP
17/11/08 11:39:12 AM
Describe the three main types of activity driver found in activity-based costing and
give two examples of each type of driver for Australia Post. (Hint: First think about
the activities performed at Australia Post and then think about their activity drivers.)
8.18
What factors should be considered in deciding whether to aggregate individual
activities into larger homogeneous ‘activity cost pools’ and in deciding how many
cost pools to use?
8.19
What causes conventional product costing systems to report lower product costs
than those reported by activity-based costing systems for low-volume, smallbatch, speciality product lines?
8.20
Describe the circumstances in which the benefits from ABC will be greatest.
Using the ‘Real life’ scenarios in this chapter give some examples of the benefits
of activity-based costing.
8.21
What factors may impede the introduction of ABC?
8.22
What are the implications of spare capacity when activity-based costing is used
to report on the profitability of a firm?
8.23
The success (or failure) of activity-based costing is determined by the reactions of
the people who develop and use the system. Discuss.
8.24
Describe the limitations of activity-based costing.
8.25
Give three examples of service organisations that use activity-based costing
drawing on the ‘Real life’ scenarios in this chapter. Are there any special problems
that are likely to arise in using activity-based costing in service organisations?
8.26
(appendix) Compare the simple ABC system described in this chapter with
the conventional approaches to product costing that use either a plantwide
manufacturing overhead rate or departmental overhead rates.
QUESTIONS
EXERCISES
PROBLEMS
CASES
8.17
EXERCISES
E8.27
Assigning costs to activity centres: manufacturer
Silverwater Ltd manufactures video recorders and has decided to develop an
activity-based product costing system to assign labour and overhead costs to
products. The table below lists Silverwater’s costs during the current year and the
resource drivers to be used to assign these costs to activity centres.
Silverwater Ltd
Labour and Overhead Costs
Total cost
Wages
$600 000
Resource driver
Total amount of
resource driver
Head count
100 employees
Building costs
200 000
Floor area
10 000 square metres
Energy
300 000
Kilowatt hours
250 000 kilowatt hours
Other
50 000
Head count
100 employees
Total labour and
overhead costs
$1 150 000
Required:
1 Calculate the costs assigned to the Assembly Centre given its usage of
resource drivers during the year, as follows:
Number of employees
Floor area
Power used
Y
L
N
O
R
E
T
P
A
H
C
E
L
SAMP
20
1 000 square metres
10 000 kilowatt hours
CHAPTER 8 ACTIVITY-BASED COSTING
LS(5e)-08.indd 405
405
17/11/08 11:39:12 AM
QUESTIONS
EXERCISES
PROBLEMS
CASES
2 The costs listed above are not individual costs but a series of costs grouped
together into cost categories such as wages, building costs and so on.
Explain why Silverwater combined the costs from its general ledger into cost
categories. Under what conditions is it appropriate to combine costs into cost
categories? Give three examples of the types of costs likely to be included in
each category.
3 What is meant by the term resource driver? Can you suggest a better basis for
assigning ‘Wages’ to activity centres?
E8.28
Assigning activity centre costs to activities: manufacturer
Acacia Paints Ltd manufactures paint and uses an activity-based product costing
system. The table below lists the labour and overhead costs of the Mixing Centre
for the current year, and their resource drivers.
Acacia Paints Ltd
Mixing Centre
Costs and Resource Drivers
Total cost
Wages
$100 000
Energy
80 000
Resource driver
Amount of resource
driver consumed by
the centre
Head count
5 people
Kilowatt hours
10 000 kilowatt hours
Depreciation
20 000
Machine hours
5000 machine hours
Other
10 000
Head count
5 people
Total labour and
overhead costs
$210 000
Required:
1 Complete the following table to calculate the cost of the activity ‘Load mixer’
for the current year. This activity is performed in the Mixing Centre.
Acacia Paints Ltd
Activity: Load Mixer
Cost category
Mixing
Centre
cost
Wages
$100 000
Energy
Amount of resource driver
used to load mixer
Cost of
activity
‘Load mixer’
5% of total labour time in
Mixing Centre
?
80 000
500 kilowatt hours
?
Depreciation
20 000
100 machine hours
?
Other
10 000
5% of total labour time in
Mixing Centre
?
Total cost
$210 000
2 Why would Acacia Paints use an activity-based product costing system that
assigns labour as well as overhead costs to activities?
3 How would the management accountant obtain details of the activities performed
and the quantity of resource drivers used by the activities in the Mixing Centre?
E8.29
406
LS(5e)-08.indd 406
Y
L
N
O
R
E
T
P
A
H
C
E
L
SAMP
Calculating the cost per unit of activity driver: manufacturer
McPhail Ltd manufactures delicious shortbread biscuits in a variety of shapes and
sizes. The following is a list of activities, costs, and quantities of activity drivers for
the Mixing Centre for the current year:
PART 2 COSTS AND COSTING SYSTEMS
17/11/08 11:39:13 AM
Activity
cost
Activity driver
Quantity of
activity driver
$6 000
No. of batches
400 batches
9 200
No. of batches
400 batches
Operate mixing machine
51 200
No. of machine
hours
3 200 machine
hours
Unload mixing machine
8 000
No. of batches
400 batches
Press biscuits onto trays
20 000
No. of biscuits
500 000 biscuits
No. of loads
2000 loads
Activity
Weigh ingredients
Load mixing machine
Move trays to ovens
Total cost
6 400
QUESTIONS
EXERCISES
PROBLEMS
CASES
McPhail Ltd
Mixing Centre
Activities and costs
$100 800
Required:
1 Calculate the cost per unit of activity driver for each activity in the Mixing
Centre.
2 Explain how these costs are used to calculate the cost of the range of
shortbread products produced by McPhail Ltd.
3 Classify each activity in the Mixing Centre as facility, product, batch or unit
level. Give your reasons for each classification.
4 Suggest alternative activity drivers for each of the activities.
E8.30
Assigning activity costs to products: manufacturer
Sonix Sounds Ltd manufactures high-fidelity compact disc players and uses an
activity-based product costing system that assigns labour and overhead costs.
Below is an incomplete bill of activities for the high-volume product, CD Standard.
Sonix Sounds Ltd
Bill of activities: CD Standard
Activity
Cost per unit of activity
driver
Annual quantity of
activity drivers used
by the product
Process payables
$40 per purchase order
400 purchase orders
Program production
$150 per production
schedule
100 schedules
Process sales order
$50 per sales order
300 sales orders
Issue materials
$80 per issue
100 issues
Set up solder machine
$105 per setup
100 setups
Solder circuit boards
$10 per solder joint
40 000 solder joints
Insert motor
$20 per player
5 000 players
Assemble player
$12 per player
5 000 players
Design player
Directly assigned cost of $8 000 for model CD Standard
Y
L
N
O
R
E
T
P
A
H
C
E
L
SAMP
Required:
1 Complete the bill of activities and estimate the total activity cost of the CD
Standard player, calculated on an annual and per unit basis, assuming the
annual production is 5000 units. (You may find it useful to refer to Exhibit 8.10
on page 383.)
CHAPTER 8 ACTIVITY-BASED COSTING
LS(5e)-08.indd 407
407
17/11/08 11:39:13 AM
QUESTIONS
EXERCISES
PROBLEMS
CASES
408
LS(5e)-08.indd 408
2 If the direct material cost of a CD Standard player is $45 per unit, what is the
total unit cost of the product?
3 Explain the treatment of the costs of the activity ‘Design player’.
E8.31
Activity-based costing and inventory valuation: manufacturer
Refer to the data in Exercise 8.30. Would the product cost calculated using the
activity-based costing system be allowed as a basis for valuing inventory under
Australian accounting standards? Explain your answer. (The inventory valuation
requirements of the Australian accounting standards are described in the
appendix to Chapter 4, see pages 171 and 172.)
E8.32
Classifying activities as unit, batch, product or facility level costs: manufacturer
Refer to the data in Exercise 8.30 on page 407. For each activity, indicate whether
it represents a unit, batch, product or facility level activity. In each case, explain
your answer.
E8.33
Classification of activities: winery
Seneca Falls Winery is a small, family-run operation in the Snowy Mountains.
The winery produces two varieties of wine: riesling and chardonnay. Among the
activities engaged in by the winery are the following:
(a) Pruning: At the end of a growing season, the vines are pruned, which helps
prepare them for the next harvest.
(b) Tying: The vines are tied onto wires to help protect them from the cold. (This
also occurs at the end of the season.)
(c) Hilling: Dirt is piled up around the roots to help protect them from frost.
(d) Conditioning: After the snow melts in the spring, dirt is levelled back from the
roots.
(e) Untying: The vines are untied from the wires to allow them freedom to grow
during the spring and summer months.
(f) Chemical spraying: The vines are sprayed in the spring to protect them from
disease and insects.
(g) Harvesting: All of the grapes of both varieties are picked by hand to minimise
damage.
(h) Stemming and crushing: Batches of grapes are hand-loaded into a machine,
which gently removes the stems and mildly crushes them.
(i) Pressing: After removal from the stemmer/crusher, the juice runs freely from
the grapes.
(j) Filtering: The grapes are crushed mechanically to render more juice from
them.
(k) Fermentation: The riesling grape juice is placed in stainless steel tanks for
fermentation. The chardonnay grape juice undergoes a two-stage fermentation
process in oak barrels.
(l) Ageing: The riesling wines are aged in the stainless steel tanks for
approximately a year. The chardonnays are aged in the oak barrels for about
two years.
(m) Bottling: A machine bottles the wine and corks the bottles.
(n) Labelling: Each bottle in manually labelled with the name of the vintner,
vintage and variety.
(o) Packing: The bottles are manually packed in 12 bottle cases.
(p) Case labelling: The cases are hand-stamped with the same information that
the bottles received.
(q) Shipping: The wine is shipped to wine distributors and retailers, mainly in
Sydney and Melbourne. Generally, about 100 cases are shipped at a time.
(r) Maintenance on buildings: This is done during the slow winter months.
(s) Maintenance on equipment: This is done when needed, and on a routine basis
for preventative maintenance.
PART 2 COSTS AND COSTING SYSTEMS
Y
L
N
O
R
E
T
P
A
H
C
E
L
SAMP
17/11/08 11:39:13 AM
E8.34
Comparison of activity-based and conventional product costs: manufacturer
Fantastique Fashions Ltd has switched from a conventional product costing
system to an activity-based product costing system to assign manufacturing
overhead costs to products. The table below shows the cost per unit for two
products under the two costing systems:
Costing system
Product A
Product B
Conventional
$36
$25
ABC
$30
$45
QUESTIONS
EXERCISES
PROBLEMS
CASES
Required:
Classify each of the activities listed as a unit, batch, product-sustaining or facility
level activity.
Required:
1 Describe the most likely features of products A and B by replacing the
question marks (?) in the following table with ‘Yes’ or ‘No’.
Product feature
Product A
Product B
High-volume product line
?
?
Low-volume product line
?
?
Produced in small batches
?
?
Produced in large batches
?
?
Simple to produce
?
?
Complex to produce
?
?
2 Explain your answers to requirement 1.
E8.35
Volume-based cost driver versus ABC: manufacturer
Optic Lens Company manufactures sophisticated lenses and mirrors used in
large optical telescopes. The company is now preparing its annual profit plan.
As part of its analysis of the profitability of individual products, the management
accountant estimates the amount of overhead that should be allocated to the
individual product lines from the following information:
Units produced
Material handling (number of
moves) per product line
Direct labour hours per unit
Lenses
Mirrors
25
25
5
15
200
200
The total budgeted material handling cost is $50 000.
Required:
1 Calculate the material handling costs allocated to one lens under a costing
system that allocates overhead on the basis of direct labour hours.
2 Calculate the material handling costs allocated to one mirror under a costing
system that allocates overhead on the basis of direct labour hours.
3 Calculate the material handling costs allocated to one lens under activitybased costing. The activity driver for the material handling activity is the
number of material moves.
4 Calculate the material handling costs allocated to one mirror under activitybased costing.
Y
L
N
O
R
E
T
P
A
H
C
E
L
SAMP
(CMA, adapted)
CHAPTER 8 ACTIVITY-BASED COSTING
LS(5e)-08.indd 409
409
17/11/08 11:39:14 AM
QUESTIONS
EXERCISES
PROBLEMS
CASES
E8.36
Distortion of product costs: manufacturer
Wheelco Pty Ltd manufactures car and truck wheels. The company produces
four basic, high-volume wheels used by manufacturers of large cars and trucks.
Wheelco also has two specialty wheel lines. These are fancy, complicated wheels
used in expensive sports cars.
Lately, Wheelco’s profits have been declining. Foreign competitors have
been undercutting Wheelco’s prices in three of its four major product lines, and
Wheelco’s sales volume and market share have declined. In contrast, Wheelco’s
speciality wheels have been selling steadily, although in relatively small numbers,
in spite of three recent price increases. At a recent staff meeting, Wheelco’s
managing director made the following remarks:
Our profits are going down the tube. It costs us $29 to manufacture our A22
wheel. That’s our best seller, with a volume last year of 17 000 units, but our
chief competitor is selling basically the same wheel for $27. I don’t see how
they can do it. I think it’s just one more example of foreign dumping. I’m going
to write to my local MP about it!
Thank goodness for our speciality wheels. We must get our salespeople
to push those wheels more and more. Take the D52 model, for example. It’s
a complicated thing to make and we don’t sell many, but look at the profit
margin. Those wheels cost us $49 to make, and we’re selling them for $105
each.
Required:
What do you think is behind the problems faced by Wheelco? Comment on the
managing director’s remarks. Do you think his strategy is a good one? What do
you recommend, and why?
E8.37
Key features of activity-based costing: manufacturer
Refer to the description of Wheelco Ltd in Exercise 8.36. Suppose the firm’s
managing director has decided to implement an activity-based costing system.
Required:
1 List and briefly describe the key features that Wheelco’s new product costing
system should include.
2 What impact will the new system be likely to have on the company’s situation?
3 What strategic options are likely to be considered once the results of the new
costing system are examined?
E8.38
Activity-based costing: service firm
Rex Rogers, the manager of Outback Treks, uses activity-based costing to
calculate the cost of the company’s adventure walking trips. The company offers
two basic trips: a two-day walk along the El Questro Gorge and a five-day trip to
the Flinders Ranges. The activities and costs relevant to the walking trips are as
follows:
Activity
Activity driver
Cost per unit of activity driver
Advertise trips
No. of trips
$50 per trip
Obtain National Park
permit
Destination
$100 per group permit issued
Use equipment
No. of person-days
$20 per person per day
Insure participants
No. of people
$5 per person
Cook meals
No. of person-days
$25 per person per day
Distance walked
$7 per kilometre
Y
L
N
O
R
E
T
P
A
H
C
E
L
SAMP
Guide walkers
The El Questro Gorge trip caters for 8 people, does not enter National
Parks and covers a walking distance of 50 kilometres. The Flinders Ranges trip
410
LS(5e)-08.indd 410
PART 2 COSTS AND COSTING SYSTEMS
17/11/08 11:39:14 AM
E8.39
Activity-based costing; identifying activities and activity drivers: university
Your university has decided to adopt an activity-based costing system to estimate
the cost of the various courses taught at the university.
Required:
1 Identify the major activities performed by the staff in the department that
teaches the accounting courses.
2 Suggest possible activity drivers for each activity.
3 Prepare a bill of activities that could be used to estimate the total cost of the
management accounting subject that you are currently studying.
4 Do the terms unit level, batch level, product level or facility level activities have
any relevance in this example? Explain.
5 In estimating the cost of the management accounting subject, how would you
account for materials? Explain your answer.
E8.40
(appendix) Cost drivers and activity costs in a simple activity-based product
costing system: manufacturer
Digitech Ltd manufactures various computer components in its Paramatta plant.
The following costs are budgeted for the coming year:
Insurance, plant
Electricity, machinery
Electricity, light
$780 000
156 000
78 000
Engineering design
793 000
Depreciation, plant
910 000
Depreciation, machinery
Security staff wages, plant
1 820 000
52 000
Equipment maintenance, wages
195 000
Equipment maintenance, parts
39 000
Setup wages
52 000
Inspection
39 000
Property taxes
Natural gas, heating
Raw materials and components
QUESTIONS
EXERCISES
PROBLEMS
CASES
caters for 15 people, is based in the Mt Remarkable National Park, and covers
100 kilometres.
Required:
1 Calculate the total cost of each trip, the cost per person for each trip, and the
cost per day for each trip, using the activity-based costing system.
2 Before introducing activity-based costing, Rex had estimated the average cost
of all trips at $65 per person per day. (This was based on the previous year’s
costs, adjusted for any expected changes.) Explain how the activity-based
system results in more accurate service cost estimates.
156 000
39 000
3 835 000
Required:
1 Suggest possible activities for Digitech and identify which costs would be
assigned to each activity.
2 For each activity, suggest an activity driver that could be used to assign
activity costs to products.
E8.41
Y
L
N
O
R
E
T
P
A
H
C
E
L
SAMP
Categorising activity costs: manufacturer
Refer to the information given in Exercise 8.40. For each of the activity costs
identified, indicate whether it represents a unit level, batch level, productsustaining level or facility level activity.
CHAPTER 8 ACTIVITY-BASED COSTING
LS(5e)-08.indd 411
411
17/11/08 11:39:14 AM
QUESTIONS
EXERCISES
PROBLEMS
CASES
E8.42
Activity-based costing; quality control costs: manufacturer
Natural Cosmetics Ltd (NCL) has used a conventional cost accounting system
to apply quality control costs uniformly to all products at a rate of 14.5 per cent
of direct labour cost. Monthly direct labour cost for Satin Sheen make up is
$27 500. In an attempt to distribute quality control costs more equitably, NCL is
considering activity-based costing. The monthly data following relates to monthly
quality control costs for Satin Sheen make up:
Quantity of
activity driver for
enamel paint
Activity driver
Cost per unit of
activity driver
Incoming material
inspection
Type of material
$11.50 per type
12 types
In-process
inspection
Number of units
$0.14 per unit
17 500 units
Product certification
Per order
$77.00 per order
25 orders
Activity
Required:
1 Calculate the monthly quality control cost to be assigned to the Satin Sheen
product line under each of the following approaches:
(a) conventional system which assigns overhead on the basis of direct
labour costs
(b) activity-based costing
2 Does the conventional product costing system overcost or undercost the Satin
Sheen product line with respect to quality-control costs? By what amount and
why?
(CMA, adapted)
E8.43
Problems with conventional costing systems; activity-based costing
principles: manufacturer
Marrabel Manufacturing has just completed a major change in its quality control (QC)
process. Previously, products were reviewed by QC inspectors at the end of each
major process, and the company’s 10 QC inspectors were charged as direct labour
to the operation or job. In an effort to improve efficiency and quality, a computerised
video QC system was purchased for $250 000. The system consists of a computer,
15 video cameras, other peripheral hardware, and software. The new system uses
cameras stationed by QC engineers at key points in the production process. Each
time an operation changes or there is a new operation, the cameras are moved, and
a new master picture is loaded into the computer by a QC engineer. The camera
takes pictures of the units in process, and the computer compares them with a
picture of a ‘good’ unit. Any differences are sent to a QC engineer who removes the
bad units and discusses the flaws with the production supervisors. The new system
has replaced the 10 QC inspectors with two QC engineers.
The operating costs of the new QC system, including the salaries of the
QC engineers, have been included as factory overhead in calculating the
company’s plantwide manufacturing overhead rate, which is based on direct
labour dollars. The company’s managing director is confused. His production
manager has told him how efficient the new system is, yet there is a large
increase in the overhead rate. The calculation of the overhead rate before and
after automation is as follows:
Y
L
N
O
R
E
T
P
A
H
C
E
L
SAMP
Before
$1 900 000
$2 100 000
Budgeted direct labour cost
$1 000 000
$700 000
190%
300%
Budgeted overhead rate (as % of direct labour cost)
412
LS(5e)-08.indd 412
After
Budgeted manufacturing overhead
PART 2 COSTS AND COSTING SYSTEMS
17/11/08 11:39:15 AM
QUESTIONS
EXERCISES
PROBLEMS
CASES
‘Three hundred per cent’, lamented the managing director. ‘How can we
compete with such a high overhead rate?’
Required:
1 Define ‘manufacturing overhead’ and cite three examples of typical costs that
would be included in manufacturing overhead.
2 Explain why the increase in the overhead rate should not have a negative
financial impact on Marrabel Manufacturing.
3 Discuss how an activity-based costing system might benefit Marrabel
Manufacturing.
PROBLEMS
P8.44
Calculating activity-based product costs; identifying non-manufacturing
costs: manufacturer
Kennelly and Sons manufactures components for the computer industry. The
company uses an activity-based costing system to assign labour, manufacturing
overhead and non-manufacturing costs to products. Below is a partially
completed bill of activities for one of the company’s major products,
Switch 3901.
Switch 3901
Cost per unit of
activity driver
Annual quantity of
activity driver
Prepare purchase order
$43 per purchase order
50 purchase orders
Process payables
$27 per invoice received
50 invoices
Prepare payroll
$10 per payslip
300 payslips
Activity
Process sales orders
$33 per sales order
500 sales orders
Pack and dispatch
$17 per sales order
500 sales orders
Program solder robots
$153 per program
200 programs
Solder circuits
$2 per solder joint
72 000 solder joints
Assemble circuit boards
$5 per board
15 000 boards
Wire in switch
$14 per switch
5000 switches
Insert fuse
$10 per fuse
5000 fuses
Test switch
$4 per switch
5000 switches
Design switch
$5000 for model 3901
These annual costs relate to an annual production level of 5000 switches. The
direct material cost per switch is $20.
Required:
1 Calculate the total cost per unit for Switch 3901.
2 Calculate the manufacturing cost per unit for Switch 3901. (Hint: Include only
those activities that relate to manufacturing.)
3 Discuss the role that product costs that include both manufacturing and
non-manufacturing costs can play in management decision making.
P8.45
Y
L
N
O
R
E
T
P
A
H
C
E
L
SAMP
Calculating activity costs: winery
The management of Mutherglen Wines Pty Ltd is contemplating the introduction
of an activity-based costing system and has just conducted an activity-based
costing exercise in its bottling plant. The costs of the plant, summarised into cost
categories for the year, are as follows:
CHAPTER 8 ACTIVITY-BASED COSTING
LS(5e)-08.indd 413
413
17/11/08 11:39:15 AM
QUESTIONS
EXERCISES
PROBLEMS
CASES
Bottling Plant costs
Wages
Total amount of
resource driver
Total cost
Resource driver
$2 000 000
No. of employees
40 employees
Floor area
50 000 square metres
Building costs
200 000
Machinery costs
Energy costs
900 000
Machine hours
90 000 machine hours
1 200 000
Kilowatt hours
600 000 kilowatt hours
45 000
Machine hours
90 000 machine hours
Other
$4 345 000
Four activity centres have been identified in the plant, with the following
resource driver consumption patterns:
Bottling Plant activity centres
Resource drivers
Activity
centre
No. of
employees
Floor area
(m2)
Machine
hours
Kilowatt
hours
Filling
20
15 000
40 000
250 000
Corking
10
5 000
15 000
100 000
Labelling
4
10 000
10 000
50 000
6
20 000
25 000
200 000
40
50 000
90 000
600 000
Packing
Total
The work in the Labelling Centre has been broken down into the following five
activities. Their use of resource drivers is also shown.
Labelling Centre activities
Resource drivers
No. of
employees
Activity
Floor area
(m2)
Machine
hours
Kilowatt
hours
Set up front label machines
0.5
–
–
–
Operate front label machines
1.0
3 000
7 000
30 000
Set up back label machines
0.5
–
–
–
Operate back label machines
1.0
2 000
3 000
20 000
Inspect labelled bottles
1.0
5 000
–
–
Total
4.0
10 000
10 000
50 000
Required:
1 Calculate the cost of each activity centre.
2 Calculate the cost of the activities performed in the Labelling Centre.
3 Why would Mutherglen contemplate using an activity-based product costing
system?
4 What are the limitations of activity-based product costing?
P8.46
414
LS(5e)-08.indd 414
Y
L
N
O
R
E
T
P
A
H
C
E
L
SAMP
Activity-based costing: service
Rabid Roberts is the manager of a firm, QuikTax, which specialises in the
preparation of income tax returns. The firm offers two basic products: the
preparation of income tax returns for wage and salary earners and the preparation
of income tax returns for small businesses. Any clients requiring more complex
PART 2 COSTS AND COSTING SYSTEMS
17/11/08 11:39:15 AM
Activity
Activity
cost
Interview salaried client
$40 000
Interview business client
50 000
Obtain missing data
Input data
Print return
400 000
80 000
Activity driver
Quantity
of activity
driver
No. of wage and salary clients
8 000
No. of business clients
2 000
No. of follow-up calls
8 000
No. of data entries
400 000
60 000
No. of returns
10 000
120 000
No. of hours
6 000
Rectify errors
60 000
No. of errors
6 000
Submit return
20 000
No. of returns
10 000
Verify return with client
Total costs
QUESTIONS
EXERCISES
PROBLEMS
CASES
services are referred to Rabid’s brother Roger, who is a partner in a large firm of
chartered accountants.
The processing of wage and salary tax returns is quite straightforward, and
the firm uses a software package to process data and print the return. A software
package is also used to prepare returns for small businesses, although more
information is required, particularly about business expenses.
Rabid has only recently joined QuikTax and he is concerned about the firm’s
pricing policy, which sets a flat fee of $40 per return for wage and salary clients
and $200 for small businesses. He decides to use activity-based costing to
estimate the costs of providing each of these services.
At the end of the year, Rabid reviewed the company’s total costs and
activities, resulting in the following list:
$830 000
In identifying the activities required for each type of return, Rabid noted the
following:
(a) Clients are interviewed only once per return.
(b) All follow-up calls to obtain missing data relate to business returns; on
average, each business tax return requires four follow-up calls.
(c) Processing a wage and salary tax return requires 20 data entries, whereas a
business return requires 120 data entries.
(d) On average, it takes 22.5 minutes to verify a wage and salary tax return,
whereas it takes one and a half hours to verify a business return.
(e) All errors relate to business returns; on average, there are 3 errors per
business return.
Required:
1 Use activity-based costing to estimate the cost of preparing:
(a) Wage and salary tax return.
(b) Business tax return.
2 In the light of your answers to requirement 1, evaluate the firm’s pricing policy.
P8.47
Activity-based costing; analysis of operations: service firm
Clark and Shiffer perform consulting services related to e-commerce consulting
and information systems in Perth. The firm, which bills $125 per hour for services
performed, is in a very tight local labour market and is having difficulty finding
quality staff. The labour cost per hour paid by Clark and Shiffer for professional
staff time is $45. Selected information follows:
(a) Billable hours to clients for the year totalled 5000, consisting of: information
systems services, 3100; e-commerce consulting, 1900.
(b) Administrative cost of $342 000 was (and continues to be) allocated to both
consulting services based on billable hours. These costs consist of staff
Y
L
N
O
R
E
T
P
A
H
C
E
L
SAMP
CHAPTER 8 ACTIVITY-BASED COSTING
LS(5e)-08.indd 415
415
17/11/08 11:39:16 AM
QUESTIONS
EXERCISES
PROBLEMS
CASES
support, $180 000; in-house computing, $136 400; and miscellaneous office
charges, $25 600.
A recent analysis of staff support costs found a correlation with the number
of clients served. In-house computing and miscellaneous office charges varied
directly with the number of computer hours logged and number of client
transactions, respectively. The following table shows the number of clients,
computer hours and client transactions for the e-commerce and information
systems consulting services:
e-commerce
consulting
Number of clients
Number of computer hours
Number of client transactions
Information
systems consulting
Total
50
200
250
1 800
2 600
4 400
600
400
1 000
Required:
1 Activity-based costing (ABC) is said to result in improved costing accuracy
when compared with conventional costing procedures. Briefly explain how
this improved accuracy is attained.
2 Assume that the firm uses conventional costing procedures, allocating total
costs on the basis of billable hours. Determine the profitability of the firm’s
e-commerce and information systems consulting services, expressing your
answer both in dollars and as a percentage of activity revenue.
3 Repeat requirement 2, using activity-based costing.
4 Stephen Shiffer, one of the firm’s partners, doesn’t care where his
professionals spend their time because, as he notes, ‘Many clients have
come to expect both services and we need both to stay in business. Also,
information systems and e-commerce professionals are paid the same hourly
rate’. Should Shiffer’s attitude change? Explain.
5 Is an aggressive expansion of either consulting service desirable? Briefly discuss.
P8.48
416
LS(5e)-08.indd 416
Estimating activity-based product costs; problems with conventional costing
systems: manufacturer
Sunsafe Optics Ltd manufactures lenses for sunglasses. Although the company
manufactures a wide range of lenses that vary in size and shape, these products
can be grouped into three basic product lines: coloured plastic lenses, lenses that
absorb ultraviolet radiation, and lenses that provide both sun protection and the
correction of optical defects.
All three products undergo the same injection moulding process where a
plastic substance is injected between two glass dies. When the plastic is set, the
lenses are removed from the dies, which, if possible, are re-used for subsequent
batches. The coloured plastic lenses and the UV-absorbing lenses are highvolume lines produced in large batches. These two products are simple to make
and are similar in many ways, except that the material used for the UV-absorbing
lenses is much more expensive than the material used for the coloured plastic
lenses. The optical lenses are a low-volume line, produced in small batches.
These lenses are complex to make. They require specially ground optical dies and
careful inspection at several points during production.
Currently, the company uses a conventional costing system and applies
overhead on the basis of direct labour cost. This system was developed many
years ago when the company’s production processes were labour-intensive and
overhead costs were relatively insignificant. However, over time, the production
environment has become more automated, overhead costs have increased
significantly and many of the overhead costs bear no direct relationship to the
volume of production in general, or to the direct labour cost in particular.
PART 2 COSTS AND COSTING SYSTEMS
Y
L
N
O
R
E
T
P
A
H
C
E
L
SAMP
17/11/08 11:39:16 AM
Sunsafe Optics Ltd
Activity
Activity cost
Prepare purchase order
$25 000
Annual quantity of activity driver
2 000 purchase orders
Process payables
20 000
2 000 invoices
Prepare payroll
30 000
4 000 payslips
Process sales orders
90 000
15 000 sales orders
Move finished goods
600 000
15 000 sales orders
Pack and dispatch
240 000
15 000 sales orders
Produce basic dies
180 000
60 000 dies
Produce optical dies
200 000
20 000 dies
60 000
20 000 dies
Inspect dies
Clean injection moulders
600 000
1 000 batches
Program injection moulders
360 000
1 000 batches
Move material
800 000
1 000 batches
Operate injection moulders
2 800 000
Remove dies
96 000
QUESTIONS
EXERCISES
PROBLEMS
CASES
The company’s management accountant believes that the current costing
system no longer fits Sunsafe’s production environment and has set up a special
costing study to analyse the labour and overhead costs for the year that has just
finished. The study identified the activities and costs shown below:
40 000 machine hours
4 800 000 lenses
Inspect lens
90 000
50 000 lenses
Design lens
90 000
Assigned directly to products
These annual costs relate to an annual production level of 2.5 million coloured
plastic lenses, 2.25 million UV-absorbing lenses and 50 000 optical lenses. The
direct material costs for each product are as follows:
Coloured plastic
$2 per lens
UV-absorbing
$4 per lens
Optical
$4 per lens
The management accountant estimates that the activity consumption of the
three product lines during the year was:
Sunsafe Optics Ltd
Quantity of activity driver used by each product line
Coloured
plastic
Activity
Activity driver
UV-absorbing
Optical
Prepare purchase
order
No. of purchase
orders
1 000
900
100
Process payables
No. of invoices
1 000
900
100
Prepare payroll
No. of payslips
2 000
1 800
200
Process sales orders
No. of sales orders
6 950
8 000
50
Move finished goods
No. of sales orders
6 950
8 000
50
Pack and dispatch
No. of sales orders
6 950
8 000
50
Produce basic dies
No. of dies
30 000
30 000
–
Y
L
N
O
R
E
T
P
A
H
C
E
L
SAMP
continues
CHAPTER 8 ACTIVITY-BASED COSTING
LS(5e)-08.indd 417
417
17/11/08 11:39:16 AM
QUESTIONS
EXERCISES
PROBLEMS
CASES
Sunsafe Optics Ltd
Quantity of activity driver used by each product line
Coloured
plastic
Activity
Activity driver
UV-absorbing
Optical
Produce optical dies
No. of dies
–
–
20 000
Inspect dies
No. of dies
–
–
20 000
Clean injection
moulders
No. of batches
500
450
50
Program injection
moulders
No. of batches
500
450
50
Move material
No. of batches
500
450
50
Operate injection
moulders
No. of machine
hours
20 000
18 000
2 000
Remove dies
No. of lenses
2 500 000
2 250 000
50 000
Inspect lens
No. of lenses
–
–
50 000
Design lens
Assigned directly
to products
$30 000
$50 000
$10 000
Required:
1 Estimate the per unit cost of each of the three products (rounded to three
decimal places).
2 Do you expect these costs to be higher than or lower than the product costs
estimated under the existing conventional costing system? Explain your
answer.
P8.49
Activity-based costing: service organisation
The Intellectually Disabled Council has the responsibility for distributing
government grants to fund support services for intellectually disabled people.
The director is concerned that grants be distributed on an equitable basis, and
asks Sue Jolley, the Council’s management accountant, to estimate the cost of
providing institutional care to clients with intellectual disabilities. Jolley decides to
use activity-based costing in one of the state’s larger institutions, Greenfields, to
obtain an initial estimate of the costs of the services provided.
Working with a project team at Greenfields, she identifies the following major
activities and costs for next year.
Greenfields
Activities performed
Activity
Cost (in $’000s)
Cook meals
$500
Transport clients (internal)
4000 hours of assistance
450
6000 hours of assistance
Clean rooms
100
20 000 rooms cleaned
Bath clients
144
16 000 baths given
Dress clients
30
10 000 clients dressed
Y
L
N
O
R
E
T
P
A
H
C
E
L
SAMP
Provide occupational therapy
LS(5e)-08.indd 418
100 000 meals
Transport clients (external)
Administer medication
418
200
Annual volume of
activity drivers
120
90
75 000 doses administered
600 classes
Provide physiotherapy
250
5000 hours of physiotherapy
Run sheltered workshop
150
200 days of operation
PART 2 COSTS AND COSTING SYSTEMS
17/11/08 11:39:17 AM
Greenfields
Activities consumed per client per day
Highdependency
Lowdependency
Outpatient
Cook meals
3
3
1
Internal transport
4
0
0
External transport
3
2
1
Clean room
2
1
0
Bath client
1
0
0
Dress client
1
0
0
Administer medication
4
1
1
Provide occupational
therapy*
1
2
2
4
2
1
0
1
1
Activity
Provide physiotherapy
†
Run sheltered workshop
QUESTIONS
EXERCISES
PROBLEMS
CASES
Although the needs of the individual clients vary tremendously, the
project team identifies three major service types: high-dependency support,
low-dependency support and outpatient support. High-dependency and lowdependency clients live at Greenfields, while outpatients attend the centre on a
daily basis. The average number of activities required to support each of the three
types of clients each day is estimated as follows:
* Occupational therapy classes are attended by an average of 10 clients.
†
The sheltered workshop is used by an average of 20 clients per day.
Required:
1 Use an Excel® spreadsheet to:
(a) Calculate the cost per unit of activity driver for each of the activities
identified by the project team.
(b) Calculate the daily cost of supporting:
(i) High-dependency client. (ii) Low-dependency client. (iii) Outpatient client.
2 Review the list of activities and suggest some major activities that may have
been overlooked by the project team.
3 Do you think activity-based costing is useful in this situation? Explain your
answer.
P8.50
Activity-based costing; product decisions: manufacturer
Territory Electronics Company
Income Statement
Zodiac
Sales
Cost of goods sold
Gross margin
Selling and administrative
expenses
Net profit
Units produced and sold
Net profit per unit sold
* Rounded.
Novelle
Total
$4 560 000
$19 800 000
$24 360 000
3 192 000
12 540 000
15 732 000
$1 368 000
$7 260 000
$8 628 000
978 000
5 830 000
6 808 000
$390 000
$1 430 000
$1 820 000
4 000
22 000
Y
L
N
O
R
E
T
P
A
H
C
E
L
SAMP
$97.50
$65.00*
CHAPTER 8 ACTIVITY-BASED COSTING
LS(5e)-08.indd 419
419
17/11/08 11:39:17 AM
QUESTIONS
EXERCISES
PROBLEMS
CASES
Territory Electronics Company (TEC) manufactures two large-screen television
models, the Novelle which has been produced for 10 years and sells for $900,
and the Zodiac, a new model which sells for $1140. Based on the income
statement for the year just ended, presented on page 419, a decision has been
made to concentrate TEC’s marketing resources on the Zodiac model and to
begin to phase out the Novelle model.
The unit costs for the Zodiac and Novelle models are as follows:
Zodiac
Direct material
Novelle
$584
$208
Direct labour:
42
Zodiac (3.5 hr × $14)
18
Novelle (1.5 hr × $14)
100
200
$798
$570
Manufacturing overhead*
Cost per unit
* Manufacturing overhead was applied on the basis of machine hours at a predetermined rate of $26 per hour.
Territory Electronics Company’s financial controller is advocating the use of
activity-based costing, and has gathered the following information about the
company’s manufacturing overhead costs for the year just ended:
Quantity of activity drivers consumed
Activity (activity driver)
Activity
costs
Zodiac
Novelle
Total
Soldering (number of solder joints)
$942 000
385 000
1 185 000
1 570 000
Shipments (number of shipments)
860 000
3 800
16 200
20 000
1 240 000
21 300
56 200
77 500
950 400
109 980
80 100
190 080
57 600
16 000
176 000
192 000
750 000
14 000
16 000
30 000
Quality control (number of
inspections)
Purchase orders (number of orders)
Machine power (machine hours)
Machine setups (number of setups)
Total activity costs
$4 800 000
Required:
1 Briefly explain how an activity-based costing system operates.
2 Using activity-based costing, determine if TEC should continue to emphasise
the Zodiac model and phase out the Novelle model.
(CMA, adapted)
P8.51
(appendix) Activity-based costing for overhead versus conventional costing
systems: manufacturer
Locket Storage Ltd manufactures two types of storage cabinets—Deluxe and
Executive—and applies manufacturing overhead to all units at the rate of $80 per
machine hour. Production information follows.
Y
L
N
O
R
E
T
P
A
H
C
E
L
SAMP
Deluxe
Direct material cost
Direct labour cost
Budgeted volume (units)
420
LS(5e)-08.indd 420
PART 2 COSTS AND COSTING SYSTEMS
Executive
$35
$60
20
20
8 000
15 000
17/11/08 11:39:18 AM
Deluxe
Setups
Machine hours
Outgoing shipments
Executive
Total
50
30
80
16 000
22 500
38 500
100
75
175
QUESTIONS
EXERCISES
PROBLEMS
CASES
The management accountant, who is studying activity-based costing, has
determined that the firm’s overhead can be identified with three activities:
manufacturing setups, machine processing and product shipping. Data on
the number of setups, machine hours and outgoing shipments, which are the
activities’ three respective cost drivers, follow:
The firm’s total overhead of $3 080 000 is subdivided as follows:
manufacturing setups, $672 000; machine processing, $1 848 000; and product
shipping, $560 000.
Required:
1 Calculate the unit manufacturing cost of Deluxe and Executive cabinets by
using the company’s current overhead costing procedures.
2 Calculate the unit manufacturing cost of Deluxe and Executive cabinets by
using activity-based costing.
3 Is the cost of the Deluxe cabinet overstated or understated (i.e. distorted)
by the use of machine hours to allocate total manufacturing overhead to
production? By how much?
4 Calculate the aggregate amount by which the Deluxe cabinet line is
undercosted by the company’s current conventional overhead costing
procedures. Then calculate the aggregate amount by which the conventional
system overcosts the Executive cabinet line.
5 Assume that the current selling price of a Deluxe cabinet is $260 and the
marketing manager is contemplating a $30 discount to stimulate sales. Is this
discount advisable? Briefly discuss.
P8.52
(appendix) Activity cost pools; cost drivers: manufacturer
The accountant for Halifax Photographic Supply Ltd has estimated the following
activity cost pools and activity drivers for the coming year:
Activity
Machine setups
Material
handling
Budgeted
overhead
cost
Activity driver
$200 000
No. of setups
100 000
Weight of raw
material
Budgeted
level for
activity driver
100
Cost per
unit of
activity
driver
$2000 per
setup
50 000 kilograms $2 per kilogram
Hazardous
waste control
50 000
10 000 kilograms $5 per kilogram
Weight of
hazardous
chemicals used
Quality control
75 000
No. of
inspections
Other overhead
costs
200 000
Total
$625 000
1 000
$75 per
inspection
Y
L
N
O
R
E
T
P
A
H
C
E
L
SAMP
Machine hours
20 000
$10 per
machine
hour
CHAPTER 8 ACTIVITY-BASED COSTING
LS(5e)-08.indd 421
421
17/11/08 11:39:18 AM
QUESTIONS
EXERCISES
PROBLEMS
CASES
An order for 1000 boxes of film development chemicals has the following
production requirements:
Machine setups
4 setups
Raw material
10 000 kilograms
Hazardous materials
2000 kilograms
Inspections
10 inspections
Machine hours
500 machine hours
Required:
1 Calculate the total overhead that should be assigned to the order for
development chemicals.
2 What is the overhead cost per box of chemicals?
3 If Halifax Photographic Supply Ltd were to use a plantwide predetermined
overhead rate based on machine hours, calculate the rate per hour.
4 Under the approach in requirement 3, how much overhead would be assigned
to the order for development chemicals:
(a) In total?
(b) Per box of chemicals?
5 Explain why these two product costing systems result in such widely differing
costs. Which system do you recommend? Why?
6 Calculate the unit cost of a production order for 100 specially coated
plates used in film development. In addition to direct material costing
$120 per plate and direct labour costing $40 per plate, the order requires the
following:
Machine setups
2 setups
Raw material
800 kilograms
Hazardous materials
300 kilograms
Inspections
3 inspections
Machine hours
50 machine hours
CASES
C8.53
Activity-based costing; forecasting; ethics: manufacturer
East Coast Marine Ltd (ECM) manufactures parts for small marine craft. Over the
past decade, ECM’s management has met its goal of reducing its reliance on
government contract work to 50 per cent of total sales. ECM is now equally reliant
on commercial sales and government contracts.
Traditionally, the costs of the Material Handling Department have been
allocated to direct material as a percentage of direct material dollar value. This was
adequate when the majority of the manufacturing was homogeneous and related to
government contracts. Recently, however, government auditors have rejected some
proposals, stating that ‘the amount of Material Handling Department costs allocated
to these proposals is disproportionate to the total effort involved’.
Eloise Smith, the newly hired cost accounting manager, was asked by the
manager of ECM’s Government Contracts Unit, Paul Jones, to find a more equitable method of allocating the Material Handling Department costs to the user
departments. Her review has revealed the following information:
■
422
LS(5e)-08.indd 422
Y
L
N
O
R
E
T
P
A
H
C
E
L
SAMP
The majority of the direct material purchases for government contracts are
high-dollar, low-volume purchases, while commercial materials represent lowdollar, high-volume purchases.
PART 2 COSTS AND COSTING SYSTEMS
17/11/08 11:39:19 AM
■
■
Administrative departments such as Marketing, Finance and Administration,
Human Resources and Maintenance also use the services of the Material
Handling Department on a limited basis but have never been charged in the
past for material handling costs.
One purchasing manager with a direct phone line is assigned exclusively to
purchasing high-dollar, low-volume material for government contracts on an
annual salary of $36 000. Employee on-costs are estimated to be 20 per cent
of the annual salary. The annual costs of the dedicated phone line are $2800.
The components of the Material Handling Department’s budget for the coming
year, as proposed by Lindley’s predecessor, follow.
Payroll
QUESTIONS
EXERCISES
PROBLEMS
CASES
■
$180 000
Employee on-costs
36 000
Telephone
38 000
Other utilities
22 000
Materials and supplies
6 000
Depreciation
6 000
Direct material budget:
Government contracts
2 006 000
Commercial products
874 000
Smith has estimated the number of purchase orders to be processed in the
coming year as follows:
Government contracts*
80 000
Commercial products
156 000
Marketing
1 800
Finance and Administration
2 700
Human Resources
500
Maintenance
1 000
Total
242 000
* Exclusive of high-dollar, low-volume materials.
Smith has recommended to Jones that material handling costs should be
allocated on a per purchase order basis. Jones realises that the company has
been allocating to government contracts more material handling costs than can
be justified. However, the implication of Smith’s analysis could be a decrease in
his unit’s earnings and, consequently, a cut in his annual bonus. Jones told Smith
to ‘adjust’ her numbers and modify her recommendation so that the results will be
more favourable to the Government Contracts Unit.
Being new in her position, Smith is not sure how to proceed. She feels
ambivalent about Jones’ instructions and suspects his motivation may not be
in the best interest of ECM. To complicate matters for Smith, the company’s
new managing director has asked her to prepare a three-year forecast of
the Government Contracts Unit’s results, and she believes that the newly
recommended allocation method would provide the most accurate data.
However, this would put her in direct opposition to Jones’ directives.
Smith has assembled the following data to project the material handling costs
over the next three years:
■
The number of purchase orders increases 5 per cent per year.
■
The ratio of government purchase orders to total purchase orders remains at
33 per cent.
Y
L
N
O
R
E
T
P
A
H
C
E
L
SAMP
CHAPTER 8 ACTIVITY-BASED COSTING
LS(5e)-08.indd 423
423
17/11/08 11:39:19 AM
Total direct material costs increase 2.5 per cent per year.
Material handling costs remain the same percentage of direct material costs.
■
Direct government costs (payroll, employee on-costs, and direct phone line)
remain constant.
■
In addition, she has assumed that the cost of government material in the
future will be 70 per cent of total material.
Required:
1 Calculate the material handling rate that would have been used by Eloise
Smith’s predecessor at East Coast Marine.
2 (a) Calculate the revised material handling costs to be allocated on a per
purchase order basis.
(b) Discuss why purchase orders might be a more reliable cost driver than the
dollar amount of direct material.
3 Calculate the difference due to the change to the new method of allocating
material handling costs to government contracts.
4 Prepare a forecast of the cumulative dollar impact over a three-year period
(based on the coming year plus 2 more years) of Eloise Smith’s recommended
change for allocating Material Handling Department costs to the Government
Contracts Unit. Round all calculations to the nearest whole number.
5 Referring to the standards of ethical conduct for accountants described in
Chapter 1:
(a) Discuss why Eloise Smith has an ethical conflict.
(b) Identify several steps that Smith could take to resolve the
ethical conflict.
QUESTIONS
EXERCISES
PROBLEMS
CASES
■
■
(CMA, adapted)
C8.54
Activity-based costing; conventional costing: manufacturer
Cravings for Cakes Pty Ltd manufactures a wide range of delicious cakes and
pastries. At the annual Christmas party, the company’s owner, I.M. Craving,
treated his employees to a nostalgic review of the firm’s history. He told them:
Twenty years ago we had only three product lines—pies, finger buns
and lamingtons. We were flat out producing large volumes of each
product, using very simple machinery and a lot of hard work.
My, how things have changed! We still make and sell a lot of pies
and lamingtons, but we also produce a wide range of low-volume lines,
such as danish pastries, donuts and vanilla slices. I hear you sighing,
and no wonder; these low-volume products are a pain in the neck. They
are complex to produce and their short production runs involve a lot of
extra machinery setups and material handling. But the accountants tell
me that these speciality lines have wonderful profit margins, so we must
not complain.
Craving then outlined the dramatic changes that had occurred within the
business over the past 20 years. In the factory he had seen the introduction
of computer-controlled mixing machines and ovens that replaced a lot of the
direct labour operations, and an increased emphasis on quality and delivery
performance. Indeed, right across the business, more and more effort had been
placed on keeping the customer happy.
However, his speech cast a gloomy shadow across the Christmas festivities
when he warned:
Y
L
N
O
R
E
T
P
A
H
C
E
L
SAMP
Despite all this progress, the company seems to be struggling. Our
profits are declining, and if things don’t improve over the next few months,
this may be our last Christmas together. To survive we must all work very
hard. We must focus on increasing sales, particularly of our high-margin
specialty products.
424
LS(5e)-08.indd 424
PART 2 COSTS AND COSTING SYSTEMS
17/11/08 11:39:19 AM
C8.55
QUESTIONS
EXERCISES
PROBLEMS
CASES
The company’s management accountant, Ursula B. Bright, had become
concerned about the conventional product costing system at Cravings for Cakes.
The manufacturing people were also sure that the costing system was distorting
product costs.
Required:
1 Describe the changes in cost structure that are likely to have occurred at
Cravings for Cakes over the last 20 years, and explain their causes.
2 Do you think that the existing costing system understates or overstates the
cost of:
(a) Lamington?
(b) Danish pastry?
Explain your answers.
3 Explain how activity-based costing could overcome the deficiencies inherent
in the existing costing system.
4 What factors should U.B. Bright consider when deciding whether to use:
(a) Simple activity-based costing system to assign manufacturing overhead to
products?
(b) Activity-based system that includes both manufacturing overhead and
non-manufacturing costs?
(c) Comprehensive activity-based system that includes all product-related
costs except direct material?
Estimating activity costs; assigning costs to activity
centres: manufacturer
Refer to Case 8.54. Assume that U.B. Bright decided to implement an activitybased costing system that included all costs except direct material. She identifies
the following costs, by cost category, for the past year and selects the following
resource drivers:
Cravings for Cakes
Costs and resource drivers
Cost category
Wages
Building costs
Cost
Resource driver
$300 000
Number of employees
80 000
Depreciation
100 000
Consumables
50 000
Energy
400 000
Other
20 000
Total
$950 000
Floor space
Machine hours
Orders placed by centre
Kilowatt hours used
Number of employees
Next, Bright divides the company into the following activity centres:
Product Development
Baking
Sales and Dispatch
Packing and Warehousing
Mixing Pastries and Batters
Administration
Filling Pies and Danishes
Corporate Management
Y
L
N
O
R
E
T
P
A
H
C
E
L
SAMP
The resource driver usage by each activity centre, for the various cost
categories, follow.
CHAPTER 8 ACTIVITY-BASED COSTING
LS(5e)-08.indd 425
425
17/11/08 11:39:19 AM
QUESTIONS
EXERCISES
PROBLEMS
CASES
Cravings for Cakes
Resource drivers consumed by activity centres
Cost categories (resource drivers)
Activity
centres
Wages
Building
(employees)
(m2)
Product
development
Depreciation
Energy
(machine
Consumables (kilowatt
Other
hours)
(orders)
hours) (employees)
5
200
–
10
–
5
Sales and
dispatch
10
500
–
15
–
10
Mixing
15
500
1 000
50
10 000
15
Filling
20
1 000
3 000
100
10 000
20
Baking
15
500
5 000
100
200 000
15
Packing
20
1 000
500
150
30 000
20
Administration
10
1 000
500
50
–
10
Corporate
management
5
300
–
25
–
5
100
5 000
10 000
500
Total quantity
of resource
drivers across
all activity
centres
250 000
100
Required:
1 Assign the costs to the activity centres using the resource driver consumption
patterns shown above.
2 Why did U.B. Bright use cost categories in her analysis?
3 Explain how she would have identified the cost categories, and give two
examples of the costs likely to be included in each category.
4 U.B. Bright used the number of employees as the resource driver for wages.
Can you suggest a more accurate basis for assigning wage costs to activity
centres?
5 Can you suggest a more accurate basis than machine hours for assigning
depreciation costs to activity centres?
C8.56
Estimating activity costs; assigning activity centre costs to activities:
manufacturer
Refer to Cases 8.54 (see page 424) and 8.55 (see pages 425 and above).
Notwithstanding your answers so far, assume the following costs and resource
drivers for the Mixing Centre:
Cravings for Cakes
Mixing Centre: Costs and resource drivers
Wages
Building costs
Depreciation
Consumables
Energy
Other
Total
426
LS(5e)-08.indd 426
PART 2 COSTS AND COSTING SYSTEMS
Costs
Resource drivers
$45 000
Percentage of labour time
8 000
10 000
Floor space occupied
Machine hours
Y
L
N
O
R
E
T
P
A
H
C
E
L
SAMP
5 000
16 000
3 000
Percentage of labour time
Kilowatt hours
Percentage of labour time
$87 000
17/11/08 11:39:20 AM
Cravings for Cakes
Mixing Centre:
Activities and resource drivers used
Activity
Percentage of labour
time
Percentage of floor
space
Set up scales
20
Weigh ingredients
10
5
Load mixers
25
10
Operate mixers
30
50
Clean mixers
10
20
5
10
100%
100%
Move mixture to filling
Total
5
QUESTIONS
EXERCISES
PROBLEMS
CASES
U.B. Bright has identified the following activities that take place in the Mixing
Centre, and estimates that they use the following percentage of labour time and
floor space:
The only activity that makes significant use of machinery (and therefore
depreciation and energy) is ‘Operate mixers’.
Required:
1 Calculate the cost of each activity performed in the Mixing Centre.
2 Explain how U.B. Bright would have collected the information necessary to
identify the activities and their resource driver consumption.
3 What steps can U.B. Bright take to ensure that this information is reliable?
4 Classify each activity as unit, batch, product or facility level.
C8.57
Assigning activity costs to products; benefits, costs and limitations of ABC:
manufacturer
Refer to Cases 8.54 (see page 424) to 8.56 (above). After much hard work, U.B.
Bright produces a list of the activities performed at Cravings for Cakes and their
annual costs. In addition, Bright identifies an activity driver for each activity and
the annual quantity of each activity driver. A partial list of activity costs and
quantities of activity drivers is shown overleaf.
Cravings for Cakes
List of activities
Activity
Prepare annual
accounts
Activity
cost ($)
5 000
Activity driver
Annual quantity of
activity driver
None available
Process receivables
15 000
No. of invoices
5000 invoices
Process payables
25 000
No. of purchase
orders
2500 purchase
orders
Program production
28 000
No. of production
schedules
1000 schedules
Process sales order
40 000
No. of sales orders
4000 sales orders
Dispatch sales order
30 000
No. of dispatches
2500 dispatches
Develop and test
products
60 000
Assigned directly to
products
Y
L
N
O
R
E
T
P
A
H
C
E
L
SAMP
continues
CHAPTER 8 ACTIVITY-BASED COSTING
LS(5e)-08.indd 427
427
17/11/08 11:39:20 AM
QUESTIONS
EXERCISES
PROBLEMS
CASES
Cravings for Cakes
List of activities
Activity
Activity
cost ($)
Load mixers
14 050
No. of batches
1000 batches
Operate mixers
45 900
No. of kilograms
200 000 kilograms
Activity driver
Annual quantity of
activity driver
Clean mixers
6 900
No. of batches
1000 batches
Move mixture to filling
3 450
No. of kilograms
200 000 kilograms
Clean trays
20 000
No. of trays
16 000 trays
Fill trays
16 000
No. of cakes/pastries
800 000 cakes/
pastries
No. of trays
16 000 trays
No. of batches
1000 batches
Move to baking
Set up ovens
8 000
50 000
Bake cakes/pastries
No. of batches
1000 batches
Move to packing
40 000
No. of trays
16 000 trays
Pack cakes/pastries
80 000
No. of cakes/pastries
800 000 cakes/
pastries
No. of pastries
50 000 pastries
Inspect pastries
130 000
2 500
Required:
1 Construct an Excel® spreadsheet to:
(a) Calculate the cost per unit of activity driver for the activities previously
listed. (Work to four decimal places.)
(b) Based on the information in the following table, prepare a bill of activities
and determine the cost per unit for:
(i) Lamington. (ii) Danish pastry.
Lamington (batch size 1000; annual volume 100 000)
428
LS(5e)-08.indd 428
Activities consumed
Annual quantity of activity driver
Process receivables
500 invoices
Process payables
200 purchase orders
Program production
100 production schedules
Process sales order
400 sales orders
Load mixers
100 batches
Operate mixers
30 000 kilograms
Clean mixers
100 batches
Move mixture to filling
30 000 kilograms
Clean trays
2 000 trays
Fill trays
100 000 cakes
Move to baking
2 000 trays
Set up ovens
100 batches
Bake cakes/pastries
100 batches
Move to packing
2 000 trays
Pack cakes/pastries
100 000 cakes
Dispatch sales order
500 sales orders
Develop and test product
$600 assigned directly to this product
PART 2 COSTS AND COSTING SYSTEMS
Y
L
N
O
R
E
T
P
A
H
C
E
L
SAMP
17/11/08 11:39:21 AM
Annual quantity of activity driver
Process receivables
150 invoices
Process payables
100 purchase orders
Program production
50 production schedules
Process sales order
100 sales orders
Load mixers
50 batches
Operate mixers
4 000 kilograms
Clean mixers
50 batches
Move mixture to filling
4 000 kilograms
Clean trays
400 trays
Fill trays
10 000 pastries
Move to baking
400 trays
Set up ovens
50 batches
Bake cakes/pastries
50 batches
Inspect pastries
10 000 pastries
Move to packing
400 trays
Pack cakes/pastries
10 000 pastries
Dispatch sales order
150 sales orders
Develop and test product
$2 400 assigned directly to this product
QUESTIONS
EXERCISES
PROBLEMS
CASES
Danish Pastry (batch size 200; annual volume 10 000)
Activities consumed
2 What other costs must be added to calculate the product cost for lamingtons
and danish pastries?
3 Why is the cost per danish pastry much higher than the cost per lamington?
Would this difference be reflected in the conventional costing system? Explain
your answers.
4 U.B. Bright, as management accountant for Cravings for Cakes Pty Ltd, has
recommended the introduction of an activity-based costing system to improve
the accuracy of the company’s product costs. Bright is filled with enthusiasm,
but the company’s owner, I.M. Craving, is more cautious:
All these new-fangled systems, with fancy names. Twenty years ago it was
JIT, or was it ERP? Ten years ago, TQM, and now it’s ABC or is it ABM?
I’m not keen—ABC sounds complex and expensive. Your report outlines
the benefits of ABC but it can’t be all positive. I know every cloud has a
silver lining, but I also know every silver lining has a cloud. Rewrite your
report—but this time describe the costs of ABC and its limitations, as well
as the benefits.
Prepare a report for Craving that outlines the benefits, costs and limitations
of activity-based costing. (To set your report in the appropriate business context,
you should refer to the information given in Case 8.54 on pages 424 and 425.)
C8.58
(appendix) Conventional versus simple activity-based costing systems;
strategic cost analysis: manufacturer
Gigabyte Ltd manufactures three products for the calculator industry:
■
■
■
Y
L
N
O
R
E
T
P
A
H
C
E
L
SAMP
Gismos (product G): annual sales, 8000 units.
Thingamajigs (product T): annual sales, 15 000 units.
Whatchamacallits (product W): annual sales, 4000 units.
CHAPTER 8 ACTIVITY-BASED COSTING
LS(5e)-08.indd 429
429
17/11/08 11:39:21 AM
QUESTIONS
EXERCISES
PROBLEMS
CASES
The company uses a conventional, volume-based product costing system with
manufacturing overhead applied on the basis of direct labour dollars. The product
costs have been calculated as follows:
Raw material
Direct labour
Manufacturing
overhead*
Total product
cost
Product G
Product T
$105.00
$157.50
Product W
$52.50
48.00 (2.4 hr × $20)
36.00 (1.8 hr × $20)
24.00 (1.2 hr × $20)
420.00 ($48 × 875%)
315.00 ($36 × 875%)
210.00 ($24 × 875%)
$573.00
$508.50
* Calculation of predetermined overhead rate:
Manufacturing overhead budget:
Machinery
Machine setup
Inspection
Material handling
Engineering
Total
$286.50
$3 675 000
15 750
1 575 000
2 625 000
1 034 250
_________
$8 925 000
_________
_________
Direct labour budget (based on budgeted annual sales):
Product G:
(8 000 × $48.00)
$384 000
Product T:
(15 000 × $36.00)
540 000
Product W:
(4 000 × $24.00)
96 000
_________
Total
$1 020 000
_________
_________
Predetermined overhead rate =
Budgeted overhead
= 875%
Budgeted direct labour
Gigabyte’s pricing method has been to set a budgeted price equal to 150
per cent of full product cost. However, only the thingamajigs have been selling
at their budgeted price. The budgeted and actual current prices for all three
products are the following:
Product G
Product T
Product W
$573.00
$508.50
$286.50
Budgeted price
859.50
762.75
429.75
Actual current selling price
639.00
762.75
600.00
Product cost
Gigabyte has been forced to lower the price of gismos in order to get orders.
In contrast, Gigabyte has raised the price of whatchamacallits several times, but
there has been no apparent loss of sales. Gigabyte has been under increasing
pressure to reduce the price even further on gismos. In contrast, Gigabyte’s
competitors do not seem to be interested in the market for whatchamacallits.
Gigabyte apparently has this market to itself.
Required:
1 Is product G the company’s least profitable product?
2 Is product W a profitable product for Gigabyte Ltd?
3 Comment on the reactions of Gigabyte’s competitors to the firm’s pricing
strategy. What dangers does Gigabyte face?
4 Gigabyte’s financial controller, Nan O’Second, recently attended a conference
at which activity-based costing systems were discussed. She became
convinced that such a system would help Gigabyte’s management to
understand its product costs better. She obtained top management’s approval
to design an activity-based costing system, and an ABC project team was
formed. In Stage one of the ABC project, each of the overhead items listed
430
LS(5e)-08.indd 430
PART 2 COSTS AND COSTING SYSTEMS
Y
L
N
O
R
E
T
P
A
H
C
E
L
SAMP
17/11/08 11:39:21 AM
Activity cost pool
Activity driver
Product G
Product T
Product W
Machinery
Machine hours
24%
50%
26%
Machine setup
Number of setups
22%
30%
48%
Inspection
Number of
inspections
16%
44%
40%
Material handling
Raw material costs
25%
69%
6%
Engineering
Number of change
orders
35%
10%
55%
5
6
7
8
QUESTIONS
EXERCISES
PROBLEMS
CASES
in the overhead budget was placed into its own activity cost pool. Then an
activity driver was identified for each activity cost pool. Finally, the ABC
project team compiled data showing the percentage of each activity driver
that was consumed by each of Gigabyte’s product lines. These data are
summarised as follows:
Show how the financial controller determined the percentages given above
for raw material costs. (Round to the nearest whole per cent.)
Develop product costs for the three products on the basis of a simple activitybased costing system. (Round to the nearest cent.)
Calculate a budgeted price for each product, using Gigabyte’s pricing formula.
Compare the new budgeted prices with the current actual selling prices and
previously reported product costs.
Refer to the new budgeted prices for Gigabyte’s three products, based on the
new activity-based costing system. Write a memo to the company managing
director commenting on the situation Gigabyte has been facing regarding
the market for its products and the actions of its competitors. Discuss the
strategic options available to management. What do you recommend, and
why?
Refer to the product costs developed in requirement 5. Prepare a table
showing how Gigabyte’s conventional, volume-based product costing system
distorts the product costs of gismos, thingamajigs and whatchamacallits.
Y
L
N
O
R
E
T
P
A
H
C
E
L
SAMP
CHAPTER 8 ACTIVITY-BASED COSTING
LS(5e)-08.indd 431
431
17/11/08 11:39:22 AM
Y
L
N
O
R
E
T
P
A
H
C
E
L
SAMP
LS(5e)-08.indd 432
17/11/08 11:39:22 AM


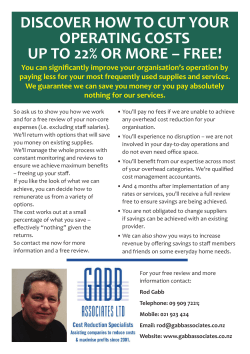


© Copyright 2026