
Variability in Juice Quality of Quality Experiments Sweet
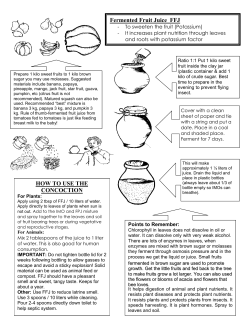
J. AMER. SOC. HORT. SCI. 128(6):803–808. 2003. Variability in Juice Quality of ‘Valencia· Sweet Orange and Sample Size Estimation for Juice Quality Experiments Graham H. Barry1 and William S. Castle Citrus Research and Education Center, University of Florida, 700 Experiment Station Road, Lake Alfred, FL 33850-2299 Frederick S. Davies Department of Horticultural Sciences, University of Florida, PO Box 110690, Gainesville, FL 32611-0690 Ramon C. Littell Department of Statistics, University of Florida, PO Box 110339, Gainesville, FL 32611-0339 ADDITIONAL INDEX WORDS. Citrus sinensis, variance components, partitioning variance, soluble solids concentration, SSC, titratable acidity, TA ABSTRACT. Sources of variation in juice quality of ‘Valencia·sweet orange [Citrus sinensis (L.) Osb.] were quantified and their relative contributions to variability in juice quality were determined, from which sample sizes were estimated. Commercial orchards of ‘Valencia· sweet orange trees on Carrizo citrange [C. sinensis x Poncirus trifoliata (L.) Raf.] rootstock were selected at four geographic locations representing the major citrus-producing regions in Florida. Within- and between-tree variation in soluble solids concentration (SSC) and titratable acidity (TA) were estimated in two experiments over two or three seasons, respectively. Variance components for all treatment effects were estimated to partition total variation into all possible component sources of variation. Seasonal variation in SSC and TA was relatively small, but larger for TA than SSC. Variation in SSC among blocks within a location was intermediate to low, and was less than variation among locations. In contrast, tree-to-tree variation in SSC and TA was large, in spite of sampling from trees of similar vigor and crop load, and variation in SSC and TA among fruit was relatively large. Based on results of this study, samples consisting of 35 fruit are required to detect differences (P 0.05) of 0.3% SSC and 0.06% TA, whereas 20-fruit samples can be used to detect differences of 0.4% SSC and 0.08% TA. Seven replications are required to detect differences of 0.5% SSC and 0.1% TA, with small gains in precision when tree numbers exceed 10. Juice soluble solids concentration (SSC) and titratable acidity (TA) of citrus are inherently variable. This variability can be large, and is a result of various factors that affect juice quality. Some factors affect individual fruit (Denny, 1922), whereas most effects on variation in juice quality are at the whole-tree level (Appleman and Richards, 1939; Jones et al., 1957; Reitz and Sites, 1948; Sites and Reitz, 1949), resulting in variability in juice quality among orchards within a region, among trees, within a tree, and among fruit. In addition, seasonal variation in juice quality, due to prevailing weather conditions during fruit development, is also a potentially important contributor to total variability in juice quality. A knowledge of the factors affecting juice quality, and the magnitude of their effects, allows those factors to be manipulated to maximize juice quality and produce fruit of consistent quality. Knowing the amount of variability in juice quality is also a prerequisite for juice quality research, and plays a pivotal role in experimental design. The concept of estimating and partitioning variance into its component sources of variation (Hanson, 1955) has extensive application to horticultural work in the field of Received for publication 29 May 2003. Accepted for publication 1 July 2003. Florida Agricultural Experiment Station journal series R-09286. This study was made possible by partial funding from Capespan International, South Africa and Tropicana Products Inc., Fla. The authors acknowledge the cooperation of Florida Fruit Managers, Barron Collier Partnership, Becker Groves Inc., and Kahn Grove Service Company, and Jim Baldwin, Jean Eelman and Linda Barry for technical assistance. 1Current address: Citrus Research International, Department of Horticultural Science, University of Stellenbosch, Private Bag X01, Maiteland, 7602, South Africa; e-mail [email protected]. J. AMER. SOC. HORT. SCI. 128(6):803–808. 2003. 060-Dev 803 sampling and sample size determination (Sharpe and van Middelem, 1955). Several citrus sample size studies have been conducted to determine the variability in juice SSC among individual fruit (Appleman and Richards, 1939; Bartholomew and Sinclair, 1943; Denny, 1922; Reitz and Sites, 1948; Sites and Reitz, 1949; Wallace et al., 1955). The results were commonly used to enable representative fruit sampling of commercial lots of citrus for remuneration purposes. Invariably these experiments used only one set of fruit samples to estimate variability in juice quality, whereas Reitz and Sites (1948) demonstrated how juice quality varied within a single tree. The outcome of these studies resulted in sample size estimates varying from 18 to 36 fruit per sample. However, the number of replications required to detect differences among treatment means has only been reported in one previous study (Jones et al., 1957), and the relative contributions of the factors affecting juice quality to variability in juice quality has not been reported. As part of a larger study of macroclimate and canopy microclimate effects on juice quality in ‘Valencia·sweet orange (Barry, 2000), a study was conducted to account for within- and betweentree variation in juice quality. The current study examines how juice quality varies according to some of the factors known to make a contribution to total variation in juice quality, including geographic locations, orchards within locations, between and within trees, and between fruit. The objectives of this study were to quantify these sources of variation in juice quality of ‘Valencia· sweet orange, and to determine their relative contributions to variability in juice quality, and to estimate sample sizes. 803 9/27/03, 11:11:48 AM Materials and Methods Sites and plant material Commercial orchards of ‘Valencia·sweet orange trees on Carrizo citrange rootstock were selected at four geographic locations after a preliminary climatic analysis of the major citrus-producing regions in Florida: Howey-in-the-Hills (northern region; 28°44·N, 81°46·W; elevation 23 m; Astatula sand soil [a hyperthermic, uncoated Typic Quartipsamment of the Entisol order]; trees planted 1987), Sebring (central region; 27°30·N, 81°26·W; elevation 44 m; Astatula sand soil; trees planted 1983), Immokalee (southwest coast; 26°28·N, 81°25·W; elevation 11 m; Oldsmar fine sand soil [a sandy, siliceous, hyperthermic Alfic Arenic Haploquod of the Spodosol order]; trees planted 1986), and Ft. Pierce (east coast; 27°32·N, 80°34·W; elevation 7 m; Winder sand soil [a fine-loamy, siliceous hyperthermic Typic Glossaqualf of the Alfisol order]; trees planted 1987). The Howey and Sebring sites were in upland ridge landscape positions and the orchards were unbedded, the Immokalee site was in a flatwoods landscape position, and the Ft. Pierce site was in a marsh landscape position (Obreza and Collins, 2002). The orchards in the latter two sites were bedded in two- and three-row beds, respectively. The trees were planted in north–south rows with tree densities at the four sites of §380 trees/ha. The trees in each site were irrigated with microsprinklers, and fertilized annually with §225 kg N/ha. Trees were not topped, but alternate sides of trees were hedged annually to maintain a 2.4-m-wide drive middle. Trees were otherwise cared for according to local cultural practices. To determine within-location variation in juice quality, three blocks were selected within the large commercial orchard at each geographic location. Within each block, research plots consisting of 120 trees (10 rows × 12 trees per row) with buffer rows and trees were used. According to grower records, the trees within each geographic location were of similar age and cropping history. Visual inspection of the trees indicated that the trees were apparently healthy and of similar size. Experimental design and data collection There were two experiments in this study. Experiment 1 was designed to estimate within-tree variation in juice quality and was conducted over two seasons, and Experiment 2, which was conducted over three seasons to estimate between-tree variation in juice quality. EXPERIMENT 1. A 4 × 2 factorial design (four geographic locations and two canopy positions), established as a crossed-nested design, was used. The sources of variation were geographic location, tree nested within location, canopy position, and the interactions, location × position, and position × tree nested within location. The two canopy positions, southwest top (SWT) and northeast bottom (NEB), were selected to provide a contrast in juice quality (Reitz and Sites, 1948). Each canopy sector represented about one-eighth of a tree·s canopy. Five randomly selected trees from one of the three blocks in each of the four geographic locations were used. At commercial fruit maturity (when juice reached a 13:1 ratio of SSC-to-TA on 9 Mar. 1998 and 8 Mar. 1999), six randomly selected fruit, regardless of size, were harvested from each of the SWT and NEB tree canopy positions. Juice was extracted from individual fruit using a citrus reamer (Sunkist Inc., Los Angeles). Brix of juice samples was measured using a hand-held temperature-compensated Brix refractometer (Atago Co., Japan), and TA was determined by titration with 0.3125 N NaOH and 0.5% 804 060-Dev 804 phenolphthalein solution. The acid correction factor was added to Brix measurements to determine SSC (Fellers, 1990). EXPERIMENT 2. A nested design was used with four geographic locations and three blocks. The sources of variation were geographic location and block nested within location. In March 1998, ten randomly selected trees in each of the three blocks at the four geographic locations were used, whereas five different trees were used in March 1999 and 2000. At commercial fruit maturity (when juice reached a 13:1 ratio of SSC-to-TA on 9 Mar. 1998, 8 Mar. 1999, and 9 Mar. 2000), 50 fruit were harvested from around each tree at a height of 1 to 2 m. Juice was extracted and analyzed at the Citrus Research and Education Center state test house facility, Lake Alfred, Fla. Statistical analysis EXPERIMENT 1. Juice quality variables were analyzed using PROC GLM and PROC MIXED (Littell et al., 1996; SAS Institute Inc., 1996). Location and canopy position were fixed effects, whereas tree nested within location was a random effect. From the analysis of variance (ANOVA), the significance of treatment effects was determined, and means were separated by least significant difference (LSD). To partition total variation into all the possible component sources of variation, geographic location and canopy position were treated as random effects, and variance components for all effects were estimated using PROC MIXED. EXPERIMENT 2. Juice quality variables were analyzed using PROC NESTED (SAS Institute Inc., 1996). Location was a fixed effect, and block nested within location was a random effect. The significance of treatment effects was determined from the ANOVA, and means were separated by least significant difference (LSD). To estimate variances of all effects to partition them into their component sources of variation, geographic location was treated as a random effect. Seasonal (year-to-year) variation was also analyzed using season as the subplot in a split-plot in time analysis. Sample size estimation A standard sample size equation (Steel and Torrie, 1980) was used to calculate sample size estimates for the number of fruit per sample or trees (replications) required to detect a difference between two means, n = (2 • t_2 • S 2)/d 2, where n is the number of fruit or trees, t is Student·s t value for the degrees of freedom associated with S 2 at P 0.05 (when _ = 0.05 and df = 15 to 27, then t § 2.1), S 2 is the sample variance for fruit or trees, and d is the desired degree of precision, or the difference to be detected between treatment means. The numbers of fruit per sample and replications required to detect differences between two treatment means for each juice quality variable, at a desired degree of precision and at P 0.05, were plotted to generate Figs. 1 and 2. Results and Discussion Juice quality EXPERIMENT 1. The overall mean SSC of ‘Valencia· sweet orange juice at maturity in two seasons was 12.7%. In each season, there was no significant difference in juice SSC among locations at P 0.05, but in 1998, SSC of fruit from Howey was lower than the other three locations at P 0.06 (Table 1). Among locations, mean SSC ranged from 12.0% to 13.2% in March 1998, but the range was narrower in March 1999 when mean SSC ranged from 12.4% to 12.8%. Fruit from the SWT canopy position had J. AMER. SOC. HORT. SCI. 128(6):803–808. 2003. 9/27/03, 11:11:52 AM significantly higher SSC than the NEB canopy position in both seasons, the difference being 0.7% and 0.6% SSC in 1998 and 1999, respectively. However, the effect of canopy position on SSC was not consistent at all locations in 1998 (significant interaction). Fruit from the SWT canopy position had significantly higher SSC than the NEB canopy position at Sebring and Howey, but there were no significant differences in SSC between canopy position at Ft. Pierce and Immokalee. Mean TA in March 1998 was 0.84%, and in March 1999 mean TA was 0.91% (Table 1). In 1998, there were no significant differences in TA among locations nor between canopy positions. The range of mean TA among locations was 0.16%. However, in 1999, TA was significantly higher in fruit from Immokalee and Howey than Ft. Pierce, whereas TA from Sebring was lower than that from Immokalee, but not significantly different from the other locations, with a range of mean TA among locations of 0.15%. No trend in TA among locations over the two seasons was evident. In 1999, fruit borne in the SWT canopy position had significantly lower TA than NEB canopy positions by 0.1% TA. The lower SSC and higher TA of fruit borne in the NEB canopy position in 1999 resulted in fruit of lower SSC-to-TA ratio compared with fruit from the SWT canopy position. EXPERIMENT 2. Mean juice SSC of ‘Valencia·sweet oranges at maturity across the four locations and three seasons was 13.1%. There was no significant difference in juice SSC among the three seasons (P = 0.2331), and the range in mean SSC among seasons across all locations was 0.5% SSC (Table 2). However, location effects were inconsistent in the three seasons (significant season × location interaction). In 1998, juice SSC of fruit samples from Ft. Pierce, Immokalee, and Sebring were not significantly different, but they were significantly higher than the SSC of fruit samples from Howey (Table 2), with a range in SSC among locations of 1.1% SSC. In 1999 and 2000, there were no significant differences in juice SSC among locations (Table 2), with the narrowest range in SSC among locations of 0.6% SSC in 1999 and an intermediate range in 2000 of 0.8% SSC. There was no trend in SSC among locations over the three seasons, there being no difference in SSC among locations in two of three seasons (Table 2). Mean juice TA at maturity across the four locations and three seasons was 0.96%, being significantly lower (at P < 0.075) in 1998 than 1999 and 2000 (Table 2). In all three seasons, TA did not differ among locations. The range in TA within each season among locations was 0.07% TA in 1998, 0.05% TA in 1999, and 0.16% TA in 2000. Variability in juice quality EXPERIMENT 1. Variation among fruit, represented by error variance, and variation among trees within locations contributed the most to total variance of SSC and TA (Table 3). These two sources of variation, together, accounted for >55% of total variance in juice SSC, and 72% (1998) and 63% (1999) of total variance in TA. Variation between canopy positions contributed Table 1. Geographic location and canopy position (SWT = southwest top; NEB = northeast bottom) effects on juice soluble solids concentration (SSC) and titratable acidity (TA) of ‘Valencia· sweet orange fruit harvested March 1998 and 1999. SSC (%) TA (%) Geographic 1998 1999 1998 1999 location SWT NEB Meanz SWT NEB Mean SWT NEB Mean SWT NEB Mean Ft. Pierce 12.8 12.8 12.8NS 12.8 12.2 12.5NS 0.73 0.83 0.78NS 0.81 0.86 0.83 c Howey 12.8 11.2 12.0 13.1 12.4 12.8 0.79 0.78 0.78 0.94 0.97 0.95 ab Immokalee 13.4 13.1 13.2 12.9 12.3 12.6 1.00 0.88 0.94 0.95 1.01 0.98 a Sebring 13.5 12.7 13.1 12.7 12.0 12.4 0.83 0.86 0.84 0.80 0.93 0.87 bc Meany 13.1 a 12.4 b 12.8 12.9 a 12.3 b 12.6 0.84NS 0.84 0.84 0.84 b 0.94 a 0.91 x P values Location 0.0586 0.5010 0.1222 0.0143 Tree (location) 0.0001 0.0290 0.0143 0.0060 Canopy position 0.0001 0.0001 0.9687 0.0007 Location × position 0.0008 0.9265 0.0658 0.1697 Within-column (location) means (n = 5 trees, 2 canopy positions) by year followed by different letters are significantly different; NSNonsignificant; P 0.05 (LSD). yWithin-row (canopy position) means (n = 5 trees, 4 geographic locations) by year followed by different letters are significantly different, NSNonsignificant; P 0.05 (LSD). xProbability values of main effects and interaction. z Table 2. Mean juice quality of ‘Valencia· sweet oranges harvested at maturity in 1998, 1999, and 2000 from four geographic locations in Florida (50-fruit samples analyzed at the Citrus Research and Education Center state test house facility, Lake Alfred, Fla.). Geographic SSCz (%) TAy (%) location 1998 1999 2000 1998 1999 2000 Ft. Pierce 13.4 ax 13.3NS 13.0NS 0.91NS 0.97NS 0.93NS Howey 12.6 b 12.9 12.9 0.93 1.02 0.95 Immokalee 13.7 a 12.9 12.6 0.86 1.00 1.09 Sebring 13.7 a 12.7 13.4 0.88 0.98 1.01 Mean 13.4 12.9 13.0 0.89 0.99 0.99 P valuew 0.0010 0.1371 0.4857 0.3627 0.9450 0.2145 Soluble solids concentration. Titratable acidity. xWithin-column means followed by different letters are significantly different; n = 10 (1998), n = 5 (1999 and 2000); NSNonsignificant; P 0.05 (LSD). wProbability value. z y J. AMER. SOC. HORT. SCI. 128(6):803–808. 2003. 060-Dev 805 805 9/27/03, 11:11:57 AM Table 3. Partitioning of variance into component sources of variation as percentage of total variance for soluble solids concentration (SSC) and titratable acidity (TA) of ‘Valencia· sweet orange fruit harvested March 1998 and 1999 to estimate within-tree variation in juice quality. Variance (% of total variance)z Source of SSC TA variation 1998 1999 1998 1999 Location 0.1032 (8.0) 0.0000 (0.0) 0.0021 (6.7) 0.0036 (17.7) Tree (location) 0.4266 (32.9) 0.1149 (18.1) 0.0078 (25.2) 0.0037 (18.2) Canopy position 0.1685 (13.0) 0.2037 (32.2) 0.0000 (0.0) 0.0021 (10.3) Location × position 0.2017 (15.5) 0.0000 (0.0) 0.0017 (5.5) 0.0005 (2.5) Position × tree (location) 0.0626 (4.8) 0.0760 (12.0) 0.0049 (15.8) 0.0012 (5.9) Errory 0.3349 (25.8) 0.2387 (37.7) 0.0145 (46.8) 0.0092 (45.3) Total 1.2975 0.6333 0.031 0.0203 zTotal variance partitioned into component sources of variation as estimated by PROC MIXED (Littell et al., 1996; SAS Institute Inc., 1996). Numbers in parenthesis represent percentages of total measured variation. yError or residual variation representing fruit-to-fruit variation. Table 4. Partitioning of variance into component sources of variation as percentage of total variance from a split-plot in time analysis for soluble solids concentration (SSC) and titratable acidity (TA) of ‘Valencia· sweet orange fruit harvested at maturity in 1998, 1999, and 2000 from four geographic locations in Florida to estimate between-tree variation in juice quality. Source of variation SSC TA Season 14.3 20.7 Location 8.5 0.9 Block 0.2 4.3 Errorz 76.9 74.2 Error or residual variation representing tree-to-tree variation. z an intermediate amount to total variation in SSC (13% in 1998 and 32% in 1999), and variation among locations contributed the smallest amount to total variation in SSC (<10%). For TA, variation among locations contributed an intermediate amount to total variation (7% in 1998 and 18% in 1999), and variation between canopy positions contributed the least to total variation (0% in 1998 and 10% in 1999). Total variance of juice SSC in 1999 was less than half that in 1998, and, for TA, total variance in 1999 was two-thirds that of 1998. EXPERIMENT 2. The primary source of variation in juice SSC and TA was tree-to-tree variation, represented by error variance, which contributed §75% of total variance (Table 4). Variation due to seasons was the next largest component of variation, contributing 14% to 21% to total measured variance. Variation among locations contributed only a small amount to variance (1% to 8%), and block-to-block variation made a negligible contribution to total measured variance (<5%). Seasonal variation in SSC and TA was relatively small, being larger for TA than SSC as observed by Harding and Sunday (1949) and Harding et al. (1959). Mean annual air temperature did not differ substantially during the period of the study, resulting in little seasonal variation in juice quality (Barry, 2000). However, seasonal variation in juice quality can be significant (Fellers, 1985; Harding et al., 1940), highlighting the importance of conducting field studies over more than one season. Collecting data over more than one season provides data about another source of variation thereby allowing more precise estimates of sample size. Under comparable conditions of climate, rootstock, tree age, and row orientation, geographic location had little effect on juice SSC and TA of ‘Valencia· sweet orange over three seasons. This apparently small effect of production region on juice quality is attributed to the similarity in mean annual air temperatures among 806 060-Dev 806 locations within the narrow geographic range from which fruit were sampled (Barry, 2000; Barry et al., 2000) and the similarity in general cultural practices of citrus trees grown in the different regions in Florida. The relatively small differences in climatic conditions within Florida contrast with large differences in climatic conditions among citrus-producing regions of the world in different climatic zones where large differences in juice quality occur (Reuther and Rios-Castaño, 1969). Variation in juice SSC among blocks within a location was intermediate to low, relative to other sources of variation, and less than variation among locations. Since blocks with trees of similar age, size, and crop load were selected for the study, low variation in juice SSC among blocks can be expected. Variation in juice SSC and TA among trees was large, in spite of sampling from trees of similar vigor and crop load. Appleman and Richards (1939) also observed tree-to-tree variation in juice quality of samples of uniformly sized fruit from trees carefully selected for uniformity. The cause of this variation is unknown. Despite the use of clonally propagated citrus trees and uniform cultural practices applied across all trees within an orchard, natural heterogeneity in site conditions may be sufficient to result in subtle differences in tree behavior, even under well-managed conditions. Nevertheless, the inherent tree-to-tree variation observed in this study highlights the need to sample fruit from sufficient numbers of trees to account for tree-to-tree variation, as mentioned by Jones et al. (1957). Canopy position had a large effect on juice SSC, and fruit borne in upper, sun-exposed canopy positions had higher SSC and lower TA than fruit borne in lower, semi-shaded positions. This effect was attributed to differences in incident radiation in the different tree canopy positions (Reitz and Sites, 1948), although this has not been quantified. Data from the current study reinforce the importance of canopy microclimate as a source of within-tree variation in juice quality. However, in addition to the affect of canopy microclimate on juice quality, the position where fruit are borne in citrus trees also has a meaningful contribution to variability in SSC. The cause of this variability may be due to fruit-to-fruit variation within canopy positions. Therefore, to take a representative sample from a tree and to avoid canopy-related bias, fruit should be sampled from all canopy positions. In contrast to SSC, canopy position effects on TA were less important. Variation in juice SSC and TA among fruit was relatively large. Similar observations were made by Denny (1922), Reitz and Sites (1948), and Wallace et al. (1955). Inherent fruit-to-fruit variation in juice quality may be due to variation in fruit size, differences in leaf-to-fruit ratio, differences in exposure of bearing shoots to J. AMER. SOC. HORT. SCI. 128(6):803–808. 2003. 9/27/03, 11:12:01 AM Fig. 1. Number of fruit per sample required to estimate differences between two means for soluble solids concentration (SSC) and titratable acidity (TA) for a given degree of precision at P 0.05 using 1998 and 1999 variances for SSC and TA. Degree of precision refers to the difference in % SSC or % TA to be detected between two means. solar radiation, or other unknown factors, and has implications in ensuring that fruit samples consist of adequate numbers of fruit to be representative of the unit being sampled. TA than SSC. In the current study this was reflected in larger coefficients of variation for TA than SSC (§10% vs. §3%). As a result, it is more difficult to demonstrate treatment differences in TA than SSC. Therefore, for the estimation of sample size, a more liberal degree of precision for TA is required than for SSC. The alternative is impractically large samples are required to estimate small differences in TA. Using 1998 data, for example, 12 fruit per sample are required to detect a difference of 0.5% SSC between two means (Fig. 1), whereas 33 fruit per sample are required to detect a difference of 0.3% SSC. The number of replications (trees) required to detect the same differences are seven vs. 19 (Fig. 2). Similarly for TA, 13 fruit per sample are required to detect a difference of 0.1% TA between two means using 1998 data (Fig. 1), whereas 35 fruit per sample are required to detect a difference of 0.06% TA. The number of replications required to detect these differences in TA are seven and 18 trees, respectively (Fig. 2). Many possible combinations of numbers of fruit per sample and replications exist, depending on the degree of precision selected. Results from previous sample size studies (Appleman and Richards, 1939; Wallace et al., 1955) showed that §30 fruit were required to detect differences of 0.5% SSC, whereas Sites and Reitz (1949) proposed that 20 fruit of uniform size sampled from the four cardinal points from the outside of a tree·s canopy at §1 m height were required to detect a difference of 0.5% SSC. From the current study, a difference of 0.5% SSC Sample size estimation The relationships between the number of fruit or replications and the difference to be detected between treatment means (degree of precision) are represented by asymptotic lines (Figs. 1 and 2). The difference to be detected, or degree of precision, becomes smaller as the number of fruit increases, and the slope of the line decreases with increasing sample size. With relatively small sample sizes, <13 fruit per sample, relatively large changes in precision occur for small increases in fruit number, but when sample sizes increase above 20 fruit per sample, relatively small changes in precision occur with increasing sample size (Fig. 1). Similarly for replications, relatively large changes in precision occur with increasing number of trees until eight trees, but when the number of replications exceeds 10 trees, relatively small changes in precision occur (Fig. 2). For both SSC and TA, variance was greater in 1998 than the other seasons, resulting in the 1998 curve being further from the horizontal and vertical axes (Figs. 1 and 2). Estimates of sample size from the 1998 curve will result in larger sample sizes than if the curves from the other seasons are used. Juice TA had greater within- and between-tree variation than juice SSC. Jones et al. (1957) also observed greater variation in Fig. 2. Number of trees (=replications) required to estimate differences between two means for soluble solids concentration (SSC) and titratable acidity (TA) for a given degree of precision at P 0.05 using 1998, 1999, and 2000 variances for SSC and TA. Degree of precision refers to the difference in percent SSC or percent TA to be detected between two means. J. AMER. SOC. HORT. SCI. 128(6):803–808. 2003. 060-Dev 807 807 9/27/03, 11:12:05 AM could be detected by sampling as few as 12 fruit. Considering the relatively large contributions of trees and fruit as sources of variation in juice quality of ‘Valencia· sweet oranges, samples consisting of 35 fruit are required to detect differences between means of 0.3% SSC and 0.06% TA at P 0.05, whereas 20-fruit samples can be used to detect differences of 0.4% SSC and 0.08% TA. The sample size selected depends on the differences to be detected for both SSC and TA, as well as practical factors such as the level of detection of the instrument used to measure the variable of interest, cost of sampling and transportation, and time taken to conduct measurements. Figure 2 can be used as a guideline to select the number of replications required, with small gains in precision when tree numbers exceed 10. Jones et al. (1957) provided a similar, but more general, guideline for four-tree plots. The value of Fig. 2 lies in the user·s ability to either specify a preferred degree of precision and then to determine the number of replications required, or to select a practical number of replications and then to assess whether the corresponding degree of precision is acceptable to the researcher·s needs. When too few replications are used in an experiment, true differences among treatments may not be detected. In such cases, type II errors are made, i.e., fail to reject the null hypothesis when it is false, and conclude that there are no differences among treatments when true differences do exist. For example, previous studies on rootstock effects on juice quality were unable to detect differences in SSC of §1.0% and TA of §0.1% among fruit samples from trees on different rootstocks (Castle and Phillips, 1980; Castle et al., 2000). In these examples too few replications were used, n = 3 and n = 5, respectively. Literature Cited Appleman, D. and A.V. Richards. 1939. Variability of sugar-acid ratio and total nitrogen in ‘Valencia· oranges. Proc. Amer. Soc. Hort. Sci. 37:539–542. Barry, G.H. 2000. Sources of variation in juice quality of ‘Valencia·sweet orange [Citrus sinensis (L.) Osb.]. PhD diss. Univ. of Fla. Barry, G.H., W.S. Castle, and F.S. Davies. 2000. Juice quality of ‘Valencia· sweet orange among citrus-producing regions in Florida and between canopy positions. Proc. Intl. Soc. Citricult. 1:308–314. Bartholomew, E.T. and W.B. Sinclair. 1943. Soluble constituents and buffer properties of orange juice. Plant Physiol. 18:185–206. Castle, W.S. and R.L. Phillips. 1980. Performance of ‘Marsh· grapefruit and ‘Valencia· orange trees on eighteen rootstocks in a closely spaced planting. J. Amer. Soc. Hort. Sci. 105:496–499. 808 060-Dev 808 Castle, W.S., J.C. Baldwin, and J.W. Grosser. 2000. Performance of ‘Washington· navel orange trees in rootstock trials located in Lake and St. Lucie counties. Proc. Fla. State Hort. Soc. 113:106–111. Denny, F.E. 1922. Formulas for calculating number of fruits required for adequate sample for analysis. Bot. Gaz. 73:44–57. Fellers, P.J. 1985. Citrus: Sensory quality as related to rootstock, cultivar, maturity, and season, p. 83–128. In: H. Pattee (ed.). Evaluation of quality of fruits and vegetables. AVI Publ., Westport, Conn. Fellers, P.J. 1990. Florida·s citrus juice standards for grades and their differences from United States standards for grades and United States Food and Drug Administration standards of identity. Proc. Fla. State Hort. Soc. 103:260–265. Hanson, W.D. 1955. General concept of and considerations for the use of variance components. Proc. Amer. Soc. Hort. Sci., 66:403–409. Harding, P.L. and M.B. Sunday. 1949. Seasonal changes in Florida tangerines. U.S. Dept. Agr. Tech. Bul. No. 988. Harding, P.L., M.B. Sunday, and P.L. Davis. 1959. Seasonal changes in Florida tangelos. U.S. Dept. Agr. Tech. Bul. No. 886. Harding, P.L., J.R. Winston, and D.F. Fisher. 1940. Seasonal changes in Florida oranges. U.S. Dept. Agr. Tech. Bul. No. 753. Jones, W.W., T.W. Embleton, and C.B. Cree. 1957. Number of replications and plot sizes required for reliable evaluation of nutritional studies and yield relationships with citrus and avocado. Proc. Amer. Soc. Hort. Sci. 69:208–216. Littell, R.C., G.A. Milliken, W.W. Stroup, and R.D. Wolfinger. 1996. SAS system for mixed models. SAS Inst., Cary, N.C. Obreza, T.A. and M.E. Collins. 2002. Common soils used for citrus production in Florida. Univ. Fla. Coop. Ext. EDIS Pub SL-193, http: //edis.ifas.ufl.edu/SS403 (26 May 2003). Reitz, H.J. and J.W. Sites. 1948. Relation between positions on the tree and analysis of citrus fruit with special reference to sampling and meeting internal grades. Proc. Fla. State Hort. Soc. 54:80–90. Reuther, W. and D. Rios-Castaño. 1969. Comparison of growth, maturation and composition of citrus fruits in subtropical California and tropical Columbia. Proc. 1st Intl. Citrus Symp. 1:277–300. SAS Institute Inc. 1996. SAS user·s guide: Statistics. version 5 ed. SAS Inst. Inc., Cary, N.C. Sharpe, R.H. and C.H. van Middelem. 1955. Application of variance components to horticultural problems with special reference to a parathion residue study. Proc. Amer. Soc. Hort. Sci., 66:415–420. Sites, J.W. and H.J. Reitz. 1949. The variation in individual Valencia oranges from different locations of the tree as a guide to sampling methods and spot-picking for quality. Part I. Soluble solids in the juice. Proc. Amer. Soc. Hort. Sci. 54:1–9. Steel, R.G.D. and J.H. Torrie. 1980. Principles and procedures of statistics. 2nd ed. McGraw-Hill, New York. Wallace, A., S.H. Cameron, and P.A.T. Wieland. 1955. Variability in citrus fruit characteristics, including the influences of position on the tree and nitrogen fertilization. Proc. Amer. Soc. Hort. Sci., 65:99–108. J. AMER. SOC. HORT. SCI. 128(6):803–808. 2003. 9/27/03, 11:12:09 AM


© Copyright 2026