
Document 289826
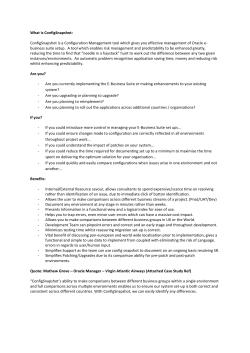
AskAnalyst.com
Chisinau, Moldova
[email protected]
+373-796-24706
Independent Equity Research
December 2006
Equity Research Report
ORACLE CORP. (ORCL)
Analyst Opinion: NEUTRAL
(in $ millions, except per share data)
Year Ends May 31
Q1
FY07
Q2
FY07
Q3
FY07E
Q4
FY07E
FY06
FY07E
FY08E
Total revenues
Operating income
Net income
Diluted Earnings per share (US GAAP)
3,591
936
663
$0.13
4,163
1,357
967
$0.18
4,347
1,228
831
$0.16
5,947
2,199
1,508
$0.28
14,380
4,736
3,381
$0.64
17,858
5,714
4,024
$0.76
20,942
6,568
4,560
$0.86
Source: Analyst estimates, SEC filings.
Summary
We believe Oracle is fairly valued. Oracle is a successful software and IT services company,
which has exhibited strong growth, fuelled by an aggressive acquisition-driven strategy. It is a
multibillion company with a strong brand name and large customer base. However, the company
has been relying on acquisitions for its growth and faces very strong competition, represented by
such industry giants as Microsoft, IBM and SAP. The latter is a leader in many business software
segments and is developing its own set of SOA tools, an area heavily targeted by Oracle.
However, unlike Oracle, SAP has reported strong organic growth and is in no position to give up
its market share. Currently, Oracle has built a strong portfolio of companies, but it will need to
consolidate them efficiently, recovering the margins that suffered in the past two years. It will also
have to make an effort at pushing organic growth to rates comparable with SAP’s to keep and
gain market share.
Investment Highlights
Company size
Large size provides numerous benefits: credibility, rich resource base (including human capital, research
facilities, intellectual property), cross-subsidization possibilities, relative ease of entry into new
industries/segments, possibility to work with large customers (governments, multinationals etc),
economies of scale, bargaining power and lobbying, purchasing power for acquisitions.
Wide range of products
Oracle targets the corporate segment of the software consumer market and offers a wide range of
business software, developed both internally and acquired through purchase of subsidiaries. The
products include:
• Technology Products: Database and Grids, Middleware, Data Hubs, Developer Tools, Security,
Search, Enterprise Management, Business Intelligence, Collaboration, Content, Data
Warehousing, Linux;
• Application Products: Customer Relationship Management, Financial Accounting, Human
Resources, Supply Chain, Public Sector Applications, Banking Applications, Retail Applications,
Telecom Applications, Higher Education Applications and other;
• Services: Support, Education, On Demand, Financing, INSIGHT, Consulting.
The company is also developing a new integrated product suite planned for initial release in 2008 – the
Fusion Project (discussed below). With such an extensive portfolio and significant expertise, Oracle is a
world-class leader and a standard-setting player in its domain.
Expansion into industry subsectors through acquisitions
Oracle has been acquiring subsidiaries in other market segments, benefiting from existing customer
bases, technology and trust already gained by the target companies. Oracle’s size and customer base
both allow and require the company to keep looking for new directions to expand to. In the past several
years, Oracle has been very active in terms of acquisitions, buying both small and big IT companies.
Page 1 of 9
This is a free sample – not to be used for trading. AskAnalyst.com assumes no responsibility for decisions
based on information presented in this report.
AskAnalyst.com
Chisinau, Moldova
[email protected]
+373-796-24706
Independent Equity Research
Company
Month/Year
Industry
Collaxa
PeopleSoft
Oblix
Retek
TripleHop
TimesTen
ProfitLogic
Context Media
i-flex
June 2004
January 2005
March 2005
April 2005
June 2005
June 2005
July 2005
July 2005
August 2005
Business Process Management
Enterprise Software
Identity Management Solutions
Retail Industry Solutions
Context-sensitive Enterprise Search
Real-time Enterprise Solutions
Retail Industry Solutions
Enterprise Content Integration
Banking Industry Solutions
G-Log
Innobase
September 2005
October 2005
Thor
Technologies
OctetString
Temposoft
360Commerce
Siebel Systems
Sleepycat
November 2005
HotSip
Portal Software
Net4Call
February 2006
April 2006
April 2006
Demantra
Telephony@Work
Sigma Dynamics
Sunopsis
MetaSolv
Software
SPL WorldGroup
Stellent
November 2005
December 2005
January 2006
January 2006
February 2006
Logistics Hib Solutions
Discrete Transactional Open Source Database
Technology
Enterprise-wide User Provisioning Solutions.
Valuation
n/a
$11.1 billion
n/a
$701 million
n/a
n/a
n/a
n/a
$847
million*
n/a
n/a
n/a
June 2006
June 2006
August 2006
October 2006
October 2006
Virtual Directory Solutions
Workforce Management Applications
Retail Industry Solutions
Customer Relationship Management Solutions
Open Source Database Software for Embedded
Applications
Communications Infrastructure Solutions
Software Suite for Communications Industry
Service Delivery Platform for Communications
Industry
Demand-driven Planning Solutions
IP-based Contact Center Technology
Real-time Predictive Analytics Software
Enterprise Integration Software
Solutions for Communications Service Providers
n/a
n/a
n/a
n/a
$219 million
November 2006
December 2006
Revenue and Operations Management Software
Content Management Solutions
n/a
$440 million
n/a
n/a
n/a
$6.1 billion
n/a
n/a
n/a
n/a
* As of August 31, 2006.
Source: http://en.wikipedia.org/wiki/Oracle_Corporation, SEC filings.
Oracle leads in many market segments
Oracle is an experienced multibillion company, present in several key software markets. The company is
a leader in many of the market segments it is present in, This leadership is the result of both internal
developments (such as its database business) and acquisitions (such as the acquisition of Siebel, which
allowed Oracle to narrow the gap between itself and SAP in the CRM market from 20 to just 3 percentage
1
points ).
Fusion Applications scheduled for release in 2008
Oracle plans to launch a new business software suite that will combine the functionality of its currently
separate software packages, offering greater data management capabilities to businesses than
standalone applications. An analyst notes that “if Fusion works as advertised, Oracle could wind up
2
dominating the software world this decade much as Microsoft dominated the last one.” Fusion
1
Based on 2005 data, source: Gartner.
Source: http://news.zdnet.com/2010-3513_22-6130041.html.
Page 2 of 9
This is a free sample – not to be used for trading. AskAnalyst.com assumes no responsibility for decisions
based on information presented in this report.
2
AskAnalyst.com
Chisinau, Moldova
[email protected]
+373-796-24706
Independent Equity Research
3
Middleware already has 30,000 users allowing customers to use software from different vendors.
However, SAP is planning to launch its own SOA-based suite in 2007, with its NetWeaver SOA platform
launched in 2004.
Aggressive business strategy
As illustrated by Oracle’s move to provide low cost support to Red Hat Enterprise Linux users and by the
announcement to create and offer its own version of Linux operating system, Oracle uses a very
aggressive business strategy, trying to “steal” customers from competitors or at least to make
competitors’ lives harder. This strategy is also exemplified by the acquisition activity discussed above and
by numerous partnerships that Oracle keeps establishing with various industry players.
Partnerships with industry leaders
Oracle has partnered with a number of leading companies in the IT industry, among which are Dell, HP,
Intel and others. Through such partnerships, Oracle benefits from greater exposure to potential
customers, from increased trust inferred from the expertise of its partners and from cross-marketing
opportunities. Of course, competitors also rely on partnerships and Oracle partnering with other
companies mostly offsets similar relationships between competitors.
Sound financials with healthy balance sheet
Oracle has exhibited accelerating revenue growth rates in the past several years following revenue
stagnation in 2003, resulting from its aggressive business strategy and partly fueled by acquisitions. Such
high growth rates are not typical for multi-billion companies and represent a strength on their own.
However, much of the revenue growth came from acquisitions:
11
9
7
5
3
1
-1
-3
14.4
11.8
9.7
9.5
10.2
21.9%
25%
20%
15%
16.2%
10%
9.2%
5%
7.2%
0.0%
2002
5.1%
-2.0%
2003
0%
2004
2005
Annual growth rate
Revenue, $ billions
Revenue volume and growth rates
17
15
13
2006
-5%
Total revenues
Organic revenue growth (based on pro forma data)
revenue year-over-year growth
Fiscal year ends May 31.
Pro forma data includes only Siebel and PeopleSoft acquisitions.
Source: SEC filings, our calculations
Nonetheless, in H1FY07, organic revenue year-over-year growth was 17% with 28% total revenue year4
over-year growth. In the Q1FY07 Earnings Call , the company’s CFO noted that in Q1FY07 Oracle had its
strongest Q1 licensed growth in more than five years and that the company was gaining share across all
product lines. This was also the third consecutive quarter in which Oracle had applications license growth
5
greater than 75% .
The company’s EPS has also been growing steadily as a result of both revenue increase and share
buybacks. The company plans to buy back $1 billion worth of shares every quarter until the end of the
fiscal year. Since the inception of Oracle’s share repurchase program in 1992 through FY06, the
company repurchased 1.8 billion of its shares for a total of $20.7 billion, and in July 2006 the company’s
Board extended the repurchase program so that another $4 billion worth of shares could be repurchased.
During the six months ended November 30, 2006, ORCL repurchased 121.3 million shares for $2.0
billion.
3
Source: Q1FY07 Earnings Call, available at http://seekingalpha.com/article/17179.
Transcript available at http://seekingalpha.com/article/17179.
5
Data from management in this paragraph reflect non-GAAP measures.
Page 3 of 9
This is a free sample – not to be used for trading. AskAnalyst.com assumes no responsibility for decisions
based on information presented in this report.
4
AskAnalyst.com
Chisinau, Moldova
[email protected]
+373-796-24706
Independent Equity Research
The Q2FY07 balance sheet exhibited decent liquidity, with the current ratio at 1.75, cash & equivalents
and marketable securities together accounting for 27% of all assets, and net working capital standing at
$5.6 billion. At the same time, financial debt stood at $5.9 billion, or 20.4% of total assets.
6
Positive guidance provided by management for Q3FY07 :
• New software license revenues are expected to be up 16% to 22% year-over-year;
• Total revenue is expected to be up 23% to 25% on a GAAP basis;
• Net income is expected to growth 24% to 29% on a GAAP basis;
• GAAP EPS is expected to be $0.18-0.19, up from $0.14 last year.
Investment Risks
Company size
Large size also brings some disadvantages: multiple levels of management increase bureaucracy, small
but highly lucrative niches may remain unnoticed/unattended and left to smaller players to fill in,
difficulties to implement corporation-wide changes, antitrust attention from governments, any
errors/malfunctions in products immediately create bad publicity.
Strong competition
Oracle faces competition from Microsoft, SAP, IBM etc. – some of the biggest corporations in the world.
Other competitors are also well established big companies with large resource and customer bases. Thus
competing with all of them efficiently requires a lot of financial and marketing resources, as well as
management attention. Some moves by the company to fend off competition may prove to be ineffective
and considered too costly by shareholders and the professional public. For example, the move to
compete with Red Hat in the corporate Linux space has been received by the industry with mixed
feelings. On one hand, Red Hat is forced to cut down pricing and faces a threat of customer outflow. On
the other hand, analysts observe that customer loyalty and Red Hat’s software certification program are
very hard to beat. Besides, the revenues that Oracle might take away from Red Hat would not make
7
much of a difference at the bottom line for Oracle . Moreover, a RedMonk analyst Stephen O’Grady
considers that “in the short term, this will be a problem in terms of perception and customer
apprehension. In the longer term, this could actually reinforce Red Hat’s preeminence.”
SAP is one of Oracle’s main competitors. SAP is the market share leader in the CRM, ERP, and SCM
8
spaces, according to Gartner Dataquest , and has partnered with Microsoft to make its applications
integrate easily with MS Office applications. SAP is also developing a Services Oriented Architecture
suite which may be launched as soon as in 2007, one year before Oracle’s Fusion application suite. It’s
SOA platform – NetWeaver – was launched in 2004. At its recent European TechEd conference in
9
Amsterdam, SAP opened the NetWeaver platform to a broader development community . Via the online
SAP Developers Network, developers will be able to purchase individual subscriptions to SAP software,
allowing them to test, evaluate and develop tools in NetWeaver. Previously, access to development tools
was available only for companies that had purchased SAP software. The subscription program will
include access to technical support, premium content and online access for testing enterprise services.
The program is scheduled to begin in 2007.
SAP also has a large customer base and a strong brand name. Just like Oracle attacked Red Hat, SAP
10
attacked Oracle earlier this year, offering support to Siebel customers at lower rates than Oracle’s. SAP
also boasts growing revenues, including in Oracle’s home market – the US, where it had 15% growth of
Software revenues in Q3FY06, and has issued a positive outlook for the year in October, while stating
that SAP was gaining market share and growing mainly organically, as opposed to Oracle’s acquisition11
driven growth . SAP expects full-year 2006 product revenues to increase by 13-15% year-over-year,
6
Oracle F2Q07 (Qtr End 11/30/06) Earnings Call from December 18, 2006, transcript available at
http://seekingalpha.com/article/22626.
7
Some of these opinions can be found here: http://news.zdnet.com/2100-3513_22-6130071.html.
8
Source: http://www.destinationcrm.com/articles/default.asp?ArticleID=6162.
9
Source: http://searchsap.techtarget.com/originalContent/0,289142,sid21_gci1225126,00.html.
10
Source: http://news.zdnet.com/2100-9593_22-6071696.html.
11
Source: Q3FY06 earnings call, available at http://seekingalpha.com/article/18842.
Page 4 of 9
This is a free sample – not to be used for trading. AskAnalyst.com assumes no responsibility for decisions
based on information presented in this report.
AskAnalyst.com
Chisinau, Moldova
[email protected]
+373-796-24706
Independent Equity Research
based on the expectation for full-year 2006 software revenue growth in the range of 15% to 17%,
compared to 2005.
Relative security weakness of Oracle databases
The company’s key product suffers from weak security compared to competitors. Recently, a security
researcher from NGS Software published a white paper comparing security robustness of database
12
software from several producers . Oracle’s products were recognized to contain more security bugs than
Microsoft’s SQL Server products.
The number of security flaws in the Oracle and Microsoft database servers that have been discovered
and fixed since December 2000 until November 2006:
Source: http://www.databasesecurity.com/dbsec/comparison.pdf
13
Another report by the Enterprise Management Group , also notes Oracle’s relatively poor security
record. In fact, security vendor Argeniss has announced that it will have a “week of Oracle Database
bugs” in December focusing on Oracle’s poor security record.
Such poor security record can cast a shadow of doubt on Oracle’s other products and reduce customer
trust, especially when data security is being addressed on national level in many countries.
Fast expansion and tight competition have eroded Oracle’s profit margins
Rapid expansion came at the price of margins, with both operating and net margins experiencing a
decline during 2005-2006.
Operating and Net margins
40%
36%
32%
28%
36.9%
38.0%
36.3%
32.9%
26.4%
24%
20%
34.1%
operating margin
net margin
23.0%
2002
24.5%
24.3%
2003
2004
2005
23.5%
2006
Fiscal year ends May 31.
12
Source: http://www.vnunet.com/vnunet/news/2169225/microsoft-beats-oracle-security, white paper
available at http://www.databasesecurity.com/dbsec/comparison.pdf.
13
Source: http://www.microsoft.com/presspass/itanalyst/docs/ESGNov2006SQLServerSecurity.pdf.
Page 5 of 9
This is a free sample – not to be used for trading. AskAnalyst.com assumes no responsibility for decisions
based on information presented in this report.
AskAnalyst.com
Chisinau, Moldova
[email protected]
+373-796-24706
Independent Equity Research
Source: SEC filings, our calculations.
SWOT Analysis
Strengths
• Big size: large resource base;
• Leadership in many market segments;
• Strong brand name and reputation;
• Partnerships with industry leaders;
• Diversified product portfolio;
• Strong revenue growth;
• Sound financial situation;
• Fusion suite to be launched in 2008;
• Aggressive business strategy;
• Positive guidance.
Weaknesses
• Relatively poor safety record;
• Acquisitions have been the main source of
revenue growth, while organic growth
slowed down in FY06.
• Mr. Ellison likes to make unsubstantiated
statements which eventually may lead to
trouble.
Opportunities
• Continuous adoption of BPO and related
software;
• Increasing adoption of software-as-aservice concept;
• Globalization
driving
multinational
companies to implement software that
reduces costs and increases efficiency, to
remain competitive.
Threats
• Tough competition against very large
players;
• SAP is developing a competing SOA suite;
• Fast expansion erodes margins;
• Increasing size of corporation may
deteriorate management focus.
Industry Overview
Enterprise resource planning (ERP) applications market: Oracle is the fastest market share gainer
14
The ERP applications market is expected to reach $29 billion in 2006 or 14.2% higher than in 2005.
Also, for the next five years the market is expected to grow at a CAGR of 10%.
While Oracle is expected to maintain its second position in terms of market share, it is likely to enjoy the
largest growth in the ERP application segment compared to other Top 5 ERP vendors and at 2x the
overall market growth rate.
Top 5
ERP Vendors
SAP
Oracle
Sage Group
Microsoft
SSA Global
2004
Revenue
Share
2005
Revenue
Share
2006
Revenue
Share
Revenue Growth
Rate
2005-06
40%
10%
5%
3%
3%
42%
20%
6%
4%
3%
43%
23%
6%
4%
3%
17%
29%
10%
18%
3%
100% =
$25.4 billion
100% =
$29 billion
14%
TOTAL
MARKET
Source: AMR Research (2006)
Business analytics software and data warehousing tools market: Oracle is the market leader
14
Source: AMR Research
Page 6 of 9
This is a free sample – not to be used for trading. AskAnalyst.com assumes no responsibility for decisions
based on information presented in this report.
AskAnalyst.com
Chisinau, Moldova
[email protected]
+373-796-24706
Independent Equity Research
Oracle was recognized as the leading business analytics software and data warehousing tools vendor for
15
2005, retaining a market share of 13.1% or $2.2 billion of the $16.6 billion total market . This market
grew by 11% in 2005.
Oracle is the world leader in the data warehousing tools market with a 19.3% market share and $1.9
16
billion in 2005 software revenues. Oracle is also the leading vendor in the data warehouse management
category with a 39.8% market share and $1.6 billion in revenues for 2005. Oracle’s closest competitor in
the category had a 22.7% market share.
Worldwide relational database market (RDBMS): Oracle is the market leader
Worldwide relational database management systems (RDBMS) total software revenue increased by 8.3%
17
in 2005 reaching $13.8 billion . Of the top 5 vendors, just Microsoft experienced a growth rate above the
industry average, primarily due to pent-up demand for SQL Server 2005.
RDBMS,
top vendors
Oracle
IBM
Microsoft
Teradata
Sybase
Other
TOTAL
2005
Market Share
48.6%
22.0%
15.0%
3.2%
2.9%
8.2%
100% = $13.8 billion,
8.3% yoy growth
Source: Gartner.
Customer relationship management (CRM) software market: Oracle is much closer to the leading
position after the acquisition of Siebel
18
Worldwide CRM software market reached $5.7 billion, experiencing 14% growth in 2005 over 2004,
driven by companies looking for more opportunities to drive revenue and expand business lines.
In 2005, SAP was the top CRM vendor in terms of revenue (26% market share), followed by Siebel
(17%), Oracle (6%), Salesforce.com (5%) and Amdocs (5%). However after the acquisition of Siebel
Systems in January 2006, Oracle attained a 23% market share.
Application integration and middleware (AIM) market: Oracle has the strongest momentum in the
segment
The application integration market reached $8.5 billion in 2005, a 7.1% increase over 2004. The main
players were: IBM (a clear leader with market share of 37%), BEA Systems (14.5%), Oracle (8.7%),
Microsoft (4.7%) and Tibco (3.7%).
Oracle – with the highest momentum in the segment – witnessed revenue growth of 40% in 2005.
19
2005 Worldwide Vendor Revenue Estimates for AIM Software (Millions of Dollars)
Company
2004
2005
2004-2005
2004
2005
Growth (%)
Market
Market
Share (%)
Share (%)
IBM
BEA Systems
Oracle
15
2,959.8
1,163.3
529.8
3,159.4
1,232.5
739.4
6.7
6
39.6
37.3
14.7
6.7
37.2
14.5
8.7
Source: IDC.
Source: IDC.
17
Source: Gartner.
18
Source: Gartner.
19
Source: http://www.gartner.com/press_releases/asset_153343_11.html.
Page 7 of 9
This is a free sample – not to be used for trading. AskAnalyst.com assumes no responsibility for decisions
based on information presented in this report.
16
AskAnalyst.com
Chisinau, Moldova
[email protected]
+373-796-24706
Independent Equity Research
Microsoft
Tibco
Other Vendors
TOTAL
350.3
289.9
2,643.0
7,936.1
397.1
314.4
2,657.3
8,500.2
13.4
8.5
0.5
7.1
4.7
3.7
31.3
100
4.4
3.7
33.3
100
Source: Gartner Dataquest (May 2006)
Oracle Versus Peers
Despite its aggressive acquisition strategy, ORCL maintains superior profitability level compared to other
giants from the IT space; in terms of operating and net margin being exceeded just by Microsoft.
Market Cap, $Bn:
Revenue, $Bn (ttm):
Latest Quarter Rev. Growth (yoy):
Revenue per employee, Mn
Gross Margin (ttm):
EBITDA Margin (ttm):
Operating Margin (ttm):
Net Margin (ttm):
ORCL
SAP
MSFT
IBM20
101.8
15.2
29.7%
0.27
77.1%
40.5%
34.1%
23.2%
258.1
12.1
11.5%
0.34
65.9%
30.1%
27.5%
18.5%
295.1
45.4
11.0%
0.64
82.2%
41.9%
39.4%
28.5%
NA
15.8
5.5%
NA
87.5%
NA
31.0%
18.0%
Source: Yahoo! Finance, SEC filings.
Valuation
We expect ORCL to report:
• $18 billion in sales for FY07 and $21 billion in FY08;
• GAAP diluted EPS of $0.76 (FY07) and $0.86 (FY08).
While estimated P/S ratio unveils a premium of ORCL over peers multiple, we believe it is warranted by
superior profitability. According to peers’ median P/E multiple, ORCL seems fairly valued.
Overall, we are quite optimistic about ORCL and consider it may show further positive developments. But
we consider that at current stock price, the investment gain is limited.
12/28/06
COMPANY NAME
AMDOCS
SALESFORCE.COM
SAP AG ADR
TIBCO SOFTWARE
MICROSOFT
BEA SYSTEMS
SYBASE
Median
TICKER
SYMBOL
MRKT CAP
(MILS)
PRICE
PER SHR
PE
CAL 2006
PE
CAL 2007
P/S
CAL 2006
P/S
CAL 2007
7,758
4,151
66,861
1,981
295,110
5,590
2,268
38.00
36.96
52.82
9.41
30.02
12.66
24.89
19.69
160.70
27.65
26.89
24.81
23.44
17.05
24.81
17.12
85.95
24.57
24.13
17.87
20.42
16.48
20.42
2.98
8.39
5.57
3.83
6.42
3.99
2.62
3.99
2.59
5.81
5.14
3.43
5.37
3.73
2.27
3.73
88,843
17.1
22.47
19.82
9%
4.98
3%
4.24
-25%
DOX
CRM
SAP
TIBX
MSFT
BEAS
SY
ORACLE
ORCL
Discount (premium) to peers median
Source: Analyst estimates for ORCL, other stocks – www.baselinedirect.com
Income statement Forecast
US GAAP, $ millions, except per share
data
20
Q1
FY07
Q2
FY07
Q3
FY07E
Q4
FY07E
FY06
FY07E FY08E
Software segment only; annual (2005) values.
Page 8 of 9
This is a free sample – not to be used for trading. AskAnalyst.com assumes no responsibility for decisions
based on information presented in this report.
AskAnalyst.com
Chisinau, Moldova
[email protected]
+373-796-24706
Independent Equity Research
Fiscal Year Ends May 31
Revenues:
New software licenses
Software license updates and product
support
Software revenues
804
1,941
1,207
2,007
1,235
2,143
2,364
2,308
4,905
6,636
5,610
8,399
6,174
9,961
2,745
3,214
3,378
4,672 11,541
14,009
16,136
846
949
916
2,839
3,849
4,807
3,591
4,163
4,294
5,809 14,380
17,858
20,942
750
200
915
205
954
222
1,264
251
3,177
719
3,883
878
4,554
1,029
780
506
157
205
48
9
820
519
170
202
-36
11
819
588
174
222
60
11
961
664
168
244
70
11
2,516
1,872
555
583
137
85
3,380
2,277
669
873
142
42
4,173
2,670
785
961
156
46
2,655
2,806
3,051
3,633
9,644
12,144
14,374
Operating income
Interest expense
Non-operating income, net
936
-83
102
1,357
-82
79
1,244
-90
79
2,177
-99
79
4,736
-169
243
5,714
-354
339
6,568
-390
373
Income before provision for income taxes
Provision for income taxes
955
292
1,354
387
1,233
362
2,156
634
4,810
1,429
5,698
1,675
6,551
1,991
Net income
663
967
870
1,523
3,381
4,024
4,560
$0.13
$0.13
$0.19
$0.18
$0.17
$0.16
$0.29
$0.29
$0.65
$0.64
$0.78
$0.76
$0.88
$0.86
Services
Total revenues
Operating expenses:
Sales and marketing
Software license updates and product
support
Cost of services
Research and development
General and administrative
Amortization of intangible assets
Acquisition related
Restructuring
Total operating expenses
Earnings per share: (US GAAP)
Basic
Diluted
1,137
Source: SEC filings, analyst estimates.
Page 9 of 9
This is a free sample – not to be used for trading. AskAnalyst.com assumes no responsibility for decisions
based on information presented in this report.


© Copyright 2026