
BGC Growth Assessment Report - SAMPLE -
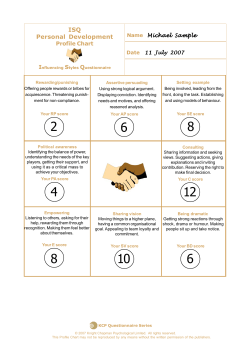
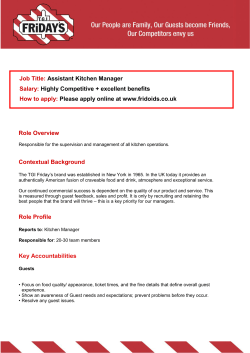
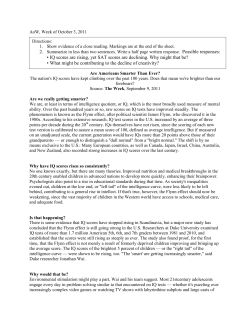
BGC Growth Assessment Report
- SAMPLE -
About the BGC Growth Assessment
The BGC Growth Assessment is based on FORECAST, a new Best Practices assessment and
analysis instrument that measures your company’s performance in 34 Best Practices and 171
Attributes of fast and sustainable growth against those of the world’s best-run companies.
Focusing on the areas of Market Intelligence, Brand, Operations, and Talent, FORECAST is
the result of over a quarter century of experience working with the world’s leading fast growth
companies and the last six years of dedicated research in development of the instrument itself.
Built by a team of executives, entrepreneurs, consultants, and business school professors,
FORECAST is the most comprehensive Best Practices assessment on the market today.
FORECAST is unique in that it combines multiple aspects of the world’s leading models, theories,
and organizational development instruments into one. For example, you will find elements of Ken
Blanchard’s “Raving Fans” alongside Ichak Adizes’ Lifecycle Theory and Peter Senge’s work on
Systems Thinking from MIT/Sloan. You will also find elements of not only one, but five major
quality assessments contained in this instrument such as the Baldridge and EFQM assessments
which are not only used by Fortune 500 companies throughout the world, but governments and
public institutions as well.
Only FORECAST brings this complete suite of thought leadership together removing the jargon
and consulting-speak so that its Best Practices and attributes can be used by your organization
no matter what organizational development model, practice, or methodology yours may subscribe
to.
By distilling Best Practices down to their basic elements, FORECAST can also be configured to
work with new leading models as well. Through exclusive arrangement with Applied
KnowledgeLabs, the creators of FORECAST, Birol Growth Consulting has brought you its own
customized version of the assessment focused specifically around those best practices and
attributes relating to your company’s Best and Highest Use™ and Andy’s own unique and highly
sought after prescription for growth.
Underlying Models of the Assessment
There are three underlying core models of the Assessment: Systems Theory, Organizing
Theory, and Lifecycle Theory.
Systems Theory in its simplest form explains the interconnectedness of everything within a
business. It means that making change in one area affects the whole. Most problems or
challenges facing the business today are only symptoms of an underlying cause that is more
complex. If the organization does not take a larger view of the problem of the moment, it will not
see the true cause. A quick way to tell if an organization is dealing with symptoms or the root
cause is if the problem is recurring. If you are solving the same problem, you have been treating
symptoms. Solving the root cause means the problem stays solved.
Organizing Theory (The Law of 5’s) looks at the situational nature of the five processes, the five
control mechanisms, and the five components of organizational structure that drive how a
business organizes to maximize resources.
Lifecycle Theory looks a business over its entire life and based upon its current stage can help a
company predict the greatest threats and opportunities it has both now and in the immediate
future. It allows any business to understand their present circumstances and predict what is next.
2
Often when executives speak of what stage in their lifecycle they are in, they will refer to their
current capitalization, number of customers, number of employees, or perhaps their number of
physical locations. Lifecycle Theory, however, discounts those attributes. While age of the
company, current capitalization, number of customers, number of employees, or perhaps the
number of physical locations a company may have will be a statement to what that company has
achieved, they are not necessarily predictors of whether or not those achievements can be
sustained. Lifecycle Theory instead looks for those predictors by way of corporate culture and
management’s beliefs about what needs to be focused on which in turn drive the traditional
indicators of success. For example, cash flow and profitability are both important in a company,
yet profitability is less crucial to success in earlier stages than it is at later stages.
Regardless of industry, company history, company size, or revenue, all organizations must
implement specific best practices at particular stages of their corporate life cycle in order to
achieve optimum growth. A company may be 25 years in existence and has grown, and grown
profitably, every year making it appear like it is at the Stable or Prime stage in its lifecycle, yet it
may still be neglecting many Stage I or Stage II attributes which have in turn either stifled the
company’s true growth potential (i.e. it was growing at 10% per year “safely” while its competitors
were growing at 20%), or are in fact setting it up for future hardship, or even demise.
Many of the challenges in companies today come from these best practices working out of
sequence. Life Cycle Theory, and the FORECAST Assessment as a whole, can help determine
what an organization needs to do first, and then next throughout its entire corporate life cycle.
Research has shown that no matter from what industry or unique circumstances a company may
be coming from, it must work these Best Practices in their proper order in order to achieve and
sustain optimum growth. For further illustration of these Best Practices and their position in the
corporate lifecycle, please note Appendices B and C near the end of this report.
A discussion of your assessment scores, beginning with How To Read This Report, begins on
the next page.
3
How To Read This Report
Overall, this assessment is designed to determine how aligned your company is around its Best
and Highest Use™.
As you recall from taking the Assessment, you were provided with a statement from which you
either agree or disagree. A six-point scale was used to eliminate the midpoint and provide an
score that was to one side, or the other. Of the scores themselves, a “1” indicates that the
attribute does not exist, whereas a “6” indicates that it exists all the time. Comments are also
included which provide further insight into the numbers provided.
Each score you see represents an average. In the larger, organization-wide report, the scores are
divided into four categories - O, E, M, and I – which refer to the various respondent groups:
Overall, Executive, (Middle) Management, and Individual (or “front-line”) Contributor. In
certain cases, only the score for Executive will be provided.
To the right of the averages you will see the heading “Stage” along with a Roman numeral beside
each attribute. This refers to the stage in the corporate lifecycle that attribute is associated with.
Please note that the stage the attribute is associated with is not affected by that attribute’s score.
What to Look For In Your Report
While there are many “layers” to the data and your corresponding report (Andy will guide you
through the pertinent ones), there are two things to look for which can help you put the report to
immediate use.
1) Stage I Scores Below 4.00. A score below 4.00 for a Stage I attribute represents an area of
the company that should receive immediate triage. Often challenges within a company that keep
repeating themselves (i.e. they never stay solved) are a result of a Stage I attribute which has not
been fully developed within the company.
2) Conflicting Scores. Attributes within the Assessment can be independent of one another, or
either complementary or contradictory depending on their nature. For instance, a company may
score itself very high on “Collecting Competitor Intelligence” yet score itself very low on “Market
Research”, leading one to question how in fact the company is either collecting, or perhaps
storing and processing, its Market Intelligence. Although there are many of these relationships
between the attributes of the assessment, your FORECAST expert will guide you through the
ones relevant to your company and current situation.
Finally, upon review of your scores, Andy will discuss how specifically his process can assist you
in maintaining and improving each of these Best Practices and attributes within in your
organization, as well as answer any additional questions you may have.
Expert analysts at Applied KnowledgeLabs have prepared an interpretation of your scores from
an objective third-party position. Your Assessment Results begin on the next page, starting with
the Executive Summary and followed by Andy Birol’s recommendations.
4
Executive Summary
The scores would indicate a very high degree of customer satisfaction and customer commitment
within the company. Scores of 6.00 were present for such key attributes as Voice of Customers,
Internal Service, Impacting New Customers, Rapid Response and Tailored Response. Other
high scores for attributes such as Streamlined for Responsiveness (6.00), Continuous
Improvement Processes (6.00), and Customer-Driven Strategy (5.00) appears to be in support of
this as well.
Bureaucracy scores and Infrastructure scores would indicate that there’s a lot of empowerment
and/or autonomy in the organization as well with employees tasked with serving the customer.
Product & Service Offer Mix was given a score of 3.00. The statement responded to was: “It is
very clear we have the right product & service offer mix for the price”. With such high scores for
Voice of Customers (6.00) and Adding Value to Customers (5.00), a score of 3.00 might suggest
that the operative phrase in this statement could be “very clear”. While your company may
be winning customers over, there appears to not be any basis other than sales and perhaps
customer satisfaction indexes to address the question of “why” from a competitive standpoint.
This would be supported by the low scores given for Market Research, Client Development, and
Making The Rules.
Nontheless, everything the company is doing internally appears to be working as far as keeping
customers is concerned. Externally, however, the scores express some challenges as again the
score for Product & Service Offer Mix would begin to suggest being less than a 4.00. Market
Research was given a score of 1.00, as was Sales Automation and Client Development.
Collecting Market Intelligence was given a 2.00.
In the short-term, a company can manage fairly well letting sales levels and feedback from
customers suffice as market research and intelligence (especially if a company has exclusive
products or services), however relying solely on this makes for an increasing level of customer
and employee flight risk if situated in a marketplace with savvy and/or aggressive competitors.
Low scores in these areas may indicate that the company is missing out on potential
opportunities that further articulation of its brand may help to remedy.
Client Development was given a score of 1.00. If the company is in a transactional business
where the ability to be a knowledge resource for the customer and build relationships between
clients/customers and the company is limited, this score may not have a lot of bearing on the
success of the organization. If the opposite is true, however, a 1.00 in combination with a low
Characteristics of Profitable Customers score of 3.00 would indicate that the company may be
leaving significant amounts of money “on the table” in trying to discover/meet a customer’s needs.
Sometimes a score of 1.00 here can be an indicator of too many “hassle customers” which may
generate revenue, but at the expense of company efficiency or morale. It can also sometimes be
an indicator that the company’s employees tend to be excessive in trying to serve a particular
group or type of customers to too much of the company’s expense. Either way, the low scores for
these attributes, especially those of Stage I, warrant more discussion.
Recommendations
Andy will be providing you with recommendations based on your data during your executive
debriefing. Those recommendations and corresponding dialogue here will be captured in this
section once the debriefing has concluded.
5
Stage I Attributes <4.00:
Part A:
Attribute:
Score (Overall):
Product & Service Offer Mix
Market Research
1.00
Collecting Market Intelligence
3.00
2.00
Part B:
Attribute:
Score (Overall):
Identifying Best Customers
Characteristics Profitable Customers
Making The Rules
1.00
2.00
3.00
Part C:
Attribute:
Score (Overall):
- No scores <4.00
Part D:
Attribute:
Score (Overall):
- No scores <4.00
Your Assessment scores begin on the next page.
6
Best and Highest Use® Survey Results
Part A: Internal Perception
Description
Internal Perception
How your firm perceives what your customers value it for
doing.
A snapshot of the perceptions of your systems,
structure, processes, and procedures that currently
deliver your firm’s BHU.
3.33
Attribute
Understand
Customer Use
Product and
Service Offer Mix
Market Research
Right Structure
Adding Value to
Customers
Communicate Key
Performance
Collecting Market
Intelligence
Enhance Brand
Image
Description
Stage
II
3.00
I
1.00
2.00
I
III
5.00
II
4.00
III
2.00
I
2.00
II
Internal Service
6.00
III
Vx of Customers
6.00
III
2.00
III
2.00
IV
E
Stage
2.00
I
3.00
I
6.00
I
5.00
I
5.00
I
2.00
III
4.00
6.00
I
I
Tailored Response 6.00
III
Perceived
3.00
Uniqueness (Brand)
III
Capability
Development
Maintaining Price
Integrity
Part B: External Snapshot
E
5.00
3.85
Attribute
Identifying Best
Customers
Characteristics
Prof. Customers
Impacting New
Customers
External Snapshot
Research-Driven
Provide Superior
An analysis of the company's performance in the
Value
marketplace based upon their opinion of the perception of
New Uses for
former and existing clients and suppliers.
Existing Offer
Understand Trends
Rapid Response
Chars of Best
Customers
4.00
II
Making The Rules
1.00
I
Winning Profitable
3.00
Customers
II
7
Best and Highest Use® Survey Results
Part C: Direction Setting
Description
2.91
Attribute
Customer-Driven
Strategy
Sales Automation
E
Stage
5.00
I
1.00
III
Client Development 1.00
III
Formal Customer
Development
3.00
III
Direction Setting
CRM Technology
5.00
I
An actionable growth plan designed to find, keep, and
grow customers with confidence.
Build Right First
Time
Flexible Output
Perception
5.00
III
5.00
IV
Selling Overwhelms
1.00
Service
III
Flexible Output
Reality
Runs @ 95%
Capacity
Perceived
Uniqueness
(Metrics)
Part D: Tactics and Structure
Description
Tactics and Structure
Your confidence in implementing your Best and Highest
Use by aligning strategy with people, processes with
clients.
1.00
III
2.00
IV
3.00
II
4.09
Attribute
E Stage
Silo-less
5.00
III
Infrastructure
Impact on Existing
5.00
III
Customers
Bureaucracy Not an
4.00
IV
Obstacle
Remove Non-Value 3.00
III
Excellent Service w/
3.00
Margins
III
Policies for Service 5.00
III
Continuous Impr.
Programs
Appropriate
Funding
Provide Superior
Value
Streamlined for
Responsiveness
Sales Process
Objectives
6.00
III
1.00
IV
5.00
I
6.00
III
2.00
III
8
Best and Highest Use® Survey Results
Part A: Internal Perception
Understand Customer Use
6.00
Maintaining Price Product and Service Integrity
Offer Mix
5.00
Capability Development
4.00
Market Research
3.00
2.00
1.00
Vx of Customers
Right Structure
0.00
Adding Value to Customers
Internal Service
Communicate Key Performance
Enhance Brand Image
Collecting Market Intelligence
Part B: External Snapshot
Winning Profitable Customers
Making The Rules
Identifying Best Customers
6.00
5.00
4.00
3.00
Characteristics Prof. Customers
Impacting New Customers
2.00
Chars of Best Customers
1.00
Research‐Driven
0.00
Perceived Uniqueness (Brand)
Provide Superior Value
Tailored Response
Rapid Response
New Uses for Existing Offer
Understand Trends
9
Best and Highest Use® Survey Results
Part C: Direction Setting
Perceived Uniqueness (Metrics)
Runs @ 95% Capacity
Customer‐Driven Strategy
5.00
4.50
4.00
3.50
3.00
2.50
2.00
1.50
1.00
0.50
0.00
Flexible Output Reality
Selling Overwhelms Service
Sales Automation
Client Development
Formal Customer Development
CRM Technology
Flexible Output Perception
Build Right First Time
Part D: Tactics and Structure
Sales Process Objectives
Streamlined for Responsiveness
Silo‐less Infrastructure
6.00
Impact on Existing 5.00
Customers
4.00
3.00
2.00
Bureaucracy Not an Obstacle
1.00
Provide Superior Value
0.00
Appropriate Funding
Continuous Impr. Programs
Remove Non‐Value
Excellent Service w/ Margins
Policies for Service
10
Appendix A: Glossary of Concepts
Market Intelligence (Competitive Advantage)
The essence of understanding market leadership, this section identifies where the
organization can excel and is the matched set for Core Competency. Competitive
Advantage exist in both real time and the future, understanding the under- or unserved
needs with significant financial gain of a targeted niche.
Best Practices
Description
Attributes
Definition
The benefit of any offer is
Impacting New
how it affects the customers
Customers
business.
Competitive
Landscape
Creating an accurate and
complete picture of the
entire marketplace, used
to identify current and
future customer value
Impact on
Existing
Customers
Making the
Rules
Research
Driven
Product to
Knowledge
Understanding how the
customer uses your
products and services to
drive continuous
improvement of your
existing offer and
development of new
products and services
Customer
Driven Strategy
LeaderCustomer
Contact
Client
Development
Market
Research
By understanding our
customers better, we can
improve the profitability of
the relationship
Given only two choices in
the marketplace, copy, or
lead, the leaders force their
competitors to copy.
Intuition alone is dangerous;
market leadership utilizes
intuitive knowledge based
upon provable facts.
Business strategy is designed
to improved customer
performance.
Developing critical intuitive
knowledge by direct contact
with the market
Improving the profitability of
existing accounts with the
same diligence as improving
product quality
Comparing current and
future competitors,
identifying most and least
profitable customers, and the
best and worst products
(services) available.
11
New Uses for
Existing Offer
Understand
Trends
Targeted
Industries
Based upon Competitive
Landscape, the selection
of specific industries
with un or underserved
needs and high economic
return
Identifying Best
Customers
Characteristics
Profitable
Customers
Rapid Response
Tailoring
Response
Product and
Service Offer
Mix
Identifying the most
profitable customers today
and the immediate future for
the current offer.
Identifying the issues
affecting value of customers,
the customers’ customer, and
competitors.
Identifying the
characteristics of the best and
worse customers.
Identifying customers where
there is a match between
vision-mission-values,
business models, and
willingness to pay for
performance.
Flexibility of the systems to
operate in the real-time to
customer needs
Flexibility of the systems to
customize the offer to
provide better value to the
customer
The company’s offer of
products and services at
current price matches the
targeted accounts
12
Brand (Core Competence)
Fast growth starts with brand, and what makes it superior in the eyes of the customer.
Beyond a marketing campaign, it is about perceived customer benefits of your end
product and the experience of buying and using it. It must be difficult for competitors to
imitate, and must create uniqueness from anyone else.
Best Practices
Description
Attribute
Statements
The
end
game, what the
Distinguishing
company
intends to
Mission
achieve for whom.
Statement
Embraced Vision The company’s social
rules, how we intend to
Creating a clear and
& Values
accomplish the mission.
compelling picture of the
Ensuring the “rules of the
Clarity of
game” is clearly defined to
Stakeholder company’s future that
enables everyone:
allow for independent
Purpose
Contribution employees, suppliers,
action.
All short-term actions are
and shareholders to
Long Term
weighed against the longcontribute
Perspective
term impact.
Respected
Leaders
Reporting
Methods
Given your company’s
strategy and processes,
Infrastructure the most efficient
method of organizing to
Alignment
ensure coordination
without bureaucracy
Streamlined for
Responsiveness
Solve Problems
Silo-less
Fire Fighting
Cultural
Adaptability
Based upon your
company’s history and
traditions, the ease or
difficulty for using all of
its resources to conduct
on-going change
Flexible
The behavior of corporate
leaders is consistent with
the organizations mission,
vision, and values.
The company provides the
right amount of
information about the few
key metrics.
All processes are aligned
with impact on the
customer’s business or
those who service
customers.
The company is not
reactive to reoccurring
problems, issues are solved
once.
Processes drive structure;
the company organizes
around core processes and
then determines the best
structure.
The urgent (the immediate)
does not crowd out the
critical (long term).
The company’s culture
(social structure) is flexible
enough to match rate of
change in the marketplace.
13
Communicate
Key Performance
Customer
Feedback
Information on
Quality
Goal
Integration
The blending of diverse
goals (business
objectives, job demands,
professional
development) to align
people with strategy,
processes with customers
Understand
Personal Impact
Service to
Existing Vs.
Selling to New
Selling
Overwhelms
Service
Common
Objectives
Policies for
Service
Right Structure
Resource
Deployment
Given the restrictions on
available resources
(money, time, people,
focus), a process that
maximizes results from
current budget
Executive Focus
on Service
Sufficient
Resources
Bureaucracy Not
an Obstacle
Intellectual
Leadership
Your company’s ability
to establish thought
leadership in its industry
by being first to take
advantage of new
opportunities
Collecting
Market
Intelligence
Developing
Future
Capabilities
The company collects and
shares information to
provide clarity to act.
Information about
customers is part of
corporate reporting.
Information about quality
is part of corporate
reporting.
All members understand
their impact on corporate
performance.
The company balances
service to existing
customers with gaining
new customers.
Internal service is treated
with the same diligence as
external service to
customers.
High levels of consistency
exist between customer
objectives and company
objectives.
Policies for servicing
internal and external
customers are consistent
throughout the company.
Execution is a core
component of everyone’s
job.
The company fully
supports fewer initiatives
to ensure execution instead
of under funding many
initiatives.
The company is never
confused: purpose always
trumps policy.
The company’s structure
supports performance and
does not serve as an
obstacle.
Collecting, interpreting,
and sharing knowledge
about the market is a core
function in the company.
Information about future
opportunities and threats
drives internal
improvement.
14
Improving Core
Capabilities
Migration
Management
Based upon trends
identified in your
company’s Targeted
Industries, the ability to
move into new markets
while the opportunity
exists
Leveraging
Technology
Assembling
Experts
First to New
Markets
Quickest to
Customers
Planned
Change
Readiness
The ability of your
organization (strategy,
processes, resources,
people) to tackle change
as part of how business
is done
Compelling
Invigorated
Collaborative
Anticipating
Change
Strategic
Response
The creation and
execution of business
strategy that creates a
competitive advantage
by making your brand
superior in its niche
Winning
Profitable
Customers
Best Suppliers
Technology for
Service
Capability
Development
Part of the company’s
yearly strategy is the
improvement of internal
processes.
The company uses
technology as leverage for
improvement and
increasing productivity.
The company has
relationships with industry
and subject matter experts
to improve the business.
The company is successful
at being first to take
advantage of changes in the
market.
The company is successful
at being first at introducing
new products and services
in the market.
The company understands
that the process of making
changes is as important as
the quality of the decisions.
All changed is approached
and managed through
WIIFM (What Is In It For
Me).
Members of the company
understand that change is
core the business and enjoy
the challenge.
Special emphasis is placed
on collaboration during
period of change to
minimize isolation and
resistance.
The company understands
the market and their
customers, and therefore is
first in the market.
The company competes for
and wins the best
customers.
The company competes for
and wins the best suppliers.
The company uses
technology as leverage for
implementing strategy.
Information about current
opportunities and threats
drives internal
improvement.
15
Perceived
Uniqueness
Adding Value to
Customers
Targeted
Accounts
Based upon your
Targeted Industries,
selecting customers that
match the company’s
core competence
Collecting
Competitor
Research
Executive
Involvement in
Sales
Right Selling
Level
Understand
Customer Use
Characteristics of
Best Customers
Right Sales
Metrics
Enhance Brand
Image
The company understands
how to be distinctive in the
customer’s eyes.
The company constantly
looks for ways to make
existing accounts more
profitable.
The company understands
how to be distinctive from
their competitors.
The company founderowner-executive has an
active role in the sale
process.
The sales force is selling to
the right customer level.
The sales force understands
how customers use the
company’s products and
services.
The sales force understands
the reasons the best
customers are the best
customers.
The company measures
sales in a way that ensures
the sales force will do the
right thing
Everyone in the company
ensures the brand is
protected or enhanced.
16
Operations (Productive Capacity)
The essence of your business model, this section measures the organization's ability to
provide products, services, and customer enthusiasm to specified markets. It is the
delivery component for Core Competency.
Best Practices
Description
Attribute
Our processes ensure that
The availability of
knowledge is embedded
multiple methods of
in processes and is readily
storing information
available.
Information
(quantitative and
Storage
Acquisition
qualitative) from
business operations for
future use.
Aggressively Build
Capabilities
Problem Solving
Development
& Research
Reversal of traditional
R&D, new ideas is
developed in
collaboration with
suppliers and
customers: bringing
products and services
to the market faster
and at lower cost.
Soliciting Input
Brand Uniqueness
Voice of Customer
Voice of Supplier
Part of the company’s
R&D processes is
dedicated to improving of
how it does business.
The company has a
commonly used process
for analyzing problems.
The right people – subject
matter experts, process
owners – are involved
early in the R&D process.
Being unique is integral
to any design
specifications for new
products & services.
Customer specifications
are integral to any design
specifications for new
products & services.
Supplier specifications
are integral to any design
specifications for new
products & services.
17
Remove Nonvalue
Build Right First
Time
New Process =
New Standard
Excellent Service
Margins
Locus of Control
Process
Design
An established process
for designing and
building product,
service, sales, and
support processes that
ensures right first time
delivery.
Performance
Autonomy
Minimize
Management
Surprises
Provide Superior
Value
Provide Value
@Price
Flexible Output
Run @95%
Capacity
Operational
Cleanliness
The company ensures all
nonvalue added activities
are eliminated from
processes.
Designing processes with
quality built in, not
inspected in later.
Designing processes that
create new standards for
quality, speed, and cost.
Great margins are built
into all service processes.
People focus their time
and energy on things
under their control.
Everyone has the freedom
necessary to do the job
right the first time.
Management’s decisionmaking is fact based and
consistent.
Providing superior value
to the customer is built
into the process.
Designing processes that
build superior value for
the price.
Product and service
processes are flexible and
able to adjust to market
demands.
Product and service
processes are capable of
running at 95% of its
capacity over time.
Acting as if all functions
and processes are open
and available for
immediate customer
inspection.
18
Availability
Knowledge
Dissemination
The availability of
multiple methods for
retrieving information
(quantitative and
qualitative) used in
problem solving and
decision-making.
Direct Access
Task Procedures
Notified of
Advertising
Right Information
Production
Equipment
Inventory
Management
Preventive
Maintenance
Reliable and robust
applications
(machinery,
computers, pagers,
phones, etc.) that are
user friendly and
dependable.
An established and
ongoing process for
managing inventory
using JIT (just in time)
methods to reduce
costs and ensure
quality.
An established and
ongoing process for
ensuring equipment is
managed through its
lifecycle, not run to
destruction.
All information relevant
to problem solving,
decision-making, and
operating the business is
immediately available.
Everyone in the
organization has access to
relevant information
when performing his or
her role.
Knowledge on how
processes work is
embedded in the system.
Information about
marketing and advertising
campaigns is shared
internally prior to launch.
The right people have
access to the right
information at the right
time.
We have the necessary
equipment in place to
leverage all resources.
Info-structure
Turnover Metric
Turnover Leader
Maintenance
Schedule
Production
Downtime
Inventory turnover is a
shared and managed
metric.
Our company exceeds the
industry average for
inventory turnover.
We do not run to
destruction, our
equipment is serviced to
ensure
The maintenance
schedule eliminates
untimely breakdowns that
affect production.
19
Front Line
Continuous
Improvement
Local Control of
Resources
Process
Reengineering
An established and
ongoing process that
ensures every
component of the
business is
continuously improved
using the tools of
quality.
Feedback on
Continuous
Improvement
Continuous
Improvement
Programs
Quality
Programs
Challenging Work
Safety Emphasis
Tracking Progress
Project
Management
A core competency of
change, the ability to
manage the process of
change is determined
by the ability to
manage large and
complex projects.
Team
Involvement
Industry Leading
Process
Meeting Efficiency
Teamwork
Effectiveness
The front line is
responsible for initial
quality and continuous
improvement.
All members of the
company have control of
resources required to do
the job.
All members of the
company receive
feedback on performance
that drives improvement.
Processes exist and are
used to constantly
improve all components
of the business.
Processes exist and are
used to consistently
improve initial quality on
all components of the
business.
Jobs are structured to be
challenging and demand
high levels of
performance.
When processes are
designed, safety has the
same priority as quality
and continuous
improvement.
Projects are tracked to
ensure the result meets
specifications: features,
budget, and schedule.
Projects are designed and
managed to include all
the key stakeholders.
Processes exist and are
used to consistently
manage projects.
Project meetings are held
frequently (as
appropriate) and are well
run.
Collaboration is a key
component of the project
management process.
20
Product Testing
Appropriate
Funding
Beta Testing
Based on research &
development
initiatives, a
methodology that tests
processes, products,
and services with end
users prior to launch.
Testing New
Capabilities
Maintaining Price
Integrity
Leader in Product
Launch
New products (services)
are tested prior to
customer delivery.
New products (services)
development receives
necessary funding to do it
right the first time.
New products (services)
are developed with
improving the customer’s
competitive advantage as
key objective.
The company does not
have to reduce its price
after introducing new
products (services).
The company has
developed a reputation as
an industry leader for
developing new products
(services).
21
Customer Recovery
Formal Customer
Development
Operations to
Knowledge
The lessons learned
from internal
operations to R&D
and continuous
improvement
initiatives.
CRM Technology
Exceeding
Customer
Expectations
Customer Driven
Innovation
Supplier Driven
Innovation
Sales Process
Objectives
The company has a clear
and flexible policy to
allow the customercontact personnel to
recover from overpromising and underdelivering.
When processes are
designed, improving the
profitability of current
customers has the priority
as the Sales Process.
The company’s long-term
goal in all customer
relationships is creating
long-term loyalty with the
most profitable.
The company constant
provides +1% service;
just a little bit more than
expected.
Customer feedback and
performance of the
company’s products
(services) is used to drive
innovation.
The company shares
industry and customer
information with
suppliers to identify new
ways of growing the
business.
When processes are
designed, improving the
profitability of new
customers has the priority
as products (services).
22
Talent (Discretionary Performance)
Talent represents the amount of performance the organization can capture beyond what is
required. Typically, standards are set artificially low. No business is able to sustain itself
when people do the minimum. Every successful company has a competitive advantage
through people who work harder then required or compensated.
Best Practices
Description
Attribute
Statements
The
company
invests in
A future focus on the
knowledge
for
future
Education
skills required to meet
business demands.
the performance
The company invests in
Knowledge
demands as the
knowledge to support
Development company moves into
making the organization a
Career
career.
new business
opportunities
Responsibility =
Authority
Unburdened of
Bureaucracy
Self Esteem &
Accountability
Motivating
Work
A work environment
where the barriers are
removed and the
factors that multiply
performance enhanced
Encourage
Initiative
Reward for
Corporate Results
Reward for
Special Effort
Overall Respect
Share Business
Information
Solicit Innovative
Ideas
The amount of responsibility
demanded of employees is
equal to their degree of
authority.
Individuals are never
conflicted between following
policy and doing the right
thing.
The company is able to
maintain employee selfesteem while holding them
accountable.
The company expects and
has built into ever role the
need to take the initiative and
not wait for direction.
The company rewards
performance in a way that
makes the effort worthwhile.
The company rewards
special effort in a way that
makes it a good deal.
Employees are treated with
respect regardless their level
in the company, same as
customers and suppliers.
All relevant and appropriate
information about the
business is shared to enable
initiative.
The company seeks
information from all
employees to drive
innovation.
23
Promotion for
Performance
Selection of Right
People
Recognizing
Talent
Employer of
Choice
The processes for
attracting, developing,
and keeping the right
talent to become the
Employer of Choice in
your niche
Retaining the
Best
Separating the
Mismatch
Rewarding
Leadership
Hire the Best
Qualified for
Promotion
Work
Organization
The informal and social
relationships between
members of a group
and between other
groups that support or
hinder overall
performance
Servicing Internal
Customers
Managing
Interpersonal
Dynamics
Service & Quality
Teamwork
How the company promotes
people is known and
considered fair.
The company’s employment
process ensures the right
person is available.
The company rewards people
in a way that makes the
effort worthwhile.
The company’s employment
process ensures the right
people are retained.
The company’s employment
process ensures the right
people are separated as
quickly as possible.
The company rewards
leaders for the development
of people.
The company’s employment
process attracts the right
people at the right time.
The company’s employment
and training processes ensure
a pool of talent is available
for selection.
Internal customers are
serviced with the same
diligence as external
customers.
The challenges of
interpersonal dynamics are
managed as part of
maintaining collaboration.
Teams are focused on
serving customers (internal
and external) by working
together.
24
Individual &
Group Scorecards
Team Based
Innovation
Group
Performance
The creation of synergy Significance of
from teamwork where
Membership
to results are greater
than the sum of the
parts
Internally Driven
Improvement
Group Success
Openness & Trust
Formal
Performance
Appraisals
Self-Managed
Scorecards
Performance
Feedback
Formal and informal
communications on
organizational,
departmental, group
and individual
performance
Leader as Coach
Management
Involvement
Solicit
Suggestions
Management
Face Time
Service
Component in
Evaluations
The company has scorecards
to measure the performance
of groups and teams.
The company uses groups
and teams as essential
element in the innovation
process.
The purpose for creating
groups and teams is to
achieve something of
significance for the
company.
The company uses the
interpersonal dynamics of
group membership to drive
performance.
Groups and teams are
assembled for the right
reasons, provide with clear
mandates, and managed to
achieve high levels of
success.
Building trust is one of the
objectives for how the
company provides
performance feedback.
Performance evaluations are
a core element of the
reporting process and are
used for personnel and
compensation decisions.
Every individual in the
company has a scorecard that
is used to track and selfmanage performance.
Leaders in the company use
scorecards to coach
individual and group
performance.
The company’s decision
makers receive frequent
information from customercontact personnel to collect
real time perceptions.
Customer contact employees
are an important source for
improvements to the
customer service process.
The company’s decision
makers have frequent facetto-face meetings with
customer-contact personnel.
Customer service is a core
component of all
performance measures
25
Behavioral
Boundaries
The establishment of
operating limits that
define acceptable
behaviors and enable
independent decisionmaking.
Role Models
Total
Accountability
Vision & Values
= Behavior
Individual &
Team
Performance
Objective
Setting
A clear and concise
picture for individual
and group performance
that serves as the basis
for performance
management,
succession planning,
and compensation
Support for
Corporate
Objectives
Communicating
Success Factors
Building in
Customer
Requirements
Advertising
Involvement
Written
Expectations
Role Clarity
Specific and
documented
requirements of a job
or task, linked to a
process, and with realtime measurements.
Link to Goals
Link to Processes
Goal
Accountability
Clarity in
Evaluation
Individuals in leadership
positions are the best role
models for the company’s
values.
The company holds
individuals and groups
responsible for violating the
company’s values.
The company’s values are
used by everyone to guide
behavior.
The goals of leaders and
managers contain the goals
of both individuals and
groups.
Leaders and managers in the
company are available to
support attainment of
business objectives.
The company ensures that
business objectives are
integral to individual and
team goals.
Customer requirements are
integral to performance
standards.
The company ensures it does
not over-promise and underdeliver by including
employees in the
development of advertising.
The company documents all
performance contracts for
feedback, rewards, and
accountability.
Individual and group goals
are linked to necessary
resources and business
objectives.
Every job/role in the
company is clearly liked to
its process.
All employees are held
accountable for business
results and job performance.
All employees are clear and
not surprised when
performance is evaluated.
26
Training
Integrated with
Job
Training as a
Priority
Skills
Training
A present focus;
bringing the skill levels
up to meet current role
demands.
Training Supports
Business
Clarity of
Expectations
Back on the Job
Support
Follow-up for
Continuous
Improvement
Business objectives and job
demands are reflected in all
training courses.
The company demonstrates
its commitment to market
leadership by investing in
skill development.
The company ensures that
training supports business
objectives.
Training courses have a clear
expectations and
performance objectives.
The company ensures that
after training employees are
supported when applying
new skills.
Training is always followedup to ensure it is used by the
individual.
27
Appendix B: Stages of Fast Growth by Attribute
Lifecycle Theory suggests that a company will move through each stage of its corporate lifecycle
not by financial performance, but rather by its beliefs regarding what attributes should be focused
on for each particular stage.
Applied KnowledgeLabs has identified 170 attributes that represent those of the world’s leading
companies, and in what stage those attributes are focused on in order to achieve and sustain
optimum growth.
Companies may find that while they are categorically a “Stage III” company (as defined in
Appendix C), they may have a number of Stage I or Stage II attributes which have gone either unserved or under-served as they’ve grown.
It is often found that the lack of focus or resources towards these attributes may be what is
underlying an organization’s current constraints to growth. For instance, a company may feel
they are at Stage III in their lifecycle yet they are experiencing problems with increasing the
revenue and profitability of accounts. It may be determined through further investigation that
“Distinguishing Mission Statement”, “Identifying Best Customers”, and “Identifying Most Profitable
Customers”, all Stage I attributes, were foregone in the early stages of the company and instead,
the company held a “Revenue Above All” belief system in place.
While cash flow is of course primary in the early stages, not doing anything in regards to these
other three attributes can lead to a company having to now sort and cull their customer base in
Stage III more than would have been necessary, at a time which is much more costly. With
clients now much larger than in their earlier stages, and relationships which are now much more
longstanding, a company can be left in a difficult position that could have been at least minimized
if not avoided.
Issues with today’s automakers can also be considered from this perspective, with there being a
widely-held opinion that Customer-Driven Strategy and Leader-Customer Contact (both Stage I
attributes) were neglected while Internal Service (i.e. taking care of Internal Customers) and
Streamlining were given priority based on their perceived stage in their lifecycles.
Upon further review one will find that these attributes are indeed relevant to any industry and
companies of any size or shape. Attributes specific to your organization will be discussed in more
detail during your Executive Feedback session.
A table of the attributes and their appropriate Lifecycle Stage is listed on the next few pages.
28
Appendix B: Stages of Fast Growth by Attribute
Stage I
Stage II
Stage III
Impacting New
Customers
Making the Rules
Leader – Customer
Contact
Respected Leaders
Impact on Existing
Customers
Client Development
Research Driven
Anticipating Change
Customer Driven
Strategy
Market Research
Understand Trends
Winning Profitable
Customers
Technology for
Service
Perceived Uniqueness
New Uses for Existing
Offer
Tailoring Response
Identifying Best
Customers
Characteristics of
Profitable Customers
Rapid Response
Product and Service
Offer Mix
Distinguishing
Mission Statement
Clarity of Purpose
Adding Value to
Customers
Executive
Involvement in Sales
Right Selling Level
Understand Customer
Use
Characteristics of Best
Customers
Right Sales Metrics
Collecting Market
Intelligence
Collecting Competitor
Research
Performance
Autonomy
Provide Superior
Value
Local Control of
Resources
Customer Recovery
Enhance Brand Image
CRM Technology
Embraced Vision &
Values
Long Term
Perspective
Reporting Methods
Stage IV
60% Gross Margin
Bureaucracy Not an
Obstacle
Improving Core
Capabilities
Leveraging
Technology
Assembling Experts
30% Revenue Growth
Quickest to Customers
Planned
Fire Fighting
Collaborative
Communicate Key
Performance
Customer Feedback
Storage
Information on
Quality
Understand Personal
Impact
Service to Existing
vs. Selling to New
Internal Service
Knowledge
Availability
Direct Access to
Knowledge
Notified of
Advertising
Right Information
Reward for Corporate
Results
Reward for Special
Effort
Overall Respect
Selling Overwhelms
Service
Common Objectives
Turnover Metric
Policies for Service
Share Business
Information
Self-Managed
Scorecards
Total Accountability
Role Models
Right Structure
Scheduled
Maintenance
Production Downtime
Responsibility =
Authority
Self Esteem &
Accountability
Encourage Initiative
Individual & Group
Performance
Support for Corporate
Objectives
Executive Focus on
Execution
Sufficient Resources
Developing Future
Capabilities
Best suppliers
Capability
Development
30% Reinvested in
Growth
First to New Markets
Streamlined for
Responsiveness
Solve Problems
Silo-less
Challenging Work
Stage V
Flexible
Compelling
Invigorated
Run @95% Capacity
Turnover Leader
Product Testing
Appropriate Funding
Testing New
Capabilities
Maintaining Price
Integrity
Leader in Product
Launch
29
Stage I
Stage II
Communicating
Success Factors
Building in Customer
Requirements
Stage III
Stage IV
Aggressively Build
Capabilities
Problem Solving
Education
Soliciting Input
Unburdened of
Bureaucracy
Promotion for
Performance
Retaining the Best
Separating the
Mismatch
Reward Leadership
Servicing Internal
Customers
Managing
Interpersonal
Dynamics
Service & Quality
Teamwork
Team Based
Innovation
Significance of
Membership
Brand Uniqueness
Vx of Customer
Vx of Supplier
Remove Nonvalue
Build Right First
Time
New Process = New
Standard
Excellent Service with
Margins
Locus of Control
Minimize
Management
Surprises
Provide Value @Price
Flexible Output
Operational
Cleanliness
Availability of Task
Procedures
Info-structure
Front Line Continuous
Improvement
Feedback on
Continuous
Improvement
Continuous
Improvement
Programs
Quality programs
Safety Emphasis
Tracking Progress
Team Involvement
Stage V
Career
Internally Driven
Improvement
Group Success
Openness & Trust
Formal Performance
Appraisals
Leader as Coach
Solicit Suggestions
Training Integrated
with Job
Training as a Priority
Training Supports
Business
Clarity of
Expectations
Back on the Job
Support
Follow-up for
Continuous
Improvement
Industry Leading
Process
Meetings Efficiency
Teamwork
Effectiveness
30
Appendix B: Stages of Fast Growth by Attribute
Stage I
Stage II
Stage III
Impacting New
Customers
Making the Rules
Leader – Customer
Contact
Respected Leaders
Impact on Existing
Customers
Client Development
Research Driven
Anticipating Change
Customer Driven
Strategy
Market Research
Understand Trends
Winning Profitable
Customers
Technology for
Service
Perceived Uniqueness
New Uses for Existing
Offer
Tailoring Response
Identifying Best
Customers
Characteristics of
Profitable Customers
Rapid Response
Product and Service
Offer Mix
Distinguishing
Mission Statement
Clarity of Purpose
Adding Value to
Customers
Executive
Involvement in Sales
Right Selling Level
Understand Customer
Use
Characteristics of Best
Customers
Right Sales Metrics
Collecting Market
Intelligence
Collecting Competitor
Research
Performance
Autonomy
Provide Superior
Value
Local Control of
Resources
Customer Recovery
Enhance Brand Image
CRM Technology
Embraced Vision &
Values
Long Term
Perspective
Reporting Methods
Stage IV
60% Gross Margin
Bureaucracy Not an
Obstacle
Improving Core
Capabilities
Leveraging
Technology
Assembling Experts
30% Revenue Growth
Quickest to Customers
Planned
Fire Fighting
Collaborative
Communicate Key
Performance
Customer Feedback
Storage
Information on
Quality
Understand Personal
Impact
Service to Existing
vs. Selling to New
Internal Service
Knowledge
Availability
Direct Access to
Knowledge
Notified of
Advertising
Right Information
Reward for Corporate
Results
Reward for Special
Effort
Overall Respect
Selling Overwhelms
Service
Common Objectives
Turnover Metric
Policies for Service
Share Business
Information
Self-Managed
Scorecards
Total Accountability
Role Models
Right Structure
Scheduled
Maintenance
Production Downtime
Responsibility =
Authority
Self Esteem &
Accountability
Encourage Initiative
Individual & Group
Performance
Support for Corporate
Objectives
Executive Focus on
Execution
Sufficient Resources
Developing Future
Capabilities
Best suppliers
Capability
Development
30% Reinvested in
Growth
First to New Markets
Streamlined for
Responsiveness
Solve Problems
Silo-less
Challenging Work
Stage V
Flexible
Compelling
Invigorated
Run @95% Capacity
Turnover Leader
Product Testing
Appropriate Funding
Testing New
Capabilities
Maintaining Price
Integrity
Leader in Product
Launch
31
Stage I
Stage II
Communicating
Success Factors
Building in Customer
Requirements
Stage III
Stage IV
Aggressively Build
Capabilities
Problem Solving
Education
Soliciting Input
Unburdened of
Bureaucracy
Promotion for
Performance
Retaining the Best
Separating the
Mismatch
Reward Leadership
Servicing Internal
Customers
Managing
Interpersonal
Dynamics
Service & Quality
Teamwork
Team Based
Innovation
Significance of
Membership
Brand Uniqueness
Vx of Customer
Vx of Supplier
Remove Nonvalue
Build Right First
Time
New Process = New
Standard
Excellent Service with
Margins
Locus of Control
Minimize
Management
Surprises
Provide Value @Price
Flexible Output
Operational
Cleanliness
Availability of Task
Procedures
Info-structure
Front Line Continuous
Improvement
Feedback on
Continuous
Improvement
Continuous
Improvement
Programs
Quality programs
Safety Emphasis
Tracking Progress
Team Involvement
Stage V
Career
Internally Driven
Improvement
Group Success
Openness & Trust
Formal Performance
Appraisals
Leader as Coach
Solicit Suggestions
Training Integrated
with Job
Training as a Priority
Training Supports
Business
Clarity of
Expectations
Back on the Job
Support
Follow-up for
Continuous
Improvement
Industry Leading
Process
Meetings Efficiency
Teamwork
Effectiveness
32
Stage I
Stage II
Stage III
Stage IV
Stage V
Formal Customer
Development
Exceeding Customer
Expectations
Customer Driven
Innovation
Supplier Driven
Innovation
Sales Process
Objectives
Solicit Innovative
Ideas
Selection of Right
People
Recognizing Talent
Hiring the Best
Qualified for
Promotion
Individual & Group
Scorecards
Management
Involvement
Service Components
in Evaluations
Vision & Values =
Behavior
Advertising
Involvement
Written Expectations
Linked to Goals
Linked to Processes
Goal Accountability
Clarity in Evaluation
33
Appendix C: FORECAST Lifecycle Stages
Stage I: Dream
Principals have decided to open the doors and execute the business plan. No systems are
in place as of yet but should be mapped out in concept. Plans are fuzzy on the details;
business concept driven mostly by a vision or dream. Personal inventory (“gut check”)
must be performed in order to determine whether there is enough conviction to weather
the storms and stay the course with a lack of systems and lack of support.
Stage II: Go Live
Cash is created by pursuing any and all opportunities that arise, but company is relying
typically on a few key accounts to fund their startup (along with, perhaps, external
sources of capital such as credit cards, banks or investors). There is typically a struggle
to complete the product or service. A lot of mistakes are made, and often products or
services will be replaced with better ones. Leaders/Founders are hands-on and participate
in the day-to-day work. “Info-structure” is non-existent except for accounting and orderentry systems.
Stage III: Second Act
Company is on a high – they’ve survived the first cash drought, the products/services
have been proven, and sales are now increasing. Dreams are now bigger – if you can
succeed doing it for a few, why not for millions or even billions? The organization is
strongly sales-driven and wants to consume and devour everything in its path. Every
opportunity is pursued Deals are often made without knowing fully whether or not the
company can deliver. Everything is “now!” Lack of information or poor velocity of
information affects executive decision-making, often causing a lot of fires. Change is
driven by disasters, direction determined by which disaster is the biggest. Info-structure
has improved, but is still mostly for data storage rather than active, real-time data usage.
Stage IV: Big Fast
Company starts looking and feeling like a “real” company. Accounting and information
systems are in place, and the corporate culture shifts from entrepreneurial leadership to
professional management. Some of the entrepreneurial drive begins to get reined in –
controls are put in place around workflows and behaviors that may not be well-accepted.
There is a definite contrast and feeling of “old vs. new” inside the organization. For the
first time the company has been able to seriously consider its long-term potential. Bad
news tends to move far slower than good news. Turf protection and turf wars may exist.
Stage V: Dominance
The optimum growth position where the company achieves a balance between control
and flexibility. Gross margins are at 60%, with 30% of revenues being invested back into
the company. The company operates in a clear, focused, and committed matter. Frontline and customer-facing employees are the eyes and the ears of the company. Bad news
moves as quickly (or quicker) than good news. The corporate culture is balanced equally
between Leadership and Management. Executive time spent “on” the business vs. “in”
the business is around 50/50. Infrastructure is trusted by all employees. Company is in a
constant stage of change which is supported and encouraged by all staff.
34
Stable
V. Dominance
IV. Big Fast
Aristocracy
Bureaucracy
III. Second Act
II. Go Live
I. Dream
35
About Andy Birol
Andy Birol helps driven business owners create breakthrough growth and prosperity by
discovering their Best and Highest Use® (BHU) and driving it through their firms. Birol's Firm,
Birol Growth Consulting has increased the gross margins of over 400 businesses by an
average of at least $100,000 each for an economic impact of $40 million overall.
Andy's business consulting philosophy is to passionately understand his clients' condition and
aspirations and then bring as much in-depth influence, external objectivity and breakthrough
thinking to help them "Get There." Following twenty years of management experience and
backed by academic achievements from Boston University and Kellogg Graduate School, Andy
has helped many firms grow their businesses in a variety of different ways. He has helped
introduce new products, enter new markets and develop new distribution channels. He has
designed new pricing, compensation and sales incentive plans as well as restructured and staffed
marketing, sales and customer service organizations to achieve a greater level of success.
Andy has been quoted as an expert in such publications as the Wall Street Journal and The New
York Times. He is the author of five books himself, his most recent being the 5 Catalysts of 7
Figure Growth. He is the recipient of multiple entrepreneurial awards and is a much sought after
speaker to both large and small organizations. With a passion for small business and
entrepreneurship, Andy frequently leads owners’ workshops and roundtables and coaches
business owners one-on-one from all four corners of the globe. Andy has traveled, lived, spoken
or worked in 59 countries and all 7 continents. He is based in Cleveland, Ohio, where he lives
with his wife, Joan and daughter Margo.
More information about Andy’s experience and accolades can be found on his website at
www.andybirol.com (see “About Andy”). His passion for business, love of family, and firm belief
in the American Dream is equally matched by his high level of expertise and insight, and we look
forward to putting that to work for your company.
36


© Copyright 2026