
T
pa
ge
s
pl
e
T
Sa
m
here are many knots that we encounter every day and
give no mathematical thought to at all. The knots we
use for rope or shoe laces are considered to be only trivial
by mathematicians. However, when the ends are joined it
becomes a knot of interest. Much research has been done to
describe different knots and find equivalent knots. One
application is in the study of DNA: this double helix can be
tangled up millions of times since it is so long. In the 1980s
Vaughan Jones realised a connection between knots and
statistical mechanics. This led to a new polynomial
invariant, known as the Jones polynomial. Not only do knots
come in different forms, so do polynomials!
187
Prepare for this chapter by attempting the following questions. If you have difficulty with a
question, click on the Replay Worksheet icon on your Exam Café CD or ask your teacher for the
Replay Worksheet. Fully worked solutions to every question in this Prep Zone are contained in
the Student Worked Solutions book.
Worksheet R4.1
1 Rearrange the following equations to make y the subject.
(a) x = 3y + 6
(b) x = y2 − 4
2
(d) x = --- + 3
(c) x = (2y + 3)2
y
e
Worksheet R4.2
2 Find the equation of the straight line fitting the following criteria.
(a) m = 3 and y-intercept of 2
(b) passing through (1, 2) and (-3, 5)
(c) m = 2 and passing through (-1, 4)
(d) passing through (0, -4) and (3, 2)
e
Worksheet R4.3
3 Complete the square for each of the following expressions.
(a) x2 + 4x
(b) x2 − 3x
(c) y2 + 4y − 3
(d) 2m2 + 12m
e
Worksheet R4.4
4 Find the values of x for which each of the following is undefined.
2
(a) --(b)
x
x
2
(c) ----------(d)
x–4
x+3
3
-4
(e) -----(f) --------------x
x–1
e
Worksheet R4.5
5 Solve each of the following quadratic equations by hand, leaving your answer in exact form
where appropriate.
(b) (x + 1)2 = 4
(a) (x − 1)2 = 0
(c) x2 + 3x − 4 = 0
(d) 2x2 + 3x − 4 = 0
(e) x3 = -1
(f) x2 + 4x + 4 = 0
Sa
m
pl
e
pa
ge
s
e
A fraction is not defined if its denominator equals zero.
The square root of a negative number has no real number solutions.
Null factor law:
If a × b = 0 then a = 0, b = 0 or a and b = 0.
188
H ei n e m an n V CE Z O N E : M A T H E M A T I C A L M E T H O D S 1 & 2 CAS E N H A N C E D
4.1
Hyperbola and truncus
Hyperbola
y
5
4
y= 1
x
3
2
1
-5
-4
-3
-2
-1
1
2
3
4
5
x
-1
-2
pa
ge
s
1
The simplest hyperbola has the equation y = --- . Its graph is
x
shown at right. As the value of x approaches -∞ the value of
1
y approaches 0 from below (as ----------------------------------------- is close to
very big number
zero). It can be written as x → -∞, y → 0−.
As x approaches 0 from the left the value of y approaches
1
-∞ (as ---------------------------------------------------------------------- gives a very big negative
very small negative number
number). This can be written as x → 0−, y → -∞.
A similar thing occurs on the right-hand side of the graph.
These restrictions can be written as x → 0+, y → +∞ and
x → +∞, y → 0+.
We say that this graph has asymptotes. These are values
that the graph approaches but never reaches in this part of
the graph.
-3
-4
-5
Sa
m
pl
e
1
For y = --- the x-axis is a horizontal asymptote and the y-axis is a vertical asymptote. The
x
graph is discontinuous at the value of both asymptotes. It is called a rectangular hyperbola
because its two asymptotes are perpendicular to each other.
The basic rectangular hyperbola can be transformed in various ways. In particular we are
interested in dilations from the x-axis, translations parallel to the x-axis and translations parallel
to the y-axis. The translations are especially important to us as they give the equations for the
asymptotes.
The general equation for a rectangular hyperbola is:
a
y = ------------ + c , x ≠ b
x–b
1
Transformations from y = --- :
x
• dilation by a factor of a from the x-axis
• translation b units horizontally
• translation c units vertically
Asymptotes: x = b and y = c
If the value of a is negative then the graph will appear in the top left and bottom right
corners formed by the asymptotes.
4 ● advanced f unctions and r ela tions
189
worked example 1
1
Sketch the graph of y = ----------- + 4, stating the equations of the asymptotes and giving the domain and
x–2
range for the function.
Steps
1. Identify the equation of the vertical asymptote.
This is the horizontal translation and occurs
when the denominator is equal to 0.
2. Identify the equation of the horizontal asymptote.
This is the vertical translation and is found by
looking at the term not connected to the x.
3. Sketch the graph.
Solution
If x − 2 = 0 then x = 2.
The graph has been translated 2 units to the right.
The vertical asymptote is x = 2.
The graph has been translated 4 units up.
The horizontal asymptote is y = 4.
y
1 +4
x−2
pa
ge
s
y=
4
0
domain: R\{2}, range: R\{4}
pl
e
4. State the domain and the range.
2
Sa
m
You can also use your CAS to help you sketch these
graphs. You need to use the equation to help you
identify the equations of the asymptotes. Note,
however, the asymptotes will not be shown on the
screen. Enter the equation and graph in the standard
1
window. At right is the graph of y = ----------- .
x–3
1
• When entering an expression like ----------- , the denominator needs to be put in brackets unless you
x–3
use the fraction template.
190
H ei n e m an n V CE Z O N E : M A T H E M A T I C A L M E T H O D S 1 & 2 CAS E N H A N C E D
x
Truncus
1
The graph of the equation y = ----2 or y = x -2, x ≠ 0, is a truncus.
x
y
5
y= 1
x2
4
3
2
1
-5
-4
-3
-2
-1
0
1
2
3
4
5
x
pa
ge
s
Its graph is shown at right. It has a horizontal asymptote at y = 0 and a vertical asymptote at
x = 0. We need to write x ≠ 0 as part of the definition of this curve, as the graph is undefined
at this particular value of x because we cannot divide by zero. It should be possible to see the
similarities between this graph and that of the hyperbola.
Sa
m
pl
e
The general equation of the truncus is:
a
y = -------------------2- + c , x ≠ b
(x – b)
1
Transformations from y = ----2- :
x
• dilation from the x-axis by a factor of a
• translation horizontally by b
• translation vertically by c
If the value of a is negative, the graph will be reflected in the x-axis.
Asymptotes: x = b and y = c.
The process of solving an equation to find the x value for when the equation is equal to zero is
often called finding the zeros or roots.
One of the easier ways to use your CAS to solve an equation, is using the ‘Solve’ function.
TI-Nspire CAS
ClassPad
4 ● advanced f unctions and r ela tions
191
worked example 2
1
Sketch the truncus with equation y = ---------------2 – 2 and state the equations of the asymptotes and
(x – 3)
coordinates of intercepts.
Steps
1. Identify the equation of the vertical asymptote.
This occurs when the denominator is equal
to 0.
2. Identify the equation of the horizontal
asymptote. This is the vertical shift and is
found by looking at the term not connected
to the x.
Solution
x − 3 = 0 when x = 3.
The vertical asymptote is x = 3.
The horizontal asymptote is y = -2.
pa
ge
s
3. Use the solve function to find the x-intercepts.
pl
e
TI-Nspire CAS
Sa
m
ClassPad
4. Let x = 0 to find the y-intercept.
5. Sketch the graph.
2+6 - 2+6
y = 0: x = ----------------- , ------------------2
2
= ------2- + 3, - ------2- + 3
2
2
x = 0: y = 1-9 – 2
= -1 8-9
y
y=
0
1 −2
(x − 3)2
3
x
-2
6. State equations of the asymptotes and
coordinates of intercepts.
192
8
2
2
x = 3, y = -2; (0, -1 --- ), ( ------- + 3, 0), (- ------- + 3, 0)
9
2
2
H ei n e m an n V CE Z O N E : M A T H E M A T I C A L M E T H O D S 1 & 2 CAS E N H A N C E D
exercise 4.1
Hyperbola and truncus
Short answer
1 Sketch the graphs for the following rectangular hyperbolas, state the equations of the
asymptotes, and give the domain and range.
1
1
1
1
(a) y = ----------(b) y = ----------(c) y = ----------(d) y = ----------x–2
x–6
x+1
x+3
2 Each of the following equations represents a truncus. Sketch the graph of each and state
the equations of the asymptotes and coordinates of intercepts.
1
1
1
(a) y = -----------------2- + 2
(b) y = -----------------2- – 4
(c) y = -----------------2- + 1
(x – 2)
(x – 5)
(x – 6)
1
1
1
(d) y = ------------------2 – 2
(e) y = -----------------(f) y = -----------------+2
–3
(x + 3)
(x + 1) 2
(x + 4) 2
e
Hint
Worked Example 2
e
Hint
Sa
m
pl
e
pa
ge
s
3 Sketch the graphs for the following hyperbolas, state the equations of the asymptotes, and
give the domain and range.
1
1
1
1
(a) y = ----------- + 1
(b) y = ----------- + 2
(c) y = ----------- − 1
(d) y = ----------- − 2
x–3
x–3
x–3
x–3
4 Sketch the graphs for the following hyperbolas, state the equations of the asymptotes, and
give the domain and range.
2
-2
3
-1
(a) y = ----------(b) y = ----------(c) y = ----------(d) y = ----------x–3
x–3
x–3
x–3
5 Sketch the graphs for the following hyperbolas, state the equations of the asymptotes, and
give the domain and range.
1
1
1
1
(a) y = -------------(b) y = -------------(c) y = -------------(d) y = ----------------2x – 3
-x – 3
-2x – 3
3x – 3
1
1
1
1
(e) y = - ----------(f) y = - -------------(g) y = - -------------(h) y = - -------------x–3
2x – 3
3x – 3
3x – 6
6 (a) Draw the graph for each of the following.
1
2
1
(i) y = -----------------2- + 3
(ii) y = -----------------2- – 2
(iii) y = ---------------------2 + 3
(x – 4)
(x – 4)
2(x – 4)
1
-1
-2
(iv) y = ---------------------2 – 1
(v) y = -----------------2- + 3
(vi) y = ---------------------2 + 2
2(x – 4)
(x – 4)
3(x – 4)
a
(b) Consider the general equation for a truncus, y = -----------------2- + c, x ≠ b.
(x – b)
(i) What effect does the value of a have on the graph?
(ii) What effect does the value of b have on the graph?
(iii) What effect does the value of c have on the graph?
(iv) What effect does the sign of the numerator have on the graph?
Worked Example 1
Multiple choice
7 For each of the following rectangular hyperbolas, select the pair of equations that represent
the horizontal and vertical asymptotes.
1
(a) y = ----------x+9
A x = 9, y = 0
B x = -9, y = 0
C x = 0, y = 9
D x = 0, y = -9
E x = -3, y = 0
1
(b) y = ----------- + 5
x+1
A x = 1, y = 5
B x = -1, y = -5
C x = 1, y = -5
D x = -1, y = 4
E x = -1, y = 5
4 ● advanced f unctions and r ela tions
193
4
(c) y = ----------- + 2
x–1
A x = -1, y = 2
B x = 1, y = -2
D x = -1, y = -2
E x = 4, y = 2
1
(d) y = ------------------2x + 2
A x = 1, y = 0
B x = 2, y = 0
D x = -1, y = 0
E x = 0, y = -2
1
(e) y = - --------------2x + 3
A x = -3, y = 0
B x = 3, y = 0
D x = -1.5, y = 0
E x = -3, y = 2
8 The graph shown at right is best described by:
C x = 1, y = 2
C x = -2, y = 0
C x = 1.5, y = 0
y
6
4
-8
-6
-4
-2
2
4
pa
ge
s
2
x
-2
-4
Sa
m
pl
e
1
1
1
A y = ------------------2 + 2
B y = -----------------2- + 2
C y = ------------------2 – 2
(x + 4)
(x – 4)
(x + 4)
1
1 -+4
D y = -----------------2- – 2
E y = ----------------(x – 4)
(x – 2) 2
1
9 The truncus y = ---------------------2 – 2 has vertical and horizontal asymptotes at:
(3x – 5)
5
A x = 5, y = -2
B x = --- , y = -2
C x = 5, y = 2
3
5
3
D x = --- , y = 2
E x = --- , y = -2
3
5
Extended answer
10 (a) Use an algebraic process to find the x- and y-intercepts, where they exist, for the
following hyperbolas.
1
(i) y = --------------3x + 4
-2
(ii) y = ----------- + 2
x–5
3
(iii) y = -------------- – 2
5x – 4
4
(iv) y = ----------------- + 6
-2x – 5
(b) When will there be no y-intercept?
(c) When will there be no x-intercept?
(d) Why can there be a maximum of only one x-intercept?
194
H ei n e m an n V CE Z O N E : M A T H E M A T I C A L M E T H O D S 1 & 2 CAS E N H A N C E D
e
Hint
Sa
m
pl
e
pa
ge
s
x+2
1
11 (a) Show that y = ----------- can be written as y = ----------- + 1 , by using polynomial division or
x+1
x+1
some other algebraic technique.
x+2
(b) Sketch the graph of y = -----------, stating the equations for the asymptotes.
x+1
(c) Use a similar technique to sketch the graphs of the following. In each case state the
equations of the asymptotes.
x+3
2x – 5
4x + 5
(i) y = ----------(ii) y = -------------(iii) y = --------------x+2
x–2
2x + 3
1
12 (a) Sketch the graph of y = ---------------------2 − 3.
2(x – 4)
(b) Algebraically find the value of the y-intercept.
(c) Algebraically find the value of the x-intercept(s).
(d) Confirm your answers to parts (a), (b) and (c) using your CAS.
(e) State the possible number of x-intercepts that a positive truncus may have and
explain under what circumstances each will occur.
(f) State the possible number of y-intercepts that a positive truncus may have and
explain under what circumstances each will occur.
-3
13 The cross section of a crevice can be modelled by the equation h = ------------------------2- + 2 where
4(2x – 5)
h (metres) is the distance from the water’s surface, and x (metres) the distance from a
warning sign.
-3
(a) Sketch the graph of h = ------------------------2- + 2.
4(2x – 5)
(b) Algebraically find the value of the x-intercept(s) and, hence, the width (in metres)
of the crevice, at the water surface.
(c) Confirm your answers to part (b) using your CAS.
(d) Determine the width of the crevice 1 m below the water surface.
(e) Find at what depth (from the surface of the water) the crevice is 20 cm wide.
4 ● advanced f unctions and r ela tions
195
4.2 The square root function
1
---
The function f(x) = x can also be written as f(x) = x 2 . Its graph
is shown at right. It is important to recognise that this is only the
positive square root.
y
2
-6
-2 0
-2
-4
2
4
6x
worked example 3
Determine the transformations undergone by f(x) =
the graph of f(x).
Solution
f(x) = 2 x + 3 − 1
dilation by a factor of 2 from the x-axis
translation 3 units to the left and 1 unit down
x = 0: f(0) = 2 3 − 1
y = 0: 0 = 2 x + 3 − 1
x = -2 3-4-
Sa
m
2. Determine translations.
3. Find any intercepts.
x to become f(x) = 2 x + 3 − 1 and hence sketch
pl
e
Steps
1. Determine the dilation factor(s).
pa
ge
s
The general form of the square root function is f (x) = a x – b + c.
Transformations from f (x) = x are:
• a: dilation by a factor of a from the x-axis
• b: translation b units horizontally
• c: translation c units vertically.
A negative value of a reflects the graph in the x-axis.
4. Sketch the basic graph and apply
transformations.
y
2
-3
1
3
0
-1
dilated by factor of 2
x
The graph can always be checked using your CAS.
exercise 4.2
The square root function
Short answer
1 Determine the transformations f(x) = x has undergone to achieve each of the following
functions and hence sketch the graph of each function.
196
(a) f(x) = 3 x – 2 + 1
(b) f(x) = - x + 1 − 4
(c) f(x) = 3 x – 4 + 1
(d) f(x) = 0.5 x + 3 – 1
(e) f(x) =
(f) f(x) =
x–2
4x + 1
H ei n e m an n V CE Z O N E : M A T H E M A T I C A L M E T H O D S 1 & 2 CAS E N H A N C E D
Worked Example 3
e
Hint
2 For each of the following, find the function if f(x) = x has undergone the transformations
given.
(a) dilation by a factor of 3 from the x-axis and translation 3 units left
(b) dilation by a factor of 0.5 from the x-axis, reflection in the x-axis and translation
3 units up
(c) translation 3 units to the left and 4 units up
(d) dilation by a factor of 4 from the x-axis, translation 3 units to the left and 2 units down
(e) reflection in the x-axis, translation 3 units up and 2 units to the right
(f) dilation by a factor of 2 from the x-axis, translation 0.4 units to the left and 3 units up
(g) dilation by a factor of 3 and reflection in the x-axis
e
Hint
e
Hint
Multiple choice
3 The graph of f(x) = a x + b − c where a, b and c are positive integers could be:
A
y
y
B
C
D
y
x
y
E
x
pl
e
x
4 Translation of the function f(x) = x + 3 − 2 by 4 units to the left and 5 units up will result
in the function:
A f(x) = x + 4 + 5
B f(x) = x + 1 + 3
C f(x) = x – 1 + 5
x–4 +5
E f(x) =
Sa
m
D f(x) =
x
pa
ge
s
x
y
x+7 +3
Extended answer
5 A water slide is modelled by the equation h = a x + c
where x is the horizontal distance in metres from the
start and h is the height above the water. The slide starts
6 m above the water and touches the water 9 m from
the base of its starting point.
(a) Determine the values of a and c and hence the
equation.
(b) Find the height of the slide 3 m from the end.
(c) Find the equation of the slide if it was to start 3 m
higher and have the same shape.
(d) How long would this slide be?
4 ● advanced f unctions and r ela tions
197
pa
ge
s
Answer each of the following questions as thoroughly as possible, showing all working.
1 (a) A function passes through the points (0, -5), (1, 0), (2, 7). Use finite differences to
determine the equation of the function.
(b) Draw the graph of the function.
(c) Draw the inverse on the graph.
(d) Show at least two different restrictions to the domain that could be made so that the
inverse is a function.
(e) Find the equation of the inverse.
(f) Show using the domains found in part (d) that the domain of the function is the
range of the inverse and that the range of the function is the domain of the inverse.
1
2 Consider the graph f(x) = ----2 .
x
Sa
m
pl
e
(a) Find the equation of the new function g(x) that is f(x) dilated by a factor of 2 from the
x-axis, translated 3 units to the left and translated 4 units up.
(b) Use three coordinate points of f(x) and the equation of g(x) to show that
g(x) = 2f(x + 3) + 4.
(c) Sketch the graph of f(x) and g(x) on the same set of axes.
3 (a) Determine the equation of the graph
y
shown.
8
(b) Find the equation of this graph if it is
7
reflected in the y-axis.
6
(c) Find the equation of this graph if it is
5
reflected in the x-axis.
4
3
2
1
-8 -7 -6 -5 -4 -3 -2 -1-10
-2
-3
1
2
3
4 5 6
7
8
x
-2.5
-4
-5
-6
-7
4 (a) Sketch the graph f(x) = 3x − 4.
(b) Determine the inverse function,
-8
f -1(x).
(c) Find |f -1(x)| and add this to the graph.
5 Find the equation for each of the following.
(a) a rectangular hyperbola with asymptotes x = 3 and y = 2 passing through (2, -2)
(b) the inverse function of f(x) = x2 + 5x + 6
(c) a quartic function with turning point at (3, 0) and intercepts at (2, 0) and (-1, 0) that
passes through (4, 20).
4 ● advanced f unctions and r ela tions
213
Adding absolute functions
Using the TI-Nspire CAS
If we have defined f1(x) = x and
f2(x) = x + 5, we can then define
f3(x) = f1(x) + f2(x), and we can use our
CAS to check that f3(x) is in fact equal to
2x + 5.
Do this now by entering f1 to f3 as given
and then enter f4(x) = 2x + 5.
How can you tell from the graph display
that f3(x) = 2x + 5?
Using the ClassPad
If we have defined y1(x) = x and
y2(x) = x + 5, we can then define
y3(x) = y1(x) + y2(x), and we can use our
CAS to check that y3(x) is in fact equal
to 2x + 5.
Do this now by entering y1 and y2.
We can then enter y3 as y1(x) + y2(x), but
you will need to enter the y1 and y2 from
the 0 section of the k (the
bracket and xs can be from the
calculator keypad).
Then enter y4(x) = 2x + 5.
How can you tell from the graph display
that y3(x) = 2x + 5?
pa
ge
s
1
If we do the same thing with absolute value functions will we get the same result?
Using the TI-Nspire CAS
Set f1(x) = |x|, f2(x) = |x + 5|,
f3(x) = f1(x) + f2(x), and f4(x) = |2x + 5|
and draw the graphs.
Is f1(x) + f2(x) = f4(x)?
Using the ClassPad
Set y1(x) = |x|, y2(x) = |x + 5|,
y3(x) = y1(x) + y2(x), and y4(x) = |2x + 5|
and draw the graphs.
Is y1(x) + y2(x) = y4(x)?
Sa
m
pl
e
2
If you have done this correctly you should have a screen display like the one shown below. Since there are
four clearly different graphs on display this means that x + x + 5 ≠ 2x + 5 .
TI-Nspire CAS
214
ClassPad
H ei n e m an n V CE Z O N E : M A T H E M A T I C A L M E T H O D S 1 & 2 CAS E N H A N C E D
3 To help see what is happening here, draw up a table of values for each of the equations that
covers -10 x 10. The outline of the table is shown below.
x
f 1(x) = |x|
f 2(x) = |x + 5|
f 3(x) = f 1(x) + f 2(x)
f 4(x) = |2x + 5|
-10
-9
...
9
10
Sa
m
pl
e
pa
ge
s
Note: For the ClassPad your equations will begin with y1, y2 etc.
4 The graph of x + x + 5 consists of three sections. At which x values do the changes in
sections occur? What is significant about these two values?
5 Sketch the following graphs and see if you can predict the location of the section changes in
each case. You may wish to use your CAS to help you with this. Make a general statement
about what you find.
(a) y = x + x + 3
(b) y = x + x + 1
(c) y = x + x – 3
(d) y = x + x – 1
(e) y = 2x + x + 3
(f) y = 3x + x + 1
(g) y = 4x + x – 3
(h) y = 5x + x – 1
(i) y = x + 1 + x + 3 (j) y = x – 2 + x + 1 (k) y = x – 1 + x – 3 (l) y = x + 2 + x – 1
6 (a) Is x + x + 3 = x + 3 + x ?
(b) Is 2x + x + 3 = x + 3 + 2x ?
(c) What can you conclude from this?
7 Now look back at the graphs in Question 5 and see if you can work out the gradient of each
of the different pieces of the graphs.
What will happen if we extend this to the addition of more than two absolute value expressions?
8 Sketch each of the following graphs.
(a) y = x + x + 1 + x + 2
(b) y = 2x + 3x – 1 + 2x + 5
(c) y = x + x + 3 + x – 1 + x – 4
(d) y = 2x + x – 1 + 3x – 6 + 4x – 3
What general conclusions can you draw from all of this?
4 ● advanced f unctions and r ela tions
215
Summary
y
Square root function
• The general form of the square root function is
y= a x–b+c.
• The transformations undergone from f(x) = x are:
a: dilation by a factor of a from the x-axis or parallel
to the y-axis
b: translation horizontally b units
c: translation vertically c units.
• The domain of the equation is x b since the square
root of a negative number cannot be found.
• The standard graph looks like:
pa
ge
s
Hyperbola
• The general equation of a hyperbola is
a
y = ----------- + c, x ≠ b
x–b
where: a is the dilation factor from the x-axis or
parallel to the y-axis
b is the horizontal translation
c is the vertical translation
a negative value of a means that the standard
graph has been reflected in the x-axis.
• When graphing hyperbolas important points to show
are asymptotes and intercepts.
• Asymptotes occur at x = b and y = c if the equation is in
the general form.
y
(b, c)
pl
e
c
y=c
x=b
x
Sa
m
b
Truncus
• The standard equation of a truncus is
a
y = -----------------2- + c , x ≠ b
(x – b)
where: a is the dilation factor from the x-axis or
parallel to the y-axis
b is the horizontal translation
c is the vertical translation
when a is negative the standard graph has
been reflected in the x-axis
• A truncus written in the general form has asymptotes
of x = b and y = c.
y
c
216
Circles
• A circle is the set of points equidistant from a fixed
point. It is not a function but a relation.
• The standard equation of a circle is
(x − a)2 + (x − b)2 = r2 where the centre of the circle is
(a, b) and the radius is r.
y
r
(a, b)
x
• If the equation of a circle is not in this form it can be
changed by completing the square in order to identify
the centre and radius easily.
• When graphing circles on the CAS they have to be
entered in two parts and the graph may not always
be continuous.
y=c
b
x=b
x
x
H ei n e m an n V CE Z O N E : M A T H E M A T I C A L M E T H O D S 1 & 2 CAS E N H A N C E D
Absolute value function
• The absolute value is the size of the variable regardless
of its sign.
• The graph of an absolute value will have a sharp
turning point if the graph of the original equation
passed through the x-axis prior to taking the absolute
value.
• To graph an absolute value function it is easiest to
graph the part of the function inside the absolute value
signs and then reflect any negative part in the x-axis.
If the function includes other parts the appropriate
transformations can then be made.
• The general equation for a linear absolute value
function can be written: y = a|x − b| + c
• The graph of this function looks like:
pl
e
pa
ge
s
Inverse functions
• A function can only have an inverse function if it is a
one-to-one function. Using the vertical line test and
horizontal line test it is possible to determine if a
function is one-to-one.
• If a function is not one-to-one then an inverse can be
found but it is not an inverse function. The domain of
the function can be limited so that an inverse function
will exist.
• The inverse function is written as f -1(x).
• The inverse can be found by:
– swapping the x and y and rearranging the equation,
or
– reflecting the graph of the function in the line y = x.
• CAS can be used to rearrange equations but care needs
to be taken in interpreting the solution.
• Any points of intersection of the function and its
inverse will lie on the line y = x (i.e. they will have the
same x and y coordinates).
• Domain of f(x) is the range of f -1(x).
• Range of f(x) is the domain of f -1(x).
y
c
x
b
Sa
m
Use the following to check your progress. If you need more help with any questions, turn back
to the section given in the side column, look carefully at the explanation of the skill and the
worked examples, and try a few similar questions from the exercise provided.
Short answer
1 Sketch the graphs for the following hyperbolas, and state the equations of the asymptotes.
1
1
1
1
(a) y = ----------(b) y = --------------(c) y = - ----------(d) y = - --------------x–3
3x + 3
x+5
3x + 4
2 Sketch the graph for each of the following.
1
2
-1
(a) y = -----------------2- + 2
(b) y = ------------------2 − 4
(c) y = ---------------------2 + 2
(x – 4)
(x + 4)
3(x – 2)
3 State the transformations required to form the following functions from f(x) =
(a) f(x) = 3 x – 1 + 4
(b) f(x) =
4x + 8 − 2
(c) f(x) =
x.
4.1
4.1
4.2
x+3 +2
4 State the equation of each of the following circles.
(a) radius 2 with centre (4, 5)
(b) radius 2.5 with centre (-2, 1)
5 Sketch the graph for each of the following circles, stating the radius and the centre.
(b) x2 + y2 + 8x − 2y + 15 = 0
(a) x2 + y2 − 6x − 4y + 7 = 0
6 Find the inverse function for each of the following, stating the domain and range of the function f -1(x).
3
(a) f(x) = ----------(b) f(x) = 4x + 5
(c) f(x) = x + 5
x+4
4.3
4.3
4.4
4 ● advanced f unctions and r ela tions
217
7 Sketch the graphs of the following absolute value functions.
(a) y = x + 4
(b) y = 3x – 6
(c) y = - x + 4 – 2
8 Sketch the graphs of the following quadratic absolute value functions.
(a) y = x 2 + 3
(b) y = (x + 3) 2 – 2 + 2
(c) y = - (x + 2) 2 – 1
4.5
4.5
Multiple choice
pl
e
pa
ge
s
9 For each of the following hyperbolas, select the pair of equations that represent the equations of the
horizontal and vertical asymptotes.
1
(a) y = ----------x–4
A x = 4, y = 0
B x = -4, y = 0
C x = 0, y = 4
D x = 0, y = -4
E x = 2, y = 0
1
(b) y = - -------------2x – 3
A x = -3, y = 0
B x = 3, y = 0
C x = 1.5, y = 0
D x = -1.5, y = -9
E x = -3, y = 2
1
10 The truncus y = ---------------------2- − 2 has vertical and horizontal asymptotes:
(2x + 5)
A x = -2.5, y = -2
B x = 2.5, y = 2
C x = -2.5, y = 2
2--D x = , y = -2
E x = 2.5, y = -2
5
Sa
m
11 The graph of y = x – a + b where a and b are positive integers has:
A domain x a
B range R
D asymptote y = b
E domain x > a
C asymptote x = a
12 To obtain the graph of f(x) = 3 x + 1 – 2 , the graph of f(x) = x has been transformed by:
A dilation by a factor of 3 from the x-axis, translation right 1 unit and down 2 units.
B dilation by a factor of 1--3- from the y-axis, translation right 1 unit and down 2 units.
4.1
4.1
4.2
4.2
C dilation by a factor of 3 from the x-axis, translation left 1 unit and down 2 units.
D dilation by a factor of 1--3- from the y-axis, translation left 1 unit and up 2 units.
E dilation by a factor of 3 from the y-axis, translation left 1 unit and up 2 units.
13 The equation of the circle shown is:
y
A (x − 3)2 + (y − 2)2 = 64
7
B (x + 3)2 + (y + 2)2 = 25
C (x − 3)2 + (y − 2)2 = 49
D (x − 3)2 + (y − 2)2 = 25
2
E (x − 8)2 + (y − 7)2 = 25
3
-2
4.3
8 x
-3
14 The equation x2 + y2 + 4x − 10y + 20 = 0 describes a circle with:
A radius 9 and centre (-2, 5)
B radius 9 and centre (2, -5)
C radius 3 and centre (2, -5)
D radius 20 and centre (-2, 5)
E radius 3 and centre (-2, 5)
218
H ei n e m an n V CE Z O N E : M A T H E M A T I C A L M E T H O D S 1 & 2 CAS E N H A N C E D
4.3
3
15 The inverse function f -1(x) of f(x) = ----------- + 5 is:
x–2
1
3
B f -1(x) = ----------- + 2
A f -1(x) = --- (x + 2) – 5
3
x–5
3
E f -1(x) = 5(x – 2) + 3
D f -1(x) = ----------- + 5
x–2
16 The inverse of this graph is:
4.4
2
C f -1(x) = ----------- – 5
x–3
y
4.4
1
B
y
y
0
-2
1
-3
0
0 1 2
-3
x
0
Sa
m
D
-3
y
2
1
-5
C
y
pl
e
A
x
0
-3
pa
ge
s
-5
E
1
x
-2
0
-2
2
x
y
x
17 For the graph shown at right the best equation is:
A y= -x–4 +2
B y= x–4 +2
C y= -x–4 –2
D y= -x+4 +2
E y = -x + 4 + 2
3
x
y
4.5
4
2
-6 -4 -2 0
-2
2
4
6
8 10 x
-4
-6
-8
-10
4 ● advanced f unctions and r ela tions
219
18 The absolute value function y = 2(x – 3) 2 – 5 has a turning point at:
A (-2.5, -3)
B (2.5, -3)
C (3, 5)
D (-3, -5)
E (0.4, -3)
4.5
Extended answer
pa
ge
s
(d) The screen dump below shows two graphs.
One is the graph from part (c). Find the
equation of the other graph.
(e) Use your CAS to draw the graph of
y = - (0.5x + 1) 2 – 3 + 2.
(f) The screen dump below shows two graphs.
One is the graph from part (e). Find the
equation of the other graph.
Sa
m
pl
e
19 For the function f(x) = 2x4 − x3 − 20x2 − 29x − 12:
(a) find the x-intercepts of f(x) algebraically
(b) graph the function showing all key features
(c) determine three domains for which an inverse
function f -1(x) will exist.
20 The function f(x) = x is dilated by a factor of 2 and
reflected in the x-axis, and translated left 3 units.
(a) What is its new equation?
(b) State the domain and range of the new
function.
(c) Find the inverse of the new function, and state
its domain and range.
(d) Find the inverse of f(x) = x and state the
transformations needed to obtain the equation
found in part (c).
(e) What do you notice?
21 (a) Use your CAS to draw the graph of y = x 2 – 5 .
(b) The screen dump below shows two graphs.
One is the graph from part (a). Find the
equation of the other graph.
(c) Use your CAS to draw the graph of
y = (x – 3) 2 – 4 – 3.
220
H ei n e m an n V CE Z O N E : M A T H E M A T I C A L M E T H O D S 1 & 2 CAS E N H A N C E D
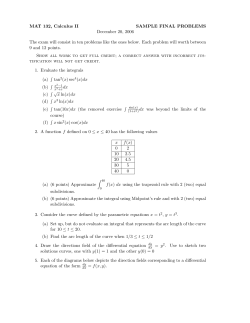
exam focus 8
VCAA 2005 Mathematical Methods (CAS) Pilot Study Units 3 & 4, Exam 1,
Part I, Question 17
y
2
O 1 2
x
pa
ge
s
a
Part of the graph of the function with rule y = ------------------2- + c is shown on the right.
(x + b)
The values of a, b and c respectively are
a
b
c
A. 2
-1
0
B. -2
-1
2
C. 2
1
2
D. 2
-2
1
E. -2
1
2
exam focus 9
VCAA 2005 Mathematical Methods (CAS) Pilot Study Units 3 & 4, Exam 1,
Part I, Question 18
C. x = -3, y = 1
Sa
m
exam focus 10
pl
e
x–2
The graph of y = ------------ has two asymptotes with equations
x+3
A. x = 3, y = 1
B. x = 3, y = -2
D. x = -3, y = 2
E. x = -3, y = - --23-
VCAA 2004 Mathematical Methods (CAS) Pilot Study Units 3 & 4, Exam 1,
Part I, Question 10
Which one of the following functions does not have an inverse function?
A. f: [2, 4) → R, f(x) = x – 2
1
B. g: R\{0} → R, g(x) = ----2x
C. h: R+ → R, h(x) = x3
D. k: (-∞, 0] → R, k(x) = x2 + 1
1
E. m: R+ → R, m(x) = -----------x+3
exam focus 11
VCAA 2005 Mathematical Methods (CAS) Pilot Study Units 3 & 4, Exam 1,
Part I, Question 7
The function f: [a, ∞) → R with rule f(x) = 2(x − 3)2 + 1 will have an inverse function if
A. a ≤ - 3
B. a ≥ -3
C. a ≥ 1
D. a ≤ 3
E. a ≥ 3
4 ● advanced f unctions and r ela tions
221


© Copyright 2026