
EARTH SCIENCE PHYSICAL SETTING Friday, PS/EARTH SCIENCE
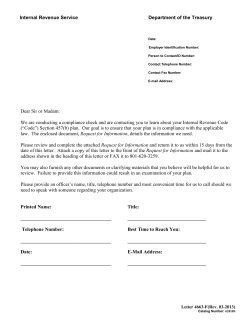
PS/EARTH SCIENCE
The University of the State of New York
REGENTS HIGH SCHOOL EXAMINATION
PHYSICAL SETTING
EARTH SCIENCE
Friday, June 17, 2011 — 1:15 to 4:15 p.m., only
Use your knowledge of Earth science to answer all questions in this examination.
Before you begin this examination, you must be provided with the
2010 Edition Reference Tables for Physical Setting/Earth Science. You will need these
reference tables to answer some of the questions.
You are to answer all questions in all parts of this examination. You may use scrap
paper to work out the answers to the questions. A separate answer sheet for Part A
and Part B–1 has been provided to you. Follow the instructions from the proctor for
completing the student information on your answer sheet. Record your answers to the
Part A and Part B–1 multiple-choice questions on this separate answer sheet. Record
your answers for the questions in Part B–2 and Part C in your separate answer
booklet. Be sure to fill in the heading on the front of your answer booklet.
All answers in your answer booklet should be written in pen, except for graphs
and drawings, which should be done in pencil.
When you have completed the examination, you must sign the declaration
printed on your separate answer sheet, indicating that you had no unlawful
knowledge of the questions or answers prior to the examination and that you have
neither given nor received assistance in answering any of the questions during the
examination. Your answer sheet and answer booklet cannot be accepted if you fail to
sign this declaration.
Notice. . .
A four-function or scientific calculator and a copy of the 2010 Edition Reference Tables for
Physical Setting/Earth Science must be available for you to use while taking this examination.
The use of any communications device is strictly prohibited when taking this
examination. If you use any communications device, no matter how briefly, your
examination will be invalidated and no score will be calculated for you.
DO NOT OPEN THIS EXAMINATION BOOKLET UNTIL THE SIGNAL IS GIVEN.
PS/EARTH SCIENCE
Part A
Answer all questions in this part.
Directions (1–35): For each statement or question, choose the word or expression that, of those given, best
completes the statement or answers the question. Some questions may require the use of the 2010 Edition
Reference Tables for Physical Setting/Earth Science. Record your answers on your separate answer sheet.
4 Cosmic background radiation provides direct
evidence for the origin of
(1) the universe
(2) our solar system
(3) Earth’s ozone layer
(4) Earth’s earliest atmosphere
1 Why do the planets in our solar system have a
layered internal structure?
(1) All planets cooled rapidly after they formed.
(2) The Sun exerts a gravitational force on the
planets.
(3) Each planet is composed of materials of
different densities.
(4) Cosmic dust settled in layers on the planets’
surfaces.
5 Planetary winds and ocean currents are deflected
to the right in the Northern Hemisphere and to
the left in the Southern Hemisphere due to
(1) seasonal changes
(3) the Doppler effect
(2) plate tectonics
(4) the Coriolis effect
2 The diagram below shows a large pendulum in
motion over an 8-hour period.
6 What is the approximate altitude of Polaris at
Syracuse, New York?
(1) 43°
(3) 76°
(2) 47°
(4) 90°
Swing
7 Most rocks that form from fragmental rock
particles are classified as
(1) extrusive igneous
(2) intrusive igneous
(3) clastic sedimentary
(4) chemical sedimentary
Apparent
change in
pendulum
0 2 direction
4
6
8 hours
Floor
8 Which group of organisms has the shortest record
of life on Earth?
(1) eurypterids
(3) birds
(2) graptolites
(4) placoderm fish
What is the main reason the pendulum appears to
change its direction of swing over time?
(1) tilt of Earth on its axis
(2) rotation of Earth on its axis
(3) revolution of Earth in its orbit
(4) speed of Earth in its orbit
9 What is inferred to be the main source of the free
oxygen that first entered Earth’s atmosphere?
(1) meteorite impacts releasing oxygen
(2) oxygen-producing organisms
(3) melting of glacial ice into hydrogen and
oxygen
(4) radioactive decay of rocks containing oxygen
3 On which day of the year does the Sun reach the
greatest altitude at solar noon in New York City?
(1) June 21
(3) August 21
(2) July 21
(4) September 21
P.S./E. Sci.–June ’11
[2]
12 Near which two latitudes are most of Earth’s
major deserts located?
(1) 0° and 90° N
(3) 30° N and 30° S
(2) 30° S and 60° S
(4) 60° S and 60° N
10 The drill-core samples below were taken from
two locations 1000 kilometers apart. Rock layers
1 through 8 have been labeled. Some index fossils
are shown in the layers.
Drill Core 1
Drill Core 2
1
5
2
6
13 How much of an 800-gram sample of potassium-40
will remain after 3.9 × 10⁹ years of radioactive
decay?
(1) 50 grams
(3) 200 grams
(2) 100 grams
(4) 400 grams
3
7
4
8
14 Thin layers of volcanic ash act as excellent time
markers in the correlation of bedrock because
volcanic ash
(1) is easily eroded and lasts only a short time on
Earth’s surface
(2) stays in the atmosphere for millions of years
(3) is deposited over millions of years
(4) falls to Earth over a large area in a short
period of time
Which numbered layers most likely formed at the
same time?
(1) 1 and 6
(3) 3 and 5
(2) 2 and 8
(4) 4 and 7
15 Evidence indicates that 251 million years ago a mass
extinction of many life-forms occurred on Earth.
Which form of life became extinct at this time?
(1) trilobites
(3) mammoths
(2) dinosaurs
(4) eurypterids
16 What is the dewpoint when the air temperature is
26°C and the relative humidity is 77%?
(1) 3°C
(3) 22°C
(2) 20°C
(4) 23°C
11 A tree in New York State casts a shadow as shown
in the diagram below.
Horizon
South
Sun
West
What time of day and season are represented by
the diagram?
(1) early morning in winter
(2) early morning in summer
(3) late afternoon in winter
(4) late afternoon in summer
P.S./E. Sci.–June ’11
[3]
[OVER]
20 The topographic map below shows a stream
crossing several contour lines and passing
through points X and Y. Elevations are measured
in feet.
17 On the map below, dark-gray areas represent
regions of lake-effect snow on a December day.
Which New York State location appears to be
experiencing a lake-effect snowstorm?
(1) New York City
(3) Plattsburgh
(2) Utica
(4) Watertown
What is the approximate gradient between point X
and point Y?
(1) 10 ft/mi
(3) 40 ft/mi
(2) 20 ft/mi
(4) 80 ft/mi
18 The cross section below shows the general
bedrock structure of an area containing three
different landscape regions, A, B, and C.
21 The map below shows an overhead view of
sediments that have accumulated at the bottom
of a lake. Points A through D represent locations
on the shoreline of the lake.
C
A
B
A
2 km
Clay
Silt
(Not drawn to scale)
Which list correctly identifies the type of
landscapes represented by letters A, B, and C?
(1) A = plain, B = plateau, C = mountain
(2) A = mountain, B = plateau, C = plain
(3) A = mountain, B = plain, C = plateau
(4) A = plateau, B = plain, C = mountain
Sand
B
Pebbles
C
A river most likely flows into the lake nearest to
location
(1) A
(3) C
(2) B
(4) D
19 In New York State, the surface bedrock of the
Catskills consists mainly of
(1) weakly consolidated gravels and sands
(2) quartzites, dolostones, marbles, and schists
(3) conglomerates, red sandstones, basalt, and
diabase
(4) limestones,
shales,
sandstones,
and
conglomerates
P.S./E. Sci.–June ’11
D
22 An increase in which gas in Earth’s atmosphere
will most significantly increase global temperatures?
(1) methane
(3) nitrogen
(2) oxygen
(4) hydrogen
[4]
25 The diagram below shows air movement over a
mountain.
23 The topographic map below shows two hills
located in upstate New York.
Windward
side
Leeward
side
650
Compared to the climate on the windward side of
the mountain, the climate on the leeward side of
the mountain is
(1) drier and warmer
(2) drier and cooler
(3) more humid and warmer
(4) more humid and cooler
600
600
26 Which factor has the greatest influence on the
number of daylight hours that a particular Earth
surface location receives?
(1) longitude
(2) latitude
(3) diameter of Earth
(4) distance from the Sun
N
miles
0
0.1
0.2
0.3
27 Energy is transferred from Barnard’s Star to
Earth mainly by
(1) red shifts
(2) density currents
(3) conduction
(4) electromagnetic waves
0.4
Which agent of erosion is most responsible for
the shape of these hills?
(1) wind
(3) waves
(2) gravity
(4) glaciers
28 A stream’s velocity decreases from 100 cm/s to
5 cm/s. Which size sediment particles will still be
transported by the stream?
(1) pebbles, sand, silt, and clay
(2) sand, silt, and clay, only
(3) silt and clay, only
(4) clay, only
24 During an El Niño event, surface water temperatures increase along the west coast of South
America. Which weather changes are likely to
occur in this region?
(1) decreased air temperature and decreased
precipitation
(2) decreased air temperature and increased
precipitation
(3) increased air temperature and increased
precipitation
(4) increased air temperature and decreased
precipitation
P.S./E. Sci.–June ’11
[5]
[OVER]
29 Which diagram most accurately represents the relative diameters of Earth and Mercury?
Earth
Earth
Mercury
Mercury
(1)
(3)
Mercury
Earth
Earth
(2)
Mercury
(4)
30 Which diagram represents the tilt of Earth’s axis relative to the Sun’s rays on December 15?
N Pole
N Pole
Sun’s
Sun’s
Sun’s
Sun’s
rays
rays
rays
rays
S Pole
S Pole
(1)
N Pole
(2)
(3)
S Pole
(4)
31 The cross section below shows four rock units, A, B, C, and D.
Key
Contact
metamorphism
Igneous rock
Which rock unit is youngest in age?
(1) A
(2) B
P.S./E. Sci.– June ’11
(3) C
(4) D
[6]
32 The incomplete flowchart below shows some of the changes that occur in warm air as it rises to form a cloud.
Warm air rises.
The air expands
due to
lower pressure.
Condensation
occurs and a
cloud forms.
Which statement should be placed in the empty box to accurately complete the
flowchart?
(1) The air warms as it expands.
(2) The air cools until it reaches the dewpoint.
(3) The air’s relative humidity decreases to zero.
(4) The air enters the thermosphere.
33 The highest surface wind speeds occur when there is a
(1) 4-millibar air-pressure difference between two nearby locations
(2) 4-millibar air-pressure difference between two distant locations
(3) 20-millibar air-pressure difference between two nearby locations
(4) 20-millibar air-pressure difference between two distant locations
34 The block diagram below shows a portion of Earth’s crust.
Which stream drainage pattern is most likely present on this crustal surface?
(1)
P.S./E. Sci.– June ’11
(2)
(3)
[7]
(4)
[OVER]
500
35 The contour map below shows elevations recorded in meters. Line AB is a reference line on the map.
A
B
Ocean
N
Contour interval = 100 m
Elevation (m)
Elevation (m)
Which graph best represents the profile from point A to point B?
500
0
0
Distance
(1)
B
A
Elevation (m)
Elevation (m)
A
500
0
Distance
(3)
B
Distance
(4)
B
500
0
A
P.S./E. Sci.– June ’11
500
Distance
(2)
B
A
[8]
Part B–1
Answer all questions in this part.
Directions (36–50): For each statement or question, choose the word or expression that, of those given, best
completes the statement or answers the question. Some questions may require the use of the 2010 Edition
Reference Tables for Physical Setting/Earth Science. Record your answers on your separate answer sheet.
Base your answers to questions 36 through 40 on the diagram below, which represents zones of Earth’s
interior, identified by letters A through E. The scale shows depths below Earth’s surface, measured in
kilometers.
A
0
B
C
1000
D
2000
3000
36 The Moho is a boundary located in zone
(1) A
(2) B
4000
E
5000
6000 km
(3) E
(4) D
37 What is the approximate thickness of zone C?
(1) 650 km
(3) 2250 km
(2) 1600 km
(4) 2900 km
38 Which zone is characterized by partially melted rock and large-scale convection
currents?
(1) zone A
(3) zone C
(2) zone B
(4) zone E
39 Which zone of Earth’s interior has a density closest to the densities of the other
terrestrial planets?
(1) zone A
(3) zone C
(2) zone E
(4) zone D
40 S-waves produced by an earthquake are transmitted through zones
(1) A and B, but not zones C, D, and E
(3) C, D, and E, but not zones A and B
(2) A, B, and C, but not zones D and E
(4) D and E, but not zones A, B, and C
P.S./E. Sci.–June ’11
[9]
[OVER]
Base your answers to questions 41 through 43 on the data table below, which lists some properties of four
minerals that are used as ores of zinc (Zn).
Mineral
Property
Mineral
Smithsonite
Sphalerite
Willemite
Zincite
Composition
ZnCO3
ZnS
Zn2SiO4
ZnO
Hardness
4–4.5
3.5–4
5.5
4
4.4
4.0
4.0
5.6
Color
white, gray,
green, blue,
yellow
brown, yellow,
red, green,
black
white, yellow,
green, reddish
brown, black
deep red to
orange yellow
Streak
white
white to yellow
to brown
white
orange yellow
Density (g/cm3)
41 A mineral with a hardness of 5 would scratch
(1) all four zinc minerals in the table
(2) zincite, but not sphalerite, smithsonite, or willemite
(3) zincite and sphalerite, but not smithsonite or willemite
(4) zincite, sphalerite, and smithsonite, but not willemite
42 A sample of sphalerite has a mass of 176.0 grams. What is the volume of the sample?
(1) 22.7 cm3
(3) 40.0 cm3
3
(2) 31.4 cm
(4) 44.0 cm3
43 Which mineral belongs in the same mineral group as quartz and olivine?
(1) zincite
(3) sphalerite
(2) willemite
(4) smithsonite
P.S./E. Sci.–June ’11
[10]
Base your answers to questions 44 through 46 on the map below, which shows a portion of the continent of
North America and outlines the Mississippi River watershed. Points A, B, C, D, and E represent locations on
Earth’s surface.
A
ssippi
ssi
Mi
B
Riv
er
C
Atlantic
Ocean
D
E
Pacific
Ocean
Gulf of Mexico
Key
Mississippi watershed boundary
44 At which location would the Mississippi River’s discharge most likely be the greatest?
(1) A
(3) C
(2) B
(4) D
45 Sediments deposited by the river at location B are best described as
(1) sorted and layered
(3) unsorted and layered
(2) sorted and not layered
(4) unsorted and not layered
46 Which landform is produced at location E where the Mississippi River enters the
Gulf of Mexico?
(1) a delta
(3) an escarpment
(2) a drumlin
(4) an outwash plain
P.S./E. Sci.–June ’11
[11]
[OVER]
Base your answers to questions 47 through 50 on the calendar below, which shows the month of July of a
recent year. The dates of major Moon phases, as seen in New York State, are shown.
July
Sunday
Monday
Tuesday
Wednesday Thursday
Friday
Saturday
1
2
3
4
5
6
7
8
9
10
11
12
13
14
15
16
17
18
19
20
21
22
23
24
25
26
27
28
Key
New Moon
First-quarter Moon
Full Moon
29
30
31
Last-quarter Moon
47 The diagram below represents the phase of the Moon observed from New York State
one night during the month of July.
On which date was this phase of the Moon visible from New York State?
(1) July 4
(3) July 19
(2) July 11
(4) July 26
48 On which date will the next first-quarter Moon phase occur?
(1) August 6
(3) August 16
(2) August 10
(4) August 22
49 Eclipses do not occur every month because the Moon’s
(1) rate of rotation is 15° each hour
(2) orbit is inclined to Earth’s orbit
(3) period of revolution is 27.3 days
(4) period of rotation and period of revolution are the same
50 Why does the Moon’s gravity have a greater effect on Earth’s ocean tides than the
Sun’s gravity?
(1) The Sun is composed mostly of gases.
(2) The Sun’s gravity influences more planets.
(3) The Moon has a greater mass.
(4) The Moon is much closer to Earth.
P.S./E. Sci.–June ’11
[12]
Part B–2
Answer all questions in this part.
Directions (51–65): Record your answers in the spaces provided in your answer booklet. Some questions
may require the use of the 2010 Edition Reference Tables for Physical Setting/Earth Science.
Base your answers to questions 51 and 52 on the block diagram and information below. The diagram is of
the Niagara Falls region as viewed from the north.
Lockport
dolostone
Rochester
shale
Niagara Falls
Niagar
a
Escarpmen
t
Niagara
River
Lake Ontario
N
The Niagara River began to flow over the Niagara Escarpment about 12,000 years
ago when the last Pleistocene ice sheet melted and retreated north from the Niagara
Escarpment. Since that time, Niagara Falls has eroded upriver, leaving a deep, steepsided valley that is 11,000 meters long. The top bedrock layer of the escarpment is the
Lockport dolostone which lies above the Rochester shale. The shale is more easily
weathered than the dolostone. This causes the dolostone to be undercut. As a result,
the dolostone breaks off in large blocks that tumble to the base of Niagara Falls.
51 In which New York State landscape region is Niagara Falls located?
[1]
52 Toward which compass direction is the location of Niagara Falls likely to move in the
future? [1]
P.S./E. Sci.–June ’11
[13]
[OVER]
Base your answers to questions 53 through 55 on the diagram below, which represents Earth’s water cycle.
The arrows represent some water cycle processes. Letter A indicates a surface location on Earth.
Condensation
Precipitation
Evaporation
Forest
Water table
A
Ru
no
ff
Ground
Ocean
water f
low
53 Other than evaporation, which water cycle process transfers large amounts of water
vapor into the atmosphere from the forest? [1]
54 Describe one surface condition change at location A that would decrease the rate of
runoff. [1]
55 How many joules (J) of heat energy are released by each gram of water vapor that
condenses to form cloud droplets? [1]
P.S./E. Sci.–June ’11
[14]
Base your answers to questions 56 through 59 on the graphs and map below. The map shows a view of Earth
from above the North Pole. Points on the map indicate the positions of Reykjavik, Iceland, and Yakutsk, Russia.
The graphs show average monthly air temperature (line graphs) and amount of precipitation (bar graphs) for
both locations.
56 Write the two-letter weather map symbol for an air mass that originates over
Yakutsk. [1]
57 Explain why Reykjavik has cooler summers and warmer winters than Yakutsk.
P.S./E. Sci.–June ’11
[1]
58 Describe one way the yearly precipitation in Yakutsk differs from that in Reykjavik.
[1]
59 Identify one warm and one cool ocean current that affect the climate of Iceland.
[1]
[15]
[OVER]
Base your answers to questions 60 through 65 on the star chart below, which shows the locations of several
constellations visible in the night sky. These constellations appear to move counterclockwise around the star in
the center of the chart. Straight lines are at 15-degree intervals. Merak and Dubhe are two stars in the Big
Dipper.
Cepheus
Cassiopeia
Perseus
Draco
Little Dipper
Camelopardalis
Bi
Auriga
Dubhe
gD
ipp
er
Lynx
Merak
(Not drawn to scale)
60 Identify the star located in the center of this star chart.
[1]
61 How many degrees would the star directly below the “ss” in Cassiopeia appear to
move in 3 hours? [1]
62 Which Earth motion causes the apparent daily movement of these constellations?
[1]
63 Complete the table in your answer booklet by identifying the classification of the
star Dubhe. The classification for the star Merak has been provided as an example.
[1]
64 The stars Merak and Dubhe are located within the same galaxy as our Sun. Identify
the galaxy in which these stars are located. [1]
65 On the chart of the night sky in your answer booklet, place an X to indicate the
location of the Big Dipper at the same time of night 6 months later. [1]
P.S./E. Sci.–June ’11
[16]
Part C
Answer all questions in this part.
Directions (66–85): Record your answers in the spaces provided in your answer booklet. Some questions
may require the use of the 2010 Edition Reference Tables for Physical Setting/Earth Science.
Base your answers to questions 66 through 68 on the table below, which shows information about five large
objects in the Kuiper Belt. The Kuiper Belt is located approximately 30 to 1000 astronomical units (AU) from
the Sun. An astronomical unit is the average distance between Earth and the Sun, 149.6 million kilometers.
Kuiper Belt Data
Orbit Characteristics
Kuiper Belt
Objects
Closest Distance
to the Sun
(AU)
Farthest Distance
from the Sun
(AU)
Eccentricity
Approximate
Equatorial Diameter
(km)
Varuna
40.47
45.13
0.053
900
Eris
37.77
97.56
0.442
2400
Quaoar
41.92
45.28
0.039
1260
Sedna
76.15
975.05
0.855
1500
Ixion
30.04
49.36
0.243
1065
66 The diagram in your answer booklet shows the orbits of some of the planets in our
solar system. The approximate average distances from the Sun, in astronomical
units, are indicated. On the diagram, place an X to show the closest distance of Ixion
to the Sun. [1]
67 On the graph in your answer booklet, construct a bar graph of the equatorial
diameter of each of the Kuiper Belt objects listed in the table. The diameter of
Earth’s Moon has been graphed for comparison. [1]
68 Identify the Kuiper Belt object with the longest period of revolution and state the
evidence that supports that conclusion. [1]
69 On the weather station model in your answer booklet, using the proper format,
record the four weather conditions shown below. [1]
Dewpoint:
Air pressure:
Wind:
Wind speed:
P.S./E. Sci.–June ’11
48°F
998.3 mb
from the southeast
10 knots
[17]
[OVER]
Base your answers to questions 70 through 74 on the two maps in your answer booklet. Map 1 shows air
temperatures in the United States and Mexico, recorded in °F, at the points shown on the map. Map 2 shows
the location of a low-pressure system at the time these air temperatures were measured. An occluded front extends
from the center of the low-pressure system (L) to point A. Lines AB and AC are two other frontal boundaries.
Two air masses are shown. The storm system later moved toward New York State and produced an ice storm.
70 On map 1 in your answer booklet, draw the 32°F isotherm.
[1]
71 On map 2 in your answer booklet, draw weather front symbols on the correct sides
of both line AB and line AC to show the most probable type and direction of movement of each front. [1]
72 Describe the general surface wind pattern associated with the low-pressure system
shown on map 2. [1]
73 Explain what caused the center of this low-pressure system to move toward
New York State. [1]
74 State one action New York State residents should have taken to prepare for the
approaching ice storm. [1]
Base your answers to questions 75 through 79 on the block diagram below, which shows rock units that have
not been overturned. Point A is located in the zone of contact metamorphism. A New York State index fossil is
shown in one of the rock units.
75 State the evidence shown by the block diagram that supports the inference that the
fault is older than the rhyolite. [1]
76 Identify the geologic time period when the index fossil shown in the block diagram
was a living organism. [1]
77 Identify the crystal size of the minerals in rhyolite and explain what this size
indicates about the rate of cooling of the magma from which it formed. [1]
78 Identify the metamorphic rock that most likely formed at point A.
[1]
79 Describe one piece of evidence that would indicate that the valley shown on the
surface of the block diagram had been eroded and deepened by a glacier. [1]
P.S./E. Sci.–June ’11
[18]
Base your answers to questions 80 through 85 on the passage and map below. The map shows the volcanic
island, Krakatau, before and after the 1883 eruption.
Krakatau
On August 27, 1883, one of the largest volcanic eruptions ever recorded in history
occurred. Krakatau, a volcanic island nearly 800 meters in height, located at 6° S 105.5° E,
exploded. Two-thirds of the island was destroyed by the blast. Blocks of pumice
produced by the eruption were found floating in the ocean for months afterward.
Tsunamis produced by the eruption reached heights of 40 meters as they came
ashore on nearby islands. These destructive waves traveled 6360 kilometers in just
12 hours. Over 36,000 people died and 165 coastal villages were destroyed.
Volcanic ash was blasted into the atmosphere to heights between 36 and 48 kilometers.
Global temperatures cooled as the ash traveled on air currents around the world.
Volcanic Island of Krakatau
Part of Krakatau Island
destroyed in 1883
Krakatau
Island
today
80 The diagram in your answer booklet shows where Krakatau formed, then exploded.
Draw one arrow on each lithospheric plate to show the relative direction that both
plates are moving to produce this type of volcano. [1]
81 The diagram in your answer booklet represents an average size person standing next
to a tall building. Draw a horizontal line across the building to show the maximum
height of the tsunami waves produced by the 1883 eruption of Krakatau. [1]
82 Determine the rate the tsunamis traveled across the ocean. Label your answer with
the correct units. [1]
83 Identify the layer of the atmosphere into which the highest volcanic ash was blasted
from the Krakatau eruption. [1]
84 Explain how the volcanic ash from the Krakatau eruption caused global
temperatures to decrease. [1]
85 Describe the texture and density of pumice that allowed the blocks of pumice to float
on the ocean. [1]
P.S./E. Sci.– June ’11
[19]
PS/EARTH SCIENCE
Printed on Recycled Paper
PS/EARTH SCIENCE
PS/EARTH SCIENCE
The University of the State of New York
REGENTS HIGH SCHOOL EXAMINATION
PHYSICAL SETTING
EARTH SCIENCE
Friday, June 17, 2011 — 1:15 to 4:15 p.m., only
Use your knowledge of Earth science to answer all questions in this examination.
Before you begin this examination, you must be provided with the
2010 Edition Reference Tables for Physical Setting/Earth Science. You will need these
reference tables to answer some of the questions.
You are to answer all questions in all parts of this examination. You may use scrap
paper to work out the answers to the questions. A separate answer sheet for Part A
and Part B–1 has been provided to you. Follow the instructions from the proctor for
completing the student information on your answer sheet. Record your answers to the
Part A and Part B–1 multiple-choice questions on this separate answer sheet. Record
your answers for the questions in Part B–2 and Part C in your separate answer
booklet. Be sure to fill in the heading on the front of your answer booklet.
All answers in your answer booklet should be written in pen, except for graphs
and drawings, which should be done in pencil.
When you have completed the examination, you must sign the declaration
printed on your separate answer sheet, indicating that you had no unlawful
knowledge of the questions or answers prior to the examination and that you have
neither given nor received assistance in answering any of the questions during the
examination. Your answer sheet and answer booklet cannot be accepted if you fail to
sign this declaration.
Notice. . .
A four-function or scientific calculator and a copy of the 2010 Edition Reference Tables for
Physical Setting/Earth Science must be available for you to use while taking this examination.
The use of any communications device is strictly prohibited when taking this
examination. If you use any communications device, no matter how briefly, your
examination will be invalidated and no score will be calculated for you.
DO NOT OPEN THIS EXAMINATION BOOKLET UNTIL THE SIGNAL IS GIVEN.
PS/EARTH SCIENCE
Part A
Answer all questions in this part.
Directions (1–35): For each statement or question, choose the word or expression that, of those given, best
completes the statement or answers the question. Some questions may require the use of the 2010 Edition
Reference Tables for Physical Setting/Earth Science. Record your answers on your separate answer sheet.
4 Cosmic background radiation provides direct
evidence for the origin of
(1) the universe
(2) our solar system
(3) Earth’s ozone layer
(4) Earth’s earliest atmosphere
1 Why do the planets in our solar system have a
layered internal structure?
(1) All planets cooled rapidly after they formed.
(2) The Sun exerts a gravitational force on the
planets.
(3) Each planet is composed of materials of
different densities.
(4) Cosmic dust settled in layers on the planets’
surfaces.
5 Planetary winds and ocean currents are deflected
to the right in the Northern Hemisphere and to
the left in the Southern Hemisphere due to
(1) seasonal changes
(3) the Doppler effect
(2) plate tectonics
(4) the Coriolis effect
2 The diagram below shows a large pendulum in
motion over an 8-hour period.
6 What is the approximate altitude of Polaris at
Syracuse, New York?
(1) 43°
(3) 76°
(2) 47°
(4) 90°
Swing
7 Most rocks that form from fragmental rock
particles are classified as
(1) extrusive igneous
(2) intrusive igneous
(3) clastic sedimentary
(4) chemical sedimentary
Apparent
change in
pendulum
0 2 direction
4
6
8 hours
Floor
8 Which group of organisms has the shortest record
of life on Earth?
(1) eurypterids
(3) birds
(2) graptolites
(4) placoderm fish
What is the main reason the pendulum appears to
change its direction of swing over time?
(1) tilt of Earth on its axis
(2) rotation of Earth on its axis
(3) revolution of Earth in its orbit
(4) speed of Earth in its orbit
9 What is inferred to be the main source of the free
oxygen that first entered Earth’s atmosphere?
(1) meteorite impacts releasing oxygen
(2) oxygen-producing organisms
(3) melting of glacial ice into hydrogen and
oxygen
(4) radioactive decay of rocks containing oxygen
3 On which day of the year does the Sun reach the
greatest altitude at solar noon in New York City?
(1) June 21
(3) August 21
(2) July 21
(4) September 21
P.S./E. Sci.–June ’11
[2]
12 Near which two latitudes are most of Earth’s
major deserts located?
(1) 0° and 90° N
(3) 30° N and 30° S
(2) 30° S and 60° S
(4) 60° S and 60° N
10 The drill-core samples below were taken from
two locations 1000 kilometers apart. Rock layers
1 through 8 have been labeled. Some index fossils
are shown in the layers.
Drill Core 1
Drill Core 2
1
5
2
6
13 How much of an 800-gram sample of potassium-40
will remain after 3.9 × 10⁹ years of radioactive
decay?
(1) 50 grams
(3) 200 grams
(2) 100 grams
(4) 400 grams
3
7
4
8
14 Thin layers of volcanic ash act as excellent time
markers in the correlation of bedrock because
volcanic ash
(1) is easily eroded and lasts only a short time on
Earth’s surface
(2) stays in the atmosphere for millions of years
(3) is deposited over millions of years
(4) falls to Earth over a large area in a short
period of time
Which numbered layers most likely formed at the
same time?
(1) 1 and 6
(3) 3 and 5
(2) 2 and 8
(4) 4 and 7
15 Evidence indicates that 251 million years ago a mass
extinction of many life-forms occurred on Earth.
Which form of life became extinct at this time?
(1) trilobites
(3) mammoths
(2) dinosaurs
(4) eurypterids
16 What is the dewpoint when the air temperature is
26°C and the relative humidity is 77%?
(1) 3°C
(3) 22°C
(2) 20°C
(4) 23°C
11 A tree in New York State casts a shadow as shown
in the diagram below.
Horizon
South
Sun
West
What time of day and season are represented by
the diagram?
(1) early morning in winter
(2) early morning in summer
(3) late afternoon in winter
(4) late afternoon in summer
P.S./E. Sci.–June ’11
[3]
[OVER]
20 The topographic map below shows a stream
crossing several contour lines and passing
through points X and Y. Elevations are measured
in feet.
17 On the map below, dark-gray areas represent
regions of lake-effect snow on a December day.
Which New York State location appears to be
experiencing a lake-effect snowstorm?
(1) New York City
(3) Plattsburgh
(2) Utica
(4) Watertown
What is the approximate gradient between point X
and point Y?
(1) 10 ft/mi
(3) 40 ft/mi
(2) 20 ft/mi
(4) 80 ft/mi
18 The cross section below shows the general
bedrock structure of an area containing three
different landscape regions, A, B, and C.
21 The map below shows an overhead view of
sediments that have accumulated at the bottom
of a lake. Points A through D represent locations
on the shoreline of the lake.
C
A
B
A
2 km
Clay
Silt
(Not drawn to scale)
Which list correctly identifies the type of
landscapes represented by letters A, B, and C?
(1) A = plain, B = plateau, C = mountain
(2) A = mountain, B = plateau, C = plain
(3) A = mountain, B = plain, C = plateau
(4) A = plateau, B = plain, C = mountain
Sand
B
Pebbles
C
A river most likely flows into the lake nearest to
location
(1) A
(3) C
(2) B
(4) D
19 In New York State, the surface bedrock of the
Catskills consists mainly of
(1) weakly consolidated gravels and sands
(2) quartzites, dolostones, marbles, and schists
(3) conglomerates, red sandstones, basalt, and
diabase
(4) limestones,
shales,
sandstones,
and
conglomerates
P.S./E. Sci.–June ’11
D
22 An increase in which gas in Earth’s atmosphere
will most significantly increase global temperatures?
(1) methane
(3) nitrogen
(2) oxygen
(4) hydrogen
[4]
25 The diagram below shows air movement over a
mountain.
23 The topographic map below shows two hills
located in upstate New York.
Windward
side
Leeward
side
650
Compared to the climate on the windward side of
the mountain, the climate on the leeward side of
the mountain is
(1) drier and warmer
(2) drier and cooler
(3) more humid and warmer
(4) more humid and cooler
600
600
26 Which factor has the greatest influence on the
number of daylight hours that a particular Earth
surface location receives?
(1) longitude
(2) latitude
(3) diameter of Earth
(4) distance from the Sun
N
miles
0
0.1
0.2
0.3
27 Energy is transferred from Barnard’s Star to
Earth mainly by
(1) red shifts
(2) density currents
(3) conduction
(4) electromagnetic waves
0.4
Which agent of erosion is most responsible for
the shape of these hills?
(1) wind
(3) waves
(2) gravity
(4) glaciers
28 A stream’s velocity decreases from 100 cm/s to
5 cm/s. Which size sediment particles will still be
transported by the stream?
(1) pebbles, sand, silt, and clay
(2) sand, silt, and clay, only
(3) silt and clay, only
(4) clay, only
24 During an El Niño event, surface water temperatures increase along the west coast of South
America. Which weather changes are likely to
occur in this region?
(1) decreased air temperature and decreased
precipitation
(2) decreased air temperature and increased
precipitation
(3) increased air temperature and increased
precipitation
(4) increased air temperature and decreased
precipitation
P.S./E. Sci.–June ’11
[5]
[OVER]
29 Which diagram most accurately represents the relative diameters of Earth and Mercury?
Earth
Earth
Mercury
Mercury
(1)
(3)
Mercury
Earth
Earth
(2)
Mercury
(4)
30 Which diagram represents the tilt of Earth’s axis relative to the Sun’s rays on December 15?
N Pole
N Pole
Sun’s
Sun’s
Sun’s
Sun’s
rays
rays
rays
rays
S Pole
S Pole
(1)
N Pole
(2)
(3)
S Pole
(4)
31 The cross section below shows four rock units, A, B, C, and D.
Key
Contact
metamorphism
Igneous rock
Which rock unit is youngest in age?
(1) A
(2) B
P.S./E. Sci.– June ’11
(3) C
(4) D
[6]
32 The incomplete flowchart below shows some of the changes that occur in warm air as it rises to form a cloud.
Warm air rises.
The air expands
due to
lower pressure.
Condensation
occurs and a
cloud forms.
Which statement should be placed in the empty box to accurately complete the
flowchart?
(1) The air warms as it expands.
(2) The air cools until it reaches the dewpoint.
(3) The air’s relative humidity decreases to zero.
(4) The air enters the thermosphere.
33 The highest surface wind speeds occur when there is a
(1) 4-millibar air-pressure difference between two nearby locations
(2) 4-millibar air-pressure difference between two distant locations
(3) 20-millibar air-pressure difference between two nearby locations
(4) 20-millibar air-pressure difference between two distant locations
34 The block diagram below shows a portion of Earth’s crust.
Which stream drainage pattern is most likely present on this crustal surface?
(1)
P.S./E. Sci.– June ’11
(2)
(3)
[7]
(4)
[OVER]
500
35 The contour map below shows elevations recorded in meters. Line AB is a reference line on the map.
A
B
Ocean
N
Contour interval = 100 m
Elevation (m)
Elevation (m)
Which graph best represents the profile from point A to point B?
500
0
0
Distance
(1)
B
A
Elevation (m)
Elevation (m)
A
500
0
Distance
(3)
B
Distance
(4)
B
500
0
A
P.S./E. Sci.– June ’11
500
Distance
(2)
B
A
[8]
Part B–1
Answer all questions in this part.
Directions (36–50): For each statement or question, choose the word or expression that, of those given, best
completes the statement or answers the question. Some questions may require the use of the 2010 Edition
Reference Tables for Physical Setting/Earth Science. Record your answers on your separate answer sheet.
Base your answers to questions 36 through 40 on the diagram below, which represents zones of Earth’s
interior, identified by letters A through E. The scale shows depths below Earth’s surface, measured in
kilometers.
A
0
B
C
1000
D
2000
3000
36 The Moho is a boundary located in zone
(1) A
(2) B
4000
E
5000
6000 km
(3) E
(4) D
37 What is the approximate thickness of zone C?
(1) 650 km
(3) 2250 km
(2) 1600 km
(4) 2900 km
38 Which zone is characterized by partially melted rock and large-scale convection
currents?
(1) zone A
(3) zone C
(2) zone B
(4) zone E
39 Which zone of Earth’s interior has a density closest to the densities of the other
terrestrial planets?
(1) zone A
(3) zone C
(2) zone E
(4) zone D
40 S-waves produced by an earthquake are transmitted through zones
(1) A and B, but not zones C, D, and E
(3) C, D, and E, but not zones A and B
(2) A, B, and C, but not zones D and E
(4) D and E, but not zones A, B, and C
P.S./E. Sci.–June ’11
[9]
[OVER]
Base your answers to questions 41 through 43 on the data table below, which lists some properties of four
minerals that are used as ores of zinc (Zn).
Mineral
Property
Mineral
Smithsonite
Sphalerite
Willemite
Zincite
Composition
ZnCO3
ZnS
Zn2SiO4
ZnO
Hardness
4–4.5
3.5–4
5.5
4
4.4
4.0
4.0
5.6
Color
white, gray,
green, blue,
yellow
brown, yellow,
red, green,
black
white, yellow,
green, reddish
brown, black
deep red to
orange yellow
Streak
white
white to yellow
to brown
white
orange yellow
Density (g/cm3)
41 A mineral with a hardness of 5 would scratch
(1) all four zinc minerals in the table
(2) zincite, but not sphalerite, smithsonite, or willemite
(3) zincite and sphalerite, but not smithsonite or willemite
(4) zincite, sphalerite, and smithsonite, but not willemite
42 A sample of sphalerite has a mass of 176.0 grams. What is the volume of the sample?
(1) 22.7 cm3
(3) 40.0 cm3
3
(2) 31.4 cm
(4) 44.0 cm3
43 Which mineral belongs in the same mineral group as quartz and olivine?
(1) zincite
(3) sphalerite
(2) willemite
(4) smithsonite
P.S./E. Sci.–June ’11
[10]
Base your answers to questions 44 through 46 on the map below, which shows a portion of the continent of
North America and outlines the Mississippi River watershed. Points A, B, C, D, and E represent locations on
Earth’s surface.
A
ssippi
ssi
Mi
B
Riv
er
C
Atlantic
Ocean
D
E
Pacific
Ocean
Gulf of Mexico
Key
Mississippi watershed boundary
44 At which location would the Mississippi River’s discharge most likely be the greatest?
(1) A
(3) C
(2) B
(4) D
45 Sediments deposited by the river at location B are best described as
(1) sorted and layered
(3) unsorted and layered
(2) sorted and not layered
(4) unsorted and not layered
46 Which landform is produced at location E where the Mississippi River enters the
Gulf of Mexico?
(1) a delta
(3) an escarpment
(2) a drumlin
(4) an outwash plain
P.S./E. Sci.–June ’11
[11]
[OVER]
Base your answers to questions 47 through 50 on the calendar below, which shows the month of July of a
recent year. The dates of major Moon phases, as seen in New York State, are shown.
July
Sunday
Monday
Tuesday
Wednesday Thursday
Friday
Saturday
1
2
3
4
5
6
7
8
9
10
11
12
13
14
15
16
17
18
19
20
21
22
23
24
25
26
27
28
Key
New Moon
First-quarter Moon
Full Moon
29
30
31
Last-quarter Moon
47 The diagram below represents the phase of the Moon observed from New York State
one night during the month of July.
On which date was this phase of the Moon visible from New York State?
(1) July 4
(3) July 19
(2) July 11
(4) July 26
48 On which date will the next first-quarter Moon phase occur?
(1) August 6
(3) August 16
(2) August 10
(4) August 22
49 Eclipses do not occur every month because the Moon’s
(1) rate of rotation is 15° each hour
(2) orbit is inclined to Earth’s orbit
(3) period of revolution is 27.3 days
(4) period of rotation and period of revolution are the same
50 Why does the Moon’s gravity have a greater effect on Earth’s ocean tides than the
Sun’s gravity?
(1) The Sun is composed mostly of gases.
(2) The Sun’s gravity influences more planets.
(3) The Moon has a greater mass.
(4) The Moon is much closer to Earth.
P.S./E. Sci.–June ’11
[12]
Part B–2
Answer all questions in this part.
Directions (51–65): Record your answers in the spaces provided in your answer booklet. Some questions
may require the use of the 2010 Edition Reference Tables for Physical Setting/Earth Science.
Base your answers to questions 51 and 52 on the block diagram and information below. The diagram is of
the Niagara Falls region as viewed from the north.
Lockport
dolostone
Rochester
shale
Niagara Falls
Niagar
a
Escarpmen
t
Niagara
River
Lake Ontario
N
The Niagara River began to flow over the Niagara Escarpment about 12,000 years
ago when the last Pleistocene ice sheet melted and retreated north from the Niagara
Escarpment. Since that time, Niagara Falls has eroded upriver, leaving a deep, steepsided valley that is 11,000 meters long. The top bedrock layer of the escarpment is the
Lockport dolostone which lies above the Rochester shale. The shale is more easily
weathered than the dolostone. This causes the dolostone to be undercut. As a result,
the dolostone breaks off in large blocks that tumble to the base of Niagara Falls.
51 In which New York State landscape region is Niagara Falls located?
[1]
52 Toward which compass direction is the location of Niagara Falls likely to move in the
future? [1]
P.S./E. Sci.–June ’11
[13]
[OVER]
Base your answers to questions 53 through 55 on the diagram below, which represents Earth’s water cycle.
The arrows represent some water cycle processes. Letter A indicates a surface location on Earth.
Condensation
Precipitation
Evaporation
Forest
Water table
A
Ru
no
ff
Ground
Ocean
water f
low
53 Other than evaporation, which water cycle process transfers large amounts of water
vapor into the atmosphere from the forest? [1]
54 Describe one surface condition change at location A that would decrease the rate of
runoff. [1]
55 How many joules (J) of heat energy are released by each gram of water vapor that
condenses to form cloud droplets? [1]
P.S./E. Sci.–June ’11
[14]
Base your answers to questions 56 through 59 on the graphs and map below. The map shows a view of Earth
from above the North Pole. Points on the map indicate the positions of Reykjavik, Iceland, and Yakutsk, Russia.
The graphs show average monthly air temperature (line graphs) and amount of precipitation (bar graphs) for
both locations.
56 Write the two-letter weather map symbol for an air mass that originates over
Yakutsk. [1]
57 Explain why Reykjavik has cooler summers and warmer winters than Yakutsk.
P.S./E. Sci.–June ’11
[1]
58 Describe one way the yearly precipitation in Yakutsk differs from that in Reykjavik.
[1]
59 Identify one warm and one cool ocean current that affect the climate of Iceland.
[1]
[15]
[OVER]
Base your answers to questions 60 through 65 on the star chart below, which shows the locations of several
constellations visible in the night sky. These constellations appear to move counterclockwise around the star in
the center of the chart. Straight lines are at 15-degree intervals. Merak and Dubhe are two stars in the Big
Dipper.
Cepheus
Cassiopeia
Perseus
Draco
Little Dipper
Camelopardalis
Bi
Auriga
Dubhe
gD
ipp
er
Lynx
Merak
(Not drawn to scale)
60 Identify the star located in the center of this star chart.
[1]
61 How many degrees would the star directly below the “ss” in Cassiopeia appear to
move in 3 hours? [1]
62 Which Earth motion causes the apparent daily movement of these constellations?
[1]
63 Complete the table in your answer booklet by identifying the classification of the
star Dubhe. The classification for the star Merak has been provided as an example.
[1]
64 The stars Merak and Dubhe are located within the same galaxy as our Sun. Identify
the galaxy in which these stars are located. [1]
65 On the chart of the night sky in your answer booklet, place an X to indicate the
location of the Big Dipper at the same time of night 6 months later. [1]
P.S./E. Sci.–June ’11
[16]
Part C
Answer all questions in this part.
Directions (66–85): Record your answers in the spaces provided in your answer booklet. Some questions
may require the use of the 2010 Edition Reference Tables for Physical Setting/Earth Science.
Base your answers to questions 66 through 68 on the table below, which shows information about five large
objects in the Kuiper Belt. The Kuiper Belt is located approximately 30 to 1000 astronomical units (AU) from
the Sun. An astronomical unit is the average distance between Earth and the Sun, 149.6 million kilometers.
Kuiper Belt Data
Orbit Characteristics
Kuiper Belt
Objects
Closest Distance
to the Sun
(AU)
Farthest Distance
from the Sun
(AU)
Eccentricity
Approximate
Equatorial Diameter
(km)
Varuna
40.47
45.13
0.053
900
Eris
37.77
97.56
0.442
2400
Quaoar
41.92
45.28
0.039
1260
Sedna
76.15
975.05
0.855
1500
Ixion
30.04
49.36
0.243
1065
66 The diagram in your answer booklet shows the orbits of some of the planets in our
solar system. The approximate average distances from the Sun, in astronomical
units, are indicated. On the diagram, place an X to show the closest distance of Ixion
to the Sun. [1]
67 On the graph in your answer booklet, construct a bar graph of the equatorial
diameter of each of the Kuiper Belt objects listed in the table. The diameter of
Earth’s Moon has been graphed for comparison. [1]
68 Identify the Kuiper Belt object with the longest period of revolution and state the
evidence that supports that conclusion. [1]
69 On the weather station model in your answer booklet, using the proper format,
record the four weather conditions shown below. [1]
Dewpoint:
Air pressure:
Wind:
Wind speed:
P.S./E. Sci.–June ’11
48°F
998.3 mb
from the southeast
10 knots
[17]
[OVER]
Base your answers to questions 70 through 74 on the two maps in your answer booklet. Map 1 shows air
temperatures in the United States and Mexico, recorded in °F, at the points shown on the map. Map 2 shows
the location of a low-pressure system at the time these air temperatures were measured. An occluded front extends
from the center of the low-pressure system (L) to point A. Lines AB and AC are two other frontal boundaries.
Two air masses are shown. The storm system later moved toward New York State and produced an ice storm.
70 On map 1 in your answer booklet, draw the 32°F isotherm.
[1]
71 On map 2 in your answer booklet, draw weather front symbols on the correct sides
of both line AB and line AC to show the most probable type and direction of movement of each front. [1]
72 Describe the general surface wind pattern associated with the low-pressure system
shown on map 2. [1]
73 Explain what caused the center of this low-pressure system to move toward
New York State. [1]
74 State one action New York State residents should have taken to prepare for the
approaching ice storm. [1]
Base your answers to questions 75 through 79 on the block diagram below, which shows rock units that have
not been overturned. Point A is located in the zone of contact metamorphism. A New York State index fossil is
shown in one of the rock units.
75 State the evidence shown by the block diagram that supports the inference that the
fault is older than the rhyolite. [1]
76 Identify the geologic time period when the index fossil shown in the block diagram
was a living organism. [1]
77 Identify the crystal size of the minerals in rhyolite and explain what this size
indicates about the rate of cooling of the magma from which it formed. [1]
78 Identify the metamorphic rock that most likely formed at point A.
[1]
79 Describe one piece of evidence that would indicate that the valley shown on the
surface of the block diagram had been eroded and deepened by a glacier. [1]
P.S./E. Sci.–June ’11
[18]
Base your answers to questions 80 through 85 on the passage and map below. The map shows the volcanic
island, Krakatau, before and after the 1883 eruption.
Krakatau
On August 27, 1883, one of the largest volcanic eruptions ever recorded in history
occurred. Krakatau, a volcanic island nearly 800 meters in height, located at 6° S 105.5° E,
exploded. Two-thirds of the island was destroyed by the blast. Blocks of pumice
produced by the eruption were found floating in the ocean for months afterward.
Tsunamis produced by the eruption reached heights of 40 meters as they came
ashore on nearby islands. These destructive waves traveled 6360 kilometers in just
12 hours. Over 36,000 people died and 165 coastal villages were destroyed.
Volcanic ash was blasted into the atmosphere to heights between 36 and 48 kilometers.
Global temperatures cooled as the ash traveled on air currents around the world.
Volcanic Island of Krakatau
Part of Krakatau Island
destroyed in 1883
Krakatau
Island
today
80 The diagram in your answer booklet shows where Krakatau formed, then exploded.
Draw one arrow on each lithospheric plate to show the relative direction that both
plates are moving to produce this type of volcano. [1]
81 The diagram in your answer booklet represents an average size person standing next
to a tall building. Draw a horizontal line across the building to show the maximum
height of the tsunami waves produced by the 1883 eruption of Krakatau. [1]
82 Determine the rate the tsunamis traveled across the ocean. Label your answer with
the correct units. [1]
83 Identify the layer of the atmosphere into which the highest volcanic ash was blasted
from the Krakatau eruption. [1]
84 Explain how the volcanic ash from the Krakatau eruption caused global
temperatures to decrease. [1]
85 Describe the texture and density of pumice that allowed the blocks of pumice to float
on the ocean. [1]
P.S./E. Sci.– June ’11
[19]
PS/EARTH SCIENCE
Printed on Recycled Paper
PS/EARTH SCIENCE
FOR TEACHERS ONLY
The University of the State of New York
REGENTS HIGH SCHOOL EXAMINATION
PS–ES PHYSICAL SETTING/EARTH SCIENCE
Friday, June 17, 2011 — 1:15 to 4:15 p.m., only
SCORING KEY AND RATING GUIDE
Directions to the Teacher:
Refer to the directions on page 2 before rating student papers.
Updated information regarding the rating of this examination may be posted on the New York
State Education Department’s web site during the rating period. Check this web site at:
http://www.p12.nysed.gov/apda/ and select the link “Scoring Information” for any recently posted
information regarding this examination. This site should be checked before the
rating process for this examination begins and several times throughout the Regents Examination
period.
Part A and Part B–1
Allow 1 credit for each correct response.
Part A
1 ......3......
10 . . . . . . 3 . . . . . .
19 . . . . . . 4 . . . . . .
28 . . . . . . 2 . . . . . .
2 ......2......
11 . . . . . . 3 . . . . . .
20 . . . . . . 3 . . . . . .
29 . . . . . . 1 . . . . . .
3 ......1......
12 . . . . . . 3 . . . . . .
21 . . . . . . 3 . . . . . .
30 . . . . . . 4 . . . . . .
4 ......1......
13 . . . . . . 2 . . . . . .
22 . . . . . . 1 . . . . . .
31 . . . . . . 1 . . . . . .
5 ......4......
14 . . . . . . 4 . . . . . .
23 . . . . . . 4 . . . . . .
32 . . . . . . 2 . . . . . .
6 ......1......
15 . . . . . . 1 . . . . . .
24 . . . . . . 3 . . . . . .
33 . . . . . . 3 . . . . . .
7 ......3......
16 . . . . . . 3 . . . . . .
25 . . . . . . 1 . . . . . .
34 . . . . . . 2 . . . . . .
8 ......4......
17 . . . . . . 2 . . . . . .
26 . . . . . . 2 . . . . . .
35 . . . . . . 4 . . . . . .
9 ......2......
18 . . . . . . 4 . . . . . .
27 . . . . . . 4 . . . . . .
Part B–1
36 . . . . . . 1 . . . . . .
40 . . . . . . 2 . . . . . .
44 . . . . . . 4 . . . . . .
48 . . . . . . 1 . . . . . .
37 . . . . . . 3 . . . . . .
41 . . . . . . 4 . . . . . .
45 . . . . . . 1 . . . . . .
49 . . . . . . 2 . . . . . .
38 . . . . . . 2 . . . . . .
42 . . . . . . 4 . . . . . .
46 . . . . . . 1 . . . . . .
50 . . . . . . 4 . . . . . .
39 . . . . . . 3 . . . . . .
43 . . . . . . 2 . . . . . .
47 . . . . . . 3 . . . . . .
Directions to the Teacher
Follow the procedures below for scoring student answer papers for the Regents Examination in
Physical Setting/Earth Science. Additional information about scoring is provided in the publication
Information Booklet for Scoring Regents Examinations in the Sciences.
Do not attempt to correct the student’s work by making insertions or changes of any kind.
Allow 1 credit for each correct response.
At least two science teachers must participate in the scoring of the Part B–2 and Part C openended questions on a student’s paper. Each of these teachers should be responsible for scoring a
selected number of the open-ended questions on each answer paper. No one teacher is to score
more than approximately one-half of the open-ended questions on a student’s answer paper.
Students’ responses must be scored strictly according to the Scoring Key and Rating Guide.
For open-ended questions, credit may be allowed for responses other than those given in the rating
guide if the response is a scientifically accurate answer to the question and demonstrates adequate
knowledge as indicated by the examples in the rating guide. On the student’s separate answer sheet,
for each question, record the number of credits earned and the teacher’s assigned rater/scorer letter.
Fractional credit is not allowed. Only whole-number credit may be given for a response. If the
student gives more than one answer to a question, only the first answer should be rated. Units need
not be given when the wording of the questions allows such omissions.
For handscoring, raters should enter the scores earned in the appropriate boxes printed on the
separate answer sheet. Next, the rater should add these scores and enter the total in the space
provided. The student’s score for the Earth Science Performance Test should be recorded in the
space provided. Then the student’s raw scores on the written test and the performance test should
be converted to a scale score by using the conversion chart that will be posted on the Department’s
web site at: http://www.p12.nysed.gov/apda/ on Friday, June 17, 2011. The student’s scale score
should be entered in the box labeled “Scale Score” on the student’s answer sheet. The scale score
is the student’s final examination score.
Beginning in June 2011, schools are no longer permitted to rescore any of the openended questions on this exam after each question has been rated once, regardless of the
final exam score. Schools are required to ensure that the raw scores have been added correctly and that the resulting scale score has been determined accurately.
Because scale scores corresponding to raw scores in the conversion chart may change from one
examination to another, it is crucial that for each administration, the conversion chart provided for
that administration be used to determine the student’s final score.
P.S./E. Sci. Rating Guide–June ’11
[2]
Part B–2
Allow a maximum of 15 credits for this part.
51 [1] Allow 1 credit. Acceptable responses include, but are not limited to:
— Erie-Ontario Lowlands
— Erie-Ontario plains
— interior lowlands
52 [1] Allow 1 credit. Acceptable responses include, but are not limited to:
—S
— south
— SE
— SW
53 [1] Allow 1 credit for transpiration or sublimation.
54 [1] Allow 1 credit. Acceptable responses include, but are not limited to:
— a decrease in slope
— increased vegetation
— increased infiltration
— a more permeable surface
55 [1] Allow 1 credit for 2260 J.
56 [1] Allow 1 credit for cA or cP.
Note: Do not allow credit if the letters are reversed. Allow credit whether or not capital letters are
used.
P.S./E. Sci. Rating Guide–June ’11
[3]
57 [1] Allow 1 credit. Acceptable responses include, but are not limited to:
— Reykjavik has a maritime climate.
— The ocean around Iceland moderates Reykjavik’s climate.
— Reykjavik is located near a large body of water which heats and cools more slowly
than inland locations.
— Yakutsk is located farther inland.
58 [1] Allow 1 credit. Acceptable responses include, but are not limited to:
— Yakutsk receives less precipitation during the year than Reykjavik.
— Yakutsk receives more of its precipitation in summer than in winter.
— Yakutsk receives a higher percentage of precipitation as snowfall.
59 [1] Allow 1 credit for two correct responses. Acceptable responses include, but are not limited to:
Warm: Norwegian Current or North Atlantic Current
Cool:
East Greenland Current
60 [1] Allow 1 credit for Polaris or North Star.
61 [1] Allow 1 credit for 45°.
62 [1] Allow 1 credit. Acceptable responses include, but are not limited to:
— rotation
— Earth spinning on its axis
63 [1] Allow 1 credit.
Example of a 1-credit response:
Star
Luminosity Temperature (K)
Classification
Merak
Dubhe
giant
64 [1] Allow 1 credit for the Milky Way.
P.S./E. Sci. Rating Guide–June ’11
[4]
65 [1] Allow 1 credit if the center of the X is drawn within the shaded area shown.
Note: It is recommended that an overlay of the same scale as the student answer booklet be used to
ensure reliability in rating.
P.S./E. Sci. Rating Guide–June ’11
[5]
Part C
Allow a maximum of 20 credits for this part.
66 [1] Allow 1 credit if the center of the X is drawn anywhere on the orbit of Neptune ± 2 mm.
67 [1] Allow 1 credit if all bars are correctly graphed ± 100 km.
Note: It is recommended that an overlay of the same scale as the student answer booklet be used to
ensure reliability in rating.
Example of a 1-credit graph:
68 [1] Allow 1 credit for Sedna and acceptable evidence. Acceptable evidence includes, but is not
limited to:
— Sedna is the farthest from the Sun at its closest approach.
— Sedna travels the farthest away from the Sun.
— Its average distance from the Sun is greatest.
P.S./E. Sci. Rating Guide–June ’11
[6]
69 [1] Allow 1 credit if all four weather variables are correctly located in the proper format.
Note: Allow credit for a wind-speed feather drawn at the end, and on either side, of the
wind-direction line.
Example of a 1-credit response:
70 [1] Allow 1 credit for a correctly drawn 32°F isotherm. The line must pass through the points for 32°F.
If additional isotherms are drawn, all isotherms must be correct to receive credit.
Note: Allow credit if the isoline extends to the edge of the map.
Example of a 1-credit response:
P.S./E. Sci. Rating Guide–June ’11
[7]
71 [1] Allow 1 credit for the placement of the correct symbol facing in the correct direction for both fronts.
Note: Allow credit even if symbols are not shaded in.
Example of a 1-credit response:
72 [1] Allow 1 credit. Acceptable responses include, but are not limited to:
— Winds are moving counterclockwise.
— Winds are moving inward toward the low-pressure center.
— in and counterclockwise
73 [1] Allow 1 credit. Acceptable responses include, but are not limited to:
— Prevailing winds blow toward the northeast.
— New York State is located in the southwesterly wind belt.
— The jet stream moved the low-pressure system in that direction.
— prevailing winds
— Winds are moving the system northeast.
P.S./E. Sci. Rating Guide–June ’11
[8]
74 [1] Allow 1 credit. Acceptable responses include, but are not limited to:
— Residents should have purchased extra supplies, such as food and water.
— Residents should have obtained battery-powered radios, flashlights, and/or candles.
— Rock salt or de-icing pellets should have been obtained to clear ice from sidewalks and driveways.
— Check to make sure enough fuel for heat is on hand to last several days.
— People who have emergency generators should check to make sure they are working properly.
75 [1] Allow 1 credit. Acceptable responses include, but are not limited to:
— The intrusion has not been broken and offset.
— The igneous rhyolite cuts across the fault.
76 [1] Allow 1 credit for Devonian Period.
77 [1] Allow 1 credit for the correct crystal size and an acceptable explanation. Acceptable responses
include, but are not limited to:
Crystal size:
— fine grained
— less than 1-mm crystal size
Explanation:
— The magma cooled rapidly.
— It cooled over a short period of time.
78 [1] Allow 1 credit for quartzite or hornfels.
79 [1] Allow 1 credit. Acceptable responses include, but are not limited to:
— The valley is U-shaped.
— The valley has grooved, scratched, and polished bedrock.
P.S./E. Sci. Rating Guide–June ’11
[9]
80 [1] Allow 1 credit if both arrows show the plates coming toward each other.
Example of a 1-credit response:
81 [1] Allow 1 credit for correctly indicating the maximum height of the tsunami wave on the building,
within the shaded region shown below.
Note: It is recommended that an overlay of the same scale as the student answer booklet be used to
ensure reliability in rating.
P.S./E. Sci. Rating Guide–June ’11
[10]
82 [1] Allow 1 credit for 530 and the correct units. Acceptable units include, but are not limited to:
— kilometers/hour
— km/h
Note: Allow credit for a correct calculation expressed in other acceptable units, i.e., 8.8 kilometers/minute.
83 [1] Allow 1 credit for stratosphere.
84 [1] Allow 1 credit. Acceptable responses include, but are not limited to:
— The ash particles blocked out the Sun’s rays.
— Dust particles reflect the Sun’s rays.
— Less insolation reached Earth’s surface.
85 [1] Allow 1 credit if the texture and density are correct. Acceptable responses include, but are
not limited to:
Texture:
— vesicular
— filled with gas pockets
Note: Do not accept glassy, only.
Density:
— low density
— density less than 1 g/cm3
— less dense than water
P.S./E. Sci. Rating Guide–June ’11
[11]
Regents Examination in Physical Setting/Earth Science
June 2011
Chart for Converting Total Test Raw Scores to
Final Examination Scores (Scale Scores)
The Chart for Determining the Final Examination Score for the June 2011
Regents Examination in Physical Setting/Earth Science will be posted on
the Department’s web site at: http://www.p12.nysed.gov/apda/ on Friday,
June 17, 2011. Conversion charts provided for previous administrations of
the Regents Examination in Physical Setting/Earth Science must NOT be
used to determine students’ final scores for this administration.
Online Submission of Teacher Evaluations of the Test to the Department
Suggestions and feedback from teachers provide an important contribution to the test
development process. The Department provides an online evaluation form for State
assessments. It contains spaces for teachers to respond to several specific questions and to
make suggestions. Instructions for completing the evaluation form are as follows:
1. Go to http://www.forms2.nysed.gov/emsc/osa/exameval/reexameval.cfm.
2. Select the test title.
3. Complete the required demographic fields.
4. Complete each evaluation question and provide comments in the space provided.
5. Click the SUBMIT button at the bottom of the page to submit the completed form.
P.S./E. Sci. Rating Guide–June ’11
[12]
Map to Core Curriculum
June 2011 Physical Setting/Earth Science
Question Numbers
Key Ideas/Performance Indicators
Part A
Part B
Part C
Standard 1
Math Key Idea 1
Math Key Idea 2
20
13, 16, 28, 35
Math Key Idea 3
Science Inquiry Key Idea 1
33
2, 4, 5, 9, 10, 14,
22, 23, 27, 30, 31,
35
42, 55, 61
37, 44, 50, 58, 63,
65
38, 41, 43, 46, 49,
57, 62
67, 81, 82
66, 83
68
71, 73, 75, 77, 79,
80, 84, 85
Science Inquiry Key Idea 2
Science Inquiry Key Idea 3
Engineering Design Key Idea 1
Standard 2
Key Idea 1
Key Idea 2
Key Idea 3
17, 21
Key Idea 1
14, 24, 25, 26, 30,
32, 34
2, 6, 7, 8, 10, 11,
12, 15, 17, 18, 19,
21, 23, 25, 28, 29,
30, 31, 32, 34, 35
74
Standard 6
Key Idea 2
Key Idea 3
Key Idea 4
Key Idea 5
40, 44, 45, 49, 50,
52, 53, 64
36, 37, 38, 39, 40,
41, 42, 43, 44, 46,
47, 48, 51, 52, 53,
54, 56, 57, 58, 59,
60, 61, 63, 65
29, 35
68, 71, 77, 79, 80,
84
66, 67, 69, 70, 71,
72, 75, 76, 78, 79,
80, 81, 83, 85
81
6, 11, 21, 24, 25,
26, 33
45, 47, 48, 52, 58,
61, 65
70, 71, 72, 73
Key Idea 6
Standard 7
Key Idea 1
Key Idea 2
22
Key Idea 1
1, 2, 3, 4, 5, 6, 8,
9, 10, 11, 13, 14,
15, 29, 30, 31
47, 48, 49, 50, 53,
54, 55, 60, 61, 62,
63, 64, 65
66, 67, 68, 75, 76
Key Idea 2
12, 16, 17, 18, 19,
20, 21, 22, 23, 24,
25, 26, 27, 28, 32,
33, 34, 35
36, 37, 38, 39, 40,
44, 45, 46, 51, 52,
56, 57, 58, 59
69, 70, 71, 72, 73,
74, 79, 80, 81, 82,
83, 84
Key Idea 3
7
41, 42, 43
77, 78, 85
ESRT 2010 Edition (Revised)
6, 7, 8, 9, 10, 12,
13, 15, 16, 17, 18,
19, 20, 27, 28, 29,
31
74
Standard 4
Reference Tables
P.S./E. Sci. Rating Guide–June ’11
[13]
36, 37, 38, 39, 40,
42, 43, 51, 55, 56,
59, 63
68, 69, 71, 73, 76,
77, 78, 80, 81, 82,
83, 85
The State Education Department / The University of the State of New York
Regents Examination in Physical Setting/Earth Science – June 2011
Chart for Converting Total Test Raw Scores to Final Examination Scores (Scale Scores)
(Not to be used for the Braille Edition)
To determine the student’s final score, locate the student’s Total Performance Test Score across the top of the chart and the Total Written Test Score down the side of
the chart. The point where the two scores intersect is the student’s final examination score. For example, a student receiving a Total Performance Test Score of 10 and
Total Written Test Score of 71 would receive a final examination score of 90.
Total Written Test Score
Total Performance Test Score
85
84
83
82
81
80
79
78
77
76
75
74
73
72
71
70
69
68
67
66
65
64
63
62
61
60
59
58
57
56
55
54
53
52
51
50
49
48
47
46
45
44
16
100
99
99
98
98
97
97
97
96
95
94
94
93
92
92
92
91
90
89
89
88
87
86
86
85
85
84
83
82
81
80
80
79
78
77
76
75
75
74
73
72
71
15
99
99
99
98
98
97
96
96
95
95
94
94
93
92
92
91
90
90
89
89
88
87
86
85
84
84
84
83
82
81
80
79
78
78
77
76
75
74
73
73
72
71
14
99
98
98
98
98
97
96
96
95
94
93
93
92
92
92
91
90
89
88
88
87
87
86
85
84
84
83
82
81
81
80
79
78
77
76
75
75
74
73
72
71
70
13
99
98
98
97
97
96
95
95
95
94
93
93
92
91
91
90
89
89
88
88
87
86
85
84
84
84
83
82
81
80
79
78
78
77
76
75
74
73
72
72
71
70
Physical Setting/Earth Science - June 2011
12
98
98
98
97
97
96
95
95
94
93
92
92
92
91
91
90
89
88
87
87
86
86
85
84
83
83
82
81
81
80
79
78
77
76
75
75
74
73
72
71
70
69
11
98
97
97
96
96
95
94
94
94
93
92
92
91
90
90
89
88
88
87
87
86
85
84
83
82
82
82
81
80
79
78
77
77
76
75
74
73
72
71
71
70
69
10
97
96
96
95
95
95
94
94
93
92
91
91
90
90
90
89
88
87
86
86
85
84
84
83
82
82
81
80
79
78
78
77
76
75
74
73
73
72
71
70
69
68
9
96
96
96
95
95
94
93
93
92
91
90
90
90
89
89
88
87
86
85
85
85
84
83
82
81
81
80
79
79
78
77
76
75
74
73
73
72
71
70
69
68
68
1 of 2
8
96
95
95
94
94
93
92
92
91
91
90
90
89
88
88
87
86
85
85
85
84
83
82
81
80
80
80
79
78
77
76
75
74
74
73
72
71
70
69
68
68
67
7
95
94
94
93
93
92
91
91
91
90
89
89
88
87
87
86
85
85
84
84
83
82
81
80
79
79
79
78
77
76
75
74
74
73
72
71
70
69
68
68
67
66
6
94
93
93
92
92
91
90
90
89
89
88
88
87
86
86
85
84
84
83
83
82
81
80
79
78
78
78
77
76
75
74
73
72
72
71
70
69
68
67
67
66
65
5
93
92
92
91
91
90
89
89
88
88
87
87
86
85
85
84
83
82
82
82
81
80
79
78
77
77
77
76
75
74
73
72
71
71
70
69
68
67
66
65
65
64
4
91
91
91
90
90
89
88
88
87
86
86
86
85
84
84
83
82
81
80
80
80
79
78
77
76
76
75
74
74
73
72
71
70
69
69
68
67
66
65
64
63
63
3
90
89
89
88
88
88
87
87
86
85
84
84
83
82
82
82
81
80
79
79
78
77
77
76
75
75
74
73
72
71
71
70
69
68
67
66
65
65
64
63
62
61
2
88
88
88
87
87
86
85
85
84
83
83
83
82
81
81
80
79
78
77
77
77
76
75
74
73
73
72
71
71
70
69
68
67
66
66
65
64
63
62
61
60
60
1
87
86
86
85
85
84
83
83
83
82
81
81
80
79
79
78
77
77
76
76
75
74
73
72
72
72
71
70
69
68
67
66
66
65
64
63
62
61
60
60
59
58
0
85
84
84
83
83
82
82
82
81
80
79
79
78
77
77
77
76
75
74
74
73
72
71
71
70
70
69
68
67
66
65
65
64
63
62
61
60
60
59
58
57
56
http://www.p12.nysed.gov/apda/
Final Examination Scores
June 2011 Examination in Physical Setting/Earth Science – continued
Total Performance Test Score
43
42
41
40
39
38
37
36
35
34
33
32
31
30
29
28
27
26
25
24
23
22
21
20
19
18
17
16
15
14
13
12
11
10
9
8
7
6
5
4
3
2
1
0
16
70
69
69
68
66
65
64
63
63
61
60
59
58
57
56
55
53
52
51
50
49
47
46
45
44
42
41
40
38
37
35
34
33
31
29
28
27
25
24
22
20
18
17
15
15
70
69
68
67
66
65
64
63
62
61
60
59
58
56
56
55
53
52
50
50
49
47
46
44
44
42
40
39
38
37
35
33
33
31
29
27
27
25
23
22
20
18
16
15
14
70
69
68
67
65
64
64
63
62
60
59
58
58
56
55
54
53
52
50
49
48
47
46
44
43
41
40
39
37
36
35
33
32
30
29
27
26
24
23
21
19
18
16
14
13
69
68
67
67
65
64
63
62
61
60
59
58
57
55
55
54
52
51
50
49
48
46
45
44
43
41
39
38
37
36
34
33
32
30
28
27
26
24
22
21
19
17
16
14
Physical Setting/Earth Science - June 2011
12
69
68
67
66
64
64
63
62
61
59
58
58
57
55
54
53
52
51
49
48
47
46
45
43
42
41
39
38
36
35
34
32
31
30
28
26
25
24
22
20
18
17
15
13
11
68
67
66
65
64
63
62
61
60
59
58
57
56
54
54
53
51
50
48
48
47
45
44
43
42
40
38
37
36
35
33
31
31
29
27
26
25
23
21
20
18
16
14
13
10
67
67
66
65
63
62
61
61
60
58
57
56
56
54
53
52
50
50
48
47
46
44
44
42
41
39
38
37
35
34
33
31
30
28
27
25
24
22
21
19
17
16
14
12
9
67
66
65
64
62
62
61
60
59
57
56
56
55
53
52
51
50
49
47
46
45
44
43
41
40
39
37
36
34
34
32
30
29
28
26
24
23
22
20
18
17
15
13
11
2 of 2
8
66
65
64
63
62
61
60
59
58
57
56
55
54
52
51
51
49
48
46
46
45
43
42
40
40
38
36
35
34
33
31
29
29
27
25
23
23
21
19
17
16
14
12
11
7
65
64
63
62
61
60
59
58
57
56
55
54
53
51
51
50
48
47
45
45
44
42
41
40
39
37
35
34
33
32
30
28
28
26
24
23
22
20
18
17
15
13
11
10
6
64
63
62
61
60
59
58
57
56
55
54
53
52
50
50
49
47
46
44
44
43
41
40
38
38
36
34
33
32
31
29
27
27
25
23
21
21
19
17
16
14
12
10
9
5
63
62
61
60
59
58
57
56
55
54
53
52
51
49
48
48
46
45
43
43
42
40
39
37
37
35
33
32
31
30
28
26
26
24
22
20
20
18
16
14
13
11
9
8
4
62
61
60
59
57
57
56
55
54
52
52
51
50
48
47
46
45
44
42
41
40
39
38
36
35
34
32
31
29
29
27
25
24
23
21
19
18
17
15
13
12
10
8
6
3
60
60
59
58
56
55
54
54
53
51
50
49
48
47
46
45
43
43
41
40
39
37
37
35
34
32
31
30
28
27
26
24
23
21
20
18
17
15
14
12
10
9
7
5
2
59
58
57
56
54
54
53
52
51
49
49
48
47
45
44
43
42
41
39
38
37
36
35
33
32
31
29
28
26
26
24
22
21
20
18
16
15
14
12
10
9
7
5
3
1
57
56
55
55
53
52
51
50
49
48
47
46
45
43
43
42
40
39
38
37
36
34
33
32
31
29
27
26
25
24
22
21
20
18
16
15
14
12
10
9
7
5
4
2
0
55
54
54
53
51
50
49
48
48
46
45
44
43
42
41
40
38
37
36
35
34
32
31
30
29
27
26
25
23
22
20
19
18
16
14
13
12
10
9
7
5
3
2
0
http://www.p12.nysed.gov/apda/


© Copyright 2026