
Document 299275
This document is not an API Standard; it is under consideration within an API technical committee but has not received all approvals required to become an API Standard. It shall not be reproduced or circulated or quoted, in whole or in part, outside of API committee activities except with the approval of the Chairman of the committee having jurisdiction and API staff. Copyright API. All rights reserved. API MANUAL OF PETROLEUM MEASUREMENT STANDARDS Chapter 22 – Testing Protocols Section 6 – Gas Chromatographs Working Group Ballot Draft, August 2014 API Chapter 22.6 P a g e | i This document is not an API Standard; it is under consideration within an API technical committee but has not received all approvals required to become an API Standard. It shall not be reproduced or circulated or quoted, in whole or in part, outside of API committee activities except with the approval of the Chairman of the committee having jurisdiction and API staff. Copyright API. All rights reserved. TABLE OF CONTENTS Introduction........................................................................................................................................1 1 Scope.............................................................................................................................................2 2 NormativeReferences............................................................................................................2 3 TerminologyandDefinitions...............................................................................................2 4 SymbolsandAbbreviations................................................................................................10 4.1 4.2 Symbols ........................................................................................................................ 10 Acronyms and Abbreviations ........................................................................................ 10 5 SafetyConsiderations...........................................................................................................11 6 ParameterVariationsAffectingDevicePerformance...............................................11 6.1 6.2 6.3 6.4 7 7.1 7.2 7.3 7.4 7.5 7.6 7.7 7.8 Selection of Relevant Test Parameters ........................................................................ 11 Mandatory Baseline (Ideal Condition) Testing .............................................................. 11 Mandatory Non-Ideal Condition Testing ....................................................................... 12 Non-Mandatory Special Testing ................................................................................... 13 PerformanceTests.................................................................................................................14 Test Conditions ............................................................................................................. 14 Test Installation ............................................................................................................ 15 Test Results .................................................................................................................. 18 Mandatory Baseline (Ideal Condition) Testing .............................................................. 20 Mandatory Non-Ideal Condition Testing ....................................................................... 20 Non-Mandatory Special Testing ................................................................................... 22 Testing Documentation ................................................................................................. 24 Testing Procedures ...................................................................................................... 24 8 TestFacilityRequirements.................................................................................................32 9 UncertaintyAnalysisandCalculation.............................................................................33 9.1 9.2 9.3 Types of Uncertainty Calculations ................................................................................ 33 How to Calculate Uncertainty ....................................................................................... 36 Presentation of Uncertainty .......................................................................................... 45 10 TestReport...............................................................................................................................46 Bibliography.....................................................................................................................................50 Working Group Ballot Draft, August 2014 API Chapter 22.6 P a g e | ii This document is not an API Standard; it is under consideration within an API technical committee but has not received all approvals required to become an API Standard. It shall not be reproduced or circulated or quoted, in whole or in part, outside of API committee activities except with the approval of the Chairman of the committee having jurisdiction and API staff. Copyright API. All rights reserved. Introduction Gas chromatographs (GCs) with improved design and performance claims are regularly introduced to the natural gas industry. Natural gas companies that purchase these GCs often have to debug these units, eliminate problems, and evaluate field performance characteristics and specifications of the units at their own expense. Often several companies form a consortium to conduct performance verification tests on such devices, while individual companies may also perform their own tests that unnecessarily duplicate effort. The need for a standardized testing protocol to assess the performance of GC technology that will allow test results to be recognized by regulators and accepted by the user community is recognized by the natural gas industry. Test results published in a specified format and obtained by following an industry-accepted uniform testing protocol will benefit the natural gas industry and save the industry from duplication of effort. To meet this need, this general GC performance test protocol specifies the scope and reporting requirements of GC tests for repeatability, reproducibility, and response. This document specifies requirements for tests over a range of gas compositions, tests over a range of operating conditions, and tests with variations in other external parameters that may influence GC performance. Many existing industry standards and accepted practices for the analysis of natural gas by gas chromatography were reviewed for the development of this protocol. Applicable standards at the time this document was written are listed in the Bibliography. It is not the intent of this protocol to replace these standards, but to allow those who perform the tests to incorporate these standards into the testing process where possible. This protocol does not specify acceptance criteria for GCs undergoing tests, nor does it permit those who perform the tests to set acceptance criteria within the test procedures or judge the usefulness of a GC for a particular application. The end-users of test reports created using this protocol should choose acceptance criteria for GCs based on their individual applications and requirements. Working Group Ballot Draft, August 2014 API Chapter 22.6 P a g e | 1 This document is not an API Standard; it is under consideration within an API technical committee but has not received all approvals required to become an API Standard. It shall not be reproduced or circulated or quoted, in whole or in part, outside of API committee activities except with the approval of the Chairman of the committee having jurisdiction and API staff. Copyright API. All rights reserved. TESTING PROTOCOL FOR GAS CHROMATOGRAPHS 1 Scope This standard is a general GC performance test protocol. It specifies the scope and reporting requirements of GC tests for repeatability, reproducibility, and response linearity. The protocol specifies requirements for tests over a range of gas compositions, tests over a range of environmental conditions, and long-term performance tests. 2 Normative References The following referenced documents are indispensable for the application of this document. For dated references, only the edition cited applies. For undated references, the latest edition of the referenced document (including any amendments) applies. API Manual of Petroleum Measurement Standards, Chapter 14 – Natural Gas Fluids Measurements, Section 1 – Collecting and Handling of Natural Gas Samples for Custody Transfer, American Petroleum Institute, Washington D.C., USA, 6th Edition, February 2006 GPA Standard 2198, Selection, Preparation, Validation, Care and Storage of Natural Gas and Natural Gas Liquids Reference Standard Blends, Gas Processors Association, Tulsa, Oklahoma, USA. 3 Terminology and Definitions For the purposes of this document, the following definitions apply. If the definition has been drawn from another document, its source is indicated in parentheses after the term or definition itself. 3.1 acceptance criteria Defined upper and lower limits for accepting the value of a process variable which is being monitored. 3.2 ambient conditions The conditions (pressure, temperature, humidity, etc.) of the medium surrounding an object such as the case of a meter, instrument, transducer, etc. (API MPMS Chapter 1) 3.3 ambient pressure The pressure of the surrounding medium, such as of the liquid in a pipeline or of the atmosphere. (API MPMS Chapter 1) 3.4 ambient temperature The temperature of the surrounding medium, such as the atmosphere surrounding an object being tested. 3.5 atmospheric pressure The pressure exerted by the weight of the atmosphere. At sea level, the pressure is approximately 14.7 pounds per square inch (101 kilopascals), often referred to as 1 atmosphere, atmospheric pressure, or pressure of one atmosphere. (API MPMS Chapter 1) Working Group Ballot Draft, August 2014 API Chapter 22.6 P a g e | 2 This document is not an API Standard; it is under consideration within an API technical committee but has not received all approvals required to become an API Standard. It shall not be reproduced or circulated or quoted, in whole or in part, outside of API committee activities except with the approval of the Chairman of the committee having jurisdiction and API staff. Copyright API. All rights reserved. 3.6 barometric pressure Ambient pressure in an absolute pressure scale monitored or displayed by a barometer. 3.7 bias Any influence on a result that produces an incorrect approximation of the true value of the variable being measured. Bias is the result of a predictable systematic error. (API MPMS Chapter 1) 3.8 calibration The process or procedure of adjusting an instrument, such as a meter, so that its indication or registration is in satisfactorily close agreement with a reference standard. (API MPMS Chapter 1) 3.9 calibration gas A gas blend of sufficient stability and homogeneity whose composition is properly established for use in the calibration of a measuring instrument. (based on ISO 7504) 3.10 carrier gas A pure gas introduced so as to transport a sample through the separation unit of a gas chromatograph for analytical purposes. Note: Typical carrier gases are hydrogen, nitrogen, helium and argon. (ISO 14532) 3.11 certificate A document issued by a nationally or internationally recognized facility or regulatory agency attesting to a specific property or performance. 3.12 certificate of analysis A document that indicates one or more properties of a material based on the test result of an analysis or the preparation of the material in accordance with a defined procedure. Note 1: A certificate of analysis may be used to convey a laboratory test result, demonstrate conformance with a product specification, or provide information required for the certification of a reference material. Note 2: Industry standards or regulation may dictate what additional information is to be contained in a certificate of analysis for it to be valid for its intended use. 3.13 certified composition A list of component concentrations in a gas blend that is verified and traceable to nationally recognized standards of weights and measures. 3.14 chromatogram A graph relating concentration (or mass per unit time) of solute leaving a chromatographic column, plotted against time, and taking the form of a series of ever broadening peaks. 3.15 chromatographic method, gas A method of analysis by which the components of a gas blend are separated using gas chromatography. (based on ISO 14532-2, Subsection 2.2.2.1) 3.16 component concentration The presence of a component in a mixture expressed in percentage or as a fraction of the total mixture. Working Group Ballot Draft, August 2014 API Chapter 22.6 P a g e | 3 This document is not an API Standard; it is under consideration within an API technical committee but has not received all approvals required to become an API Standard. It shall not be reproduced or circulated or quoted, in whole or in part, outside of API committee activities except with the approval of the Chairman of the committee having jurisdiction and API staff. Copyright API. All rights reserved. 3.17 composition Property of a gas blend given by the identity and the concentration of each component. (based on ISO 7504) Note: The term “content” is used as a generic term for the qualitative description of the composition of a gas blend without specifying any numerical values. In quantitative expressions of a gas blend composition, the selected quantity of composition, e.g. the mole fraction or the mass concentration, is used in conjunction with the name or the chemical formula of the component. 3.18 compressibility factor In reference to gases, a factor calculated by taking the ratio of the actual volume of a given mass of gas at a specified temperature and pressure to its volume calculated from the ideal gas law at the same conditions. (ASTM D4150) 3.19 concentration A reference to any of a group of four quantities characterizing the composition of a mixture with respect to the volume of the mixture. The four quantities are mass concentration (mass per unit volume), amount concentration (moles per unit volume), volume concentration (volume per unit total volume) and number concentration (count per unit volume). 3.20 condensation The process by which a gas or vapor changes to its liquid phase. 3.21 confidence interval The range or interval within which the true value is expected to lie with a stated degree of confidence. (API MPMS Chapter 13.1) 3.22 confidence level The probability that the true value will lie between the specified confidence limits, assuming negligible systematic error. This is generally expressed as a percentage, e.g. 95%. (ISO 4006) 3.23 contaminant A substance that makes a gas blend or another substance impure or unclean through contact or mixing. 3.24 cylinder, gas A tank or pressure vessel used to store gases at pressures above atmospheric pressure. 3.25 dead band In reference to process instrumentation, the range through which an input signal may be varied, upon reversal of direction, without initiating an observable change in output signal. (ANSI/ISA S51.1) 3.26 dead volume The term ‘dead-volume’ refers to volumes within a chromatographic system which are not swept by the mobile phase that is flowing through most of the extra-column volumes. (IUPAC) 3.27 density The density of a quantity of a homogeneous substance is the ratio of its mass to its volume. The density varies as the temperature changes and is therefore generally expressed as the mass per unit of volume at a specified temperature. (API MPMS Chapter 1) Working Group Ballot Draft, August 2014 API Chapter 22.6 P a g e | 4 This document is not an API Standard; it is under consideration within an API technical committee but has not received all approvals required to become an API Standard. It shall not be reproduced or circulated or quoted, in whole or in part, outside of API committee activities except with the approval of the Chairman of the committee having jurisdiction and API staff. Copyright API. All rights reserved. 3.28 elution time The time after injection at which a component of an analyzed sample elutes from a chromatographic column and is sensed by the detector on a gas chromatograph. 3.29 environmental chamber An enclosure used to test the effects of specified environmental conditions on biological items, industrial products, materials, and electronic devices and components. 3.30 environmental conditions External conditions (such as shock, vibration, and temperature) to which a meter, transducer, instrument, etc., may be exposed during shipping, storage, handling, and operation. (API MPMS Chapter 1) 3.31 error, measurement The discrepancy between the result of the measurement and the value of the quantity measured. The value of the quantity measured is a comparison value equal, according to the particular case, to the following: (a) the true value of the quantity, (b) the accepted true value, or (c) the arithmetic mean of the results of a series of measurements. (API MPMS Chapter 1) Note: Definition (b) applies to the term as used in this document. 3.32 gas chromatograph An analytical instrument that separates mixtures of substances into identifiable components by means of chromatography. Separation is achieved by introducing a finite volume of a sample into a continuous inert gas flow (a carrier gas) that moves through one or more separation columns. The separation columns make use of differences in the adsorption behavior of the sample components onto a stationary phase, causing the components to move through each column at different rates. The components then leave the column at different times, and their amounts are measured individually by a detector. 3.33 heat trace A heating system consisting of a heating medium run in physical contact with process equipment or piping, externally applied and normally covered by insulation, that is used to maintain or raise the temperature of contents in piping, tanks and associated equipment. Note: Typical heating media include steam tubing and electric trace heater cables, pads or panels. 3.34 heating value, gross The quantity of heat released by the complete combustion of a material at constant pressure, the water vapor produced being condensed to liquid in equilibrium with its own vapor under the specified reference conditions, and the latent heat of condensation being included in the heat content. Also known as superior heating value. Note 1: The term in current use is "heating value" or "specific energy." Historically obsolete synonyms are "heat of combustion" and "calorific value". Note 2: Heating value may be expressed on a mass, molar or volume basis. 3.35 heavy hydrocarbons Hydrocarbon components in a transmission-quality gas that tend to condense at operating pressures and temperatures. Typically, hexanes and heavier hydrocarbon gas components (C6+) are considered to be heavy hydrocarbon gases. Working Group Ballot Draft, August 2014 API Chapter 22.6 P a g e | 5 This document is not an API Standard; it is under consideration within an API technical committee but has not received all approvals required to become an API Standard. It shall not be reproduced or circulated or quoted, in whole or in part, outside of API committee activities except with the approval of the Chairman of the committee having jurisdiction and API staff. Copyright API. All rights reserved. 3.36 hydrocarbon dew point A temperature at a given pressure at which hydrocarbon vapor condensation begins. (API MPMS Chapter 14.1) 3.37 interlaboratory comparison Organization, performance and evaluation of measurements or tests on the same or similar items by two or more laboratories in accordance with predetermined conditions. 3.38 limit of detection The lowest analyte concentration to be reliably distinguished from the blank response or baseline response. It is the lowest concentration of a measurand reliably measured by an analytical procedure. 3.39 linearity The degree to which a response function describing the input-output relationship between an analyzed quantity and the signal produced by the analyzing device can be described by a straight line. 3.40 linear range Maximum and minimum limits of the output or error of a device within which the calibration curve fits over a stated monitoring range of the device. 3.41 manifold A pipe, tube, or chamber having multiple apertures for making connections. 3.42 Maximum Allowable Operating Pressure The wall strength of a pressurized gas cylinder such as a pipeline or storage tank; an indication of the pressure that the walls may safely hold in normal operation. 3.43 measurand A physical quantity, property, or condition that has been or is to be measured. (API MPMS Chapter 1) 3.44 nominal Describes a value assigned for the purpose of convenient designation; existing in name only. (API MPMS Chapter 1) 3.45 normalize To adjust the representation of a quantity so that the representation lies within a prescribed range. Analyzed gas compositions are customarily normalized so that the total of all component concentrations equals 100%. 3.46 operating conditions See environmental conditions. 3.47 outlier A result that differs considerably from the main body of results in a set. (API MPMS Chapter 1) 3.48 parameters The values that characterize and summarize the essential features of measurements. (API MPMS Chapter 1) Working Group Ballot Draft, August 2014 API Chapter 22.6 P a g e | 6 This document is not an API Standard; it is under consideration within an API technical committee but has not received all approvals required to become an API Standard. It shall not be reproduced or circulated or quoted, in whole or in part, outside of API committee activities except with the approval of the Chairman of the committee having jurisdiction and API staff. Copyright API. All rights reserved. 3.49 peak area The area enclosed between the peak and the baseline on a chromatogram. 3.50 peak integration method Method by which the area underneath each peak in a chromatogram is quantified, so as to identify component concentrations in the sample. 3.51 power supply A component of a system that provides a source of electrical energy at one or more voltages to other components of the system or to external devices associated with the system. 3.52 pressure regulator A valve that automatically limits the flow of a liquid or gas to a certain pressure. 3.53 purge To eliminate impure or undesirable substances. 3.54 purge loop A part of a sample collection system used to purge or flush unwanted samples from the system. Purge loops may be built to increase the flow rate of a sample stream through the system. 3.55 relative density Quotient of the gas density and the density of dry air of standard composition, specified at the same state conditions. (ISO 7504) 3.56 relative humidity A term used to describe the amount of water vapor in a mixture of air and water vapor. 3.57 repeatability (a) Metering – The closeness of the agreement between the results of successive measurement of the same quantity carried out by the same method, by the same person, with the same measuring instrument at the same location, over a short period of time. (b) Laboratory test method – The difference between successive test results obtained by the same operator, with the same apparatus, under certain operating conditions, on identical test materials using the same test method. Note: This definition applies to the term as used in this document. (API MPMS Chapter 1) 3.58 resistance temperature detector A temperature measuring device that operates on the principle of a change in electrical resistance in wire as a function of temperature. (API MPMS Chapter 7.3) 3.59 resolution, measurement The smallest change in the quantity measured to which the instrument will react with an observable change in an analog or digital indication. (API MPMS Chapter 1) 3.60 response factor The ratio between the quantity of an analyte and the peak area or peak height of a component peak in a chromatogram. Working Group Ballot Draft, August 2014 API Chapter 22.6 P a g e | 7 This document is not an API Standard; it is under consideration within an API technical committee but has not received all approvals required to become an API Standard. It shall not be reproduced or circulated or quoted, in whole or in part, outside of API committee activities except with the approval of the Chairman of the committee having jurisdiction and API staff. Copyright API. All rights reserved. 3.61 response function A function describing the relationship between the quantity of an analyte and the signal produced in a GC by the analyte. Response functions may be a constant ratio (a single response factor) or a non-linear relationship that produces different response factors for different analyte quantities. 3.62 sample A portion extracted from a total volume that may or may not contain the constituents in the same proportions that are present in that total volume. (API MPMS Chapter 1) 3.63 sample line Tubing used to transport continuous or intermittent samples from its source to one or more analyzers. 3.64 sample probe A device extending through the meter tube or piping into the stream to be sampled. (API MPMS Chapter 14.1) 3.65 sampling All the steps required to obtain a sample that is representative of the contents of any pipe, tank, or other vessel and to place that sample in a container from which a representative test specimen can be taken for analysis. (API MPMS Chapter 1) 3.66 sampling system System capable of extracting a representative sample from the fluid flowing in a pipe. Note: This system can be automatic or manual, continuous or intermittent. (ISO 1998-6) 3.67 separation column A long capillary tube packed with material that isolates individual components, elements and/or compounds of a mixture having different physical or chemical properties. Separation columns in GCs serve to separate components in a sample stream so that they can be identified and quantified. 3.68 significant digits The number of meaningful digits that is displayed or recorded in a measurement. The last digit (and only the last digit) in a measurement is an estimate. 3.69 stability The ability of a measuring instrument to maintain its accuracy over a long period of time. (API MPMS Chapter 1) 3.70 standard, API As per API Policy 104, a prescribed set of voluntary rules, conditions, or requirements concerned with the definition of terms; classification of components; delineation of procedures; specification of dimensions; construction criteria, materials, performance, design, or operations; measurement of quality and quantity in describing materials, products, systems, services, or practices; or descriptions of fit and measurement of size. (API MPMS Chapter 1) 3.71 standard deviation, sample For a series of n measurements of the same measurand, the parameter characterizing the dispersion of the results and given by the formula Working Group Ballot Draft, August 2014 API Chapter 22.6 P a g e | 8 This document is not an API Standard; it is under consideration within an API technical committee but has not received all approvals required to become an API Standard. It shall not be reproduced or circulated or quoted, in whole or in part, outside of API committee activities except with the approval of the Chairman of the committee having jurisdiction and API staff. Copyright API. All rights reserved. ∑ ̅ 1 where xi is the result of the i-th measurement and ̅ is the arithmetic mean of the n results considered. Note: The experimental standard deviation should not be confused with the population standard deviation of a population of size N and of mean m. (ISO 4006) 3.72 student’s t distribution The distribution of the deviations of the mean values of the samples from the population mean, expressed as a proportion of the sample standard deviation (the samples being taken from normal distributions). It is used to set the confidence limits of the population mean, in particular in cases where the mean has been estimated from small samples. (ISO 4006) 3.73 test gas A gas blend of sufficient stability and homogeneity whose composition is properly established for use in the performance testing of a measurement system. 3.74 test GC The gas chromatograph which is to be tested to ascertain its performance characteristics. 3.75 thermal conductivity detector (TCD) A detector that measures the difference in thermal conductivity between two gas streams when a sample (gas blend) passes through the sample channel. (adapted from ISO 14532) Note 1: The TCD is a dual channel detector, requiring a reference flow of pure carrier gas through the reference channel. Note 2: The use of helium or hydrogen is recommended as carrier gas except when the sample contains either of these two substances to be measured. Note 3: The detector consists of a bridge circuit; the change in resistance in the sample channel during the passage of the sample produces an out-of-balance signal that is the basis of the detection. The detector responds to all components except the carrier gas and is nondestructive. 3.76 thermocouple A thermocouple is a junction between two different metals that produces a voltage related to a temperature difference. (API MPMS Chapter 7.3) 3.77 traceability The relation of a calibration, through a step-by-step process, to an instrument or group of instruments calibrated and certified by a national or international primary standard. (modified from API MPMS Chapter 1) 3.78 true value The theoretically correct amount. In practice, it is represented by the standard being used for comparison, such as a prover. (API MPMS Chapter 1) 3.79 uncertainty A parameter associated with the result of a measurement that characterizes the dispersion of the values that could be reasonably be attributed to the measurand, often expressed in terms of its variance or standard deviation. (ISO GUM) Working Group Ballot Draft, August 2014 API Chapter 22.6 P a g e | 9 This document is not an API Standard; it is under consideration within an API technical committee but has not received all approvals required to become an API Standard. It shall not be reproduced or circulated or quoted, in whole or in part, outside of API committee activities except with the approval of the Chairman of the committee having jurisdiction and API staff. Copyright API. All rights reserved. 3.80 unnormalized Not normalized; not adjusted to lie within a prescribed range. Raw gas compositions reported by GCs are typically unnormalized, such that the total of all component concentrations does not equal 100%. 3.81 variable, measured The physical quantity, property, or condition that is to be measured. Common measured variables are temperature, pressure, rate of flow, thickness, velocity, etc. (API MPMS Chapter 1) 3.82 verification GC A gas chromatograph that serves as the reference GC to evaluate performance characteristics of the test GC. 3.83 Warren reproducibility The comparison between the gravimetrically determined composition or calculated property of a calibration gas or test gas and the composition or property determined by GC analysis of the gas. (modified from API MPMS Chapter 14.1) 4 4.1 Symbols and Abbreviations Symbols Ai peak area of a chromatogram produced by component i Ci constant coefficient of a linear response function c0, c1, c2… coefficients of a nonlinear response function Hv gross heating value r repeatability s sample standard deviation t t-statistic computed from the Student’s t distribution u standard uncertainty U95 95% confidence interval unnormalized mole percent or mole fraction of component i in a gas blend normalized mole percent or mole fraction of component i in a gas blend ̅ average of multiple values of quantity z in a measurement sample Z compressibility factor density 4.2 Acronyms and Abbreviations ASTM ASTM International (formerly American Society for Testing Materials) GC gas chromatograph GPA Gas Processors Association ISO International Organization for Standardization Working Group Ballot Draft, August 2014 API Chapter 22.6 P a g e | 10 This document is not an API Standard; it is under consideration within an API technical committee but has not received all approvals required to become an API Standard. It shall not be reproduced or circulated or quoted, in whole or in part, outside of API committee activities except with the approval of the Chairman of the committee having jurisdiction and API staff. Copyright API. All rights reserved. MPMS Manual of Petroleum Measurement Standards, API NIST National Institute of Standards and Technology RTD resistance temperature detector TCD thermal conductivity detector 5 Safety Considerations Facilities should follow all local, state and federal laws regarding the use and handling of hazardous materials. 6 Parameter Variations Affecting Device Performance 6.1 Selection of Relevant Test Parameters This section identifies the minimum set of test parameters required to permit the user to make an informed decision regarding GC performance. It is understood that the user or tester may add parameters for individual testing. 6.2 Mandatory Baseline (Ideal Condition) Testing Baseline testing shall identify the influence of the following parameters on GC performance: Test gas composition Calibration gas composition Baseline testing shall produce the following information, at a minimum, to characterize the GC’s baseline performance: Results of gross heating value and relative density calculations, if performed by the GC Repeatability of analyses Linear range of component response functions End-users of test reports created under this protocol should choose acceptance criteria for GC performance based on their individual applications and requirements. Industry standards containing acceptance criteria that may be of use are listed in the Bibliography. Tests for the limits of detection for gas components of interest are not included in this test protocol. Users are encouraged to consult with the GC manufacturer to determine the limits of detection for components of interest. Figure 1 shows the relationship between parameter variations, test results, and performance data produced during baseline tests. Working Group Ballot Draft, August 2014 API Chapter 22.6 P a g e | 11 This document is not an API Standard; it is under consideration within an API technical committee but has not received all approvals required to become an API Standard. It shall not be reproduced or circulated or quoted, in whole or in part, outside of API committee activities except with the approval of the Chairman of the committee having jurisdiction and API staff. Copyright API. All rights reserved. Varied parameters: • Test gas composition • Calibration gas composition Test results: • Calculated response factors • Chromatograms • Elution times • Analyzed compositions • Calculated gas properties (Hv, relative density, , Z) Data for performance evaluation: • Measurement error in compositions and properties • Repeatability of analyses • Linear range of component response functions Figure 1 – Parameter Variations and Information Produced by Mandatory Baseline Testing 6.3 Mandatory Non-Ideal Condition Testing Mandatory non-ideal condition testing quantifies environmental effects on GC performance and the dynamic performance of the GC under changing conditions. The following test parameters are included in non-ideal condition tests: Ambient temperature Barometric pressure Alternating test gas compositions representing varying sample streams Test gas temperature Test gas flow rate Carrier gas flow rate Carrier gas purity Non-ideal condition testing shall produce data quantifying the bias of GC analyses with respect to changes in these variables. For all variables except barometric pressure and carrier gas purity, non-ideal condition testing shall also produce data on the dynamic response of the GC to these changes. End-users should choose acceptance criteria for non-ideal condition testing based on their individual applications and requirements. Figure 2 shows the relationship between parameter variations and performance data produced during non-ideal condition tests. Working Group Ballot Draft, August 2014 API Chapter 22.6 P a g e | 12 This document is not an API Standard; it is under consideration within an API technical committee but has not received all approvals required to become an API Standard. It shall not be reproduced or circulated or quoted, in whole or in part, outside of API committee activities except with the approval of the Chairman of the committee having jurisdiction and API staff. Copyright API. All rights reserved. Varied parameters: • Ambient temperature • Alternating test gas compositions representing varying sample streams • Test gas temperature • Test gas flow rate • Carrier gas flow rate • Barometric pressure • Carrier gas purity Dynamic response of GC to changes in varied parameters Bias in gas analyses related to changes in varied parameters Figure 2 – Parameter Variations and Information Produced by Mandatory Non-Ideal Condition Testing 6.4 Non-Mandatory Special Testing Non-mandatory special testing quantifies the effects of external mechanical, electrical, and environmental conditions that may affect the performance of GCs. These conditions may include: Mounting position – e.g., direct or remote mount to sample probe Relative humidity Mechanical vibration “Drop and topple” testing Power supply fluctuations Any other external parameter that may affect GC performance If performed, special testing shall produce data quantifying the bias of GC analyses with respect to changes in these conditions. For relative humidity and power supply fluctuations, special testing shall also produce data on the dynamic response of the GC to these changes. Special testing may also include long-term stability tests. Such tests shall produce data quantifying changes in the repeatability and response linearity of the GC over long periods of time, and shall also produce data on any variables known through baseline tests and non-ideal condition tests to affect GC performance. End-users should choose acceptance criteria for special testing based on their individual applications and requirements. Figure 3 shows the relationship between parameter variations and performance data produced during special tests. Working Group Ballot Draft, August 2014 API Chapter 22.6 P a g e | 13 This document is not an API Standard; it is under consideration within an API technical committee but has not received all approvals required to become an API Standard. It shall not be reproduced or circulated or quoted, in whole or in part, outside of API committee activities except with the approval of the Chairman of the committee having jurisdiction and API staff. Copyright API. All rights reserved. Dynamic response of GC to changes in varied parameters Varied parameters: • Relative humidity • Power supply fluctuations • Mounting position – e.g., direct or remote mount to sample probe • Mechanical vibration • “Drop and topple” testing • Any other external parameter that may affect GC performance Bias in gas analyses related to changes in varied parameters Figure 3 – Parameter Variations and Information Produced by Non-Mandatory Special Testing 7 Performance Tests 7.1 Test Conditions This subsection identifies variables and environmental effects that can influence GC performance. These variables and conditions shall be measured or recorded over the course of tests and documented in the test report. Depending upon the tests performed and/or the capabilities of the test installation, it may not be possible to change some of these variables or evaluate their influence on GC performance. In that case, the test report shall identify those parameters that were not varied during tests, and where possible, shall report their values during tests. 7.1.1 Conditions Recorded Before Tests The following variables and quantities shall be documented before tests begin: Test gas compositions (gravimetrically determined and certified) Calibration gas compositions (also gravimetrically determined and certified) Carrier gas purity Internal GC configuration (separation columns, valves, valve timing, column temperatures, etc.) Response functions (proportional, linear, polynomial, etc.) for each gas component Installation position, orientation, etc., of GCs in the test apparatus 7.1.2 Conditions Recorded During Tests The following variables and quantities shall be recorded during all baseline tests and non-ideal condition tests: Conditions in the environment where the GC resides: o Ambient temperature o Barometric pressure o Relative humidity Test gas temperature Test gas flow rate Carrier gas flow rate Working Group Ballot Draft, August 2014 API Chapter 22.6 P a g e | 14 This document is not an API Standard; it is under consideration within an API technical committee but has not received all approvals required to become an API Standard. It shall not be reproduced or circulated or quoted, in whole or in part, outside of API committee activities except with the approval of the Chairman of the committee having jurisdiction and API staff. Copyright API. All rights reserved. 7.2 Any external mechanical or electrical conditions varied during tests, such as: o Direction, magnitude, and frequency of mechanical vibration o Changes or fluctuations in power supply o Mounting position of GC Test Installation This subsection describes required features of the test installation used to evaluate GC performance under controlled conditions, and requirements for measuring variables and conditions affecting GC performance. Other key requirements addressed in this subsection include equipment cleanliness, features of the laboratory or environmental chamber containing the GC(s), and the purity and composition of gases used in tests. 7.2.1 Design Requirements Under operating conditions in the field or laboratory, a GC collects samples of a gas stream from a sampling system. The sampling system may be designed to meet industry standards, GC manufacturer requirements, user-standard requirements, or a combination of these. For this test protocol, the test installation serves the role of the sampling system by delivering test gases and calibration gases to the GC(s) under test. The test installation shall be designed per industry standards and the requirements specified by the GC manufacturer. The Laboratory Inspection Checklist of API MPMS Chapter 14.1, Appendix E should be used to verify the proper design of the test sampling system. Those who perform the tests are not responsible for choosing the acceptance criteria for GCs under test, so the criteria in Table E.1 of API 14.1, Appendix E shall not be applied as part of the design requirements. The test installation shall also be designed to meet the following requirements: The test installation shall be configured so that each GC is able to analyze the same test gas(es), and so that each GC shall be calibrated on the same calibration gas(es). The test installation shall be designed to allow purging with carrier gas before tests are performed. The test installation shall be designed to minimize dead volumes in the sample lines, thus minimizing purge times and errors due to gas volumes trapped from prior tests. If a GC under test has a low purge rate or no purging capabilities, an independent purge loop should be incorporated in the installation for that GC, so that the time required for the GC to accurately analyze a new test gas composition is reduced. If a purge loop is installed, the rate at which gas is purged and the volume of gas to be purged shall be considered in determining the required volumes of test gases. A test installation may be designed to include a single GC, multiple GCs of the same brand and model, and/or GCs of different brands and models. A test installation may be designed so that each GC operates from a separate supply of carrier gas, or so that test gases and calibration gases are delivered to different inlets on the same GC. Pressure regulators on gas cylinders should be set to ensure that the sample flow rate to a given GC is consistent for all test gases and calibration gases, so as to minimize the amount of renormalization that each GC requires due to varying volumes of gas samples. Figure 4 is an example of a test installation that may be used for baseline (ideal condition) tests and non-ideal condition tests. Other test installation designs that meet the requirements above are also acceptable. Working Group Ballot Draft, August 2014 API Chapter 22.6 P a g e | 15 This document is not an API Standard; it is under consideration within an API technical committee but has not received all approvals required to become an API Standard. It shall not be reproduced or circulated or quoted, in whole or in part, outside of API committee activities except with the approval of the Chairman of the committee having jurisdiction and API staff. Copyright API. All rights reserved. Figure 4 – Example Installation for GC Testing 7.2.2 Verification GC A GC separate from the units under test shall be used to verify the composition of each of the calibration gases and test gases before tests of any GC begin under this testing protocol. This “verification GC” may also be used to check the gas compositions during testing. The verification GC shall be capable of analyzing all components listed in the certificate of analysis of the calibration gases and test gases, without reporting listed components as combined fractions. The verification GC should be one in which the investigator has confidence and prior record of good performance, such as a GC that has been utilized in an interlaboratory comparison to identify and eliminate biases. The verification GC shall be calibrated on a different gas blend than the gas blend(s) used to calibrate the GCs under test, preferably on a gas blend from a different supplier, so as to establish a separate traceability chain. If any discrepancy is observed in the compositions of the calibration or test gases, another GC (such as one of the test units) shall be used to confirm that the discrepancies are in the gas blend certificate of analysis, and not with the verification GC. 7.2.3 Equipment Cleaning and Leak Testing Before tests begin, the manifold and other equipment used to transfer gases to the GCs shall be cleaned with reagent-grade acetone or shall be steam cleaned. The equipment shall then be leak-tested with helium at its Maximum Allowable Operating Pressure before first use. A Working Group Ballot Draft, August 2014 API Chapter 22.6 P a g e | 16 This document is not an API Standard; it is under consideration within an API technical committee but has not received all approvals required to become an API Standard. It shall not be reproduced or circulated or quoted, in whole or in part, outside of API committee activities except with the approval of the Chairman of the committee having jurisdiction and API staff. Copyright API. All rights reserved. thermal conductivity detector (TCD) or similar gas leak detector should be used to check system integrity during leak tests. Checks should ensure that each test GC is venting helium to atmosphere, and that its discharge pressure is equal to ambient atmospheric pressure. 7.2.4 Carrier Gas Analysis After equipment cleaning is complete, and before tests are performed, each GC shall be used to analyze a sample of the carrier gas supply to be used with the GC. The carrier gas analysis should produce a flat baseline, except for any expected valve switching effects. A successful carrier gas analysis from each test GC may be used as a baseline chromatogram for comparison with later test results. If the carrier gas is a gas other than nitrogen, the appearance of nitrogen in the carrier gas analysis may indicate an air leak in the manifold or test installation. If leaks have been eliminated, yet nitrogen or other contaminants appear after repeated system purges, the carrier gas supply shall be analyzed as an unknown gas using the verification GC and a separate carrier gas supply. If contaminants are found in the suspect carrier gas supply, that supply shall be replaced. 7.2.5 Test Gases and Calibration Gases Certified test gases shall be used to evaluate the performance of each GC. Multiple test gas blends are required for mandatory baseline (ideal condition testing) and mandatory non-ideal condition testing to evaluate the response of the GCs at different component concentrations, as well as the measurement error, repeatability and response linearity of the GCs. The test gases shall be chosen to represent gas compositions that the GCs are expected to analyze in actual use. Test gas compositions should also consider each GC’s lower limit of detection for components of interest. Users are encouraged to consult with the GC manufacturer to determine the limits of detection for components of interest. Calibration gas blends separate from the test gas blends shall be used for GC calibration. Each component in a GC calibration gas shall have a concentration between one-half and twice its concentration in the test gases to be analyzed. If necessary, more than one calibration gas shall be used to meet this requirement for all test gases. The calibration gas blend for the verification GC should be obtained from a different supplier than the test gas so as to establish a separate traceability chain and eliminate possible biases related to the blend supplier. Test gases and calibration gases shall be certified and traceable by weight to a national standards organization such as the National Institute of Standards and Technology (NIST) in the United States or an equivalent internationally recognized certifying organization. Test gases shall be prepared in accordance with API MPMS Chapter 14.1, Subsection 16.2. Each component concentration shall have an uncertainty at the 95% confidence level that meets the requirements of GPA 2198. The test gas blend compositions shall be verified before they are used in the protocol, using the verification GC or a separate GC not otherwise involved in the tests. The verification GC shall be calibrated according to the procedure in Subsection 7.8.2, Calibration of the Verification GC. Required volumes of test gases and calibration gases shall be estimated before the gases are obtained. Estimates shall consider the delivery pressure and usable volume of gas in the cylinder in which it will be delivered, the hydrocarbon dew point of the gas, the length of each test sequence, the gas consumption rates of all the GCs under test, and any amounts of gas needed to prepare the GCs and test apparatus. Using multiple cylinders of test gases blended separately to the same nominal specifications in the same test will often introduce a bias to the results, since the blends in each cylinder will vary slightly in actual certified composition. For this reason, a single test gas cylinder should contain enough gas to supply the entire volume Working Group Ballot Draft, August 2014 API Chapter 22.6 P a g e | 17 This document is not an API Standard; it is under consideration within an API technical committee but has not received all approvals required to become an API Standard. It shall not be reproduced or circulated or quoted, in whole or in part, outside of API committee activities except with the approval of the Chairman of the committee having jurisdiction and API staff. Copyright API. All rights reserved. required for a particular test. At the completion of tests, the remaining pressure in the cylinder should meet or exceed the minimum delivery pressure required at the GC inlet. Note that for some gas blends, particularly those with high hydrocarbon dew point temperatures, it may not be possible to prepare a single gas cylinder with enough delivery pressure to complete all tests. In this case, tests should consider the use of multiple cylinders of similar gas compositions, and the compositional uncertainties of each individual cylinder should be considered in the results. 7.2.6 Laboratory Environment or Environmental Chamber Mandatory baseline (ideal condition) tests shall be performed in a facility with controlled ambient temperature to eliminate environmental influences on GC performance. Tests under non-ideal conditions may identify any changes in the measurement error, repeatability, and response linearity of a GC with changes in ambient temperature, barometric pressure, and other environmental variables. If performed, these tests shall be conducted with the GC(s) operating at various ambient conditions in a controlled environment, such as an environmental chamber. Tests under some non-ideal conditions include swings in ambient temperature to assess a GC’s performance during transients, followed by periods at a fixed ambient temperature to evaluate a GC’s stabilization time after a temperature change. Other non-ideal tests evaluate the GC’s performance with changes in barometric pressure or with changes in the temperature of the test gas being analyzed. The environmental chamber should be able to produce and maintain stable conditions of temperature and pressure across the GC manufacturer’s stated operational range. The environmental chamber should also be able to control the rate of change of temperature and pressure to within the requirements of the investigator or the requirements of the GC’s intended application. The ambient temperature and barometric pressure in the lab environment, or the ambient pressure and temperature in the environmental chamber, shall be measured during tests using instruments with calibrations traceable to a national standards organization such as NIST in the United States or an equivalent internationally recognized certifying organization. If the test gas temperature and ambient relative humidity are varied, measurements of these quantities shall also be made using instruments with calibrations traceable to NIST or an equivalent certifying organization. If a new manifold or test installation is built for use in the environmental chamber, it shall be cleaned and leak-tested in the manner described in Subsection 7.2.3. If a manifold and installation equipment used during other tests are transferred into the environmental chamber, cleaning and leak-testing should be performed. If possible, such testing should be performed at the extreme temperatures planned for tests in the chamber. Condensation of heavy hydrocarbons from calibration and test gases may occur in the sample lines at low environmental temperatures, biasing the results. Each test gas and calibration gas shall be evaluated to determine if the sample lines require heating as specified in Subsection 7.8.1, Preheating of Gas Blends and Equipment. If heating is necessary, all GC sample lines inside the environmental chamber shall be insulated and heat traced according to the guidelines of API MPMS Chapter 14.1, Subsection 16.1. 7.3 Test Results Data generated by the GCs during tests shall be saved for review. At a minimum, the recorded data shall include the following: Calculated response factors or response functions for each component Chromatograms Working Group Ballot Draft, August 2014 API Chapter 22.6 P a g e | 18 This document is not an API Standard; it is under consideration within an API technical committee but has not received all approvals required to become an API Standard. It shall not be reproduced or circulated or quoted, in whole or in part, outside of API committee activities except with the approval of the Chairman of the committee having jurisdiction and API staff. Copyright API. All rights reserved. Elution times for each component Analyzed gas compositions (raw and normalized) Calculated test gas properties: o Gross heating value o Density at standard conditions o Compressibility factor o Relative density The GCs shall be configured to save these data before tests begin, and if possible, should record data electronically. The data should be recorded with enough significant digits to observe variations on the order of 0.01 mol % or less. Test conditions listed in Subsection 7.1.2 shall also be recorded during tests. Before tests begin, the amount of data (chromatograms, raw data, and processed data) that will be produced by each GC shall be compared to its data storage capacity. Some GCs have limited onboard memory, and will overwrite the oldest data with the most recent data when their memory capacity is reached. All test data should be downloaded from the GC at regular intervals to prevent loss of test results. If several GCs are tested simultaneously and their results are to be compared, the GCs should be configured to calculate gas properties using the same calculational standard so that results can be compared equitably. If this is not possible, gas properties shall be computed independently using the normalized compositions reported by each GC and a single calculational standard. Within the test report (see Section 10), the data and test results shall be presented so that the following can be assessed: Adequacy of response functions for each component o A plot of response factor versus molecular weight for normal alkanes shall be included in the data. Response factors that do not fall on a straight line may indicate a nonlinear response function, an incorrect component concentration in the calibration gas certificate of analysis, or loss of components due to condensation or other factors. Elution time behavior for each component o Elution time repeatability values reflect the performance capabilities of the GC under test. Component peak separation/interface within the chromatograms o Chromatograms shall be reviewed to determine if the components are separated correctly by the GC columns, or if there is any overlap of peaks that can cause inconsistent analysis. Measurement error of reported component concentrations, gross heating value, density, and other calculated gas properties Correct conversion of unnormalized component concentrations to a normalized composition with a total of 100% (to within the number of significant digits reported by the GC) Repeatability of reported component concentrations, gross heating value, density, and other calculated gas properties Linear range of GC response for each component Bias (Warren reproducibility) in reported component concentrations, gross heating value, density, and other calculated gas properties with changes in test parameters Working Group Ballot Draft, August 2014 API Chapter 22.6 P a g e | 19 This document is not an API Standard; it is under consideration within an API technical committee but has not received all approvals required to become an API Standard. It shall not be reproduced or circulated or quoted, in whole or in part, outside of API committee activities except with the approval of the Chairman of the committee having jurisdiction and API staff. Copyright API. All rights reserved. 7.4 Mandatory Baseline (Ideal Condition) Testing Baseline tests evaluate the repeatability, response linearity, and measurement error in calculated gas properties for each GC. These tests are conducted with multiple test gas blends chosen according to the guidance in Subsection 7.8.5, Procedure for Baseline Tests and Variable Gas Composition Tests. Baseline tests shall be performed in a facility with controlled ambient temperature to eliminate environmental influences on GC performance. Flow rates of test gases and carrier gases shall also be held constant during baseline tests. In the baseline tests, multiple analyses are performed on a single test gas blend to determine the repeatability of GC analyses and the measurement error of gas properties calculated by each GC. This process is repeated on multiple test gas blends, and data from all test gases are used to assess the response linearity of each component. Before the GC is tested on each gas blend, it shall be calibrated on an appropriate calibration gas blend as discussed in Subsection 7.2.5, Test Gases and Calibration Gases. The repeatability and measurement errors of each GC shall be assessed as described in Section 9, Uncertainty Analysis and Calculation. 7.5 Mandatory Non-Ideal Condition Testing Tests under non-ideal conditions evaluate the bias in GC analyses due to changing environmental conditions and varying gas stream conditions and compositions. Some of these tests are conducted with multiple test gas blends, chosen according to the guidance in Subsection 7.8.5, Procedure for Baseline Tests and Variable Gas Composition Tests. Other tests involve different carrier gas supplies with different levels of purity. Non-ideal condition tests require the use of an environmental chamber which shall be able to produce and maintain a stable ambient temperature, and should be able to control the rate of change of temperature. Methods to control the temperature of the test gas stream and the flow rates of the test gas and carrier gas are also required. If possible, the atmospheric pressure within the chamber should also be controlled. Variables and quantities listed in Subsection 7.1 shall be recorded during these tests. Some GCs may have internal sensors and alarms that will halt their operation under extreme environmental conditions or low flow conditions. If the purpose of the test is to evaluate the function of such alarms, the alarms shall not be disabled before the tests. If the alarm is only informative and does not indicate a condition that could damage the GC, or if the purpose of the test is to evaluate a GC’s performance without such alarms in place, the GC alarms may be disabled before performing the tests. In tests under non-ideal conditions, variables affecting GC performance are changed over preset ranges and patterns to assess the biases in GC analyses due to changes in those variables. The following subsections describe the specific parameters that are varied and the equipment required to perform the tests. Biases in results with respect to these variables shall be quantified as discussed in Section 9. 7.5.1 Environmental Tests Environmental tests are performed to assess the response of a GC to changes in its environment, by quantifying the bias in GC results with changes in ambient temperature and ambient or barometric pressure. The test gas blend(s) used in the environmental tests should closely resemble the typical gas composition expected in the GC’s eventual application. Environmental tests may be performed with only one test gas; however, if the GC is to be tested on a wide variety of test gases and is expected to be exposed to wide variations in environmental conditions, the entire test may be repeated with different gas blends to cover the expected variations in actual use. Working Group Ballot Draft, August 2014 API Chapter 22.6 P a g e | 20 This document is not an API Standard; it is under consideration within an API technical committee but has not received all approvals required to become an API Standard. It shall not be reproduced or circulated or quoted, in whole or in part, outside of API committee activities except with the approval of the Chairman of the committee having jurisdiction and API staff. Copyright API. All rights reserved. Ambient temperature tests shall be conducted with the GC operating at various ambient temperatures in an environmental chamber. The tests shall involve swings in ambient temperature to assess the GC’s dynamic response to ambient transients, as well as several constant ambient temperatures to evaluate the GC’s performance at these temperatures and its stabilization time after a temperature change. Barometric pressure tests should be conducted in an environmental chamber capable of controlling the atmospheric pressure within the chamber. If such a chamber is available, tests shall be performed at different atmospheric pressure levels to assess any changes in the GC’s performance with ambient pressure. If a chamber capable of varying atmospheric pressure is not available, barometric pressure tests shall be performed in an environmental chamber held at a constant ambient temperature, and the barometric pressure in the chamber shall be measured over a preset period as it varies with local weather conditions. 7.5.2 Variable Gas Composition Test Tests with varying gas compositions are performed to assess the response of a GC to changes in the analyzed gas stream. The same test gas blends used in the baseline tests shall be used in the variable gas composition test. However, the GC shall be calibrated only once on a single calibration gas blend at the start of the test, so that recalibration does not obscure biases related to varying test gas compositions. During the variable gas composition test, the sample stream is alternated among the test gases in a non-repeating sequence, and each test gas is analyzed multiple times over the course of the test. All analyses of a given test gas within the sequence are compared to quantify the bias in the GC analyses due to changes in the gas stream composition. Other environmental variables affecting GC performance listed in Subsection 6.3, Mandatory Non-Ideal Condition Testing shall be held constant during the test, particularly the ambient temperature in the environmental chamber housing the GC, to avoid biases in the results due to these variables. 7.5.3 Flowing Gas Conditions Tests These tests evaluate the impact of changes in flowing conditions of the analyzed gas stream on GC performance. Each test shall be performed on a single test gas blend, using one of the blends used in the baseline tests. The GC shall be calibrated only once on an appropriate calibration gas blend at the start of each test, so that recalibration does not obscure biases related to flowing gas conditions. If desired, separate tests may be performed on more than one test gas composition to identify dependence of the results on gas composition. The flowing gas condition tests require means of controlling both the temperature and the flow rate of the test gas stream supplied to the GC. In sample temperature tests, the gas temperature may be controlled using heat trace on the sample line or another method that is capable of controlling the gas temperature to within a known “dead band.” Tests shall include analyses of the test gas stream at different constant temperatures and analyses during transients in gas stream temperature. The temperature of the gas stream itself shall be measured in the flow using a thermocouple, an RTD, or another device whose calibration is current and traceable to NIST or an equivalent internationally recognized certifying organization. The temperature measurement location should be immediately upstream of the GC sample inlet, to ensure representative measurements of the stream temperature. In sample flow rate tests, the test gas flow may be controlled using a method that produces a steady flow rate to the GC. These tests shall include analyses with the test gas stream set to several different constant flow rates. The test gas flow rate shall be measured using a device whose calibration is current and traceable to NIST or an equivalent internationally recognized certifying organization. The preferred measurement location will depend upon the design of the Working Group Ballot Draft, August 2014 API Chapter 22.6 P a g e | 21 This document is not an API Standard; it is under consideration within an API technical committee but has not received all approvals required to become an API Standard. It shall not be reproduced or circulated or quoted, in whole or in part, outside of API committee activities except with the approval of the Chairman of the committee having jurisdiction and API staff. Copyright API. All rights reserved. GC under test. Tests shall include analyses of the test gas stream at different test gas flow rates and analyses during transients in test gas flow rate. 7.5.4 Carrier Gas Tests These tests evaluate the impact of changes in the purity and flow rate of carrier gas on GC performance. Note that these tests are not the same as the carrier gas analysis discussed in Subsection 7.2.4 that produces a baseline chromatogram for each GC under test. As with the flowing gas conditions test, each carrier gas test shall be performed using one of the test gas blends used in the baseline tests. The GC shall be calibrated only once on an appropriate calibration gas blend at the start of each test, so that recalibration does not obscure biases related to carrier gas changes. In carrier gas purity tests, the same test gas is analyzed using carrier gases with increasing levels of impurities. The raw chromatograms and test gas analyses are compared to quantify the effect of carrier gas impurities on GC performance. Carrier gas compositions shall be verified before use with the verification GC or a separate GC not otherwise involved in the tests. The choice of carrier gas impurities is left to the party responsible for performing tests, but should consider the type of detector and other design features of the GC under test. In carrier gas flow rate tests, the carrier gas flow may be controlled using a method that produces a steady flow rate to the GC. These tests shall include analyses of the test gas stream while the carrier gas is delivered at several different flow rates. The carrier gas flow rate shall be measured using a device whose calibration is current and traceable to NIST or an equivalent internationally recognized certifying organization. The preferred measurement location will depend upon the design of the GC under test. Tests shall include analyses of the test gas stream at different constant carrier gas flow rates and analyses during transients in carrier gas flow rate. 7.6 Non-Mandatory Special Testing Special testing is not mandatory under this protocol. Special testing quantifies the effects of external mechanical, electrical, and environmental conditions that may affect the performance of GCs. These tests may require specialized equipment, such as vibration tables or facilities capable of providing variable supply voltage to the GC under test. If performed, special testing shall produce data quantifying the bias of GC analyses with respect to these tests. These tests are not recommended for in-service GCs. 7.6.1 Mounting Position Test The mounting position test may be performed to assess changes in GC response with changes in the length of the sample line. The test requires the use of a manifold with sample lines of different lengths between the gas supply and the GC under test. The mounting position test shall use two or more test gas blends and an appropriate calibration gas blend from the baseline tests. However, the GC shall be calibrated only once at the start of the test, so that recalibration does not obscure biases related to the sample line length. The end-user of the test or the party responsible for performing the test may specify the sample line lengths to be tested. Environmental and other conditions affecting GC performance listed in Subsections 6.2 and 6.3 shall be kept constant during the test, to avoid biases due to changes in these conditions. For each sample line length being tested, the test gas supply shall be alternated to simulate changes in gas composition in the field application. GC analyses over time shall be recorded and compared to the times at which the test gas was changed at the source. The times needed for the analysis to stabilize on the new test gas composition shall be used to quantify the GC response time to composition changes at the source for the tested sample line length. Multiple Working Group Ballot Draft, August 2014 API Chapter 22.6 P a g e | 22 This document is not an API Standard; it is under consideration within an API technical committee but has not received all approvals required to become an API Standard. It shall not be reproduced or circulated or quoted, in whole or in part, outside of API committee activities except with the approval of the Chairman of the committee having jurisdiction and API staff. Copyright API. All rights reserved. changes in the test gas for each sample line may be performed if desired. These tests shall be repeated for each sample line length to assess the overall effects of sample line length on GC response time. Analyses of each test gas may also be compared to assess the effects of sample line length on other aspects of GC performance. Sample line lengths used in each test shall be recorded, along with other required data described in Subsection 7.1. 7.6.2 Relative Humidity Test The relative humidity test may be performed to assess changes in GC performance with changes in the ambient relative humidity. The test requires the use of an environmental chamber that is able to produce and maintain different levels of relative humidity, and that is able to control the rate of change of moisture levels in the environment. Relative humidity tests shall use a single test gas blend and a single calibration gas blend from the baseline tests, to eliminate changes in gas composition as sources of bias. The tests shall include swings in relative humidity to assess the GC’s dynamic response to humidity transients, as well as several constant levels of relative humidity to evaluate the GC’s performance at each condition and its stabilization time after a humidity change. All analyses of the test gas shall be compared to quantify the effects of ambient relative humidity on GC performance. Relative humidity conditions in the environmental chamber shall be recorded during tests, along with other required data described in Subsection 7.1. 7.6.3 Mechanical Vibration Test This test may be performed to assess the effects of mechanical vibrations on GC performance. The test requires the use of a “shake table” or other facility that is able to subject a GC to vibrations with controlled frequencies, amplitudes, and patterns. The mechanical vibration test shall use a single test gas blend and a single calibration gas blend, to eliminate changes in gas composition as sources of bias. The end-user of the test or the party responsible for performing the test may specify the frequencies, magnitudes, and directions of vibrations to which the test GC is subjected. These vibration conditions shall be recorded as part of the test, along with along with other required data described in Subsection 7.1. The chosen test gas blend shall be analyzed before and after the GC is subjected to the chosen mechanical vibration patterns to establish their effects on GC repeatability and performance. If desired, the mechanical vibration test may be performed by repeating the complete baseline test on the GC before and after mechanical vibrations. 7.6.4 “Drop and Topple” Test This test is similar to the mechanical vibration test, but assesses the effects of sudden mechanical shocks to the GC. The “drop and topple” test shall use a single test gas blend and a single calibration gas blend, to eliminate changes in gas composition as sources of bias. The end-user of the tests or the investigator responsible for performing the tests may specify the distance and direction from which the GC under test is dropped, and/or the manner in which the GC is toppled or pushed over. These conditions shall be recorded as part of the test, along with other required data described in Subsection 7.1. The chosen test gas blend shall be analyzed before and after the GC is subjected to the chosen mechanical shocks to establish their effects on GC repeatability and performance. If desired, the “drop and topple” test may be performed by repeating the complete baseline test on the GC before and after each mechanical shock is inflicted. Working Group Ballot Draft, August 2014 API Chapter 22.6 P a g e | 23 This document is not an API Standard; it is under consideration within an API technical committee but has not received all approvals required to become an API Standard. It shall not be reproduced or circulated or quoted, in whole or in part, outside of API committee activities except with the approval of the Chairman of the committee having jurisdiction and API staff. Copyright API. All rights reserved. 7.6.5 Power Supply Fluctuation Test This test may be performed to determine the influence of fluctuations in supply voltage on GC performance. The test requires the use of an adjustable power supply that is able to produce and maintain preselected supply voltages to the GC under test, and that is also able to create transients in the power supply at a predetermined rate of change. The power supply fluctuation test shall use a single test gas blend and a single calibration gas blend from the baseline tests, to eliminate changes in gas composition as sources of bias. The tests shall include swings in supply voltage to assess the GC’s dynamic response to power transients, as well as constant voltage levels at, above, and below the GC’s rated supply voltage to evaluate the GC’s performance at each condition and its stabilization time after a power transient. All analyses of the test gas under this test shall be compared to quantify the effects of power supply fluctuations on GC performance. Supply voltages and voltage transients shall be recorded during tests, along with other required data described in Subsection 7.1. 7.6.6 Long-Term Stability Test The long-term stability test is performed to evaluate changes in the measurement error, repeatability, response linearity, and/or errors in calculated gas properties for a GC over long periods of time. One or more of the test gas blends used in the baseline tests shall be analyzed during the long-term stability tests. The same calibration gas blend(s) used in the baseline tests shall be used to calibrate the GC during this test. In the long-term stability test, the chosen test gas blend shall be analyzed at regular intervals (e.g., weekly) in duplicate to establish ongoing changes in measurement error. Environmental and other conditions affecting GC performance listed in Subsections 6.2 and 6.3 shall be reproduced during each regular analysis, to avoid biases due to changes in these conditions. Test conditions listed in Subsection 7.1 shall be recorded during each test. Multiple analyses shall be performed on the test gas(es) to determine the repeatability and measurement error of the GC over the course of tests. Results at each regular test interval shall be compared to one another to assess the stability of the unit over time. If multiple test gas blends are analyzed, response linearity shall also be compared at each interval to assess changes in these parameters over time. If desired, the long-term stability test may be performed by repeating the baseline test on the GC at regular intervals. 7.7 Testing Documentation The raw data and test condition records of all tests, attested and/or certified by the test facility if tests are performed at a third party facility, should be saved and/or archived for future reference by the manufacturer of the device, for verification if any of the reported results or computations are questioned at a later date. If a specific test report is not published in the public domain and is not available for verification of any claim in that database, all claims based on that database will be deemed unverifiable, and will possibly not be accepted by the equipment user. 7.8 Testing Procedures Table 1 lists the testing procedures in this subsection that shall be followed during the mandatory baseline tests, mandatory non-ideal condition tests, and non-mandatory special tests described in Subsections 7.4 through 7.6. Note that procedures in Subsections 7.8.1 through 7.8.4 shall be followed during all tests. Working Group Ballot Draft, August 2014 API Chapter 22.6 P a g e | 24 This document is not an API Standard; it is under consideration within an API technical committee but has not received all approvals required to become an API Standard. It shall not be reproduced or circulated or quoted, in whole or in part, outside of API committee activities except with the approval of the Chairman of the committee having jurisdiction and API staff. Copyright API. All rights reserved. Table 1 – Applicability of Testing Procedures to Specific Tests Legend: “X” indicates the procedure in the listed subsection shall be followed as part of the test. “O” indicates the procedure in the listed subsection may be followed as part of the test, but is not required. A blank entry indicates the procedure in the listed subsection does not apply to the test. Test Mandatory baseline (ideal condition) testing, Subsection 7.4 Mandatory non-ideal condition tests Ambient temperature test, Subsection 7.5.1 Barometric pressure test, Subsection 7.5.1 Variable gas composition test, Subsection 7.5.2 Sample temperature test, Subsection 7.5.3 Sample flow rate test, Subsection 7.5.3 Carrier gas purity test, Subsection 7.5.4 Carrier gas flow rate test, Subsection 7.5.4 Non-mandatory special tests Mounting position test, Subsection 7.6.1 Relative humidity test, Subsection 7.6.2 Mechanical vibration test, Subsection 7.6.3 “Drop and topple” test, Subsection 7.6.4 Power supply fluctuation test, Subsection 7.6.5 Long-term stability test, Subsection 7.6.6 Subsections 7.8.1 through 7.8.4 X Procedures Subsection Subsection 7.8.5 7.8.6 X X X X X Subsection g)1) X X X X X X X X X X X X X X X O X X O X X X X O 7.8.1 Preheating of Gas Blends and Equipment Each test gas and calibration gas shall be evaluated to determine if its cylinder and sample lines require heating to avoid condensation of heavy components and distortion of the composition before the gas reaches the test GCs. If heating is needed, the heating process shall conform to the guidelines of API MPMS Chapter 14.1, Subsection 16.1. The gas cylinder, outlet pressure regulator, and sample lines in the manifold shall be heated to the required temperature before any gas is withdrawn from the cylinder to calibrate or test the GCs. The equipment should be heated continuously until the cylinder is empty or the gas is no longer needed. If it is suspected that the test gas composition has been distorted due to condensation of heavy hydrocarbons or some other cause, the verification GC shall be used to Working Group Ballot Draft, August 2014 API Chapter 22.6 P a g e | 25 This document is not an API Standard; it is under consideration within an API technical committee but has not received all approvals required to become an API Standard. It shall not be reproduced or circulated or quoted, in whole or in part, outside of API committee activities except with the approval of the Chairman of the committee having jurisdiction and API staff. Copyright API. All rights reserved. check the gas composition leaving the manifold and sample lines before the gas is used in tests. 7.8.2 Calibration of the Verification GC The verification GC (see Subsection 7.2.2) shall be calibrated before it is used to verify the composition of test gases and calibration gases for the test GCs. The verification GC shall be calibrated using a gas blend separate from the blends used to calibrate and evaluate the test GCs. The calibration gas blend for the verification GC should be obtained from a different supplier so as to establish a separate traceability chain and eliminate possible biases related to the test gas supplier. The verification GC shall be recalibrated before use if its last calibration is more than 24 hours old. The method of calibration for the verification GC should follow the manufacturers’ recommended procedures. The alternative calibration procedure listed below shall be followed if the manufacturers’ procedures are not followed or are not available. a) A calibration gas shall be selected that is appropriate for the gases to be analyzed. The concentration of each component in the calibration gas shall be between one-half and twice its expected concentration in the gas to be analyzed. b) If required, the calibration gas cylinder, its outlet pressure regulator, and the sample lines shall be preheated according to the guidelines of API MPMS Chapter 14.1, Subsection 16.1. If the calibration gas becomes too cold, the heavy components of the gas blend may condense in the gas cylinder or in the sample line, thereby distorting its composition. c) At least six consecutive calibration runs shall be performed on the verification GC using the calibration gas. The results of usable calibration runs shall be reviewed to ensure that response factors, elution times and other quantities are acceptable. Initial runs that exhibit transient behavior may be discarded, but a minimum of five sequential usable runs should be obtained to provide a statistically significant dataset. 1) The chromatograms from the useful calibration runs shall be inspected to ensure that baselines are stable and that peaks are integrated consistently according to the desired chromatographic method. 2) The peak areas and analyzed component concentrations from each run shall be reviewed to confirm that component concentrations are repeatable, and that no contaminants are present in the calibration gas. 3) The response factors and elution times from the useful calibration runs shall be verified as acceptable and consistent with expected values. For GCs that assume a linear relationship between peak area and component concentration, a plot of the response factors versus molecular weight for the normal alkanes (paraffin hydrocarbons) should follow a straight line. 7.8.3 Verification of Test Gas and Calibration Gas Compositions Before the test gases and calibration gases for the test GCs are first used, their compositions shall be analyzed using the calibrated verification GC. If a test gas or calibration gas is to be heated above room temperature during GC tests, the verification GC shall also be used to verify the heated gas composition at regular intervals during tests. If the analysis by the verification GC does not agree with the certified composition, the cause shall be determined before tests are performed using the gas in question. During the verification process, the gases shall be delivered to the verification GC through the test manifold. If the gas is to be heated during use, the manifold shall be heated according to Subsection 7.8.1, Preheating of Gas Blends and Equipment, to maintain the gas stream at temperature during the verification process. Working Group Ballot Draft, August 2014 API Chapter 22.6 P a g e | 26 This document is not an API Standard; it is under consideration within an API technical committee but has not received all approvals required to become an API Standard. It shall not be reproduced or circulated or quoted, in whole or in part, outside of API committee activities except with the approval of the Chairman of the committee having jurisdiction and API staff. Copyright API. All rights reserved. 7.8.4 Calibration of Test GCs Each test GC shall be calibrated at the beginning of each test described in Subsections 7.4 through 7.6. Each component in the GC calibration gas shall have a concentration between one-half and twice its concentration in the test gas(es) to be analyzed. For baseline tests (Subsection 7.4), environmental tests (Subsection 7.5.1), and long-term stability tests (Subsection 7.6.6), the test GC shall be recalibrated if a new test gas is introduced and the original calibration gas does not meet this criterion for both the old and new test gases. Other tests require that the test GC shall be calibrated only at the beginning of the test, so as to eliminate bias from the results. The method of calibration for the GCs should follow the manufacturers’ recommended procedures. The alternative calibration procedure in Subsection 7.8.2 shall be followed if the manufacturers’ procedures are not followed or are not available. 7.8.5 Procedure for Baseline Tests and Variable Gas Composition Tests Baseline tests and the variable gas composition test require the GC to repeatedly analyze multiple test gas blends in order to determine the repeatability and measurement errors by GCs under test. The sample stream is alternated among the test gases in a non-repeating sequence, and each test gas is analyzed multiple times over the course of the test. Some special tests, including the mechanical vibration test, the drop-and-topple test, and the long-term stability test, may also be performed on multiple gas compositions following this procedure. Before tests begin, the test gas compositions shall be chosen to represent gas streams that the test GCs are expected to analyze in actual use. The test gas compositions should also cover a range of concentrations for each individual component that is sufficient to assess the GC’s response linearity in each component. A minimum of four test gas blends is considered sufficient for these tests. Before tests begin, a test matrix shall be created to specify the order in which gas blends shall be analyzed. The matrix shall include at least three tests on each gas blend in a non-repeating order. The matrix should be arranged so that each gas blend is analyzed once before any gas blend is analyzed a second time, and so that each blend is analyzed twice before any blend is analyzed a third time. An example test matrix for four gas blends, each analyzed three times, is shown in Table 2. Other test matrices meeting the requirements of this subsection are also acceptable. Table 2 – Example Test Gas Matrix Test Test gas blend 1 1 2 2 3 3 4 4 5 3 6 1 7 4 8 2 9 4 10 3 11 2 12 1 The following procedure shall be followed during baseline tests and variable gas composition tests. Working Group Ballot Draft, August 2014 API Chapter 22.6 P a g e | 27 This document is not an API Standard; it is under consideration within an API technical committee but has not received all approvals required to become an API Standard. It shall not be reproduced or circulated or quoted, in whole or in part, outside of API committee activities except with the approval of the Chairman of the committee having jurisdiction and API staff. Copyright API. All rights reserved. a) The test installation shall be configured to flow the same test gas through each test GC simultaneously. b) The installation manifold shall be purged with carrier gas, and each GC shall be used to analyze the carrier gas stream to confirm that no contaminants are present in the system. If contaminants are found, the purge process shall be repeated until the contaminants are eliminated. See Subsection 7.2.4 for guidance on resolving issues with contaminants in the carrier gas. c) The first test gas shall be introduced into the manifold for analysis by all test GCs. 1) The test gas shall flow through the installation long enough to ensure that any gas present in the system from the previous test or analysis is completely purged. Stability of chromatograms, peak areas and component concentrations among successive analyses by each test GC shall be used to confirm that the test gas has purged the previous gas from the system. The time required to purge the previous gas from the system should be recorded for later reference. Note that the time required to purge one test gas with another may be different than the time required to initially purge carrier gas from the system. 2) The GCs shall be operated per manufacturers’ recommendations. 3) Once the previous gas has been purged from the system, the GC shall run continuously until enough successive analyses of the test gas have been performed to produce statistically useful results for the repeatability analyses. Five or six successive analyses may be considered enough for statistically useful results, though more analyses will generally improve the validity of the statistics. Unnormalized totals should be between 95% and 105% for each analysis, and should be consistent among successive analyses. d) Step (c) shall be repeated on successive test gases until the test matrix has been completed. e) The following information shall be recorded electronically or in a logbook for each test: 1) Test gas composition, gross heating value, and estimated hydrocarbon dew point 2) Start and end time of each test sequence 3) Names of GC data files generated during tests 4) Start time and end time of data collection and other important test steps 5) Pressure and temperature of the gas stream in the manifold 6) GC environmental conditions: ambient temperature and barometric pressure or ambient temperature and pressure in the environmental chamber 7) If available, the flow rate of gas through each GC (e.g., measured by a flow meter on each GC vent) 8) GC analysis configurations and chromatographic method: elution times, peak integration methods, response factors/response functions, etc. 9) Compositional analyses, physical property calculations, unnormalized totals, and related data 10) Chromatograms collected during analyses 11) Any unusual events during testing 7.8.6 Procedure for Tests Involving Transient Conditions Several mandatory non-ideal condition tests and non-mandatory special tests involve GC analyses of a single test gas while an environmental variable, a flow rate, or another quantity of interest is varied continuously. These tests include: Ambient temperature test Flowing gas conditions tests (sample temperature and sample flow rate tests) Working Group Ballot Draft, August 2014 API Chapter 22.6 P a g e | 28 This document is not an API Standard; it is under consideration within an API technical committee but has not received all approvals required to become an API Standard. It shall not be reproduced or circulated or quoted, in whole or in part, outside of API committee activities except with the approval of the Chairman of the committee having jurisdiction and API staff. Copyright API. All rights reserved. Carrier gas flow rate test Relative humidity test Power supply fluctuation test The single test gas is analyzed continuously over the course of these tests to evaluate the operational bias of the GC with respect to the quantity being changed. Each test shall include “soak periods” in which the quantity of interest is held constant and transient periods in which the quantity changes between preselected values. Tests shall include at least five constant values of the variable of interest over the manufacturer’s stated operational range, including the minimum value, maximum value, and typical operating value. During each soak period when the quantity is held constant, the GC shall perform continuous analyses of the test gas. The resulting data shall be used to determine either the initial stability of the GC’s performance, or the time needed for the GC’s environment and its performance to stabilize after the preceding transient in the quantity of interest. Between soak periods, the quantity of interest shall be raised or lowered at a controlled rate specified by the investigator or required by the GC’s intended application. Tests shall involve both increasing and decreasing transients in the variable of interest. During these transients, the GC shall analyze the test gas continuously to assess its response to each transient. Each transient shall begin only after the GC performance during the previous soak period is judged to be stable. Figure 5 shows an example of a time profile for a quantity of interest being tested during nonideal condition tests or special tests. The profile in the figure meets the requirements above for the number of constant values of the quantity of interest and transients between values. Other time profiles which meet the requirements above are also acceptable. Time profiles of the quantity of interest shall be recorded during tests and documented in the test report. Stabilization period at maximum value Stabilization period at maximum value Test variable Stabilization period at mid-high value Stabilization period at mid-high value Final stabilization period at initial value Stabilization period at typical operating value Stabilization period at mid-low value Stabilization period at minimum value Time Figure 5 – Example of Soak Periods and Transients in a Quantity of Interest for Tests of Transient Conditions Working Group Ballot Draft, August 2014 API Chapter 22.6 P a g e | 29 This document is not an API Standard; it is under consideration within an API technical committee but has not received all approvals required to become an API Standard. It shall not be reproduced or circulated or quoted, in whole or in part, outside of API committee activities except with the approval of the Chairman of the committee having jurisdiction and API staff. Copyright API. All rights reserved. The following procedure shall be followed during non-ideal condition tests and special tests that involve transients in an environmental variable, a flow rate, or another quantity of interest. a) The environmental chamber or device controlling the quantity of interest shall be programmed according to test requirements. The chamber or device shall be allowed to reach its operating or starting condition and shall be verified to be stable at that condition before tests begin. b) The test system shall be configured to flow the same test gas through each GC simultaneously. c) The installation manifold shall be purged with carrier gas, and each GC shall be used to analyze the carrier gas stream to confirm that no contaminants are present in the system. If contaminants are found, the purge process shall be repeated until the contaminants are eliminated. See Subsection 7.2.4 for guidance on resolving issues with contaminants in the carrier gas. d) The test gas shall be introduced into the manifold for analysis by all test GCs. The test gas shall flow through the installation long enough to ensure that any excess carrier gas present in the system is completely purged. Stability of chromatograms, peak areas and component concentrations among successive analyses by each GC shall be used to confirm that the test gas has purged the carrier gas from the system. The time required to purge the carrier gas from the system shall be recorded for later reference. e) The GCs shall be activated for continuous analysis of the test gas while the tests are performed. The GCs shall otherwise be operated per manufacturers’ recommendations. f) If the GCs are calibrated once per day during the test series, the GCs shall be calibrated at the same conditions during each calibration to eliminate possible biases related to environmental variables, gas flow rates, or other quantities of interest. Alternatively, the GCs may be calibrated once at the beginning of the tests, so that the cumulative effects of transients on performance can be assessed. g) The following information shall be recorded electronically or in a logbook during tests: 1) Test gas composition, gross heating value, and estimated hydrocarbon dew point 2) Start and end time of each test sequence 3) Names of GC data files generated during tests 4) Start time and end time of data collection and other important test steps 5) Pressure and temperature of the gas stream in the manifold 6) GC environmental conditions: ambient temperature and barometric pressure or ambient temperature and pressure in the environmental chamber 7) If available, the flow rate of gas through each GC (e.g., measured by a flow meter on each GC vent) 8) GC analysis configurations and chromatographic method: elution times, peak integration methods, response factors/response functions, etc. 9) Compositional analyses, physical property calculations, unnormalized totals, and related data 10) Chromatograms collected during analyses 11) Any unusual events during testing 7.8.7 Procedure for Tests Involving Discrete Conditions without Transients Several non-ideal condition tests and special tests involve GC analyses of one or more test gases while a quantity of interest (an environmental variable or a mechanical condition) is varied between discrete levels. These tests include: Barometric pressure test Carrier gas purity test Mounting position test Working Group Ballot Draft, August 2014 API Chapter 22.6 P a g e | 30 This document is not an API Standard; it is under consideration within an API technical committee but has not received all approvals required to become an API Standard. It shall not be reproduced or circulated or quoted, in whole or in part, outside of API committee activities except with the approval of the Chairman of the committee having jurisdiction and API staff. Copyright API. All rights reserved. Mechanical vibration test “Drop and topple” test In these tests, test gas analyses are performed under initial conditions, the quantity or condition of interest is changed, and the same test gas(es) is (are) analyzed again to evaluate the operational bias of the GC with respect to the quantity or condition being changed. Analyses during transients in the quantity of interest are not required. The following procedure shall be followed during non-ideal condition tests and special tests that involve discrete changes in the quantity of interest. a) If the barometric pressure test is being performed using an environmental chamber, the chamber shall be programmed according to test requirements. The chamber or device shall stabilize at its starting condition before tests begin. b) The test installation shall be configured to flow the same test gas through each test GC simultaneously. c) The installation manifold shall be purged with carrier gas, and each GC shall be used to analyze the carrier gas stream to confirm that no contaminants are present in the system. If contaminants are found, the purge process shall be repeated until the contaminants are eliminated. See Subsection 7.2.4 for guidance on resolving issues with contaminants in the carrier gas. d) The GCs shall be calibrated according to the following requirements. 1) For the barometric pressure test and the carrier gas purity test, the GCs shall be calibrated only once at the beginning of tests, so that the effects of barometric pressure or carrier gas purity are not biased by recalibration. 2) For the mounting position test, the mechanical vibration test, and the “drop and topple” test, the GCs shall be calibrated once at the beginning of the tests, and a second time after mechanical changes are introduced and the GCs are powered up. e) The test gas shall be introduced into the manifold for analysis by all test GCs. 1) Except as required by this procedure, the GCs shall be operated per manufacturers’ recommendations. 2) The test gas shall flow through the installation long enough to ensure that any gas present in the system from the previous test or carrier gas purge is completely removed. Stability of chromatograms, peak areas and component concentrations among successive analyses by each test GC shall be used to confirm that the test gas has eliminated the previous gas from the system. The time required to eliminate the previous gas from the system should be recorded for later reference. f) The GCs shall analyze the test gas continuously until enough successive analyses of the test gas have been performed to produce statistically useful results. Five or six successive analyses may be considered enough for statistically useful results, though more analyses will generally improve the validity of the statistics. Unnormalized totals should be between 95% and 105% for each analysis, and should be consistent among successive analyses. g) If the mounting position test is being performed, the GCs shall be configured to analyze the test gas stream continuously, and test gases shall be alternated as required. Steps (e) and (f) shall be repeated to quantify GC response time to gas composition changes for the sample line length being tested. h) After tests are complete for the initial condition, the condition or quantity of interest shall be changed to its new level, and tests shall be performed at the new condition. 1) For barometric pressure tests in which the environmental chamber controls the barometric pressure, the chamber shall be set to its new pressure condition Working Group Ballot Draft, August 2014 API Chapter 22.6 P a g e | 31 This document is not an API Standard; it is under consideration within an API technical committee but has not received all approvals required to become an API Standard. It shall not be reproduced or circulated or quoted, in whole or in part, outside of API committee activities except with the approval of the Chairman of the committee having jurisdiction and API staff. Copyright API. All rights reserved. i) 8 and allowed to stabilize at that condition. Step (f) shall be repeated at the new barometric pressure. This step shall be repeated for each new barometric pressure condition of interest. 2) For barometric pressure tests in which the environmental chamber is not capable of controlling atmospheric pressure, step (f) shall be repeated at regular intervals or when the barometric pressure reaches other values of interest. 3) For the carrier gas purity test, the test GCs shall be halted (not powered down), a carrier gas supply with a new impurity level shall be installed, and the test GCs shall be restarted. The GCs shall analyze the test gas continuously using the new carrier gas supply until the stability of chromatograms, peak areas and component concentrations among successive analyses by each test GC indicate that the new carrier gas has replaced the old supply, and that analyses are stable. Once results are stable, step (f) shall be repeated for the new carrier gas supply. This step shall be repeated for each new carrier gas impurity level of interest. 4) For the mounting position test, the test GCs shall be powered down, and the sample line shall be replaced with another line of the next length of interest. The test GCs shall be powered up, and steps (b) through (g) shall be repeated. This sequence shall be repeated for each sample line length of interest. 5) For the mechanical vibration test and the “drop and topple” test, the test GC(s) shall be powered down, disconnected and removed from the test manifold and/or environmental chamber. The GC(s) shall be subjected to the chosen mechanical vibrations or shocks, and then reinstalled in the test manifold and/or environmental chamber. The test GCs shall be powered up, and steps (b) through (f) shall be repeated. The following information shall be recorded electronically or in a logbook for each test: 1) Test gas composition, gross heating value, and estimated hydrocarbon dew point 2) Start and end time of each test sequence 3) Names of GC data files generated during tests 4) Start time and end time of data collection and other important test steps 5) Pressure and temperature of the gas stream in the manifold 6) GC environmental conditions: ambient temperature and barometric pressure or ambient temperature and pressure in the environmental chamber 7) If available, the flow rate of gas through each GC (e.g., measured by a flow meter on each GC vent) 8) GC analysis configurations and chromatographic method: elution times, peak integration methods, response factors/response functions, etc. 9) Compositional analyses, physical property calculations, unnormalized totals, and related data 10) Chromatograms collected during analyses 11) Any unusual events during testing Test Facility Requirements The laboratory or testing facility conducting performance evaluation tests under this protocol shall either provide the details of its uncertainty calculations to the facility user or shall be certified by a third party in the measurement uncertainty of each variable monitored and reported in the test results. All references used to establish the measurement uncertainty or performance specification of the GC under test shall be traceable to national or internationally recognized standards. The facility system uncertainty and the uncertainty of each monitored Working Group Ballot Draft, August 2014 API Chapter 22.6 P a g e | 32 This document is not an API Standard; it is under consideration within an API technical committee but has not received all approvals required to become an API Standard. It shall not be reproduced or circulated or quoted, in whole or in part, outside of API committee activities except with the approval of the Chairman of the committee having jurisdiction and API staff. Copyright API. All rights reserved. variable included in the test report for establishing the performance of the GC shall include the measurement uncertainty at the 95% confidence level. If requested by the user of the facility, the calibration facility shall provide the documentation for establishing its system uncertainty and the frequency of uncertainty verification, unless the performance uncertainty of the facility is certified and periodically verified by a nationally or internationally recognized third party. In order to assure the validity of tests performed under this testing protocol, the laboratory or testing facility performing the tests shall provide evidence that the tests are performed in accordance with the procedures in this standard. This evidence shall be provided at the request of any user of the laboratory or facility. Providing validity that the tests were performed in accordance with the applicable test procedure in this standard is the responsibility of the user of the facility. A user of the facility wanting a detailed analysis of the performance of the lab/facility can request a review all of its procedures and processes. The user may require a lab/facility to meet minimum performance criteria in order to demonstrate that the facility can successfully perform the test. If the lab/facility meets all the user requirements and the other requirements defined in this section of the standard, then the test results shall be considered valid. 9 Uncertainty Analysis and Calculation 9.1 General This section explains specific uncertainty terms relevant to GC performance, how uncertainty values are determined, and how they are to be presented in test reports. Relevant examples of uncertainty calculations are also presented. 9.2 Types of Uncertainty Calculations This subsection defines the different types of uncertainty to be determined when characterizing and comparing GC performance under this protocol. In addition to uncertainties associated with the test facility and the GC itself, uncertainties in gas blend compositions and gas properties shall also be considered. 9.2.1 Test Facility Uncertainties Parameters and conditions applied to the GC by the test facility, such as ambient temperature, barometric pressure, the temperature of the test gas, and the flow rates of the test gas and carrier gas, are measured with secondary instruments that carry measurement uncertainties. These measurement uncertainties shall be quantified during calibration of the secondary instruments, and shall be included in the presentation of results. While these uncertainties may not be needed to calculate uncertainties in GC results, they shall be included in graphs or other features of test reports used to assess the significance of the changing parameters on GC performance. The secondary instrument calibrations shall be current and traceable to a national standards organization, such as NIST in the United States or an equivalent internationally recognized certifying organization. The measurement uncertainties of these secondary instruments, with appropriate confidence levels, shall be obtained from their calibration certificates and shall be documented in the GC test report. Parameter uncertainties in the GC test report shall be listed at the 95% confidence level. If measurement uncertainties obtained during an instrument calibration are not assigned a 95% confidence level, the method used to establish the 95% confidence level for the secondary measurements shall be documented in the test report. Working Group Ballot Draft, August 2014 API Chapter 22.6 P a g e | 33 This document is not an API Standard; it is under consideration within an API technical committee but has not received all approvals required to become an API Standard. It shall not be reproduced or circulated or quoted, in whole or in part, outside of API committee activities except with the approval of the Chairman of the committee having jurisdiction and API staff. Copyright API. All rights reserved. 9.2.2 Reference Gas Blend Composition Uncertainties Compositions of test gases and calibration gases will carry uncertainties associated with the blending process. Most primary calibration gas standards are gravimetrically prepared using high precision balances, and the uncertainties in the balance measurements determine the uncertainties in the gas composition. For components present in significant amounts, uncertainties are typically between 1% and 2% relative to their certified values. (As an example, a gas blend with a certified ethane content of 3 mol% would likely have an uncertainty in ethane of 0.03 mol % to 0.06 mol %.) The uncertainties in gas blend compositions shall be considered when assessing GC measurement error. Compositions of test gases and calibration gases shall be certified and traceable by weight to a national standards organization such as the National Institute of Standards and Technology (NIST) in the United States or an equivalent internationally recognized certifying organization. Test gases and calibration gases shall be prepared in accordance with API MPMS Chapter 14.1, Subsection 16.2. Each component concentration shall have an uncertainty at the 95% confidence level that meets the requirements of GPA Standard 2198. Test gas and calibration gas certificates of analysis shall include the calculated uncertainties in each component concentration, either in mole percent or in a relative percent of the certified value. Uncertainties in the component concentrations shall be calculated by the blend preparer using uncertainties of the instruments used in the preparation process, bias errors observed during calibration of the instruments, and any impurities in raw materials. The confidence level of the uncertainties shall also be included on the certificate. The compositional uncertainty of each test gas and calibration gas, including the confidence level of the uncertainty values, shall be recorded in the test report. Compositions of test gas blends and calibration gas blends shall be verified before they are used in tests, using the verification GC or a separate GC not otherwise involved in the tests. The verification process shall follow the procedure in Subsection 7.8.3. The GC used to verify the gas compositions shall be calibrated according to the procedure in Subsection 7.8.2. 9.2.3 Reference Gas Blend Property Uncertainties GC performance is also assessed by comparing gas properties computed from GC analyses to reference gas properties computed from the gravimetric composition of the test gas. The uncertainty in a reference gas property depends upon both the uncertainties in the gravimetric composition and the method used to compute the property. Subsection 9.3.2 discusses a method for computing uncertainties in gas properties using propagation of uncertainties. These property uncertainties shall be calculated and documented in the test report, and shall be considered when computing Warren reproducibility, the difference between the analyzed quantity and the quantity from the gravimetric composition. 9.2.4 Uncertainties in GC Analyses Two types of uncertainties are present in GC analyses. Random uncertainties in analyzed component concentrations and computed properties are caused by slight variations in valve timing, sample volume, or flow rate through the system. These variations shall be quantified by performing several repeat analyses of the same calibration gas or test gas stream, and then determining the average analyzed component concentration or property and its 95% confidence interval. Random uncertainties are determined through the mandatory baseline (ideal condition) tests, and are quantified by calculated repeatability values as discussed in Subsection 9.3. Bias errors are consistent shifts in GC analyses from the true composition or property. These can be caused by changes in pressure of the sample stream leaving an upstream Working Group Ballot Draft, August 2014 API Chapter 22.6 P a g e | 34 This document is not an API Standard; it is under consideration within an API technical committee but has not received all approvals required to become an API Standard. It shall not be reproduced or circulated or quoted, in whole or in part, outside of API committee activities except with the approval of the Chairman of the committee having jurisdiction and API staff. Copyright API. All rights reserved. regulator, changes in barometric pressure that affect the sample flow rate through a GC that vents the sample stream to atmosphere, non-linear detector response for one or more components, errors during the calibration process, and/or other operational influences on GC behavior. Bias errors due to changes in operational variables are determined from the results of non-ideal tests and special tests. Bias errors may also be identified from baseline tests as measurement errors in compositions or properties of the test gas. Bias errors are quantified by Warren reproducibility, as discussed in Subsection 9.3. Multiple sources of uncertainty can propagate to produce combined uncertainties in compositional analyses and in properties computed from the analyses. For example, when a GC is calibrated and then used to analyze a test gas, the combined uncertainty in the analyzed test gas composition includes (1) gravimetric uncertainties in the calibration gas blend, (2) random uncertainties (repeatability) in the response factors from the calibration, and (3) random uncertainties in peak areas during the test gas analysis. The combined uncertainty in the analyzed composition can also combine with uncertainties in component properties to produce a combined uncertainty in gas properties such as gross heating value. This is similar to the combined uncertainties in reference gas properties discussed in Subsection 9.2.3. Repeatability of gas compositions and repeatability of properties determined by each GC under test shall be calculated and documented in the test report. Combined uncertainties in analyzed gas compositions and properties determined from the analyses shall also be computed and reported. Repeatability values and combined uncertainties shall be presented at the 95% confidence level. Note that computed GC uncertainties are only valid for the range of operating conditions over which the GC is tested. 9.2.5 Significance Determination and Acceptance Criteria The non-ideal tests and special tests provide data to determine the Warren reproducibility of GC analyses and computed gas properties (differences between values produced by the GC and the value listed on the test gas certificate of analysis). Warren reproducibility values are also used to quantify biases with changes in operating conditions. The test report shall indicate whether Warren reproducibility values are statistically significant. The threshold for significance shall be stated in the test report. A recommended method for determining significance is to compare the 95% confidence interval on a quantity produced by the GC analysis and the 95% confidence interval on the same quantity determined from the gravimetric test gas composition. If the confidence intervals do not overlap, the bias in the quantity calculated via Warren reproducibility should be considered statistically significant. All acquired data shall be included in the report, including outliers. If the cause of outliers is known or can be defined, it should be stated with the reported data. An industry-accepted statistical method, such as ASTM E178, may be used to assess whether outliers should be excluded from the uncertainty analysis, to determine 95% confidence intervals, and to determine statistical significance. If such a method is used to remove outliers from the analysis, the report shall describe the method used and the justification under that method for removing the data point(s) before calculating uncertainties. Acceptance criteria for repeatability and Warren reproducibility of chromatogram peak areas, normalized component concentrations, and calculated properties may be found in various industry standards. Examples include, but are not limited to, API MPMS Chapter 14.1, ASTM D1945, and GPA 2261. The acceptance criteria used to evaluate a GC’s repeatability and Warren reproducibility shall be selected before tests begin. The criteria should involve relative Working Group Ballot Draft, August 2014 API Chapter 22.6 P a g e | 35 This document is not an API Standard; it is under consideration within an API technical committee but has not received all approvals required to become an API Standard. It shall not be reproduced or circulated or quoted, in whole or in part, outside of API committee activities except with the approval of the Chairman of the committee having jurisdiction and API staff. Copyright API. All rights reserved. limits that increase as the concentration of the component decreases and the measurement resolution of the GC is approached. It is recommended that all selected criteria be taken from a single standards organization, since criteria from different organizations may conflict with one another. 9.3 How to Calculate Uncertainty This subsection describes methods for calculating the uncertainty data needed for GC evaluations. This discussion assumes that measurement uncertainties of secondary instruments have been obtained during instrument calibration, and that gravimetric uncertainties in gas blends have been obtained from the blend providers. Sample calculations are provided where practical. 9.3.1 Calculating 95% Confidence Intervals To compare results from different GCs on an equal basis, all results shall be expressed with an uncertainty at the 95% confidence level. For quantities determined from a series of repeat measurements, such as the repeatability of an analyzed quantity, the 95% confidence interval U95 on the measurand shall be calculated using the sample standard deviation. 95% confidence intervals shall be calculated using an accepted industry method, such as the coverage factor approach found in the ISO Guide to Uncertainty in Measurement (GUM) or the use of the tstatistic from the Student’s t distribution. One acceptable method is described below. For a series of n repeat measurements z1, z2, ..., zn measured or determined from analysis, the sample standard deviation s shall be calculated by the formula below to characterize the scatter in the measurements. ∑ ̅ 1 In the formula above, ̅ is the arithmetic mean of the n measurements. To obtain the 95% confidence interval, the standard deviation shall be multiplied by the appropriate coverage factor k from ISO GUM or by the appropriate t-statistic from the student’s t distribution. If the t-statistic is used, it shall be determined for a symmetric 95% confidence interval with (n – 1) degrees of freedom. Tables of t-statistic values can be found in ISO GUM or in appropriate statistics references. The 95% confidence interval may be expressed in absolute units, or may be expressed as a percentage by dividing by the mean value and multiplying by 100%. absoluteunits or %ofvalue 100%or 100% ̅ ̅ For quantities whose uncertainties are determined by means other than repeat measurements, such as manufacturer specifications, data in calibration certificates, or scientific or engineering experience, the method used to establish the 95% confidence level shall be documented in the test report. 9.3.2 Propagating Uncertainties If several independent measured quantities are combined to calculate a dependent quantity, the uncertainties in the independent quantities will propagate into the uncertainty in the dependent quantity. Examples of dependent quantities include analyzed test gas compositions, properties calculated from GC analyses, and properties calculated from certified gas compositions. The uncertainty in any dependent quantity shall be calculated by the method described here. Working Group Ballot Draft, August 2014 API Chapter 22.6 P a g e | 36 This document is not an API Standard; it is under consideration within an API technical committee but has not received all approvals required to become an API Standard. It shall not be reproduced or circulated or quoted, in whole or in part, outside of API committee activities except with the approval of the Chairman of the committee having jurisdiction and API staff. Copyright API. All rights reserved. If a dependent quantity z is calculated from independent quantities w1, w2, ..., wn by a general function f given by , ,…, , and if each independent quantity wi carries an uncertainty u(wi), the combined uncertainty in z shall be calculated by the general law of uncertainty propagation. ⋯ In the formula above, is the partial derivative of the function f with respect to the quantity wi. The uncertainty in z shall be taken to be at the same confidence level as the uncertainties u(wi) used in the calculation. For example, if all uncertainties u(wi) are standard deviations of repeat measurements, u(z) shall be taken as the standard deviation in z. All uncertainties in wi used in the calculation shall be at the same confidence level. The 95% confidence interval U95(wi) for each independent quantity may be used as input to the calculation to obtain the 95% confidence interval on z. However, the preferred method is to calculate the standard uncertainty u(z) from the standard deviations or standard uncertainties u(wi), and then multiply u(z) by an appropriate coverage factor k or t-statistic to obtain U95(z). Examples of uncertainty propagation for an analyzed gas composition are given in Subsections 9.3.5 and 9.3.5. 9.3.3 Calculating Reference Gas Blend Property Uncertainties Subsection 9.2.2, Reference Gas Blend Composition Uncertainties, describes the requirements for obtaining uncertainties in test gas and calibration gas compositions. These composition uncertainties shall be used to compute uncertainties in test gas reference properties such as heating value or relative density. In turn, uncertainties in reference properties shall be used to determine if biases in GC results are statistically significant, as discussed in subsection 10. Uncertainties in reference properties of gas blends should be determined using one of the methods below. If neither method can be applied to the calculation, the method used to determine uncertainties in gas blend reference properties shall be documented in the test report. Some reference gas properties may be computed using equation-of-state software. An example is AGA Report No. 8, which is used to calculate the compressibility factor or density of natural gas. If the software documentation includes a standard uncertainty in properties calculated for gas compositions within a predefined range of compositions, and the 95% confidence intervals of the test gas composition fall entirely within this range, the stated uncertainty of properties computed by the software may be taken as the uncertainty in the test gas property. Some reference gas properties may be computed using formulas that involve the mole percent or mole fraction of each component and the property of each component. An example is the use of GPA Standards 2145 and 2172 to compute gross heating value, molecular weight, and other properties. If this approach is used, and the properties of each component carry individual uncertainties, the uncertainty in the property of the gas blend can be determined from the uncertainties in the gravimetric amounts and the individual component properties using the propagation of uncertainties method described in subsection 9.3.2. Working Group Ballot Draft, August 2014 API Chapter 22.6 P a g e | 37 This document is not an API Standard; it is under consideration within an API technical committee but has not received all approvals required to become an API Standard. It shall not be reproduced or circulated or quoted, in whole or in part, outside of API committee activities except with the approval of the Chairman of the committee having jurisdiction and API staff. Copyright API. All rights reserved. 9.3.4 Repeatability of GC Analyses Repeatability is the closeness of agreement of successive runs using the same test gas, chromatograph and operator over a short period of time. In this procedure, repeatability quantifies random uncertainties in analyzed compositions and in the properties determined from those compositions. Repeatability does not represent the overall uncertainty in analyzed values; overall uncertainty is discussed in Subsection 9.3.5. To quantify the repeatability in an analyzed quantity, such as a component concentration or a calculated property, the 95% confidence interval (U95) shall be calculated on the average value from five or more successive analyses of the test gas, as described in Subsection 9.3.1. Repeatability values for normalized component concentrations and calculated properties produced by GC baseline tests shall be calculated and reported. Component concentrations in each analysis shall be normalized to a total of 100 mol% before gas properties are calculated and before average quantities are computed (“normalizing before averaging”). Repeatability may be calculated either as a percent of the value of the quantity, or in absolute units. Example: Five successive analyses of a test gas produce normalized ethane values of 4.592, 4.609, 4.602, 4.593, and 4.602 mol%. The average ethane value ̅ is 4.600 mol%, and the sample standard deviation s is 0.00709 mol%. For a sample of five values, the t-statistic corresponding to a 95% confidence level on the average is 2.7764. The repeatability r of the ethane measurement as a percent of value is calculated as %ofvalue ̅ 100% 2.7764 0.00709 4.600 % % 100% 0.428% The repeatability of the ethane measurement in units of mol% is calculated as absoluteunits 2.7764 0.00709 % 0.0197mol% Repeatability values shall also be calculated for normalized component concentrations produced during calibration runs. The calibration repeatability values do not need to be reported separately, but shall be used to determine measurement errors and bias errors (Warren reproducibility values) of GC results. 9.3.5 Combined Uncertainties in GC Analyses Each component concentration determined by the GC analysis of a test gas is calculated from three quantities: the integrated peak area for that component during calibration, Ai,cal, the normalized mole fraction or mole percentage of the component in the calibration gas blend, yi,cal, and the integrated peak area for that component in the test gas, Ai,meas. Uncertainties in all of these quantities shall be combined to obtain the uncertainty in the analyzed component concentration as discussed below. In the general case, when a GC is calibrated, the mole fraction xi of component i in the calibration gas may be related to its integrated peak area Ai in its chromatogram by a nonlinear response function such as the following polynomial. Some GCs can be programmed to use nonlinear response functions. Many analyzers, however, assume the linear response function below. Ci is the response factor for component i, and is assumed to be constant over the entire composition range. The uncertainty propagation formulas below assume the use of linear response factors. If nonlinear response functions are used by the GC under test, propagation of uncertainties Working Group Ballot Draft, August 2014 API Chapter 22.6 P a g e | 38 This document is not an API Standard; it is under consideration within an API technical committee but has not received all approvals required to become an API Standard. It shall not be reproduced or circulated or quoted, in whole or in part, outside of API committee activities except with the approval of the Chairman of the committee having jurisdiction and API staff. Copyright API. All rights reserved. (Subsection 9.3.2) shall be used to derive the uncertainty in the analyzed component concentrations. The derivation shall be documented in the test report. The calibration process produces an average peak area Ai,cal for each component. This is used with the normalized mole fraction or mole percentage yi,cal of the component in the calibration gas blend to compute the response factor Ci for that component. The same calibration factor is then used with the peak area from the analysis of an unknown test gas to measure the unknown amount xi,meas of component i. If a linear response function is used, the calibration factor is assumed to be constant, so that , , , , and the measured mole fraction or mole percent xi,meas of component i in the test gas is computed as , , , , Once each component has been measured, the resulting composition is normalized to produce a total of 1 (100%) for all component concentrations: , , ∑ , The combined uncertainty of the measured, unnormalized mole fraction of component i, U95(xi,meas), shall be computed by the formula below, derived from propagation of uncertainties: , , , , . . . , The 95% confidence interval on the component concentration in the calibration gas, U95(yi,cal), shall be obtained from the certificate of analysis of the calibration gas. Since this quantity is to be provided by the blender at the 95% confidence level, the repeatability r of each peak area at the 95% confidence level shall also be used in the calculation above. The peak area repeatability values shall be calculated as described in Subsection 9.3.4. Example: A GC is calibrated on a gas blend with a certified methane content of 94.766 mol%. The uncertainty in this methane value is 0.35% relative at the 95% confidence level. The same GC is then used to analyze a test gas blend, and the analysis produces an average unnormalized methane value of 94.737 mol%. The table below shows the methane peak areas from each of the five calibration runs, each of the five analyses of the test gas, the average peak areas, and the repeatability values at the 95% confidence level. Calibration run Analysis run peak areas peak areas Run Working Group Ballot Draft, August 2014 1 6225524 6723755 2 6226322 6723597 3 6225408 6723751 4 6224970 6723813 API Chapter 22.6 P a g e | 39 This document is not an API Standard; it is under consideration within an API technical committee but has not received all approvals required to become an API Standard. It shall not be reproduced or circulated or quoted, in whole or in part, outside of API committee activities except with the approval of the Chairman of the committee having jurisdiction and API staff. Copyright API. All rights reserved. 5 6226591 6723604 average 6225763 6723704 sample standard deviation (in units of peak area) 672.716 97.489 t-statistic, n = 5 2.7764 2.7764 repeatability, r (in units of peak area) 1867.7 270.67 The combined uncertainty of the measured, unnormalized methane amount is then computed using the formula above. , , , . , 94.737 0.332 % . , . 0.0035 94.766 94.766 % 1867.7 6225763 % 270.67 6723704 % The combined uncertainty of the measured, normalized mole fraction of component i, U95(yi,meas), shall be computed by the formula below. Note that uncertainties in all unnormalized component concentrations are needed in order to calculate the uncertainty in a single normalized component concentration. The combined uncertainty in the component concentration shall be computed and reported in the same units as the component concentration itself, either as a mole fraction or in mole percent. , , , , ∑ , ∑ , Example: For the same analysis in the previous example, the table below lists the unnormalized concentrations of each component and their combined uncertainties at the 95% confidence level, along with quantities needed to calculate the combined uncertainty of normalized component concentrations. In this example, the unnormalized total is, coincidentally, 100 mol%, so that the unnormalized and normalized amounts are identical. Component i Unnormalized Normalized mol%, , mol%, , , (in mol%) , Nitrogen 0.993 0.993 7.459×10⁻³ 5.564×10⁻⁵ Carbon dioxide 0.501 0.501 4.014×10⁻³ 1.611×10⁻⁵ Methane 94.737 94.737 3.316×10⁻¹ 1.100×10⁻¹ Ethane 2.022 2.022 1.215×10⁻² 1.475×10⁻⁴ Propane 0.746 0.746 5.991×10⁻³ 3.589×10⁻⁴ Isobutane 0.299 0.299 2.486×10⁻³ 6.179×10⁻⁶ Working Group Ballot Draft, August 2014 API Chapter 22.6 P a g e | 40 This document is not an API Standard; it is under consideration within an API technical committee but has not received all approvals required to become an API Standard. It shall not be reproduced or circulated or quoted, in whole or in part, outside of API committee activities except with the approval of the Chairman of the committee having jurisdiction and API staff. Copyright API. All rights reserved. n-Butane 0.302 0.302 2.461×10⁻³ 6.058×10⁻⁶ Isopentane 0.151 0.151 2.427×10⁻³ 5.892×10⁻⁶ n-Pentane 0.150 0.150 2.756×10⁻³ 7.596×10⁻⁶ n-Hexane 0.058 0.058 8.686×10⁻⁴ 7.545×10⁻⁷ n-Heptane 0.030 0.030 4.497×10⁻⁴ 2.022×10⁻⁷ n-Octane 0.009 0.009 2.384×10⁻⁴ 5.681×10⁻⁸ n-Nonane 0.001 0.001 3.333×10⁻⁵ 1.111×10⁻⁹ n-Decane 0.001 0.001 2.550×10⁻⁵ 6.504×10⁻¹⁰ , , 100.000 0.1103 mol%2 The combined uncertainty of the measured, normalized methane amount is then computed using the formula above. , 94.737 ∑ , , ∑ , % , 0.332 94.737 , % % 0.1103 100 % % 0.458 % 9.3.6 Combined Uncertainties in Gas Properties Calculated from GC Analyses After the combined uncertainties in analyzed component concentrations have been computed using the methods in Subsection 9.3.5, uncertainties in test gas properties computed from the analysis can be computed. The same method used to compute uncertainties in reference properties of the test gas (Subsection 9.3.3) shall be used to compute uncertainties in analyzed properties of the test gas, except that the uncertainties in the analyzed component concentrations shall be used in place of the gravimetric uncertainties of the certified composition. Example: The gross heating value of the test gas blend in the previous example is to be calculated using the method of GPA 2172. That standard lists reference data for the heating value Hv,i of each natural gas component, and states a relative uncertainty of 0.1% in each component heating value. The gross heating value is computed from the normalized analysis using the following formula. ∑ , The compressibility factor Z is to be computed using the AGA-8 equation of state. For most gas streams of interest, the value of Z computed by AGA-8 carries a relative uncertainty of 0.1% of value. Using the formula for uncertainty propagation, begin by deriving the uncertainty for the product , , the contribution of normalized component i to the heating value of the test gas blend. Let , : Working Group Ballot Draft, August 2014 API Chapter 22.6 P a g e | 41 This document is not an API Standard; it is under consideration within an API technical committee but has not received all approvals required to become an API Standard. It shall not be reproduced or circulated or quoted, in whole or in part, outside of API committee activities except with the approval of the Chairman of the committee having jurisdiction and API staff. Copyright API. All rights reserved. , , Dividing both sides by , , , , , , , , , , , Next comes the uncertainty in the sum of all heating value contributions. Let ∑ : ∑ , , ⋯ , ⋯ , ⋯ 1 1 ⋯ 1 Finally, the uncertainty in the gross heating value of the test gas blend is computed. ∑ , 1 The table below lists the analyzed composition and uncertainties in each component, reference heating values for each component from GPA 2145, results of intermediate calculations, the final heating value Hv computed from the gas analysis, and the uncertainty in Hv. The values in the table are computed from the formulas derived above. As noted, the uncertainty in Hv,i for each component and in the value of Z from AGA-8 is 0.1% of value. Working Group Ballot Draft, August 2014 API Chapter 22.6 P a g e | 42 This document is not an API Standard; it is under consideration within an API technical committee but has not received all approvals required to become an API Standard. It shall not be reproduced or circulated or quoted, in whole or in part, outside of API committee activities except with the approval of the Chairman of the committee having jurisdiction and API staff. Copyright API. All rights reserved. Component i Normalized mol%, , , , . (Btu/scf) (in mol%) . (Btu/scf) , . (Btu/scf) Nitrogen 0.993 7.459×10⁻³ 0 0 0 Carbon dioxide 0.501 4.014×10⁻³ 0 0 0 Methane 94.737 3.316×10⁻¹ 1010.0 956.84 Ethane 2.022 1.215×10⁻² 1769.7 35.78 2.482×10⁻¹ Propane 0.746 5.991×10⁻³ 2516.2 18.77 1.642×10⁻¹ Isobutane 0.299 2.486×10⁻³ 3252.0 9.72 8.759×10⁻² n-Butane 0.302 2.461×10⁻³ 3262.4 9.85 8.726×10⁻² Isopentane 0.151 2.427×10⁻³ 4000.9 6.04 9.935×10⁻² n-Pentane 0.150 2.756×10⁻³ 4008.7 6.01 1.124×10⁻¹ n-Hexane 0.058 8.686×10⁻⁴ 4756.0 2.75 4.240×10⁻² n-Heptane 0.030 4.497×10⁻⁴ 5502.5 1.65 2.540×10⁻² n-Octane 0.009 2.384×10⁻⁴ 6248.9 0.55 1.502×10⁻² n-Nonane 0.001 3.333×10⁻⁵ 6996.4 0.09 2.354×10⁻³ n-Decane 0.001 2.550×10⁻⁵ 7743.0 0.08 1.993×10⁻³ , , 4.715 1048.15 Btu/scf 2 95 95 ∑ Z (from AGA-8) = 0.9977 4.73 Btu/scf , , , 95 , 1053.53 Btu/scf 4.74 Btu/scf 9.3.7 Comparison of Analyzed Quantities to Reference Quantities Warren reproducibility is defined as the comparison between a reference property of the test gas and the same property of the test gas as analyzed by the GC. During non-ideal condition tests or special tests, multiple analyses on a single test gas blend at different conditions of interest (such as different test gas flow rates, different ambient temperatures, or exposure to vibration) produce data on the Warren reproducibility of the GC with respect to the changing condition. Warren reproducibility shall be used to quantify bias errors due to changes in the Working Group Ballot Draft, August 2014 API Chapter 22.6 P a g e | 43 This document is not an API Standard; it is under consideration within an API technical committee but has not received all approvals required to become an API Standard. It shall not be reproduced or circulated or quoted, in whole or in part, outside of API committee activities except with the approval of the Chairman of the committee having jurisdiction and API staff. Copyright API. All rights reserved. operational parameters listed in Subsection 6.3, and shall also be used to quantify measurement errors by the GC in baseline tests. The bias error in the measured value of component i, i, shall be computed as the Warren reproducibility, or the difference between the average measured mole fraction and the actual mole fraction in the gas from the certificate of analysis: , , , Similarly, if a gas property P is computed from the average measured composition and the actual certified composition, the bias in the property shall be computed as: , Example: In the example above, if the gross heating value calculated from the average analyzed composition is 1050.53 Btu/scf, and the gross heating value calculated from the certified composition of the test gas is 1046.20 Btu/scf, the Warren Reproducibility (or bias error) is , , , 1050.53 / 1046.20 / 4.33 / . The biases shall be compared to acceptance criteria chosen before tests. For acceptable performance, properties calculated and reported by the GC shall agree with the reference values of the certified test gas composition to within the chosen acceptance criteria. The reference properties of test gases shall be calculated from the certified gas compositions using the same methods used by the GC for property calculations, including the same base conditions. If gas properties produced by the GC are to be verified separately, peak areas determined by the chromatograms and the response functions used by the GC to compute component concentrations shall be used in the verification calculations. Test gas properties reported by the GC during environmental tests shall be evaluated against (a) the performance stated by the GC manufacturer for the range of tested environmental temperatures, and/or (b) the performance required for the GC’s intended application. As part of the evaluation, trends in reported properties over time shall be compared to trends in environmental temperature and barometric pressure over time. To determine if the Warren reproducibility is statistically significant, the average and 95% confidence interval of the analyzed quantity of interest for each group of five or more analyses on a test gas shall also be compared to the average and 95% confidence interval on the same quantity derived from the certified test gas composition. If the confidence intervals do not overlap, the bias in the quantity calculated via Warren reproducibility shall be considered statistically significant. This comparison shall be applied to normalized component concentrations and calculated properties of test gases, and if available from the GC, to the same quantities produced by analyses of calibration gases during calibration runs. Example: The gross heating value calculated from the average analyzed composition is 1050.53 Btu/scf, with U95 = ±4.74 Btu/scf. Suppose the gross heating value calculated from the certified composition of the test gas is 1046.20 Btu/scf, with U95 = ±2.50 Btu/scf. The 95% confidence interval on the analyzed heating value is 1045.79 Btu/scf to 1055.27 Btu/scf, while the 95% confidence interval on the heating value calculated from the certified composition is 1043.70 Btu/scf to 1048.70 Btu/scf. Because these intervals overlap, the Warren reproducibility in the gross heating value is not statistically significant. Working Group Ballot Draft, August 2014 API Chapter 22.6 P a g e | 44 This document is not an API Standard; it is under consideration within an API technical committee but has not received all approvals required to become an API Standard. It shall not be reproduced or circulated or quoted, in whole or in part, outside of API committee activities except with the approval of the Chairman of the committee having jurisdiction and API staff. Copyright API. All rights reserved. 9.3.8 Linearity Linearity quantifies the usable detector range for each component. determined using the procedure in GPA 2198. 9.4 Linearity shall be Presentation of Uncertainty 9.4.1 Test Facility Uncertainties The test report shall include a table of parameters and conditions applied to the GC by the test facility, such as pressures, temperatures, and flow rates. Uncertainties in these secondary measurements at the 95% confidence level shall be listed in the table, along with the method used to establish the 95% confidence level for each measurement. 9.4.2 Uncertainties in Reference Gas Blend Compositions and Properties Certified compositions of calibration gases and test gases, and calculated reference properties of test gases, shall be presented in tabular format. Uncertainties in component concentrations and calculated reference properties of calibration gases shall be included in the table alongside each reference value. Uncertainties shall be listed at the 95% confidence level. 9.4.3 Repeatability of GC Analyses The repeatability of analyzed component concentrations and gas properties calculated from analyses shall be reported from baseline tests, and from any non-ideal condition tests and special tests for which repeatability is to be studied. To assess the repeatability of a GC, multiple analyses are performed on the same test gas blend in sequence. Depending upon the test, repeatability data may be collected and reported on multiple test gases. Repeatability data shall be presented in tabular format. The average values and the repeatability values at the 95% confidence level (r values or U95 values) of each component concentration or property shall be presented in adjacent columns to allow comparisons. The table shall state whether the repeatability values are reported as a percentage of the average value or in absolute units. A separate repeatability table shall be presented for each test gas in the baseline tests. A separate repeatability table shall also be presented for each non-ideal test and special test in which repeatability is of interest. 9.4.4 Comparisons of Analyzed Quantities to Reference Quantities Baseline tests, non-ideal tests and special tests all involve comparisons of analyzed quantities (compositions or calculated properties) to reference quantities of the test gas in the form of Warren reproducibility. For each comparison in baseline tests to determine measurement error, a table shall be presented that contains the following information in separate columns: The value of the reference quantity (certified component concentration or calculated property) The combined uncertainty on the reference quantity The average analyzed value of the quantity The combined uncertainty on the analyzed value of the quantity The Warren reproducibility (the difference between the average analyzed value and the reference value) Whether the Warren reproducibility is statistically significant or exceeds acceptance criteria The combined uncertainties shall be reported at the 95% confidence level, and in the same units as the component concentration or property itself. Working Group Ballot Draft, August 2014 API Chapter 22.6 P a g e | 45 This document is not an API Standard; it is under consideration within an API technical committee but has not received all approvals required to become an API Standard. It shall not be reproduced or circulated or quoted, in whole or in part, outside of API committee activities except with the approval of the Chairman of the committee having jurisdiction and API staff. Copyright API. All rights reserved. Non-ideal tests and special tests determine the dynamic response of a GC to changes in operating conditions and biases related to these changes. For each comparison in non-ideal tests and special tests, the reference quantity and analyzed quantity shall be presented in graphs. The reference quantity and average analyzed quantity shall be plotted on the vertical axis, and the test condition of interest shall be plotted on the horizontal axis. Uncertainties in the reference quantity and analyzed quantity shall be included as vertical error bars on the data points. Test facility uncertainties in the operational variable being tested shall be included as horizontal error bars on the data points. The error bars shall represent the uncertainty of the quantity at the 95% confidence level. If the vertical error bars of the reference quantity and the analyzed quantity at the same operating condition do not overlap, the Warren reproducibility can be considered statistically significant. 9.4.5 Linearity Linearity shall be reported in accordance with GPA 2198. 10 Test Report The intent of this test protocol is not to define a level of performance that a GC under test has to meet. Rather, the intent is to allow users to compare performance characteristics of different brands and models of GCs with similar performance specifications, under the same operating conditions, as a function of parameters that are important in selecting a GC for a known application. To achieve this goal, test reports should provide users with sufficient information to compare results from various GCs and choose the appropriate units for their application(s). As a minimum, the test report should contain the following sections: Summary Description of GC tested (GC manufacturer and model, column configuration, detector type, software version) Parameters affecting device performance (as listed in Section 6) Description of the test facility or facilities (including uncertainties – see Section 9) Tests performed Test results o Comparison of properties computed from GC analyses to properties computed from certified compositions of test gases o Response linearity, i.e., the usable detector range for each component, determined per API 14.1 Table E1 and GPA 2198 Appendix A o Dynamic response of GC analyses and derived properties to changing test parameters Uncertainty analyses o Repeatability of computed properties (determined from baseline tests) o Biases in GC analyses and computed properties related to changes in test parameters Discussion of test results Conclusions Appendices (descriptive literature, specification sheets, etc.) The raw data and records of test conditions for all tests should be saved and/or archived for future reference and verification, in the event that any reported results or computations are questioned. All acquired data shall be reported, without removing any outliers. If the cause of any outliers is known, it should be stated in the reported data. The report shall identify any outlier data that are not used to compute properties from GC analyses or otherwise included in test results. Working Group Ballot Draft, August 2014 API Chapter 22.6 P a g e | 46 This document is not an API Standard; it is under consideration within an API technical committee but has not received all approvals required to become an API Standard. It shall not be reproduced or circulated or quoted, in whole or in part, outside of API committee activities except with the approval of the Chairman of the committee having jurisdiction and API staff. Copyright API. All rights reserved. The following is an example outline of a test report that includes all required information. Test GC Manufacturer: Model: Serial number: Date of manufacture: Column configuration: Valve configuration and valve timing: Column temperatures: Line flow rates: Detector: Carrier gas and related equipment: Response functions (proportional, linear, polynomial, etc.) for each component: Electrical area classification: Verification GC Manufacturer: Model: Serial number: Date of manufacture: Column configuration: Valve configuration and valve timing: Column temperatures: Line flow rates: Detector: Carrier gas and related equipment: Response functions (proportional, linear, polynomial, etc.) for each component: Mandatory Baseline (Ideal Condition) Test Results Test gas composition and uncertainty: Calibration gas composition and uncertainty: Carrier gas purity: Conditions during tests: o Ambient temperature: o Barometric pressure: o Relative humidity: o Test gas temperature: o Test gas flow rate: o Carrier gas flow rate: Unnormalized and normalized totals: Calculated response factors: Chromatograms: Elution order and times for each component: Analyzed compositions: Calculated gas properties: o Gross heating value(s): o Relative density: Working Group Ballot Draft, August 2014 API Chapter 22.6 P a g e | 47 This document is not an API Standard; it is under consideration within an API technical committee but has not received all approvals required to become an API Standard. It shall not be reproduced or circulated or quoted, in whole or in part, outside of API committee activities except with the approval of the Chairman of the committee having jurisdiction and API staff. Copyright API. All rights reserved. o o Density: Compressibility factor: Mandatory Baseline (Ideal Condition) Test Performance Evaluation Measurement error in composition and properties: Repeatability of analyses: Linear range of component response functions: Mandatory Non-Ideal Condition Test Results Ambient temperature: Barometric pressure: Alternating test gas compositions representing varying sample streams: Test gas temperature: Test gas flow rates: Carrier gas: Carrier gas purity: Carrier gas flow rates: Mandatory Non-Ideal Condition Test Performance Evaluation Dynamic response of GC to changes in varied parameters: Bias in gas analyses related to changes in varied parameters: Measurement error in composition and properties: Repeatability of analyses: Linear range of component response functions: Non-Mandatory Special Testing (if performed) Mounting position tests: o Direct mount: o Remote mount: Relative humidity tests: o Results: Mechanical vibration testing performed: o Results: Drop-and-topple testing performed: o Results: Power supply fluctuation tests performed: o Results: Tests of any other factor that might affect GC performance: o Results: Long-term stability testing o Repeatability: o Response linearity: Uncertainty Analysis Uncertainties in parameters applied by the test facility (pressure, temperature, gas composition, etc.) Working Group Ballot Draft, August 2014 API Chapter 22.6 P a g e | 48 This document is not an API Standard; it is under consideration within an API technical committee but has not received all approvals required to become an API Standard. It shall not be reproduced or circulated or quoted, in whole or in part, outside of API committee activities except with the approval of the Chairman of the committee having jurisdiction and API staff. Copyright API. All rights reserved. Description of the methodology used to determine uncertainties applied by the test facility Description of the methodology used to determine uncertainties in analyzed values and calculated properties Summary Working Group Ballot Draft, August 2014 API Chapter 22.6 P a g e | 49 This document is not an API Standard; it is under consideration within an API technical committee but has not received all approvals required to become an API Standard. It shall not be reproduced or circulated or quoted, in whole or in part, outside of API committee activities except with the approval of the Chairman of the committee having jurisdiction and API staff. Copyright API. All rights reserved. Bibliography This section includes informative references only. Normative references required in the application of the test protocol can be found in Section 2. [1] AGA Report No. 8, Compressibility Factors of Natural Gas and Other Related Hydrocarbon Gases, Second Edition, Second Printing, American Gas Association, Arlington, Virginia, USA, July 1994. [2] ANSI/ISA S51.1-1979 (R1993), Process Instrumentation Terminology, American National Standards Institute, Washington, DC, USA, 1993. [3] API Manual of Petroleum Measurement Standards, Chapter 1 – Vocabulary, Second Edition, American Petroleum Institute, Washington, DC, USA, July 1994. [4] API Manual of Petroleum Measurement Standards, Chapter 7.3 – Fixed Automatic Tank Temperature Systems, Second Edition, American Petroleum Institute, Washington, DC, USA, October 2011. [5] ASTM Standard D1945-96, Standard Test Method for Analysis of Natural Gas by Gas Chromatography, ASTM International, West Conshohocken, Pennsylvania, USA, 1996 (reapproved 2001). [6] ASTM Standard D3588, Standard Practice for Calculating Heat Value, Compressibility Factor, and Relative Density of Gaseous Fuels, ASTM International, West Conshohocken, Pennsylvania, USA. [7] ASTM Standard D4150, Standard Terminology Relating to Gaseous Fuels, ASTM International, West Conshohocken, Pennsylvania, USA. [8] ASTM Standard D7164, Standard Practice for On-line/At-line Heating Value Determination of Gaseous Fuels by Gas Chromatography, ASTM International, West Conshohocken, Pennsylvania, USA. [9] ASTM Standard D7165, Standard Practice for Gas Chromatograph Based Online/At-line Analysis for Sulfur Content of Gaseous Fuels, ASTM International, West Conshohocken, Pennsylvania, USA. [10] ASTM Standard E178, Standard Practice for Dealing with Outlying Observations, ASTM International, West Conshohocken, Pennsylvania, USA. [11] GPA Standard 2145, Table of Physical Properties for Hydrocarbons and Other Compounds of Interest to the Natural Gas Industry, Gas Processors Association, Tulsa, Oklahoma, USA. [12] GPA Standard 2166, Obtaining Natural Gas Samples for Analysis by Gas Chromatography, Gas Processors Association, Tulsa, Oklahoma, USA. [13] GPA Standard 2172, Calculation of Gross Heating Value, Relative Density and Compressibility Factor for Natural Gas Mixtures from Compositional Analysis, Gas Processors Association, Tulsa, Oklahoma, USA. [14] GPA Standard 2261, Analysis for Natural Gas and Similar Gaseous Mixtures by Gas Chromatography, Gas Processors Association, Tulsa, Oklahoma, USA. [15] GPA Standard 2286, Tentative Method of Extended Analysis for Natural Gas and Similar Gaseous Mixtures by Temperature Programmed Gas Chromatography, Gas Processors Association, Tulsa, Oklahoma, USA. [16] ISO 1998-6, Petroleum industry – Terminology – Part 6: Measurement, International Organization for Standardization, Geneva, Switzerland. Working Group Ballot Draft, August 2014 API Chapter 22.6 P a g e | 50 This document is not an API Standard; it is under consideration within an API technical committee but has not received all approvals required to become an API Standard. It shall not be reproduced or circulated or quoted, in whole or in part, outside of API committee activities except with the approval of the Chairman of the committee having jurisdiction and API staff. Copyright API. All rights reserved. [17] ISO 4006, Measurement of fluid flow in closed conduits – Vocabulary and symbols, International Organization for Standardization, Geneva, Switzerland. [18] ISO 6976, Natural gas – Calculation of calorific values, density, relative density and Wobbe index from composition, International Organization for Standardization, Geneva, Switzerland. [19] ISO 7504, Gas Analysis – Vocabulary, International Organization for Standardization, Geneva, Switzerland. [20] ISO 10723, Natural gas – Performance evaluation for on-line analytical systems, International Organization for Standardization, Geneva, Switzerland. [21] ISO 14532, Natural gas – Vocabulary, International Organization for Standardization, Geneva, Switzerland. [22] ISO Guide to the Expression of Uncertainty in Measurement (ISO GUM), International Organization for Standardization, Geneva, Switzerland. Working Group Ballot Draft, August 2014 API Chapter 22.6 P a g e | 51


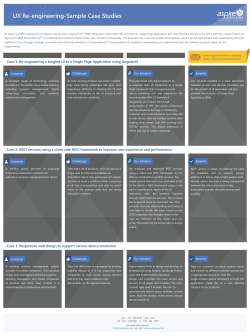

© Copyright 2026