
Please read this manual carefully to ensure you obtain valid
System Design and the Advanced Calculator for PowerSpout Please read this manual carefully to ensure you obtain valid calculation results for your site. Worked examples are given at the end of this document. PowerSpout Advanced Calculator If you cannot find the answers to your questions about your site's potential or designing your system with the Advanced Calculator, please email us at [email protected] consult with a local PowerSpout dealer. Please accept that we may answer your question by directing you back to a certain part of this manual or by putting you into contact with your local dealer. If you are having technical difficulties with the website, please email us at [email protected] If you are having problems with your existing order, please email us at [email protected] The Advanced Calculator and this manual were updated in November 2013 to include: New product options New examples added for new products EcoInnovation 671 Kent Road New Plymouth R.D.1 New Zealand Phone: (+64) 06 752 2765 Fax: (+64) 06 7522768 Web: www.ecoinnovation.co.nz Disclaimer UNLESS SPECIFICALLY AGREED TO IN WRITING, ECOINNOVATION LIMITED: (a) MAKES NO WARRANTY AS TO THE ACCURACY, SUFFICIENCY OR SUITABILITY OF ANY TECHNICAL OR OTHER INFORMATION PROVIDED IN ITS DOCUMENTATION. (b) ASSUMES NO RESPONSIBILITY OR LIABILITY FOR LOSS OR DAMAGE, WHETHER DIRECT, INDIRECT, CONSEQUENTIAL OR INCIDENTAL, WHICH MIGHT ARISE OUT OF THE USE OF SUCH INFORMATION. THE USE OF ANY SUCH INFORMATION WILL BE ENTIRELY AT THE USER’S RISK. © 2014 EcoInnovation Ltd (NZ) PowerSpout Advanced Calculator Table of Contents 1. 2. Introduction .................................................................................................................. 1 Which turbine, which calculator? .................................................................................. 2 2.1. Design for variable flow .......................................................................................... 2 3. How do I use it? ........................................................................................................... 4 3.1. Getting started ........................................................................................................ 4 3.2. Essential data......................................................................................................... 5 3.2.1. Head and flow ................................................................................................. 5 3.2.2. Length of pipe and cable ................................................................................. 5 3.2.3. Design load voltage (PLT/TRG) ....................................................................... 5 3.2.4. Max/min load voltage (LH) ............................................................................... 7 3.2.5. Additional water supply details (LH) ................................................................. 7 3.3. Improving your design ............................................................................................ 9 3.3.1. Reducing system costs .................................................................................... 9 3.3.2. Increasing power generation ........................................................................... 9 3.3.3. Notes and hints ............................................................................................. 10 3.3.4. Interaction between entries ............................................................................ 10 3.3.5. Design improvement example: Hydro pipe losses TRG/PLT ......................... 10 3.3.6. Design improvement example: Voltage and Cable costs ............................... 11 3.3.7. Cable efficiency limit ...................................................................................... 11 3.4. Save & Share Results .......................................................................................... 11 4. About making entries.................................................................................................. 12 4.1. Metric and Imperial units ...................................................................................... 12 4.2. Each entry and result explained ........................................................................... 13 4.2.1. Available water flow ....................................................................................... 13 4.2.2. Used water flow ............................................................................................. 13 4.2.3. Available head ............................................................................................... 13 4.2.4. Pipe or Flume (LH) ........................................................................................ 13 4.2.5. Pipe/Flume Fall (LH) ...................................................................................... 13 4.2.6. Pipe/Flume Material (LH) ............................................................................... 13 4.2.7. Flume Width/Height (LH) ............................................................................... 13 4.2.8. Pipe/flume Length.......................................................................................... 13 4.2.9. Water Depth In Flume (LH) ............................................................................ 13 4.2.10. Pipe/Flume capacity (LH) .............................................................................. 13 4.2.11. Draft tube diameter (LH) ................................................................................ 13 4.2.12. Target Pipe Efficiency (PLT/TRG) ................................................................. 13 4.2.13. Pipe Diameter................................................................................................ 14 4.2.14. Lock Pipe Diameter ....................................................................................... 14 4.2.15. Number of PowerSpouts................................................................................ 14 4.2.16. Lock PowerSpouts......................................................................................... 14 4.2.17. Jets per PowerSpout (PLT/TRG) ................................................................... 14 4.2.18. Jet diameter (PLT/TRG) ................................................................................ 14 4.2.19. Actual Pipe Efficiency .................................................................................... 14 © 2014 EcoInnovation Ltd (NZ) PowerSpout Advanced Calculator 4.2.20. Rotor Speed .................................................................................................. 15 4.2.21. No Load Rotor Speed (LH) ............................................................................ 15 4.2.22. Output per PowerSpout ................................................................................. 15 4.2.23. Total PowerSpout output ............................................................................... 15 4.2.24. PowerSpout output voltage............................................................................ 15 4.2.25. No Load Voltage (LH) .................................................................................... 15 4.2.26. Target Cable efficiency .................................................................................. 15 4.2.27. Length of Cable ............................................................................................. 16 4.2.28. Design Load Voltage (PLT/TRG) ................................................................... 16 4.2.29. Load Max Voltage (LH) .................................................................................. 16 4.2.30. Load Min Voltage (LH) ................................................................................... 16 4.2.31. Actual Load Voltage ...................................................................................... 16 4.2.32. Cable Material ............................................................................................... 16 4.2.33. Cable cross section ....................................................................................... 16 4.2.34. Lock Cable (Size) .......................................................................................... 16 4.2.35. Next size up cable ......................................................................................... 17 4.2.36. Cable Current/Amperage ............................................................................... 17 4.2.37. Actual Cable Efficiency .................................................................................. 17 4.2.38. Power at Your Shed ...................................................................................... 17 5. Design comments....................................................................................................... 18 5.1. Hydro related hints and warnings ......................................................................... 18 5.2. Electrical related warnings.................................................................................... 19 5.3. LH specific turbine advice and warnings............................................................... 20 6. Examples using the Advanced Calculator .................................................................. 22 6.1. Off-grid ELV system (PLT 100C) .......................................................................... 22 6.1.1. Preferences ................................................................................................... 22 6.1.5. So what did we do? ....................................................................................... 26 6.2. Off-grid situation, long cable (PLT 80 HP) ............................................................ 28 6.3. Grid-connected situation (PLT 200) ...................................................................... 29 6.3.1. System costs ................................................................................................. 29 6.3.2. Flow rate ....................................................................................................... 30 6.3.3. Turbine version .............................................................................................. 30 6.3.4. Results .......................................................................................................... 30 6.3.5. So what did we do? ....................................................................................... 31 6.4. Small scale option (PLT 28) ................................................................................. 31 6.4.1. So what did we do? ....................................................................................... 32 6.5. Grid Connected option – TRG/LH......................................................................... 33 Figures Figure 1. Water supply system .............................................................................................. 5 Figure 2. System output and costs (turbines, pipe and cable) with water flows of 5 l/sec .... 23 Figure 3. System output and costs (turbines, pipe and cable) with water flows of 10 l/sec .. 24 Figure 4. Costs of grid connected power options (flow, turbines) ........................................ 30 Tables Table 1. Common versions of PowerSpout PLT with no overvolts crowbar ........................... 6 Table 2. Common versions of PowerSpout PLT with overvolts crowbar fitted* ...................... 6 Table 3. Common versions of PowerSpout TRG with no overvolts crowbar .......................... 6 Table 4. Common versions of PowerSpout TRG with overvolts crowbar fitted* ..................... 6 Table 5. Units and conversion rates .................................................................................... 12 Table 6. Indicative system options and total costs (2 PowerSpout PLT100C) ..................... 25 © 2014 EcoInnovation Ltd (NZ) PowerSpout Advanced Calculator 1. Introduction We take the pain out of hydro design for everyone! The Advanced Calculator is an easy to use software tool that helps you determine how much electricity you can produce at your site from one to multiple PowerSpout generators. Anyone can use the calculator – we certainly do. We have developed it to do all the complex calculations for you, incorporating factors such as water friction and cable resistance losses. Hydro design is now easy, even for non-engineers. If you are an engineer the Advance Calculator will still save you time. You can trial possible system designs and quickly realize the consequences of any changes you make. This will enable you to find a good economic solution to your hydro needs. A basic principle of hydro design is that if you want more power then you need more water and/or more head (i.e. height of fall between the intake and the generator). It is often true that there is less water higher up a stream, hence increasing the head might also mean less water. However, it is generally more cost efficient to go as high as you can since: a smaller diameter (cheaper) pipe can be used less water is needed each hydro turbine can generate more power you tend to be less exposed to flooding on higher heads Siting the intake further up the stream to get more head will increase your pipe length and hence cost for the pipe, but the smaller diameter pipe required tends to mean reduced overall costs. Conversely, moving the generator further away from the power demand can increase the length of cable required. If the cable is too thin, or long, or both, the cabling will limit the electricity delivered. To avoid high cable costs changing the cable voltage and cable material may result is a good solution for your site. The Advance Calculator is intended to be simple. As each input is entered the calculator recalculates all items. It can also serve as an educational tool for students learning about hydro design. The most cost-effective solution will depend on many factors about your site, the costs of materials available to you locally, and your objectives. The outputs you obtain from this tool are based on the data you enter, so if you have complete and accurate data you can obtain a better estimate of your output. Your data from this tool can be sent directly to your dealer and is then used to manufacture your PowerSpout hydro turbine. Overestimating the hydro resource can result in disappointment and may require a new stator/rotor combination to be installed to reach the target output. January 2014 © 2014 EcoInnovation Ltd (NZ) Page 1 PowerSpout Advanced Calculator 2. Which turbine, which calculator? Before you go to the Advanced Calculator it is worth knowing data about your site. You should measure the head and flow rate you have available and the length of pipe and cables that you will need. If you have more than one potential location for the intake or generator, take note of the distances for each so you can investigate your options. The Advanced Calculator can be used for all PowerSpout turbines. However, there are some slight differences with the PowerSpout LH turbines, which have been incorporated into a modified version of the model used for PLT and TRG turbines. Hence you will have to know which version to use, based on the available head and water flow at your site. Each turbine is designed for different situations to optimize the output from the available head and flow. In summary: PowerSpout PLT (Pelton) is suited to sites with a running head from 3 to 130m (up to 160m static head) and flow greater than 0.1 l/s and less than 10 l/s. PowerSpout TRG (Turgo) is more cost effective on medium head (2-30 m) sites with medium flow rates greater than 8 l/s less than 16 l/s. PowerSpout LH (low-head) is designed for low-head (1-5 m) sites and high flow rates greater than 25 l/s less than 56 l/s. The diagram below illustrates the operating range of each type of turbine and indicates both the number of turbines you could install and the potential power they could generate. This can be used as a quick guide for model selection; note this has a log scale so the black power lines are straight. 2.1. Design for variable flow It is important to recognise that water flows tend to vary during the year, particularly between seasons. It is not uncommon for the high flows (wet season or after rain) to be three times as much as low flows (dry season). You should try to measure this variability at your site since it can affect your system design. PLT or TRG turbines can exploit higher head sites with lower flows during the dry season, while LH turbines may be used during the wet season to generate more power when it is most needed. Similarly, hydro turbines can be combined with complementary energy options. The recent fall in the cost of solar photovoltaic (PV) panels is one such opportunity. In the dry season it will be sunny and any power shortfall (due to lack of water flow) can be made up with PV panels. This combination of hydro and PV (if sized correctly) can mean that remote homes and communities can be completely free of any reliance on fossil fuel generation which tends to be very costly in the long run. January 2014 © 2014 EcoInnovation Ltd (NZ) Page 2 PowerSpout Advanced Calculator PowerSpout Model Selection Chart For the head and flow rate at your site the above chart will quickly give you the maximum power you can generate (refer to black angled lines indicate 100W to 12kW). The coloured zones refer to the range for each product type: The red lines are 1, 2, 5, 10 PowerSpout Pelton (PLT) turbines respectively The yellow lines are 1, 2, 5, 10 PowerSpout Turgo (TRG) turbines respectively The blue lines are 1, 2, 5, 10 PowerSpout Low Head (LH) turbines respectively For example a site with a head of 20m, and flow of 10l/s can generate about 1000 W with 1 TRG or 2 PLT turbines. Once you have identified the most suitable turbine type(s), use the Advanced Calculation Tools at www.powerspout.com to perform accurate site calculations. January 2014 © 2014 EcoInnovation Ltd (NZ) Page 3 PowerSpout Advanced Calculator 3. How do I use it? Armed with your site data, go to www.powerspout.com and click on the Calculators tab www.powerspout.com/calculators. Select the calculation tool you want, PLT & TRG or LH. 3.1. Getting started Use the first drop down box to select metric or imperial units for input and display. You can change this at any time and enter values with your choice of units. Select which PowerSpout you want to design with. With the PLT/TRG versions there are standard and high power (HP) models. The main difference is the increase in output for the HP versions for a slightly higher turbine cost. HP versions can generate up to 25% more than the standard turbines, so if you want a little extra output, it could be worth trying the HP version. In some cases HP turbines can reduce the number of turbines required, hence reducing total cost. There is no advantage to a HP turbine if you do not have a site that needs more than one normal turbine. For low head sites there is no optional HP configuration, since the HP will be automatically selected if it is appropriate for your site. If you need an HP upgrade you will see the “HP” appear in the SD code e.g. 60dcHP-3s-4p-delta (provisional). All this means is that the turbine price will be a little more. In the Advanced Calculator the type of PowerSpout alters the way the calculations work according to how each version of the PowerSpout operates. The type of Smart Drive (SD) stator/rotor used in your PowerSpout is important. The Advanced Calculator automatically selects the best options for your site data and PowerSpout type selected. Several TRG and PLT SD code options will be displayed in priority order. The first column score (Pref.) indicates preference with scores nearer to 1 being easier to manufacture. The SD codes have been developed by EcoInnovation to help differentiate between SD variations. The final column (Vo) indicates the maximum power point voltage (MPPT). For LH turbines only 1 option is given. This SD data is displayed in the electrical section of the calculator for your information. The primary objective is to help EcoInnovation identify the most suitable rotor/stator and hence ensure you can get the best from your site. Production testing and tuning may result in the makers altering the SD stator code to obtain optimum results. January 2014 © 2014 EcoInnovation Ltd (NZ) Page 4 PowerSpout Advanced Calculator 3.2. Essential data The following data are critical in order to obtain a good estimate of site potential. 3.2.1. Head and flow You need to enter values for the available water flow and head before other entries are possible. Enter the amount of water you have available to use. Enter the vertical fall (available head) for your stream. For the LH turbines the head default of 2m (6.6 ft) appears as soon as the flow is entered; you then enter the correct head. For LH turbines the head you enter is the actual operating head of the turbine, any fall on the supply pipe/flume is extra to this entered value. Water intake Av a ila ble flo w Available Head P ip Su pp ly p el en g th ipe P owerS pout Figure 1. Water supply system Once this data have been entered, the program completes the other data fields with “typical best guess data” to fill in the blanks in order to get an answer. You must edit this information so it is correct for your site. 3.2.2. Length of pipe and cable The pipe length relates to the distance between the intake and generator. The cable length is the distance from generator to the batteries (or load). 3.2.3. Design load voltage (PLT/TRG) The Design Load Voltage default in the Advanced Calculator is 56 V. This is the operating cable voltage for off-grid systems (48V battery bank) using PWM regulators. You must enter the correct voltage for your system to avoid disappointment. January 2014 © 2014 EcoInnovation Ltd (NZ) Page 5 PowerSpout Advanced Calculator The Tables below includes the common versions of PLT/TRG turbines that can be used for different situations. Turbines of any voltage in the range 12-500 can be made on request. Table 1. Common versions of PowerSpout PLT with no overvolts crowbar PLT model Max cable length m Operating cable V 14 50 14 Max open circuit V 38 Off-grid* 40 250 40 120 28 150 28 75 ELV US/EU ELV NZ/AUS 56 500 56 80 1000 80 On-grid 170 200 1000 1000 170 200 150 220 <450 <550 Regulator/inverter PWM PWM MPPT PWM MPPT Grid-tie Grid-tie * All off grid MPPT turbines can charge 12, 24 or 48 V battery bank except PLT40 which can only be used in 12 and 24 V systems. Table 2. Common versions of PowerSpout PLT with overvolts crowbar fitted* Off-grid Off-grid Off-grid On-grid 75vdc limit 120vdc limit 240vdc limit Aurora PVI wind interface PLT model 56C 100C 170C 200C 350 Max cable length m 500 1000 1000 1000 1000 Operating cable V 56 100 170 200 250-350 Max open circuit V <75 <120 <240 <240 <400 Regulator/inverter PWM MPPT MPPT MPPT Grid-tie * crowbar drops voltage to zero if max open circuit V is reached. Refer to Technical Manual Table 3. Common versions of PowerSpout TRG with no overvolts crowbar TRG model Max cable length m Operating cable V Max open circuit V 28 150 28 75 ELV US/EU Off-grid 40 56 250 500 40 56 120 150 ELV NZ/AUS 80 1000 80 On-grid 170 200 1000 1000 170 200 220 <450 <550 Regulator/inverter PWM MPPT PWM MPPT Grid-tie Grid-tie *All off grid MPPT turbines can charge 12, 24 or 48 V battery bank except PLT40 which can only be used in 12 and 24 V systems. Table 4. Common versions of PowerSpout TRG with overvolts crowbar fitted* Off-grid Off-grid Off-grid On-grid 75vdc limit 120vdc limit 240vdc limit Aurora PVI wind interface TRG model 56C 100C 170C 200C 350 Max cable length m 500 1000 1000 1000 1000 Operating cable V 56 100 170 200 250-350 Max open circuit V <75 <120 <240 <240 <400 Regulator/inverter PWM MPPT MPPT MPPT Grid-tie * crowbar drops voltage to zero if max open circuit V is reached. Refer to Technical Manual The “C” in the above Tables means that a crowbar is fitted. This crowbar will drop the voltage to zero if 75/120 or 240 VDC is ever exceeded. Reset is by turning the turbine off. January 2014 © 2014 EcoInnovation Ltd (NZ) Page 6 PowerSpout Advanced Calculator For basic battery-based systems, enter the nominal float voltage for your battery bank. Typically a 48V lead acid battery bank will have a nominal float voltage of 56V Typically a 24V lead acid battery bank will have a nominal float voltage of 28V Typically a 12V lead acid battery bank will have a nominal float voltage of 14V Some users have made the mistake of not entering their correct Design Load Voltage, and then complained of poor performance after installing the turbine. This will occur if, for example, a turbine designed for 48V battery bank is used on a 12 or 24 VDC bank. The problem can be easily fixed with a new stator core, but there will be a fee and a time delay to correct this mistake. 3.2.4. Max/min load voltage (LH) LH and LH Pro products only connect via MPPT regulators or grid-tied inverters. There are no direct battery options available. The default settings are: Min load voltage 50 VDC Max load voltage 400 VDC You have to update these values with the minimum and maximum operating values of your MPPT regulator or grid connect inverter that is approved for hydro input. For example: EnaSolar 2kW inverter Aurora Uno-2.0 Outback FM80 to a 24 VDC battery Outback FM80 to a 48 VDC battery Midnite Classic 250 to a 48 VDC battery Min load voltage 120 90 30 (default 50 applies) 60 60 Max load voltage 600 500 150 150 250 The above data can be located on the product specification sheet. LH150 and LH150Pro – use with MPPT regulator rated for up to 150 VDC charging 12/24 VDC batteries. MPP cable voltage may be as low as 50 VDC. LH250 and LH250Pro – use with MPPT regulator rated for up to 250 VDC charging 12/24/48 VDC batteries. MPP cable voltage may be as low as 80 VDC. LH400 and LH400Pro – use with MPPT regulator or grid connect inverter rated for up to 400 VDC. MPP cable voltage may be as low as 140 VDC. 3.2.5. Additional water supply details (LH) Low head sites have different characteristics which require additional inputs about the water supply. Most importantly you need to decide whether to have a flume or a pipe to convey the water to the turbine, and what material it will be made from. 3 x LH turbine timber flume January 2014 3 x LH turbine concrete flume 1 x LH turbine steel pipe © 2014 EcoInnovation Ltd (NZ) Page 7 PowerSpout Advanced Calculator Wooden flumes or PVC pipes are commonly used to channel the water to the turbine. The flow rate is related to the slope (incline) and dimensions of the flume/pipe. The depth of the water to get this flow at the exit of the pipe/flume can then be calculated. The calculator has default settings, but you need to enter the data for the flume/pipe you intend to use. The flume design features in the LH calculation tool are provided to you free of charge. This program does not take into account the effect of flooding and low water heights in the stream. You must seek professional engineering advice prior to constructing a flume as forces from flood waters can be immense and easily destroy poorly implemented structures. Example pipe flume If for example you have 50 l/s and a 3.6m fall, a 250mm PVC pipe that is 20m long and falls 0.1m over the 20 m length is able to flow up to 56 l/s. As this is very close to the 50 l/s you have, you should consider: Increasing the pipe diameter to 300mm or Increasing the fall to 0.15m (your head is then 3.55m) Your site will generate about 870W. Example rectangular timber flume If for example you have 150 l/s and a 3.0m fall, a 400mm wide, 300 deep timber flume that is 25m long and falls 0.15m over the 25 m length is able to flow up to 189 l/s. Such a flume will look similar to this picture. It will have to widen at the end to allow room for 3 turbines to be installed. Your site will generate about 1960W January 2014 © 2014 EcoInnovation Ltd (NZ) Page 8 PowerSpout Advanced Calculator 3.3. Improving your design Once initial data has been entered you will see an output figure at the bottom of the page. The “Output per PowerSpout” and “Total PowerSpout output” in Watts represents the capacity of your system. The Advanced Calculator always tries to maximise the electrical power for a given hydro resource. The Advanced Calculator will recommend as many PowerSpout turbines as necessary to harness all the available water. This is often 1 more PowerSpout than is economically optimal, so always try 1 less and the HP option. Improvements generally satisfy one or both of two main objectives: Reducing system costs Increasing power generation Other improvements may enhance the safety of the system or ensure the design will comply with warranty conditions. Notes will appear on the left side of the screen to guide you through most of these issues (see below). You can type your values into any entry box. A few moments after you stop typing the Advanced Calculator will recalculate all values, causing other values to change as a result. Whenever you make a design change, check the ‘Power at Your Shed’ result. More power is almost always better. 3.3.1. Reducing system costs If the design provides ample power for your needs and you wish to minimize your build costs then you can try reducing one or more of the following: The number of PowerSpout generators Pipe diameter (inside diameter. The calculator assumes a smooth walled plastic pipe for PLT and TRG calculations) Flume dimensions (LH only) Cable sizes You can test the impact of each of the above in turn or in combination, while checking there will still be enough generation for your needs. You can check availability and costs of pipes and cables with your local suppliers to help determine the total costs and $/Watt cost of your system design options. 3.3.2. Increasing power generation If the power available is very low, you should look at whether you can increase this by increasing one or more of the following: The head (going further upstream) Pipe diameter (inside diameter) Flume dimensions (LH only) In some cases using a high power (HP) turbine is a cost effective way to boost your power production by using less turbines. If generation is still very low you should investigate other generation options. For example, if you get only 20 W then in most cases there are cheaper and easier options. One 250W solar PV panel is a good option for 20 W 24/7, unless there is no sunlight available. January 2014 © 2014 EcoInnovation Ltd (NZ) Page 9 PowerSpout Advanced Calculator 3.3.3. Notes and hints Please read the design notes in red on the left hand side of the screen. These notes are important as they enable you to understand ways to improve your design, or provide safety concerns and warrantee issues you may need to consider. See Section 5 for more detailed explanations. 3.3.4. Interaction between entries Some boxes do more than might seem obvious at first. If you enter a specific ‘Pipe Diameter’ then the Advanced Calculator (PLT/TRG) overrides the ‘Target Pipe Efficiency’ you entered and automatically ‘locks’ the pipe size for you with ‘Lock Pipe Diameter’. If you then enter a new ‘Target Pipe Efficiency’ then the pipe size will unlock and be adjusted for the ‘Target Pipe Efficiency’ to be met. The ‘Actual Pipe Efficiency’ shows the efficiency of the displayed ‘Pipe Diameter’. If you enter a ‘Cable size’ or ‘Metric cross section’ then the ‘Lock Cable Size’ will be ticked for you. This blocks the automatic calculation of the cable size based on the ‘Target Cable Efficiency’. Then entering a new ‘Target Cable Efficiency’ will unlock the ‘Lock Cable Size’ so the cable size will be calculated according to the new ‘Target Cable Efficiency’ you have just entered. ‘Cable size’ and ‘Metric cross section’ are interactive. When you enter a ‘Cable size’ in AWG then there is always a decimal number for the ‘Metric cross section’ which is an accurate equivalent. Cables specified in ‘Metric cross section’ are normally made to whole ½ square mm values. These do not have an AWG equivalent. So the Advanced Calculator rounds up to the next AWG size and displays this in the ‘Cable size’ field and changes the title to ‘Next size up cable’. 3.3.5. Design improvement example: Hydro pipe losses TRG/PLT If you enter a very small diameter and/or long pipe then the pressure drop may be too great for the water to flow through it. The maximum water power through a given pipe size (assuming you have plenty of water available) occurs when the pressure drop is 33.3%. To avoid excessive pipe losses the Advanced Calculator automatically reduces the water flow to obtain the maximum power for the pipe you have specified. A note will appear in red to alert you to the issue and advise you to specify a larger pipe. For example, at a site with 40 m head, 200m pipe length and 2 l/s available flow, a 20 mm pipe would restrict the flow used to 0.3 l/s and hence significantly reduce generation potential. Increasing the pipe diameter to 40 mm will allow the full flow to be utilized and increase the generation capacity by an order of magnitude to 249W, though there is still 33% of the power lost in the pipe due to friction. If a 55mm pipe is used then only 8% of the power is lost to friction and we generate 362W. January 2014 © 2014 EcoInnovation Ltd (NZ) Page 10 PowerSpout Advanced Calculator 3.3.6. Design improvement example: Voltage and Cable costs Although it is possible to use a long small cable with a low-voltage PowerSpout PLT, it is likely to be very inefficient (high cable losses) and hence it is rarely a cost effective option. Using a heavier cable and/or a higher voltage is the preferred solution. For example, with the same input data as above and 55mm pipe, using a PowerSpout PLT14 to deliver 326 W at 90% efficiency to a 12 V battery located 500 m away requires a 267 mm2 copper cable. Changing the design to use the PowerSpout PLT80 and MPPT regulator will deliver the same energy at the same efficiency but require a cable size of just 8.2 mm2. Since the larger cable costs around $190/m and smaller cable closer to $6/m, this is a huge reduction in cable costs and why at long distance you must avoid generating 12 or 24 VDC direct to the battery banks and use MPPT technology. Even though MPPT will cost more the total system cost will be much less with MPPT. The longer the cable run, and the lower the load voltage, the more likely it is you need a PowerSpout with a MPPT controller. Higher voltage generally leads to savings in cable costs, but be aware that only qualified electrical workers are allowed to do the installation above ELV limits: check your local regulations for relevant details. Also cables running above ELV limits often have to be buried or mounted on poles for safety, which can add to the total installed costs. 3.3.7. Cable efficiency limit With PLT/TRG PowerSpouts the maximum power transfer through the cable occurs when the ‘Actual Load Voltage’ is approximately half the ‘PowerSpout Output Voltage’ at the same rpm. It is approximately a third of the ‘PowerSpout Output Voltage’ at the unloaded runaway rpm. MPPT controllers and Grid tied inverters feature a wide input voltage range. The calculator knows this and alters the Design and Actual load voltages accordingly. A cable with more loss will result in the ‘PowerSpout Output Voltage’ being higher, up to the limit for that type of PowerSpout. The Advanced Calculator then reduces the ‘Used Water flow’ to prevent exceeding the voltage limit of the PowerSpout. 3.4. Save & Share Results Your turbine will be designed for the site data you supply, so it is very important to ensure that the data entered and saved is accurate. If you operate the turbine on a different site, or in very different conditions, the power output will differ. If you intend to run your turbine over a wide range of flow rates, you need to state this at the time of ordering, since a new generator core may be required to obtain the best results. A different generator core can be supplied for an additional charge. Save & Share Results If you wish to save your results above and share them with a dealer, please input your own email address, and select a dealer if desired. You will receive an email containing a summary of the results and a reference number. 1000’s of calculations are saved each year, so follow up with an email to your dealer if you need direction/advice or to place an order. You can save the data from the calculator for yourself, and/or share them with a dealer. All you need to do is to input your own email address, and select a dealer if desired. You will receive an email containing a summary of the results and a reference number. You should check all the data to ensure they are accurate. Once you are satisfied with the data you need to follow up with your dealer to confirm your requirements and place your order. January 2014 © 2014 EcoInnovation Ltd (NZ) Page 11 PowerSpout Advanced Calculator 4. About making entries 4.1. Metric and Imperial units Internally the Advanced Calculator does everything in metric units with full precision and results are displayed according to the selected unit system. Please note that US Gallons are used (not British Gallons) in the calculations since Britain is officially metric. If you change between imperial (US) and metric units then all values are redisplayed accordingly. The resultant output power may change a minor amount due to rounding differences between the input units. You do not have to be in Metric to enter a metric value, and the units are not case sensitive. For example, you can enter “10 lps” or “132 gpm” (Litres per second, US Gallons per minute) for ‘Available Water flow’. The letters after the number tells the Advanced Calculator what units you are using. These will be converted for use and displayed in the preferred units after calculations are completed (Table 5). Table 5. Units and conversion rates Preferred unit m lps Entry units ft in cm m mm mile kpa psi bar atm lps lpm lph gpm cfs cfm cfh cfd cumecs Conversion factor 0.3048 0.0254 0.01 1 0.001 1609.344 0.102 0.703 10.197 10.33211 1 60 3600 0.06301 28.31684659 0.471947443 0.007865791 0.000327741 1000 All values are read from left to right as a number of digits with an optional decimal point followed by an optional string of characters giving the unit type. Furthermore: Only the first decimal point is considered. All spaces are ignored. Any unit that is mistyped or not recognized will be ignored and the unit displayed before typing is assumed. If no unit is given then the unit displayed before typing is assumed. January 2014 © 2014 EcoInnovation Ltd (NZ) Page 12 PowerSpout Advanced Calculator 4.2. Each entry and result explained 4.2.1. Available water flow This is the amount of water you can use, usually determined by measuring the flow in your stream(s). Valid units are litres per second (lps) and gallons per minute (gpm). 4.2.2. Used water flow This is the water flow that will be used by the pipe. If you have a system design that limits the amount of electricity that can be produced then the calculator determines the amount of water that is required to produce this amount of electricity. 4.2.3. Available head This is the vertical height from the pipe intake to the turbine (see Figure 1). 4.2.4. Pipe or Flume (LH) This is the choice of method for conveying the water to the LH turbines. 4.2.5. Pipe/Flume Fall (LH) This is the vertical drop of the pipe/flume over the entire length. 4.2.6. Pipe/Flume Material (LH) This is the material used for the pipe/flume which affects the friction in the supply channel. 4.2.7. Flume Width/Height (LH) If a flume is used the dimensions are required to determine cross-sectional area and affects the flow capacity. 4.2.8. Pipe/flume Length This is the actual length of the pipe or flume you intend to use (see Figure 1).The pipe that carries the water to the PowerSpout can be very long if you have gentle sloping land. 4.2.9. Water Depth In Flume (LH) This is the calculated water depth at the end of the flume. If this depth is higher than the sides of the flume then the flume capacity will be automatically decreased so the flume does not spill, and a warning note will appear on the left hand side. . 4.2.10. Pipe/Flume capacity (LH) The pipe or flume flow capacity will be displayed depending on the selection made. As it is possible to have a pipe/flume capacity lower than the flow you entered a warning will appear. You must ensure the size of the pipe/flume has the capacity you need to convey the water to generate the Watts required. 4.2.11. Draft tube diameter (LH) The turbine has 2 draft tube sizes available. If the head is < 2.6 m the size is 190mm ID (200mm OD PVC pipe). If >2.6 m the size is 240mm ID (250mm OD PVC pipe). 4.2.12. Target Pipe Efficiency (PLT/TRG) This is related to the losses in the pipe: water flowing quickly through a pipe causes friction and this reduces the water pressure available for the PowerSpout to convert into electricity. Generally 90% efficiency, or 10% power loss in the pipe, is a reasonable design point. January 2014 © 2014 EcoInnovation Ltd (NZ) Page 13 PowerSpout Advanced Calculator At 90% efficiency the pressure at the PowerSpout when it is operating will be 10% less than the pressure in the pipe when the PowerSpout is off (static pressure). The minimum efficiency you can enter is 66% since this is the point that maximum power transfer will occur if there is unlimited water available. With limited water, more power is produced by reducing the pipe loses, which means a larger pipe. 4.2.13. Pipe Diameter This is the internal diameter of the pipe carrying the water to the PowerSpout. Pipes are often sold by their external diameter, so be careful. A higher pressure pipe has a smaller inside diameter than a lower pressure pipe of the same specified outside diameter because it has a thicker wall. For a high head site use lower pressure rated pipe for the top section in order to save on cost. Enter in the smallest internal diameter of all the pipe you will be using. The small pipe size will dominate the flow calculations and give a conservative answer. 4.2.14. Lock Pipe Diameter A tick here tells the Advanced Calculator to use the given pipe diameter and ignores the Target Pipe Efficiency. 4.2.15. Number of PowerSpouts The Advanced Calculator tries to maximise the power output for the water flow available and hence may use multiple PowerSpouts to achieve this. However, one less PowerSpout does not always reduce the output power that much since it may not have been fully employed, and you cannot have 1.2 PowerSpouts. It is worthwhile trying one less PowerSpout than the calculator advises and try the HP option. 4.2.16. Lock PowerSpouts A tick in here tells the calculator to retain the current number of PowerSpouts rather than choose the number of PowerSpouts for maximum electricity. 4.2.17. Jets per PowerSpout (PLT/TRG) With PowerSpout PLT/TRG you might want to use fewer jets even though more are possible. In most cases a single jet (for high power) is a bad design choice as it increases the loading on the turbine bearings. One jet may be used in situations where for example: Output power is less than 400 Watts; There are much lower summer flows (2-4 jets used in winter/wet season, 1 in summer/dry season); You have a high head low power site and a single jet is larger so it is easier to make and less likely to become clogged with debris. PowerSpout TRG turbines have up to 4 jets. If you need to run on just 2 jets in the dry period, then using opposing jets will give a better bearing life. 4.2.18. Jet diameter (PLT/TRG) This is the hole size for each jet. The size is calculated for the number of jets selected. 4.2.19. Actual Pipe Efficiency This is the efficiency of the pipe size used. See section 4.2.12 above. January 2014 © 2014 EcoInnovation Ltd (NZ) Page 14 PowerSpout Advanced Calculator 4.2.20. Rotor Speed The wet rotor and generator speed is displayed so you can appreciate just how quickly it is going. Under no load conditions the rotor speed can almost double. The rotor has a maximum design speed of 3500 rpm but rarely exceeds 1600 rpm in normal use. Both rotors are fully enclosed for your safety and have been rpm explosion tested to ensure your safety should they ever fail. Body fairings must always be in place and secure. 4.2.21. No Load Rotor Speed (LH) This is the free runaway speed of the LH turbine: it cannot exceed 2300 rpm. The free runaway speed of the PLT and TRG turbines is not displayed; this cannot be more than 2x the rotor speed displayed. 4.2.22. Output per PowerSpout This is the electricity output in Watts measured at the PowerSpout. 4.2.23. Total PowerSpout output This is the total electrical power from your PowerSpout(s) in Watts before the cable losses. This power then travels to your power shed via a cable which has losses. 4.2.24. PowerSpout output voltage Power transfer through a cable results in a voltage drop across the cable. The PowerSpout output voltage is always higher than your load voltage so there can be electrical current flow. A quick look on the internet will explain Ohms law for you. The calculator considers the voltage limit of the PowerSpout you have selected and will adjust the numbers accordingly to keep this voltage within limits: PowerSpout PLT and TRG voltages can be up to 3 times higher than your battery nominal voltage if allowed to free spin disconnected from the battery. You must not free spin a PowerSpout PLT other than for testing OCV during the commissioning process. Always ensure it is connected to the battery load. PowerSpout PLT and TRG turbines that have a Crowbar fitted are limited to the voltages given in tables 2 and 4. This is the voltage limit of the internal circuit board to meet ELV rules for some countries as well as a safe operating voltage for many MPPT charge controllers. PowerSpout PLT350 and TRG350 turbines for grid connection are voltage limited by external regulators such as the Aurora PVI wind interface. 4.2.25. No Load Voltage (LH) The is the estimated voltage at runaway speed, which will occur with a grid connected turbine when the grid is shut down or fails 4.2.26. Target Cable efficiency Electricity flowing through a wire suffers from losses. Generally 90% efficiency, or 10% power loss in the cable, is a reasonable design point. At 90% efficiency there is a 10% voltage drop along the cable. The minimum efficiency you can enter is 50%. Please note that some regulations around the world limit the maximum cable loss to 3-5%, so check your local rules. January 2014 © 2014 EcoInnovation Ltd (NZ) Page 15 PowerSpout Advanced Calculator 4.2.27. Length of Cable This is the actual length of the cable from your PowerSpout to your batteries or load. 4.2.28. Design Load Voltage (PLT/TRG) This is the operating voltage of the equipment you will be connecting to your PowerSpout. See Section 3.2.3 4.2.29. Load Max Voltage (LH) You have to update this input with the maximum operating voltage of your MPPT regulator or grid-connect inverter that is approved for hydro input. 4.2.30. Load Min Voltage (LH) You have to update this input with the minimum operating voltage of your MPPT regulator or grid-connect inverter that is approved for hydro input. 4.2.31. Actual Load Voltage This is the voltage of the cable when delivering the maximum power that can be generated. 4.2.32. Cable Material Copper is not the only material for electrical cables, and aluminium is often used. Aluminium has higher losses than copper on a cross sectional area basis but much lower losses on a weight basis. As wire is sold by the kg, aluminium cable is more cost efficient than copper cable. Copper cable is more efficient size for size only. Most big power cables used for long distance power transmission in national grids around the world are made with a steel core for strength and with aluminium for conduction. The availability of low cost steel fencing wire is an attractive option for standalone power systems. Very long suspended spans of up to 1 km (2/3 mile) can be made using high tensile strength steel wire and may be an ideal choice. (Please check local rules regarding suspended wires. They are very dangerous for aircraft!). Steel is a variable conductor as there are many different steel grades. If you are considering this option you will need to confirm electrical losses with your supplier or to measure losses of a sample. 4.2.33. Cable cross section Metric cables are defined in square mm of cross section. This refers to the cross section of the cable for each direction. If you have a two-core 4 mm2 cable, one conductor for positive and one for negative, then you enter 4 mm2. When you enter a new cable size the Advanced Calculator will tell you the next biggest AWG size for this metric size. When you enter a specific cable size then the Lock Cable Size will be ticked for you automatically. 4.2.34. Lock Cable (Size) This locks the cable size and prevents the Advanced Calculator from using the Target Cable Efficiency to determine a new cable size. If losses in the cable are very high the lock will be ignored. January 2014 © 2014 EcoInnovation Ltd (NZ) Page 16 PowerSpout Advanced Calculator 4.2.35. Next size up cable As for Cable cross section, the AWG (American Wire Gauge) size is the size of each wire required. This will update the Cable cross section with the exact mm2 for the AWG wire size entered. When you enter a cable size then the Lock Cable Size will be ticked automatically. 4.2.36. Cable Current/Amperage This is the number of amps in the cable. It is useful to know this if you need to talk to a cable supplier about current handling and for fuse/breaker sizing. 4.2.37. Actual Cable Efficiency This is the efficiency of your cable. If you have 90% efficiency then 10% of the electricity produced by your PowerSpout(s) is lost before it reaches your power shed. These losses create heat in the cable. The loss calculation assumes your cable is lightly loaded and is operating at 20ºC (68ºF). As cables carry more current, they heat up and their losses increase. Cable manufactures specify their cable current carrying ability at the maximum temperature rise the insulation can safely operate at. Normally cables used for transmission at low voltages are oversized in terms of current rating in order to get the losses to acceptable levels. 4.2.38. Power at Your Shed This is the most important figure of all i.e. the amount of power delivered to where you will be using it. When reviewing this number consider that it is providing power all day and night, 24 hours per day for every day of the year. This constant generation means a 500 W PowerSpout is equivalent to around 3,000 – 4,000 W of solar PV panels, depending on local weather patterns and time of year. Power at your shed excludes the small losses in the MPPT regulator or grid-connect inverter. An average western house uses 25 to 30 kWh per day. An energy efficient house with no electrical heating appliances can be less than 5 kWh. A 500 W PowerSpout operating for 24 hours a day produces 12 kWh per day. If you are a very conservative electricity user then 250 W of Power at Your Shed will run your home! (Generates approximately 2200 kWh – is this enough?) January 2014 © 2014 EcoInnovation Ltd (NZ) Page 17 PowerSpout Advanced Calculator 5. Design comments There are many reasons why a design may be flawed or not sensible. The Advanced Calculator advises the user of issues and what may be done about them. In some cases the design concern may not be a concern to that user. Below are the hints and warnings given (in bold italics) and some further detail about each. 5.1. Hydro related hints and warnings Less water is being used than is available as the pipe size limits maximum power. Choose a larger pipe for more power. If you have a pipe that is too small you may not be able to use all the water available so will not get all the Watts from your water resource. Less water is being used than is available as the maximum jet size is in use. Use more PowerSpouts for more power. The jet size is limited by the size of the turbine rotor. You need more jets for this volume of water. Use more jets on the PowerSpout(s) to increase the amount of water through each PowerSpout or more PowerSpouts are needed if using all jets are in use. The PowerSpout can generate more power with the same size jet with more head, but some sites have less available water at more head. Depending on pipe costs, less water from further up the stream may be a cost effective way to get more power. Try appropriate combinations of head, flow and jet size to see what is best for you and your site. Less water is being used than is available as the output is limited by the amount of water each PowerSpout can use at this operating head. Use more PowerSpouts for more power For any given water pressure there is only so much energy that can be converted to electricity. You have reached the power to pressure ratio limit of the PowerSpout in your design. No load speed is ???? rpm!!! Contact your supplier (and read the manual) on regulation methods that can be employed to prevent turbine runaway. When there is no electrical load the rotor in the PowerSpout increases in speed. On sites over about 75m (PLT) and 30m (TRG) the no load rotor speed is beyond its maximum design speed of 3000 rpm. There is a small risk of it coming apart if allowed to run at such speeds for long periods of time. The rotor will normally survive over-speed as there is a design safety margin: the measured failure speed is 5500 rpm. Provided protective body fairings are always in place, running up to 3500 rpm for short duration is acceptable. Too much power for reliable, warrantable operation without more jets in use. Note: All TRGs are sold with 4 jets fitted! or Too much power for reliable, warrantable single jet operation. Note: All PLTs are sold with 2 jets fitted! January 2014 © 2014 EcoInnovation Ltd (NZ) Page 18 PowerSpout Advanced Calculator Please select more jets per PowerSpout, or more PowerSpouts, or reduce water flow and/or head, or buy additional replacement bearings. If only one jet is used there is a side load that causes increased bearing load. Please connect both opposing jets in running above 400W; they are supplied for you to use. In some low power, high head applications a single jet may help avoid a very small jet size. Please contact EcoInnovation if this is sensible in your situation. Too much water pressure for reliable, warrantable operation. 30m (98ft) is the maximum operating head for TRG. or Too much water pressure for reliable, warrantable operation. 130m (427ft) is the maximum operating head for PLT. Use a smaller penstock size to reduce the operating head. Smaller pipe is also cheaper. The use of too much water pressure will reduce the life of the PowerSpout. We do not recommend excessive operating pressure and we do not warrantee it either. We know the PowerSpout is a robust machine and will operate at well over the design pressure rating. The question is for how long… you are welcomed to try without warrantee! 5.2. Electrical related warnings Operation of PowerSpout PLT on this site with no load will result in ???V at the terminals and exceeds the Extra Low Voltage (ELV) limits for non electrical workers to maintain. In Australasia the ELV limit is 120 VDC, in most other parts of the world the ELV limit is 75 VDC. Hire a registered electrical worker if your system is not ELV and ensure your site never operates without load. When the load is removed from a PowerSpout PLT/TRG the output voltage increases to about 3 times the normal loaded voltage. If the rotor spins fast enough to generate a high voltage it can damage the internal insulation. Turbine runaway voltage is tested as part of the commissioning process; this should never be over 600 VDC. Correct runaway voltage is typically 3x the normal operational voltage of the PLT/TRG turbine and 2x for LH turbines If you, the operator, are always careful and make sure the PowerSpout never operates unloaded then this will not be a problem. If your design has very high cable losses, this makes your design more vulnerable to over voltage damage during no load. Some PowerSpout turbines have internal (and in some cases external) voltage control circuitry to limit the PowerSpout output voltage. Cable size is within 50% of likely current rating. Cable loss calculations are based on 20 deg C (68 deg F) conductor temperature. Please check with your cable supplier for suitability for current handling, temperature rise and loss at this current. If you have selected a very small cable the calculator will always increase its size to avoid excessive heating in the cable. However, the maximum current a cable can carry depends January 2014 © 2014 EcoInnovation Ltd (NZ) Page 19 PowerSpout Advanced Calculator on the cable and installation. Please check with the supplier of your cable to ensure this limit is not exceeded. Steel wire is not all created equal and can have a wide range of loss. Calculations are based on common high tensile steel. Please check with your supplier for the actual resistance of your wire. Steel wire, in particular high tensile fencing wire, can be a very cheap cable. However, steel has a relatively high electrical loss and is not well defined. This note is a reminder to check the resistance of the steel wire you intend to use. 5.3. LH specific turbine advice and warnings Your pipe is at least 70% full. Note that this calculator is provided as a guide only. Adequate design margin is your responsibility and you are recommended to obtain independent engineering advice if you are committing significant money into your installation. This warning alerts the user than the flume design might need to be made larger. More LH hydros could use more of your available water but you would then get less power. This design provides the most power as it will operate at the highest efficiency as the LH hydro(s) are fully utilized. This warning alerts the user that more turbines running on reduced flow is less efficient than 1 turbine operating with adequate flow. More LH hydro units would use more of your available water and provide more power. 2 LH hydro units is best. This warning alerts the user that more turbines should be specified for the site, as long as more power is needed. Your chosen pipe/flume is operating at capacity. If there was an air gap at XXX mm water depth the pipe can transport XX lps. Increased flow is not expected as surging likely to limit performance so pipe is assumed to be full. A warning that increased pipe size or slope may be needed. Your chosen flume is completely full. Overflow water can cause erosion issues. A warning to increase the height of the flume sides. Your cable efficiency target has been ignored and a larger cable size calculated to carry the current from the LH hydro unit(s). If you only have a smaller sized cable to use then either increase the operating voltage or reduce the number of LH hydro units. A warning that you are trying to enter a cable size that is too small. The no load voltage from the LH Hydro is close to the Vmax of your inverter/charge controller will accept. Exceeding Vmax for a charge controller/inverter is usually destructive. Failure to follow documented commissioning procedures may result in the damage of your inverter/charge controller at your expense! No warranty is provided for failure to follow instructions. January 2014 © 2014 EcoInnovation Ltd (NZ) Page 20 PowerSpout Advanced Calculator A warning that you are close to the voltage limits and must carefully follow documented commissioning procedures. January 2014 © 2014 EcoInnovation Ltd (NZ) Page 21 PowerSpout Advanced Calculator 6. Examples using the Advanced Calculator Please note that the advanced calculator is often updated, based on infield feedback, the numbers that you might get when following the examples below may vary, though they will be very similar. The examples given here are intended to illustrate possible situations and the range of options available. Each situation utilises a different version of PowerSpout PLT as follows: 1. 2. 3. 4. Off-grid ELV system: Off-grid situation, long cable: Grid-connected situation: Small scale system: PowerSpout PLT 100C PowerSpout PLT 80 HP PowerSpout PLT 200 PowerSpout PLT 28 6.1. Off-grid ELV system (PLT 100C) I have identified suitable sites for a water intake, generator and battery shed on my property. I have measured heights and distances and have collated the following site data: Available Flow Head Pipe length Cable length 5 l/s (minimum all year. 10 l/s in winter) 70 m 400 m 500 m I go to www.powerspout.com and log in to the PLT Advanced Calculator. 6.1.1. Preferences I prefer to work with metric units so I select this option. My property is off grid and the generation site is not very close to my battery shed. I would like to install it myself and we have 120 VDC ELV regulations (I live in Australia) allowing me to work on systems up to 120 V, so my first choice will be the PLT 100C 6.1.2. Hydro I select the PLT option and enter my measured values for Available water flow (5), Head (70) after which the calculation tool inserts default values and proceeds with an initial calculation. I now have to correct the default data to my site data. I enter the Pipe length (400). Appropriate metric units are assigned if I do not enter them. The calculator suggests that a pipe with an internal diameter of 75 mm can supply 2 PowerSpout units, each generating 802 W. The pressure rating for the pipe needs to be greater than 70m = 700 kPA = 0.7 MPA = 100 psi. PN9 pipe means that it is rated for 90m, 900kPa or 9 Bar so it is stronger than needed. 6.1.3. Electrical I enter the Length of cable (500m) and the Design load voltage of 100 V (that is what the 100 means in the PLT100C product name). If I select aluminium cable, the calculator indicates I will need to use cable with a cross section of 42 mm2. It will carry a current of 14.4A, and with Actual cable efficiency of 90% it will deliver a total of 1443 W. 6.1.4. Refining the system I need to obtain details from my local suppliers on suitable pipes and cables available. January 2014 © 2014 EcoInnovation Ltd (NZ) Page 22 PowerSpout Advanced Calculator I ask for costs and inside diameter of LDPE or MDPE pipes, which are most commonly used, rated for at least 70m of head. My local suppliers tell me they can supply the following pipes rated up to 90 m (900 kPa): Pipe inside diameter 94 mm 79 mm 65 mm 55 mm 50 mm Pipe costs NZ$/m 11.50 9.00 7.00 5.00 3.50 Source: Rural Direct NZ – March 2013 I have 2-core aluminium cable with of 25mm2 at $3/m. For a larger cable I know I can run several parallel wires. 2 parallel cables equate to 50 mm2 which is close to my target diameter, but I could try to increase efficiency still further with 3 cables. The closest option to that suggested is to have a 79 mm diameter pipe and a cable with a cross section of 50 mm2 (two parallel cables). I enter these values: this will produce 1500 W at the shed. I can assess for each pipe diameter the impact of using 1, 2 or 3 parallel electrical cables. The most power is understandably generated with the biggest pipe and cable combination, but the extra size comes at a cost. Figure 2 illustrates differences in output and cost per unit capacity, including 2 turbines and pipe and cable costs. Costs vary widely and hence must be considered as indicative only. In each case the columns are assigned two numbers referring to the pipe diameter and the cable size respectively. For example the first column is labelled 55, 25 which indicates 55 mm pipe diameter and 25 mm2 cable size. Figure 2. System output and costs (turbines, pipe and cable) with water flows of 5 l/sec January 2014 © 2014 EcoInnovation Ltd (NZ) Page 23 PowerSpout Advanced Calculator It is evident from this figure that the 79mm pipe diameter would maximize power production. Reducing the pipe diameter to 65 mm reduces the power output, and if I enter 55 mm I am warned this is too small to use the water available and hence will limit the power output. My most cost-effective option in this scenario is a pipe diameter of 65 mm and a single length of 25 mm2 2-core cable. If I decide that 1200 W is sufficient for my needs I could adopt this combination. Adopting the larger pipe could produce 25% more power, but would mean higher pipe costs. I could also investigate other options that might exist, for example if I can gain 10m head by going 50m further upstream. I can change the head to 80 m and pipe length to 450 m and the calculator shows me I could increase generation with the 65mm pipe and 25mm2 cable to 1379 W; despite adding to overall costs I calculate I can slightly reduce the cost per Watt. I can also see that if the increased head means there is less flow (reduce to 4 l/s) then the power drops back to nearly 1200 W and hence I do not gain anything but extra expense. When I evaluate winter flows of 10 l/sec (Figure 3) even the 65mm pipe is limiting the power output, although output will rise by around 10%. This pipe can use a maximum of 6.7 lps, and at this point it will operate at 66% efficiency. To produce more power I would need to increase the size of the pipe. The 79mm pipe is sufficient to increase the number of PowerSpout units from 2 to 3 and generate almost 2000 W, but for comparison I will check the box in the calculator to keep the number of PowerSpouts at 2. Two units would not be sufficient to use all the water available at this site with 79 mm pipe, but the output would increase from these by around 25% and hence costs per W would fall. The 55 mm pipe cannot use any of the extra flow available so the power and costs are the same as during lower summer flows. Figure 3. System output and costs (turbines, pipe and cable) with water flows of 10 l/sec Although I do not need over 2000 W currently, it is useful to know that this larger pipe could supply 3 turbines during higher flows, and generate up to almost 2400 W. If I lock the January 2014 © 2014 EcoInnovation Ltd (NZ) Page 24 PowerSpout Advanced Calculator calculator with 3 PowerSpouts and return the flow to 5 l/s I can immediately see there would be no increase in power output from having a third generator. In this situation I could turn off 1 turbine in summer, remembering to grease the bearings when doing so. Removing the turbine bearing block and generator and storing them in a dry warm place is wise if the turbine is not being used for an extended period. To calculate total system costs I need to add the costs for the other system components such as batteries, inverter, installation and other minor electrical items. These other costs combined could equal around $7,000. The total costs are shown in Table 6, both in terms of cost per unit of installed capacity and the generation costs per kWh over 10 years of operation (360 days/yr). Table 6. Indicative system options and total costs (2 PowerSpout PLT100C) Flow Pipe diam Cable size Power at Shed Turbine(s) cost Pipe cost Cable cost Other cost Total cost Unit cost Annual power 10 year power 10 year cost January 2014 l/s mm mm2 W $ $ $ $ $ $/W kWh kWh $/kWh 65, 25 10 65 25 1,340 5,300 2,800 1,500 7,000 16,600 12.39 11,578 115,776 0.14 Winter flow 65, 50 79, 25 10 10 65 79 50 25 1,460 1,580 5,300 5,300 2,800 4,000 3,000 1,500 7,000 7,000 18,100 17,800 12.40 11.27 12,614 13,651 126,144 136,512 0.14 0.13 79, 50 10 79 50 1,765 5,300 4,000 3,000 7,000 19,300 10.93 15,250 152,496 0.13 65, 25 5 65 25 1,224 5,300 2,800 1,500 7,000 16,600 13.56 10,575 105,754 0.16 © 2014 EcoInnovation Ltd (NZ) Summer flow 65, 50 79, 25 5 5 65 79 50 25 1,319 1,382 5,300 5,300 2,800 4,000 3,000 1,500 7,000 7,000 18,100 17,800 13.72 12.88 11,396 11,940 113,962 119,405 0.16 0.15 79, 50 5 79 50 1,511 5,300 4,000 3,000 7,000 19,300 12.77 13,055 130,550 0.15 Page 25 PowerSpout Advanced Calculator The final decision will be based on your needs for power and your economic situation. This is different for every customer and every hydro site. This is partly why you often struggle to get a straight answer from a hydro supplier as there are an infinite number of possible solutions. 6.1.5. So what did we do? Power consumption in the home will increase during winter as it is much colder and more time will be spent indoors. Also the solar hot water heater that will meet the home’s needs in summer time will not in winter time. Generating more power in winter to help heat the hot water and drive the pumps needed for the wood fired central heating system would be of great benefit. Hence the solution chosen: 2 turbines, upgradable to 3 if needed in the future 500m of 50mm2 cable 400m of 79mm ID pipe As the labour cost to lay a pipe will be the same regardless of the pipe size, spending an extra $1200 on pipe seems like a very sensible option. This will allow the system to be upgraded to over 2000 W by the addition of a 3rd PowerSpout for winter time generation if needed. When installed the output power was a little over 1500 Watts which was predicted in the Advanced Calculator. January 2014 © 2014 EcoInnovation Ltd (NZ) Page 26 PowerSpout Advanced Calculator 2 x PowerSpout turbines doing 1520 Watts via a common aluminium cable into an Outback FM60 regulator Input voltage 104 VDC, output 27.00 VDC and 1520 Watts. The AUX relay is used to automatically turn on a water heater in the home, diverting surplus power not needed to hot water. Battery Storage January 2014 © 2014 EcoInnovation Ltd (NZ) Page 27 PowerSpout Advanced Calculator 6.2. Off-grid situation, long cable (PLT 80 HP) We run a tourist hostel and chalets near a ski resort. We have minimized our consumption through efficient buildings and appliances as well as solar heating and sensible behaviour. Solar PV panels are our principal source of power with a diesel generator for backup. We do not like the generator (noise, expense, fuel uncertainty, greenhouse gas emissions etc.) but find it is increasingly in demand, particularly in winter. We had not previously considered hydropower because we thought we are too far (about 2 km) from the spring and the stream running from it. It is a reliable spring and we use it for our drinking water via a 25mm pipe to our two 10,000l header tanks. A guest told me about the PowerSpout Advanced Calculator and I decided to investigate. Our first decision was the location of the turbine: do we move the water to the house with a long pipe, or generate beside the stream? We thought moving the water to the house might help with drinking water supply, garden irrigation and possible water features, but soon realized it would require considerable effort and costs to return the surplus water to the stream. Hence we looked for sites with good access near the stream, and selected one with 50m head and available flow of 4 litres/second. It would require 300 m of pipe and 1,800 m of cable to the existing battery shed. At such a distance it seems from the documents available online that the PowerSpout PLT80 and Midnight Classic 250 regulator could be the most appropriate. We do not have good electrical skills and wanted to engage an electrician to install the system to ensure compliance and safety for ourselves and our guests. Entering head and flow data and pipe and cable lengths in the Advanced Calculator suggested 2 turbines and a pipe diameter of 70mm would supply a total of 892 W. I changed the pipe to 65mm which is the nearest size available to me. I also changed the Design load voltage to 80 and cable to 50mm aluminium cable which my electrician suggests should be cost effective over long distances at this voltage. The calculator shows a cable efficiency of 80% and 682 W Power at the shed. I notice an HP version amongst the stator/rotor options so changed the turbine type to select PLT HP. The calculator shows this can generate 702W. The combined costs of turbine, pipe and cable contribute to a cost of over 19 $/W, or 22 c/kWh over a 10 year period, in my initial system design. January 2014 © 2014 EcoInnovation Ltd (NZ) Page 28 PowerSpout Advanced Calculator 6.3. Grid-connected situation (PLT 200) I pay an average NZ power price of 25c/kWh giving me a power bill of $2400 per annum. I am considering installing a solar hot water system to reduce my power consumption, but my energy retailer has agreed to pay me 25c/kWh for every unit I supply into the grid if I generate power, provided I do not supply to the grid more than I use on an annual basis. I want to stay on the grid and sell my surplus power into it. I have an existing water supply pipe that is used for irrigation in the summer for a few weeks, but not used for the rest of the year. I want to know how much energy can be generated assuming 10 months of viable operation and at what cost. I am looking for a return on my investment (ROI) of 20% or more. My site details are as follows: Head: 120 m Flow: 3 lps (summer) Pipe: 400 m of 120 m rated pipe, 63 mm OD, 55 mm ID all the way Cable length 30 m I log in to the PLT Advanced calculator and select metric units. I enter my data for flow (3 lps) and head (120 m), existing pipe length (400 m) and inside diameter (55 mm). At this point the Advanced Calculator indicates that 3 lps could supply 2 turbines and generate 822 W from each of them. I see a warning about the cable rating in the electrical section of the calculator, so I hope my data will rectify this. I enter the correct cable length (30 m) and 2.5 mm2 copper wire which I know is widely available at around $2/m. I also enter a higher Design Load Voltage (200V) suitable for grid-tied systems. Not only does the warning disappear but I notice this cable can achieve 98% efficiency and produce 1618 W at the shed. Operating over 10 months at this rate would equate to almost 12,000 kWh. I need to consider the output since my current consumption is just less than 10,000 kWh. I therefore need to reduce my production and/or increase my consumption, or renegotiate with my power company for any net surplus power I supply. Although my static head (120m) is at the upper limit, I know from the PowerSpout Installation Manual that it is the operational (running) head that is important. I can estimate this if I multiply the static head by the pipe efficiency (89%) giving 107 m. This is under the recommended maximum operation head (130 m) covered by the standard warranty. As the flow rate increases the pipe efficiency falls, and rates above 4 l/s have efficiency lower than 83% and hence running head of less than 100m. First of all I need to get some materials availability and cost data, and then look at the system design options and their costs. 6.3.1. System costs I want to look at the entire system costs and potential savings. I will examine two options for savings: the maximum saving is the value of potential power all sold at 25c/kWh, and the other applies a cap at the current cost of $2400. Hence in the latter case either I use more power, or I assume I will get no returns for any surplus supply. Pipe diameter, rating and costs can be provided by my supplier, although I am keen to use my existing irrigation pipe at no cost. January 2014 © 2014 EcoInnovation Ltd (NZ) Page 29 PowerSpout Advanced Calculator Cable costs are insignificant: 30m adds little to the total costs. The PowerSpout PLT200 turbines cost NZ$ 2,200 each and fixed system costs could amount to NZ$ 4,000, including a suitable inverter (over NZ$ 3,000), meters and installation. 6.3.2. Flow rate I know I have 3 lps in the summer when I use it for irrigation so I presume winter flows increase - but I haven’t measured the rate. I do not want to reduce the pressure of water available since it suits my irrigation system. By increasing the flow rate in the Advanced Calculator I discover I can use up to 5.8 lps with this pipe. At this rate I can use 3 turbines and generate 2,330 W, or 17,000 kWh over 10 months. I discover I can generate approximately the same from 2 turbines with a flow rate of 5.1 lps. Flow rates from 4 lps can generate over 2,000 W from 2 turbines, or nearly 15,000 kWh over 10 months. 6.3.3. Turbine version There is no increase in output if 2 of the HP versions are used instead of the standard PowerSpout GE 400 turbine is used at up to 5.1 l/s and only a minor increase at 5.8 l/s. A single PowerSpout GE 400 HP turbine could generate over 1,500 W (11,000 kWh/yr) but would only use 2.7 l/s and hence there would be no increase if winter flows increased. All these options generate more power than I consume, so I wonder if I can usefully increase consumption. I would enjoy adding some power tools to my workshop and a heat pump might be a good option for extra heat in winter or even cooling in summer. 6.3.4. Results Figure 4 illustrates the performance and cost for each system, identifying each scenario by the flow rate and the number/type of turbines. T: standard turbine, HP: high power turbine Figure 4. Costs of grid connected power options (flow, turbines) Given the indicative nature of costs and values, this data should also be considered as illustrative only. January 2014 © 2014 EcoInnovation Ltd (NZ) Page 30 PowerSpout Advanced Calculator A single HP turbine offers the best ROI due to the lower costs and least surplus power. An investment of around $7,000 will provide annual savings of $2,400 and hence a payback of 3 years. The system may need a general overhaul at 10 years old, with some costs relating to the inverter and turbines, but the pipes and cable will last 25-50 years. If I spend some more money at year 10, then the system will continue to give us a great return into the future. 6.3.5. So what did we do? The client was uncertain and keen to reduce risks, both the perceived “new technology risks” and the risk of borrowing money. This resulted in the decision to install 1-turbine and a smaller inverter and “see how it goes”. An upgrade is planned once sufficient money has been saved on power bills. The PLT200 turbine was installed using 2.7 lps. The turbine produced 1,500 W connected via an EnaSolar 2000 inverter. PowerSpout PLT200 running at 1500W Grid connected EnaSolar 2000W inverter 6.4. Small scale option (PLT 28) I have a bush lodge which is used by a range of friends and international hunters. It is very remote but has a small creek nearby that I would like to use to generate enough power for lighting and other minor loads, replacing the noisy generator I currently use. I am also considering using solar panels, particularly since the creek is little more than a trickle in summer sometimes. I have a number of possible sites for an intake, depending how far I go up the stream. The simplest option is at a set of small waterfalls only 200m from the hut, but there is another intake site approximately 100m upstream which would increase the head from 20 m to 40m without noticeably reducing flow rates. The access to the second site is less convenient and part of the gulley is very hard to reach. The water pipe could be diverted away from the river to avoid this, which would considerably increase distance (total 500m from turbine). I have a shed between the lodge and creek that would be suitable for the generator, only 20m from the lodge. This would require creating some sort of exit for exhaust water to return to the stream without causing erosion. I have measured the stream flow frequently over the past year and it has ranged between 1 to 2 lps for most of the year, with a couple of floods and a short drought. January 2014 © 2014 EcoInnovation Ltd (NZ) Page 31 PowerSpout Advanced Calculator I decide to start with the easy option and conservative flows: Option 1 Option 2 (min) (max) Head: 20 m 40 m Flow: 1 lps 2 lps Pipe: 200 m 500 m Cable length 20 m 20 m Due to the short cable distance I select the PowerSpout PLT28, and choose to work in metric units. I enter the head, flow, pipe length, cable length and design load voltage (28). I enter 2.5 mm2 copper cable as used for house wiring. With 38 mm pipe this option will generate just 61 W for me, and increasing the pipe diameter to 50, 55 or 65 mm increases output to 80, 83 and 85 W respectively. The 38 mm pipe can only use 1.2 l/s and hence has little to gain with higher flows. Based on the pipe prices I choose to use 50mm pipe for further analysis. I can test the different head options, and the impact of cable size. I know I can get 2.5 mm2 cable for $2/m and use two or more parallel lengths to increase the size if required. In each case I assume it will cost me approximately $6000 for inverter, batteries and installation. It is not surprising that I only need one turbine in each case, even if I can reach the higher flow rate of 2 lps and larger pipe diameter. To generate more than 100 W I need higher flows or head. The higher head and larger pipe returns warnings but these can be managed as I do not intend to run the turbine disconnected from the batteries. I have been advised to put up a sign in the shed that says ”Attention, turn off hydro before working on this system”, just in case I forget. I am on a tight budget and the bush lodge is mainly used in summer when the flow is about 1 lps, I decide to go for 50 mm pipe at 40m head because it can use the higher water flows, and I already have some. With this option I can generate 161 W in summer and 249 W in winter. Generation costs ($/kWh) over 10 years are higher than grid costs, but the grid is not an option. Our bush lodge has been running on a generator and some years ago we had installed a kWh meter so we could charge visitors for the power (fuel) they used. The fuel bill has been about $2000 per year for 900 kWh, a cost of $2.22/kWh, not to mention the noise and effort of carrying in fuel. Installing a hydro will reduce our energy costs by 70%, allowing us to put money aside for battery replacement every 10 years and maintenance as required. We hope to be able to market the bush lodge to both hunters and Eco clients. In the past some clients have not been impressed with the generator spoiling the tranquillity of the place. It is time for a change. 6.4.1. So what did we do? A 50 mm pipe and 25 mm aluminium cable were used. A 24 V battery/inverter system and PowerSpout PLT28 turbine was installed in the power shed. The site produced around 160 Watts most of the time, dropping to 85 Watts during the last drought. The generator is rarely used these days with a fuel bill of less than $50/year. January 2014 © 2014 EcoInnovation Ltd (NZ) Page 32 PowerSpout Advanced Calculator PowerSpout PLT28 Small 24 volt system 4 x 12 volt 200 amp hour Battery bank 6.5. Grid Connected option – TRG/LH Detailed case studies for actual installations of our TRG and LH turbines can be located on our www.powerspout.com web site. These studies include the use of the advanced calculation tool. January 2014 © 2014 EcoInnovation Ltd (NZ) Page 33

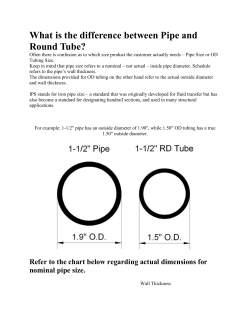
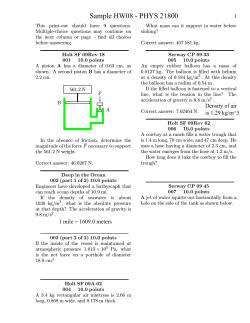
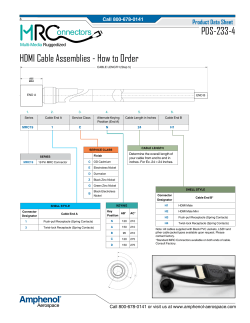


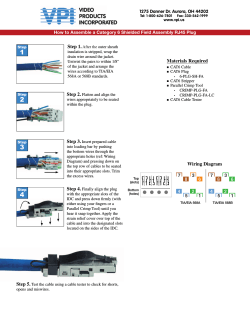
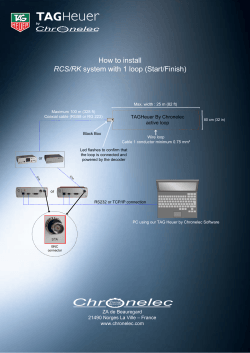
© Copyright 2026