
Software manual For HQ Users
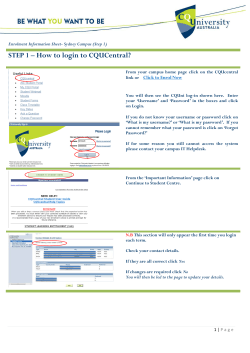
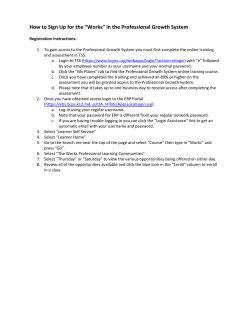
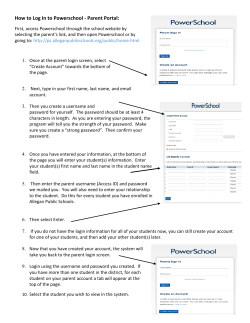
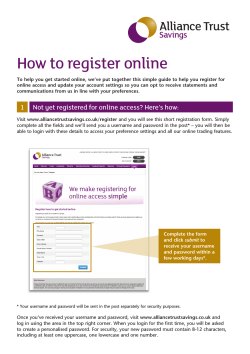
Software manual For HQ Users This third edition was updated by Christoph Andert (Save the Children UK) Susan Fuller (Save the Children UK) Acknowledgments The authors would like to express their gratitude to Management Systems Modelling Ltd (MSM) that developed the CMAM Report software which was built on the work of Shafat Sharif (2012-13) and Mark Yarmoshuk (2008). Save the Children would like to thank all agencies that have used or reviewed the previous version of the software and made valuable comments for its improvement: ACF-USA, Concern Worldwide, EDARP, GOAL, IMC, Merlin, World Vision and people from Save the Children regional and country offices. Save the Children thanks the Humanitarian Innovation Fund (HIF), Office for Disaster Assistance (OFDA) and the European Commission Humanitarian Office (ECHO) who provided generous funding for the different project periods: Funding 2013 - 2014 The Humanitarian Innovation Fund supports organisations and individuals to identify, nurture and share innovative and scalable solutions to the challenges facing effective humanitarian assistance. Funding 2011 – 2012 The European Commission’s Humanitarian Aid department funds relief operations for victims of natural disasters and conflicts outside the European Union. Aid is channelled impartially, straight to people in need, regardless of their race, ethnic group, religion, gender, age, nationality or political affiliation. Funding 2008 – 2011 The MRP Project was made possible through the generous support of the American people through OFDA of the United States Agency for International Development (USAID) under the Agreement No. DFD-G00-07-00226-00 to the ENN as part of a project entitled Strengthening Capacity to Respond to Emergencies in the Food Security and Nutrition Sectors (2008 - 2011). The content does not necessarily reflect the views of USAID or the United States. Table of Contents ACRONYMS.............................................................................................................................................. 5 INTRODUCTION TO THE SOFTWARE ......................................................................................................... 6 GETTING STARTED ................................................................................................................................... 8 CREATING AND MAINTAINING USERS ...................................................................................................... 9 ADDITIONAL INFORMATION – CONTEXTUAL INFORMATION AND GRANTS ............................................. 10 DATA ANALYSIS – CREATING REPORTS AND GRAPHS .............................................................................. 11 SURVEY DATA ........................................................................................................................................ 13 BACKUP, SYNCHRONIZE AND OTHERS .................................................................................................... 15 APPENDIX .............................................................................................................................................. 18 Acronyms BSFP CMAM GAM HQ MoH MUAC TSFP OTP PLW SAM SC WFH Blanket Supplementary Feeding Programme Community-based Management of Acute Malnutrition Global Acute Malnutrition Headquarters, head office Ministry of Health Mid-Upper Arm Circumference Targeted Supplementary Feeding Programme Outpatient Therapeutic Programme Pregnant and lactating women Severe Acute Malnutrition Stabilisation Centre Weight-for-Height Read this first This manual is for HQ Users only. If your role is different please refer to the other manuals and find the user level for your specific roll 1. As HQ User you are responsible to create Data Manager accounts for your countries and maintain their logins. You will be able to analyse data for all your countries and generate reports and graphs. 1 There are five user levels for the CMAM Report software: Field User, Basic User, Data Manager, Country administrator role and HQ User. For each level there is a Software manual downloadable here www.cmamreport.com. Introduction to the software About the software CMAM Report is a comprehensive monitoring and reporting tool for CMAM programmes featuring standardised reporting categories and indicators which have been developed through a consensus building exercise with a large number of humanitarian agencies. The CMAM Report software is a web based software with offline capacity that allows Users to enter and analyse all CMAM related data for SFP, OTP, SC and MUAC screening including contextual information, and generates automated tables and graphs that can be exported to Microsoft Excel. To run the software you will need a PC, laptop or tablet with Windows XP service pack 3, Windows 7 or above and internet browsers Google Chrome (version 24.0 or above), Internet Explorer (version 10.0 or above) or Mozilla Firefox (version 18.0 or above). In case you do not have these browsers, Google Chrome and Mozilla Firefox can be downloaded for free from the internet in your preferred language using the following links: Google Chrome: https://www.google.com/intl/us/chrome/browser/ Mozilla Firefox: http://www.mozilla.org/en-US/firefox/all/ The software can also be run on a Windows tablet or smart phone with the above mentioned browsers. Ownership Agencies or organisations inputting data into CMAM Report retain ownership of data and any potential use of it. Agencies will endeavour to ensure all data supplied is correct and accurate. Agencies using the CMAM report software to enter data from their programme are under no obligation to contribute, share or grant access to their raw data which will be securely stored by Save the Children UK. Save the Children agree to: Store the data on a secure server Only give access to the data to authorised persons Not share the data or any sub-set of data with any other agency or agent without the prior agreement of each contributing agency Not identify any contributing agency, treatment programme or treatment site in any publication derived from the analysis of data without the prior approval of the contributing agency Acknowledge the general contributions of all contributing agencies in any publication, not linked to any specific data source User levels There are five user levels for the CMAM Report software: Field User, Basic User, Data Manager, Country administrator role and HQ User. The software is managed from a central server (please see ownership statement). Each user level has certain access rights: Field Users: Field Users are responsible for data entry (and if desired for basic analysis of entered data). An example of a Field User could be a community health worker or a data entry clerk. Basic Users: Basic Users manage all data for a defined geographical or programme area, for example district level nutrition coordinators or programme managers. Their role is to review entered data2 for a programme, review and edit data if needed and approve data for their programme. Where the Field User role is not in use, Basic Users may also enter data. Data Managers: Data managers oversee all data for a country, for example nutrition advisors at country level. Their role is to oversee data from multiple sites and programmes in a country (not necessarily to make edits to data) and will be able to compile data for analysis and reporting to the next level (for example the MoH or donor reporting). HQ Users: HQ Users oversee all global data - e.g. HQ nutrition advisor. Their role is to oversee data from multiple countries. They will be able to compile data from different programmes & countries for analysis and reporting. Country admins: Country admins oversee data of multiple partners/agencies in one country, for example the MoH or UN agencies in a given country or the head of a consortium of agencies. They will be able to compile data from different partners/agencies in one country for analysis and reporting. 2 In case a programme does not have Field user(s) for data entry the Basic user can enter data as well. Getting started Accessing the software The CMAM Report software can be accessed through the CMAM Report website using the following link: www.cmamreport.com. You need a personal username and a password. Please contact [email protected] to receive these. Do keep the username and password confidential and do not share it with anybody. The CMAM Report software can be accessed through the CMAM Report website using the following link: www.cmamreport.com. Login You are asked to enter your personal username and password. Click Login and you will be directed to the home page of the software. Forgotten password In the event that you have forgotten your password, you can click on the Reset my forgotten password link on the login page. An automatic email will then be sent to your registered email address with instructions on how to choose a new password instantly. You can also use the forgotten password to reset your password to your own personal preference when you first receive your login details. Creating and maintaining users Quick guide Go to Admin>Users>Add user or search for current users Creating users As a HQ User you are able to create user accounts for Data Managers, Basic Users and Field Users. For your convenience it is suggested that you create only the Data Manager position for each of your operational countries and the Data Manager will create all other user accounts in his country (Basic and Field Users). To create a user click on the Admin button on the top bar and then click Users. You will be able to search users from here or add a new one. To add a new one click Add User. On the add user screen please fill in all of the required fields. You can create a password for users which they can later change. In case users change you will be able to change the passwords so that the user is unable to login; see below section Terminate access for users. Information needed for creating a new user: Username – This must be unique and cannot be changed once you define it. You might choose your name, or an email address Contact email – this will be used to send emails to reset passwords or receive stock warnings Country – Select the country for which you create the login Role – Choose Data Manager, Field or Basic User Phone number - optional Preferred language – Choose English or French Need another HQ login for your agency? Please contact [email protected] to add a new HQ user account to the system. Terminate access for users In case you want to terminate a Data Manager, Basic or Field User’s access to the CMAM Report system you can do so by following these steps: Go to Admin>Users and search for the user, then click Edit to enter the User’s account. Replace the user’s email address with your own and Save. Log out from the system and click Reset my forgotten password. Enter the username of the user you want to terminate, click Request. An email with a link to choose a new password will be sent to your email address. Follow the link and enter a new password which you do not communicate with the user. User last login date/time As HQ User you are able to view the last date and time Data Managers, Field or Basic Users were logged into the software. Go to Admin>User>Search and view the right hand column in the list of users. Additional information – Contextual information and grants CMAM Report allows you to enter additional information that can help you to analyse your CMAM performance and simplify your analysis options. The software will allow you to analyse data according to a given context to assist in interpretation (for example a defined geographical area – eg urban or rural) or according to grants (for example sites and activities funded by a particular donor). Contextual information You can enter contextual background information to describe your CMAM programme from general information via major events to protocols and products used and set a geographical location (e.g. province or district) for which this context information is valid. Any feeding site within the geographical location(s) will be selected whenever you select the context profile (you have created) in the analysis section of the CMAM Report software (anything under Analysis in the taskbar). The purpose of this function is to support interpretation of data in light of protocols, context, natural events etc. In Admin>Contextual information you need to click Add context and give your context profile a name (for example a geographical name). You then select the location(s) for which this context information is valid (You can select more than one district). Below are tabs where you can enter further information on Major events, Protocols and Products. Save and sync when done. The information can be updated any time by clicking on Admin>Contextual information and selecting the context profile in the list. Grants The grant screen allows you to create new grants and edit existing ones so that you can analyse data according to the grant selected. Feeding sites can be added to the grant so that reporting can be done by selecting the grant name in the analysis section of the CMAM Report software (anything under Analysis in the taskbar) instead of all single feeding sites. In Admin>Grants you need click Add grant and give your grant a name, e.g. ECHO nutrition intervention XYZ. You then select the donor (can be multiple), start and end date, the amount and currency of funding. If the donor for your grant does not exist on the system, you can create a new donor (please check first that the donor does not already exist in the list). First go to Admin and select Donors. From here you will be taken to a screen listing donors. You can add a new one by selecting Add donor, entering the name of your donor and then pressing Save. Once you synchronise, all software users will be able to see this donor. Then you can add feeding sites to this grant. Click in the cell called Site name and type at least on letter. A list of all configured feeding sites comes up from which you can choose. You can also select which of the CMAM components are included for this grant by ticking the boxes. When done click Add site. Repeat for any other feeding site you want to register under this grant. Save and sync when done. Data analysis – creating reports and graphs Quick guide Go to Analysis>Reports or Graphs tabs> Select the report or graph from the list > Use selection criteria and press Preview&Print or Export to Word or Export to Excel Data analysis should only be done when reports have been approved to ensure quality. Making reports and graphs A list of all reports and graphs that the software can generate is provided in Appendix 1. In general data can be analysed according to the following criteria: - Country: Select single countries Region: Select a geographical region with multiple countries Date: Period from to Geographic location: Sub-national locations (country-specific, e.g. Province, District, Subdistrict ) Feeding site: It is possible to select a number of sites based on your own selection criteria independent of geographical location Furthermore - Context: Name of the context, this allows you to make a report/graph for all feeding sites that have been associated with this context - Grant: Name of the grant given, this allows you to make a report/graph for all feeding sites that have been associated with this grant For graphs, the following can be selected additionally - Programme type: TSFP, OTP, SC, SC+OTP - Treatment group: <6months, 6-59 months, PLW, etc. All variables can be selected/ deselected, e.g. Recovered, Defaulter, etc. Use any of the above selection criteria and press Preview&Print, Export to Word or Export to Excel and the report or graph will appear in your download folder. The Export to Excel includes a table with raw data that allows generating any graph type and edit it as desired. You can change the title of the graph to reflect your own requirements. Change colour The colour of any variable of a given graph can be changed if desired. Click on the arrow next to the box showing the colour and select a different one. Export data to Excel All raw data can be exported to Excel for further processing if desired. For this go to Analysis>Reports tab>Excel Export. Select any criteria and press Export to Excel button. Compliance report This report shows you how many of the feeding site reports expected for the month have been entered. If any monthly report is missing please ask the Field or Basic User to enter the missing data. Go to Analysis>Validation>Reporting Compliance. You can choose for which location you want to make the report then click Preview&Print. Survey data Quick guide Go to Search>Surveys>Use selection criteria to search for a survey or Add Survey and enter data in the tabs Scope and Results Details of nutrition, mortality and coverage surveys can be recorded in the software in order to maintain a record of different surveys against which you can interpret feeding site data and begin to monitor trends. Enter and submit nutrition survey data To create a new nutrition survey, go to Data, and then select Survey. You will be directed to the search survey screen. Select Add Nutrition Survey. On this screen you should add the title of the nutrition survey, who it was completed by and the date it was conducted. You will then see two tabs, one for Scope and one for Results. Under scope you can define the geographical area in which the survey took place, the sampling type, the sample size and the number of clusters. On the results tab, you will be able to enter the WFH and MUAC, GAM and SAM rates with associated confidence intervals, define which reference population was used and add any comments. You can save your work at any point. Once you have completed entering the survey data you should press submit and the new survey will be uploaded for other users to see. Enter and submit coverage survey data To create a new coverage survey, go to Data, and then select Survey. You will be directed to the search survey screen. Select Add Coverage Survey. On this screen you should add the title of the coverage survey, who it was completed by and the date it was conducted. You will then see two tabs, one for Scope and one for Results. Under scope you can define the geographical area in which the survey took place, the sampling type, the sample size, the number of clusters, the programme type being evaluated and the age groups included. On the results tab, you will be able to enter the point coverage rates with associated confidence intervals. There is also space for you to add comments, and list boosters and barriers to uptake of services. You can save your work at any point. Once you have completed entering the survey data you should press submit and the new survey will be uploaded for other users to see. Enter and submit mortality survey data To create a new mortality survey, go to Data, and then select Survey. You will be directed to the search survey screen. Select Add Mortality Survey. On this screen you should add the title of the mortality survey, who it was completed by and the date it was conducted. You will then see two tabs, one for Scope and one for Results. Under scope you can define the geographical area in which the survey took place, the sampling type, the sample size and the number of clusters. On the results tab, you will be able to enter the crude mortality rate and the under 5 mortality rate with associated confidence intervals, and add any comments. You can save your work at any point. Once you have completed entering the survey data you should press submit and the new survey will be uploaded for other users to see. Editing a submitted survey You are able to edit any of the survey types once they have been submitted by searching for the report. From the main taskbar go to Data and select Surveys. This will bring you to the search survey screen. Enter the search criteria you which to use and then press search. This will produce a list of surveys that match your search. Select the one you wish to edit by clicking on Edit. Make the changes you wish to make within the survey following the above instructions for entering survey data. When you press Save, your changes will be saved and visible on the system to other users. Backup, Synchronize and others Backup and Restore my data Quick guide Go to Admin>Survey>Back up (a file with all your data is stored in the folder “My Downloads” of your computer Go to Admin>Restore>Choose File, then browser to the location of the back up file you want to restore your data with>Click Open>Click Restore You can make a backup of all data that is accessible to you. The data is stored in a file that can be used to restore your data if needed. In the taskbar go to Admin and click on Backup. A file called back up. json is created and stored in the My Downloads folder of your computer. From there can move it to any other place on your computer (e.g. to My documents or the desktop) to make it available for a longer time period. To restore you data go to Admin and click on Restore. Now press Choose File and browse to the backup data file (back up.json) you want to restore your data with. Click Open and then Restore. Synchronise Data that was entered on your computer is not available to other users unless you synchronize synchronise it with the central server. There is a Sync button in the right upper corner of the task bar. Whenever this button is orange coloured data is ready for synchronisation. When online click on Sync and then click Start Synchronization. This process might take some time depending on the amount of data you want to sync and the speed of your internet. Click Close when done. You might want to sync whenever you login to the software as other user might have entered new data. Use the software offline Whenever your local internet connection is down or you are in an area without internet connectivity the software will show a red offline button in the taskbar next to your username. The CMAM Report software includes some functions that are available offline. These include: Enter feeding site data (for maximum 2 months per site) Generate a Summary report for maximum 3 last months Add or edit feeding sites Backup and Restore data In order to use all of these functions you should have synchronised with the central server before going offline. There is no problem in shutting down/restarting your computer or the browser in which you had the software open. Help function Throughout the software there are question mark symbols located in the right upper corner (see picture below). Click here, a new window opens with information for this specific section of the software that will guide you on what to do. FAQs Where can I get help? Please email to [email protected] for any queries. I cannot log in to the software with Firefox. Why? In the Firefox’ browser settings you likely have disabled the History function. Please set this to “Remember History” and you will be able to login. In the Firefox window go to Alt>Tools(on toolbar)>Options>Privacy tab>Set history to “Firefox will remember history” I forgot my password, what can I do? In the event that you have forgotten your password, you can click on the Reset my forgotten password link on the login page. An automatic email will then be sent to your registered email address with instructions on how to choose a new password. We need logins for another HQ User. What to do? Please contact [email protected] to add a new HQ User account to the system. How can I terminate a Data Manager, Field or Basic User from the system so that s/he has no access anymore to the database? In case you want to terminate a Data Manager, Basic or Field User’s access to the CMAM Report system you can do so by following these steps: Go to Admin>Users and search for the User, then click Edit to enter the User’s account. Replace the user’s email address with your own and Save. Log out from the system and click Reset my forgotten password. Enter the username of the user you want to terminate, click Request. An email with a link to choose a new password will be sent to your email address. Follow the link and enter a new password which you do not communicate with the user. Appendix Appendix 1 – List of reports and graphs Reports 1. List of feeding sites 2. Summary report 3. Context information 4. Comments by feeding site 5. Stock 6. Excel Export 7. Surveys Graphs 1. Total entries and exits 2. Performance indicators 3. Performance indicators per site 4. Detailed admissions 5. Average weight gain/length of stay Validation 1. Compliance report


© Copyright 2026