
Lab Report XRF 77 S2 PICOFOX TRACE ELEMENT ANALYSIS OF BLOOD SAMPLES
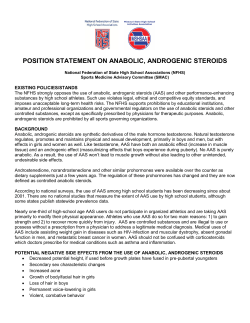
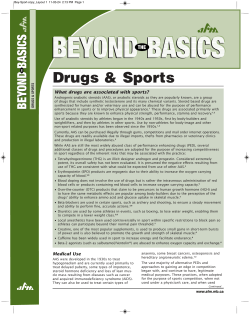
S2 PICOFOX Quartz discs Whole blood Pipette Result Lab Report XRF 77 S2 PICOFOX TRACE ELEMENT ANALYSIS OF BLOOD SAMPLES In this report, the suitability of the TXRF spectrometer S2 PICOFOX for blood analysis is evaluated. In part 1 the analysis of health essential and toxic elements in blood serum and whole blood is described. The determination of Pt in blood samples of cancer patients treated with chemotherapy is the topic of part 2. In this study, the feasibility and restrictions of blood analysis by means of Total Reflection X-ray Fluorescence (TXRF) spectroscopy without need for time-consuming preparation methods like acid digestion are reported. Samples and sample preparation Serum samples Part 1: Trace element analysis in Serum and whole blood The determination of trace elements in blood samples is an important analytical task. Essential elements like Fe, Cr, Mn, Ni, Cu, Zn and Se must be controlled because a depletion of these elements leads to serious deficiency diseases. At the same time, small discrete blood sample volumes containing a large proportion of organic molecules in a high salt matrix limit the practicality of such analyses. Typically, sample preparation for AAS or ICP-OES analysis requires timeconsuming and hazardous acid digestion. In terms of environmental and occupational medicine, a more prominent application is the analysis of toxic metals like Pb, As or Hg. The sample preparation for TXRF analysis of blood serum involves simple dilution with ultrapure water. Aliquots of 250 µl serum standard (ClinChek-Control, Level II; Recipe Chemicals + Instruments, Munich, Germany) were diluted with 2500 µl of ultrapure water (Merck). For internal standardisation, 27.5 µl of Ga (Merck, 0.1 g/l) were added. After thorough homogenisation, 10 µl of this solution were transferred to a quartz glass sample carrier and dried in a desiccator for 10 minutes. Whole blood samples Measurements Due to the high organic matrix content, whole blood samples require a digestion or at least a dilution step prior to the analysis by TXRF or atomic spectroscopy methods [1]. To evaluate fast preparation without any digestion, 250 µl of whole blood (Seronorm, Trace elem ents in whole blood L2; Sero AS, Billingstadt, Norway) were diluted with 250 ml of ultrapure water (Merck). This treatment led to the disruption of blood cells by osmotic shock and an almost homogenous suspension for direct preparation on a sample carrier. All samples were measured at an X-ray excitation of 50 kV/750 µ A for 600 s. The analysis of the volatile element Hg demanded a second preparation step: room temperature digestion for the fixation of Hg. 300 µl of whole blood were treated with 300 µl of a 10 % tetramethylammonium hydroxide (TMAH) solution for one hour at room temperature. The mixture was diluted with 600 µl of a 2 % HCl solution and 12 µl of Ga solution (Merck, 0.1 g/l) were added for internal standardisation. An aliquot of 10 µl was transferred to a quartz glass sample carrier and subsequently dried in a desiccator for 10 minutes. For all essential elements a good concordance of TXRF with reference values can be observed. It must be highlighted that in addition to the certified element concentrations other elements (P, S, Cl, K, Ca, Br, Rb, Sr) could be determined during one measurement. Results The measurement results together with comparison values from ICP-MS and AAS analysis are summarized in Table 1 for the whole blood samples and in Table 2 for blood serum samples. For blood serum samples TXRF analysis shows significantly better standard deviations compared to AAS, although no digestion procedure was applied. This example underlines the importance of an easy analytical procedure for blood serum samples. Precision test for ASTM 2622 Table 1: Comparison of TXRF and ICP-MS reference values for trace elements in whole blood Table 2: Comparison of TXRF and AAS reference values for trace elements in blood serum Serum standard Whole blood standard Fe TXRF Std. dev. AAS Std. dev. TXRF Std. dev. ICP-MS Std. dev. 440000 900 435000 12000 Fe 2920 87 1964 196 1690 43 1562 312 Cu 662 43 623 21 Cu Zn 5010 118 5038 69 Zn 2190 118 2225 334 Se 123 18 123 10 Se 97 18 102 26 6.5 396 100 Au 1343 13 1965 393 11 5.8 n.d. n.d. Pb 399 All values in µg/l Pb All values in µg/l Part 2: analysis of Platinum in blood Figure. 1: Calibration graph for Pt in blood. The continous monitoring of the Pt concentration in human blood is a crucial task during chemotherapy treatment of cancer patients. Due to the high toxicity only a small therapeutic window for the Pt concentration exists. Additionally, the kidney function of cancer patients is highly variable and thus the treatment must be exactly adapted. Since a number of different anticancer drugs is available, a bioequivalence comparison is of interest, too. Pt / Compton ratio Introduction Samples and sample preparation The blood samples were gathered during a study under guidance of the Universidad Simón Bolivar, Caracas, Venezuela [2]. 1 cm3 of whole blood sample was centrifuged at 10,000 rpm. The supernatant containing the serum was removed with a pipette and frozen at -4 °C. Pt Concentration (mg/l) Figure 2: Record of Pt concentrations in blood over a period of four days after first dose. For measurement with TXRF, the Compton peak at about 15 keV was used as the internal standard. Five different Pt-free serum samples were spiked with different Pt standard solutions (Merck, 1 g/l) and used to create a calibration curve, which is displayed in Figure 1. For this method the detection limit of the S2 PICOFOX was calculated to 67 µg/l by the following formula: DL = 3 ⋅ c I net Pt Concentration (ppm) Quantification and measurement results ⋅ 2 ⋅ I bg Hours after First Dose DL: Detection limit (µg/l) c: Pt concentration (µg/l) Inet: Net intensity Pt L a line (counts) Ibg: Background intensity Pt L a line (counts) Figure 2 shows the result of Pt monitoring in blood by TXRF. The Pt concentration of a cancer patient, treated with a Ptcontaining drug is documented over a period of four days, which allowed the toxicological control of the medication. Furthermore, the slow decrease of the Pt concentration after each application of the drug acts as an indicator of the kidney function. Conclusion The results of this study show that TXRF analysis by the S2 PICOFOX is a versatile tool for the analysis of trace elements in blood samples. Essential as well as toxic elements can be analysed with accuracies and sensitivities comparable to analytical techniques like AAS or ICP. Besides the detection performance of the S2 PICOFOX, the ability to analyse minute sample amounts offers several advantages: It allows monitoring of trace element metabolic interactions or trace metal profiles for the detection of unsuspected nutritional depletions. Element determination in distinct fractions of blood, e.g. lipids, proteins etc. is possible. Bibliography [1]: Prange, A. et al. (1989): Multi-element determination of trace elements in whole blood and serum by TXRF, Fresenius Z. Anal. Chem., 355; 914-918. [2]: Greaves, E.D. et al. (2000): Determination of platinum in serum and urine samples from pediatric cancer patients by TXRF, X-Ray Spectrometry, 29; 349-353. Acknowledgement The data of the Platinum measurements were kindly supplied by Prof. Eduardo D. Greaves, Universidad Simon Bolivar, Caracas, Venezuela. All configurations and specifications are subject to change without notice. Order No. DOC-L81-EXS077, Rev. 1.1. In addition, TXRF offers a simple and accurate method for the control of chemotherapeutical drugs like platinum in blood samples. The analyses by conventional methods, e.g. ICP-OES or AAS, are prolonged and expensive, preventing routine use in chemotherapy. Again, the effort for sample preparation is significantly reduced in the case of TXRF. Even long-term examinations are possible due to the extremly low amount of cancer patients' blood used. Author Hagen Stosnach, Armin Gross, Bruker Nano GmbH, Berlin, Germany Bruker Nano GmbH Bruker AXS GmbH Bruker AXS Inc. Berlin · Germany Phone +49 (30) 670990-0 Fax +49 (30) 670990-30 [email protected] Karlsruhe · Germany Phone +49 (7 21) 50997-0 Fax +49 (7 21) 50997-5654 [email protected] Madison, WI · USA Phone +1 (608) 276-3000 Fax +1 (608) 276-3006 [email protected] www.bruker.com © 2013 Bruker Nano GmbH. Printed in Germany. TXRF is based on a "matrix independent" internal standardisation process leading to a precise and highly accurate quantification without the need for complex and time-consuming sample preparation and instrument calibration.


© Copyright 2026